Embed Size (px)
Citation preview

AFRICAN DEVELOPMENT BANK GROUP ADB/BD/IF/2015/97 - ADF/BD/IF/2015/67
BENIN
ECONOMIC AND SECTOR WORK (ESW)
PUBLIC FINANCE MANAGEMENT AND DEVELOPMENT CHALLENGES
Author: Daniel NDOYE, Senior Country Economist, ORWA Supervisor: Ferdinand BAKOUP, Lead Economist, ORWA
ORWA DEPARTMENT
May 2015
Translated document

TABLE OF CONTENTS
ACKNOWLEDGEMENTS ………………………………………….............…………………………….i ACRONYMS AND ABBREVIATIONS……………………………………..............……………...........ii EXECUTIVE SUMMARY…………………………………………………..............………………........iii INTRODUCTION……………………………………………………………..............……………….......1 1. FISCAL STABILITY: RECENT ACHIEVEMENTS………..............………………. ……………...1 2. PUBLIC FINANCE VULNERABILITY FACTORS……………………………..............……….....3
2.1 Heavy Dependence on Customs Duties……………………………………..............……..…….....3
2.2 Low Internal Tax Revenue Mobilization……………………………………..............………….....4
2.3 Significant Revenue Shortfall Due to “Kpayo” Trafficking……………….…..............…...…........6
2.4 High Wage Bill……………………………………………………………….............……………..7
2.5 Relatively Low Capital Expenditure…………………………………………..............……….........9
2.6 An Expenditure Chain in Need of Improvement…………………………….............……..............10 3. EMERGING ECONOMIC ISSUES AND THEIR IMPACT ON PUBLIC FINANCE
MANAGEMENT…………………………………………….............................................………. .10
3.1 Structuring Investment Programme Implementation………………………............………...…... 11
3.2 Entry into Force of the ECOWAS Common External Tariff (CET)............................................... 13
3.3 Drop in Oil Prices: An Opportunity to End Petrol Smuggling and Improve Public Revenue
Collection? ......................................................................................................................................14 4. REFORM OPTIONS FOR GREATER FISCAL STABILITY..........................................................14 CONCLUSION……………………………………………………………………………….…………...18
ANNEX 1: ECOWAS COMMON EXTERNAL TARIFF (CET)…………………….…………….........19 Bibliography…………………………………………………………………………..…………………...20 List of Graphs Graph 1.a and 1.b: Fiscal Balance Trends....................................................................................................2 Graph 2 : Tax Revenue Structure in Benin....................................................................................4
Graph 3.a and 3.b: Tax Ratio Trends............................................................................................................5 Graph 4 : Wage Bill/Tax Revenue Ratio Trends………………………………………................8
Graph 5 : Average Public Investment Rate in WAEMU for the 2004-2013 Period…......………9 Graph 6 : Trends in Oil and Petrol Prices in Benin and Nigeria………………………………..15 List of Boxes Box 1: PEFA 2014 Assessment of Tax Revenue Mobilization Indicators…………….……………………5
Box 2: Structuring Investment Programme 2014-2018…..………………………..……..………………..11 Box 3: Benin’s Public Debt Strategy 2014-2018 …………………………………………………..……..12 List of Tables Table 1 : Assessment of the Impact of “Kpayo” Trafficking on Public Revenue ………………………….7 Table 2: Provisional Investment Programme Financing Schedule ……….……………………………….11

i
ACKNOWLEDGEMENTS This study was carried out by Daniel NDOYE, Country Economist (ORWA) residing in Benin,
under the general supervision of Ferdinand BAKOUP, Lead Economist (ORWA).
This document benefited from the invaluable comments and suggestions of colleagues at ORWA,
in particular Serge NGUESSAN, AfDB Resident Representative in Togo, Emanuele SANTI, Chief
Regional Economist, Maxime WEIGERT, Consultant (ORWA) and Mohamed El DAHSHAN,
Consultant (ORWA).
Peer review was carried out by Ammar KESSAB (Governance Department, OSGE.1), Valérie
ROBERT (Procurement Department, ORPF.1) and El Hadji FALL (Principal Economist, UNDP-
Benin).
The author is grateful to Beninese public administrative officials for their comments and the
information provided. Special thanks go to Mr. Aristide MEDENOU, Director General of
Economic Affairs in Benin’s Ministry of Economy and Finance and privatisation programmes.
The views expressed in this study are those of the author and do not necessarily reflect the views of the Bank, other institutions or individuals mentioned.

ii
ACRONYMS AND ABBREVIATIONS
ADF : African Development Fund
AfDB : African Development Bank
ASTER : State Accounting Software Package
ASYCUDA : Automated System of Customs Data Entry, Control and Management
CAPOD : Development Policy Formulation and Analysis Capacity Building Project
CET : Common External Tariff
CFAF : African Financial Community Franc
CSP : Country Strategy Paper
ECOWAS : Economic Community of West African States
GDP : Gross Domestic Product
GPRS : Growth and Poverty Reduction Strategy
GPRS III : Growth and Poverty Reduction Strategy for the 2011-2015 Period
GTC : General Tax Code
GUFE : Business Registration One-stop Shop
IMF : International Monetary Fund
INSAE : National Institute of Statistics and Economic Analysis of Benin
ITIN : Individual Taxpayer Identification Number
LOLF : Organic Law on Appropriation Acts
MDGs : Millennium Development Goals
MUA : Million Units of Account of the AfDB
NGO : Non-Governmental Organisation
OECD/DAC : Organisation for Economic Cooperation and Development / Development
Assistance Committee
PAAGFP : Public Finance Management Improvement Action Plan
PAGFPACAF : Public Finance Management and Business Climate Improvement Support
Project
PAREF : Economic and Financial Reform Support Programme
PEFA : Public Expenditure and Financial Accountability
PEMFAR : Public Expenditure Management and Financial Accountability Review
RISP : Regional Integration Strategy Paper
RMR : Road Maintenance Royalty
SGRFP : Comprehensive Public Service Reform Strategy
SIGFIP : Integrated Public Finance Management System
SIGMAP Computerized Public Procurement Management System
TFPs : Technical and Financial Partners
UA : AfDB Unit of Account
UNDP : United Nations Development Programme
VAT : Value Added Tax
WADB : West African Development Bank
WAEMU : West African Economic and Monetary Union

iii
EXECUTIVE SUMMARY Over the last decade, Benin has made significant progress in public finance management owing to
the implementation of poverty reduction strategies and reforms backed by technical and financial
partners, including the African Development Bank. Since the early 2000s, its budget deficit has
reduced significantly due to increased revenue and better public expenditure control. Despite these
achievements, the analysis of the public finance structure reveals points of vulnerability, namely:
(i) heavy dependence of public revenue on re-export trade with Nigeria; (ii) narrow tax base with
the predominance of the informal sector, particularly in the hydrocarbons sector; (iii) public
expenditure that is more directed towards recurrent expenditure, particularly salaries; (iv) low
contribution of domestic resources to capital expenditure and project implementation delays.
Overcoming these weaknesses so as to enable the implementation of the ambitious Structuring
Investment Programme, which received the international financial community’s backing during
the Paris Round Table held in June 2014, is a major challenge for the country. In addition, the
entry into force of the ECOWAS Common External Tariff (CET) in 2015 is a new factor that could
reduce revenue derived from re-export trade.
In this context, one of the Government’s priorities should remain the still be to broaden the tax
base by modernizing and interconnecting financial services, deepening reflection on development
taxation and combating the sale of adulterated petrol known as “kpayo” which benefits from a
favourable environment marked by the drop in world oil prices and the reduction in the petrol price
differential between Benin and Nigeria. Increasing domestic revenue is particularly essential as it
would be necessary to create more tax room to support investment programmes and boost external
resource mobilization. The second priority thrust in public finance management involves
streamlining recurrent expenditure, particularly salaries, and removing bottlenecks in the public
expenditure chain. To this end, it is crucial to strictly implement the new Public Procurement Code
as well as the decree setting timelines for public procurement bodies and public service delegations
and the decree relating to the partial delegation of public contract approval powers to ministers.
The African Development Bank (AfDB) is one of the leading actors in the public finance domain
in Benin. Its support should particularly target measures to increase tax revenue, notably by
modernizing and computerizing tax and customs services, and to strengthen the public
procurement system. Overall, the Bank should assist the Government in designing and
implementing a new plan to strengthen public finance management through on-going PEFA and
PEMFAR assessments to which it is already providing support.

1
INTRODUCTION 1. The purpose of this study is to analyse fiscal sustainability in Benin in light of its structure
and the country’s development context. The study contributes to the discussion on the
implementation of an appropriate public finance management framework to enable the country to
address its development challenges while preserving favourable conditions for fiscal
sustainability. The study complements the findings of PEFA and PEMFAR 20141 assessments by
focusing on the public finance challenges associated with the country’s macroeconomic context.
2. The country’s context is marked by the Government’s desire to implement structuring
investment programmes in several economic sectors (transport, energy, health, tourism,
agriculture, etc.). This development plan covering the 2014-2018 period, which will cost a total
amount of CFAF 6 529 billion or USD 13.8 billion, is based on the Growth and Poverty Reduction
Strategy (GPRS) guidelines. It seeks to raise the investment rate to about 27.0% of GDP in 2018,
against 19% in 2013. The plan received the international financial community’s backing during
the Paris Round Table held in June 2014. In view of its objectives, the plan should be based on an
efficient domestic and external resource mobilization strategy to maintain fiscal sustainability. The
country’s context is also marked by the entry into force in January 2015 of the ECOWAS Common
External Tariff (CET) whose impact on public finance requires an in-depth analysis.
3. The first part of this study analyses the progress made by the country in fiscal
stabilization. The second part focuses on the macroeconomic analysis of vulnerability factors
which pose a threat to fiscal sustainability. The third part highlights the various key elements of
the recent economic context and analyses their impact on public finance management. The last
part of the study identifies reform options to enhance fiscal stability and the role of the African
Development Bank (AfDB).
1. FISCAL STABILITY: RECENT ACHIEVEMENTS
4. The overall and primary budget balances experienced a downward trend in the
early 1990s and stabilized in the -4%-0% of GDP bracket in the early 2000s. After the
restoration of democracy in 1990, the public finance structure continued to be based on the socialist
model with huge, but steadily shrinking public budget deficits. The overall budget deficit fell from
an average of 8.9% of GDP during the 1990-2000 period to 3.8% between 2001 and 2013 (see
Graph 1.a2). During the last decade, the public budget deficit remained below the West African
Economic and Monetary Union (WAEMU) average3, but still remains above the average in sub-
Saharan Africa (see Graph 1.b).
1 These are respectively the assessment of Benin’s Public Finance Management System performance using the PEFA methodology and the
Beninese Government’s Public Expenditure Management and Financial Accountability Review (PEMFAR) backed by AfDB, the European
Union and the World Bank. These studies seek to assess public finance management systems using a standard framework and to identify reforms to ensure that the Public Finance Management System complies with international standards.
2 In Graph 1.a, the difference between the primary balance (using a narrow definition) and the one (using a broad definition) is that the former
does not include capital expenditure financed with external resources, which is not the case with the second. 3 An average of 5.35% of GDP in WAEMU between 2004 and 2013 and 1.7% of GDP in sub-Saharan Africa, according to IMF data.

2
Sources: National authorities, BCEAO.
5. Overall budget deficit stabilization in Benin in the last decade reflects the progress
made in revenue collection, but also a more prudent expenditure execution. The increase in
the tax ratio from 11% in 1990-2000 to 15.5% between 2001 and 2013 led to an improvement in
public revenue. This trend is attributable to the increase in revenue derived from re-export trade
and the initiation of various reforms, particularly within the framework of the implementation of
growth and poverty reduction strategies4 to improve the quality and efficiency of public
administration. These reforms sought notably to: (i) update and simplify the General Tax Code
(GTC); (ii) broaden the tax base by expanding the Individual Taxpayer Identification Number
(ITIN); (iii) modernize and interconnect customs units; and (iv) continue the computerization of
various services and the multiplication of revenue collection windows.
6. Public expenditure increased from 17.9% of GDP from 1990 to 2000 to 21.6% of
GDP from 2001 to 2013 due to the expenditure incurred within the framework of the
implementation of strategies to reduce poverty. It rose dramatically between 2007 and 2009
due to expenditure to curb food and financial crises5, on the one hand, and measures taken in
2009 to transfer contract workers to the public service and pay bonuses and allowances to
GPRS priority sector (health, education, etc.) employees. However, since then, expenditure
has stabilized following the decision to freeze recruitment into the public service. The decline
in expenditure is also due to the drop in capital expenditure, as will be discussed in the second
part.
4 That is PRS 1 (2003-2005); PRS 2 (2007-2009) and GPRS 3 (2011-2015). 5 According to World Bank estimates, the share of grants in public expenditure rose from 27% in 2006 to 30% in 2007 and 2008.
-12
-10
-8
-6
-4
-2
0
2
4
6
19
87
19
89
19
91
19
93
19
95
19
97
19
99
20
01
20
03
20
05
20
07
20
09
20
11
20
13
in %
of
GD
PGraph 1.a : Fiscal Balance Trends in Benin
Primary balance (narrow definition)
Primary balance (broad definition)
Overall deficit (commitment basis)
In
%
of
GD
P
3
7. With budget deficit stabilization, Benin is one of the countries having achieved good
performance regarding compliance with first-order WAEMU convergence criteria6.
According to the 2014 report of the WAEMU Multilateral Surveillance Commission, Benin met
the overall balance to nominal GDP ratio criterion with an average of -1.6% against a minimum
of -3.0% between 2010 and 2014. Benin is also the only WAEMU country that met this criterion
during the entire 2010-2014 period. The country also satisfies the second first-order budget
criterion relating to debt. The public debt to GDP ratio was 27.4% in 2014, well below WAEMU’s
70% threshold. Benin has been able to maintain a low debt level, thus contributing to fiscal
sustainability, thanks to debt cancellations, notably under the Heavily Indebted Poor Countries
(HIPC) Initiative and the Multilateral Debt Relief Initiative (MDRI), as well as to a decrease in
public budget deficit and better debt management.
8. On the whole, the public finance situation has improved owing to the poverty
reduction strategies and reforms implemented with the support of technical and financial
partners, including the AfDB. Despite this overall satisfactory trend, a more in-depth analysis of
the public finance structure shows vulnerability points which should be examined and addressed
by the authorities if they wish to maximize the contribution of public finance to the country’s
development efforts. These key points of vulnerability of public finance are analysed below.
2. PUBLIC FINANCE VULNERABILITY FACTORS
9. Benin’s public finance structure reflects that of the economy which is characterized by a
vibrant transit and re-export trade, the predominance of the informal sector and the significant
influence of the public service. The detailed analysis of the public finance situation reveals the
following main weaknesses.
2.1 Heavy Dependence on Customs Duties
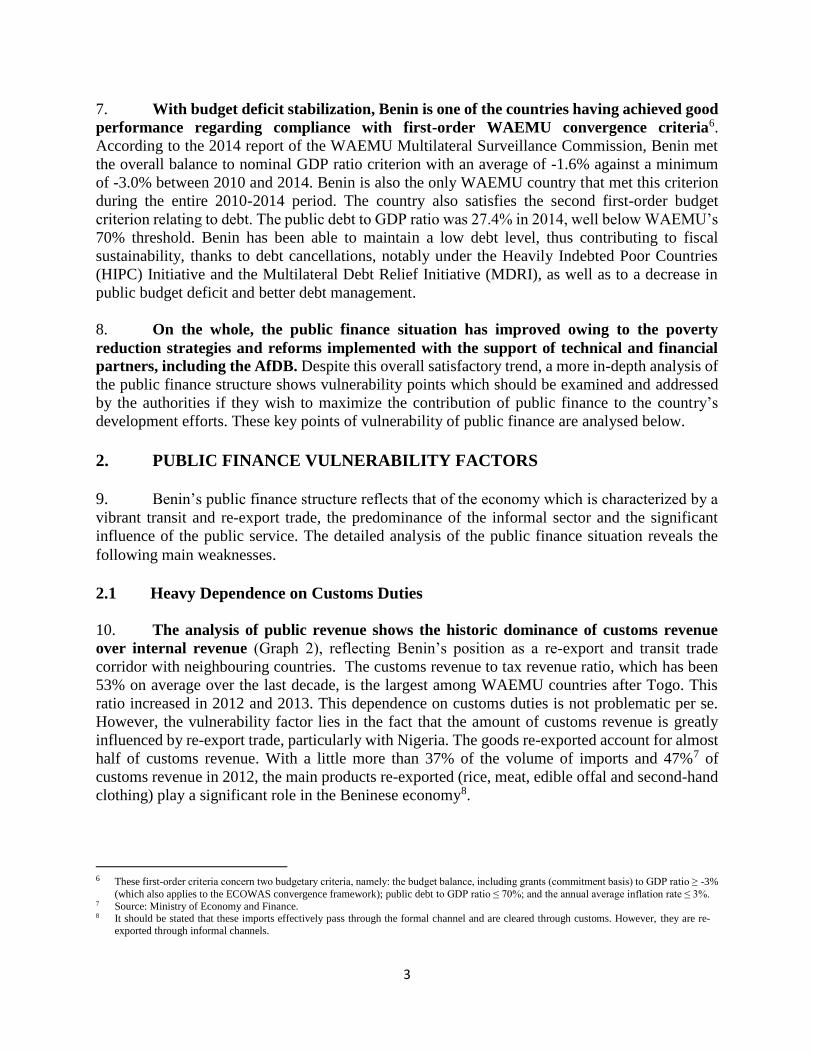
10. The analysis of public revenue shows the historic dominance of customs revenue
over internal revenue (Graph 2), reflecting Benin’s position as a re-export and transit trade
corridor with neighbouring countries. The customs revenue to tax revenue ratio, which has been
53% on average over the last decade, is the largest among WAEMU countries after Togo. This
ratio increased in 2012 and 2013. This dependence on customs duties is not problematic per se.
However, the vulnerability factor lies in the fact that the amount of customs revenue is greatly
influenced by re-export trade, particularly with Nigeria. The goods re-exported account for almost
half of customs revenue. With a little more than 37% of the volume of imports and 47%7 of
customs revenue in 2012, the main products re-exported (rice, meat, edible offal and second-hand
clothing) play a significant role in the Beninese economy8.
6 These first-order criteria concern two budgetary criteria, namely: the budget balance, including grants (commitment basis) to GDP ratio ≥ -3%
(which also applies to the ECOWAS convergence framework); public debt to GDP ratio ≤ 70%; and the annual average inflation rate ≤ 3%. 7 Source: Ministry of Economy and Finance. 8 It should be stated that these imports effectively pass through the formal channel and are cleared through customs. However, they are re-
exported through informal channels.
4
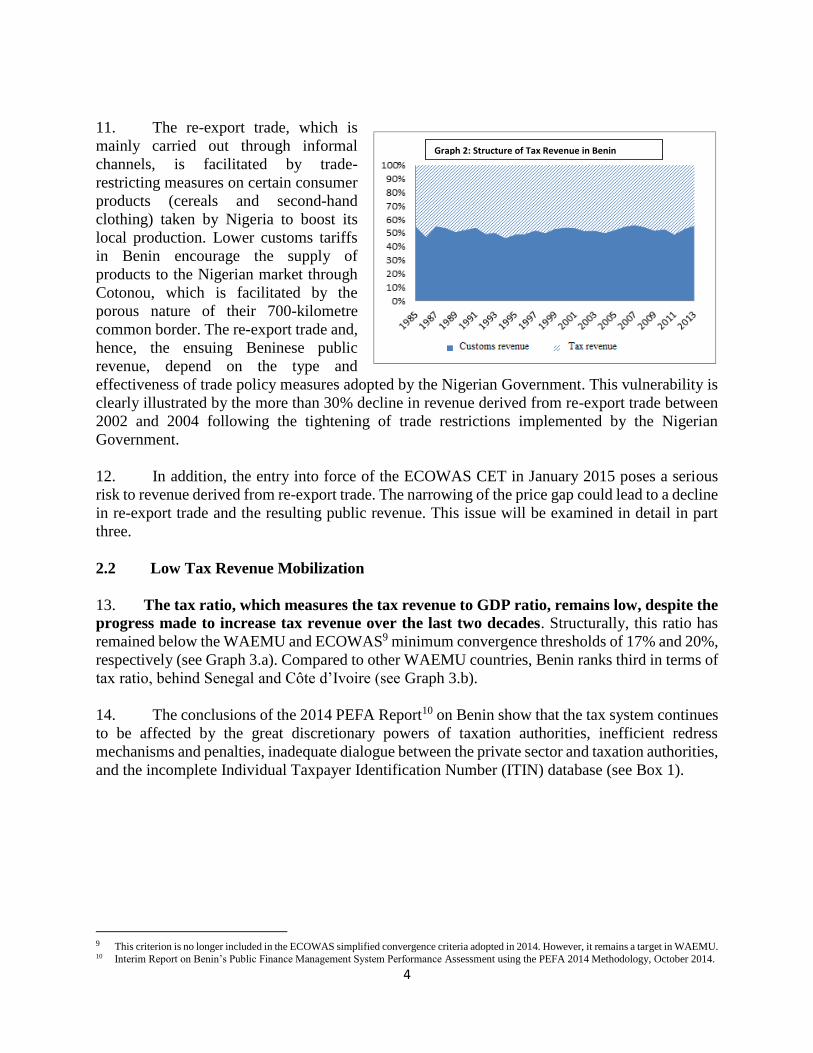
11. The re-export trade, which is
mainly carried out through informal
channels, is facilitated by trade-
restricting measures on certain consumer
products (cereals and second-hand
clothing) taken by Nigeria to boost its
local production. Lower customs tariffs
in Benin encourage the supply of
products to the Nigerian market through
Cotonou, which is facilitated by the
porous nature of their 700-kilometre
common border. The re-export trade and,
hence, the ensuing Beninese public
revenue, depend on the type and
effectiveness of trade policy measures adopted by the Nigerian Government. This vulnerability is
clearly illustrated by the more than 30% decline in revenue derived from re-export trade between
2002 and 2004 following the tightening of trade restrictions implemented by the Nigerian
Government.
12. In addition, the entry into force of the ECOWAS CET in January 2015 poses a serious
risk to revenue derived from re-export trade. The narrowing of the price gap could lead to a decline
in re-export trade and the resulting public revenue. This issue will be examined in detail in part
three.
2.2 Low Tax Revenue Mobilization
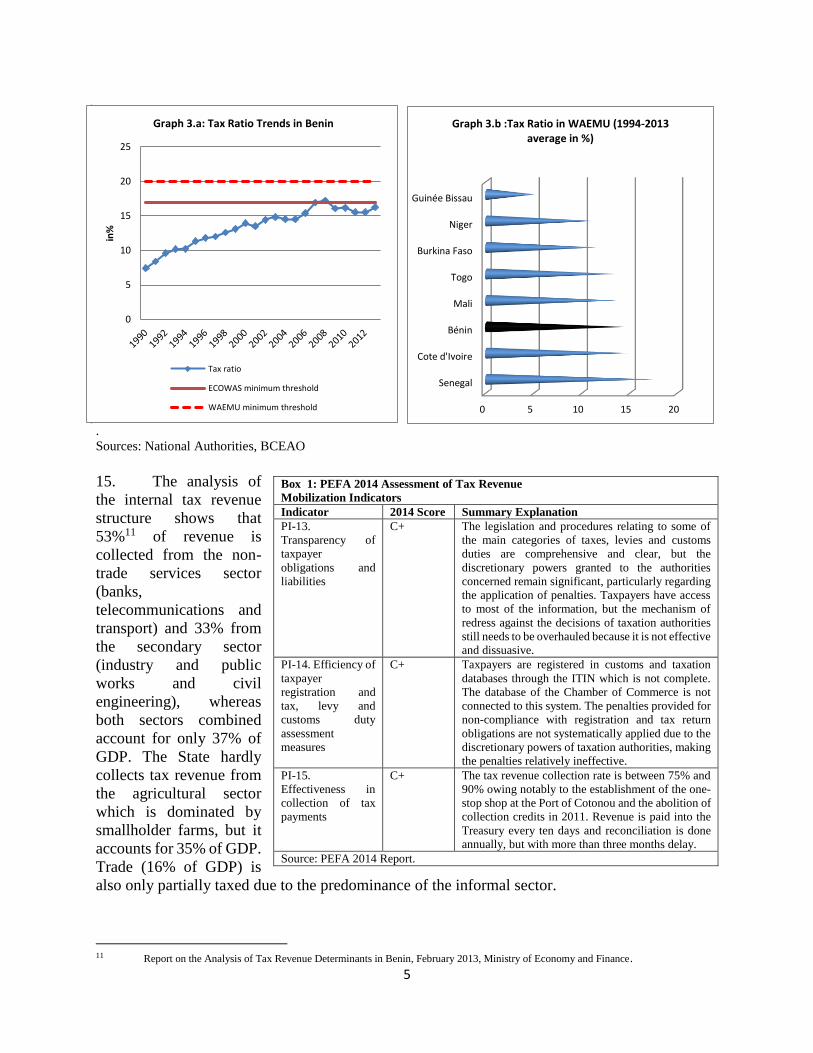
13. The tax ratio, which measures the tax revenue to GDP ratio, remains low, despite the
progress made to increase tax revenue over the last two decades. Structurally, this ratio has
remained below the WAEMU and ECOWAS9 minimum convergence thresholds of 17% and 20%,
respectively (see Graph 3.a). Compared to other WAEMU countries, Benin ranks third in terms of
tax ratio, behind Senegal and Côte d’Ivoire (see Graph 3.b).
14. The conclusions of the 2014 PEFA Report10 on Benin show that the tax system continues
to be affected by the great discretionary powers of taxation authorities, inefficient redress
mechanisms and penalties, inadequate dialogue between the private sector and taxation authorities,
and the incomplete Individual Taxpayer Identification Number (ITIN) database (see Box 1).
9 This criterion is no longer included in the ECOWAS simplified convergence criteria adopted in 2014. However, it remains a target in WAEMU. 10 Interim Report on Benin’s Public Finance Management System Performance Assessment using the PEFA 2014 Methodology, October 2014.
Graph 2: Structure of Tax Revenue in Benin
5
.
Sources: National Authorities, BCEAO
15. The analysis of
the internal tax revenue
structure shows that
53%11 of revenue is
collected from the non-
trade services sector
(banks,
telecommunications and
transport) and 33% from
the secondary sector
(industry and public
works and civil
engineering), whereas
both sectors combined
account for only 37% of
GDP. The State hardly
collects tax revenue from
the agricultural sector
which is dominated by
smallholder farms, but it
accounts for 35% of GDP.
Trade (16% of GDP) is
also only partially taxed due to the predominance of the informal sector.
11 Report on the Analysis of Tax Revenue Determinants in Benin, February 2013, Ministry of Economy and Finance.
Box 1: PEFA 2014 Assessment of Tax Revenue
Mobilization Indicators
Indicator 2014 Score Summary Explanation
PI-13. Transparency of
taxpayer
obligations and
liabilities
C+ The legislation and procedures relating to some of
the main categories of taxes, levies and customs
duties are comprehensive and clear, but the
discretionary powers granted to the authorities
concerned remain significant, particularly regarding
the application of penalties. Taxpayers have access
to most of the information, but the mechanism of
redress against the decisions of taxation authorities
still needs to be overhauled because it is not effective
and dissuasive.
PI-14. Efficiency of
taxpayer
registration and
tax, levy and
customs duty
assessment
measures
C+ Taxpayers are registered in customs and taxation
databases through the ITIN which is not complete.
The database of the Chamber of Commerce is not
connected to this system. The penalties provided for
non-compliance with registration and tax return
obligations are not systematically applied due to the
discretionary powers of taxation authorities, making
the penalties relatively ineffective.
PI-15. Effectiveness in
collection of tax
payments
C+ The tax revenue collection rate is between 75% and
90% owing notably to the establishment of the one-
stop shop at the Port of Cotonou and the abolition of
collection credits in 2011. Revenue is paid into the
Treasury every ten days and reconciliation is done
annually, but with more than three months delay.
Source: PEFA 2014 Report.
0
5
10
15
20
25
in%
Graph 3.a: Tax Ratio Trends in Benin
Tax ratio
ECOWAS minimum threshold
WAEMU minimum threshold 0 5 10 15 20
Senegal
Cote d'Ivoire
Bénin
Mali
Togo
Burkina Faso
Niger
Guinée Bissau
Graph 3.b :Tax Ratio in WAEMU (1994-2013 average in %)

6
16. The predominance of the informal sector in the country and the difficulties that
taxation authorities have taxing this sector are, indeed, a source of public finance
vulnerability. The informal economy in Benin accounts for 65% of GDP, against 42% on average
in sub-Saharan Africa. The informal sector employs 95% of the workforce and more than 9 out of
10 (97%) enterprises are operating in the informal sector. Ninety-six per cent of economic units in
urban areas and 99% in rural areas12 are in the informal sector. Thus, Benin, like many African
countries, is grappling with the predominance of the informal sector, which contributes to the
narrow tax base. The predominance of the informal sector does not only represent a huge loss for
the State, but is also a source of unfair competition with the formal sector which is taxed. The State
has embarked on the gradual formalization of the informal sector, notably through the registration
of sector actors in the ITIN database, tax exemptions during the first year of operation for newly-
established businesses, the establishment of taxation centres in major markets and the
dissemination of tax regulations. However, the impact of these measures is still limited.
2.3 Significant Revenue Shortfall Due to “Kpayo” Trafficking
17. Benin’s peculiarity with respect to other countries in the region in particular and
African countries in general is that besides a large informal sector, it has a petroleum
products distribution sector that is mainly dominated by illegal and informal activities. In
fact, adulterated petrol known as “kpayo13” smuggled out of Nigeria represents more than 80% of
Benin’s consumption of petroleum products. This trafficking is caused by disparities in pump
prices in both countries and, to a lesser extent, by Benin’s poor coverage in formal filling stations.
This trade causes health and environmental problems as well as a huge loss for the State which
does not collect the taxes on petroleum products it ought to due to the informal nature of the trade.
18. A fast estimate shows a significant loss of revenue. The loss is estimated using the model
below:
Assuming that:
QI0 = the quantity of petrol sold in the informal market QI1 = the quantity of petrol sold in the informal market which would pay taxes if the State could
tax the informal sector
t = the tax rate per litre of petrol
e = price elasticity of demand for petrol
P0 = the price of petrol sold in the informal market prior to the introduction of taxes
P1 = the price of petrol sold in the “informal”14 market if the State could tax the informal market
RS = Revenue shortfall
Therefore:
RS = t*IQ1 (1)
Where the formula is used with the price elasticity of demand to calculate IQ1, the revenue shortfall
in partial equilibrium can be estimated as follows:
12 Source: Benin’s Economic Growth Recovery Plan, February 2012. 13 Meaning “fake” in the ‘goun’ local language. 14 If the State could tax petrol sold in the informal market, the market would no longer be informal and the price structure would be different, but
for reasons of clarity and simplification, we will maintain the term informal market, even after the levying of tax.

7
RS = t*IQ0*(1+e*[(P1-P0)/P0]) (2)
Assuming that all the taxes on prices in the informal market are collected, the increase in informal
market prices [(P1-P0)/P0] after the levying of tax will be equal to the tax rate. This data is used to
calculate the revenue shortfall using equation (2).
An IMF study estimates price elasticity at between -0.2 and -0.415. The revenue shortfall can be
estimated using 2011 data on the quantities of petrol sold in the informal market and this market
price in 201416, the values of the price elasticity of demand for petrol estimated by the
aforementioned IMF study and the petrol tax rate. Table 1 shows the results of this estimate. The
calculation shows that the annual revenue losses due to this illegal trade would be between CFAF
15 billion and CFAF 17 billion (more than 2% of tax revenue). The calculation does not take into
account the huge losses of revenue derived from the activities of oil companies (turnover and
payroll taxes, etc.).
Table 1
Assessment of the impact of “Kpayo” trafficking on public revenue Baseline
situation
(2011)
Assumption
price elasticity of Kpayo
(-0.2)
Assumption
price elasticity of Kpayo
(-0.4)
Sales volume in the
informal market (in
millions of litres)
QI0 = 112.2 QI1 = 112.2* (1-0.2* (160/400))
= 103.22
QI 1 = 112.2 * (1-0.4*
(160/400)) = 94.248
Public revenue shortfall on
the basis of t = tax of CFAF
160 per litre of petrol (in
CFAF billion)17
RS = 160* 103.22 = 16.516 RS = 160* 94.248 = 15.079
Sources: National data, IMF and author’s calculation.
19. The scale of this loss has a serious impact on Beninese public finance. For instance, it
deprives the Government of revenue that could be used to replenish the Road Fund which finances
road maintenance operations. The road maintenance royalty (RMR) that is levied on petroleum
products helps to replenish the Road Fund in many ECOWAS member countries, enabling them
to comply with the Community Directive (ECOWAS and WAEMU)18 on the harmonization of
road maintenance strategies in member countries. This Directive requires each country to establish
a financially autonomous Road Fund. Benin’s Road Fund which is essentially replenished by the
State budget and toll revenue is therefore financially weak, thus affecting road maintenance
quality19.
2.4 High Payroll
20. Public expenditure is characterized by a high payroll which represents about 45%
of government tax revenue, against the 35% maximum threshold fixed within the framework
of the WAEMU convergence criteria. The payroll to tax revenue ratio dropped significantly from
more than 90% in the early 1990s to 32% in 2007. This decrease reflects the country’s transition
to a market economy and the implementation of growth and poverty reduction strategies, including
voluntary and targeted retirement programmes and the transfer of public entities to the private
15 Third review of Benin’s programme backed by the IMF Extended Credit Facility, April 2012. 16 Informal market price: PI = CFAF 400/litre. 17 Estimate Based On The December 2014 Price Structure. 18 Directive No. 11-2009-CM-WAEMU of 25 September 2009 to harmonize road maintenance strategies in WAEMU Member States. 19 By way of comparison, Côte d’Ivoire’s Road Fund which is largely replenished by the RMR was CFAF 70 billion in 2013, while Benin’s Road
Fund is less than CFAF 4 billion.

8
sector. Since 2008, however, this ratio has again exceeded the 35% maximum threshold fixed
within the framework of the WAEMU convergence criteria (see Graph 4). This upward trend was
particularly driven by the measures taken in 2009 to transfer contract employees to the public
service and the continuous increase in permanent public employees’ index points20. The total
number of public employees, therefore, rose from 40 523 in 2005 to 70 000 in 2010. In 2011, the
Government and trade unions agreed on a 25% increase in the index point from 2011 to 2014. The
proportion of bonuses and allowances included in the payroll is rising. The proportion rose from
5.77% in 2001 to 14.1% in 2010. According to a study on the wage plan21 carried out by the
Government, many bonuses are paid to public employees in violation of the instruments in force.
Whereas the General Rules and Regulations of the Public Service provides for 16 bonuses, the
said study identified 64 in the payroll. The payroll represents about 50% of recurrent expenditure,
against an average of 37% for sub-Saharan Africa.
21. Despite the efforts made by the
Government to control the Public Service
workforce, the payroll to GDP ratio in
Benin is still the highest in WAEMU.
During the 2009-2013 period, Benin’s ratio
was 7.3%, against an average of 6.1% in all
WAEMU member countries. The payroll to
tax revenue ratio is the third-highest with an
average of 44%, behind Guinea-Bissau
(74%) and Côte d’Ivoire (46%)22. An IMF
study titled “Wage Policy and Fiscal
Sustainability in Benin” carried out in 2010
had already drawn the attention of the
authorities to the risks associated with the
increase in the payroll. This study concluded
that if the payroll continued to increase at the
same rate as between 2000 and 2009 “it will compromise Benin’s debt and fiscal sustainability in
the medium-to-long term by generating excessive fiscal deficits or by crowding out growth-
enhancing public investment. A fiscal policy guided by targets set in order to maintain debt
sustainability, in tandem with population growth will leave only little space for civil service pay
increases”23. The implementation of the Comprehensive Public Service Reform Strategy (SGRFP)
should therefore be a major priority to support efforts to streamline the payroll so as to contribute
to the sustainability of public finance on the one hand, and to improve the efficiency of public
administration on the other hand.
20 This index point is used to calculate the indexed or basic salary, which is obtained by multiplying the index point value by a coefficient known
as the salary index assigned to the incremental position of each grade. 21 Study on the Beninese Public Service Wage Plan: Final “Inventory” Report, March 2012. 22 Côte d'Ivoire and Guinea-Bissau experienced political instability and conflicts, which may explain, to some extent, their high wage bill. On the
other hand, Benin, which enjoyed political stability throughout the period, was therefore able to better control its wage bill. 23 Charlotte Lundgren: Wage Policy and Fiscal Sustainability in Benin, IMF, 2010.
0
10
20
30
40
50
60
70
80
90
100
19
90
19
92
19
94
19
96
19
98
20
00
20
02
20
04
20
06
20
08
20
10
20
12
in %
Graph 4 :Payroll/Tax Revenue Ratio Trends
Benin WAEMU Maximum standard

9
2.5 Relatively Low Capital Expenditure
22. Benin’s public investment
level is low compared with other
WAEMU countries. The average
public investment rate (Public
Investment/GDP) over the last ten years
stands at 6.5%, against an average of
7.3% in WAEMU (Graph 4). Benin has
recorded the lowest public investment
rate over the last five years in the
WAEMU zone, coming after Côte
d’Ivoire. The low public investment rate
stems from the still limited domestic
resources allocated for investments, on
the one hand, and shortcomings in
project implementation, on the other
hand.
23. Average domestic financing stood at 3.5% of GDP over the period 2004-2013, against an
overall average of 4% in WAEMU. In addition, there is a tendency to space out or postpone
investment spending instead of implementing cuts in recurrent expenditure, particularly salaries,
which generally face more resistance at the social and political levels. Shortcomings in project
implementation result from the low maturity of investment projects proposed for inclusion in the
priority investment programme, frequent changes in investment priorities and the cumbersome
public procurement process.
24. The low public investment level points to low public spending effectiveness and
inadequate public resource profitability, a situation which negatively affects fiscal
sustainability. In fact, the low investment level is a serious impediment to growth and the
achievement of development objectives as it prevents the reduction of the country’s infrastructure
gap and any significant improvement of access to basic social services. Moreover, various studies
have highlighted the obstacle that such low investment level represents in the context of the
Beninese economy. Using a computable general equilibrium model, a study conducted by the
Government with the support of the Development Policy Formulation and Analysis Capacity
Building Project (CAPOD)24 showed that additional expenses geared towards investments instead
of recurrent expenditure produce a much more positive effect on growth in productive sectors. The
situation of rural households is also improved when investment spending is prioritized. The same
findings are contained in studies carried out by the IMF on the relationship between expenditure
composition and economic development in Benin25. These studies show that a change in the
composition of expenditure in favour of public investment would have beneficial effects on
growth, employment and equality of incomes, particularly through its effects on wages and
recruitment in the formal private sector. In contrast, an increase in the salary of public servants,
even if financed through foreign grants, may lead to lower growth, higher unemployment and
greater wage disparities between the various sectors. Low public investment, therefore, does not
24 Ministry of Development, Economic Analysis and Forecast-CAPOD “Alternative Economic Recovery Measures through Public Spending”,
September 2011. 25 Marco Pani and Mohamed El Harrak: “Expenditure Composition and Economic Development in Benin”, IMF, 2010.
Source: National authorities, BCEAO

10
enhance economic growth and increase incomes, a situation which does not help to consolidate
the tax base and strengthen fiscal sustainability.
25. The structuring investment programme which the Government prepared and presented to
the international community during the June 2014 Round Table is intended to make up for Benin’s
insufficient investment, especially public investment. The programme received substantial support
from international partners, which is quite encouraging. In addition to this external support, the
improvement of the public investment level is contingent on several factors, especially increased
budgetary allocation for public investment, greater effectiveness of the investment chain and better
programming of investments in relation to priority objectives.
2.6 An Expenditure Chain in Need of Improvement
26. Another huge challenge to be met to ensure fiscal stability remains the improvement
of the public expenditure chain. AfDB and the World Bank have, in particular carried out an
assessment of Benin’s Public Procurement Process using the OECD/DAC methodology as part of
the State of Benin’s Public Expenditure Management and Financial Accountability Review
(PEMFAR 2014). The review report noted particularly that although the legislative and regulatory
framework governing public procurement complies with international standards, its
implementation is not yet totally effective. The weaknesses identified concern notably the abusive
use of mutual agreement procedures, non-compliance with quotation procedures, the intrusion of
arrangements not provided for by the regulations in force (intervention of the Council of
Ministers), rotation of the staff of procurement bodies as well as human resource and financial
constraints which affect public procurement reform implementation. In order to step up the
efficiency of the procurement system, the Government of Benin issued new decrees in September
2014 aimed at ensuring the partial delegation of contract approval powers to ministers, on the one
hand, and setting timeframes for procurement bodies and public service delegations, on the other
hand. These decrees have considerably reduced the statutory procurement timeframes. As a result,
the maximum deadline for award of a public contract is now eighty (80) days, including statutory
timeframes, resulting to time savings of at least fifty-one (51) days. These are important measures
which need to be scrupulously implemented in order to ensure a significant reduction of deadlines.
3. EMERGING ECONOMIC ISSUES AND THEIR IMPACT ON PUBLIC
FINANCE MANAGEMENT
27. Benin’s current economic context is marked by many issues which will have a significant
impact on public finance and involve new revenue mobilization and public expenditure
management challenges as well as fiscal management challenges in general. This section reviews
these issues and analyses their implications for future public finance management.

11
3.1 Implementation of Structuring Investment Programmes
28. The challenges faced
by the country are basically: (i)
infrastructure gaps with a
limited road network and energy
shortage which has worsened
over the last two years owing to
the difficulties experienced by
supplier countries; (ii) economic
and financial governance
weaknesses, especially
concerning State resource
mobilization, budget
programming, execution and
control and public procurement
management; and (iii) the small
size and structure of the private
sector. These constraints impede
the optimal utilisation of the
country’s assets, especially its
agricultural potential and its
position as a sub-regional trade
corridor26.
29. To remedy these weaknesses, the Government has prepared an investment plan spanning
the period 2014-2018 for a total cost of CFAF 6 529 billion, or USD 13.8 billion. The plan, which
includes about one hundred projects, including five flagship projects (see Box 2), seeks to raise
the investment rate to nearly 27.0% in 2018, against 19% currently. It received support from the
international financial community during the June 2014 round table.
30. For an expressed financing
need of CFAF 2 900 billion,
commitments made by technical and
financial partners and the private
sector stand at close to CFAF 6 000
billion (or about USD 12 billion) for
the period 2014-2018. Additional
resources are estimated at about
CFAF 5 000 FCFA billion27, that is
about USD 10 billion, more than
half of which will be public
financing. The mobilization of these resources would help to implement the investment
programme broken down by year as shown in the provisional schedule described in Table 2.
26 Source: AfDB’s Country Strategy Paper 2012-2016 for Benin. 27 Source: World Bank “Benin Economic Update, Fall 2014”.
Box 2: Structuring Investment Programme 2014-2018
The Government has prepared an ambitious investment plan for the
period 2014-2018 for a total amount of CFAF 6 529 billion, or USD 13.8
billion, in the form of public investment and high value added private
projects that boost public-private partnership (PPP). Financing was to be
broken down into CFAF 3 762.0 billion (about USD 7.94 billion) coming
from the private sector and CFAF 2 766.3 billion (about USD 5.84 billion)
from the public sector. The plan comprises some one hundred projects
including the following five flagship projects:
(i) the backbone project to cost CFAF 2 090 billion comprising a deep-
sea oil and ore port and dry ports, the rail loop and the Glodjigbé
airport;
(ii) the programme to construct energy infrastructure and restructure
and extend the energy distribution network for a total cost of CFAF
1 545 billion;
(iii) the project to develop the fishery route for tourism purposes for an
amount of CFAF 1 200 billion;
(iv) the programme to develop irrigation schemes in Benin for a total
cost of CFAF 459 billion;
(v) the project to construct an excellence hospital evaluated at CFAF 70
billion.
In addition to these PPP flagship projects, special emphasis will be laid
on the public investment programme and road infrastructure development
projects (20 components for 1 735 kilometres of road).
Table 2: Provisional investment programme financing schedule (in
CFAF billion)
2014 2015 2016 2017 2018 Total
Investments over the
period 908.9 1092.7 1282 1505.7 1739.8 6529.1
As % of GDP 20.64 23.00 25.10 27.43 29.48 25.45
Public investments 338.9 433.4 535.5 666 792.5 2766.3
As % of GDP 7.70 9.12 10.49 12.13 13.43 10.78
Private investments 570 659.3 746.5 839.7 947.3 3762.8
As % of GDP 12.94 13.88 14.62 15.30 16.05 14.67
Source: Government authorities and author’s calculations
12
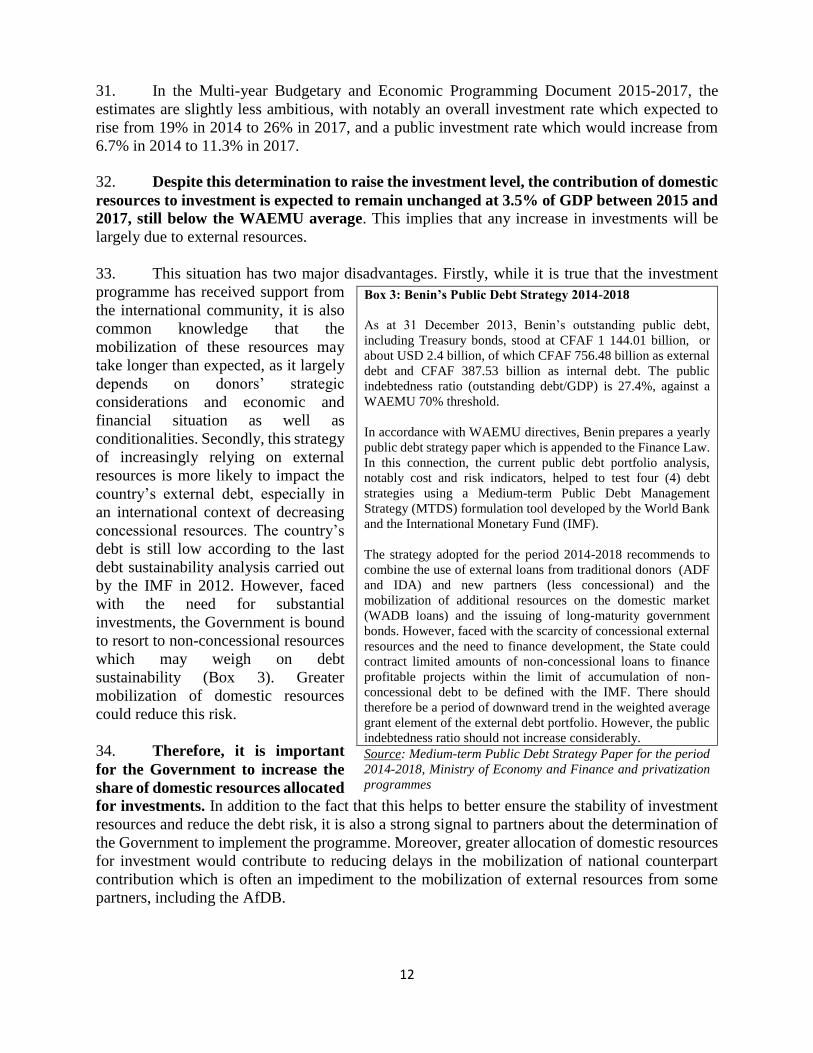
31. In the Multi-year Budgetary and Economic Programming Document 2015-2017, the
estimates are slightly less ambitious, with notably an overall investment rate which expected to
rise from 19% in 2014 to 26% in 2017, and a public investment rate which would increase from
6.7% in 2014 to 11.3% in 2017.
32. Despite this determination to raise the investment level, the contribution of domestic
resources to investment is expected to remain unchanged at 3.5% of GDP between 2015 and
2017, still below the WAEMU average. This implies that any increase in investments will be
largely due to external resources.
33. This situation has two major disadvantages. Firstly, while it is true that the investment
programme has received support from
the international community, it is also
common knowledge that the
mobilization of these resources may
take longer than expected, as it largely
depends on donors’ strategic
considerations and economic and
financial situation as well as
conditionalities. Secondly, this strategy
of increasingly relying on external
resources is more likely to impact the
country’s external debt, especially in
an international context of decreasing
concessional resources. The country’s
debt is still low according to the last
debt sustainability analysis carried out
by the IMF in 2012. However, faced
with the need for substantial
investments, the Government is bound
to resort to non-concessional resources
which may weigh on debt
sustainability (Box 3). Greater
mobilization of domestic resources
could reduce this risk.
34. Therefore, it is important
for the Government to increase the
share of domestic resources allocated
for investments. In addition to the fact that this helps to better ensure the stability of investment
resources and reduce the debt risk, it is also a strong signal to partners about the determination of
the Government to implement the programme. Moreover, greater allocation of domestic resources
for investment would contribute to reducing delays in the mobilization of national counterpart
contribution which is often an impediment to the mobilization of external resources from some
partners, including the AfDB.
Box 3: Benin’s Public Debt Strategy 2014-2018
As at 31 December 2013, Benin’s outstanding public debt,
including Treasury bonds, stood at CFAF 1 144.01 billion, or
about USD 2.4 billion, of which CFAF 756.48 billion as external
debt and CFAF 387.53 billion as internal debt. The public
indebtedness ratio (outstanding debt/GDP) is 27.4%, against a
WAEMU 70% threshold.
In accordance with WAEMU directives, Benin prepares a yearly
public debt strategy paper which is appended to the Finance Law.
In this connection, the current public debt portfolio analysis,
notably cost and risk indicators, helped to test four (4) debt
strategies using a Medium-term Public Debt Management
Strategy (MTDS) formulation tool developed by the World Bank
and the International Monetary Fund (IMF).
The strategy adopted for the period 2014-2018 recommends to
combine the use of external loans from traditional donors (ADF
and IDA) and new partners (less concessional) and the
mobilization of additional resources on the domestic market
(WADB loans) and the issuing of long-maturity government
bonds. However, faced with the scarcity of concessional external
resources and the need to finance development, the State could
contract limited amounts of non-concessional loans to finance
profitable projects within the limit of accumulation of non-
concessional debt to be defined with the IMF. There should
therefore be a period of downward trend in the weighted average
grant element of the external debt portfolio. However, the public
indebtedness ratio should not increase considerably.
Source: Medium-term Public Debt Strategy Paper for the period
2014-2018, Ministry of Economy and Finance and privatization
programmes

13
35. To increase budgetary allocation for investments, it is necessary to meet two major
challenges, namely to significantly increase State revenue and control recurrent expenditure,
particularly the payroll. Concerning the reduction of the payroll, it is necessary to speed up
implementation of the administrative reform for a more efficient and results-based administration
and ensure a streamlined and transparent allocation of bonuses.
36. These findings are consistent with the results of a recent IMF study on investment
expansion and the role of Government in Benin28. Based on the DSGE model29, the study
concludes that to preserve fiscal sustainability during the investment scale-up period, the
Government must continue to implement the stability policy and increase tax rates. The study also
highlights the importance of reducing inefficiency in tax revenue collection, which will mitigate
the role of tax rise and increase the debt reduction rate after the investment expansion phase.
37. Moreover, the promotion of public-private partnership (PPP), as provided for in the
Investment Programme (see Box 2), will contribute to enhancing the leverage effect of public
resources. To that end, it is important for the country to complete the establishment of an
institutional and legal framework for PPPs and strengthen dialogue between Government
and the private sector30.
3.2 Entry into Force of the ECOWAS Common External Tariff (CET)
38. The ECOWAS Common External Tariff (CET) entered into force on 1 January 2015 (see
Annex 1 for a more detailed CET presentation). The application of the ECOWAS CET will bring
about significant changes in terms of relative prices. For WAEMU non-member countries, it will
lead to a substantial drop in their protection level while tariff protection will increase slightly in
WAEMU member countries.
39. In the specific case of Benin, calculations made by the Ministry of Economy and Finance
show that the ECOWAS CET nominal protection rate is 15.63% for customs duties, against
13.55% for WAEMU CET. This average pricing increase is linked to the reclassification of the
ECOWAS CET and the establishment of the fifth band taxed at 35%.
40. This more protective tariff could generate additional resources for public finance
and constitute a factor in increasing production. It offers the country the opportunity to develop
growth sectors such as agriculture and agri-business for which Benin has potential and which could
benefit from the expansion of the West African market. In that regard, the implementation of the
Agricultural Sector Revival Strategic Plan (PSRSA) which mainly targets four sub-sectors (maize,
rice, pineapple and cashew) as well as the continuation of reforms aimed at improving the business
climate are of prime importance.
41. In the short term, however, the ECOWAS CET may have a negative impact
resulting from a decline in re-export trade. In fact, re-export trade fuelled by the price
differential should naturally decline with the reduction of this differential, or even be abolished
after five years of progressive adjustment. As such, according to simulations carried out by the
28 Investment Scaling-up and the Role of Government: the Case of Benin; Matteo F. Ghilardi and Sergio Sola; IMF working paper WP/15/69,
March 2015. 29 Dynamic stochastic general equilibrium model. 30 The Government has prepared and submitted to Parliament a law laying down the PPP institutional and legal framework.

14
Beninese Ministry of Economy and Finance, customs revenue will be on a downtrend (-30%) with
the decline in re-export trade. In contrast, duties and taxes whose trends depend much more on the
level of domestic activities (internal VAT, other indirect taxes and direct taxes) should increase in
very small proportions. On the whole, however, the decrease in customs revenue should drag
overall public revenue downward (-13%).
42. It is true that given the period of progressive adjustment to the CET which should span
five years and the risk that Nigeria may take a longer time to apply the CET, the decline in re-
export trade may not be felt during the initial years. All the same, it is essential for the Government
to anticipate this decline especially by broadening its tax base and continuing efforts at making the
Port of Cotonou more competitive and attractive.
3.3 Drop in Oil Prices: An Opportunity to End Petrol Smuggling and Improve Public
Revenue Collection?
43. Besides the implementation of the Structuring Investment Programme and the ECOWAS
CET, it can be said that the current context is also marked by a sharp drop in global oil prices
(40% drop between June and December 2014) which seems to be a good opportunity to end
the illegal trade in adulterated petrol. We have shown earlier on that this trade was driven by a
significant petrol price differential between Benin and Nigeria. However, as shown in Graph 6,
price gaps narrowed in December 2014 and is expected to increase in 2015 with the Nigerian
Government’s decision to reduce subsidies on petrol prices over the period 2015-2017 following
the drop in oil prices.
44. It should be recalled that after the measure to abolish subsidies taken by Nigeria in
January 2012, the population in Benin temporarily abandoned “kpayo” for filling stations until the
Nigerian Government partially resumed subsidies. However, unlike in 2012, the lifting of subsidies
in Nigeria will have limited effect on the population owing to the general drop in petrol prices, as
well as the progressive lifting of subsidies over the 2015- 2017 period. This could even lead to the
maintenance of price stability at the pump, or even a drop (certainly less sharp than in Benin),
depending on world oil price trends. The Nigerian Government could face less resistance than in
2012. For the Beninese Government, it offers an opportunity to revive the fight against the illegal
sale of petrol and to develop the hydrocarbons sector which is a major State revenue provider.
4. REFORM OPTIONS FOR GREATER FISCAL STABILITY
45. In light of the analysis we have just made on the structure and vulnerability factors of
public finance in Benin, and developments in the economic context, reform options, some of which
the Government has already embarked on, have been identified below to enable the country to lay
the foundations for sustainable and inclusive growth.

15
Sources: BCEAO; Petroleum Product Price Regulatory Agency (PPPRA) of Nigeria; US Energy
Information Administration; author’s estimates
(i) Broadening the tax base is one of Government’s major challenges
46. The purpose of broadening the tax base is to enable the country to increase its resources
and reduce the vulnerability of such resources to re-export trade. We have seen that this
vulnerability could increase with the entry into force of the CET. Increased internal revenue is all
the more important given the need, as underscored, to provide a little more tax room to support
investment programmes. The State must, therefore, resolutely continue to implement financial
services strategic orientation plans, namely: extension of the Individual Taxpayer Identification
Number (ITIN) and the fight against tax fraud and evasion; and the modernization of financial
services. Concerning the modernization of financial services, the Government needs to fine-tune
the approach consisting in interconnecting the IT systems of the various financial services
(SIGFIP, ASYCUDA, SIGMAP, ASTER, etc.) and decentralized entities in order to enhance
revenue centralization and improve the expenditure chain31. However, it is important to complete
the reflections on the implementation of a development taxation to boost economic growth. In
particular, it is necessary to develop a comprehensive taxation strategy for the informal sector,
including the agricultural sector, and provide tax incentives geared towards economic growth poles
and the development of SMEs and SMIs. A think-tank on development taxation was established
in 2008 but its findings are still to be implemented.
47. Moreover, the entry into force of the ECOWAS CET has given the Government the
opportunity to broaden its production base, especially in the agricultural and agri-business sectors
which could benefit from the West African market and contribute to increasing tax revenue. To
that end, special focus should be on accelerating the implementation of PSRSA and reforms aimed
at improving business climate.
31 In fact, the public finance information system is not integrated and not adapted to the new Organic Law on Appropriation Acts (LOLF) adopted
in 2013.
JAN
-14
FEB –
14
MA
R –
14
APR
–14
MA
Y-14
JUN
–14
JUL –
14
AU
G –
14
SEP –
14
OCT
–14
NO
V –
14
DEC
-14
Pump price in Benin
Pump price in Nigeria (pms)
Estimated price of Kpayo in Benin
Crude oil prices ($/barrel, right axis
Graph 6: Oil and Petrol Price Trends in Benin and Nigeria
In U
SD/L
itr
16
(ii) The fight against the illegal sale of “kpayo” should also contribute to increasing tax
revenue
48. The sale of this petrol is certainly a source of revenue for a number of youths, but it
nevertheless remains an illegal activity and a source of revenue loss for the State, with significant
negative impacts on the environment and health. The reduction of petrol prices and changes in the
structure of subsidies in Nigeria open a brief vista of circumstances conducive to the development
of new solutions which could extend beyond the simple fight against an illegal trade to ensure the
development of a scheduled comprehensive programme leading to an outcome favourable to all
the parties concerned. In this quest for solutions, the Government could also examine the
possibilities of reducing the tax on petroleum products. This would make “legal petrol” more
attractive. The negative effect of reduced taxes on income could be offset by the positive impact
resulting from increased sales in filling stations. The exemption of imported new equipment and
materials as well as local materials for the construction of filling stations, sidewalk stations and
petrol and gas tanks from import duties and taxes and VAT should also be continued. Less
resistance could be expected from the population compared with previous attempts32 to fight
against kpayo, as the action would be part of a structured programme and the ex-ante negative
impact of a decline in the illegal trade in petrol on transport fares and inflation would be offset by
a drop in pump prices in filling stations.
49. The experience of other countries could offer valuable hints, notably Colombia which is
also facing a similar situation in its border regions with Venezuela, and which has established a
vocational retraining programme for vendors of smuggled petrol, while trying to absorb the trade
into formal distribution networks. Therefore, it would be necessary to integrate more youths
involved in the sale of kpayo into youth employment programmes initiated by the Government.
Those who will remain in the sector will have to be encouraged to join formal economic units or
group themselves into entities (common interest groups, associations, NGOs, etc.) capable of
operating in a more formalized setting.
(iii) Streamlining Recurrent Expenditure, Especially Salaries, and Eliminating Bottlenecks
in the Public Expenditure Chain
50. By adopting the new Organic Law on Budget Laws in July 2013 in compliance with the
WAEMU directives, Benin embraced the Programme Budget (PB) practice to better articulate
budgetary allocation and public policies implemented as well as improved investment
programming. The Government is working with the support of some partners on the
implementation of programme budgets for the 2015 financial year. However, In addition to this
new budgetary approach, the improvement of the expenditure chain requires a more efficient
public procurement system. This is all the more indispensable as, in accordance with the Paris
Declaration on Aid Effectiveness, development partners, including the AfDB33, strive to
increasingly rely on the National Public Procurement System for the operations they finance. It is
crucial to strictly apply the mechanism of the new Public Procurement Code as well as the decrees
setting timeframes for public procurement bodies and public service delegations, and the
mechanism relating to the partial delegation of public contract approval powers to ministers. It is
32 The last attempt was in 2013. 33 In this connection, AfDB intends to soon sign a Letter of Agreement with the Government of Benin on the use of national competitive bidding
procedures for Bank-financed operations

17
also crucial to modernize the public procurement system and build the capacity of contracting
authorities. The operationalization of the overall public service reform strategy is another priority for
controlling the payroll.
AfDB’s Role in Benin’s Fiscal Reforms
51. AfDB is one of the Beninese Government’s major partners in the implementation of
policies aimed at strengthening public finance management. The amounts committed by the AfDB
in the public finance governance and management sector in Benin over the last ten years stand at
close to UA 110 million (about CFAF 80 billion). These funds, which were used to finance four
budget support projects and two institutional support projects34, have contributed to achieving
progress in the area of public finance management. In particular, the reforms backed by the Bank-
funded Economic and Financial Reforms Support Programme (PAREF) over the period 2012-
2013 notably focused on the broadening of the tax base with the extension of the Individual
Taxpayer Identification Number through the issuing of individual taxpayer identification numbers
at border posts, the interconnection of customs units and the adoption of a new customs code. The
previous programmes helped especially to prepare and adopt the Action Plan for Improving Public
Finance Management 2009-2013, build the capacity of internal and external audit institutions and
reduce delays in the passing of Settlement Bills by Parliament. Concerning public procurement,
the Bank supported the adoption of the new Public Procurement Code which complies with
international standards and is financing the Computerized Public Procurement Management
System (SIGMAP) under the on-going Public Finance Management and Business Climate
Improvement Support Project (PAGFPACAF). This software which was launched in January 2015
will contribute to reducing delays and strengthening transparency in public procurement
procedures.
52. In spite of this progress, there are still major challenges, as pointed out earlier on. As
such, support for the strengthening of public finance management remains a focus area in the
Bank’s on-going strategy in Benin through its Pillar 2 on good governance promotion35. The Bank
worked in conjunction with the Government, the European Union and the World Bank in assessing
the public finance system’s performance using the PEFA methodology and in a State Public
Expenditure Management and Financial Accountability Review (PEMFAR). The findings of these
works, which were validated in April 2015, will serve as a basis for preparing a new phase of the
plan to improve public finance management.
53. AfDB intends to remain one of the major players in the preparation of this plan and its
implementation. Given the Bank’s commitment during the June 2014 round table to support the
country financially and technically, it will have to pay special attention to measures aimed at
increasing tax revenue, notably through the modernization and computerization of tax and customs
services and the continuation of its support for the public procurement system. It seems to us that
these two issues are critical in enabling the country to meet the challenges related to the
implementation of its investment programme, on the one hand, and to mitigate the risks related to
the entry into force of the ECOWAS Common External Tariff (CET), on the other hand.
34 They are the three GPRS support programmes (PASCRP I 2004-2005; PASCRP II 2006-2007 and PASCRP III 2009-2010); the Economic
and Financial Reforms Support Programme (PAREF) 2012-2013; and the two institutional support projects (the Audit Institutions Support
Project and the Public Finance Management and Business Climate Improvement Support Project). 35 Bank Country Strategy Paper 2012-2016 for Benin.

18
CONCLUSION
54. In this study, we sought, from a macroeconomic perspective, to highlight the major points
of vulnerability of public finance management in light of recent developments in Benin’s economic
context. We are concluding with the need for Benin to consolidate efforts at broadening its tax
base in order to increase tax revenue and reduce its dependence on re-export trade with Nigeria.
This is all the more necessary as the entry into force of the ECOWAS CET may, in the long run,
significantly reduce re-export trade. In this connection, special attention should be paid to the fight
against the illegal sale of kpayo which, in addition to the health and environmental risks that it
represents, causes substantial public revenue losses. This fight should be part of a scheduled
comprehensive programme which blends measures for vocational retraining and integration of
actors of this illegal trade into formal channels, on the one hand, and actions aimed at attracting
the private sector to the hydrocarbons distribution sector, on the other hand. The drop in oil prices
and changes in the structure of subsidies in Nigeria provide an opportunity to start this fight.
Another finding of this study is the need for the Government to redirect public spending towards
investments through improved control of recurrent expenditure, especially salaries, and better
preparation and implementation of investment projects. This is necessary for the implementation
of the Structuring Investment Programme.
55. The above conclusions could be expounded to shed more light on public finance
management reforms. Further analyses which could be carried out on this issue relate notably to a
more detailed analysis of the structure of taxes and recurrent expenditure. This analysis would,
among other things, seek to better circumscribe the taxation and exemptions structure that best
suits development objectives, besides broadening the tax base, on the one hand, and identify the
types of recurrent expenditure, besides the payroll, which the State could adjust to widen its
investment margin while preserving social safety nets. These detailed analyses could constitute
avenues for reflection in future studies.

19
ANNEX 1
ECOWAS COMMON EXTERNAL TARIFF (Source: Ministry of Economy and Finance and Benin’s privatization programmes)
At their summit held in Niamey, Republic of Niger, in 2006, the ECOWAS Heads of State and
Government decided to extend the WAEMU Common External Tariff (CET) to all ECOWAS
member countries, subject to some readjustments to tariff lines. This decision sought to provide
ECOWAS with a customs union with a view to negotiating the Economic Partnership Agreement
with the European Union. The ECOWAS CET adopted at the summit of ECOWAS Heads of
State and Government held in Dakar on 25 October 2013 entered into force on 1 January 2015.
The ECOWAS CET classification adopted, marked by the introduction of a fifth band at 35%, is
as follows:
Category Product Customs Duty 0 Essential corporate assets 0% 1 Goods of primary necessity, raw materials, capital goods, specific
inputs 5%
2 Intermediate products 10% 3 Final consumption goods and all other products not mentioned
elsewhere 20%
4 Specific goods for economic development36 35%
This tariff structure takes into account the product’s processing level, the principle being that the
more the product is processed, the higher its classification category (tariff graduation principle).
In addition to duties and taxes proposed by the CET, there are the Import Adjustment Tax (IAT)
which will enable States to progressively adjust to the CET during a five-year period, and the
Supplementary Protection Tax (SPT) which seeks to correct any crowding out of local products
by imports. The products targeted by these two taxes are those of the agricultural, manufacturing
and industrial sectors. The cumulative ceiling of these two taxes is 70% and limited to 3% of
tariff lines.
In the case of Benin, the implementation of the ECOWAS CET will lead to a slight increase in
customs revenue compared with the WAEMU CET. The most significant increase will be in the
agri-food industry with 2.75 percentage points compared with the WAEMU CET. However,
Benin’s industrial fabric is still weak to be able to win shares in the regional market with the
implementation of the ECOWAS CET. The country must, therefore, pursue its reforms aimed at
promoting agri-business through PSRSA37 and improving the business environment in order to
increase its production potential and derive maximum benefit from the CET. In the short term,
it would be necessary to limit the risk of a fall in revenue related to a probable decline in re-
export trade by stepping up efforts to increase tax revenue mobilization. 36 The products of the 5th band include: (i) poultry, meats and meat preparations; (ii) yoghurts and cheeses; (iii) Irish potatoes and onions; (iv)
cereal flour and refined vegetable oils; (v) pastas and biscuits; and (vi) alcoholic and non-alcoholic beverages. Other products are still being
discussed. They include liquid or condensed milk, raw and refined sugar, fruit juices and tomato paste. The average tariff protection of these
lines in the WAEMU CET stands at 19.72%. 37 For agricultural products which PSRSA intends to promote (rice, maize, livestock and fishery products), the nominal protection rate should
increase with the introduction of the ECOWAS CET.

20
Bibliography
African Development Bank:
Bank’s Country Strategy Paper 2012-2016 for Benin, June 2012.
Economic and Financial Reforms Support Programme (PAREF) Evaluation
Report, September 2012.
Economic and Financial Reforms Support Programme (PAREF) Completion
Report, January 2014.
Government of Benin:
Multi-year Budgetary and Economic Programming Document 2015-2017,
October 2014.
Medium-term Public Debt Strategy Paper for the period 2014-2018, October
2014.
Study on the Remuneration System in the Beninese Public Service: Final
Inventory Report”, March 2012.
Ex-ante Impact of the Implementation of the ECOWAS CET on the Beninese
Economy, Benin’s Ministry of Economy and Finance, October 2013.
Alternative Economic Recovery Measures through Public Spending - Ministry of
Development, Economic Analysis and Forecasts - CAPOD, September 2011.
Benin’s Economic Recovery Plan, February 2012.
Analysis of Tax Revenue Determinants in Benin, February 2013, conducted
jointly with GIZ.
International Monetary Fund
Investment Scaling-up and the Role of Government: the Case of Benin; Matteo F.
Ghilardi and Sergio Sola, working paper WP/15/69, March 2015.
Third Review of Benin’s Programme backed by the IMF Extended Credit Facility,
April 2012.
Charlotte Lundgren: “Wage Policy and Fiscal Sustainability in Benin”, IMF,
2010.
Marco Pani and Mohamed El Harrak: “Expenditure Composition and Economic
Development in Benin”, IMF, 2010.

21
Final Report on the Assessment of the Performance of Benin’s Public Finance Management
System Using the PEFA 2014 Methodology, November 2014.
Interim Report on the Assessment of the Public Procurement System based on the OECD
Methodology, AfDB-World Bank, June 2014.
Interim Report on Public Finance Management and Financial Accountability Review of the State
of Benin, PEMFAR 2014, World Bank-AfDB, April 2015.
World Bank “Benin Economic Update, Fall 2014”.
WAEMU Commission: Six-monthly Report on the Implementation of Multilateral Surveillance,
December 2014.