Embed Size (px)
Citation preview

AFRICAN DEVELOPMENT FUND
RWANDA
SKILLS, EMPLOYABILITY AND ENTREPRENEURSHIP PROGRAMME (SEEP) II
APPRAISAL REPORT
OSHD DEPARTMENT
April 2014

Table of Contents
ACRONYMS AND ABBREVIATIONS ................................................................................................... i
LOAN AND GRANT INFORMATION ................................................................................................... ii
PROGRAMME EXECUTIVE SUMMARY ........................................................................................... iii
RESULTS-BASED LOGICAL FRAMEWORK .................................................................................... iv
PROGRAMME TIMEFRAME ............................................................................................................... vi
I. THE PROPOSAL .................................................................................................................................. 1
II. COUNTRY AND PROGRAMME CONTEXT .................................................................................. 2
2.1 Government’s overall development strategy and medium-term reforms priorities ........................ 2
2.2 Recent socioeconomic developments, perspectives, constraints and challenges .......................... 2
2.3 Bank Group portfolio status .......................................................................................................... 7
III. RATIONALE, KEY DESIGN ELEMENTS AND SUSTAINABILITY .......................................... 7
3.1 Link with the CSP, country readiness assessment and analytical works underpinnings .............. 7
3.2 Collaboration and coordination with other donors ........................................................................ 9
3.3 Outcomes of past and on-going similar operations ....................................................................... 9
3.4 Relationship with on-going Bank operations .............................................................................. 10
3.5 Bank’s value added and comparative advantages ....................................................................... 10
3.6 Application of good practice principles on conditionality .......................................................... 10
3.7 Application of Bank Group non-concessional borrowing policy ............................................... 10
IV. THE PROPOSED PROGRAMME .................................................................................................. 11
4.1 Programme’s goal and purpose ................................................................................................... 11
4.2 Programme’s components, operational policy objectives and expected results ......................... 11
4.3 Financing needs and arrangements ............................................................................................. 14
4.4 Programme’s beneficiaries .......................................................................................................... 15
4.5 Programme’s impact on gender ................................................................................................... 15
4.6 Environment and Climate Change .............................................................................................. 15
V. IMPLEMENTATION, MONITORING AND EVALUATION ....................................................... 15
5.1 Implementation arrangements ..................................................................................................... 15
5.2 Monitoring and evaluation arrangements .................................................................................... 17
VI. LEGAL DOCUMENTATION AND AUTHORITY ....................................................................... 17
6.1 Legal documentation ................................................................................................................... 17
6.2 Conditions associated with Bank’s intervention ......................................................................... 17
6.3 Compliance with Bank Group policies ....................................................................................... 19
VIII. RECOMMENDATION ................................................................................................................. 19
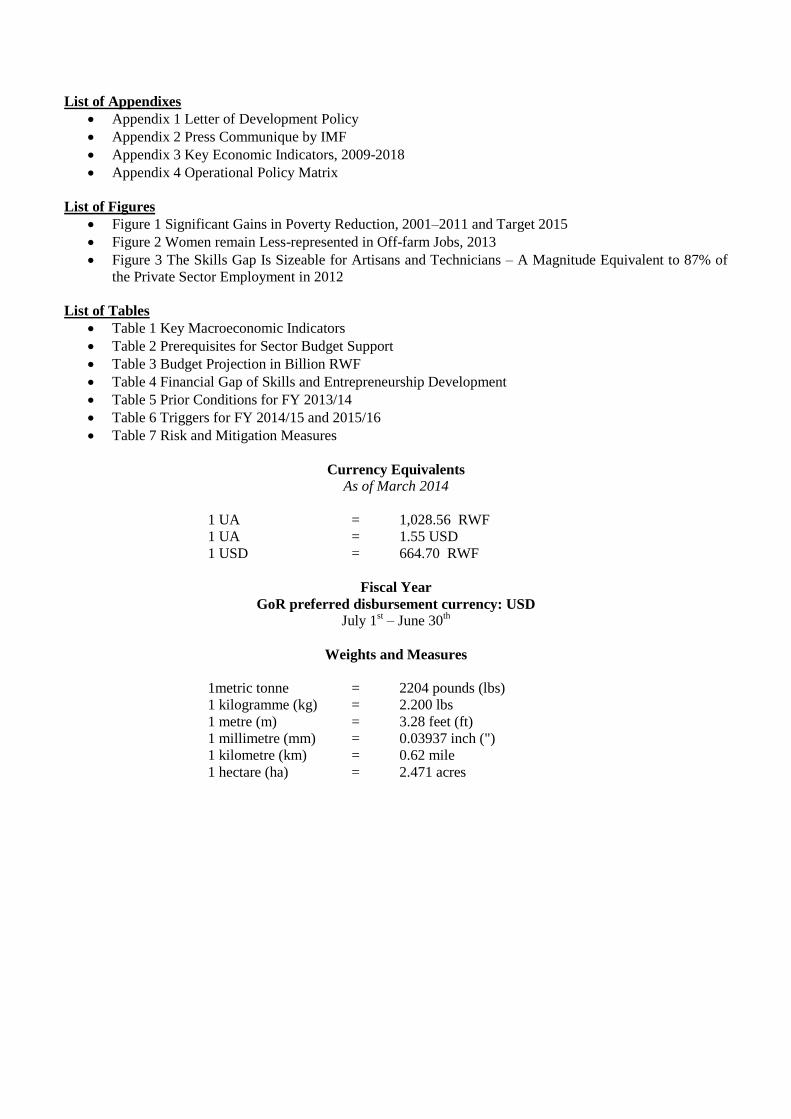
List of Appendixes
Appendix 1 Letter of Development Policy
Appendix 2 Press Communique by IMF
Appendix 3 Key Economic Indicators, 2009-2018
Appendix 4 Operational Policy Matrix
List of Figures
Figure 1 Significant Gains in Poverty Reduction, 2001–2011 and Target 2015
Figure 2 Women remain Less-represented in Off-farm Jobs, 2013
Figure 3 The Skills Gap Is Sizeable for Artisans and Technicians – A Magnitude Equivalent to 87% of
the Private Sector Employment in 2012
List of Tables
Table 1 Key Macroeconomic Indicators
Table 2 Prerequisites for Sector Budget Support
Table 3 Budget Projection in Billion RWF
Table 4 Financial Gap of Skills and Entrepreneurship Development
Table 5 Prior Conditions for FY 2013/14
Table 6 Triggers for FY 2014/15 and 2015/16
Table 7 Risk and Mitigation Measures
Currency Equivalents
As of March 2014
1 UA = 1,028.56 RWF
1 UA = 1.55 USD
1 USD = 664.70 RWF
Fiscal Year
GoR preferred disbursement currency: USD
July 1st – June 30
th
Weights and Measures
1metric tonne = 2204 pounds (lbs)
1 kilogramme (kg) = 2.200 lbs
1 metre (m) = 3.28 feet (ft)
1 millimetre (mm) = 0.03937 inch (")
1 kilometre (km) = 0.62 mile
1 hectare (ha) = 2.471 acres

i
Acronyms and Abbreviations
12YBE Twelve-year basic education
ADF African Development Fund
AfDB African Development Bank Group
AFD French Development Agency
AU African Union
BDC Business Development Center
BDE Business Development and Employment Unit
BDF Business Development Fund
BNR Banque Nationale du Rwanda (Central Bank)
BoP Balance of Payment
CDF Community Development Fund
CGF Credit Guarantee Fund
CEDP Competitiveness and Enterprise Development
Project
CPC Community Processing Centers
CPI Corruption Perception Index
CPPR Country Portfolio Performance Review
CSP Country Strategy Paper
DFID Department for International Development
DoL Division of Labour
DP Development Partner
DPCG Development Partner’s Coordination Group
DRC Democratic Republic of Congo
DRM Domestic Resource Mobilization
DSA Debt Sustainability Analysis
EAC East African Community
EC European Community
EDPRS Economic Development and Poverty
Reduction Strategy
EICV Integrated Household Living Conditions
Survey
ESSP Education Sector Strategic Plan
FAPA Fund for African Private Sector Assistance
FCS Fiscal Consolidation Strategy
FRA Fiduciary Risk Assessment
FY Fiscal Year
GDP Gross Domestic Product
GoR Government of Rwanda
HIPC Heavily Indebted Poor Country
ICGLR International Conference on the Great Lakes
Region
IPRC Integrated Polytechnic Regional Center
ICPC Integrated Craft Production Centers
ICT Information and Communication Technology
IFMIS Integrated Financial Management and
Information System
IMF International Monetary Fund
WDA Workforce Development Authority
WGI World Governance Indicators
YEGO Youth Employment for Global Opportunities
MIDR Multilateral Debt Relief Initiative MIFOTRA Ministry of Public Service and Labour
MIGEPROF Ministry of Gender and Family
Promotion
MINECOFIN Ministry of Finance and Economic
Planning
MINEDUC Ministry of Education
MINICOM Ministry of Trade and Industry
MSME Micro, Small and Medium Enterprise
MYICT Ministry of Youth, Information,
Communication and Technology
NCBS National Capacity Building Secretariat
NEP National Employment Programme
NISR National Institute of Statistics of Rwanda
OAG Office of the Auditor General
ODA Official Development Assistance
OPEV Operations Evaluation Department
PBO Policy Based Operations
PCR Programme Completion Report
PEFA Public Expenditure and Financial
Accountability
PER Public Expenditure Review
PFM Public Financial Management
PROBA Proximity Business Advisory
PRSP Poverty Reduction Strategy Paper
PSDS Private Sector Development Strategy
PSDYE Private Sector Development and Youth
Employment
PSF Private Sector Federation
PSI Policy Support Instrument
PRSSP Poverty Reduction Strategy Support
Programme
RDB Rwanda Development Board
ROR Republic of Rwanda
RWFO Rwanda Field Office
SACCO Saving and Credit Cooperative
SBS Sector Budget Support
SDTP Skills Development, Science and Technology
Project (SDTP)
SEEP Skills, Employability and Entrepreneurship
Programme
SSA Sub-Saharan Africa
SSC Sector Skills Council
SWG Sector Working Group
TSS Technical Secondary School
TVET Technical and Vocational Education and
Training
VTC Vocational Training Center
ii
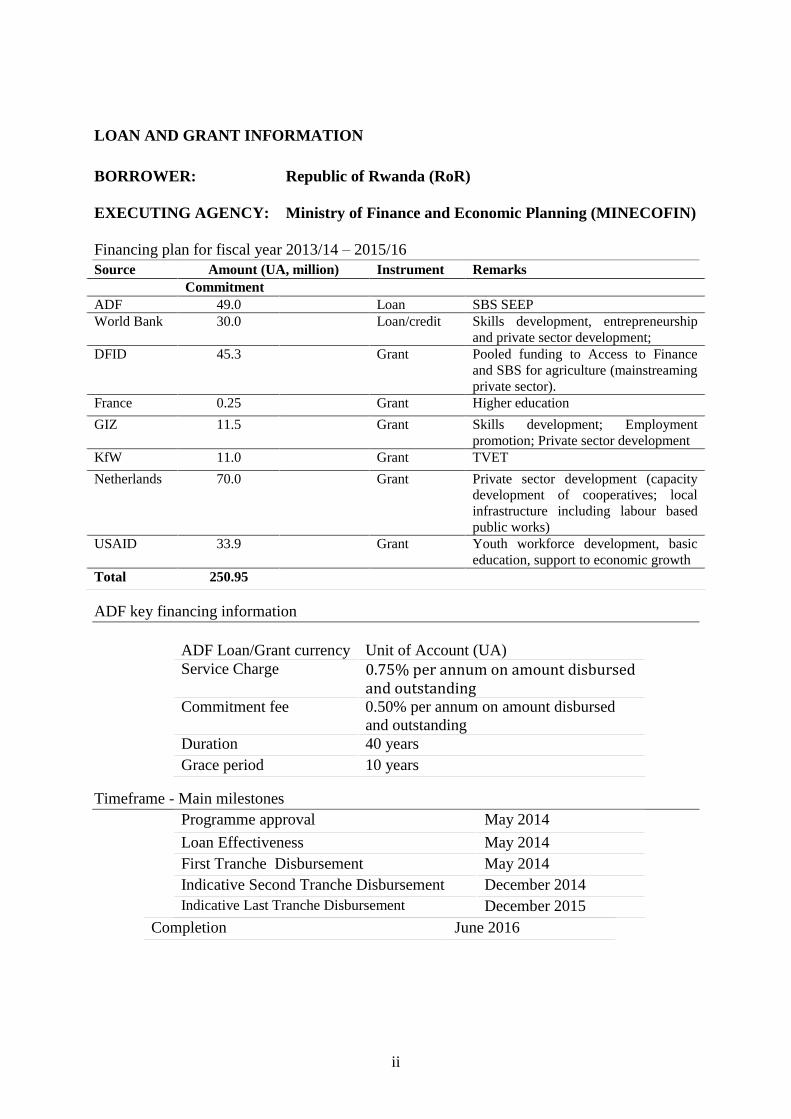
LOAN AND GRANT INFORMATION
BORROWER: Republic of Rwanda (RoR)
EXECUTING AGENCY: Ministry of Finance and Economic Planning (MINECOFIN)
Financing plan for fiscal year 2013/14 – 2015/16
Source Amount (UA, million) Instrument Remarks
Commitment
ADF 49.0 Loan SBS SEEP
World Bank 30.0 Loan/credit Skills development, entrepreneurship
and private sector development;
DFID 45.3 Grant Pooled funding to Access to Finance
and SBS for agriculture (mainstreaming
private sector).
France 0.25 Grant Higher education
GIZ 11.5 Grant Skills development; Employment
promotion; Private sector development
KfW 11.0 Grant TVET
Netherlands 70.0 Grant Private sector development (capacity
development of cooperatives; local
infrastructure including labour based
public works)
USAID 33.9 Grant Youth workforce development, basic
education, support to economic growth
Total 250.95
ADF key financing information
ADF Loan/Grant currency Unit of Account (UA)
Service Charge 0.75% per annum on amount disbursed and outstanding
Commitment fee 0.50% per annum on amount disbursed
and outstanding
Duration 40 years
Grace period 10 years
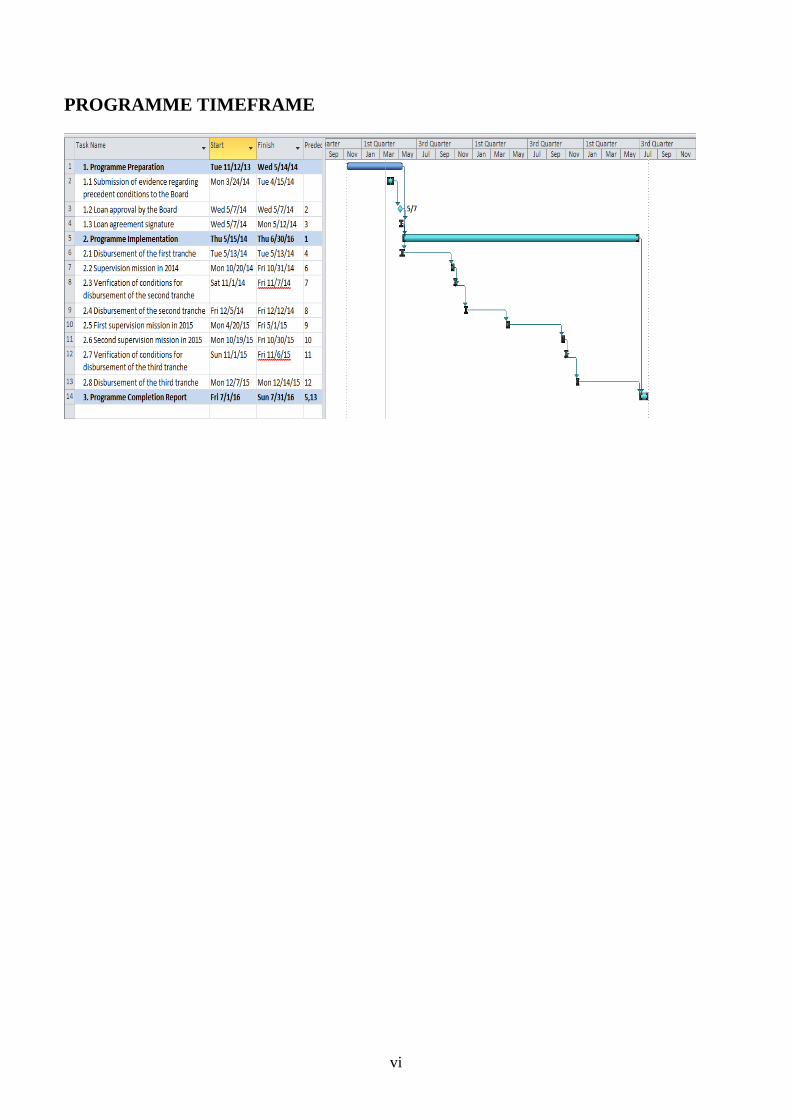
Timeframe - Main milestones
Programme approval May 2014
Loan Effectiveness May 2014
First Tranche Disbursement May 2014
Indicative Second Tranche Disbursement December 2014
Indicative Last Tranche Disbursement December 2015
Completion June 2016
iii
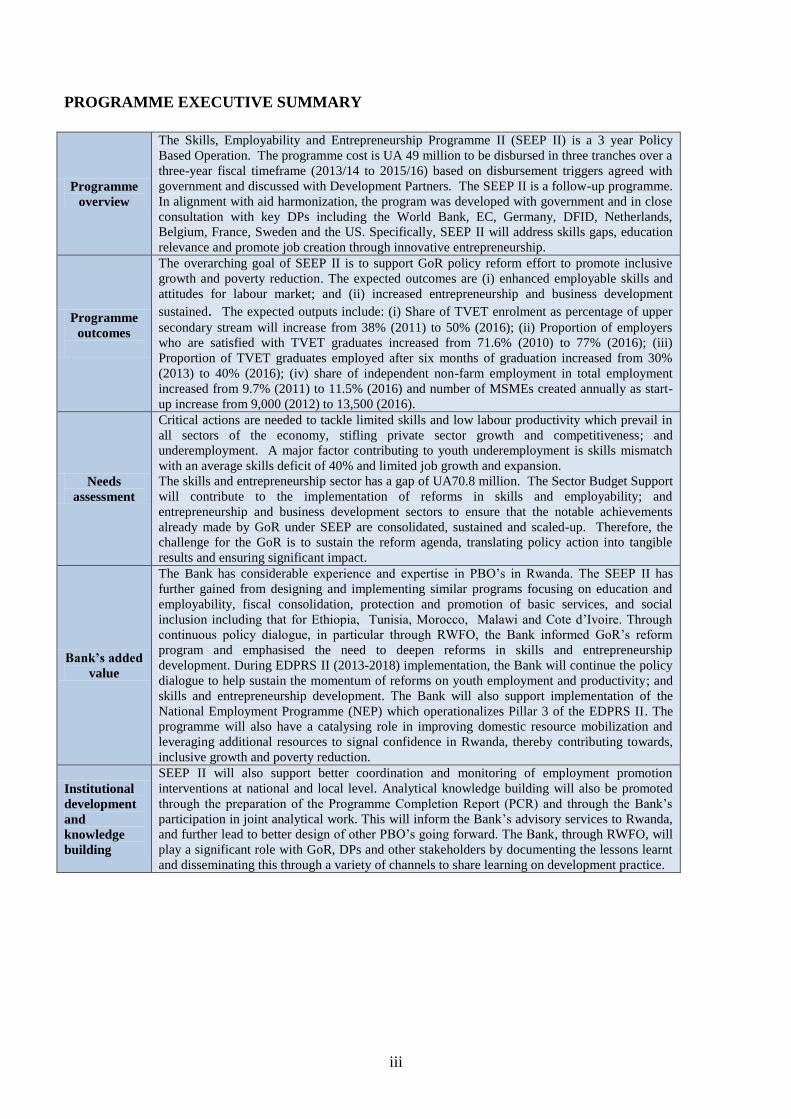
PROGRAMME EXECUTIVE SUMMARY
Programme
overview
The Skills, Employability and Entrepreneurship Programme II (SEEP II) is a 3 year Policy
Based Operation. The programme cost is UA 49 million to be disbursed in three tranches over a
three-year fiscal timeframe (2013/14 to 2015/16) based on disbursement triggers agreed with
government and discussed with Development Partners. The SEEP II is a follow-up programme.
In alignment with aid harmonization, the program was developed with government and in close
consultation with key DPs including the World Bank, EC, Germany, DFID, Netherlands,
Belgium, France, Sweden and the US. Specifically, SEEP II will address skills gaps, education
relevance and promote job creation through innovative entrepreneurship.
Programme
outcomes
The overarching goal of SEEP II is to support GoR policy reform effort to promote inclusive
growth and poverty reduction. The expected outcomes are (i) enhanced employable skills and
attitudes for labour market; and (ii) increased entrepreneurship and business development
sustained. The expected outputs include: (i) Share of TVET enrolment as percentage of upper
secondary stream will increase from 38% (2011) to 50% (2016); (ii) Proportion of employers
who are satisfied with TVET graduates increased from 71.6% (2010) to 77% (2016); (iii)
Proportion of TVET graduates employed after six months of graduation increased from 30%
(2013) to 40% (2016); (iv) share of independent non-farm employment in total employment
increased from 9.7% (2011) to 11.5% (2016) and number of MSMEs created annually as start-
up increase from 9,000 (2012) to 13,500 (2016).
Needs
assessment
Critical actions are needed to tackle limited skills and low labour productivity which prevail in
all sectors of the economy, stifling private sector growth and competitiveness; and
underemployment. A major factor contributing to youth underemployment is skills mismatch
with an average skills deficit of 40% and limited job growth and expansion.
The skills and entrepreneurship sector has a gap of UA70.8 million. The Sector Budget Support
will contribute to the implementation of reforms in skills and employability; and
entrepreneurship and business development sectors to ensure that the notable achievements
already made by GoR under SEEP are consolidated, sustained and scaled-up. Therefore, the
challenge for the GoR is to sustain the reform agenda, translating policy action into tangible
results and ensuring significant impact.
Bank’s added
value
The Bank has considerable experience and expertise in PBO’s in Rwanda. The SEEP II has
further gained from designing and implementing similar programs focusing on education and
employability, fiscal consolidation, protection and promotion of basic services, and social
inclusion including that for Ethiopia, Tunisia, Morocco, Malawi and Cote d’Ivoire. Through
continuous policy dialogue, in particular through RWFO, the Bank informed GoR’s reform
program and emphasised the need to deepen reforms in skills and entrepreneurship
development. During EDPRS II (2013-2018) implementation, the Bank will continue the policy
dialogue to help sustain the momentum of reforms on youth employment and productivity; and
skills and entrepreneurship development. The Bank will also support implementation of the
National Employment Programme (NEP) which operationalizes Pillar 3 of the EDPRS II. The
programme will also have a catalysing role in improving domestic resource mobilization and
leveraging additional resources to signal confidence in Rwanda, thereby contributing towards,
inclusive growth and poverty reduction.
Institutional
development
and
knowledge
building
SEEP II will also support better coordination and monitoring of employment promotion
interventions at national and local level. Analytical knowledge building will also be promoted
through the preparation of the Programme Completion Report (PCR) and through the Bank’s
participation in joint analytical work. This will inform the Bank’s advisory services to Rwanda,
and further lead to better design of other PBO’s going forward. The Bank, through RWFO, will
play a significant role with GoR, DPs and other stakeholders by documenting the lessons learnt
and disseminating this through a variety of channels to share learning on development practice.
iv
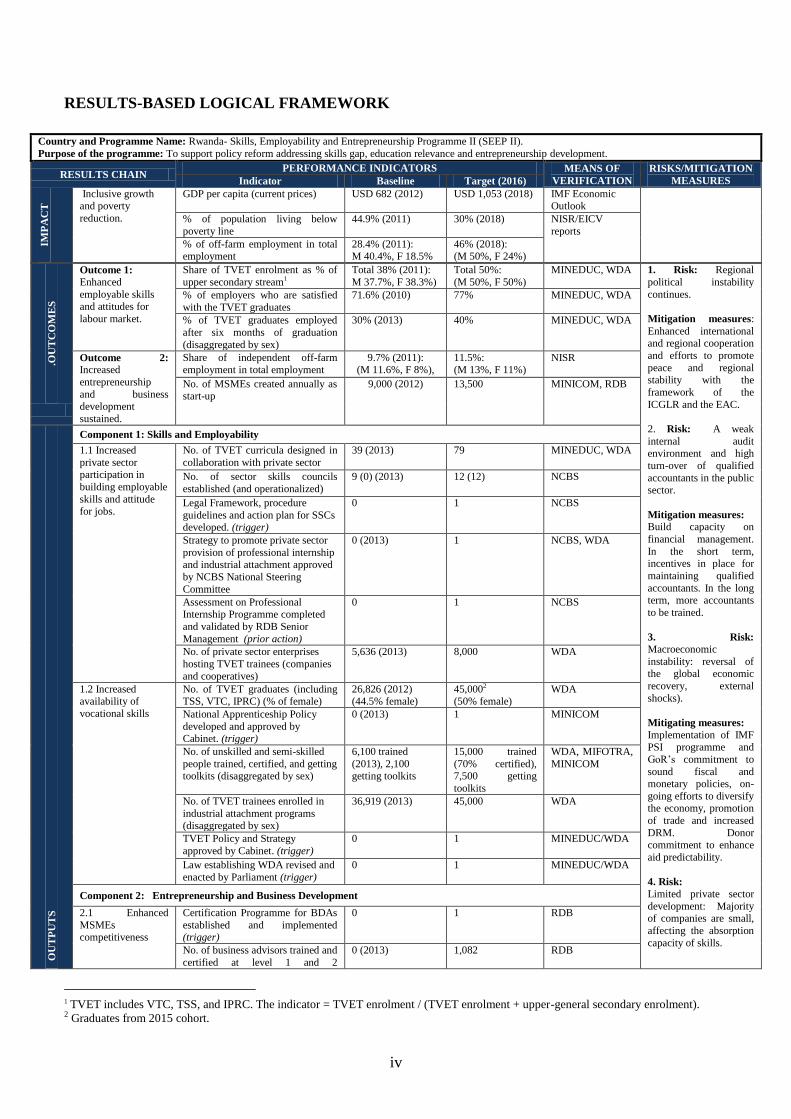
RESULTS-BASED LOGICAL FRAMEWORK
Country and Programme Name: Rwanda- Skills, Employability and Entrepreneurship Programme II (SEEP II).
Purpose of the programme: To support policy reform addressing skills gap, education relevance and entrepreneurship development.
RESULTS CHAIN PERFORMANCE INDICATORS MEANS OF
VERIFICATION
RISKS/MITIGATION
MEASURES Indicator Baseline Target (2016)
IMP
AC
T
Inclusive growth and poverty
reduction.
GDP per capita (current prices) USD 682 (2012) USD 1,053 (2018) IMF Economic Outlook
% of population living below
poverty line
44.9% (2011) 30% (2018) NISR/EICV
reports
% of off-farm employment in total employment
28.4% (2011): M 40.4%, F 18.5%
46% (2018): (M 50%, F 24%)
.OU
TC
OM
ES
Outcome 1:
Enhanced
employable skills and attitudes for
labour market.
Share of TVET enrolment as % of
upper secondary stream1
Total 38% (2011):
M 37.7%, F 38.3%)
Total 50%:
(M 50%, F 50%)
MINEDUC, WDA 1. Risk: Regional
political instability
continues.
Mitigation measures:
Enhanced international and regional cooperation
and efforts to promote
peace and regional stability with the
framework of the
ICGLR and the EAC.
2. Risk: A weak
internal audit environment and high
turn-over of qualified
accountants in the public sector.
Mitigation measures:
Build capacity on
financial management.
In the short term, incentives in place for
maintaining qualified
accountants. In the long term, more accountants
to be trained.
3. Risk:
Macroeconomic
instability: reversal of the global economic
recovery, external
shocks).
Mitigating measures:
Implementation of IMF
PSI programme and
GoR’s commitment to
sound fiscal and monetary policies, on-
going efforts to diversify the economy, promotion
of trade and increased
DRM. Donor commitment to enhance
aid predictability.
4. Risk: Limited private sector
development: Majority of companies are small,
affecting the absorption
capacity of skills.
% of employers who are satisfied
with the TVET graduates
71.6% (2010) 77% MINEDUC, WDA
% of TVET graduates employed
after six months of graduation
(disaggregated by sex)
30% (2013) 40% MINEDUC, WDA
Outcome 2:
Increased
entrepreneurship
and business development
sustained.
Share of independent off-farm employment in total employment
9.7% (2011): (M 11.6%, F 8%),
11.5%: (M 13%, F 11%)
NISR
No. of MSMEs created annually as start-up
9,000 (2012) 13,500 MINICOM, RDB
OU
TP
UT
S
Component 1: Skills and Employability
1.1 Increased
private sector participation in
building employable
skills and attitude for jobs.
No. of TVET curricula designed in
collaboration with private sector
39 (2013) 79 MINEDUC, WDA
No. of sector skills councils
established (and operationalized)
9 (0) (2013) 12 (12) NCBS
Legal Framework, procedure
guidelines and action plan for SSCs developed. (trigger)
0 1 NCBS
Strategy to promote private sector
provision of professional internship and industrial attachment approved
by NCBS National Steering
Committee
0 (2013) 1 NCBS, WDA
Assessment on Professional Internship Programme completed
and validated by RDB Senior
Management (prior action)
0 1 NCBS
No. of private sector enterprises
hosting TVET trainees (companies
and cooperatives)
5,636 (2013) 8,000 WDA
1.2 Increased availability of
vocational skills
No. of TVET graduates (including TSS, VTC, IPRC) (% of female)
26,826 (2012) (44.5% female)
45,0002 (50% female)
WDA
National Apprenticeship Policy
developed and approved by Cabinet. (trigger)
0 (2013) 1 MINICOM
No. of unskilled and semi-skilled
people trained, certified, and getting toolkits (disaggregated by sex)
6,100 trained
(2013), 2,100 getting toolkits
15,000 trained
(70% certified), 7,500 getting
toolkits
WDA, MIFOTRA,
MINICOM
No. of TVET trainees enrolled in
industrial attachment programs (disaggregated by sex)
36,919 (2013) 45,000 WDA
TVET Policy and Strategy
approved by Cabinet. (trigger)
0 1 MINEDUC/WDA
Law establishing WDA revised and
enacted by Parliament (trigger)
0 1 MINEDUC/WDA
Component 2: Entrepreneurship and Business Development
2.1 Enhanced
MSMEs competitiveness
Certification Programme for BDAs
established and implemented (trigger)
0 1 RDB
No. of business advisors trained and
certified at level 1 and 2
0 (2013) 1,082 RDB
1 TVET includes VTC, TSS, and IPRC. The indicator = TVET enrolment / (TVET enrolment + upper-general secondary enrolment). 2 Graduates from 2015 cohort.

v
(disaggregated by sex) Mitigation measures:
Dialogue between Government and Private
sector to address
bottlenecks affecting private sector growth.
No. of BDAs attached to sectors
(umurenge)
416 (2013) 832 MINICOM
Assessment on the impact of local
tax fixing and administration on MSMEs.
0 1 MINICOM
No. of ICPCs (Integrated Craft
Production Centers) and CPCs (Community Processing Centers)
equipped and operationalized
2 ICPCs, 1 CPCs
(2013)
12 ICPCs, 10
CPCs
MIFOTRA (for
ICPCs), MINICOM (for
CPCs)
2.2 Improved access
to financial services for MSMEs
No. of start-up MSMEs for youth
and women accessed to finance.
2,878 (2013) 30,000 MINICOM, BDF,
RCA
Study report on women skills gap
and existing opportunities in all
districts completed and validated by the Permanent Secretary
(MIGEPROF)
0 1 MIGEPROF
Guidelines on provision of seed
start-up capital for youth and women developed.
0 (2013) 1 MINICOM
Component 3: Enhanced coordination
Improved policy and
coordination
mechanisms of job creation
interventions
A consolidated National
Employment Programme validated
by NEP National Steering Committee. (prior action)
0 (2013) 1 MIFOTRA
Productivity and Youth
Employment (PYE) thematic steering committee established and
functional. (prior action)
0 1 MINECOFIN
No. of Business Development and
Employment (BDE) Units established and functional at district
level.
0 12 MINICOM
Gender sensitive electronic M&E
system developed. (trigger) 0 1 MIFOTRA
Coordination framework of
business development programs at district level developed and
approved by the Integrated
Development Program Steering Committee (prior action)
0 1 MINICOM
A Working Technical Secretariat
for the NEP established and functional. (trigger)
0 1 MIFOTRA
A consolidated database of potential youth and women
entrepreneurs developed
0 1 MYICT
KE
Y
AC
TIV
IT
IES
Components:
Component 1: Skills and Employability Component 2: Entrepreneurship and Business Development
Component 3: Enhanced coordination
Inputs- Funding in million UA ADF: 49 (loan)
vi
PROGRAMME TIMEFRAME
1
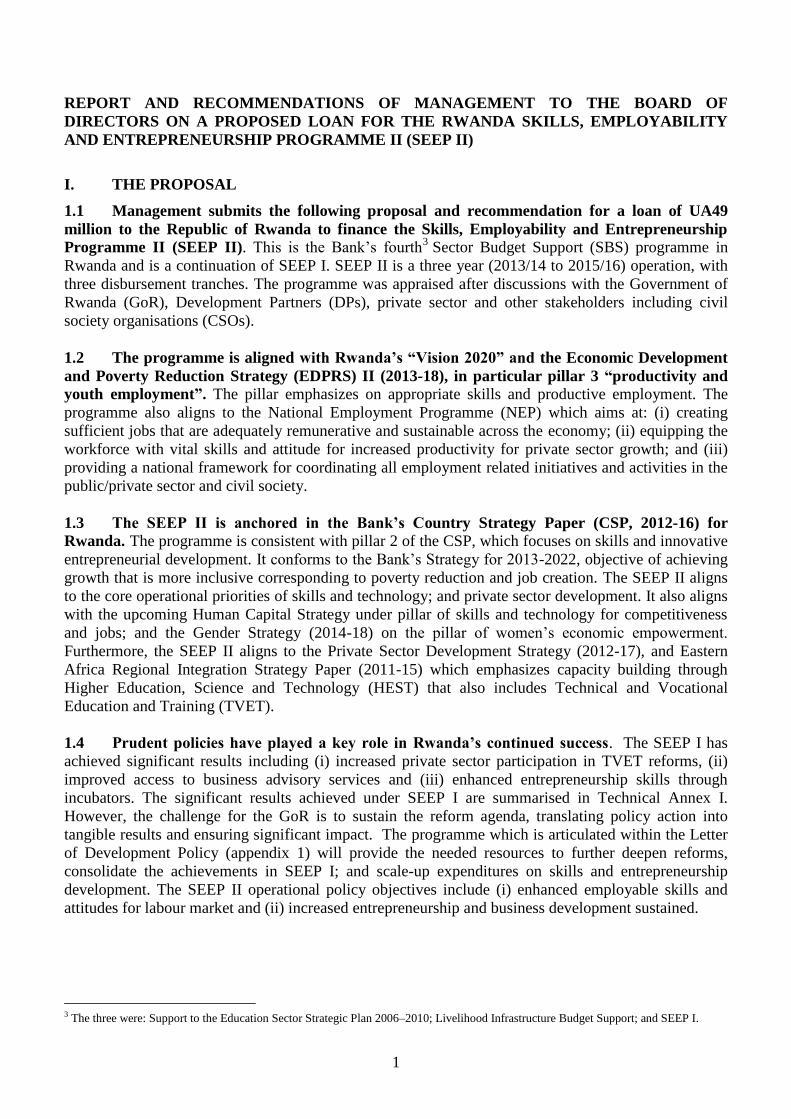
REPORT AND RECOMMENDATIONS OF MANAGEMENT TO THE BOARD OF
DIRECTORS ON A PROPOSED LOAN FOR THE RWANDA SKILLS, EMPLOYABILITY
AND ENTREPRENEURSHIP PROGRAMME II (SEEP II)
I. THE PROPOSAL
1.1 Management submits the following proposal and recommendation for a loan of UA49
million to the Republic of Rwanda to finance the Skills, Employability and Entrepreneurship
Programme II (SEEP II). This is the Bank’s fourth3 Sector Budget Support (SBS) programme in
Rwanda and is a continuation of SEEP I. SEEP II is a three year (2013/14 to 2015/16) operation, with
three disbursement tranches. The programme was appraised after discussions with the Government of
Rwanda (GoR), Development Partners (DPs), private sector and other stakeholders including civil
society organisations (CSOs).
1.2 The programme is aligned with Rwanda’s “Vision 2020” and the Economic Development
and Poverty Reduction Strategy (EDPRS) II (2013-18), in particular pillar 3 “productivity and
youth employment”. The pillar emphasizes on appropriate skills and productive employment. The
programme also aligns to the National Employment Programme (NEP) which aims at: (i) creating
sufficient jobs that are adequately remunerative and sustainable across the economy; (ii) equipping the
workforce with vital skills and attitude for increased productivity for private sector growth; and (iii)
providing a national framework for coordinating all employment related initiatives and activities in the
public/private sector and civil society.
1.3 The SEEP II is anchored in the Bank’s Country Strategy Paper (CSP, 2012-16) for
Rwanda. The programme is consistent with pillar 2 of the CSP, which focuses on skills and innovative
entrepreneurial development. It conforms to the Bank’s Strategy for 2013-2022, objective of achieving
growth that is more inclusive corresponding to poverty reduction and job creation. The SEEP II aligns
to the core operational priorities of skills and technology; and private sector development. It also aligns
with the upcoming Human Capital Strategy under pillar of skills and technology for competitiveness
and jobs; and the Gender Strategy (2014-18) on the pillar of women’s economic empowerment.
Furthermore, the SEEP II aligns to the Private Sector Development Strategy (2012-17), and Eastern
Africa Regional Integration Strategy Paper (2011-15) which emphasizes capacity building through
Higher Education, Science and Technology (HEST) that also includes Technical and Vocational
Education and Training (TVET).
1.4 Prudent policies have played a key role in Rwanda’s continued success. The SEEP I has
achieved significant results including (i) increased private sector participation in TVET reforms, (ii)
improved access to business advisory services and (iii) enhanced entrepreneurship skills through
incubators. The significant results achieved under SEEP I are summarised in Technical Annex I.
However, the challenge for the GoR is to sustain the reform agenda, translating policy action into
tangible results and ensuring significant impact. The programme which is articulated within the Letter
of Development Policy (appendix 1) will provide the needed resources to further deepen reforms,
consolidate the achievements in SEEP I; and scale-up expenditures on skills and entrepreneurship
development. The SEEP II operational policy objectives include (i) enhanced employable skills and
attitudes for labour market and (ii) increased entrepreneurship and business development sustained.
3 The three were: Support to the Education Sector Strategic Plan 2006–2010; Livelihood Infrastructure Budget Support; and SEEP I.

2
II. COUNTRY AND PROGRAMME CONTEXT
2.1 Government’s overall development strategy and medium-term reforms priorities
2.1.1 The country’s overarching development goal is to transition from a subsistence based
economy to a private sector-led economy by 2020. This development goal is articulated in Vision
2020 which presents the framework for achieving Rwanda’s aspirations4; thus ensuring that growth
benefits the majority while fostering unity and reconciliation. Medium term development strategies are
the primary vehicle for implementing Vision 2020. The Poverty Reduction Strategy Paper (PRSP)
(2002–05) contributed to restoring peace and provision of basic services. The EDPRS-1 (2008–
2012/13) prioritised poverty reduction and inclusive growth.
2.1.2 Medium-term priority reforms: EDPRS II (2013–18) aims to consolidate gains in
economic growth, poverty reduction and reduced income inequality. It focuses on four thematic
areas: (i) Economic Transformation, (ii) Rural Development, (iii) Productivity and Youth Employment,
and (iv) Accountable Governance. Achieving the EDPRS II objectives is contingent on sustained
investments in education, health, social protection, public financial management and private sector
development.
2.2 Recent socioeconomic developments, perspectives, constraints and challenges
Economic context
2.2.1 Rwanda has sustained strong economic progress, in spite of external shocks. Real GDP
growth during the first three quarters of 2013 averaged 5.3% compared to 7.7% during the same period
in 2012 yielding an estimated 6.6% GDP growth in 2013 down from 8.0% in 2012. This slow-down is
due to the effects of aid suspension experienced in 2012 which amounted to 3% of GDP. The
Government’s response to the aid cut-backs included suspending some public spending and borrowing
from the domestic financial markets which contributed to a reduction in investment and also slowed
growth in private sector credit. The 2013 GDP growth was mainly led by industry sector, while
services sector was slowed down due to the weak private sector credit growth and agriculture sector
just grew moderately due to adverse weather conditions.
Table 1: Rwanda - Key Macroeconomic Indicators (% of GDP, unless otherwise indicated) 2011 2012 2013 (e) 2014 (p) 2015 (p)
Real GDP growth (%) 8.6 8.0 6.6 7.5 7.5
Headline inflation (%, period average) 5.7 6.3 4.2 6.3 5.8
Current account, incl. official transfers
gggggGDPGDP)GDPGDPGDP)GGDPGDP) -7.3 -11.4 -10.3 -10.9 -10.3
External debt (end period) 18.0 17.1 20.8 21.4 23.1 Gross international reserves (months of imports) 5.1 3.7 3.8 4.0 4.0 Fiscal balance, including grants (fiscal year)* -3.4 -1.2 -5.0 -4.9 -4.3
Fiscal balance, excluding grants (fiscal year) -14.2 -12.4 -12.9 -13.7 -12.1 Note: * On fiscal year basis 2010 represents year 2009/10.
Source: IMF Country Report 13/372; National Bank of Rwanda Monetary Policy and Financial Stability Statement February 2014.
2.2.2 Prudent macroeconomic management has contributed to the county’s resilience to
external shocks. The three-year IMF Policy Support Instrument (PSI) programme approved in 2010,
underpins the country’s macroeconomic management.
4 The vision has six pillars: (i) good governance and a capable state; (ii) human resource development and a knowledge-based economy;
(iii) a private sector–led economy; (iv) infrastructure development; (v) productive and market-oriented agriculture; and (vi) regional and
international economic integration. It also emphasises the need for progress on four cross-cutting issues: (i) gender equality; (ii) natural
resources; (iii) the environment; and (iv) Science, Technology, and Information and Communication Technology (ICT).

3
The PSI is designed to support the implementation of the EDPRS II while ensuring macroeconomic
stability. The final review under the PSI was successfully completed in December 2013 and a successor
3-year PSI was approved (appendix 2).
2.2.3 The monetary policy stance has remained focused on price stability and expansion in
private sector credit. The central bank’s key policy rate was reduced from 7.5% in June 2012 to 7.0%
in June 2013 on the back of receding inflationary pressures. Headline inflation decreased from 5.7%
year-over-year in January 2013 to 3.7% in December 2013 as a result of robust macroeconomic
management and reduction in food prices. Average headline inflation is projected to remain within the
medium term range of 5% on account of an expected increase in food production and stable oil prices
in 2014.
2.2.4 The government fiscal policy stance aims to prioritize public spending, reduce domestic
financing and increase public revenue in line with its Fiscal Consolidation Strategy (FCS).
Revisions to the public expenditure plan were made to accommodate this financing shortfall. However,
several of the suspended public investments in transport, energy, and agriculture were implemented
with the resumption in aid disbursements in March 2013. As a result, the share of capital spending in
GDP increased from 11.8% in 2011/12 to 13.4% in 2012/13 while GDP share of recurrent spending
decreased from 15% to 13.6% during the same period. The fiscal deficit, including grants, increased
from 1.2% of GDP in 2010/11 to 5.0% in 2012/13 but was less than the programmed 6.1% as a result
of good performance in domestic revenues. Public revenues (tax and non-tax) increased from 15.1% of
GDP in 2011/12 to 16% in 2012/13 with tax revenues increasing from 13.6% to 14.2% during this
period.
2.2.5 Strong export growth has contributed to a narrowing of the trade and current account
deficits, albeit marginally. Export earnings increased by 18.7% to USD 573 million in 2013 compared
to USD 482.7 in 2012 due to increased production of coffee and tea and favourable prices for minerals
in particular coltan and cassiterite. Imports increased by 2% to USD 2.2 billion during the same period
resulting in a trade deficit of 17.9% of GDP in 2013 compared to 19.4% in 2012. Improvements in (i)
trade balance, (ii) the resumption of budget support disbursements, and (iii) an increase in transfers to
private sector including remittances contributed to reduction in current account deficit. However, rising
imports5 and narrow export base remains key driver of external vulnerability.
2.2.6 The overall Balance of Payments (BoP) position improved from a deficit of USD 205.5
million (2.9% of GDP) in 2012 to a surplus of USD 223.4 million (1.2% of GDP) in 2013. Tourism
remains the leading foreign exchange earner for the country, with receipts increasing to USD 293.6
million in 2013 up from USD 281.8 million in 2012. Remittances have also increased from USD 175.3
million in 2012 to an estimated USD 184.9 million in 2013. The BoP surplus resulted in an increase in
the gross official reserves by 10.9% to USD 935.5 million at end-2013 compared to end-2012,
consequently increasing the import cover from 3.7 months of goods and services imports in 2012 to 3.8
months in 2013.
2.2.7 Rwanda’s risk of debt distress has been downgraded from moderate to low.6 Public debt as
a share of GDP increased from 25.5% in 2012 to an estimated 28.7% in 2013 in part due to the issuance
of the country’s first sovereign bond in April 2013. The 10-year USD 400 million Eurobond with a
yield of 6.875% was nine times oversubscribed.
5 Primarily of food, construction materials, industrial products and fuel. 6 Source: Joint World Bank/IMF Debt Sustainability Analysis (DSA), 2013.

4
The proceeds will be used to repay more expensive private sector debt and to finance the government’s
strategic investments including the 28MW Nyabarongo hydro power project and completion of the
Kigali Convention Centre. However, the robustness of Rwanda’s debt profile is contingent upon the
sustained implementation of the country’s prudent debt management strategy.
Social context
2.2.8 Rwanda has made remarkable progress in reducing poverty and inequality. Income
poverty decreased to 45% in 2010/11 from 57% in
2005/06 (Figure 1) and is projected to reduce to
30.2% by 2015. However, poverty remains high in
rural areas (49%) than in urban areas (22%). Up to
72% of employment is in agriculture; and 62% of
waged farm workers are in poverty compared to
22% of waged off-farm workers. Poverty reduction
has been driven by a combination of improved
agriculture income, off-farm job creation, reduction
in household sizes and public and private transfers.
Inequality decreased with the Gini coefficient
falling from 0.52 in 2005/06 to 0.49 in 2010/2011.
Rwanda is also on track to meet 5 MDGs (1, 2, 4, 6
and 8) and likely to meet the other 3 (3, 5 and 7) by
2015 (annex II).
2.2.9 Despite the significant progress, challenges remain particularly in maternal health,
nutrition, quality of education and access to clean water. Maternal mortality ratio remains high at
487 deaths per 100,000 live births. About 26% of the population lack access to improved drinking
water. Rwanda ranks 167 out of 187 countries on HDI.7 The government is committed to poverty
reduction with focus on access to land, skills, infrastructure and connectivity.
2.2.10 Vision 2020 and EDPRS II indicate the GOR’s strong commitment to promoting gender
equality and women economic empowerment. The 2010 Gender Policy reaffirms commitment to
women’s economic empowerment especially rural women. Women constitute about 52% of the
population. Affirmative actions include: (i) the Law on Matrimonial Regimes, Donations, Succession and
Liberalities (1999), which gives women the same rights of succession as men; (ii) the 2003 Constitution
that reserves at least 30% of posts in the public sector for women; (iii) the Organic Land Law (2005)
which ensures equal access to land for men and women; (iv) the Girls Education Policy (2008), which
ensures access and retention; and (v) the 2009 Labour Law. Rwanda has been lauded for the significant
women political representation in Parliament, which increased from 17% in 1994 to 63.8% in 2013.
Rwanda has also been implementing gender responsive budgeting since 2008 and operating Gender
Monitoring Office, further promoting gender equality.
2.2.11 About 81.5% women are in the agricultural sector,
compared to 59.6% of men (figure 2). Women accounted for
33.9% of the estimated 525,000 off-farm jobs created (2006-11).
This is partly explained by job creation in construction (17.2%
annual growth; compared to 2.9% for the whole economy) which
may entail high physical demands.
7 According to United Nations Human Development Index (2012),
58,9% 56,7%
44,9%
30,2%
40,0%35,8%
24,1%
17,0%
10%
20%
30%
40%
50%
60%
70%
2000/01 2005/06 2010/11 Target 2015
Poverty rate (%)
Extreme poverty (%)
Figure 1: Significant Gains in Poverty Reduction,
2001-2011 and Target 2015
Source: NISR (2013a)
71.1%59.6%
86.3% 81.5%
28.9%40.4%
13.7% 18.5%
0%
10%
20%
30%
40%
50%
60%
70%
80%
90%
100%
Male,
2005/06
Male,
2010/11
Female,
2005/06
Female,
2010/11
Off-Farm jobs
Farm jobs
Source: Author's computations based on NISR (2013b)
Figure 2: Women remain less-represented in off-farm jobs;
however, some improvements are evidenced
5
Governance and political developments
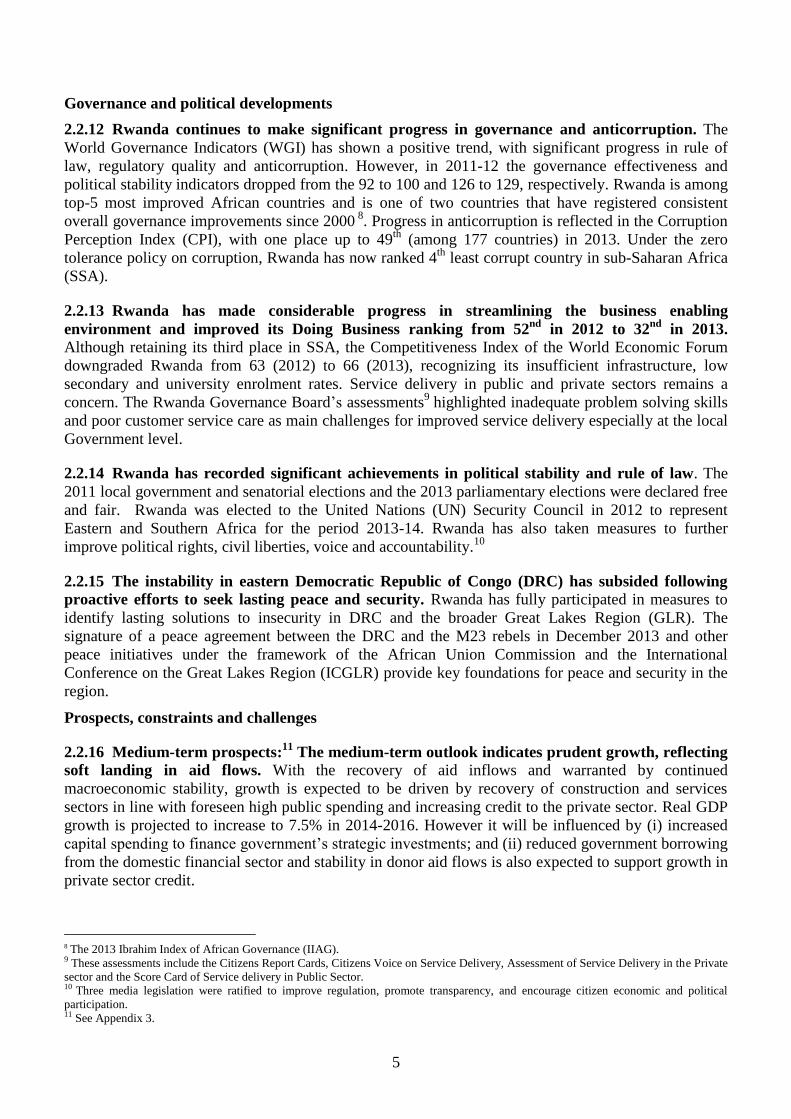
2.2.12 Rwanda continues to make significant progress in governance and anticorruption. The
World Governance Indicators (WGI) has shown a positive trend, with significant progress in rule of
law, regulatory quality and anticorruption. However, in 2011-12 the governance effectiveness and
political stability indicators dropped from the 92 to 100 and 126 to 129, respectively. Rwanda is among
top-5 most improved African countries and is one of two countries that have registered consistent
overall governance improvements since 2000 8
. Progress in anticorruption is reflected in the Corruption
Perception Index (CPI), with one place up to 49th
(among 177 countries) in 2013. Under the zero
tolerance policy on corruption, Rwanda has now ranked 4th
least corrupt country in sub-Saharan Africa
(SSA).
2.2.13 Rwanda has made considerable progress in streamlining the business enabling
environment and improved its Doing Business ranking from 52nd
in 2012 to 32nd
in 2013. Although retaining its third place in SSA, the Competitiveness Index of the World Economic Forum
downgraded Rwanda from 63 (2012) to 66 (2013), recognizing its insufficient infrastructure, low
secondary and university enrolment rates. Service delivery in public and private sectors remains a
concern. The Rwanda Governance Board’s assessments9 highlighted inadequate problem solving skills
and poor customer service care as main challenges for improved service delivery especially at the local
Government level.
2.2.14 Rwanda has recorded significant achievements in political stability and rule of law. The
2011 local government and senatorial elections and the 2013 parliamentary elections were declared free
and fair. Rwanda was elected to the United Nations (UN) Security Council in 2012 to represent
Eastern and Southern Africa for the period 2013-14. Rwanda has also taken measures to further
improve political rights, civil liberties, voice and accountability.10
2.2.15 The instability in eastern Democratic Republic of Congo (DRC) has subsided following
proactive efforts to seek lasting peace and security. Rwanda has fully participated in measures to
identify lasting solutions to insecurity in DRC and the broader Great Lakes Region (GLR). The
signature of a peace agreement between the DRC and the M23 rebels in December 2013 and other
peace initiatives under the framework of the African Union Commission and the International
Conference on the Great Lakes Region (ICGLR) provide key foundations for peace and security in the
region.
Prospects, constraints and challenges
2.2.16 Medium-term prospects:11
The medium-term outlook indicates prudent growth, reflecting
soft landing in aid flows. With the recovery of aid inflows and warranted by continued
macroeconomic stability, growth is expected to be driven by recovery of construction and services
sectors in line with foreseen high public spending and increasing credit to the private sector. Real GDP
growth is projected to increase to 7.5% in 2014-2016. However it will be influenced by (i) increased
capital spending to finance government’s strategic investments; and (ii) reduced government borrowing
from the domestic financial sector and stability in donor aid flows is also expected to support growth in
private sector credit.
8 The 2013 Ibrahim Index of African Governance (IIAG). 9 These assessments include the Citizens Report Cards, Citizens Voice on Service Delivery, Assessment of Service Delivery in the Private
sector and the Score Card of Service delivery in Public Sector. 10 Three media legislation were ratified to improve regulation, promote transparency, and encourage citizen economic and political
participation. 11 See Appendix 3.
6
The high dependence on donor aid and a weak global economic recovery present the major downside
risks. It is estimated that fiscal deficit (excluding grants) will increase from 12.9% in 2012/13 to 14% in
2013/14 and reduce to 9% by 2015/16, fostered by continued fiscal consolidation through accelerated
domestic resource mobilization and expenditure prioritization. External debt to GDP is projected to
drop from 21% in 2013 to 19.5% by 2015/16, with increased recourse to concessional borrowing. With
an improved risk rating, Rwanda faces better fund raising prospects on international financial market.
Rwanda will need to keep the momentum for strong policies that preserve fiscal sustainability, enhance
growth through structural reforms and accelerate inclusive growth.
Constraints and challenges
2.2.17 The Vision 2020 aims to have 50% workforce in off-farm jobs by 2020, up from 28.4% in
2011. The GoR is committed to develop relevant skills, particularly for youth and women, to ensure
existing workforce and new entrants increase labor productivity and foster economic growth. As part of
measures to create 200,000 off-farm jobs per year for unemployed and improve labor productivity, the
GoR has been implementing about 25 job creation initiatives covering training, mentoring, equipping
and financing. However, these initiatives have not been properly coordinated to monitor impact
effectively.
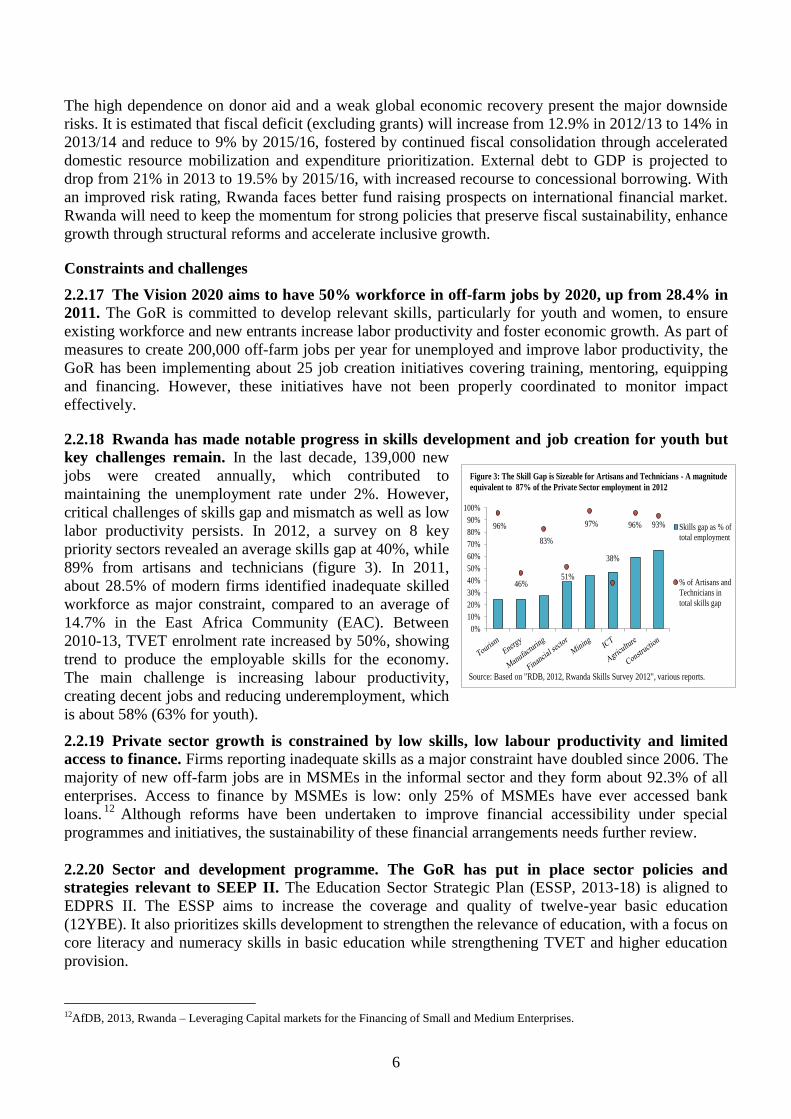
2.2.18 Rwanda has made notable progress in skills development and job creation for youth but
key challenges remain. In the last decade, 139,000 new
jobs were created annually, which contributed to
maintaining the unemployment rate under 2%. However,
critical challenges of skills gap and mismatch as well as low
labor productivity persists. In 2012, a survey on 8 key
priority sectors revealed an average skills gap at 40%, while
89% from artisans and technicians (figure 3). In 2011,
about 28.5% of modern firms identified inadequate skilled
workforce as major constraint, compared to an average of
14.7% in the East Africa Community (EAC). Between
2010-13, TVET enrolment rate increased by 50%, showing
trend to produce the employable skills for the economy.
The main challenge is increasing labour productivity,
creating decent jobs and reducing underemployment, which
is about 58% (63% for youth).
2.2.19 Private sector growth is constrained by low skills, low labour productivity and limited
access to finance. Firms reporting inadequate skills as a major constraint have doubled since 2006. The
majority of new off-farm jobs are in MSMEs in the informal sector and they form about 92.3% of all
enterprises. Access to finance by MSMEs is low: only 25% of MSMEs have ever accessed bank
loans.12
Although reforms have been undertaken to improve financial accessibility under special
programmes and initiatives, the sustainability of these financial arrangements needs further review.
2.2.20 Sector and development programme. The GoR has put in place sector policies and
strategies relevant to SEEP II. The Education Sector Strategic Plan (ESSP, 2013-18) is aligned to
EDPRS II. The ESSP aims to increase the coverage and quality of twelve-year basic education
(12YBE). It also prioritizes skills development to strengthen the relevance of education, with a focus on
core literacy and numeracy skills in basic education while strengthening TVET and higher education
provision.
12AfDB, 2013, Rwanda – Leveraging Capital markets for the Financing of Small and Medium Enterprises.
96%
46%
83%
51%
97%
38%
96% 93%
0%
10%
20%
30%
40%
50%
60%
70%
80%
90%
100%
Skills gap as % of
total employment
% of Artisans and
Technicians in
total skills gap
Source: Based on "RDB, 2012, Rwanda Skills Survey 2012", various reports.
Figure 3: The Skill Gap is Sizeable for Artisans and Technicians - A magnitude
equivalent to 87% of the Private Sector employment in 2012

7
Also, a Private Sector Development Strategy (PSDS, 2013-18) has been developed to “unleash” the
country’s nascent private sector to champion broad-based and inclusive growth. The PSDS will
enhance creation of an entrepreneurial, innovative and competitive private sector that is characterized
by adequate and well remunerated jobs. The Private Sector Development and Youth Employment
(PSDYE) Sector Working Group (SWG) provides the framework for coordination, monitoring and
reporting on employment promotion interventions. In order to ensure a holistic approach to skills
development and employment creation, a National Employment Programme (NEP, 2014-18) has been
developed. The NEP aims to guide the creation of 200,000 off-farm jobs annually; equip the workforce
with required skills for private sector development; and consolidate and coordinate all employment
interventions in both public and private sectors.
2.3 Bank Group portfolio status
2.3.1 The Bank’s portfolio comprised 23 operations as of January 2014 (see Annex III). There
are 19 sovereign loans and grants and 4 private sector operations amounting to a total commitment of
UA 334.74 million. The Bank’s portfolio shows that infrastructure (energy, transport and water)
accounts for 62.4% of the total commitments, followed by agriculture (14%), private sector (11%),
multi-sector (8.6%) and human development (4%). The Joint Rwanda CSP & CPPR Mid Term Review
(2014) demonstrated improvement in portfolio performance from overall rating of 2.43 (2012) to 2.53
(2013). There have also been remarkable improvements in the disbursement rate, from 32% (2012) to
45.9% (2013). There were no problematic or potentially problematic projects. The active sovereign
portfolio has an average age of 3.5 years with no ageing projects.
III. RATIONALE, KEY DESIGN ELEMENTS AND SUSTAINABILITY
3.1 Link with the CSP, country readiness assessment and analytical work underpinnings
3.1.1 Link with CSP: The SEEP II is anchored in the Bank’s CSP for Rwanda, specifically pillar
2. The overarching objective of the CSP is to promote economic competitiveness for inclusive growth
and poverty reduction through two strategic and complementary pillars: (i) Infrastructure Development
and (ii) Enterprise and Institutional Development. The SEEP II aligns with the second pillar which
emphasizes skills and innovative entrepreneurship development. As mentioned in Section 2.1 (para
2.1.2), SEEP-II is aligned with the EDPRS II thematic area of productivity and youth employment
which emphasizes the development of relevant skills and productive employment. It also aligns with (i)
the Bank Strategy for 2013-2022, (ii) upcoming Human Capital Strategy, (iii) Gender Strategy and (iv)
Private Sector Development Strategy (see paragraph 1.3). 3.1.2 Country readiness assessment—full compliance with Bank Group safeguards policy. Rwanda fulfils all prerequisite conditions for a Programme Based Operation (PBO) as outlined in table
2.13
Rwanda enjoys overall political and economic stability. The GoR’s commitment to poverty
reduction is strong, with a well-designed EDPRS II being implemented within a viable macroeconomic
and financial framework. There is a strong partnership and policy dialogue between the GoR and DPs,
and an effective aid coordination mechanism is in place. The seventh review under the PSI was
successfully completed in December 2013 and confirmed that the macroeconomic framework is stable.
13 Bank Group Policy on Programme Based Operations (PBO)—ADB/BD/WP/2011/68/Rev.3/Approval—ADF/BD/WP/2011/38/Rev.3/Approval.

8
Table 2: Prerequisites for Sector Budget Support
3.1.3 Analytical work underpinnings.14
The design of SEEP II has been informed by key findings
from several diagnostic studies and reports carried out by the Bank, GoR and other DPs. These include
the CSP 2012-16; the SEEP I PCR; AfDB Gender and Youth Employment study, AfDB’s draft
analysis of Rwanda’s Education System; the AfDB studies on Rwanda energy and transport sector
review and action plan; the AfDB/GoR study on Leveraging Capital Markets for SME Financing in
Rwanda; the 2010 PEFA;15
the 2008 and 2012 FRA; the 2013 Doing Business report; the 2013 Rwanda
Business and Investment Climate Survey; The 2013 Finscope study; IMF country reports; EICV 3
reports; EDPRS II; the RDB 2012 Skills survey reports. Key recommendations include: (i) sustain
improvements in the expansion of the education system while paying attention to quality and the
relevance of training for the labour market; (ii) harness the capabilities of youth and women and create
employment opportunities, while addressing the issue of low labour productivity that the country faces;
and (iii) improve the coordination of various business and entrepreneurship programmes implemented
by various ministries and agencies, for a better impact on productive job creation for out-of-schools,
school leavers and the unemployed. These recommendations have informed the programme
components.
14 See comprehensive list in Technical Annex IV. 15 See Technical Annex V.
Prerequisites Comments on the current situation
Government
commitment to
poverty
reduction
The GoR’s commitment to poverty reduction is strong. This is reflected in Rwanda’s long
term strategy – the Vision 2020; the EDPRS medium-term framework, used for achieving the
country’s long-term development goals; and the budget priorities (paragraph 2.2.1). During
the EDPRS 1 implementation there has been a significant poverty reduction of 12 percentage
points between 2005/06 and 2010/11. EDPRS II has a strong strategic thrust on rural
development and productivity and youth employment.
Macro-
economic
stability
Macro stability is ensured and the medium-term macroeconomic financial framework is
viable. Economic management has improved significantly and is continually being
strengthened, allowing for implementation of adequate macroeconomic policy.
Macroeconomic management is anchored in the three-year IMF PSI-supported programme
which was approved on 2 December 2013.
Satisfactory
fiduciary risk
assessment
Several fiduciary risk assessments done in the last eight years point to a relatively strong and
improving Public Financial Management (PFM) system. Overall, the fiduciary risk remains
moderate due to challenges in financial reporting and internal auditing in the PFM system.
Budget transparency is ensured with a budget classification in conformity with international
standards, and an adequate level of information in the budget and the budget execution
reports regularly published on MINECOFIN’s website.
Political
stability
The 2011 political stability indicator of the WGI for Rwanda scored –0.05 (–2.5 is the worst
and 2.5 the best), and Rwanda’s percentile ranking of 45.8 compared to a regional average of
34.2. This indicator has also evolved positively over the last decade. The 2012/13 Global
Competitiveness Report ranked Rwanda 6th
out of 144 countries in terms of public trust in
politicians. Presidential elections were organised in 2010 in a calm atmosphere and with a
high turnout. Local elections and indirect Senate elections were held in February and
September 2011 respectively, while Parliamentary elections were held in 2013. All elections
were peaceful and orderly.
Harmonization
There is strong partnership between the GoR and DPs, Various levels of dialogue forums
exist including the Development Partners Coordination Group (DPCG) and SWGs. The
government developed a new division of labour (DoL) to enhance coordination. SEEP will
benefit from various aid coordination mechanisms, including the SWG meetings.
9
3.2 Collaboration and coordination with other donors
3.2.1 The aid architecture was revised in 2013 to ensure alignment to EDPRS II priorities. The
revised Aid Architecture reinforces the DPCG as the core forum for dialogue on aid coordination,
harmonization and alignment but also in monitoring the implementation of EDPRS II. A major change
to the Aid Architecture is the shift from general budget support to sector budget support. In spite of the
changes, the revised Aid Architecture provides adequate scope for dialogue between the government
and DPs. Another key change is the revision of the 2010 DP DoL to ensure alignment with the EDPRS
II priorities. Similar to the 2010 DoL, the new DoL (2013) (see Annex VI) limits DP participation to
three core sectors based on a particular DP’s track record in a sector, mandate, and expertise. The
AfDB has retained two of its core sectors under the new DoL (energy and transport) and “private sector
development and youth employment” is new. The Bank co-chairs the transport and PSDYE-SWG.
3.2.2 The Bank is among the leading development partners in Rwanda. Official Development
Assistance (ODA) increased to US$ 1.17 billion in 2011/1216
from US$ 938 million in 2010/11, and
was provided by 16 DPs. The share of ODA provided through budget support increased from 29% to
33% during this period, indicating a corresponding increase in the use of country systems. The share of
total ODA provided by multilateral donors increased from 44% to 52% during this period.17
The seven
major development partners, including AfDB, accounted for 85% of total ODA in 2011/12.
3.2.3 Key stakeholders consulted. The SEEP-II was jointly designed with the GoR in close
consultations with major DPs, including the World Bank, EC, France, Germany, Netherlands, Sweden,
DFID and the United States; and other stakeholders, including the private sector and civil society. The
consultations confirmed that the SEEP-II is critical and in line with the country’s objective of creating
productive employment. Several DPs programmes (World Bank, GIZ, KfW, DfID, USAID, AFD,
Netherland and Sweden) indicated focus on/or skills development, job creation, enterprise development
and access to finance.
3.3 Outcomes of past and on-going similar operations and lessons
3.3.1 The Previous PRSSPs I–IV achieved significant results and key lessons learned were
integrated into the design of the SEEP. The four Poverty Reduction Strategy Support Programme
(PRSSPs) funded by the Bank contributed to strengthening PFM; improving the business environment,
including the financial sector; and enhancing institutional capacity. They also informed the design of
SEEP I which laid foundation for reforms in skills and enterprise development, improving private
sector participation in skills development and enhancing productivity of SMEs. Key achievements of
SEEP I include: (i) increased private engagement in skills development, (ii) increased access to
business advisory services and (iii) increased TVET enrolment. Although considerable progress has
been made, reforms need to be pursued. Lessons learned from SEEP I have informed the design of the
SEEP II. These include consideration on programme duration in relation to measuring impact,
enhanced role of private sector in skills development and improving gender monitoring in the
programme (lessons learned - Technical Annex I).
16 The 2012/13 ODA report has not yet been finalized. 17 These ODA figures only include development cooperation and exclude humanitarian assistance provided by UN agencies such as
UNHCR, and WFP. Only 16 development partners that participated in the Donor Performance Assessment Framework assessment in
2010/11 and 2011/12 are covered and these include (listed here from largest to least contributor to ODA): World Bank, US, Global Fund,
UK, African Development Bank, European Commission, One-UN (9 UN agencies), Belgium, Netherlands, Germany, Japan, Sweden,
Canada, South Korea, Luxemburg, and Switzerland.

10
3.4 Relationship with on-going Bank operations
3.4.1 SEEP II integrates and compliments other on-going Bank operations. These include the
line of credit to Bank of Kigali and the Rwanda Development Bank for lending to private sector in the
tourism, manufacturing, telecommunications, microfinance and agribusiness sectors. The other
projects include the Competitiveness and Enterprise Development Project II (CEDP-II), and the Fund
for African Private Sector Assistance (FAPA) to the Energy Sector. The programmes are strengthening
public and private sectors’ technical capacity in financial sector, enterprise development, policy design
and implementation. Given its policy focus, SEEP II is complementary to the Support to Skills
Development, Science and Technology Project (SDSTP), the Regional ICT Center of Excellence
Project, the Bank’s operations in financial and energy sectors,18
as well as the infrastructure projects
that are addressing key bottlenecks to growth. Finally, the Bank is providing capacity-building support
to Rwanda’s National Institute of Statistics (NISR) to strengthen the country’s monitoring and
evaluation capacity.
3.5 Bank’s value added and comparative advantages
3.5.1 The Bank’s value added: The Bank has considerable experience and expertise in PBOs in
Rwanda. It has also gained experience from designing and implementing similar programs focusing on
education and employability, fiscal consolidation, protection and promotion of basic services, and
social inclusion including that for Ethiopia, Senegal, Zambia, Tunisia, Morocco, Malawi and Cote
d’Ivoire. Through continuous policy dialogue, in particular through RWFO, the Bank informed GoR’s
reform program and the need to deepen reforms targeting improved skills, employability and
entrepreneurship development. Through SEEP II, the Bank will engage in policy dialogue and
contribute to the implementation of the Paris Declaration, the Accra Agenda for Action and the Bussan
Partnership by increasing the level of aid on budget, using of national systems, avoiding parallel PIUs,
and enhancing aid predictability.
3.5.2 The Bank’s comparative advantages: The Bank’s main comparative advantage is through its
role in facilitating dialogue and analytical work under the Youth Employment Initiative for Africa. The
Bank makes important contribution through participation in DPCG. The 2010 OPEV evaluation on
Budget Support noted that the Bank benefitted from participating in aid coordination, particularly
budget support. The Bank through RWFO has continued to participate and contribute actively as co-
chair of the new PSDYE-SWG established in 2013 and policy dialogue both with GoR and DPs. This
has enabled the Bank to provide technical advice on GoR priorities, facilitate dialogue between GoR
and DPs, and support aid coordination mechanisms.
3.6 Application of good practice principles on conditionality
3.6.1 Good practice principles on conditionality have been applied (annex VII). SEEP II is fully
aligned to the EDPRS II (paragraph 1.2) and its prior actions are harmonised with government policy
action (appendix 4), focusing on critical action relevant and achievable within the programme’s
timeframe.
3.7 Application of Bank Group non-concessional borrowing policy
3.7.1 Rwanda is classified as an ADF country, eligible for only ADF financing. The country is also a
beneficiary of the Heavily Indebted Poor Country (HIPC)/Multilateral Debt Relief Initiative (MDRI).
18 Credit lines to Bank of Kigali and the Rwanda Development Bank and a loan to the KivuWatt energy project.
11
Consequently, and in line with its Medium Term Debt Strategy, the public sector has restricted its
funding request from Rwanda to only the ADF window in recent years. The design of the programme
has taken into account the Bank Group’s non-concessional borrowing policy adopted in 2008 and the
2010 amendments to the Bank Group Policy on Non-Concessional Debt Accumulation.
IV. THE PROPOSED PROGRAMME
4.1 Programme’s goal and purpose
4.1.1 The overarching goal of the programme is to support Rwanda’s efforts to promote
inclusive growth and poverty reduction. The purpose of the programme is to consolidate and sustain
achievements and momentum to reforms in (i) skills development and employability; and (ii)
entrepreneurship and business development. Specifically, the operation is designed as a Sector Budget
Support (SBS) to reinforce policy measures aimed at addressing employable skills gaps, education
relevance to the labour market and innovative entrepreneurship.
4.2 Programme’s components, operational policy objectives and expected results
4.2.1 To achieve the above-mentioned objectives, the programme prioritises three components.
These are: (i) Skills Development and Employability; (ii) Entrepreneurship and Business Development;
and (iii) Enhanced Coordination. The three components are complementary and will reinforce reforms
and initiatives in promoting productive and sustainable jobs.
Component 1: Skills development and employability
4.2.2 Context: Rwanda recognises that a skilled workforce is critical to the transformation of
the economy. The GoR’s agenda of moving from low productivity-based agriculture to a more
industrial and diversified economy requires developing a workforce with relevant skills. Rwanda is
implementing a 12 year basic education policy in order to build a pipeline of skilled labour to support
innovation, enhance economic growth and accelerate poverty reduction. The government has placed
emphasis on TVET and higher education. To ensure the relevance of training for jobs, the government
is implementing a multi-pronged strategy including (i) promotion of entrepreneurial culture in
secondary school; (ii) promotion of TVET by increasing its share within upper secondary education;
(iii) diversification of higher education with incentives for priority programmes; and (iv) promotion of
a demand driven approach with an increased private sector participation in education reforms and work
experience
4.2.3 Rationale: Despite notable progress in education reforms, Rwanda still faces challenges in
skills gap and education relevance for the labour market. The 2008 TVET Policy does not
articulate apprenticeship intervention. The 2013 business and investment climate survey showed that
graduates lack basic skills needed for jobs, due to lack of linkages between education system and
industry. For example, in manufacturing, tourism and ICT, school leavers lack practical experience.
The education sector faces the challenge to keep pace with changing needs and demands of the private
sector in order to provide meaningful employment to young graduates. The 2012 skills survey revealed
a skills gaps averaging 40% of the total labour force, especially in TVET. Majority of agricultural
workers have no education qualifications and adult illiteracy remains an issues. Up to 68.3% of labour
force have never attended school or have attended but have no qualification19
which is a major
contributor to youth under-employment and low labour productivity in the informal sector, hence
prioritization of TVET in EDPRS II.
19 NISR, 2013b, EICV3 Thematic Report: Economic Activity
12
Many off-farm jobs require employability enhancing skills or prior experience in order to be productive
and employable. Therefore local level initiatives to increase access to skills and training will help to
equip rural people to acquire relevant skills and better business management including access to
finance.
4.2.4 Measures Supported: The SEEP II focuses on the involvement of the private sector in
training. The programme will support: (i) the assessment of the on-going “professional internship
programme” with the aim to develop a strategy to promote private sector provision of training and
work experience; (ii) operationalization of Sector Skills Councils (SSCs) which were established in
SEEP I through “development and adoption of a legal framework, operational guidelines and actions
plans”; and (iii) “curriculum review with private sector participation”20
, thus continuation from SEEP I.
Furthermore, SEEP II will promote a holistic approach to skills development; activities supported to
include: (i) the “design of an apprenticeship programme targeting unskilled and semi-skilled people”.
Graduates will be certified and provided with toolkits for productive self-employment; (ii) the design of
a “National apprenticeship policy” as a framework for short-term skills delivery; (iii) “review of TVET
Policy and strategy”; and (iv) “revision of the law establishing WDA” in order to extend its mandate in
apprenticeship.
4.2.5 Expected Results: (i) increased private sector participation in building employable skills and
attitude for jobs; and (ii) increased availability of vocational skills. These specifically will: (i) increase
the TVET share of upper secondary enrolment from 38% (2011) to 50% (2016); (ii) improve
employers’ satisfaction with the TVET graduates from 71.6% (2010) to 77% (2016); and (iii) increase
employment rate of TVET graduates after 6 months of graduation from 30% (2013) to 40% (2016).
Component 2: Entrepreneurship and business development
4.2.6 Context: Creating off-farm jobs requires strong entrepreneurship and business development.
However, entrepreneurship culture is weak. Business entry has increased (0.78 new firms per 1,000
adults in 2011), but remains lower than regional comparators such as Kenya or Zambia (1.26). The
private sector remains small and nascent, dominated by micro and small enterprises (92.6% of firms),
with low returns to investment and high rates of failure.21
A large number of MSMEs is in commerce
and services sector (93.1%, in contrast to only 1.7% in Arts & Crafts and 1.3% in industry). Many
MSMEs are operated by young entrepreneurs with an average age of 34 and 80% with primary
education. Lack of access to finance is also a challenge. The ratio of private credit to GDP is 15.7%.
Women take up 40% of membership but account for only 27% of loan beneficiaries especially of
SACCOs.
4.2.7 Rationale: GoR has prioritized innovative entrepreneurship, access to finance and
business development to unlock the potential for sustainable job creation. Under SEEP I, business
development centers (BDCs) were rolled out at district level and one PROBA attached to each
Umurenge. These helped to reduce the gap of supply and demand for Business Development Services
(BDS). However, provision of BDS is still underdeveloped. MSMEs have basic production facilities
and underutilize technologies. The banking system is extremely collateral based, requesting for
collateral at 275% of average loan value. This is restrictive for youth and women who lack collateral.
Although the Business Development Fund’s (BDF) Credit Guarantee Fund (CGF) runs a special
program targeting youth and women, the scale of the Fund is very limited.
20
The TVET instructors are continuously trained on the revised curriculum before implementation 21 While 46% of large firms export, just 12% of small firms do so. Further, the value added per worker of larger firms is three times as
high as smaller firms, while employing double the capital stock.

13
Also, there is lack of harmonized guidelines and procedures assessing and addressing the youth and
women entrepreneurs’ needs. Despite the tax system for MSMEs being reformed and simplified at
central level, the local taxes/fees are not harmonized to remove any disincentives that prevent MSMEs
from growing or formalised.
4.2.8 Measures supported: SEEP II aims to strengthen GoR’s actions toward facilitating
entrepreneurship and innovation for private sector development. The programme will support (i)
development of Business development advisors (BDA) Certification Programme to professionalize and
improve the quality of advisory services; (ii) rolling out BDAs to increase the availability of BDS at
Umurenge level; (iii) equip, upgrade technology and operationalize the Integrated Craft Production
Centers (ICPCs) and Community Processing Centers (CPCs) in order to enhance productivity for
craftsmen, artisans and producers; (iv) assessment of the impact of local tax rate fixing and
administration of MSMEs; (v) assessment of women’s skills gap and mapping productive opportunities
at district level; and (vi) development of guidelines on provision of seed start-up capital for youth and
women.
4.2.9 Expected results: (i) Enhanced MSMEs competitiveness; and (ii) Improved access to financial
services for MSMEs. These will specifically: (i) enhance the share of independent off-farm
employment in total employment from 9.7% (2011) to 11.5% (2016); and (ii) increase number of
MSMEs created annually from 9,000 (2012) to 13,500 (2016).
Component 3: Enhanced coordination
4.2.10 Context: Coordination of employment promotion interventions of public and private
sectors has been fragmented. Review of SEEP I revealed lack of effective coordination which
resulted into duplication of activities and resources. For example apprenticeship, access to finance and
business advisory services programme for youth and women were implemented by a number of
institutions with less coordination. MINICOM, RDB, MIFOTRA, MIGEPROF have been
implementing at least a total of 6 programmes which provide training to youth and/or women in
apprenticeship/internship. Coordination at local district level is also limited. Existing business services
at district level including BDCs, Telecenters and Youth Employment for Global Opportunities (YEGO)
centers, are not coordinated. Furthermore, there is no coordinated approach of identifying beneficiaries
and reporting performance of employment promotion interventions is weak. Tracking results
especially on youth and women has been difficult. Also, the government has not established
mechanisms to measure survival rate of start-up business despite the significant investment made. The
GoR has however made progress in developing policy frameworks for skills development,
entrepreneurship and job creation.
4.2.11 Rationale: Although through SEEP I the government started to consolidate and
synchronize various employment promotion initiatives, more needs to be done. Employment
promotion is a cross-cutting issue within the national development agenda involving various actors and
stakeholders at the central and district levels. In addition the multi-dimensional nature of employment
requires improved policy and programme coordination and coherence among key ministries and
institutions like MIFOTRA, MINICOM, MYICT, MINEDUC, RDB, WDA, NCBS etc. While under
SEEP I the government integrated a number of initiatives through the Quasi-Equity Fund, design of the
Productivity and Youth Employment Strategy and the National Apprenticeship Programme, overall
coordination remained a challenge.

14
The institutional framework for the implementation and coordination of employment promotion
interventions must be linked to the decentralized structures at local level. Overall, this calls for a need
to consolidate, rationalise and ensure coherence of implementation, and design of a robust monitoring
and evaluation system to track and report on progress.
4.2.12 Measures supported: Improved policy and coordination mechanisms of job creation
interventions remain vital to achieving the GoR goal of creating 200,000 off farm jobs per year. Thus it requires a wide range of integrated and well-designed policies and programme interventions
cutting across both macro and sectoral dimensions. It will also require addressing both labour market
demand and supply in order to produce stable and productive employment on a sustainable basis.
Measures supported by SEEP II include: (i) setting up of NEP Working Technical Secretariat under
MIFOTRA to enhance coordination and reporting of employment promotion interventions; (ii)
establishing of Productivity and Youth Employment Thematic Steering Committee; (iii) establishing at
least 12 Business Development and Employment (BDE) Units at district level to act as a one-stop
center; (iv) developing a consolidated database of potential youth and women entrepreneurs; and (v)
developing a gender sensitive M&E system which will disaggregated beneficiaries by age and also
measure survival of start-up businesses.
Expected results: Improved policy and coordination mechanisms of job creation interventions.
4.3 Financing needs and arrangements
4.3.1 The GoR’s fiscal gap before grants for FY 2013/14 – 2015-16 amounts to RWF 2,086.1
billion. SEEP II resources (UA 49 million) will cover 2.4% of this gap (table 3). The FY 2013/14 –
2015/16 budget shows that in the area of skills and entrepreneurship development, financial gap is
projected to UA 70.8 million (table 4). As a SBS, SEEP II will contribute to narrowing the sector
budget gap by 69.2% for the same period.
Table 3: Budget Projection in Billion RWF
FY 2013/14 FY 2014/15 FY 2015/16
Total domestic revenue 869.4 979.9 1139.7
Total expenditure and net lending 1,593.2 1,643.9 1854.2
Change in arrears -9.2 -10.0 -11.2
Deficit before grants (cash basis) -723.7 -663.9 -725.9
Source: MINECOFIN
Table 4: Financial Gap of Skills and Entrepreneurship Development
FY 2013/14 FY 2014/15 FY 2015/16
1. Skills and Employability 27,521 40,550 43,526
Technical Vocational Education and Training 21,962 33,379 33,769
Capacity building to engage private sector in skills development 5,559 7,171 9,757
2. Entrepreneurship and Business Development 25,812 23,892 24,339
Promotion of Trade and Industry 6,149 5,046 4,121
Promotion of Business Support and Cooperatives 18,361 17,344 18,182
Promotion of Youth and Women Economic Empowerment 1,302 1,502 2,036
3. Coordination 510 471 529
Cooperation of Employment Promotion 510 471 529
Total budget (Million RWF) 53,843 64,913 68,394
Budget gap projected (Million RWF) 24,409 26,316 22,063
Budget gap projected (Million UA) 23.7 25.6 21.5
ADF contribution (Million UA) 17 17 15
ADF contribution as percentage of sector budget gap 71.6% 66.4% 69.9% Source: MINECOFIN

15
4.4 Programme’s beneficiaries
4.4.1 Young men and young women as well as adult women will be the direct beneficiaries of
the programme. The youth and women constitute 39% and 52% of the total population respectively.
The under-employment rate amongst youth and women is high (48.3% and 46.0% in 2011
respectively). Through increased investment in skills and entrepreneurship development, business
advisory services, will enhance economic opportunities for youth and women. The programme will also
enhance youth and women’s access to finance and toolkits. Rwandan partner institutions through
enhanced gender sensitive analysis and monitoring will also benefit from the program. The private
sector will also benefit through availability of quality and relevant skills. Given the expected positive
impact on job creation, MDGs and poverty reduction, the entire population will indirectly benefit from
the programme.
4.5 Programme’s impact on gender
4.5.1 Women will significantly benefit from SEEP II. Female economic activity rates are higher
than male counterparts. They constitute about 55% of all jobs although majority of the jobs are in
agriculture (see section 2.1.11). In addition, about 40% of all registered entrepreneurs are women.
SEEP II will enhance women’s economic empowerment through improved access to TVET, finance,
toolkits and business advisory services which will have positive impact on their enterprises leading to
greater economic autonomy. Upgrading and equipping ICPCs and CPCs, which are largely patronized
by women, will enhance women economic opportunities and productivity further. The majority of
women, especially in rural areas, live under the poverty line. About 26% of female-headed households
are extremely poor compared to 23% of male-headed households. Women’s limited access to nonfarm
employment remains a key driver of their high poverty level. Through SEEP II, the GoR will generate
knowledge on women’s skills gap and existing opportunities at district level. Thus informing GoR to
develop strategies to address women’ skills gaps and their ability to exploit existing economic
opportunities. The programme will support the development of a robust gender sensitive M&E system
which will monitor performance and impact on beneficiaries including women.
4.6 Environment and climate change
4.6.1 The SEEP has been classified as a Category III programme according to the procedures
for the environmental and social impact assessment. Given that SEEP is a Sector Budget Support
operation, the policy reforms it will support will not have any direct negative impact on the
environment. The GoR has integrated environmental targets into the EDPRS II and subsequently
adopted an Environment and Natural Resources Sector Strategic Plan (2013–18) to inform its approach
to the sustainable management of the environment and natural resources. Environmental assessment
tools have also been developed to ensure that infrastructure projects are climate-resilient.
V. IMPLEMENTATION, MONITORING AND EVALUATION
5.1 Implementation arrangements
5.1.1 Institution responsible: MINECOFIN will be responsible for overall implementation of SEEP
II in collaboration with relevant institutions including MINEDUC, MINICOM, MIFOTRA,
MIGEPROF, MYICT, RDB and NCBS. MINECOFIN has demonstrated capacity to effectively
monitor implementation of the Bank’s and other donors’ previous budget support operations.

16
5.1.2 Disbursement and funds flow. On fulfilment of the disbursement conditions, the proposed
loan of UA 49 million will be disbursed in three tranches of UA 17 million, UA 17 million and UA 15
million to fund the FY 2013/14, 2014/15 and 2015/16 budgets respectively. The funds will be disbursed
into a foreign currency account opened by GoR at the Banque Nationale du Rwanda (BNR) to receive
the SEEP II resources. The local currency equivalent of the funds deposited at BNR will be transferred
to the Consolidated Fund (Treasury Account) of the Government. The SEEP II resources will be
included in the GoR budget under the relevant beneficiary sectors. The expenditures funded by the
SEEP II will be audited (each sector independently) by the Office of the Auditor General (OAG) within
the framework of the country’s Public Financial Management system (PFM). The government will
make payments to various beneficiaries from the Treasury Single Account, which is part of the
Integrated Financial Management and Information System (IFMIS). MINECOFIN will be required to
send a letter to the Bank confirming that the amount deposited in the foreign currency account at BNR
has been credited to the Government’s Treasury Account. The 2007 IMF safeguards update assessment
noted that the BNR had strengthened its safeguards since 2003.
5.1.3 Status of Rwanda PFM. Overall, the fiduciary risk remains moderate. Several Fiduciary Risk
Assessments done in the last nine years, including PEFA assessments (2007, 2010) point to a relatively
strong and improving PFM system.. There are some challenges mainly on financial reporting and
internal auditing in the PFM system. The weaknesses identified in the 2010 PEFA assessments have
largely been addressed within the PFM Reform Strategy (PFMRS 2008–13). The second phase of the
PFMRS 2014-18 identified 4 key priorities and also addresses the cross cutting issues of Capacity
Building and Regional Integration. The 2014 PEFA is being planned. The 2013 CPIA Report shows
very positive strides in the Rwanda PFM environment.
5.1.4 Fiduciary control. Budget transparency is ensured with a budget classification in conformity
with international standards, and an adequate level of information in the budget and the budget
execution reports regularly published on the MINECOFIN’s website. Since SEEP II is a Sector Budget
Support, the assessment was extended to the beneficiary sectors. MINICOM, MINEDUC and
MIFOTRA have adequate PFM controls to support this programme. The main fiduciary control for the
sector budget support is the Rwanda budget law, which contains a detailed breakdown of GoR
expenditures for 2013/14, 2014/15 and 2015/16 including programmes to be funded by SEEP II.
Furthermore, during PSDYE bi-annual review, the Bank will closely follow up on budget execution to
ensure that funds for SEEP II have been used as intended.
5.1.5 Procurement arrangement. Overall risk rating of the Rwanda public procurement, based on
the assessment in Annex V, is “moderate”. Procurement for the SEEP II will be in accordance with the
Rwanda Public Procurement Law No. 12/2007 enacted in 2007 as revised by Law N°05/2013 of
13/02/2013. The provisions of the revised procurement law are aligned with international standards and
consistent with the Bank’s procurement rules and procedures and therefore deemed acceptable.
Meanwhile, the relevant standard bidding documents and subsequent regulations should also be revised
in line with the provisions of the Law N°05/2013 of 13/02/2013 modifying and completing the Law
n°12/2007 of 27/03/2007 on Public Procurement. With the entering into force of the revised
Procurement Law, Rwanda has a primary procurement legislation that embodies the procurement
principles of efficiency, accountability, value for money and transparency in the use of public
resources.
5.1.6 Audit arrangement. In line with the Bank Policy on PBOs and the Paris, Accra and Busan
declarations, implementation, monitoring, and evaluation of the Program will follow the country’s
systems, including audit arrangements.
17
Each Ministry/sector produces annual financial statements and the Auditor General audits each
ministry/sector separately and issues an audit opinion on each sector before the government wide
financial statements are consolidated and an overall audit report with an overall audit opinion is issued.
In this operation, MINECOFIN will submit to the Bank four audit reports. These are the MINEDUC,
MINICOM and MIFOTRA audit reports; and the Consolidated GoR audit report. The OAG issued
qualified audit opinions on MINEDUC, MINICOM, and the Consolidated Financial Statements for the
year ended 30 June, 2012. The Accountant General and sectors are working on improving this.
Improving the quality and timeliness of financial statements is included as an action plan in the
PFMRS. In this regard, there has been notable progress in that the Accountant General had submitted
the consolidated financial statements for the year ended 30 June, 2013 to the OAG by the deadline of
30 September, 2013. At the time of the appraisal, the OAG was finalizing the audit reports for FY
2013. The OAG will present the consolidated audit report for the year ended 30 June, 2013 to
parliament and parliament will pass a resolution adopting the report. The summary audit findings will
be uploaded on the MINECOFIN website. Hence the audit findings and the follow up actions will be
publicly available so that interested stakeholders have access to the audit reports.
5.2 Monitoring and evaluation arrangements
5.2.1 Institution responsible: MINECOFIN will be responsible for overall monitoring and
evaluation of SEEP II in close consultation with MIFOTRA and other SEEP II implementers.
5.2.2 Monitoring system: The programme will use the PSDYE sector working group for monitoring
NEP implementation which includes SEEP II activities. The Working Technical Secretariat of NEP
under MIFOTRA will be responsible for reporting results on NEP implementation to the PSDYE sector
working group. A gender sensitive M&E system will be established to track results. The supervision of
SEEP II will be done through the bi-annual reviews of the PSDYE SWG. RWFO will actively
participate and contribute to these reviews.
5.2.3 Evaluation system: To promote mutual accountability, a Partnership Agreement was signed by
the Government and the key budget support donors in October 2008. The PSDYE SWG will provide a
framework for the Bank to evaluate implementation progress of the SEEP II. Moreover, a joint Bank-
GoR PCR will be prepared at the end of the programme.
VI. LEGAL DOCUMENTATION AND AUTHORITY
6.1 Legal documentation
6.1.1 The financing instrument used for this operation will be an ADF loan of UA 49 million in the
form of Sector Budget Support to the Republic of Rwanda. The loan will be governed by a Loan
Agreement, to be signed between the Fund and the Republic of Rwanda.
6.2 Conditions associated with Bank’s intervention
6.2.1 Prior actions. Before the loan proposal is presented to the Board for approval, GoR shall
provide evidence to the Fund that the measures outlined in table 5 have been fulfilled. Four prior
actions have been selected to underscore GoR’s commitment to skills, employability and
entrepreneurship and business development reforms. The selection of these policy actions was
informed by their importance to achieve GoR’s economic transformation objective and were discussed
and agreed by with other DPs.

18
Table 5: SEEP II Prior Actions and Required Evidence Condition Required Evidence
National Employment Programme
validated by the NEP National Steering
Committee.
A letter from MINECOFIN to the Bank submitting a copy of the
validated NEP by the NEP National Steering Committee.
Coordination framework of business
development programs at district level
developed and approved by the Integrated
Development Program Steering
Committee.
A letter from MINECOFIN to the Bank transmitting a letter from
Minister of Local Government submitting a copy of the approved
Coordination Framework of Business at district level by Integrated
Development Programme Steering Committee.
Productivity and Youth Employment
(PYE) thematic steering committee
established and functional.
A letter from MINECOFIN to the Bank submitting (i) a list of
committee members of the PYE thematic steering committee (ii)
TORS for the steering committee and (iii) copy of minutes of the
Steering Committee latest meeting.
Assessment report on Professional
Internship Program completed and
validated by the Board of RDB.
A letter from MINECOFIN to the Bank transmitting a copy of the
validated assessment report on Professional Internship Programme.
Conditions precedent to entry into force of the Loan Agreement
6.2.2 Entry into force of the Loan Agreement. The entry into force of the Loan Agreement shall be
subject to fulfillment by the Borrower of the provisions of Section 12.01 of the General Conditions
Applicable to Loan Agreements of the Fund.
6.2.3 Conditions precedent to the disbursement of the first tranche in FY 2013/14. The
disbursement of the first tranche of the Loan will be subject to the beneficiary maintaining an
appropriate macroeconomic framework as evidenced by IMF reports or assessments, and fulfillment of
the following specific condition: Transmission to the Fund of the Bank details for a Treasury account
with the National Bank of Rwanda-Central Bank (BNR), for purposes of receiving the resources of the
Loan.
Conditions precedent to the disbursement of the second and third tranche in FY 2014/15 and FY
2015/16 respectively
6.2.4 The obligation on the Fund to release the second and third tranches of the loan is subject to
Borrower maintaining an appropriate macroeconomic framework as evidenced by IMF reports and
assessment; and fulfilment of the following conditions:
Table 6: Triggers for FY 2014/15 and 2015/16 Second Tranche (FY 2014/15) Third Tranche (FY 2015/16)
Condition Required Evidence Condition Required Evidence
A Working Technical
Secretariat for the NEP is
established and functional.
A letter from MINECOFIN to the Bank
confirming the establishment of the NEP
technical secretariat and submission of
letters of appointment for the 7 NEP
technical secretariat staff (1 NEP
Coordinator and 6 specialists).
National
Apprenticeship Policy
approved by Cabinet.
A letter from MINECOFIN
transmitting a copy of the
announcement by government on the
approved National Apprenticeship
Policy.
Ministerial Instruction
establishing and
operationalizing Sector
Skills Councils approved
by Cabinet.
A letter from the MINECOFIN to the
Bank transmitting a copy of approved
Ministerial Instruction establishing and
operationalizing Sector Skills Councils.
TVET Policy and
Strategy approved by
Cabinet.
A letter from MINECOFIN
transmitting a copy of announcement
by government on the approved
TVET policy and strategy.
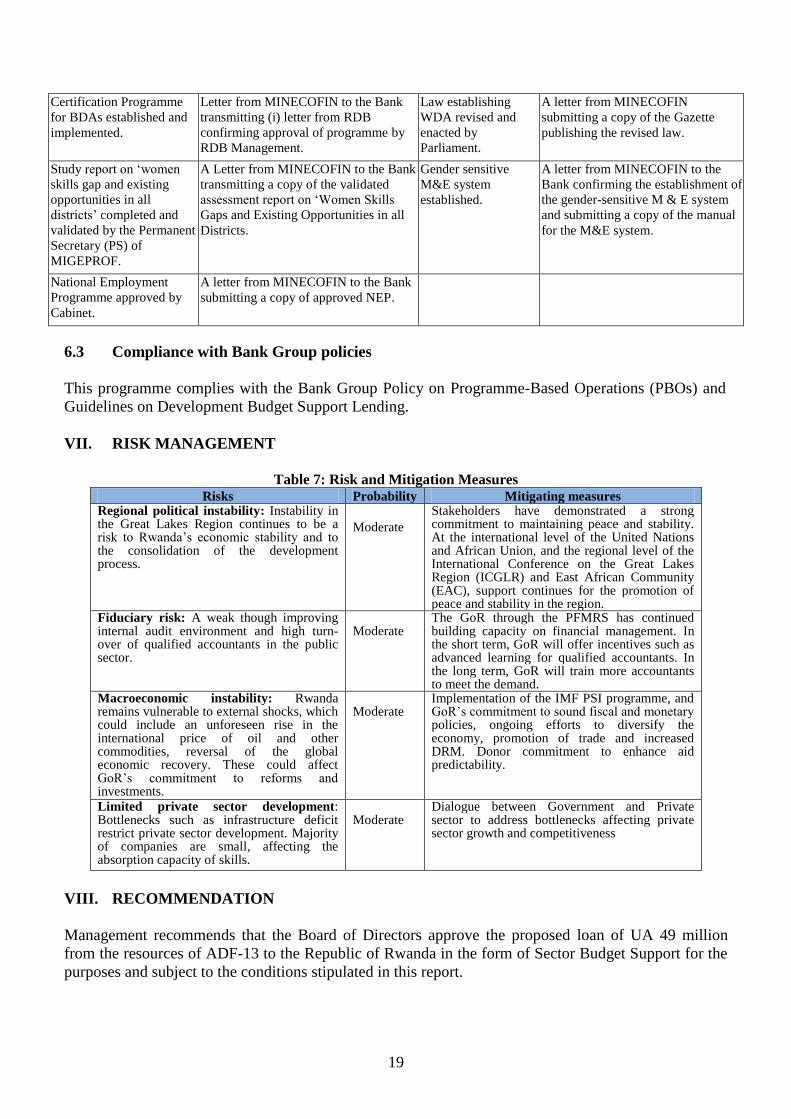
19
Certification Programme
for BDAs established and
implemented.
Letter from MINECOFIN to the Bank
transmitting (i) letter from RDB
confirming approval of programme by
RDB Management.
Law establishing
WDA revised and
enacted by
Parliament.
A letter from MINECOFIN
submitting a copy of the Gazette
publishing the revised law.
Study report on ‘women
skills gap and existing
opportunities in all
districts’ completed and
validated by the Permanent
Secretary (PS) of
MIGEPROF.
A Letter from MINECOFIN to the Bank
transmitting a copy of the validated
assessment report on ‘Women Skills
Gaps and Existing Opportunities in all
Districts.
Gender sensitive
M&E system
established.
A letter from MINECOFIN to the
Bank confirming the establishment of
the gender-sensitive M & E system
and submitting a copy of the manual
for the M&E system.
National Employment
Programme approved by
Cabinet.
A letter from MINECOFIN to the Bank
submitting a copy of approved NEP.
6.3 Compliance with Bank Group policies
This programme complies with the Bank Group Policy on Programme-Based Operations (PBOs) and
Guidelines on Development Budget Support Lending.
VII. RISK MANAGEMENT
Table 7: Risk and Mitigation Measures
Risks Probability Mitigating measures Regional political instability: Instability in the Great Lakes Region continues to be a risk to Rwanda’s economic stability and to the consolidation of the development process.
Moderate
Stakeholders have demonstrated a strong commitment to maintaining peace and stability. At the international level of the United Nations and African Union, and the regional level of the International Conference on the Great Lakes Region (ICGLR) and East African Community (EAC), support continues for the promotion of peace and stability in the region.
Fiduciary risk: A weak though improving internal audit environment and high turn-over of qualified accountants in the public sector.
Moderate
The GoR through the PFMRS has continued building capacity on financial management. In the short term, GoR will offer incentives such as advanced learning for qualified accountants. In the long term, GoR will train more accountants to meet the demand.
Macroeconomic instability: Rwanda remains vulnerable to external shocks, which could include an unforeseen rise in the international price of oil and other commodities, reversal of the global economic recovery. These could affect GoR’s commitment to reforms and investments.
Moderate
Implementation of the IMF PSI programme, and GoR’s commitment to sound fiscal and monetary policies, ongoing efforts to diversify the economy, promotion of trade and increased DRM. Donor commitment to enhance aid predictability.
Limited private sector development: Bottlenecks such as infrastructure deficit restrict private sector development. Majority of companies are small, affecting the absorption capacity of skills.
Moderate
Dialogue between Government and Private sector to address bottlenecks affecting private sector growth and competitiveness
VIII. RECOMMENDATION
Management recommends that the Board of Directors approve the proposed loan of UA 49 million
from the resources of ADF-13 to the Republic of Rwanda in the form of Sector Budget Support for the
purposes and subject to the conditions stipulated in this report.
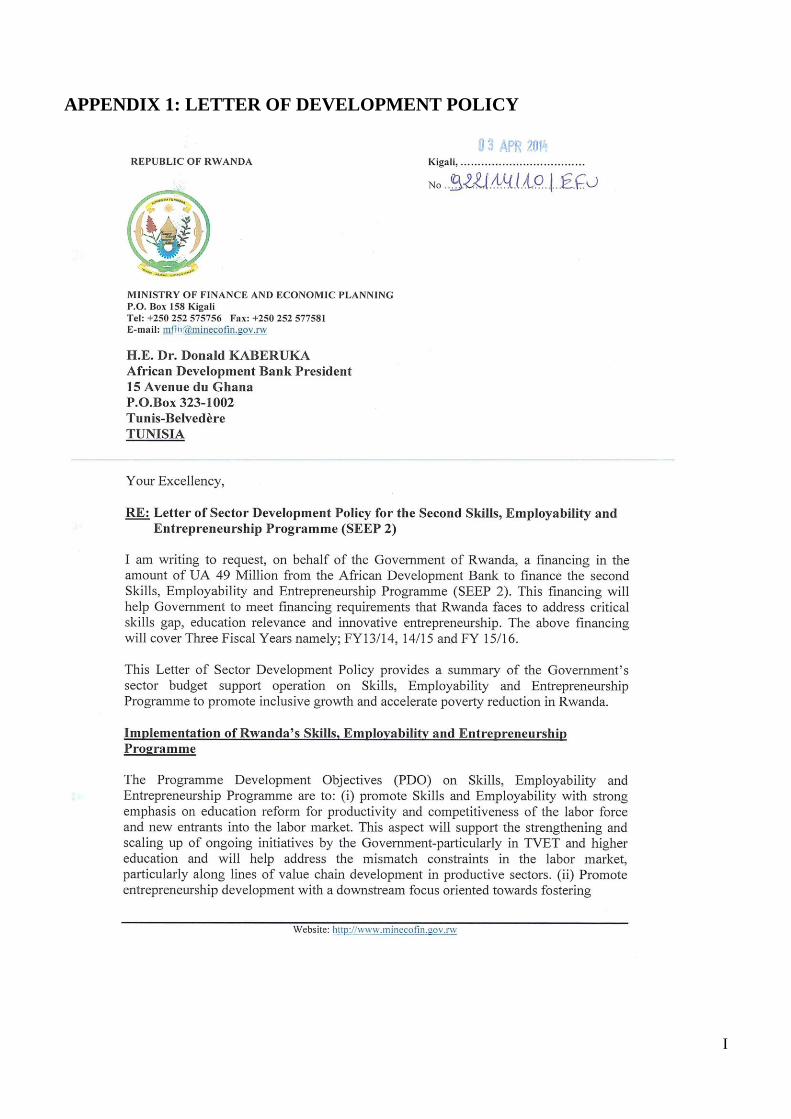
I
APPENDIX 1: LETTER OF DEVELOPMENT POLICY
II
III
IV

V
APPENDIX 2: PRESS COMMUNIQUE BY IMF
IMF Executive Board Completes Seventh and Final Review Under the Policy Support Instrument with
Rwanda Approves New Three-Year PSI
Press Release No. 13/483, December 2, 2013
The Executive Board of the International Monetary Fund (IMF) today completed the seventh and final review
under Rwanda’s Policy Support Instrument (PSI) and approved a new three-year PSI. In completing the review,
the Board approved the authorities’ request for a waiver for non-observance of the continuous assessment
criteria related to the ceiling on contracting non-concessional borrowing (NCB).
The Executive Board took note of Rwanda’s cancellation of the current PSI, which was scheduled to expire in
January 2014. The IMF's framework for PSIs is designed for low-income countries that may not need financial
assistance, but still seek IMF advice, monitoring, and endorsement of their policy frameworks. Members’
programs under PSIs are based on country-owned poverty reduction strategies adopted in a participatory process
involving civil society and development partners (see Public Information Notice No. 05/145). The authorities’
program aims to lay the foundations for strong and inclusive growth, with a strong emphasis on economic
transformation; rural development; productivity and youth employment; and accountable governance, supported
by macroeconomic stability and improved public financial management. Rwanda’s program will build on the
progress made under the previous PSI-supported program and is aligned with the objectives of the new
economic development and poverty reduction strategy.
The Executive Board approved a three-year PSI for Rwanda on June 16, 2010 (see Press Release No. 10/247).
On June 17, 2013, the Executive Board completed the sixth review and approved an extension of the PSI by
seven months to end-January 2014 (see Press Release No. 13/217). Following the Executive Board’s discussion
of Rwanda, Mr. Naoyuki Shinohara, Deputy Managing Director and Acting Chair, stated:
“The Rwandan authorities are to be commended for the strong implementation of their economic program under
the Policy Support Instrument. Prudent and inclusive policies, good governance, and support from development
partners have contributed to sustained economic growth and poverty reduction.
“Going forward, fiscal policy will need to focus on domestic revenue mobilization to finance the authorities’
ambitious development goals. Aligning spending with available resources and judicious selection and financing
of investment projects will minimize risks to the budget. It will also be important to strengthen debt
management capacity and follow a prudent approach to new borrowing to entrench long-term fiscal and debt
sustainability. The central bank will need to closely monitor rising inflationary pressures and adjust the policy
stance as needed while maintaining exchange rate flexibility. Efforts to increase financial inclusion and bolster
the regulatory and supervisory frameworks should also be accelerated.
“The authorities’ new poverty reduction strategy aims to sustain high and inclusive growth. The authorities
should maintain their commitment to prudent policies and pursue their broad reform agenda to tackle structural
impediments. In particular, further reducing the costs of doing business and addressing infrastructure
deficiencies would support economic diversification, foster private sector development, and broaden the export
base. The renewed focus on integration at the East African Community level should help in this regard. Finally,
continued emphasis on policies that will further assist poverty reduction efforts is welcome.”
Program Summary
The objectives of the new PSI program are centered around four key pillars:
Private sector development: Strong private sector development is an important pillar of the authorities’
economic transformation strategy. In this regard, the government intends to continue its investment program in
strategic infrastructure to reduce the cost of doing business while deepening its reforms to continue improving
the business environment.

VI
Exports promotion: The new export strategy is aimed at increasing export earnings through broadening of the
export base. The strategy focuses on a limited number of products with a view to diversify into non-traditional
exports that are particularly agro-based while taking advantage of traditional exports to extend production and
add value.
Domestic resource mobilization: In view of the important investment spending that is needed, one of the main
priorities will remain creation of fiscal space through accelerated domestic resource mobilization and
rationalization of spending.
Financial sector development: Financial sector development is the fourth pillar of the program. Financial
inclusion is seen as a means to further ensure connection of the population to the market while increasing
monetization of the economy. The financial reforms and the strengthening of capital markets are expected to
allow mobilization of cheaper resources and support private sector investment.
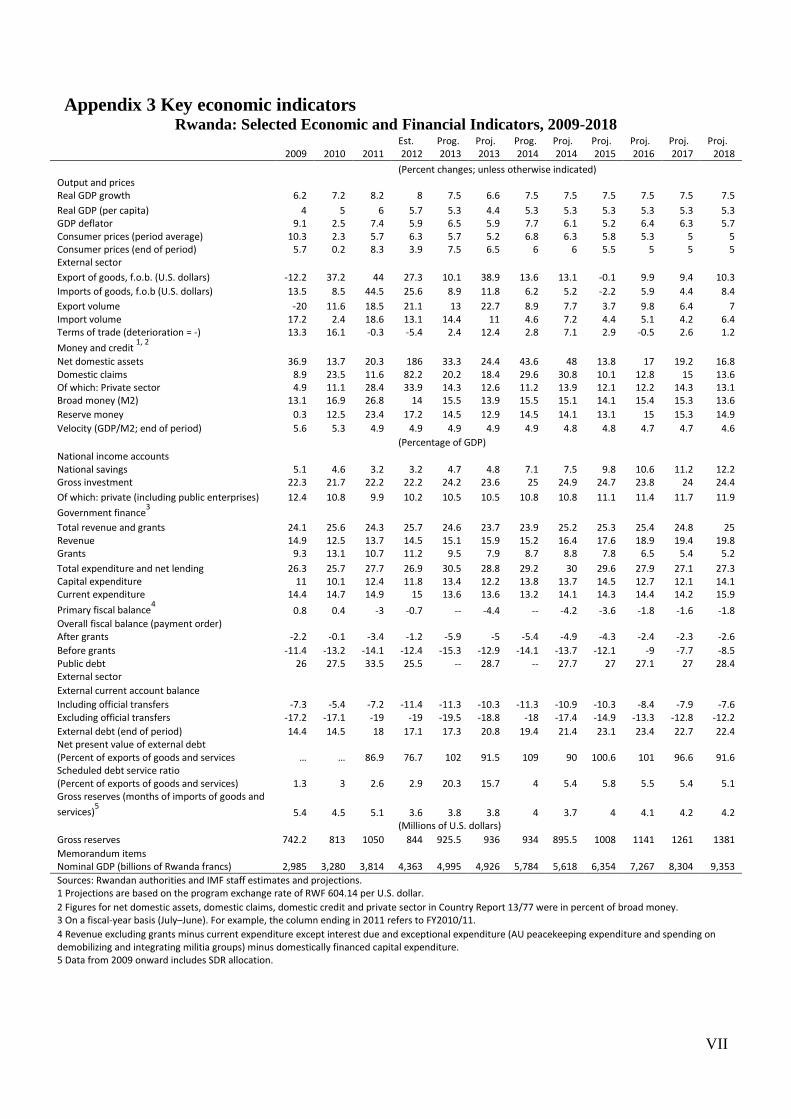
VII
Appendix 3 Key economic indicators Rwanda: Selected Economic and Financial Indicators, 2009-2018
Est. Prog. Proj. Prog. Proj. Proj. Proj. Proj. Proj.
2009 2010 2011 2012 2013 2013 2014 2014 2015 2016 2017 2018
(Percent changes; unless otherwise indicated)
Output and prices Real GDP growth 6.2 7.2 8.2 8 7.5 6.6 7.5 7.5 7.5 7.5 7.5 7.5
Real GDP (per capita) 4 5 6 5.7 5.3 4.4 5.3 5.3 5.3 5.3 5.3 5.3 GDP deflator 9.1 2.5 7.4 5.9 6.5 5.9 7.7 6.1 5.2 6.4 6.3 5.7 Consumer prices (period average) 10.3 2.3 5.7 6.3 5.7 5.2 6.8 6.3 5.8 5.3 5 5 Consumer prices (end of period) 5.7 0.2 8.3 3.9 7.5 6.5 6 6 5.5 5 5 5 External sector
Export of goods, f.o.b. (U.S. dollars) -12.2 37.2 44 27.3 10.1 38.9 13.6 13.1 -0.1 9.9 9.4 10.3
Imports of goods, f.o.b (U.S. dollars) 13.5 8.5 44.5 25.6 8.9 11.8 6.2 5.2 -2.2 5.9 4.4 8.4
Export volume -20 11.6 18.5 21.1 13 22.7 8.9 7.7 3.7 9.8 6.4 7 Import volume 17.2 2.4 18.6 13.1 14.4 11 4.6 7.2 4.4 5.1 4.2 6.4 Terms of trade (deterioration = -) 13.3 16.1 -0.3 -5.4 2.4 12.4 2.8 7.1 2.9 -0.5 2.6 1.2
Money and credit 1, 2
Net domestic assets 36.9 13.7 20.3 186 33.3 24.4 43.6 48 13.8 17 19.2 16.8 Domestic claims 8.9 23.5 11.6 82.2 20.2 18.4 29.6 30.8 10.1 12.8 15 13.6 Of which: Private sector 4.9 11.1 28.4 33.9 14.3 12.6 11.2 13.9 12.1 12.2 14.3 13.1 Broad money (M2) 13.1 16.9 26.8 14 15.5 13.9 15.5 15.1 14.1 15.4 15.3 13.6
Reserve money 0.3 12.5 23.4 17.2 14.5 12.9 14.5 14.1 13.1 15 15.3 14.9
Velocity (GDP/M2; end of period) 5.6 5.3 4.9 4.9 4.9 4.9 4.9 4.8 4.8 4.7 4.7 4.6
(Percentage of GDP)
National income accounts National savings 5.1 4.6 3.2 3.2 4.7 4.8 7.1 7.5 9.8 10.6 11.2 12.2
Gross investment 22.3 21.7 22.2 22.2 24.2 23.6 25 24.9 24.7 23.8 24 24.4
Of which: private (including public enterprises) 12.4 10.8 9.9 10.2 10.5 10.5 10.8 10.8 11.1 11.4 11.7 11.9
Government finance3
Total revenue and grants 24.1 25.6 24.3 25.7 24.6 23.7 23.9 25.2 25.3 25.4 24.8 25 Revenue 14.9 12.5 13.7 14.5 15.1 15.9 15.2 16.4 17.6 18.9 19.4 19.8 Grants 9.3 13.1 10.7 11.2 9.5 7.9 8.7 8.8 7.8 6.5 5.4 5.2
Total expenditure and net lending 26.3 25.7 27.7 26.9 30.5 28.8 29.2 30 29.6 27.9 27.1 27.3 Capital expenditure 11 10.1 12.4 11.8 13.4 12.2 13.8 13.7 14.5 12.7 12.1 14.1 Current expenditure 14.4 14.7 14.9 15 13.6 13.6 13.2 14.1 14.3 14.4 14.2 15.9
Primary fiscal balance4 0.8 0.4 -3 -0.7 -- -4.4 -- -4.2 -3.6 -1.8 -1.6 -1.8
Overall fiscal balance (payment order) After grants -2.2 -0.1 -3.4 -1.2 -5.9 -5 -5.4 -4.9 -4.3 -2.4 -2.3 -2.6
Before grants -11.4 -13.2 -14.1 -12.4 -15.3 -12.9 -14.1 -13.7 -12.1 -9 -7.7 -8.5 Public debt 26 27.5 33.5 25.5 -- 28.7 -- 27.7 27 27.1 27 28.4 External sector
External current account balance Including official transfers -7.3 -5.4 -7.2 -11.4 -11.3 -10.3 -11.3 -10.9 -10.3 -8.4 -7.9 -7.6
Excluding official transfers -17.2 -17.1 -19 -19 -19.5 -18.8 -18 -17.4 -14.9 -13.3 -12.8 -12.2
External debt (end of period) 14.4 14.5 18 17.1 17.3 20.8 19.4 21.4 23.1 23.4 22.7 22.4 Net present value of external debt
(Percent of exports of goods and services … … 86.9 76.7 102 91.5 109 90 100.6 101 96.6 91.6 Scheduled debt service ratio
(Percent of exports of goods and services) 1.3 3 2.6 2.9 20.3 15.7 4 5.4 5.8 5.5 5.4 5.1 Gross reserves (months of imports of goods and
services)5 5.4 4.5 5.1 3.6 3.8 3.8 4 3.7 4 4.1 4.2 4.2
(Millions of U.S. dollars)
Gross reserves 742.2 813 1050 844 925.5 936 934 895.5 1008 1141 1261 1381
Memorandum items Nominal GDP (billions of Rwanda francs) 2,985 3,280 3,814 4,363 4,995 4,926 5,784 5,618 6,354 7,267 8,304 9,353
Sources: Rwandan authorities and IMF staff estimates and projections. 1 Projections are based on the program exchange rate of RWF 604.14 per U.S. dollar.
2 Figures for net domestic assets, domestic claims, domestic credit and private sector in Country Report 13/77 were in percent of broad money. 3 On a fiscal-year basis (July–June). For example, the column ending in 2011 refers to FY2010/11.
4 Revenue excluding grants minus current expenditure except interest due and exceptional expenditure (AU peacekeeping expenditure and spending on demobilizing and integrating militia groups) minus domestically financed capital expenditure. 5 Data from 2009 onward includes SDR allocation.

VIII
Appendix 4 Operational Policy Matrix
Medium term objectives
Policy actions Institution responsible
Output indicators
Annual output targets
2013/14 2014/15 2015/16 2013/2014 2014/15 2015/16
EDPRS: Productivity and Youth Employment
Component 1:Skills and Employability
1. Increased private sector
participation in building
employable skills and
attitude for jobs.
Increase the number of SSCs.
Develop and adopt a legal framework, procedure guidelines, and action plans for SSCs.
Establish more SSCs and operationalize them.
NCBS, RDB No. of operational SSCs
9 SSCs established (0 operational)
Legal framework, procedure guideline and action plans approved and adopted
12 SSCs operationalized
Rollout review of curricula with private sector participation
Scale up roll-outing review of curricula with private sector participation
Scale up roll-outing review of curricula with private sector participation
WDA, MINEDUC
No. of TVET curricula designed in collaboration with private sector
39 59 79
Develop strategy for promotion of private sector provision of professional internship and industrial attachment.
Develop strategy for promotion of private sector provision of professional internship and industrial attachment.
Implementation of the strategy.
NCBS, RDB, WDA
Strategy developed; No. of private sector enterprises hosting TVET trainees (companies and cooperatives)
Assessment on Internship Program conducted; 5,636 private sector enterprises hosting TVET trainees
Strategy developed. 6,818 private sector enterprises hosting TVET trainees
Strategy approved and implemented. 8,000 private sector enterprises hosting TVET trainees
2. Increased availability of
vocational skills
Review the Law of Establishing WDA
Revise the Law of Establishing WDA
The revised Law of Establishing WDA enacted by parliament
WDA, MINEDUC, MINIJUST
Revised Law of Establishing WDA
Review of the Law of Establishing WDA conducted
Draft revised Law of Establishing WDA
The revised Law of Establishing WDA enacted
Develop TVET Policy and Strategy
Develop TVET Policy and Strategy
Implement TVET Policy and Strategy
WDA, MINEDUC
TVET Policy and Strategy developed and implemented; No. of TVET graduates (including TSS, VTC, IPRC, % female)
Draft TVET Policy and Strategy; 26,826 TVET graduates (44.5% female)
TVET Policy and Strategy approved; 35,000 TVET graduates (47% female)
TVET Policy and Strategy implemented; 45,000
TVET graduates (50% female)
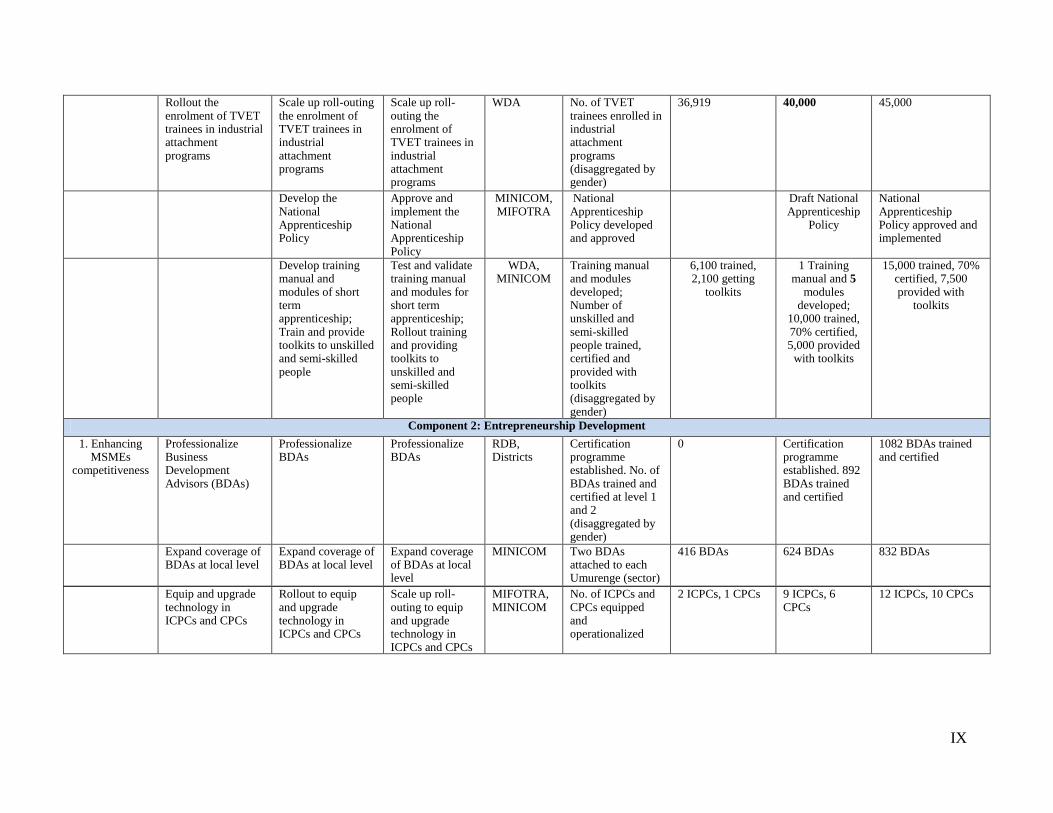
IX
Rollout the enrolment of TVET trainees in industrial attachment programs
Scale up roll-outing the enrolment of TVET trainees in industrial attachment programs
Scale up roll-outing the enrolment of TVET trainees in industrial attachment programs
WDA No. of TVET trainees enrolled in industrial attachment programs (disaggregated by gender)
36,919 40,000 45,000
Develop the National Apprenticeship Policy
Approve and implement the National Apprenticeship Policy
MINICOM, MIFOTRA
National Apprenticeship Policy developed and approved
Draft National Apprenticeship
Policy
National Apprenticeship Policy approved and implemented
Develop training manual and modules of short term apprenticeship; Train and provide toolkits to unskilled and semi-skilled people
Test and validate training manual and modules for short term apprenticeship; Rollout training and providing toolkits to unskilled and semi-skilled people
WDA, MINICOM
Training manual and modules developed; Number of unskilled and semi-skilled people trained, certified and provided with toolkits (disaggregated by gender)
6,100 trained, 2,100 getting
toolkits
1 Training manual and 5
modules developed;
10,000 trained, 70% certified, 5,000 provided
with toolkits
15,000 trained, 70% certified, 7,500 provided with
toolkits
Component 2: Entrepreneurship Development
1. Enhancing MSMEs
competitiveness
Professionalize Business Development Advisors (BDAs)
Professionalize BDAs
Professionalize BDAs
RDB, Districts
Certification programme established. No. of BDAs trained and certified at level 1 and 2 (disaggregated by gender)
0 Certification programme established. 892 BDAs trained and certified
1082 BDAs trained and certified
Expand coverage of BDAs at local level
Expand coverage of BDAs at local level
Expand coverage of BDAs at local level
MINICOM Two BDAs attached to each Umurenge (sector)
416 BDAs 624 BDAs 832 BDAs
Equip and upgrade technology in ICPCs and CPCs
Rollout to equip and upgrade technology in ICPCs and CPCs
Scale up roll-outing to equip and upgrade technology in ICPCs and CPCs
MIFOTRA, MINICOM
No. of ICPCs and CPCs equipped and operationalized
2 ICPCs, 1 CPCs 9 ICPCs, 6 CPCs
12 ICPCs, 10 CPCs
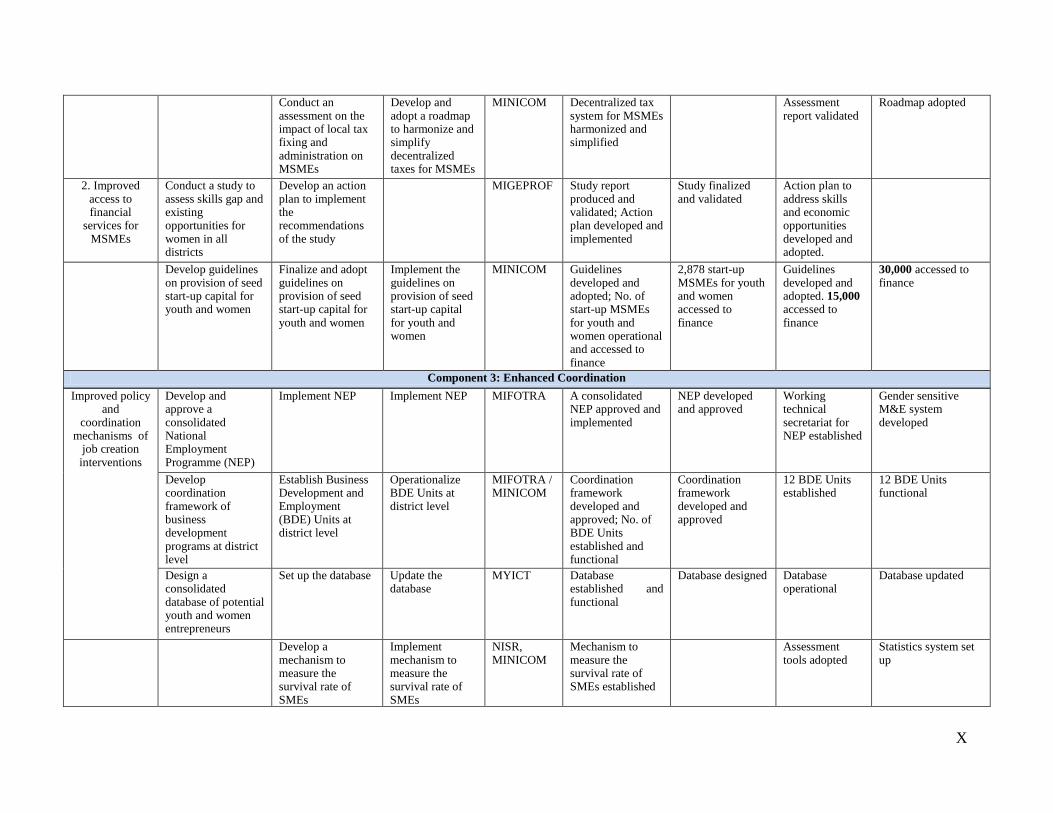
X
Conduct an assessment on the impact of local tax fixing and administration on MSMEs
Develop and adopt a roadmap to harmonize and simplify decentralized taxes for MSMEs
MINICOM Decentralized tax system for MSMEs harmonized and simplified
Assessment report validated
Roadmap adopted
2. Improved access to financial
services for MSMEs
Conduct a study to assess skills gap and existing opportunities for women in all districts
Develop an action plan to implement the recommendations of the study
MIGEPROF Study report produced and validated; Action plan developed and implemented
Study finalized and validated
Action plan to address skills and economic opportunities developed and adopted.
Develop guidelines on provision of seed start-up capital for youth and women
Finalize and adopt guidelines on provision of seed start-up capital for youth and women
Implement the guidelines on provision of seed start-up capital for youth and women
MINICOM Guidelines developed and adopted; No. of start-up MSMEs for youth and women operational and accessed to finance
2,878 start-up MSMEs for youth and women accessed to finance
Guidelines developed and adopted. 15,000 accessed to finance
30,000 accessed to finance
Component 3: Enhanced Coordination
Improved policy and
coordination mechanisms of
job creation interventions
Develop and approve a consolidated National Employment Programme (NEP)
Implement NEP Implement NEP MIFOTRA A consolidated NEP approved and implemented
NEP developed and approved
Working technical secretariat for NEP established
Gender sensitive M&E system developed
Develop coordination framework of business development programs at district level
Establish Business Development and Employment (BDE) Units at district level
Operationalize BDE Units at district level
MIFOTRA / MINICOM
Coordination framework developed and approved; No. of BDE Units established and functional
Coordination framework developed and approved
12 BDE Units established
12 BDE Units functional
Design a consolidated database of potential youth and women entrepreneurs
Set up the database Update the database
MYICT Database established and functional
Database designed Database operational
Database updated
Develop a mechanism to measure the survival rate of SMEs
Implement mechanism to measure the survival rate of SMEs
NISR, MINICOM
Mechanism to measure the survival rate of SMEs established
Assessment tools adopted
Statistics system set up