Embed Size (px)
Citation preview
1
African Regional Integration:
Implications for Food Security
Michiel van Dijk
LEI – part of Wageningen UR
Paper prepared for EL&I
08-03-2011
Final draft
2
Contents 1 List of Abbreviations ............................................................................................................ 3
3 Introduction ....................................................................................................................... 4
4 Literature Review ................................................................................................................ 4
4.1 Food Security: Definition and Strategies ........................................................................ 5
4.2 Regional Integration, Trade and Food Security ................................................................ 5
4.2.1 Theory .................................................................................................................. 5
4.2.2 Empirical findings .................................................................................................... 6
5 Regional Agricultural Integration in Africa ............................................................................... 7
6 Agricultural Provisions in African Free Trade Agreements .......................................................... 10
6.1 Common Market For Eastern and Southern Africa (COMESA) ............................................ 11
6.2 East African Community (EAC) .................................................................................... 12
6.3 Economic Community of West African States (ECOWAS) .................................................. 12
6.4 Inter-Governmental Authority on Development (IGAD) ................................................... 12
6.5 The Southern African Development Community (SADC) .................................................. 13
7 Determinants of Intra-African Agricultural Trade ..................................................................... 13
7.1 Trade barriers ........................................................................................................... 14
7.2 Infrastructure ........................................................................................................... 14
8 Pan-African Initiatives to Promote Agriculture and Food Security ............................................... 15
8.1 African Union Common Market for Agricultural Products (CMAP) ....................................... 16
8.2 The Comprehensive African Agriculture Development Programme (CAADP) ........................ 16
9 Implications for Food Security .............................................................................................. 17
10 Conclusions and Further Research ........................................................................................ 18
11 References ........................................................................................................................ 19
Annex A: Strategic Commodities ................................................................................................ 20
Annex B: Tariff data for Target Countries .................................................................................... 21
3
1 List of Abbreviations AEC - African Economic Community
AU - African Union
CET - Common External Tariff
CAADP - Comprehensive African Agriculture Development Programme
CMAP - Common Market for Agricultural Products
COMESA - Common Market for Eastern and Southern Africa
EAC - East African Community
ECOWAS - Economic Community of West African States
IGAD - Inter-Governmental Authority on Development
MFN - Most Favoured Nation
REC - Regional Economic Community
RIA - Regional Integration Agreement
SADC - Southern African Development Community
4
3 Introduction According to the most recent estimate a total of 925 million people are undernourished in the world. This
number has declined by 9.6 between 2009 and 2010 as a consequence of a recovery in economic
growth. Nonetheless the number of hungry people remains higher than before the 2007/2008 food crisis
and higher than it was 40 years ago. In Sub-Saharan Africa 30 percent or 239 million people are
undernourished, the highest proportion of all developing regions (FAO 2010).
The recent food crisis is caused by the combination and interaction of many elements. Some even have
used the concept of a ‘perfect storm’ to explain the global food price spike. Factors said to have
contributed to the food crisis range from demand-side issues such as the increasing consumption of food
by India and China and the demand surge for biofuels to supply-side factors including a decline in
stocks, slowdown in agricultural productivity and weather shocks (Headey & Fan 2008). Recent research
points out that in particular export restrictions by food supplying countries have accelerated the increase
in food prices (Headey n.d. in press).
In this light, International institutions and national governments are increasingly paying attention to the
role (African) regional trade and integration can play in mitigating the effect the food crises and
fostering agricultural growth. An example that illustrates this is UNCTAD’s recent Multi-year Expert
Meeting on International Cooperation that was devoted to South–South and triangular cooperation for
sustainable agriculture development and food security in developing countries.1 Similarly, UNECA’s
annual Economic Report on Africa 2009 focused on Developing African Agriculture Through Regional
Value Chains (UNECA, 2009) and FAO published the report Towards an African Common Market for
Agricultural Products (FAO 2008).
This report looks at the African regional trade, regional integration agreements (RIAs) and the
implications for food security. It starts by giving a literature review on the conceptual links between
regional integration and food security, listing both theoretical and empirical findings – the latter with the
accent on agricultural trade in Arica. In the subsequent section a brief overview is presented on RIAs in
Africa and the extent of intra-regional trade in agriculture and food. The analysis focuses on eight target
countries: Ethiopia, Ghana, Kenya, Mozambique, Rwanda, Tanzania, Uganda and Sudan, and the RIAs
these countries have endorsed. The report continues with a summary of agricultural provisions in the
RIAs followed by an analysis of the factors hampering agricultural and food trade between African
countries. A distinction is made between trade barriers (mainly tariffs) and problems with infrastructure.
The next section describes two Pan-African programs to promote agricultural development and food
security. Finally, the report ends with a brief discussion about the implications of the findings for food
security, conclusions and recommendations for follow-up research.
4 Literature Review The links between regional trade and food security are complex and multiple. Overall, trade is regarded
as an important channel for the diffusion of technology, which, in turn, will stimulate long-term growth
and development (Grossman & Helpman 1995). Eventually, this will contribute to poverty reduction and
food security. Such a discussion, however, is out of the scope of this paper. Here the focus is explicitly
on the trade in agricultural and food commodities and its impact on food security. There are two
channels through which agricultural trade results in enhanced food security.
First, indirectly by promoting economic growth, which improves income and, hence, the access to food.
Empirical research has shown that agricultural growth contributes more to poverty reduction in
developing countries than manufacturing and services (Cervantes-Godoy & Dewbre 2010) The main
reason is that by far most of the poor (in particularly women) are active in agriculture either as farmers
or through off-farm employment. In addition, agricultural expansion leads to multiplied growth in the
rest of the economy because agriculture is the main source of raw materials for manufacturing and it is
an important source of demand for (light) capital goods and services (transport). A rise in the income of
farmers will also create an increase in demand for locally produced goods and services.
1 Multi-year Expert Meeting on International Cooperation: South–South Cooperation and Regional Integration, Second session Geneva, 14–16 December 2009, http://www.unctad.org/templates/Meeting.asp?intItemID=4714&m=17875&info=doc&lang=1 (12-01-11).
5
Second, agricultural trade has a direct effect on food security by augmenting domestic food supplies and
thereby increasing the availability of food. This will push food prices down and reduce food supply
variability. More details about these mechanisms is presented below.
4.1 Food Security: Definition and Strategies Food security is multi-faceted concept and there exist various definitions of food security in the
literature. Here we assume the definition as used by the FAO which captures both the entitlement to
food and the need for adequate nutrition: “Food security exists when all people, at all times, have
physical, social and economic access to sufficient, safe and nutritious food to meet their dietary needs
and food preferences for an active and healthy life.” (FAO 2003, p. 28).
Countries can choose between two forms of food security policy. One option is to pursue a strategy of
food self-sufficiency, which requires that all food needs are fulfilled by means of domestic production.
Another option is to adopt a strategy of self-reliance, which argues that availability of food is most
important either produced domestically or sourced by means of international trade. Most economists
would agree that self-sufficiency is not an efficient and viable food security policy as it fails to
acknowledge potential gains of trade that are created by international differences in production factor
endowments, technology and environmental factors such as infrastructure and climate. Furthermore, a
crucial element of food security is a person’s access to food, not the extent to which food commodities
are produced in a country or region. Hence, food security is predominantly a poverty issue, determined
by whether an individual has sufficient income to purchase food. In the light of this paper and the
question how (regional) trade can contribute to food security, it is assumed governments adopt a self-
reliance strategy to achieve food security.
Finally, it is important to take into account the diversity across developing countries and agricultural
commodities when thinking about the links between (regional) trade and food security. Developing
countries differ considerably in terms of their dependency on foreign markets for the supply of food.
According to Ng and Aksoy (2008), out of the 58 low-income countries 42 are net importers of food and
16 are net exporters in 2004. Countries belonging to the former group are more vulnerable to a rise in
global food prices and possible food crisis than the latter.
It is also appropriate to make the distinction between trade in agricultural and food products. Apart from
food, the first group also encompasses crude materials such as rubber, wood. Apart from the indirect
effects on economic growth, an expansion in the trade of these goods will not contribute to food
security.2 Studies that examine the impact of trade integration (see below) do not differentiate between
trade in agriculture and trade in food products.
4.2 Regional Integration, Trade and Food Security
4.2.1 Theory
The literature offers two types of economic benefits for the creation of regional trade blocks: the
allocation effect and the accumulation effect (Baldwin & Venables 1995; UNCTAD 2009). With respect to
the allocation effect, standard economic theory argues that under assumptions of perfect competition,
free trade will lead to an optimal (Pareto efficient) allocation of production factors – a situation where
those that gain from trade could fully compensate those that lose from trade and still be better off – and
international welfare is maximised. If free trade between two countries is distorted because of tariffs,
quantitative restrictions or non-tariff measures, resources are not allocated optimally and inefficiencies
arise. Accordingly, trade liberalisation in the context of regional integration will lead to the reallocation of
production factors (e.g. on- and off farm labour, tractors, seeds, and fertilizer), more trade in
agricultural commodities including food products, improvements in efficiency and lower food prices.
The allocation effect is accompanied by so-called scale and variety effects. The former suggests that
agricultural producers in a protected market will not be able to reach optimal size. They can either be
2 The WTO uses the following definitions for food and agriculture trade. Agricultural products are defined by the Standard International Trade Classification (SITC), revision 3 codes as follows: SITC 0 (food and live animals); SITC 1 (beverages and tobacco); SITC 2 (crude materials excluding food and fuel) and SITC 4 (animal/vegetable oil/fat/wax) minus divisions 27 (crude fertilizer/mineral) and 28 (metal ores/metal scrap) of which food as: SITC 0, 1, 4, and division 22 (Oil seeds and oleaginous fruits). For another classification see NG and Aksoy (2008).
6
too large, for example because of state support or abusive market power, or too small because of
limited market size. As a consequence of increased competition, inefficient farms will be forced out of
business. The variety effect states that trade expansion allows consumers to choose from a larger
variety of food products and farmers from more sophisticated agricultural machinery which increases
welfare and productivity, respectively.
The accumulation effect implies that economic integration and free trade will attract more agricultural
investment because farmers and related industries (e.g. supermarkets, producers of farm equipment
and food processing) are able to specialise by becoming part of regional value chains (see UNECA 2009).
The presence of more specialised actors might also create agglomeration and network effects that lead
to a reduction in production costs, foster technological spillovers and increases productivity. All of this
will increase the domestic supply of food and improve food security.
Apart from arrangements on the elimination of tariffs and the harmonisation of agricultural policies, in
theory RIAs might also include agreements to discipline export restraints – one of the main causes
responsible for the surge in global food prices. Such agreements will prevent the drying up of intra-
regional food trade in times of rising world food prices when regional suppliers are tempted to reduce
food exports to put downward pressure on domestic food prices. Whether such a policy will limited food
price inflation in the region depends, among others, on the balance between extra- and intra-regional
food trade.
Despite these positive effects, the net gains of RIAs are not straightforward. On the one hand, the
formation of a trade bloc will lead to trade creation. This refers to the replacement of relatively high-cost
domestic production with cheaper products that are produced in another country that participates in the
trade block. As a result prices in the high-cost country will drop and welfare will be increased. It is
similar to the allocation effect mentioned above. On the other hand, trade diversion might occur, when a
partner’s country production replaces lower-cost imports from a country outside the free trade area as a
result of the high level of protection that protects the countries inside the free trade area.3
Critics of free trade have also pointed out that trade liberalisation, in particular in the short run, is likely
to impose costs on countries. The closing down of inefficient farms that are unable to compete with
cheaper imports from other countries might lead to increasing unemployment, disappearance of local
knowledge (for example experience on traditional farming methods) and social disturbance. Another cost
to countries that reduce tariffs is the loss in fiscal income. Finally, the recent food crisis has shown that
being dependent on foreign markets for essential food supplies also entails risks in case of a surge in
world food prices.
From an exporting country perspective there might be issues as well. Supply side constraints might
prevent family farmers and low-income households, the potential beneficiaries of trade liberalisation,
from taking advantage of increased trade opportunities. Instead, it might be the large commercial
farmers, who are part of an international trading network, that fulfil the additional demand created by
regional integration. Only with additional support, such as research and development, extension
services, access to credit, trade facilitation and investment in rural infrastructure, small scale farmers
will be able to increase productivity and output to tap into other markets (World Bank 2007).
The overall effect of regional trade liberalisation in agriculture can thus be positive or negative. Some
will benefit from increasing opportunities to trade and a decrease in the price of food commodities, while
others lose out as a consequence of increasing competition. If those who lose out are concentrated
disproportionally among food-insecure households, the overall impact of regional trade integration on
food security will be negative. This net effect of regional integration can only be verified through
empirical research and on a case-by-case basis.
4.2.2 Empirical findings
There exists a vast literature on the impact and economic benefits of RIAs but there are only a few
studies that investigate the impact on regional agricultural trade in Africa. 4 Most of them use some form
3 For an overview of the impact of RIAs see Rutten (2010). 4 Gravity models are used to analyse the ex post effects of RIA adoption. Another research strategy is to apply a Computable General Equilibrium (CGE) model, which simulates the function of international markets through
7
of gravity model estimation. This model is similar to Newton’s equation of gravity and uses the income
(economic masses) of trade partners and the distance between them (as a proxy for transaction costs)
to explain bilateral trade flows. Typically, the estimation also includes indicators to control for the effect
of common language and culture on trade.
Grant and Lambert (2005) investigate the impact of eight worldwide RIAs on the trade in agricultural
commodities. They both look at total agriculture and nine individual commodities. Regrettably, no
distinction is made between the various RIAs in Africa and regard the continent as one trade block.
According to their estimates the trade creation and trade diversion effects for African agreements are
more or less equal and therefore the net gain is minimal.
The study by Seck et al. (2010) looks specifically at the impact of ECOWAS, an RIA between West
African countries (see below), on agricultural trade. They conclude from their estimates that ECOWAS
membership has resulted in more trade (e.g. trade creation) which has not been at the expense of trade
with other countries (e.g. trade diversion). This suggests that the net effect of ECOWAS is positive.
However, the study does not give information of the relative magnitude of the effects which makes it
difficult to judge whether the impact of the RIA is substantial or marginal.
Korinek and Melatos (2009) look at the impact of three RIAs (COMESA, AFTA and MERCOSUR) in
developing countries on agricultural trade. For the purpose of this paper, the results for COMESA a
regional trade bloc in Eastern and Southern Africa is of particular interest (also see below). The model
results indicate that bilateral trade of COMESA countries has increased after the implementation of the
RTA in 2000 but also some trade diversion away from imports outside the trade block has taken place.
However in comparison to AFTA and MERCOSUR, and despite the full duty free access that is granted to
member countries, trade creation within COMESA is relatively low. According to the authors, this is
caused by other economic and physical barriers such as lengthy customs procedures, lack of
infrastructure, low complementarity of natural endowments and small markets that characterise African
countries in COMESA. They also point out that the findings might not be robust as they contrast with
similar studies that analysed the impact of COMESA on total trade flows. A possible reason for this is
problems with data availability and quality for African countries.
Nin-Pratt et al. (2008) assess the potential welfare effects of SADC, a RIA between Southern African
countries, on agricultural trade. In contrary to the other studies they apply an ex ante partial equilibrium
analysis instead of gravity model estimation. Their main finding is that regional trade liberalisation in
SADC countries has a small but positive effect on welfare. The net effect between trade creation and
trade diversion is only 0.75 percent of total agricultural trade. The main reason for this outcome is the
already low level of tariffs on agricultural products between SADC countries and the fact that most RIA
members export a similar group of products.
5 Regional Agricultural Integration in Africa5 Regional integration has been on the agenda of African countries for a long time. Apart from the
economic rationale that integration is an important stimulus for trade, investment and economic
development, also political factors contributed to regional integration in Africa. These have its roots in
“the Pan-African movement of shared values, collective self-reliance in development and political
independence” (UNCTAD 2009 ,p. 8). In line with this, African countries signed the Abuja Treaty on June
3, in 1991, to establish a continent wide African Economic Community (AEU). The treaty provides for
the creation of an African Common Market in six stages over a 34-year period. The building blocks of
the AEU are eight Regional Economic Communities (RECs) which at the regional level will start up a
process of coordination and harmonization of tariff and non-tariff measures in order to create a
continental customs union, and eventually an economic and monetary union.6
a system of demand and supply equations that are solved simultaneously. By incorporating trade liberalisation in the model, one can calculate the ex ante impact of implementing a RIA. 5 See Chapter 3 of FAO (2008) and Chapter 1 of UNCTAD (2009) for more information on regional integration in Africa. 6 The standard phases in the process of economic integration are the movement from preferential free trade area, free trade area, customs union (Common External Tariff, CET), common market (free movement of
8
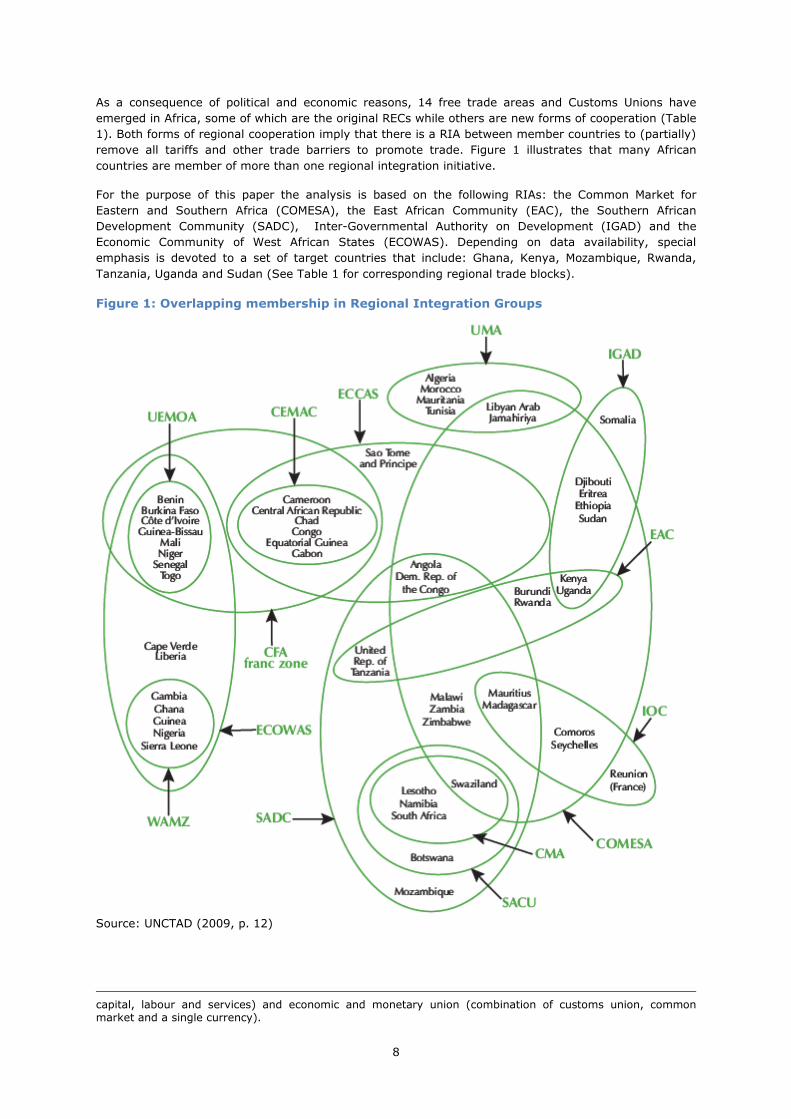
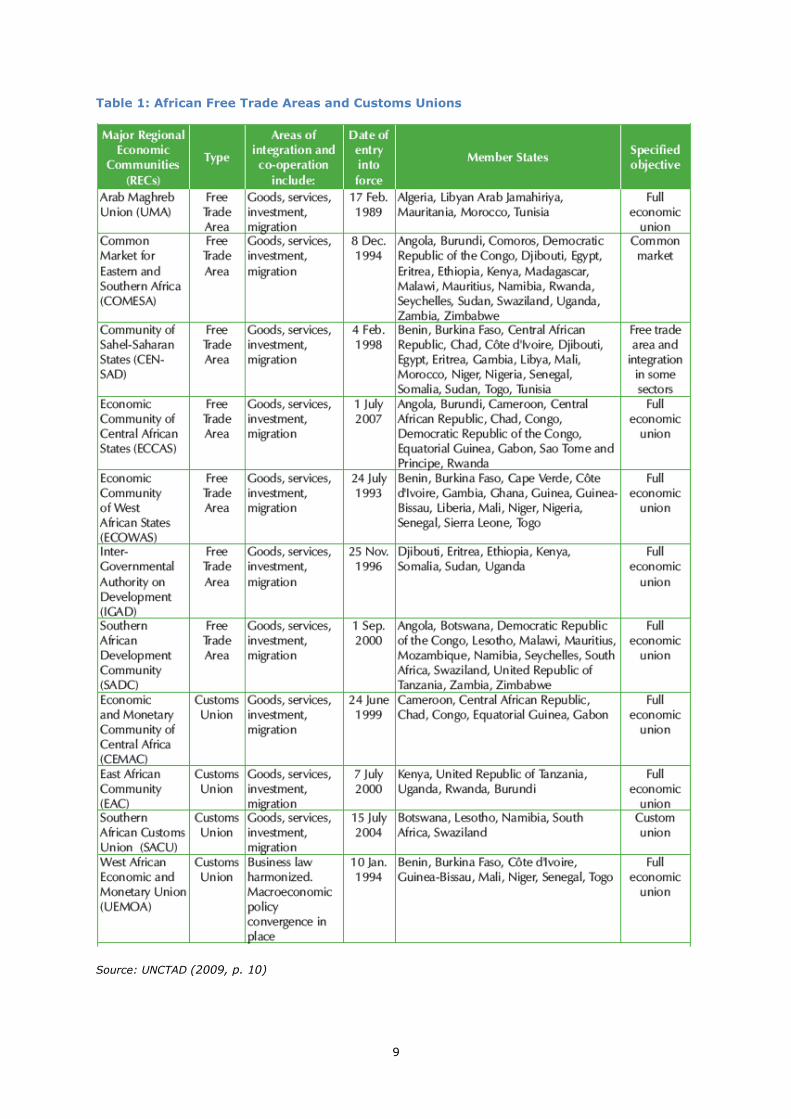
As a consequence of political and economic reasons, 14 free trade areas and Customs Unions have
emerged in Africa, some of which are the original RECs while others are new forms of cooperation (Table
1). Both forms of regional cooperation imply that there is a RIA between member countries to (partially)
remove all tariffs and other trade barriers to promote trade. Figure 1 illustrates that many African
countries are member of more than one regional integration initiative.
For the purpose of this paper the analysis is based on the following RIAs: the Common Market for
Eastern and Southern Africa (COMESA), the East African Community (EAC), the Southern African
Development Community (SADC), Inter-Governmental Authority on Development (IGAD) and the
Economic Community of West African States (ECOWAS). Depending on data availability, special
emphasis is devoted to a set of target countries that include: Ghana, Kenya, Mozambique, Rwanda,
Tanzania, Uganda and Sudan (See Table 1 for corresponding regional trade blocks).
Figure 1: Overlapping membership in Regional Integration Groups
Source: UNCTAD (2009, p. 12)
capital, labour and services) and economic and monetary union (combination of customs union, common market and a single currency).
9
Table 1: African Free Trade Areas and Customs Unions
Source: UNCTAD (2009, p. 10)
10
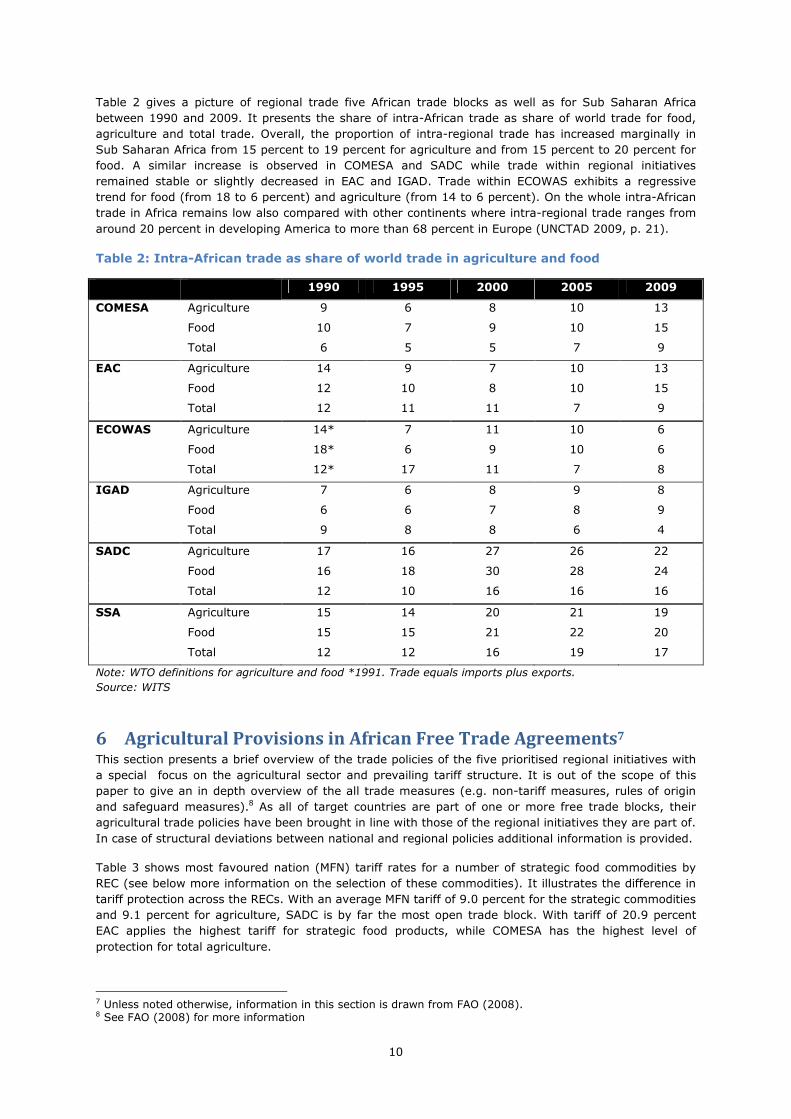
Table 2 gives a picture of regional trade five African trade blocks as well as for Sub Saharan Africa
between 1990 and 2009. It presents the share of intra-African trade as share of world trade for food,
agriculture and total trade. Overall, the proportion of intra-regional trade has increased marginally in
Sub Saharan Africa from 15 percent to 19 percent for agriculture and from 15 percent to 20 percent for
food. A similar increase is observed in COMESA and SADC while trade within regional initiatives
remained stable or slightly decreased in EAC and IGAD. Trade within ECOWAS exhibits a regressive
trend for food (from 18 to 6 percent) and agriculture (from 14 to 6 percent). On the whole intra-African
trade in Africa remains low also compared with other continents where intra-regional trade ranges from
around 20 percent in developing America to more than 68 percent in Europe (UNCTAD 2009, p. 21).
Table 2: Intra-African trade as share of world trade in agriculture and food
1990 1995 2000 2005 2009
COMESA Agriculture 9 6 8 10 13
Food 10 7 9 10 15
Total 6 5 5 7 9
EAC Agriculture 14 9 7 10 13
Food 12 10 8 10 15
Total 12 11 11 7 9
ECOWAS Agriculture 14* 7 11 10 6
Food 18* 6 9 10 6
Total 12* 17 11 7 8
IGAD Agriculture 7 6 8 9 8
Food 6 6 7 8 9
Total 9 8 8 6 4
SADC Agriculture 17 16 27 26 22
Food 16 18 30 28 24
Total 12 10 16 16 16
SSA Agriculture 15 14 20 21 19
Food 15 15 21 22 20
Total 12 12 16 19 17
Note: WTO definitions for agriculture and food *1991. Trade equals imports plus exports.
Source: WITS
6 Agricultural Provisions in African Free Trade Agreements7 This section presents a brief overview of the trade policies of the five prioritised regional initiatives with
a special focus on the agricultural sector and prevailing tariff structure. It is out of the scope of this
paper to give an in depth overview of the all trade measures (e.g. non-tariff measures, rules of origin
and safeguard measures).8 As all of target countries are part of one or more free trade blocks, their
agricultural trade policies have been brought in line with those of the regional initiatives they are part of.
In case of structural deviations between national and regional policies additional information is provided.
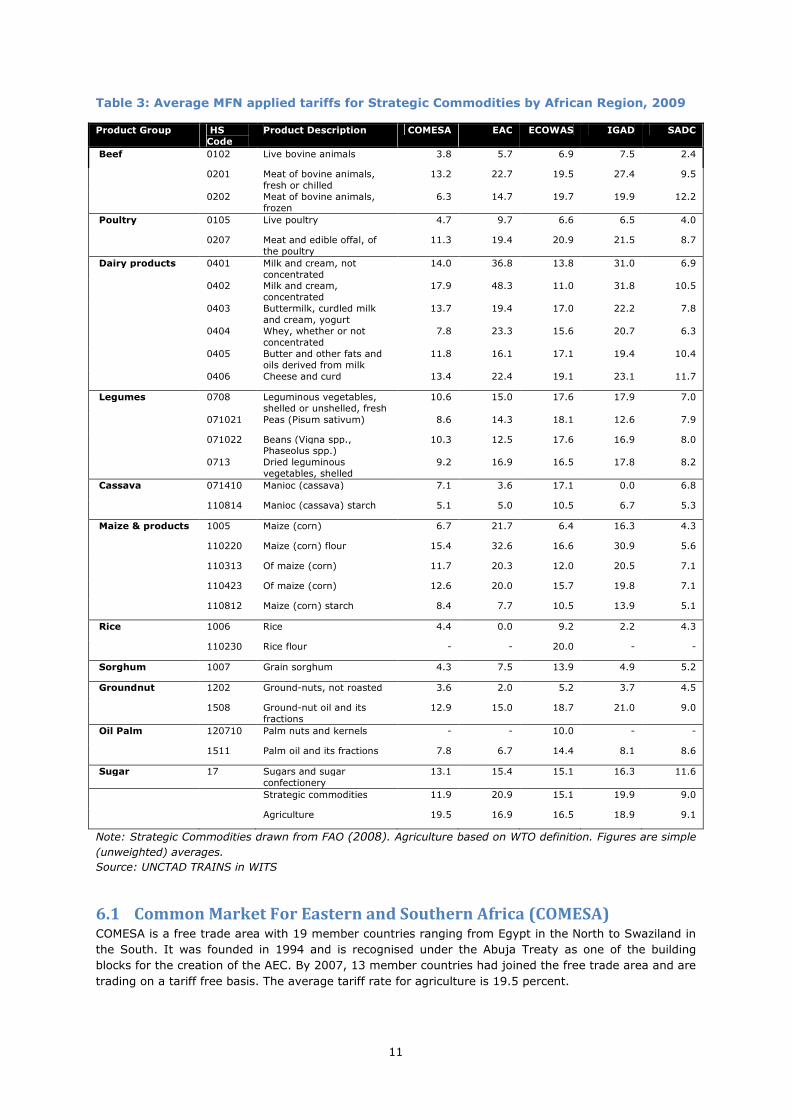
Table 3 shows most favoured nation (MFN) tariff rates for a number of strategic food commodities by
REC (see below more information on the selection of these commodities). It illustrates the difference in
tariff protection across the RECs. With an average MFN tariff of 9.0 percent for the strategic commodities
and 9.1 percent for agriculture, SADC is by far the most open trade block. With tariff of 20.9 percent
EAC applies the highest tariff for strategic food products, while COMESA has the highest level of
protection for total agriculture.
7 Unless noted otherwise, information in this section is drawn from FAO (2008). 8 See FAO (2008) for more information
11
Table 3: Average MFN applied tariffs for Strategic Commodities by African Region, 2009
Product Group HS
Code
Product Description COMESA EAC ECOWAS IGAD SADC
Beef 0102 Live bovine animals 3.8 5.7 6.9 7.5 2.4
0201 Meat of bovine animals, fresh or chilled
13.2 22.7 19.5 27.4 9.5
0202 Meat of bovine animals, frozen
6.3 14.7 19.7 19.9 12.2
Poultry 0105 Live poultry 4.7 9.7 6.6 6.5 4.0
0207 Meat and edible offal, of the poultry
11.3 19.4 20.9 21.5 8.7
Dairy products 0401 Milk and cream, not concentrated
14.0 36.8 13.8 31.0 6.9
0402 Milk and cream, concentrated
17.9 48.3 11.0 31.8 10.5
0403 Buttermilk, curdled milk and cream, yogurt
13.7 19.4 17.0 22.2 7.8
0404 Whey, whether or not concentrated
7.8 23.3 15.6 20.7 6.3
0405 Butter and other fats and oils derived from milk
11.8 16.1 17.1 19.4 10.4
0406 Cheese and curd 13.4 22.4 19.1 23.1 11.7
Legumes 0708 Leguminous vegetables, shelled or unshelled, fresh
10.6 15.0 17.6 17.9 7.0
071021 Peas (Pisum sativum) 8.6 14.3 18.1 12.6 7.9
071022 Beans (Vigna spp., Phaseolus spp.)
10.3 12.5 17.6 16.9 8.0
0713 Dried leguminous vegetables, shelled
9.2 16.9 16.5 17.8 8.2
Cassava 071410 Manioc (cassava) 7.1 3.6 17.1 0.0 6.8
110814 Manioc (cassava) starch 5.1 5.0 10.5 6.7 5.3
Maize & products 1005 Maize (corn) 6.7 21.7 6.4 16.3 4.3
110220 Maize (corn) flour 15.4 32.6 16.6 30.9 5.6
110313 Of maize (corn) 11.7 20.3 12.0 20.5 7.1
110423 Of maize (corn) 12.6 20.0 15.7 19.8 7.1
110812 Maize (corn) starch 8.4 7.7 10.5 13.9 5.1
Rice 1006 Rice 4.4 0.0 9.2 2.2 4.3
110230 Rice flour - - 20.0 - -
Sorghum 1007 Grain sorghum 4.3 7.5 13.9 4.9 5.2
Groundnut 1202 Ground-nuts, not roasted 3.6 2.0 5.2 3.7 4.5
1508 Ground-nut oil and its fractions
12.9 15.0 18.7 21.0 9.0
Oil Palm 120710 Palm nuts and kernels - - 10.0 - -
1511 Palm oil and its fractions 7.8 6.7 14.4 8.1 8.6
Sugar 17 Sugars and sugar confectionery
13.1 15.4 15.1 16.3 11.6
Strategic commodities 11.9 20.9 15.1 19.9 9.0
Agriculture 19.5 16.9 16.5 18.9 9.1
Note: Strategic Commodities drawn from FAO (2008). Agriculture based on WTO definition. Figures are simple
(unweighted) averages.
Source: UNCTAD TRAINS in WITS
6.1 Common Market For Eastern and Southern Africa (COMESA) COMESA is a free trade area with 19 member countries ranging from Egypt in the North to Swaziland in
the South. It was founded in 1994 and is recognised under the Abuja Treaty as one of the building
blocks for the creation of the AEC. By 2007, 13 member countries had joined the free trade area and are
trading on a tariff free basis. The average tariff rate for agriculture is 19.5 percent.
12
In June 2009, with a delay of nine years, the Customs Union was launched and a CET adopted. The CET
will be applied to imports from third countries subject to the MFN principle and will have a three band
structure (0%, 10%, and 25%), the first category is for raw materials which also include agricultural and
food commodities. It was agreed that the transition period will be three years, but can be extended to a
period not exceeding five years. In 2008, the heads of COMESA, EAC and SADC agreed to create an
African Free Trade Area composed of 26 joint member countries.9
COMESA’s Aim is to adopt a common agricultural policy and strategy in the medium to long term, which
objectives include among others: (1) increase agricultural productivity; (2) ensure regional food
security, and; (3) increase intra and extra COMESA agricultural trade.
6.2 East African Community (EAC) EAC is a common market comprised of five countries. After a collapse in 1977, the EAC was revived in
2000. In January 2005, the EAC CET entered into force and in 2010 launched its own common market
for goods, labour and capital within the region, with the goal of a common currency by 2012 and full
political federation in 2015. The CET has three band structure: raw materials (0%), intermediate
products (10%) and finished goods (25%). However, the customs union is not yet fully implemented
because exclusions to the CET remain. Notable exceptions for agricultural goods are rice imports from
Pakistan for Kenya and wheat and barley imports for Tanzania. Also several agricultural commodities
carry higher rates than the CET, including dairy goods, wheat, and sugar (WTO 2006). The average tariff
on agricultural goods is 16.9 percent. Tariff-free movement of goods and services in the region has not
been completely liberalised and tariffs remain in place on exports of 880 items from Kenya to Tanzania
and 443 items from Kenya to Uganda, which are to be phased out by 2010.
EAC has developed an Agriculture and Rural Development Policy which main aim is to ensure food
security and facilitate national agricultural production.10
6.3 Economic Community of West African States (ECOWAS) ECOWAS is a regional group of 15 West African states.11 ECOWAS was founded in 1975 but in 1993 its
establishment treaty was revised to take into account the provisions of the Abuja Treaty, making the
region one of the pillars of the AEC. Of the ECOWAS members, six francophone countries (plus Niger,
Côte d’Ivoire and Guinea-Bissau) make up the West African Economic and Monetary Union (WAEMU),
which is a customs and currency union. The WAEMU CET features four tariff categories with rates of 0%
for essential social goods, 5% for essential/ basic raw materials, capital goods and specific inputs, 10%
for intermediary products, and a peak tariff rate of 20% for final consumer goods. In 2006, the ECOWAS
Heads of State took the decision to harmonise their import tariffs with those of the WAEMU. This failed
however because Nigeria demanded an additional fifth band of 50 percent to protect certain sensitive
industries.12 The average tariff for agricultural products is 16.5 percent.
With regard to agriculture, Article 25 specifically provides that members must cooperate in the
harmonisation of food security policies paying particular attention to the conclusion of agreements on
food security at the regional level. In this context, the ECOWAS Heads of State adopted a common
agricultural policy (ECOWAP) in 2005 in conformity with CAADP (see below), which key aim is to fight
rural poverty and enhance food security by raising smallholder productivity. In the wake of the
2007/2008 food crisis which severely affected a number of West African countries (i.e. Burkina Faso,
Mali and Niger), ECOWAS is currently in the process of implementing ECOWAP by developing regional
and national agricultural investment plans.
6.4 Inter-Governmental Authority on Development (IGAD)13 The Intergovernmental Authority on Development (IGAD) in Eastern Africa was created in 1996 and
currently has seven members. IGAD’s mission is to increase economic cooperation and integration,
promote peace and security and ensure food security in the region. With reference to intra-regional
9 http://en.wikipedia.org/wiki/African_Free_Trade_Zone#Africa_Free_Trade_Zone (20-01-11). 10 http://www.eac.int/agriculture/index.php?option=com_docman&task=doc_download&gid=42&Itemid=6 (20-01-11). 11 Note that Niger (2009) and Côte d’Ivoire (2010) have been recently suspended from ECOWAS. 12 ECOWAS CET: the imperatives of Nigeria’s fifth band, http://ictsd.org/i/news/10674/ (20-01-11). 13 Information taken from http://igad.int/ (21-01-11).
13
trade the objectives are to harmonize policies with regard to trade and promote free movement of
goods, services, and people within the region as well as creating and enabling environment for foreign,
cross-border and domestic trade and investment. With regard to agriculture, IGAD identifies the
harmonisation of agricultural policies and the initiation of food security programs as goals.
It seems that cooperation between IGAD members has almost stopped because Kenya and Uganda have
shift their attention to integration within EAC, Sudan and Somalia’s internal problems and the conflict
between Ethiopia and Eritrea.14
6.5 The Southern African Development Community (SADC) As an organisation SADC origins date back to 1980 but its trade policy only entered into force on 25
January 2000. Its aim is to considerably reduce tariff barriers and eliminate non-trade barriers, which
culminated in the launch of a free trade area in 2008. The establishment of customs union, planned for
2010, was postponed due to the need for further studies on the impact of integration on the economies
of member states.15 This might also delay the further steps towards regional integration, including the
establishment of a customs union scheduled for 2010, a common market planned by 2015, and a
monetary union by 2016.
The SADC treaty specifies food security, land and agriculture as areas in which member countries shall
cooperate but no further information is offered with respect to agricultural trade and cooperation.
Agricultural products are classified as sensitive products which means their tariffs will be eliminated
between 2008 and 2012.
Five members of SADC (Botswana, Lesotho, Namibia, South Africa and Swaziland) form the Southern
African Customs Union (SACU). Under SACU all members implement the import duty rates determined
by South Africa. The simple average rate of SACU’s applied MFN rate was 8.1% in 2009. However, with
an average tariff of 10.1% agricultural products are more protected than non-agricultural products.
7 Determinants of Intra-African Agricultural Trade The literature points out a number of factors that influence (regional) trade. Some of them can be
considered as ‘fixed’ factors and include country characteristics like adjacency, common currency,
common language and common history. An example in which the latter three are likely to play a role is
trade within ECOWAS, which can be divided in an Anglophone and Francophone group, each with its own
language, currency (only the Francophone block) and colonial history. Common or diverse consumer
preferences also influence trade. This seems particularly relevant for the trade in food commodities as
the main staple crops, such as cassava, sorghum, millet and local varieties of maize, which make up a
large share of households’ diet, differ across Africa. Political factors such as the loss of national
sovereignty, lack of political will, lack of broad support from the private sector and civil society and
perceived inequities in sharing of costs and benefits might also block regional trade integration.
Dynamic determinants of trade that are amendable to policy intervention are economic size measured
by GDP, population or income per capita to proxy for demand. Most empirical studies find that demand
positively affects trade. Taking into account that the majority of African countries, perhaps with the
exception of South Africa and Nigeria, are characterised by low levels of income both aggregate and per
capita, it is evident that demand is a constraint to intra-African trade. Similar production structures, and
hence, the limited opportunities to exploit comparative advantage, might potentially hamper intra-
African trade. On the other hand, differences in production costs, natural resource endowments and
existing patterns of local cross-border trade in agricultural products, indicates that this might not be an
important constraint (UNCTAD 2009).
High trade costs, defined as all costs that associated with getting a final product to a final consumer,
are a major factor hampering intra-African trade. They can be divided into trade barriers ( tariffs and
non-tariff) and costs caused by problems of infrastructure.
14 http://en.wikipedia.org/wiki/IGAD (21-01-11). 15 http://allafrica.com/stories/201008180923.html (21-01-11).
14
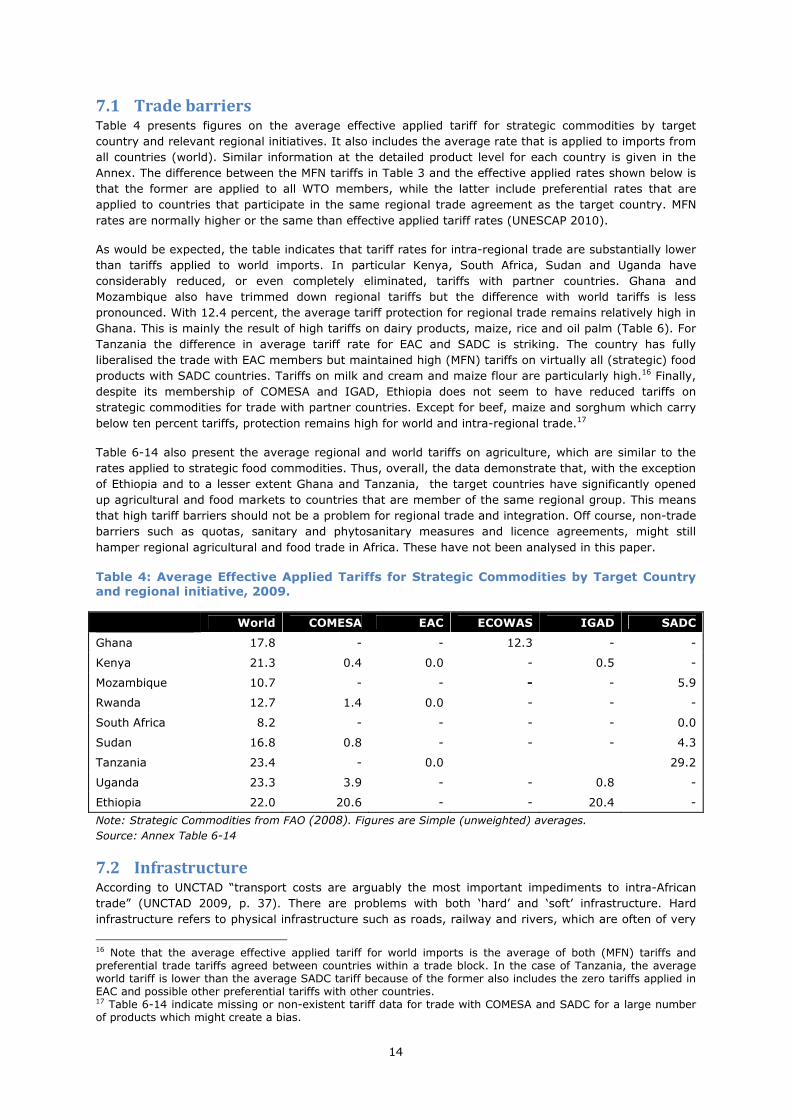
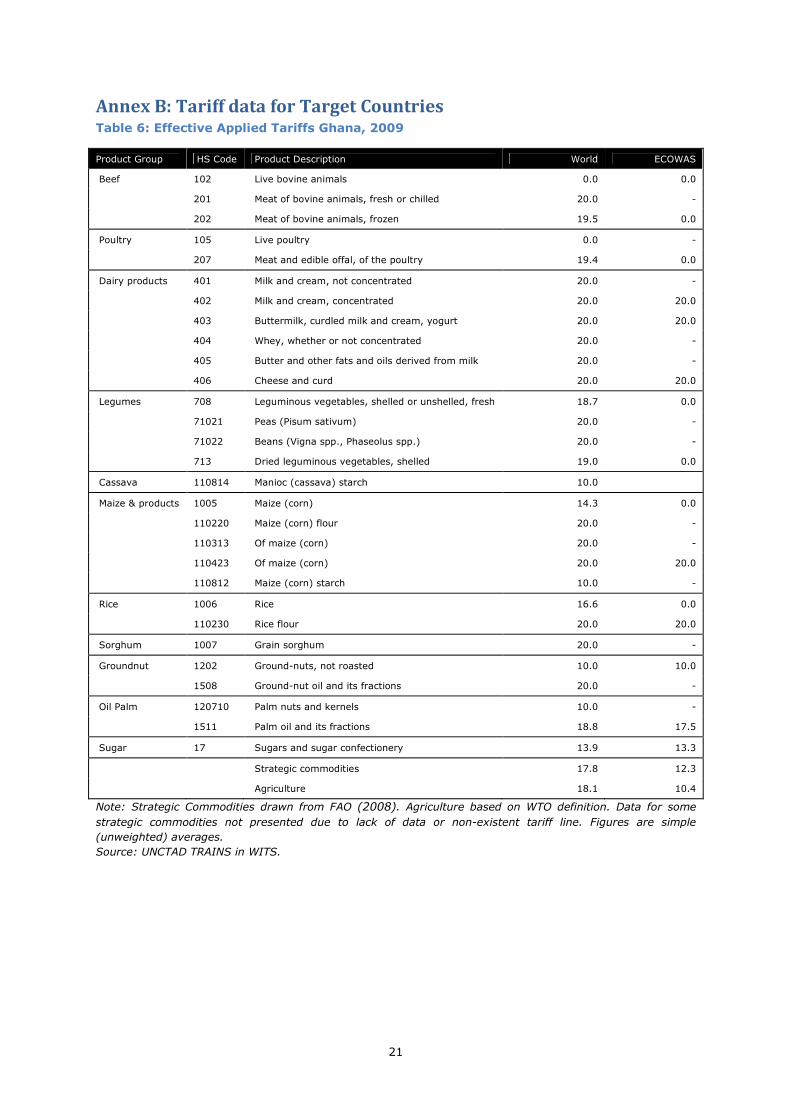
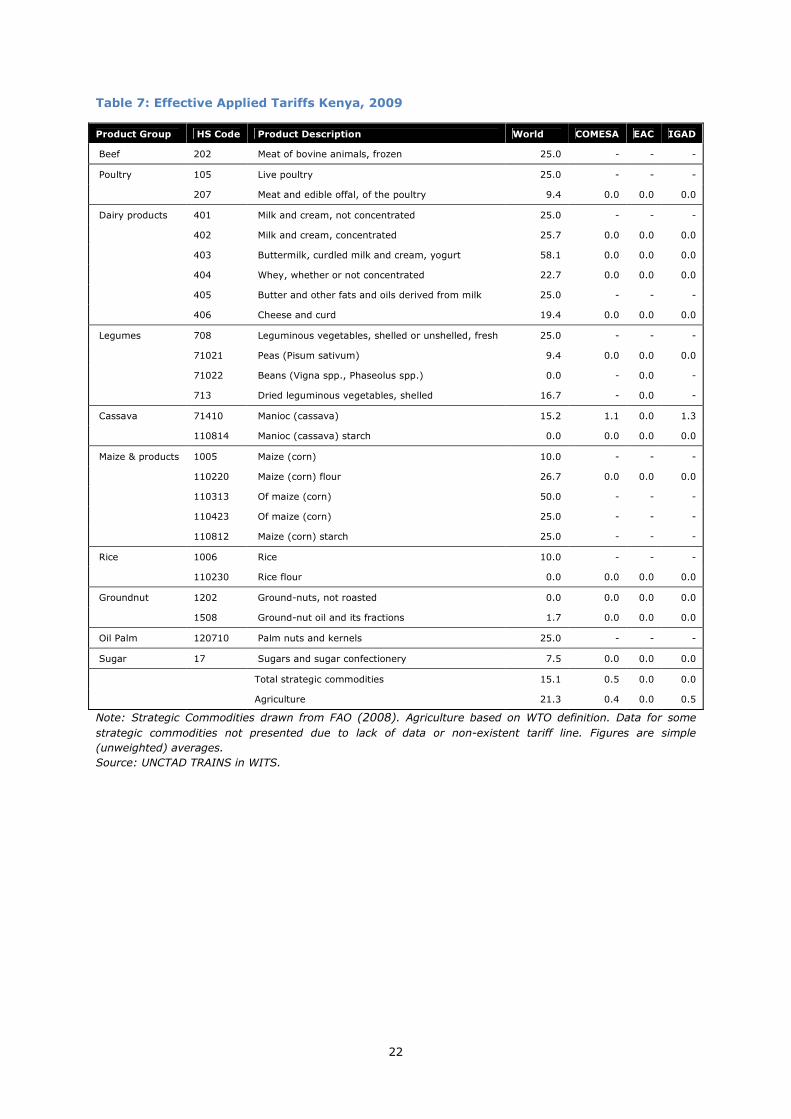
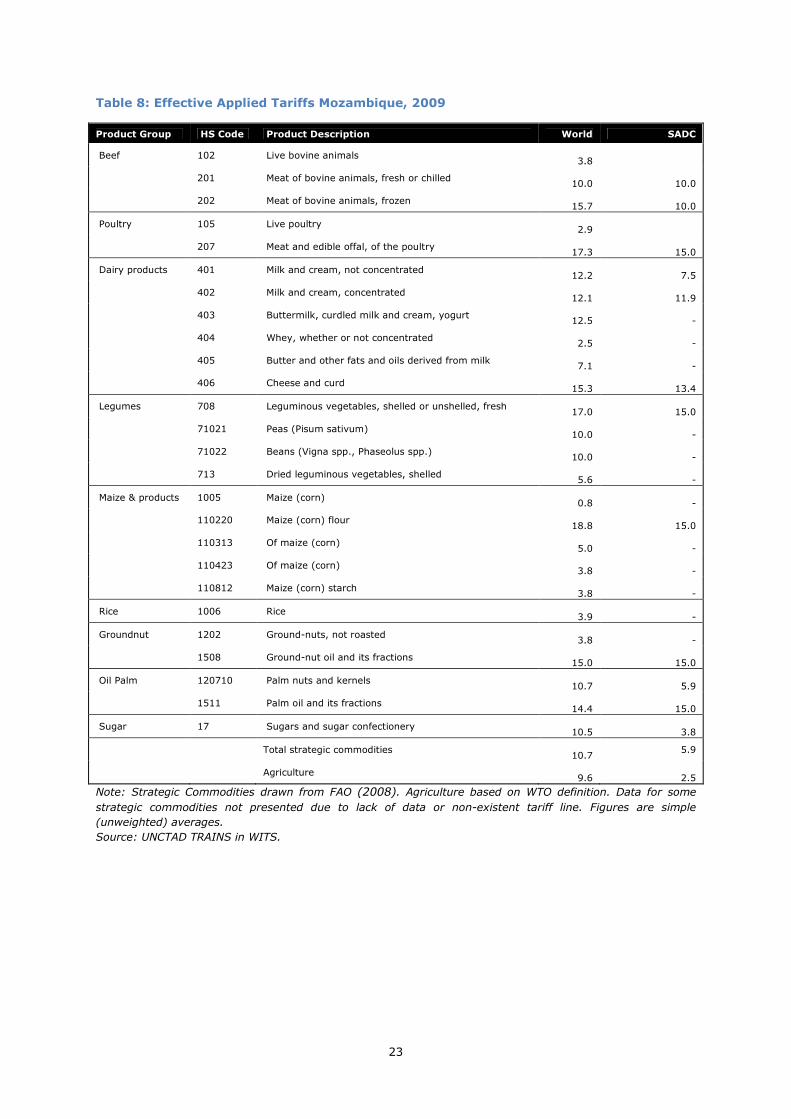
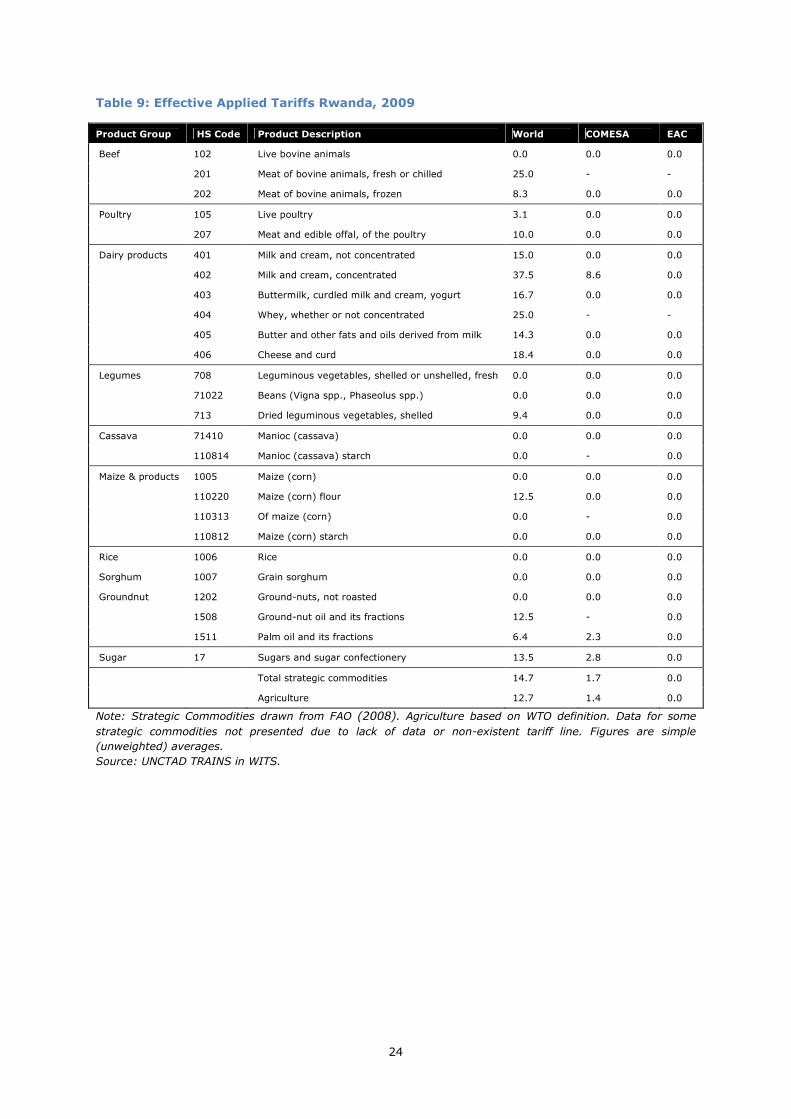
7.1 Trade barriers Table 4 presents figures on the average effective applied tariff for strategic commodities by target
country and relevant regional initiatives. It also includes the average rate that is applied to imports from
all countries (world). Similar information at the detailed product level for each country is given in the
Annex. The difference between the MFN tariffs in Table 3 and the effective applied rates shown below is
that the former are applied to all WTO members, while the latter include preferential rates that are
applied to countries that participate in the same regional trade agreement as the target country. MFN
rates are normally higher or the same than effective applied tariff rates (UNESCAP 2010).
As would be expected, the table indicates that tariff rates for intra-regional trade are substantially lower
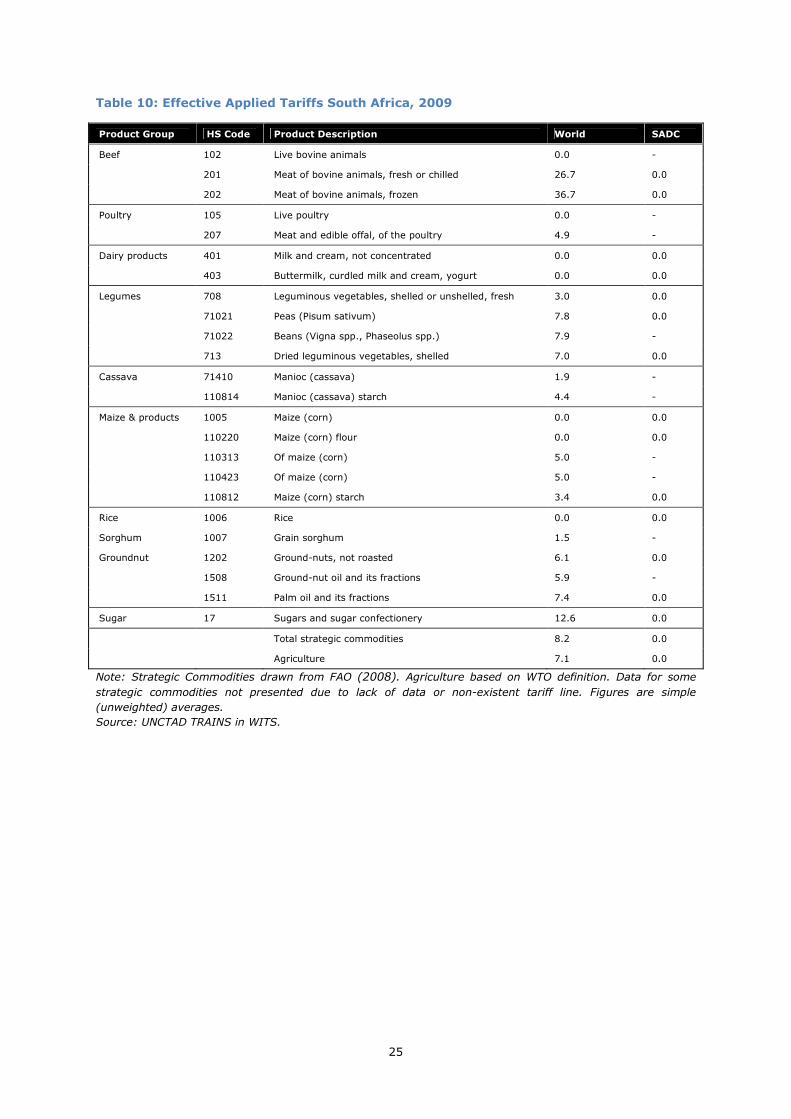
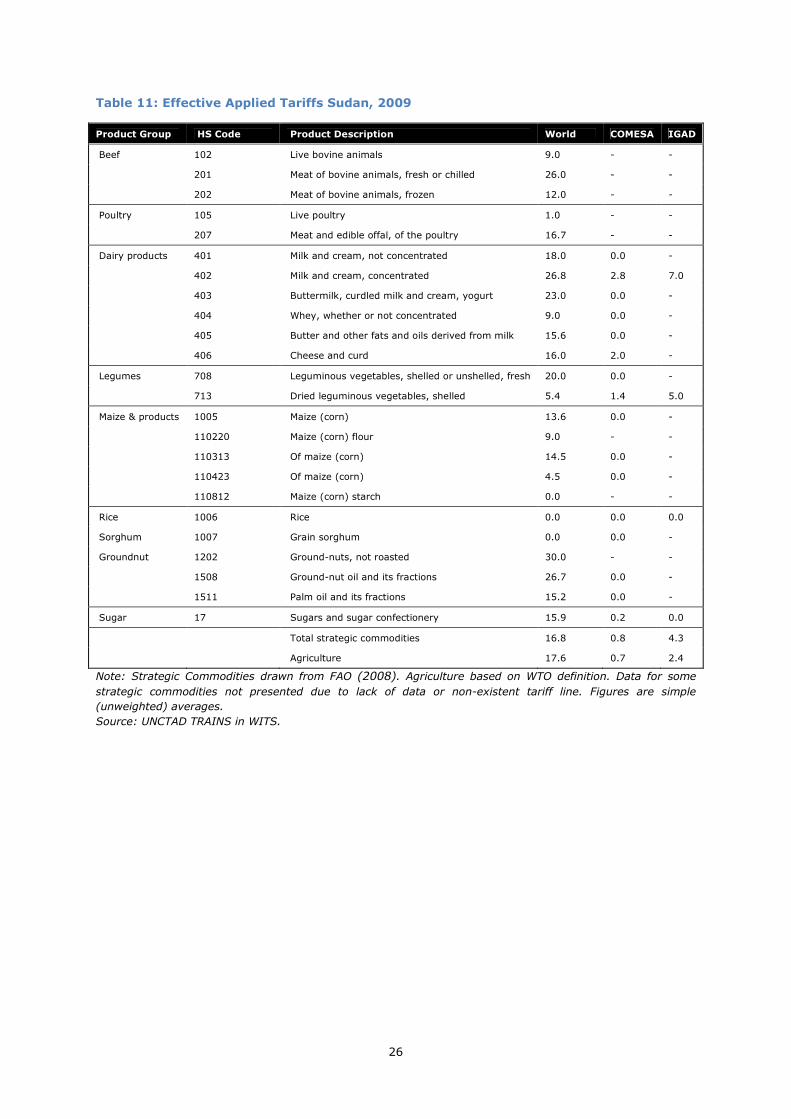
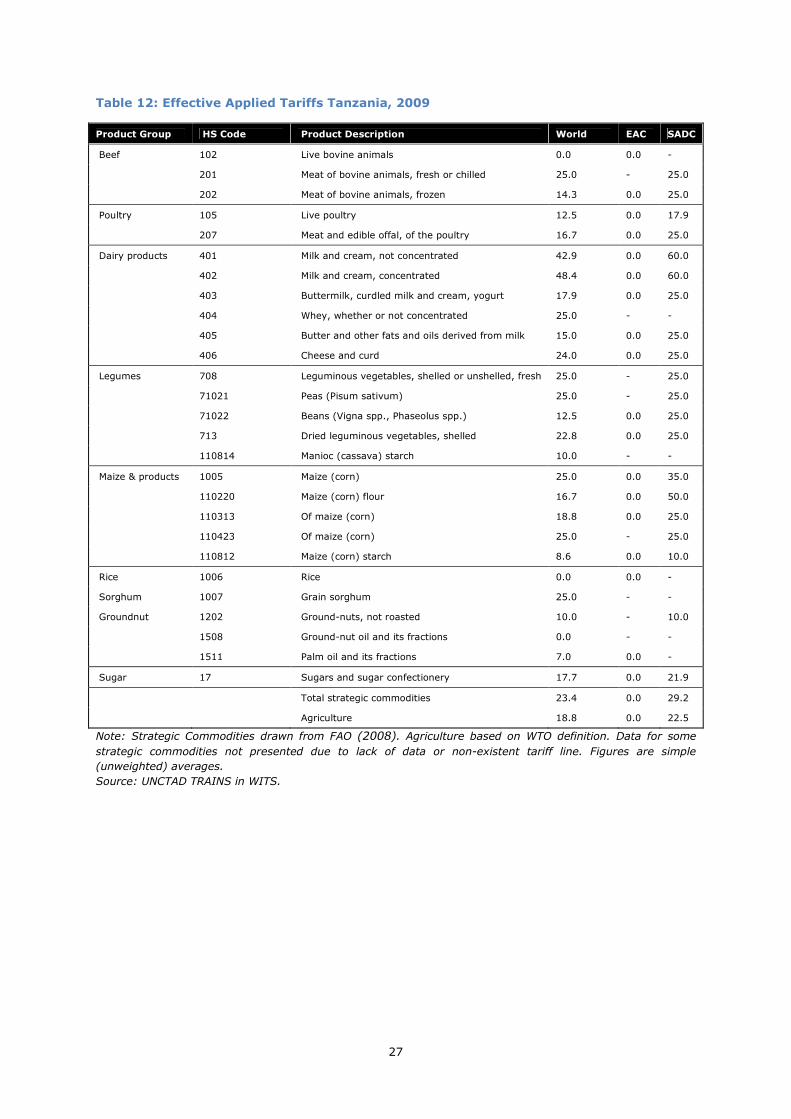
than tariffs applied to world imports. In particular Kenya, South Africa, Sudan and Uganda have
considerably reduced, or even completely eliminated, tariffs with partner countries. Ghana and
Mozambique also have trimmed down regional tariffs but the difference with world tariffs is less
pronounced. With 12.4 percent, the average tariff protection for regional trade remains relatively high in
Ghana. This is mainly the result of high tariffs on dairy products, maize, rice and oil palm (Table 6). For
Tanzania the difference in average tariff rate for EAC and SADC is striking. The country has fully
liberalised the trade with EAC members but maintained high (MFN) tariffs on virtually all (strategic) food
products with SADC countries. Tariffs on milk and cream and maize flour are particularly high.16 Finally,
despite its membership of COMESA and IGAD, Ethiopia does not seem to have reduced tariffs on
strategic commodities for trade with partner countries. Except for beef, maize and sorghum which carry
below ten percent tariffs, protection remains high for world and intra-regional trade.17
Table 6-14 also present the average regional and world tariffs on agriculture, which are similar to the
rates applied to strategic food commodities. Thus, overall, the data demonstrate that, with the exception
of Ethiopia and to a lesser extent Ghana and Tanzania, the target countries have significantly opened
up agricultural and food markets to countries that are member of the same regional group. This means
that high tariff barriers should not be a problem for regional trade and integration. Off course, non-trade
barriers such as quotas, sanitary and phytosanitary measures and licence agreements, might still
hamper regional agricultural and food trade in Africa. These have not been analysed in this paper.
Table 4: Average Effective Applied Tariffs for Strategic Commodities by Target Country
and regional initiative, 2009.
World COMESA EAC ECOWAS IGAD SADC
Ghana 17.8 - - 12.3 - -
Kenya 21.3 0.4 0.0 - 0.5 -
Mozambique 10.7 - - - - 5.9
Rwanda 12.7 1.4 0.0 - - -
South Africa 8.2 - - - - 0.0
Sudan 16.8 0.8 - - - 4.3
Tanzania 23.4 - 0.0
29.2
Uganda 23.3 3.9 - - 0.8 -
Ethiopia 22.0 20.6 - - 20.4 -
Note: Strategic Commodities from FAO (2008). Figures are Simple (unweighted) averages.
Source: Annex Table 6-14
7.2 Infrastructure According to UNCTAD “transport costs are arguably the most important impediments to intra-African
trade” (UNCTAD 2009, p. 37). There are problems with both ‘hard’ and ‘soft’ infrastructure. Hard
infrastructure refers to physical infrastructure such as roads, railway and rivers, which are often of very
16 Note that the average effective applied tariff for world imports is the average of both (MFN) tariffs and preferential trade tariffs agreed between countries within a trade block. In the case of Tanzania, the average world tariff is lower than the average SADC tariff because of the former also includes the zero tariffs applied in EAC and possible other preferential tariffs with other countries. 17 Table 6-14 indicate missing or non-existent tariff data for trade with COMESA and SADC for a large number of products which might create a bias.
15
poor quality in African countries. It is estimated an investment of $32 billion to upgrade the main intra-
African road network would result in trade expansion of about $250 billion over a period of 15 years.
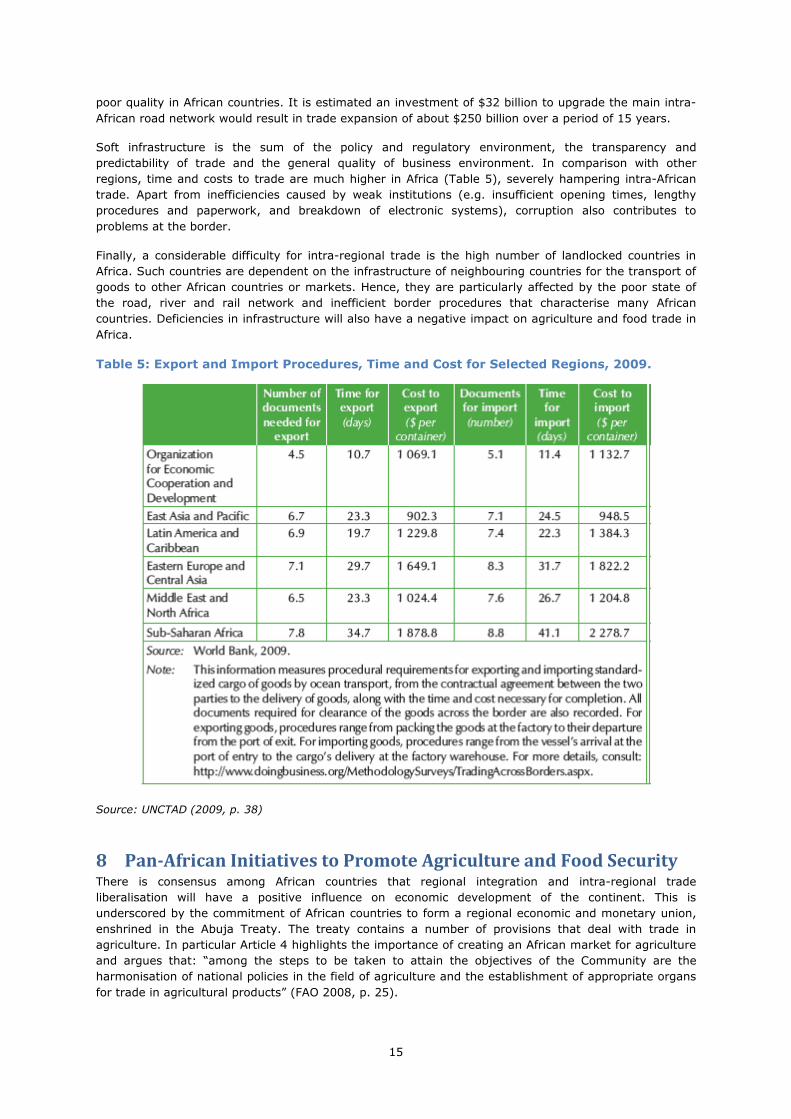
Soft infrastructure is the sum of the policy and regulatory environment, the transparency and
predictability of trade and the general quality of business environment. In comparison with other
regions, time and costs to trade are much higher in Africa (Table 5), severely hampering intra-African
trade. Apart from inefficiencies caused by weak institutions (e.g. insufficient opening times, lengthy
procedures and paperwork, and breakdown of electronic systems), corruption also contributes to
problems at the border.
Finally, a considerable difficulty for intra-regional trade is the high number of landlocked countries in
Africa. Such countries are dependent on the infrastructure of neighbouring countries for the transport of
goods to other African countries or markets. Hence, they are particularly affected by the poor state of
the road, river and rail network and inefficient border procedures that characterise many African
countries. Deficiencies in infrastructure will also have a negative impact on agriculture and food trade in
Africa.
Table 5: Export and Import Procedures, Time and Cost for Selected Regions, 2009.
Source: UNCTAD (2009, p. 38)
8 Pan-African Initiatives to Promote Agriculture and Food Security There is consensus among African countries that regional integration and intra-regional trade
liberalisation will have a positive influence on economic development of the continent. This is
underscored by the commitment of African countries to form a regional economic and monetary union,
enshrined in the Abuja Treaty. The treaty contains a number of provisions that deal with trade in
agriculture. In particular Article 4 highlights the importance of creating an African market for agriculture
and argues that: “among the steps to be taken to attain the objectives of the Community are the
harmonisation of national policies in the field of agriculture and the establishment of appropriate organs
for trade in agricultural products” (FAO 2008, p. 25).
16
So far progress towards opening up (agricultural) trade at the continental level has been modest but
progress has been made at the level of RECs as has been described above. In view of the poor
performance of the African agricultural sector and the continuous food crises that have plagued the
continent, the African Union has also commenced with several Pan-African initiatives and programs that
are specifically designed to promote agricultural development and overcome food insecurity. The two
most important are summarised below.
8.1 African Union Common Market for Agricultural Products (CMAP) In 2001, African Heads of State decided that the creation of an African common market for agricultural
products (CMAP) could be an important catalyst in addressing food security on the continent. ‘Common
market’ is somewhat misleading in this case because it refers to the ultimate goal of creating an African
Economic Community. In fact, the proposed CMAP implies the creation of a free trade area for
agricultural products across the continent. The formation of CMAP was mainly spurred by the recognition
that African food and agricultural markets are very fragmented along regional, national and even within
country levels, resulting in a failure to exploit economies of scale and a lack of investment in regional
value chains. As a consequence, Africa has become increasingly dependent on imports from outside the
continent. It is expected that by eliminating internal barriers to trade and harmonising (not increase)
external protection, agricultural trade, economic efficiency, investment and growth are stimulated.
As a practical solution to implementation of CMAP, a number of key strategic commodities were
identified during the 2006 AU/NEPAD Summit on Food Security in Africa. RECs and member countries
were called to: “promote and protect rice, legumes, maize, cotton, oil palm, beef, dairy, poultry and
fisheries products as strategic commodities at the continental level, and cassava, sorghum and millet at
subregional level, without prejudice to focused attention being given alto to products of particular
national importance” (FAO 2008, p. 7).
Furthermore they were urged to accelerate the development of the strategic commodities by: “fast
tracking the implementation of trade arrangements adopted in the Regional Economic Communities
(RECs) through lowering tariff barriers and elimination of non-tariff barriers both technical and non-
technical by 2010, and take account of these measures during global negotiations in the Doha Round
and Economic Partnership Agreement (EPA” (FAO 2008, p. 7).
The strategic commodities were selected on the basis of three criteria:
• Represent an important weight in the African food basket;
• Weigh significantly in the trade balance in the region through their contribution to foreign
exchange earnings or are imported in large quantities to make up the gap between Africa’s
production as being key to fulfil Africa’s food demand; and
• Have considerable unexploited production potential in Africa, owing mainly to internal supply-
side constraints as well as external impediments such as agricultural subsidies and support
measures used by Africa’s trading partners.
Recently FAO was requested to provide technical assistance to the AU, the RECs and member states to
push the establishment of CMAP forward. Recommendations are offered in FAO (2008).
8.2 The Comprehensive African Agriculture Development Programme
(CAADP) In 2003, the African Heads of State launched the Comprehensive Africa Agriculture Development
Programme or CAADP, which is part of the African Union’s New Partnership for Africa’s Development
(NEPAD). The program was a reaction by African governments to reverse the ‘crisis’ situation of the
agricultural sector on the continent, characterised by a high rate of food imports, vulnerability to climate
shocks and marginalised smallholder farmers. The main objective of CAADP is to stimulate growth
through agricultural-led development that will lead to halving hunger and poverty by 2015 (MDG 1) and
fighting poverty in Africa. In order to achieve these objectives, African countries pledged to spend at
least 10 percent of the national budget on agriculture before 2008 (later shifted to 2015 due to the lack
of progress). CAADP is not a detailed roadmap to promote growth of the agricultural sector and
economic development at the country level. Instead it must be regarded as a set of key principles and
targets that provide a framework for the RECs and its members to stimulate and guide the development
17
of national investment agricultural investment plans adapted to local conditions. It has identified four
pillars for transforming agriculture:
• Pillar 1: Extend the area under sustainable land management and reliable water control
systems.
• Pillar 2: Improve rural infrastructure and trade related capacities for market access;
• Pillar 3: Increase food supply chains, reduce hunger and improve response emergencies;
• Pillar 4: Improve agricultural research technology dissemination and adoption;
To implement CAADP, each REC is expected to produce regional and national agreements (Compacts)
that summarise key policies, strategies and responsibilities to promote agricultural growth, followed by
detailed regional and national agricultural investment plans. In line with the CAADP principles to foster
ownership, alliance building and partnership, the objective is to develop Compact and investment plans
in an open and participatory manner, involving all relevant stakeholders including: civil society, (small
scale) farmer associations and the private sector, alongside policy makers from the Ministry of
Agriculture, Trade and Finance and the development partners (i.e.World Bank and bilateral donors).
Following the 2007/2008 food crisis, the implementation of CAADP has rapidly accelerated. Many
international and international institutions have pledged their support and begun committing resources
to the program. To date 22 African countries have signed the Compact document and 18 of them are in
the process of drafting or reviewing the agricultural investment plans. 18
9 Implications for Food Security The analysis in previous sections demonstrates that regional integration of agricultural and food markets
in Africa has, at best, been partial. What does this mean for regional food security? Most of the empirical
research find that (net)trade creation as a consequence of signing an African RIA is limited. This implies
that the regional integration has not led to substantial allocation effects and the expected decrease in
food prices caused by efficiency gains. Hence, the direct effect of African RIAs on food security seems to
have been small. On the basis of the available information, it is impossible to determine whether RIAs
have caused accumulation effects. Because of its more dynamic nature, accumulation effects can have a
potentially much larger and positive effect on improving food security by stimulating agricultural
development and poverty reduction. Taking into account that allocation effects have been small, it
seems likely accumulation effects have also been limited.
This does not mean that more and better regional integration does not offer important opportunities to
improve food security in Africa. Intra-regional agriculture and food trade in Africa is relatively low in
comparison with other developing regions. This means there is sufficient scope for expansion. It appears
that not high tariff barriers but the poor condition of soft and hard infrastructure in Africa forms the main
bottleneck for regional integration. Hence, for regional trade to contribute to greater food security there
is a need for African countries to invest in the upgrading of regional (rural) road networks and address
deficiencies in custom procedures.
In this regard, the AU led CAADP program is a step in the right direction. The main objective of Pillar 2 is
to improve rural infrastructure and market access both at the national and regional level. Another
important component of CAADP is Pillar 4 that aims to boost agricultural research and development, and
extension services to spread new technologies among small scale farmers. The empirical research also
pointed out that the gains of regional trade in Africa are limited because of similarities in resource
endowments and tradable agricultural commodities. It is expected that the diffusion of new technologies
will lead to higher productivity, creating new opportunities for regional trade. Finally, the plan to create
African CMAP offers prospects to enhance food security by increasing the size of markets and reap
economies of scale. There is a task for the AU to play a more active role in the realisation of a CMAP as
progress has been limited since the idea emerged in 2001.
18 See the website of ReSAKSS for an overview of the process: http://www.resakss.org/ (18-01-11)
18
10 Conclusions and Further Research The objective of this study was to shed light on the linkages between regional integration and food
security in Africa. For this purpose, an overview is presented on the present state of African regional
integration and the determinants of regional trade in agriculture and food commodities. In particular the
study focuses on eight target countries, related RIAs and a set of strategic food commodities.
More and better regional integration can improve food security in Africa. Increasing trade in agriculture
and food products as well as closer cooperation between African countries to facilitate regional value
chains have the potential to decrease the price and availability of food and stimulate agricultural
development. Both will result in the alleviation of hunger and food insecurity.
Regional integration has been on the agenda of African countries for a long time. This is clearly
evidenced by the signing of the Abuja Treaty in 1991 to establish an African common market – the
African Economic Community. The evidence presented in this study shows that African countries have
made progress in opening up agriculture and food trade with member countries in the context of RIAs.
With, the exception of Ghana, Tanzania and Mozambique, the effective applied tariff rates for regional
trade partners are substantially lower than the (MFN) rates applied to world trade partners.
Furthermore, as part of some RIAs, African countries have agreed to develop regional food and
agricultural policies to stimulate regional agricultural growth. Also a positive step towards Pan-African
integration is the recent agreement between COMESA, EAC and SADC to create and African Free Trade
Area.
Nonetheless, regional trade in agriculture and food only increased marginally between 1990 and 2009,
and is relatively low in comparison with other developing regions. The weak state of soft and hard
infrastructure, rather than high trade tariffs, seem to be the cause of this. The relatively low figures
show that there are still opportunities to deepen integration and expand trade in food and agriculture.
This will have positive implications for food security on the continent. To achieve this, both the African
Union and regional bodies need to play an important role. The implementation of CAADP and the plan for
the creation of an African common market for agricultural products are important Pan-African initiatives
that will enhance food security and promote agricultural development in the long run if they are
implemented well.
Some suggestions for future research are:
• Detailed country and/or regional case studies. This study has sketched a broad picture of RIAs
in Africa and the links with food security. It would be useful to undertake more in-depth studies
to reveal country and regional specific factors that prevent or foster regional trade in agriculture
and food (e.g. non-trade barriers, the existence of local (informal) food markets, food products
that are particular to the region such as sorghum and cassava).
• Analysis of the impact of CAADP on regional trade and food security. CAADP is the core program
of the African Union to stimulate agricultural growth. It would be interesting to see if it already
generated impact and if the Netherlands can play a role in its implementation.
• Analysis of the impact of the food crisis on regional integration and food policies. Recent
research points out that many African countries reacted to the rise in food prices by various
policy actions, including tariff reductions, export bans, production support and cash transfers
(Abbott & de Battisti 2009). Some of these policies run counter to the process of regional
integration. A possible research project could be to examine how these policy reactions affected
regional integration and what would be appropriate regional (trade) policies to mitigate the
impact a rise in world food prices.
• Review of empirical research on the effects of RIAs on agriculture and food trade plus possible
new estimations for Africa. This study found only a handful of studies that have analysed the
impact of signing a RIA on the trade in agriculture and food commodities in Africa. It would be
interesting to do an extensive literature survey, review similar articles for other continents and
provide new up to date estimations. Another possibility is to simulate the impact of RIAs, for
example the implementation of an African common market for agricultural products, by means
of CGE models.
19
11 References Abbott, P.C. & de Battisti, A.B., 2009. Recent Global Food Price Shocks: Causes, Consequences and Lessons for
African Governments and Donor. Confronting Food Price Inflation: Implications for Agricultural Trade and Policies.
Baldwin, R.E. & Venables, A.J., 1995. Chapter 31 Regional economic integration. In Elsevier, pp. 1597-1644.
Available at: http://www.sciencedirect.com/science/article/B7P5T-4FKY233-C/2/2ef3495fc654d120fa33062828983ddc [Accessed January 25, 2011].
Cervantes-Godoy, D. & Dewbre, J., 2010. Economic Importance of Agriculture for Poverty Reduction, OECD
Publishing. Available at: http://ideas.repec.org/p/oec/agraaa/23-en.html [Accessed January 24, 2011].
FAO, 2010. The State of Food Insecurity in the World: Addressing food insecurity in protracted crises, Rome:
Food and Agriculture Organisation of the United Nations. FAO, 2008. Towards an African common market for agricultural products, Rome: Food and Agriculture
Organisation of the United Nations. FAO, 2003. Trade Reforms and Food Security: Conceptualizing the Linkages, Rome: Food and Agriculture
Organisation of the United Nations. Grant, J.H. & Lambert, D.M., 2005. Regionalism in world agricultural trade: Lessons from gravity model
estimation. In Proceeding of the American Agricultural Economics Association Annual Meeting, July. pp. 24–27.
Grossman, G.M. & Helpman, E., 1995. Chapter 25 Technology and trade. In Elsevier, pp. 1279-1337. Available
at:http://www.sciencedirect.com/science/article/B7P5T-4FKY233-5/2/161ba590f3073bd21435e2fd6c9eb3b0 [Accessed January 24, 2011].
Headey, D., Rethinking the global food crisis: The role of trade shocks. Food Policy, In Press, Corrected Proof.
Available at: http://www.sciencedirect.com/science/article/B6VCB-51BX6NC-2/2/5bc7af9d026ea0699c900929b88cc02a.
Headey, D. & Fan, S., 2008. Anatomy of a crisis: the causes and consequences of surging food prices.
Agricultural Economics, 39, 375-391. Jane Korinek & Mark Melatos, 2009. Trade Impacts of Selected Regional Trade Agreements in Agriculture,
OECD, Trade Directorate. Available at: http://ideas.repec.org/p/oec/traaab/87-en.html [Accessed January 7, 2011].
Ng, F. & Aksoy, M.A., 2008. Who are the net food importing countries?, Available at:
http://econ.worldbank.org/external/default/main?pagePK=64165259&piPK=64165421&theSitePK=469372&menuPK=64216926&entityID=000158349_20080102095804.
Nin-Pratt, A., Diao, X. & Bahta, Y., 2008. Assessing Potential Welfare Impacts on Agriculture of a Regional Free
Trade Agreement in Southern Africa, ReSAKSS Working Paper, 15. Rutten, M., 2010. Bilateral free trade agreements: Prospects for the EU, the Netherlands and the Dutch
agribusiness. Seck, A. et al., 2010. How Important Are Non-Tariff Barriers to Agricultural Trade within ECOWAS? Working
Papers. UNCTAD, 2009. Economic Development in Africa Report 2009: Strengthening Regional Economic Integration
for Africa' Development, New York and Geneva. UNECA, 2009. Developing African Agriculture through Regional Value Chains, Addis Ababa: United Nations
Economic Commission for Africa. UNESCAP, 2010. Trade statistics in policy making: A handbook of commonly used trade indices and indicators
Revised Edition., Bangkok: United Nations Economic and Social Commission for Asia and the Pacific. World Bank, 2007. World development report 2008: Agriculture for development, Washington, DC: World
Bank. WTO, 2006. Trade Policy Review: East African Community, World Trade Organisation.
20
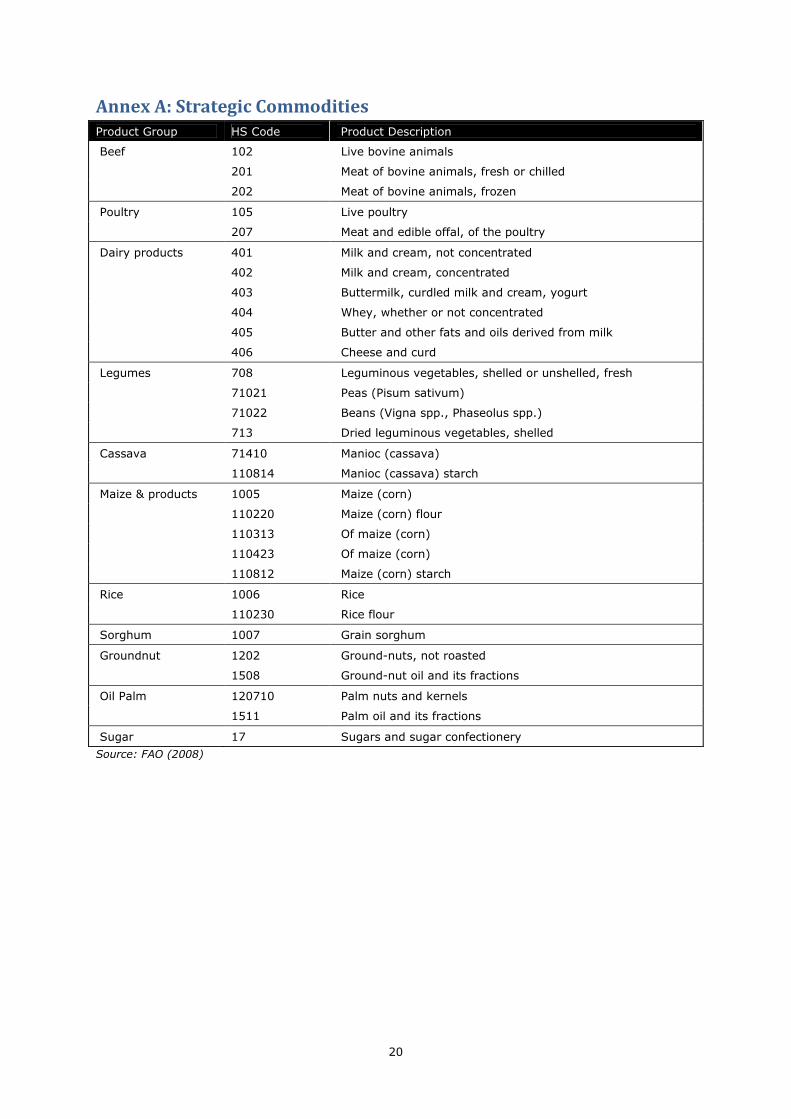
Annex A: Strategic Commodities
Product Group HS Code Product Description
Beef 102 Live bovine animals
201 Meat of bovine animals, fresh or chilled
202 Meat of bovine animals, frozen
Poultry 105 Live poultry
207 Meat and edible offal, of the poultry
Dairy products 401 Milk and cream, not concentrated
402 Milk and cream, concentrated
403 Buttermilk, curdled milk and cream, yogurt
404 Whey, whether or not concentrated
405 Butter and other fats and oils derived from milk
406 Cheese and curd
Legumes 708 Leguminous vegetables, shelled or unshelled, fresh
71021 Peas (Pisum sativum)
71022 Beans (Vigna spp., Phaseolus spp.)
713 Dried leguminous vegetables, shelled
Cassava 71410 Manioc (cassava)
110814 Manioc (cassava) starch
Maize & products 1005 Maize (corn)
110220 Maize (corn) flour
110313 Of maize (corn)
110423 Of maize (corn)
110812 Maize (corn) starch
Rice 1006 Rice
110230 Rice flour
Sorghum 1007 Grain sorghum
Groundnut 1202 Ground-nuts, not roasted
1508 Ground-nut oil and its fractions
Oil Palm 120710 Palm nuts and kernels
1511 Palm oil and its fractions
Sugar 17 Sugars and sugar confectionery
Source: FAO (2008)
21
Annex B: Tariff data for Target Countries Table 6: Effective Applied Tariffs Ghana, 2009
Product Group HS Code Product Description World ECOWAS
Beef 102 Live bovine animals 0.0 0.0
201 Meat of bovine animals, fresh or chilled 20.0 -
202 Meat of bovine animals, frozen 19.5 0.0
Poultry 105 Live poultry 0.0 -
207 Meat and edible offal, of the poultry 19.4 0.0
Dairy products 401 Milk and cream, not concentrated 20.0 -
402 Milk and cream, concentrated 20.0 20.0
403 Buttermilk, curdled milk and cream, yogurt 20.0 20.0
404 Whey, whether or not concentrated 20.0 -
405 Butter and other fats and oils derived from milk 20.0 -
406 Cheese and curd 20.0 20.0
Legumes 708 Leguminous vegetables, shelled or unshelled, fresh 18.7 0.0
71021 Peas (Pisum sativum) 20.0 -
71022 Beans (Vigna spp., Phaseolus spp.) 20.0 -
713 Dried leguminous vegetables, shelled 19.0 0.0
Cassava 110814 Manioc (cassava) starch 10.0
Maize & products 1005 Maize (corn) 14.3 0.0
110220 Maize (corn) flour 20.0 -
110313 Of maize (corn) 20.0 -
110423 Of maize (corn) 20.0 20.0
110812 Maize (corn) starch 10.0 -
Rice 1006 Rice 16.6 0.0
110230 Rice flour 20.0 20.0
Sorghum 1007 Grain sorghum 20.0 -
Groundnut 1202 Ground-nuts, not roasted 10.0 10.0
1508 Ground-nut oil and its fractions 20.0 -
Oil Palm 120710 Palm nuts and kernels 10.0 -
1511 Palm oil and its fractions 18.8 17.5
Sugar 17 Sugars and sugar confectionery 13.9 13.3
Strategic commodities 17.8 12.3
Agriculture 18.1 10.4
Note: Strategic Commodities drawn from FAO (2008). Agriculture based on WTO definition. Data for some
strategic commodities not presented due to lack of data or non-existent tariff line. Figures are simple
(unweighted) averages.
Source: UNCTAD TRAINS in WITS.
22
Table 7: Effective Applied Tariffs Kenya, 2009
Product Group HS Code Product Description World COMESA EAC IGAD
Beef 202 Meat of bovine animals, frozen 25.0 - - -
Poultry 105 Live poultry 25.0 - - -
207 Meat and edible offal, of the poultry 9.4 0.0 0.0 0.0
Dairy products 401 Milk and cream, not concentrated 25.0 - - -
402 Milk and cream, concentrated 25.7 0.0 0.0 0.0
403 Buttermilk, curdled milk and cream, yogurt 58.1 0.0 0.0 0.0
404 Whey, whether or not concentrated 22.7 0.0 0.0 0.0
405 Butter and other fats and oils derived from milk 25.0 - - -
406 Cheese and curd 19.4 0.0 0.0 0.0
Legumes 708 Leguminous vegetables, shelled or unshelled, fresh 25.0 - - -
71021 Peas (Pisum sativum) 9.4 0.0 0.0 0.0
71022 Beans (Vigna spp., Phaseolus spp.) 0.0 - 0.0 -
713 Dried leguminous vegetables, shelled 16.7 - 0.0 -
Cassava 71410 Manioc (cassava) 15.2 1.1 0.0 1.3
110814 Manioc (cassava) starch 0.0 0.0 0.0 0.0
Maize & products 1005 Maize (corn) 10.0 - - -
110220 Maize (corn) flour 26.7 0.0 0.0 0.0
110313 Of maize (corn) 50.0 - - -
110423 Of maize (corn) 25.0 - - -
110812 Maize (corn) starch 25.0 - - -
Rice 1006 Rice 10.0 - - -
110230 Rice flour 0.0 0.0 0.0 0.0
Groundnut 1202 Ground-nuts, not roasted 0.0 0.0 0.0 0.0
1508 Ground-nut oil and its fractions 1.7 0.0 0.0 0.0
Oil Palm 120710 Palm nuts and kernels 25.0 - - -
Sugar 17 Sugars and sugar confectionery 7.5 0.0 0.0 0.0
Total strategic commodities 15.1 0.5 0.0 0.0
Agriculture 21.3 0.4 0.0 0.5
Note: Strategic Commodities drawn from FAO (2008). Agriculture based on WTO definition. Data for some
strategic commodities not presented due to lack of data or non-existent tariff line. Figures are simple
(unweighted) averages.
Source: UNCTAD TRAINS in WITS.
23
Table 8: Effective Applied Tariffs Mozambique, 2009
Product Group HS Code Product Description World SADC
Beef 102 Live bovine animals
3.8
201 Meat of bovine animals, fresh or chilled
10.0
10.0
202 Meat of bovine animals, frozen
15.7
10.0
Poultry 105 Live poultry
2.9
207 Meat and edible offal, of the poultry
17.3
15.0
Dairy products 401 Milk and cream, not concentrated
12.2
7.5
402 Milk and cream, concentrated
12.1
11.9
403 Buttermilk, curdled milk and cream, yogurt
12.5 -
404 Whey, whether or not concentrated
2.5 -
405 Butter and other fats and oils derived from milk
7.1 -
406 Cheese and curd
15.3
13.4
Legumes 708 Leguminous vegetables, shelled or unshelled, fresh
17.0
15.0
71021 Peas (Pisum sativum)
10.0 -
71022 Beans (Vigna spp., Phaseolus spp.)
10.0 -
713 Dried leguminous vegetables, shelled
5.6 -
Maize & products 1005 Maize (corn)
0.8 -
110220 Maize (corn) flour
18.8
15.0
110313 Of maize (corn)
5.0 -
110423 Of maize (corn)
3.8 -
110812 Maize (corn) starch
3.8 -
Rice 1006 Rice
3.9 -
Groundnut 1202 Ground-nuts, not roasted
3.8 -
1508 Ground-nut oil and its fractions
15.0
15.0
Oil Palm 120710 Palm nuts and kernels
10.7
5.9
1511 Palm oil and its fractions
14.4
15.0
Sugar 17 Sugars and sugar confectionery
10.5
3.8
Total strategic commodities
10.7
5.9
Agriculture
9.6
2.5
Note: Strategic Commodities drawn from FAO (2008). Agriculture based on WTO definition. Data for some
strategic commodities not presented due to lack of data or non-existent tariff line. Figures are simple
(unweighted) averages.
Source: UNCTAD TRAINS in WITS.
24
Table 9: Effective Applied Tariffs Rwanda, 2009
Product Group HS Code Product Description World COMESA EAC
Beef 102 Live bovine animals 0.0 0.0 0.0
201 Meat of bovine animals, fresh or chilled 25.0 - -
202 Meat of bovine animals, frozen 8.3 0.0 0.0
Poultry 105 Live poultry 3.1 0.0 0.0
207 Meat and edible offal, of the poultry 10.0 0.0 0.0
Dairy products 401 Milk and cream, not concentrated 15.0 0.0 0.0
402 Milk and cream, concentrated 37.5 8.6 0.0
403 Buttermilk, curdled milk and cream, yogurt 16.7 0.0 0.0
404 Whey, whether or not concentrated 25.0 - -
405 Butter and other fats and oils derived from milk 14.3 0.0 0.0
406 Cheese and curd 18.4 0.0 0.0
Legumes 708 Leguminous vegetables, shelled or unshelled, fresh 0.0 0.0 0.0
71022 Beans (Vigna spp., Phaseolus spp.) 0.0 0.0 0.0
713 Dried leguminous vegetables, shelled 9.4 0.0 0.0
Cassava 71410 Manioc (cassava) 0.0 0.0 0.0
110814 Manioc (cassava) starch 0.0 - 0.0
Maize & products 1005 Maize (corn) 0.0 0.0 0.0
110220 Maize (corn) flour 12.5 0.0 0.0
110313 Of maize (corn) 0.0 - 0.0
110812 Maize (corn) starch 0.0 0.0 0.0
Rice 1006 Rice 0.0 0.0 0.0
Sorghum 1007 Grain sorghum 0.0 0.0 0.0
Groundnut 1202 Ground-nuts, not roasted 0.0 0.0 0.0
1508 Ground-nut oil and its fractions 12.5 - 0.0
1511 Palm oil and its fractions 6.4 2.3 0.0
Sugar 17 Sugars and sugar confectionery 13.5 2.8 0.0
Total strategic commodities 14.7 1.7 0.0
Agriculture 12.7 1.4 0.0
Note: Strategic Commodities drawn from FAO (2008). Agriculture based on WTO definition. Data for some
strategic commodities not presented due to lack of data or non-existent tariff line. Figures are simple
(unweighted) averages.
Source: UNCTAD TRAINS in WITS.
25
Table 10: Effective Applied Tariffs South Africa, 2009
Product Group HS Code Product Description World SADC
Beef 102 Live bovine animals 0.0 -
201 Meat of bovine animals, fresh or chilled 26.7 0.0
202 Meat of bovine animals, frozen 36.7 0.0
Poultry 105 Live poultry 0.0 -
207 Meat and edible offal, of the poultry 4.9 -
Dairy products 401 Milk and cream, not concentrated 0.0 0.0
403 Buttermilk, curdled milk and cream, yogurt 0.0 0.0
Legumes 708 Leguminous vegetables, shelled or unshelled, fresh 3.0 0.0
71021 Peas (Pisum sativum) 7.8 0.0
71022 Beans (Vigna spp., Phaseolus spp.) 7.9 -
713 Dried leguminous vegetables, shelled 7.0 0.0
Cassava 71410 Manioc (cassava) 1.9 -
110814 Manioc (cassava) starch 4.4 -
Maize & products 1005 Maize (corn) 0.0 0.0
110220 Maize (corn) flour 0.0 0.0
110313 Of maize (corn) 5.0 -
110423 Of maize (corn) 5.0 -
110812 Maize (corn) starch 3.4 0.0
Rice 1006 Rice 0.0 0.0
Sorghum 1007 Grain sorghum 1.5 -
Groundnut 1202 Ground-nuts, not roasted 6.1 0.0
1508 Ground-nut oil and its fractions 5.9 -
1511 Palm oil and its fractions 7.4 0.0
Sugar 17 Sugars and sugar confectionery 12.6 0.0
Total strategic commodities 8.2 0.0
Agriculture 7.1 0.0
Note: Strategic Commodities drawn from FAO (2008). Agriculture based on WTO definition. Data for some
strategic commodities not presented due to lack of data or non-existent tariff line. Figures are simple
(unweighted) averages.
Source: UNCTAD TRAINS in WITS.
26
Table 11: Effective Applied Tariffs Sudan, 2009
Product Group HS Code Product Description World COMESA IGAD
Beef 102 Live bovine animals 9.0 - -
201 Meat of bovine animals, fresh or chilled 26.0 - -
202 Meat of bovine animals, frozen 12.0 - -
Poultry 105 Live poultry 1.0 - -
207 Meat and edible offal, of the poultry 16.7 - -
Dairy products 401 Milk and cream, not concentrated 18.0 0.0 -
402 Milk and cream, concentrated 26.8 2.8 7.0
403 Buttermilk, curdled milk and cream, yogurt 23.0 0.0 -
404 Whey, whether or not concentrated 9.0 0.0 -
405 Butter and other fats and oils derived from milk 15.6 0.0 -
406 Cheese and curd 16.0 2.0 -
Legumes 708 Leguminous vegetables, shelled or unshelled, fresh 20.0 0.0 -
713 Dried leguminous vegetables, shelled 5.4 1.4 5.0
Maize & products 1005 Maize (corn) 13.6 0.0 -
110220 Maize (corn) flour 9.0 - -
110313 Of maize (corn) 14.5 0.0 -
110423 Of maize (corn) 4.5 0.0 -
110812 Maize (corn) starch 0.0 - -
Rice 1006 Rice 0.0 0.0 0.0
Sorghum 1007 Grain sorghum 0.0 0.0 -
Groundnut 1202 Ground-nuts, not roasted 30.0 - -
1508 Ground-nut oil and its fractions 26.7 0.0 -
1511 Palm oil and its fractions 15.2 0.0 -
Sugar 17 Sugars and sugar confectionery 15.9 0.2 0.0
Total strategic commodities 16.8 0.8 4.3
Agriculture 17.6 0.7 2.4
Note: Strategic Commodities drawn from FAO (2008). Agriculture based on WTO definition. Data for some
strategic commodities not presented due to lack of data or non-existent tariff line. Figures are simple
(unweighted) averages.
Source: UNCTAD TRAINS in WITS.
27
Table 12: Effective Applied Tariffs Tanzania, 2009
Product Group HS Code Product Description World EAC SADC
Beef 102 Live bovine animals 0.0 0.0 -
201 Meat of bovine animals, fresh or chilled 25.0 - 25.0
202 Meat of bovine animals, frozen 14.3 0.0 25.0
Poultry 105 Live poultry 12.5 0.0 17.9
207 Meat and edible offal, of the poultry 16.7 0.0 25.0
Dairy products 401 Milk and cream, not concentrated 42.9 0.0 60.0
402 Milk and cream, concentrated 48.4 0.0 60.0
403 Buttermilk, curdled milk and cream, yogurt 17.9 0.0 25.0
404 Whey, whether or not concentrated 25.0 - -
405 Butter and other fats and oils derived from milk 15.0 0.0 25.0
406 Cheese and curd 24.0 0.0 25.0
Legumes 708 Leguminous vegetables, shelled or unshelled, fresh 25.0 - 25.0
71021 Peas (Pisum sativum) 25.0 - 25.0
71022 Beans (Vigna spp., Phaseolus spp.) 12.5 0.0 25.0
713 Dried leguminous vegetables, shelled 22.8 0.0 25.0
110814 Manioc (cassava) starch 10.0 - -
Maize & products 1005 Maize (corn) 25.0 0.0 35.0
110220 Maize (corn) flour 16.7 0.0 50.0
110313 Of maize (corn) 18.8 0.0 25.0
110423 Of maize (corn) 25.0 - 25.0
110812 Maize (corn) starch 8.6 0.0 10.0
Rice 1006 Rice 0.0 0.0 -
Sorghum 1007 Grain sorghum 25.0 - -
Groundnut 1202 Ground-nuts, not roasted 10.0 - 10.0
1508 Ground-nut oil and its fractions 0.0 - -
1511 Palm oil and its fractions 7.0 0.0 -
Sugar 17 Sugars and sugar confectionery 17.7 0.0 21.9
Total strategic commodities 23.4 0.0 29.2
Agriculture 18.8 0.0 22.5
Note: Strategic Commodities drawn from FAO (2008). Agriculture based on WTO definition. Data for some
strategic commodities not presented due to lack of data or non-existent tariff line. Figures are simple
(unweighted) averages.
Source: UNCTAD TRAINS in WITS.
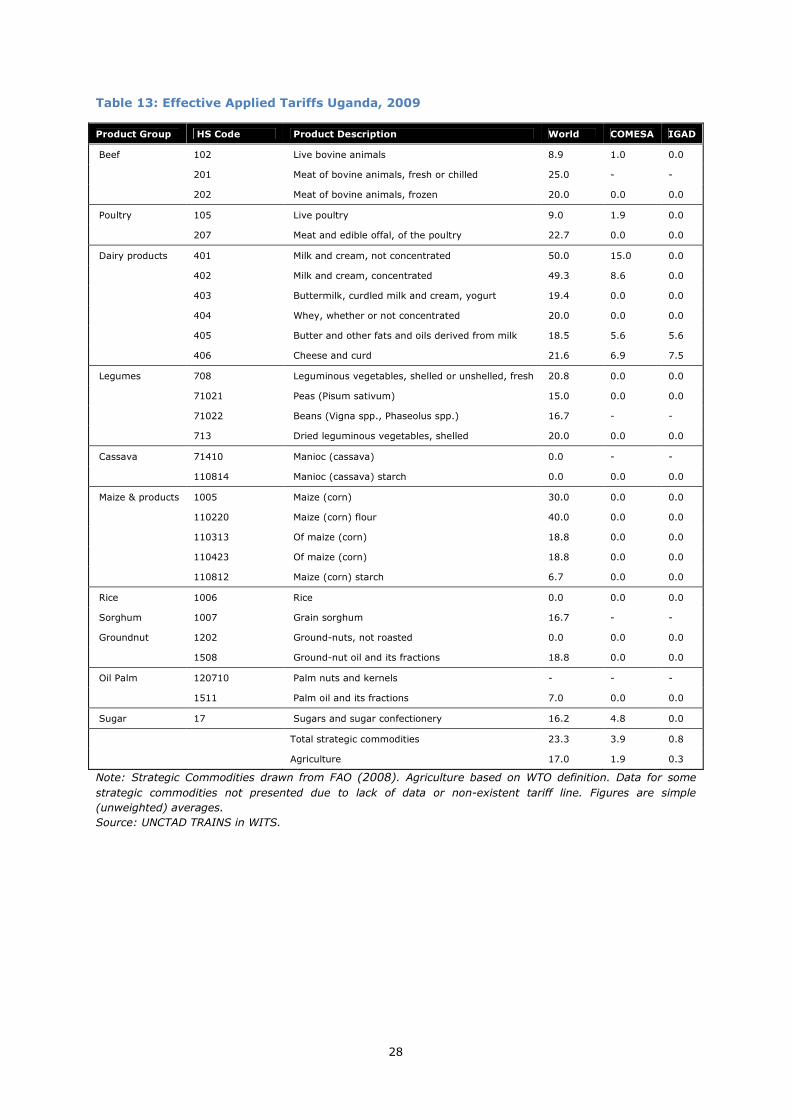
28
Table 13: Effective Applied Tariffs Uganda, 2009
Product Group HS Code Product Description World COMESA IGAD
Beef 102 Live bovine animals 8.9 1.0 0.0
201 Meat of bovine animals, fresh or chilled 25.0 - -
202 Meat of bovine animals, frozen 20.0 0.0 0.0
Poultry 105 Live poultry 9.0 1.9 0.0
207 Meat and edible offal, of the poultry 22.7 0.0 0.0
Dairy products 401 Milk and cream, not concentrated 50.0 15.0 0.0
402 Milk and cream, concentrated 49.3 8.6 0.0
403 Buttermilk, curdled milk and cream, yogurt 19.4 0.0 0.0
404 Whey, whether or not concentrated 20.0 0.0 0.0
405 Butter and other fats and oils derived from milk 18.5 5.6 5.6
406 Cheese and curd 21.6 6.9 7.5
Legumes 708 Leguminous vegetables, shelled or unshelled, fresh 20.8 0.0 0.0
71021 Peas (Pisum sativum) 15.0 0.0 0.0
71022 Beans (Vigna spp., Phaseolus spp.) 16.7 - -
713 Dried leguminous vegetables, shelled 20.0 0.0 0.0
Cassava 71410 Manioc (cassava) 0.0 - -
110814 Manioc (cassava) starch 0.0 0.0 0.0
Maize & products 1005 Maize (corn) 30.0 0.0 0.0
110220 Maize (corn) flour 40.0 0.0 0.0
110313 Of maize (corn) 18.8 0.0 0.0
110423 Of maize (corn) 18.8 0.0 0.0
110812 Maize (corn) starch 6.7 0.0 0.0
Rice 1006 Rice 0.0 0.0 0.0
Sorghum 1007 Grain sorghum 16.7 - -
Groundnut 1202 Ground-nuts, not roasted 0.0 0.0 0.0
1508 Ground-nut oil and its fractions 18.8 0.0 0.0
Oil Palm 120710 Palm nuts and kernels - - -
1511 Palm oil and its fractions 7.0 0.0 0.0
Sugar 17 Sugars and sugar confectionery 16.2 4.8 0.0
Total strategic commodities 23.3 3.9 0.8
Agriculture 17.0 1.9 0.3
Note: Strategic Commodities drawn from FAO (2008). Agriculture based on WTO definition. Data for some
strategic commodities not presented due to lack of data or non-existent tariff line. Figures are simple
(unweighted) averages.
Source: UNCTAD TRAINS in WITS.
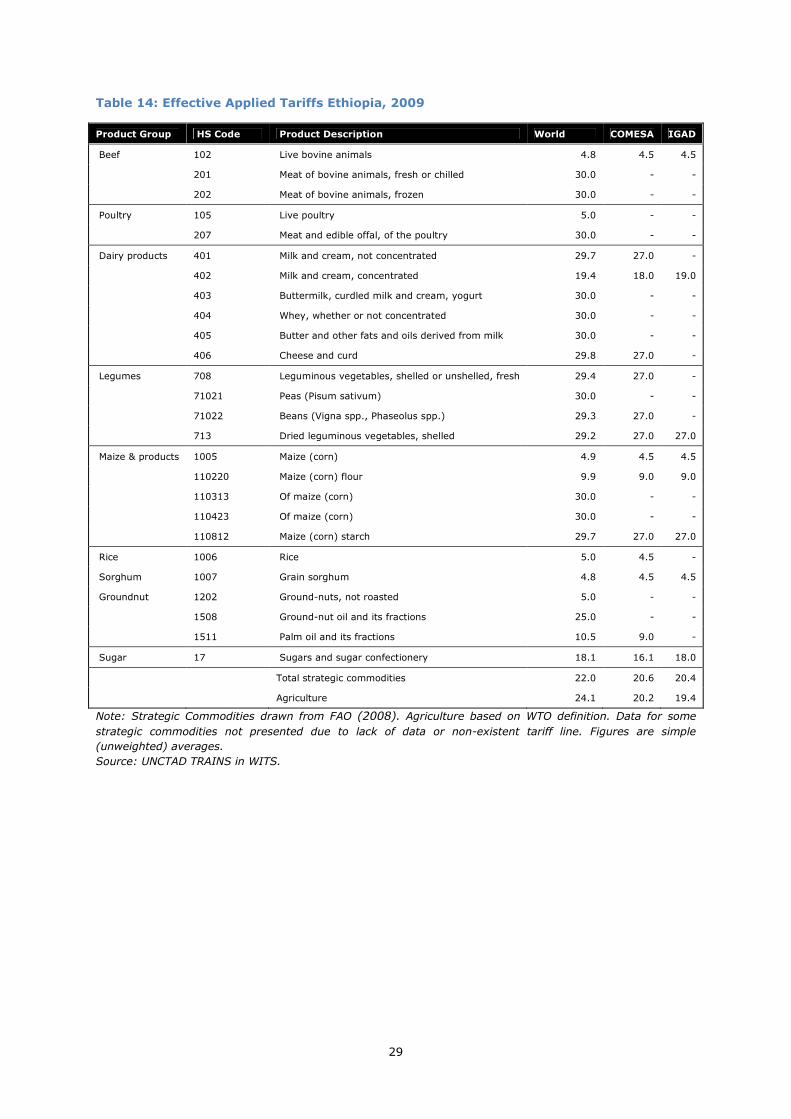
29
Table 14: Effective Applied Tariffs Ethiopia, 2009
Product Group HS Code Product Description World COMESA IGAD
Beef 102 Live bovine animals 4.8 4.5 4.5
201 Meat of bovine animals, fresh or chilled 30.0 - -
202 Meat of bovine animals, frozen 30.0 - -
Poultry 105 Live poultry 5.0 - -
207 Meat and edible offal, of the poultry 30.0 - -
Dairy products 401 Milk and cream, not concentrated 29.7 27.0 -
402 Milk and cream, concentrated 19.4 18.0 19.0
403 Buttermilk, curdled milk and cream, yogurt 30.0 - -
404 Whey, whether or not concentrated 30.0 - -
405 Butter and other fats and oils derived from milk 30.0 - -
406 Cheese and curd 29.8 27.0 -
Legumes 708 Leguminous vegetables, shelled or unshelled, fresh 29.4 27.0 -
71021 Peas (Pisum sativum) 30.0 - -
71022 Beans (Vigna spp., Phaseolus spp.) 29.3 27.0 -
713 Dried leguminous vegetables, shelled 29.2 27.0 27.0
Maize & products 1005 Maize (corn) 4.9 4.5 4.5
110220 Maize (corn) flour 9.9 9.0 9.0
110313 Of maize (corn) 30.0 - -
110423 Of maize (corn) 30.0 - -
110812 Maize (corn) starch 29.7 27.0 27.0
Rice 1006 Rice 5.0 4.5 -
Sorghum 1007 Grain sorghum 4.8 4.5 4.5
Groundnut 1202 Ground-nuts, not roasted 5.0 - -
1508 Ground-nut oil and its fractions 25.0 - -
1511 Palm oil and its fractions 10.5 9.0 -
Sugar 17 Sugars and sugar confectionery 18.1 16.1 18.0
Total strategic commodities 22.0 20.6 20.4
Agriculture 24.1 20.2 19.4
Note: Strategic Commodities drawn from FAO (2008). Agriculture based on WTO definition. Data for some
strategic commodities not presented due to lack of data or non-existent tariff line. Figures are simple
(unweighted) averages.
Source: UNCTAD TRAINS in WITS.