Embed Size (px)
Citation preview
African Trade Report2018
African Export-Import BankBanque Africaine D’Import-Export
Transforming Africa’s Trade
Boosting Intra-African Trade: Implications of the African Continental Free Trade Area Agreement

© Copyright Afreximbank, Cairo 2018. All rights reserved
No part of this publication may be reproduced or transmitted, in any form or by any means, electronic, mechanical, photocopying, recording or otherwise or stored in any retrieval system of any nature without the prior, written permission of the African Export-Import Bank, application for which shall be made to the Bank.
ISBN 978-92-95097-39-1
HEAD OFFICE African Export-Import Bank 72(B) El Maahad El Eshteraky Street Heliopolis, Cairo 11341 P O Box 613 Heliopolis Cairo 11757, Egypt Tel: +202 24564100/1/2/3 Email. [email protected] Website: www.afreximbank.com
Boosting Intra-African Trade: Implications of the African Continental Free Trade Area Agreement
AFRICAN TRADE REPORT 2018
4 AFREXIMBANK AFRICAN TRADE REPORT 2018
Foreword
The 2018 edition of the African Export-Import Bank’s annual flagship report—the African Trade Report— titled “Boosting Intra-African Trade: Implications of the African Continental Free Trade Area Agreement” (the “Report”) has been prepared at a time when concerted efforts are being made across the continent by both sovereign and corporate entities to deepen economic integration and boost intra-regional trade and cross-border investments. The report provides an important insight on the potential benefits of the AfCFTA Agreement in terms of growth, diversification of sources of growth and exports, development of global value chain, but also in terms of integration of African countries into the global economy. In particular, the analysis carried out shows that a complete tariff removal coupled with significant reduction in non-tariff barriers could lift economic growth and raise the volume of exports and imports while significantly improving the terms of trade across Africa.
The Report also undertakes a review of policy options and measures that could ensure a successful implementation of the AfCFTA Agreement and enhance the bargaining power of African sovereign entities in international trade negotiations. In particular, it is argued that transcending institutional and non-tariff barriers associated with national constructs to embrace shared institutions will enable countries to draw on economies of scale to increase efficiency and competitiveness while internalizing the costs emanating from negative externalities. At the same time, achieving higher growth and a trade development impact under the AfCFTA will depend on the commitment and steps taken by countries to eliminate non-tariff barriers, speed up the development and modernization of infrastructure, especially trade-enabling infrastructure, and raise the level of resources allocated to the financing of intra-African trade.
The 2018 edition of the African Trade Report also provides a comprehensive analysis of the state of global and African trade in 2017. After falling below parity in 2016, the lowest in 15 years, the ratio of trade growth to GDP growth rose to 1.5 in 2017, reflecting the strengthening of global trade. In the midst of that favorable environment of growth acceleration and global trade expansion, Africa’s total merchandise trade gathered momentum growing much faster than the world average, driven by a recovery in commodity prices and strengthening cross-border investment.
AFREXIMBANK AFRICAN TRADE REPORT 2018 5
Furthermore, the Report provides a comprehensive analysis of the dynamics of intra-African trade, both at a regional and national levels as well as the composition of intra-African trade by products and sectors. Industrial products and manufactured goods continue to account for the lion’s share of intra-African trade. At the same time, and interestingly, manufactured products traded within the continent are increasingly dominated by medium to high-skill technology-intensive manufactures.
Looking ahead, Africa is expected to remain on a strong economic growth path, with improving trade performance in 2018 and beyond, riding on the global momentum of synchronized global growth led by increased investment and fiscal expansion. However, in the medium term, downside risks to global growth and trade include a contraction in global demand, especially if the ongoing transition and rebalancing in China leads to acute growth deceleration; sharp tightening of financial conditions could further stress highly-indebted sovereigns and corporates and, in the process, affect business confidence and investment decisions; and the rise of protectionist policies, most notably reflected in the escalating cycle of trade restrictions and retaliations, could derail the current growth momentum. To mitigate the adverse effects of these risks on African trade and growth, the Report argues in favour of a speedy implementation of the African Continental Free Trade Area which has the potential to significantly boost intra-African trade and accelerate the process of diversification of sources of growth and trade.
The Report has been prepared by Afreximbank Research and International Cooperation Department, with consultancy support from African Finance and Economic Consult (AFEC). I hope all readers will find the contents as useful as I did.
Dr. Benedict O. Oramah President and Chairman of the Board of Directors The African Export-Import Bank Cairo, Egypt July 2018
Table of Contents
Chapter 1. Introduction and Executive Summary 8
Chapter 2. Boosting Intra-African Trade: Implications of the AfCFTA Agreement 142. 1 The Intra-African Trade Landscape 152.2 Africa’s Export Structure and the AfCFTA 162.3 Economic Impact of the AfCFTA 202. 4 Policy Framework and Conditions for Success 252. 4.1 Infrastructure and logistics: Role of development finance institutions 252. 4.2 Strong regional value chains 262. 5 Implications 27
Chapter 3. The Operating Environment 303.1 The Global Economic Environment 313.1.1 Output Development 313.1.2 Price Developments 333.2 Output and Price Developments in Africa 333.2.1 Output Development 333.2.1.1 Regional Variations 353.2.2 Price Developments 363.3 International Financial Markets and Financing Conditions 38
Chapter 4. Trade and the Trading Environment 424.1 Global Trade 434.2 Global Trade Environment 444.3 African External Reserves and Exchange Rate Developments 514.4 Africa’s Trade 55
Chapter 5. Dynamics in Commodity Markets 62
Chapter 6. Intra-African Trade 766.1 Intra-African Trade Champions 826.2 Intra-African Trade Developments for Selected Countries 856.3 Emerging Trends in Intra-African Trade 87
Chapter 7. Potential Implications of the CFTA for Intra-African Trade 887. 1 Introduction 897. 2 The Nature of Trade among African Countries 937. 3 Potential Implications of the AfCFTA for Intra-African Trade 97
Chapter 8. Prospects 104
Endnotes and References 107

1Chapter One
AFREXIMBANK AFRICAN TRADE REPORT 2018 9
Introduction and Executive Summary
The African Export-Import Bank’s 2018 African Trade Report (the Report) reviews major developments in African trade and key global and African socioeconomic developments during 2017. It is produced as the global economy enters a recovery phase characterised by synchronised growth acceleration in both developed and developing economies following cyclical upswings in Europe and a growth re-acceleration in China. This process of economic recovery which started in mid-2016 firmed up in 2017 with global GDP expanding by 3.7 percent in 2017, up from 3.2 percent in 2016. The broad-based growth and strong global output also reflected stronger growth in domestic demand in advanced economies and in China. And it reflected the continuing recovery in global investment, which spurred stronger manufacturing activity, as well as strong pick-up in trade on the back of a recovery in commodity markets.
Consistent with these developments, Africa’s economic activity rebounded, with output expanding by 3.7 percent in 2017, up from 2.8 percent in 2016. The growth recovery accelerated, especially among non-resource–intensive economies. The flagging economic fortunes of the continent’s two largest economies, Nigeria and South Africa, reversed. The macroeconomic fundamentals in a number of countries improved. Given the continent’s exposure
to adverse terms of trade and commodity price shocks, the recovery was supported by the strategic shift towards the promotion of intra-African trade which enhances the absorptive capacity of the continent and mitigates its exposure to global volatility. This was complemented by more policies aimed at ensuring effective adjustment to low commodity prices and the continent’s de-commoditization through increased value addition and export diversification.
Reflecting the historic move towards the adoption of the African Continental Free Trade Agreement (AfCFTA) to drive intra-African trade and the structural transformation of African economies, the main theme of the Report Boosting Intra-African Trade: Implications of the African Continental Free Trade Area Agreement, examines the broad ramifications of the recently signed trade agreement. In addition to ongoing efforts to implement the AfCFTA, the theme is also inspired by the Boosting Intra-African Trade (BIAT) action plan, which forms part of broader initiatives under the African Union’s Agenda 2063. The study notes the limited scope of intra-African trade, which at 15 percent compares unfavourably with Europe (67 percent), Asia (58 percent), North America (48 percent) and Latin America (20 percent).
Intra-African trade and industrialisation are crucial to the prosperity and inclusiveness
10 CHAPTER ONE AFRICAN TRADE REPORT 2018
agenda articulated under the African Union’s Agenda 2063 development strategy and moving away from commodity and natural resource dependence is an indicator of success and transformation under the AU Plan. It is also in line with the Bank’s Fifth Strategic Plan which emphasizes the promotion of intra-African trade as well as industrialisation and export development. Accordingly, the Report draws on the Herfindahl-Hirschmann Index (Product HHI) to help in understanding the extent of vulnerability and in designing the appropriate policy for promoting value addition and export diversification. Indeed, the AfCFTA arrangement needs to go beyond a 100 percent tariff reduction in all goods, as non-tariff barriers are also important constraints hampering welfare gains and efficiency in intra-African trade.
The analysis shows a net-gain from intra-African trade under the CFTA, but the gains are not evenly distributed across the continent, in part as a result of differences in GDP, patterns of growth and allocative efficiency in investment and savings, as well as reductions in export volumes in some sectors. So, non-tariff barriers need to be reduced and efficiency in intra-African trade increased while catering to losses in affected countries, to achieve inclusive growth and broaden support for the implementation of the AfCFTA over time.
Financial markets continue to strengthen in response to significant policy support, regulatory enhancements, the dissipating impact of the end of commodity super-cycle and synchronised broad-based growth. Markets in 2016 were plagued by uncertainty about the United Kingdom’s exit from the European Union, the ongoing geopolitical tensions in some parts of the world, the fears of a growth slowdown in China and weak commodity prices. Those concerns subsided in 2017, fuelling a rally in equity prices. Overall, financial markets showed resilience and adjusted to risks, with most major stock indices ending the
year at or near all-time highs on the back of favourable earnings prospects, gradual normalisation of monetary policy, weak inflation and expectations of low volatility.
Growth in the volume of global merchandise trade accelerated to 4.7 percent in 2017, up from 1.8 percent in 2016, driven largely by resurgent investment spending in both developed and developing economies, synchronised expansion in global output and recovery in global demand. The sustained pick-up in oil prices and other primary commodities, and the robust growth in China and recovery in other large developing economies such as Brazil and Russia, which emerged from recession also played a role.
This significant turnaround in global trade marked the end of five years of stagnation. It is also the strongest since 2011 when global trade expanded by an estimated 5.2 percent. The synchronised growth in the global economy meant that both developed and developing regions contributed to the strengthening of global trade in 2017, though developing regions remained the main drivers. Merchandise imports in developing countries, as a group, picked up to 7.2 percent in 2017, up from just about 1.9 percent in 2016, supported by strong output, particularly in Asia.
Sustained recovery in commodity prices, particularly for oil, and the resultant pick-up in export receipts in resource and commodity-dependent economies increased the reserve holdings of African countries during 2017, reversing the downward trend in the previous year. Progress continues in weaning the continent from over-dependence on commodities and the Bank, through its programmes most notably the Africa Commodities Initiative, contributes to higher value addition by supporting processing and industrial capacities in various commodity sectors in line with the second pillar of its Fifth Strategic Plan to promote industrialization and export development.
AFREXIMBANK AFRICAN TRADE REPORT 2018 11
A salient physical feature that provides a strong stimulus for enhanced intra-African trade is the number of landlocked countries on the continent. Sixteen of the 55 African countries are landlocked, relying to some degree on their coastal neighbours for extra-African trade and development using ports and shipping lines. Yet, trade among the landlocked countries and their neighbours has been low. Implementation of the AfCFTA creates opportunities for intra-African market access, and can significantly increase trade flows. Tariff removal and cost
reduction under the free trade arrangement also reduce production costs and induce economies of scale. That spurs higher domestic production and investment into different sectors of the economy. And that, in turn, enhances growth in exports across sectors and boosts value addition in production and exports, further deepening intra-industry trade across the continent. It is also likely to result in substantial change in the production landscape, especially for export products in value-added non-traditional sectors, such as textiles and
12 CHAPTER ONE AFRICAN TRADE REPORT 2018
apparel, light manufacturing and processed food.
Notwithstanding the challenging global environment characterised by increasing beggar-thy-neighbour policies, global growth is projected to strengthen to 3.9 percent in 2018, up from 3.7 percent in 2017, on the back of improving market sentiment, still-accommodative financial policies, strong global demand and synchronised output expansion in both developed and developing economies. In developed economies, growth is projected to accelerate—to 2.5 percent in 2018, from 2.2 percent in 2017. That increase is largely supported by accommodative policies, including the
spillover effects of expansionary fiscal policy in the United States and the continued easing of lending conditions by the European Central Bank, expected to cushion anticipated gradual rise in interest rates.
Growth in developing economies is projected to accelerate slightly to 4.9 percent in 2018, from 4.8 percent in 2017, on the back of strong economic performance in developing Asia led by India, and by a pickup in activity in Brazil and Russia. Growth in African economies is projected to accelerate to 4.1 percent in the 2018, up from 3.7 percent in 2017, on the back of continuing recovery in developed economies and stronger global
AFREXIMBANK AFRICAN TRADE REPORT 2017 13
demand, with positive repercussions for commodity prices and Africa’s merchandise trade in the short run. The main factors expected to accelerate economic growth on the continent are the strengthening of major oil-producing economies—especially Nigeria, Angola and Libya—combined with stronger economic growth in Egypt and an improving macroeconomic and business environment.
Growth in the volume of merchandise trade is projected to remain strong at 4.4 percent in 2018, down slightly from 4.7 percent in 2017. The continuing expansion of global trade is supported by stronger global economic growth, driven by recovery in most developed countries, especially by the strong pick-up in the United States and the expansion (though modest) in the eurozone, particularly France. Also expected to support global trade in 2018 is the projected growth acceleration in developing economies, led by India, Brazil and Russia.
While the outlook for growth in the near term is favourable, in the medium term prospects for global growth and trade could be fraught with downside risks including a contraction in global demand in a context
of tariff escalations, trade wars and capital flow reversals associated with tightening financing conditions and rising interest rates in the United States. Although these risks could derail the current growth momentum in the short term, most notably through the trade and investment channel, the adverse impacts on Africa in the medium and long term will be mitigated by the ongoing process of diversification of sources of growth and the promotion of intra-African trade.
The Report is organized in eight chapters. After this Introduction and Executive Summary, Chapter 2 covers the thematic research on “Boosting intra-African Trade: Implications of the African Continental Free Trade Area Agreement”. Chapter 3 reviews global and African economic and financial developments, while Chapter 4 discusses trade and the trading environment pertaining to both the global and African space. Chapter 5 reviews the dynamics of commodity markets. Chapter 6 discusses intra-African trade while Chapter 7 provides a comprehensive analysis of the potential implications of the AfCFTA for intra-African trade. The concluding chapter 8 reviews the prospects for global and African economic and trade developments in the near term.
END
2Chapter Two
AFREXIMBANK AFRICAN TRADE REPORT 2018 15
Boosting Intra-African Trade: Implications of the AfCFTA Agreement
2.1 The Intra-African Trade Landscape
Over the past few decades, the African continent has experienced a proliferation of sub-regional agreements, including the East African Community (EAC), the Common Market for Eastern and Southern Africa (COMESA), the Economic Community of West African States (ECOWAS) and the Southern African Development Community (SADC). That proliferation has raised concerns over the potential costs imposed by the fragmentation of the continent’s trading system into exclusive blocs, especially in a context of low intra-regional trade performance.
The continent accounts for less than 3 percent of world trade (UNCTADStats 2018). Commodities and natural resources continue to dominate Africa’s export basket, and the continent’s participation in the global value chain has been minimal. In terms of intra-African trade, Africa continues to trail other regions which have drawn on vibrant cross-border trade to sustain growth and economic development, as well as integration into the global economy. At about 15 percent, Africa compared unfavorably to Europe (68 percent), North America (37 percent), and Latin America (20 percent).
Cognizant of the importance of intra-regional trade, the 18th Ordinary Session of the Assembly of Heads of State and Governments of the African Union, held in January 2012, endorsed the framework and road map for the establishment of the African Continental Free Trade Area (AfCFTA) by an indicative date of 2017 through negotiations on the liberalization of trade in goods and services. The AfCFTA is a consolidation of the Tripartite Free Trade Area 1 and other regional free trade areas and is expected to create the largest free trade area in Africa. It covers a wide scope of formal trade measures, including Trade in Goods, Trade in Services, Investment, Intellectual Property Rights, Competition Policy, and Rules and Procedures on the Settlement of Disputes. The AfCFTA is meant to lay the foundation for the establishment of a continental customs union, which will advance regional economic integration on the continent. it fills an important lacuna in the Lagos Plan of Action and Abuja Treaty, which conceived continental integration at the level of a customs union. A continental free trade area is an important precursor and stepping-stone to the continental customs union.
Various protocols of the agreement cover legal arrangements that are meant to boost
16 CHAPTER TWO AFRICAN TRADE REPORT 2018
intra-African trade. Key among these are arrangements related to tariff and non-tariff barriers (NTBs), rules of origin, services liberalization and regulation, investment and cross-border movement of persons, and trade remedies, as well as monitoring and evaluation.
The Boosting Intra-African Trade (BIAT) Action Plan was also endorsed at the 18th Ordinary Session of the Assembly of Heads of State and Government of the African Union, in January 2012. The Action Plan aims at deepening integration and increasing the volume of intra-African trade. It highlights the constraints that encumber growth of intra-African trade and outlines policies and programmes to overcome each one. Some of the obstacles identified include differences in trade regime, inadequacies of trade-related infrastructure, trade finance and trade information, constricting customs, administrative and technical barriers, limited productive capacity, lack of factor market integration and inadequate focus on internal market issues.
Options for addressing each of these constraints are the broad focus of the BIAT Action Plan. The Action Plan also comprises proposals for accelerating the attainment of a Pan-African Free Trade Area and for developing a monitoring and evaluation mechanism to track market integration in Africa (AU 2014). To address the various constraints to the growth of intra-African trade, the BIAT Action Plan proposes seven programme clusters: trade policy, trade facilitation, productive capacity, trade-related infrastructure, trade finance, trade information and factor market integration.
Both the AfCFTA and the BIAT Action Plan form part of broader initiatives under the African Union’s Agenda 2063.2 Together, these initiatives offer a comprehensive framework to drive economic growth, industrialisation and development across Africa. The AfCFTA is a time bound project, whereas BIAT is continuous, with tangible
milestones marking progress on doubling intra-African trade flows from 2012 to 2022 (AU n.d). These two decisive initiatives by the Assembly of Heads of State and Governments of the African Union present great opportunities, as well as challenges, for boosting intra-African trade and create feasible avenues to deliver prosperity to all Africans.
The benefits of the AfCFTA, which is intended to eventually incorporate all 55 African countries with a population of 1.2 billion and a combined GDP of $2.5 billion are expected to be substantial. This study was undertaken to gain a better understanding of the potential implications of the AfCFTA for boosting intra-African trade. The Chapter provides a brief overview of the AfCFTA and its potential trade and development impact.3 The other chapters in the report present further details of how the AfCFTA could change the intra-African trade landscape.
2.2 Africa’s Export Structure and the AfCFTA
Economic openness exposes countries to negative external shocks, in the form of losses in export revenues and growth volatility (World Bank 2010, Briguglio et al. 2009). However, the extent of this vulnerability hinges on a country’s export concentration. A large proportion of African economies depend on either a single or a limited number of products for export earnings, rendering these earnings especially susceptible to fluctuations in adverse exogenous shocks. Since exports correlate positively with economic growth, volatility in export earnings would imply fluctuations in economic fortunes. The volatility of a country’s export earnings and rates of economic growth are directly related to the country’s degree of export concentration.
The export concentration index, estimated by the Herfindahl-Hirschmann Index
AFREXIMBANK AFRICAN TRADE REPORT 2018 17
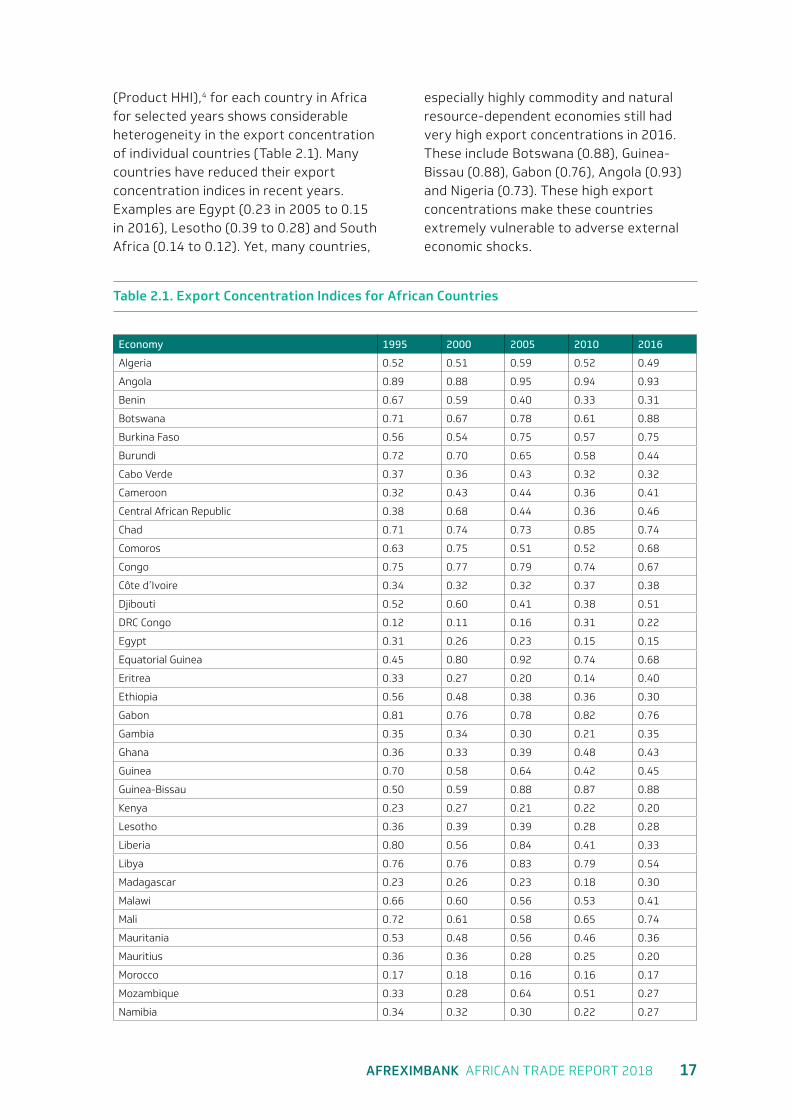
(Product HHI),4 for each country in Africa for selected years shows considerable heterogeneity in the export concentration of individual countries (Table 2.1). Many countries have reduced their export concentration indices in recent years. Examples are Egypt (0.23 in 2005 to 0.15 in 2016), Lesotho (0.39 to 0.28) and South Africa (0.14 to 0.12). Yet, many countries,
especially highly commodity and natural resource-dependent economies still had very high export concentrations in 2016. These include Botswana (0.88), Guinea-Bissau (0.88), Gabon (0.76), Angola (0.93) and Nigeria (0.73). These high export concentrations make these countries extremely vulnerable to adverse external economic shocks.
Table 2.1. Export Concentration Indices for African Countries
Economy 1995 2000 2005 2010 2016
Algeria 0.52 0.51 0.59 0.52 0.49
Angola 0.89 0.88 0.95 0.94 0.93
Benin 0.67 0.59 0.40 0.33 0.31
Botswana 0.71 0.67 0.78 0.61 0.88
Burkina Faso 0.56 0.54 0.75 0.57 0.75
Burundi 0.72 0.70 0.65 0.58 0.44
Cabo Verde 0.37 0.36 0.43 0.32 0.32
Cameroon 0.32 0.43 0.44 0.36 0.41
Central African Republic 0.38 0.68 0.44 0.36 0.46
Chad 0.71 0.74 0.73 0.85 0.74
Comoros 0.63 0.75 0.51 0.52 0.68
Congo 0.75 0.77 0.79 0.74 0.67
Côte d’Ivoire 0.34 0.32 0.32 0.37 0.38
Djibouti 0.52 0.60 0.41 0.38 0.51
DRC Congo 0.12 0.11 0.16 0.31 0.22
Egypt 0.31 0.26 0.23 0.15 0.15
Equatorial Guinea 0.45 0.80 0.92 0.74 0.68
Eritrea 0.33 0.27 0.20 0.14 0.40
Ethiopia 0.56 0.48 0.38 0.36 0.30
Gabon 0.81 0.76 0.78 0.82 0.76
Gambia 0.35 0.34 0.30 0.21 0.35
Ghana 0.36 0.33 0.39 0.48 0.43
Guinea 0.70 0.58 0.64 0.42 0.45
Guinea-Bissau 0.50 0.59 0.88 0.87 0.88
Kenya 0.23 0.27 0.21 0.22 0.20
Lesotho 0.36 0.39 0.39 0.28 0.28
Liberia 0.80 0.56 0.84 0.41 0.33
Libya 0.76 0.76 0.83 0.79 0.54
Madagascar 0.23 0.26 0.23 0.18 0.30
Malawi 0.66 0.60 0.56 0.53 0.41
Mali 0.72 0.61 0.58 0.65 0.74
Mauritania 0.53 0.48 0.56 0.46 0.36
Mauritius 0.36 0.36 0.28 0.25 0.20
Morocco 0.17 0.18 0.16 0.16 0.17
Mozambique 0.33 0.28 0.64 0.51 0.27
Namibia 0.34 0.32 0.30 0.22 0.27
18 CHAPTER TWO AFRICAN TRADE REPORT 2018
Economy 1995 2000 2005 2010 2016
Niger 0.40 0.59 0.33 0.38 0.30
Nigeria 0.85 0.92 0.88 0.80 0.73
Rwanda 0.60 0.39 0.44 0.43 0.33
São Tomé and Príncipe 0.49 0.36 0.55 0.38 0.59
Sénégal 0.22 0.24 0.21 0.26 0.22
Seychelles 0.46 0.57 0.45 0.49 0.51
Sierra Leone 0.28 0.46 0.47 0.24 0.66
Somalia 0.70 0.65 0.58 0.62 0.45
South Africa 0.11 0.14 0.14 0.14 0.12
Sudan 0.30 0.46 0.60 0.81 0.65
Swaziland 0.25 0.23 0.24 0.26 0.23
Togo 0.36 0.29 0.21 0.22 0.20
Tunisia 0.21 0.21 0.18 0.16 0.13
Uganda 0.70 0.38 0.27 0.19 0.17
Tanzania 0.26 0.22 0.25 0.23 0.32
Zambia 0.75 0.45 0.52 0.67 0.66
Zimbabwe 0.24 0.28 0.21 0.22 0.37
Africa 0.25 0.35 0.43 0.41 0.23
Source: UNCTADstat, http://unctadstat.unctad.org/.
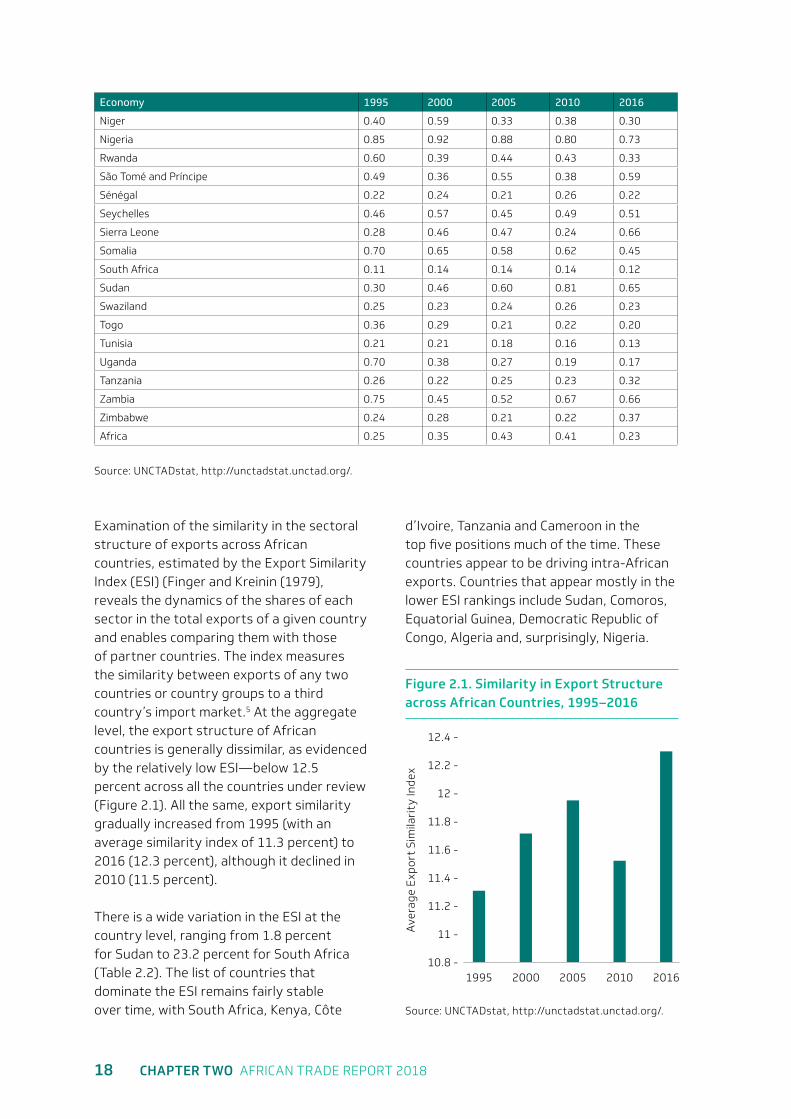
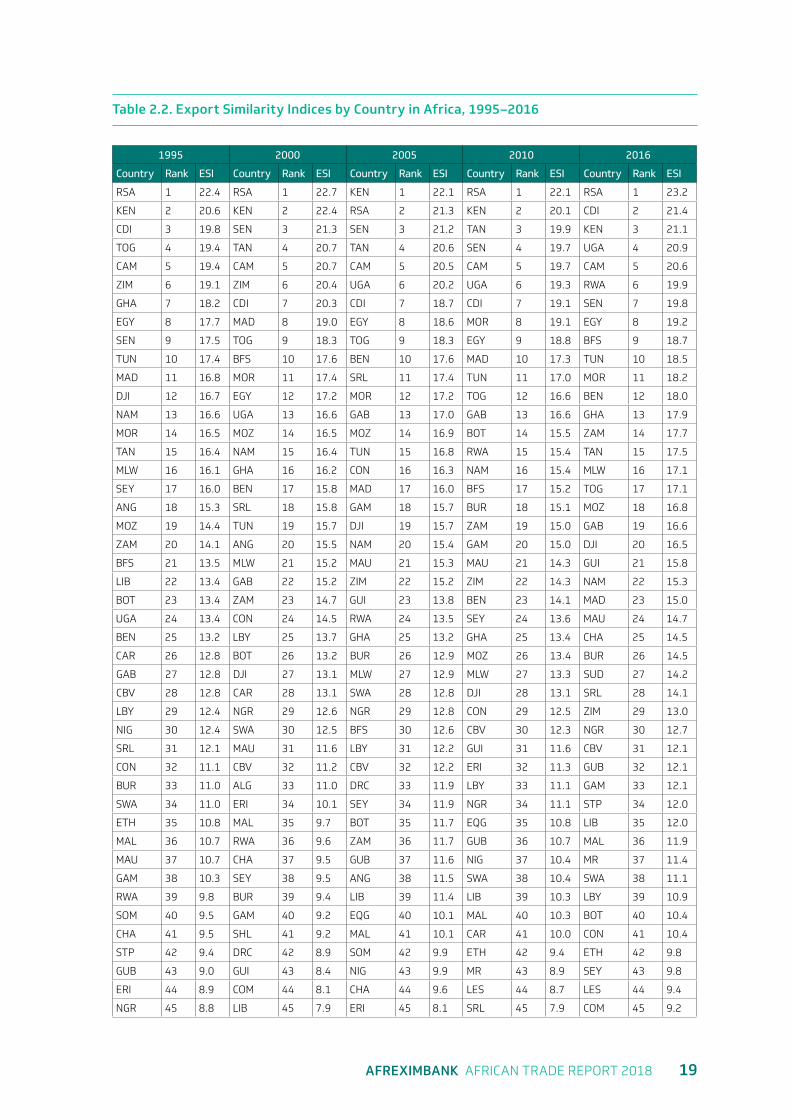
Examination of the similarity in the sectoral structure of exports across African countries, estimated by the Export Similarity Index (ESI) (Finger and Kreinin (1979), reveals the dynamics of the shares of each sector in the total exports of a given country and enables comparing them with those of partner countries. The index measures the similarity between exports of any two countries or country groups to a third country’s import market.5 At the aggregate level, the export structure of African countries is generally dissimilar, as evidenced by the relatively low ESI—below 12.5 percent across all the countries under review (Figure 2.1). All the same, export similarity gradually increased from 1995 (with an average similarity index of 11.3 percent) to 2016 (12.3 percent), although it declined in 2010 (11.5 percent).
There is a wide variation in the ESI at the country level, ranging from 1.8 percent for Sudan to 23.2 percent for South Africa (Table 2.2). The list of countries that dominate the ESI remains fairly stable over time, with South Africa, Kenya, Côte
d’Ivoire, Tanzania and Cameroon in the top five positions much of the time. These countries appear to be driving intra-African exports. Countries that appear mostly in the lower ESI rankings include Sudan, Comoros, Equatorial Guinea, Democratic Republic of Congo, Algeria and, surprisingly, Nigeria.
12.4 -
12.2 -
12 -
11.8 -
11.6 -
11.4 -
11.2 -
11 -
10.8 -
Ave
rage
Exp
ort
Sim
ilari
ty In
dex
1995 2000 2005 2010 2016
Figure 2.1. Similarity in Export Structure across African Countries, 1995–2016
Source: UNCTADstat, http://unctadstat.unctad.org/.
AFREXIMBANK AFRICAN TRADE REPORT 2018 19
Table 2.2. Export Similarity Indices by Country in Africa, 1995–2016
1995 2000 2005 2010 2016
Country Rank ESI Country Rank ESI Country Rank ESI Country Rank ESI Country Rank ESI
RSA 1 22.4 RSA 1 22.7 KEN 1 22.1 RSA 1 22.1 RSA 1 23.2
KEN 2 20.6 KEN 2 22.4 RSA 2 21.3 KEN 2 20.1 CDI 2 21.4
CDI 3 19.8 SEN 3 21.3 SEN 3 21.2 TAN 3 19.9 KEN 3 21.1
TOG 4 19.4 TAN 4 20.7 TAN 4 20.6 SEN 4 19.7 UGA 4 20.9
CAM 5 19.4 CAM 5 20.7 CAM 5 20.5 CAM 5 19.7 CAM 5 20.6
ZIM 6 19.1 ZIM 6 20.4 UGA 6 20.2 UGA 6 19.3 RWA 6 19.9
GHA 7 18.2 CDI 7 20.3 CDI 7 18.7 CDI 7 19.1 SEN 7 19.8
EGY 8 17.7 MAD 8 19.0 EGY 8 18.6 MOR 8 19.1 EGY 8 19.2
SEN 9 17.5 TOG 9 18.3 TOG 9 18.3 EGY 9 18.8 BFS 9 18.7
TUN 10 17.4 BFS 10 17.6 BEN 10 17.6 MAD 10 17.3 TUN 10 18.5
MAD 11 16.8 MOR 11 17.4 SRL 11 17.4 TUN 11 17.0 MOR 11 18.2
DJI 12 16.7 EGY 12 17.2 MOR 12 17.2 TOG 12 16.6 BEN 12 18.0
NAM 13 16.6 UGA 13 16.6 GAB 13 17.0 GAB 13 16.6 GHA 13 17.9
MOR 14 16.5 MOZ 14 16.5 MOZ 14 16.9 BOT 14 15.5 ZAM 14 17.7
TAN 15 16.4 NAM 15 16.4 TUN 15 16.8 RWA 15 15.4 TAN 15 17.5
MLW 16 16.1 GHA 16 16.2 CON 16 16.3 NAM 16 15.4 MLW 16 17.1
SEY 17 16.0 BEN 17 15.8 MAD 17 16.0 BFS 17 15.2 TOG 17 17.1
ANG 18 15.3 SRL 18 15.8 GAM 18 15.7 BUR 18 15.1 MOZ 18 16.8
MOZ 19 14.4 TUN 19 15.7 DJI 19 15.7 ZAM 19 15.0 GAB 19 16.6
ZAM 20 14.1 ANG 20 15.5 NAM 20 15.4 GAM 20 15.0 DJI 20 16.5
BFS 21 13.5 MLW 21 15.2 MAU 21 15.3 MAU 21 14.3 GUI 21 15.8
LIB 22 13.4 GAB 22 15.2 ZIM 22 15.2 ZIM 22 14.3 NAM 22 15.3
BOT 23 13.4 ZAM 23 14.7 GUI 23 13.8 BEN 23 14.1 MAD 23 15.0
UGA 24 13.4 CON 24 14.5 RWA 24 13.5 SEY 24 13.6 MAU 24 14.7
BEN 25 13.2 LBY 25 13.7 GHA 25 13.2 GHA 25 13.4 CHA 25 14.5
CAR 26 12.8 BOT 26 13.2 BUR 26 12.9 MOZ 26 13.4 BUR 26 14.5
GAB 27 12.8 DJI 27 13.1 MLW 27 12.9 MLW 27 13.3 SUD 27 14.2
CBV 28 12.8 CAR 28 13.1 SWA 28 12.8 DJI 28 13.1 SRL 28 14.1
LBY 29 12.4 NGR 29 12.6 NGR 29 12.8 CON 29 12.5 ZIM 29 13.0
NIG 30 12.4 SWA 30 12.5 BFS 30 12.6 CBV 30 12.3 NGR 30 12.7
SRL 31 12.1 MAU 31 11.6 LBY 31 12.2 GUI 31 11.6 CBV 31 12.1
CON 32 11.1 CBV 32 11.2 CBV 32 12.2 ERI 32 11.3 GUB 32 12.1
BUR 33 11.0 ALG 33 11.0 DRC 33 11.9 LBY 33 11.1 GAM 33 12.1
SWA 34 11.0 ERI 34 10.1 SEY 34 11.9 NGR 34 11.1 STP 34 12.0
ETH 35 10.8 MAL 35 9.7 BOT 35 11.7 EQG 35 10.8 LIB 35 12.0
MAL 36 10.7 RWA 36 9.6 ZAM 36 11.7 GUB 36 10.7 MAL 36 11.9
MAU 37 10.7 CHA 37 9.5 GUB 37 11.6 NIG 37 10.4 MR 37 11.4
GAM 38 10.3 SEY 38 9.5 ANG 38 11.5 SWA 38 10.4 SWA 38 11.1
RWA 39 9.8 BUR 39 9.4 LIB 39 11.4 LIB 39 10.3 LBY 39 10.9
SOM 40 9.5 GAM 40 9.2 EQG 40 10.1 MAL 40 10.3 BOT 40 10.4
CHA 41 9.5 SHL 41 9.2 MAL 41 10.1 CAR 41 10.0 CON 41 10.4
STP 42 9.4 DRC 42 8.9 SOM 42 9.9 ETH 42 9.4 ETH 42 9.8
GUB 43 9.0 GUI 43 8.4 NIG 43 9.9 MR 43 8.9 SEY 43 9.8
ERI 44 8.9 COM 44 8.1 CHA 44 9.6 LES 44 8.7 LES 44 9.4
NGR 45 8.8 LIB 45 7.9 ERI 45 8.1 SRL 45 7.9 COM 45 9.2
20 CHAPTER TWO AFRICAN TRADE REPORT 2018
1995 2000 2005 2010 2016
Country Rank ESI Country Rank ESI Country Rank ESI Country Rank ESI Country Rank ESI
MR 46 8.7 SOM 46 7.7 LES 46 8.1 DRC 46 7.7 NIG 46 9.2
LES 47 8.5 NIG 47 7.7 MR 47 7.7 SOM 47 7.6 ERI 47 8.5
DRC 48 8.2 LES 48 7.6 ALG 48 7.5 STP 48 7.5 SHL 48 8.1
GUI 49 8.0 GUB 49 7.4 STP 49 7.1 ALG 49 7.2 CAR 49 8.0
COM 50 7.0 ETH 50 6.7 ETH 50 7.0 COM 50 6.9 DRC 50 7.2
ALG 51 6.5 STP 51 6.3 CAR 51 6.8 CHA 51 6.7 ALG 51 7.0
SHL 52 5.2 EQG 52 5.8 SHL 52 5.2 ANG 52 6.0 EQG 52 7.0
EQG 53 4.1 MR 53 5.1 COM 53 3.8 SHL 53 5.8 SOM 53 6.7
SUD 54 1.8 SUD 54 1.8 SUD 54 1.8 SUD 54 1.8 ANG 54 5.4
Source: UNCTADstat, http://unctadstat.unctad.org/.
The relatively low average ESI values in Africa support the view that there is ample scope for expanding intra-African trade within the context of the AfCFTA framework. Generally, cross-country variations in export structure tend to be a manifestation of mutually beneficial exchange of products in line with country-specific comparative advantages. A high ESI value would indicate fierce competition for the market. The low ESI values for Africa indicate very low convergence in the sectoral composition of exports, which could heighten the risk of asymmetric shocks in the region. To the extent that the AfCFTA aims to promote intra-African trade in differentiated products, the similarity of African countries’ exports can be expected to increase. One way to drive this needed convergence is to expand supply chain networks associated with exports and imports across the continent.
2.3 Economic Impact of the AfCFTA
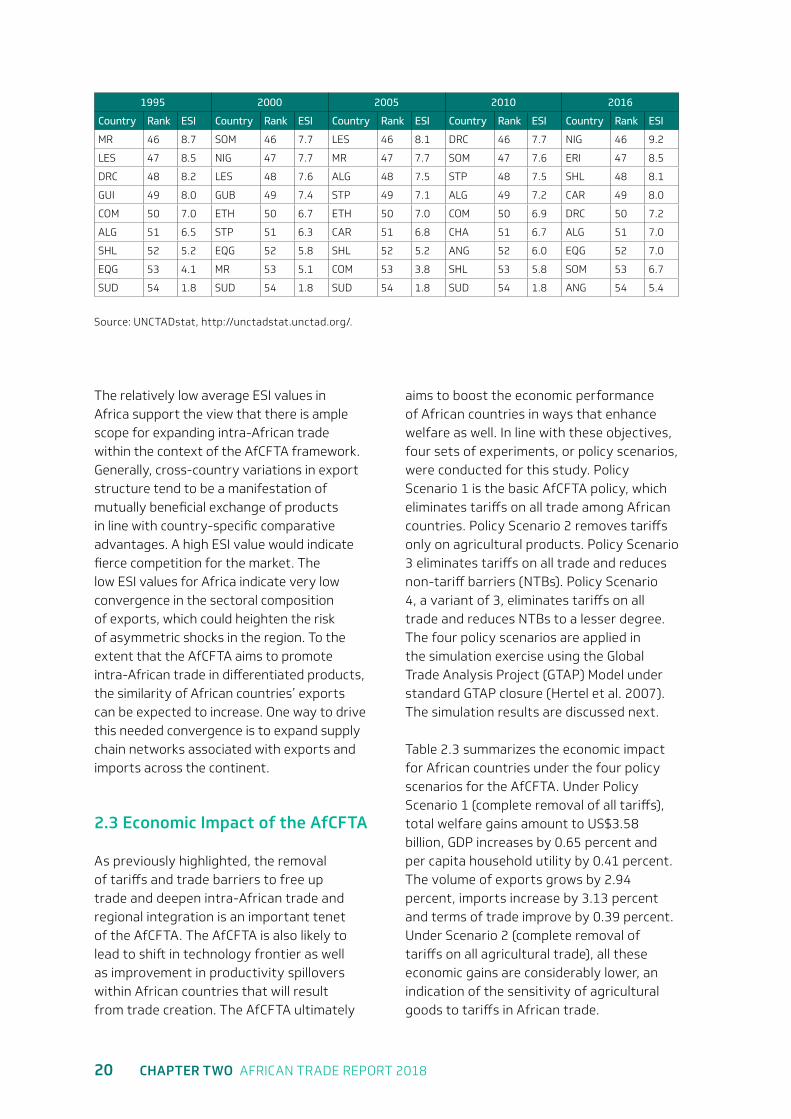
As previously highlighted, the removal of tariffs and trade barriers to free up trade and deepen intra-African trade and regional integration is an important tenet of the AfCFTA. The AfCFTA is also likely to lead to shift in technology frontier as well as improvement in productivity spillovers within African countries that will result from trade creation. The AfCFTA ultimately
aims to boost the economic performance of African countries in ways that enhance welfare as well. In line with these objectives, four sets of experiments, or policy scenarios, were conducted for this study. Policy Scenario 1 is the basic AfCFTA policy, which eliminates tariffs on all trade among African countries. Policy Scenario 2 removes tariffs only on agricultural products. Policy Scenario 3 eliminates tariffs on all trade and reduces non-tariff barriers (NTBs). Policy Scenario 4, a variant of 3, eliminates tariffs on all trade and reduces NTBs to a lesser degree. The four policy scenarios are applied in the simulation exercise using the Global Trade Analysis Project (GTAP) Model under standard GTAP closure (Hertel et al. 2007). The simulation results are discussed next.
Table 2.3 summarizes the economic impact for African countries under the four policy scenarios for the AfCFTA. Under Policy Scenario 1 (complete removal of all tariffs), total welfare gains amount to US$3.58 billion, GDP increases by 0.65 percent and per capita household utility by 0.41 percent. The volume of exports grows by 2.94 percent, imports increase by 3.13 percent and terms of trade improve by 0.39 percent. Under Scenario 2 (complete removal of tariffs on all agricultural trade), all these economic gains are considerably lower, an indication of the sensitivity of agricultural goods to tariffs in African trade.
AFREXIMBANK AFRICAN TRADE REPORT 2018 21
Table 2.3. Macroeconomic and Welfare Impact on Africa of Four Policy Scenarios for the AfCFTA
Policy Scenario
Welfare (US$
millions)GDP (%)
Per capita household
utility (%)
Volume of exports
(%)
Volume of imports
(%)
Terms of trade
(%)
1 (removal of all tariffs) 3,589.06 0.65 0.41 2.94 3.13 0.39
2 (removal of agricultural tariffs only)
751.29 0.12 0.16 0.79 0.86 0.14
3 (removal of all tariffs and lowering of non-tariff barriers)
17,956.90 3.15 1.94 5.23 6.59 1.35
4 (removal of all tariffs and less lowering of non-tariff barriers)
10,445.70 1.90 1.20 3.79 4.90 0.89
Source: GTAP Model estimates.
22 CHAPTER TWO AFRICAN TRADE REPORT 2018
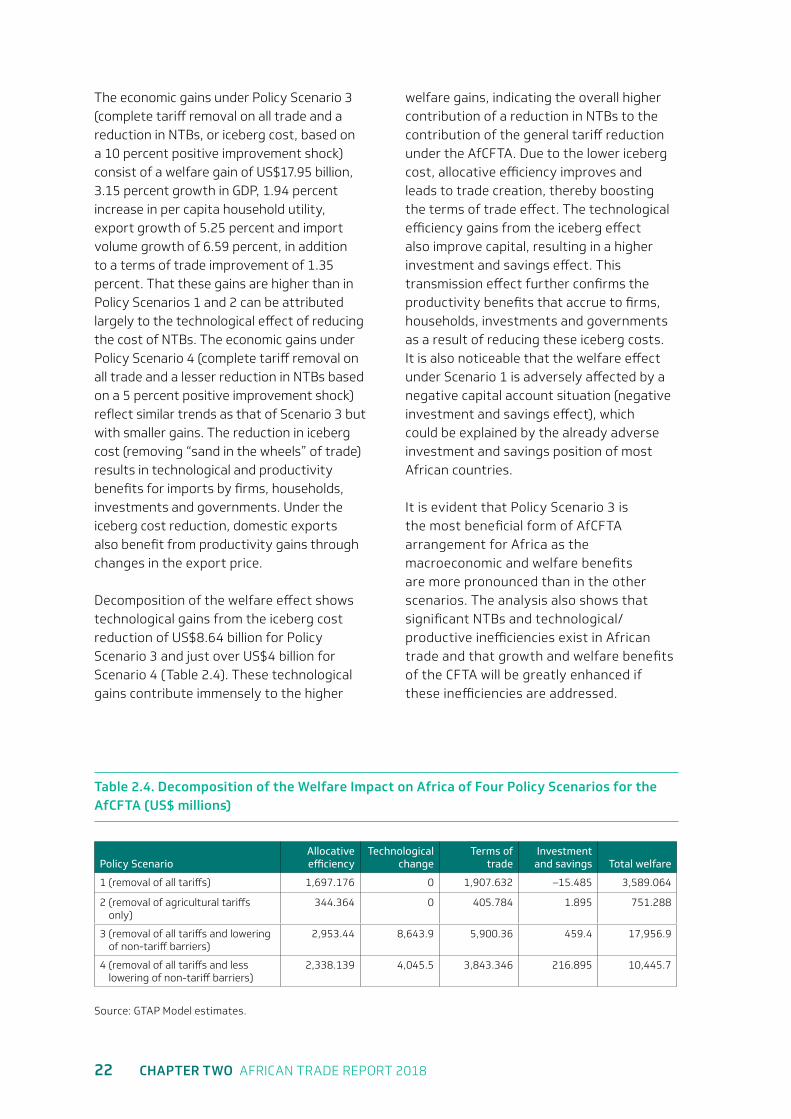
The economic gains under Policy Scenario 3 (complete tariff removal on all trade and a reduction in NTBs, or iceberg cost, based on a 10 percent positive improvement shock) consist of a welfare gain of US$17.95 billion, 3.15 percent growth in GDP, 1.94 percent increase in per capita household utility, export growth of 5.25 percent and import volume growth of 6.59 percent, in addition to a terms of trade improvement of 1.35 percent. That these gains are higher than in Policy Scenarios 1 and 2 can be attributed largely to the technological effect of reducing the cost of NTBs. The economic gains under Policy Scenario 4 (complete tariff removal on all trade and a lesser reduction in NTBs based on a 5 percent positive improvement shock) reflect similar trends as that of Scenario 3 but with smaller gains. The reduction in iceberg cost (removing “sand in the wheels” of trade) results in technological and productivity benefits for imports by firms, households, investments and governments. Under the iceberg cost reduction, domestic exports also benefit from productivity gains through changes in the export price.
Decomposition of the welfare effect shows technological gains from the iceberg cost reduction of US$8.64 billion for Policy Scenario 3 and just over US$4 billion for Scenario 4 (Table 2.4). These technological gains contribute immensely to the higher
welfare gains, indicating the overall higher contribution of a reduction in NTBs to the contribution of the general tariff reduction under the AfCFTA. Due to the lower iceberg cost, allocative efficiency improves and leads to trade creation, thereby boosting the terms of trade effect. The technological efficiency gains from the iceberg effect also improve capital, resulting in a higher investment and savings effect. This transmission effect further confirms the productivity benefits that accrue to firms, households, investments and governments as a result of reducing these iceberg costs. It is also noticeable that the welfare effect under Scenario 1 is adversely affected by a negative capital account situation (negative investment and savings effect), which could be explained by the already adverse investment and savings position of most African countries.
It is evident that Policy Scenario 3 is the most beneficial form of AfCFTA arrangement for Africa as the macroeconomic and welfare benefits are more pronounced than in the other scenarios. The analysis also shows that significant NTBs and technological/productive inefficiencies exist in African trade and that growth and welfare benefits of the CFTA will be greatly enhanced if these inefficiencies are addressed.
Table 2.4. Decomposition of the Welfare Impact on Africa of Four Policy Scenarios for the AfCFTA (US$ millions)
Policy ScenarioAllocative efficiency
Technological change
Terms of trade
Investment and savings Total welfare
1 (removal of all tariffs) 1,697.176 0 1,907.632 –15.485 3,589.064
2 (removal of agricultural tariffs only)
344.364 0 405.784 1.895 751.288
3 (removal of all tariffs and lowering of non-tariff barriers)
2,953.44 8,643.9 5,900.36 459.4 17,956.9
4 (removal of all tariffs and less lowering of non-tariff barriers)
2,338.139 4,045.5 3,843.346 216.895 10,445.7
Source: GTAP Model estimates.
AFREXIMBANK AFRICAN TRADE REPORT 2018 23
Table 2.5. Distribution of GDP and per Capita Household Utility across Countries under Four Policy Scenarios for the AfCFTA
Country
Policy Scenario 1 (removal of all tariffs)
Policy Scenario 2 (removal of agricultural
tariffs only)
Policy Scenario 3 (removal of all tariffs and lowering of non-
tariff barriers)
Policy Scenario 4 (removal of all tariffs and less lowering of non-tariff barriers)
GDP(%)
Household utility (%)
GDP (%)
Household utility (%)
GDP (%)
Household utility (%) GDP (%) Household
utility (%)
Benin 3.19 1.8 3.03 2.37 –7.08 –5.43 0.18 –0.26
Botswana 0.63 0.06 0.03 0 1.38 0.75 0.98 0.39
Burkina Faso –0.13 0.15 0.19 0.04 1.14 1.64 0.47 0.87
Cameroon –0.05 0.07 0.05 0.06 1.41 1.01 0.63 0.51
Côte d’Ivoire 2.41 1.03 1.15 0.46 5.62 2.83 3.96 1.9
Egypt 0.25 0.07 0.06 0.01 1.77 0.53 0.95 0.28
Ethiopia –0.47 –0.07 –0.07 0 1.66 0.88 0.51 0.38
Ghana 1.69 0.87 0.23 0.13 4.09 2.45 2.81 1.6
Guinea –1.95 –0.55 –0.76 –0.16 –0.44 1.48 –1.26 0.41
Kenya 0.01 0.14 –0.72 –0.14 5.31 2.59 2.49 1.3
Madagascar 0.03 0 –0.03 0 1.01 0.5 0.47 0.23
Malawi 0.41 0.27 1.28 0.52 7.12 4.18 3.63 2.2
Mauritius 0.28 0.12 0.17 0.08 2.22 1.42 1.17 0.72
Morocco 0.89 0.4 0.22 0.1 2.23 1.21 1.51 0.77
Mozambique –0.02 –0.08 0.09 0.02 3.3 2.66 1.58 1.25
Namibia 2.41 0.61 0.93 0.24 5.82 2.29 4.03 1.4
Nigeria –0.03 0.01 –0.1 –0.01 0.32 0.2 0.14 0.09
Rwanda 3.51 0.59 0.93 0.17 6.56 1.91 4.93 1.23
Senegal 4.51 1.9 1.51 0.68 9.48 4.38 6.91 3.11
South Africa 1.44 0.46 0.27 0.07 3.74 1.33 2.52 0.87
Tanzania –0.39 0.44 –0.88 0.15 1.79 2.19 0.63 1.26
Togo 5.8 4.45 0.34 0.49 14.41 11.05 9.98 7.7
Tunisia 0.53 0.25 0.03 0.02 2.63 1.38 1.5 0.78
Uganda 1.62 0.55 0.31 0.23 5.57 2.1 3.49 1.3
Zambia 2.64 0.95 0.42 0.1 10.16 4.72 6.3 2.8
Zimbabwe –13.56 –3.88 –5.65 –1.28 –8.19 1.45 –11.02 –1.27
Rest of Southern African Customs Union
2.6 0.95 0.34 0.06 4.57 2.13 3.54 1.52
Rest of Africa –0.17 0.02 –0.12 0 0.52 0.62 0.15 0.29
Average Africa 0.65 0.41 0.12 0.16 3.15 1.94 1.9 1.2
Rest of the world –0.01 0 0 0 –0.16 –0.03 –0.03 0
Source: GTAP Model estimates. Note: Negative values are displayed in bold.
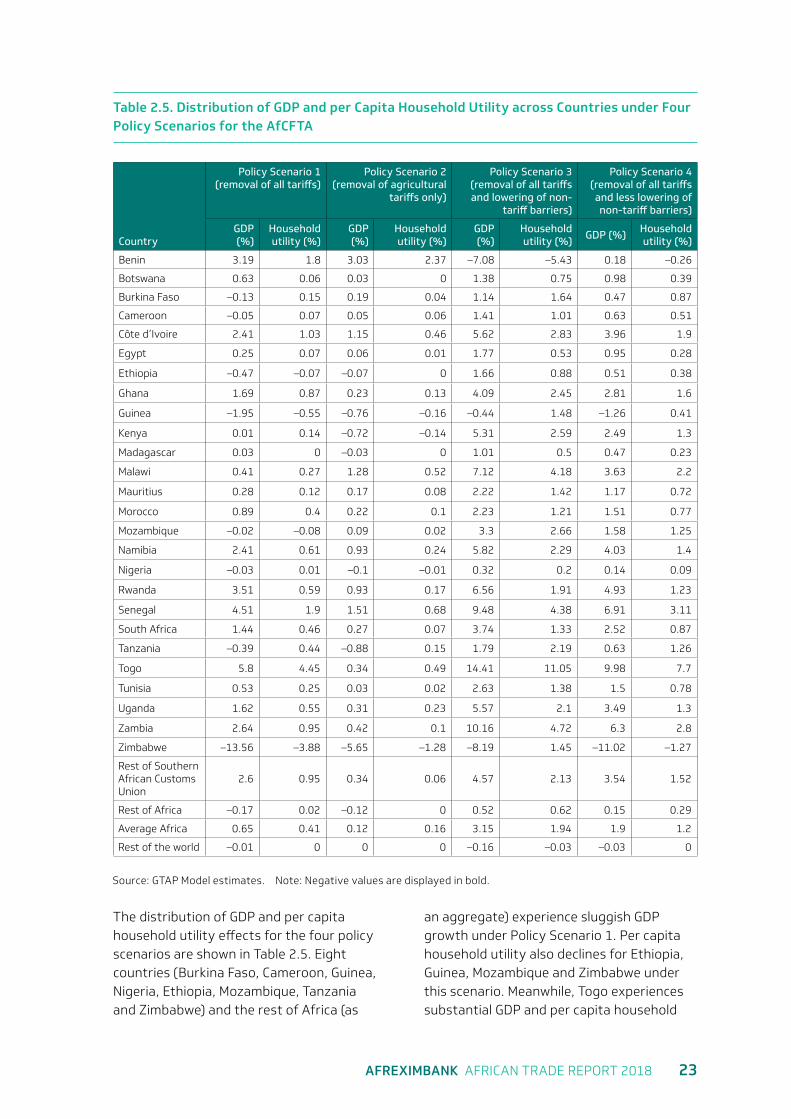
The distribution of GDP and per capita household utility effects for the four policy scenarios are shown in Table 2.5. Eight countries (Burkina Faso, Cameroon, Guinea, Nigeria, Ethiopia, Mozambique, Tanzania and Zimbabwe) and the rest of Africa (as
an aggregate) experience sluggish GDP growth under Policy Scenario 1. Per capita household utility also declines for Ethiopia, Guinea, Mozambique and Zimbabwe under this scenario. Meanwhile, Togo experiences substantial GDP and per capita household
24 CHAPTER TWO AFRICAN TRADE REPORT 2018
growth. GDP and per capita household utility growth impacts follow a similar pattern under Policy Scenario 2, but the adverse impacts are larger. Eight countries and the aggregated countries for the rest of Africa experience GDP losses, and four countries (Guinea, Kenya, Nigeria and Zimbabwe) suffer per capita household utility losses.
Under Policy Scenario 3, GDP and per capita household growth outcomes are more positive relative to the other three scenarios. The impact under Policy Scenario 4 is similar to that of Scenario 3 except that the magnitude of impact is smaller.
Overall, the analysis shows that the AfCFTA arrangement needs to take into account the impact of NTBs, which reduce the welfare gains and efficiency of intra-African trade. When tariff and NTBs are structured properly, they can remove inefficiencies to raise the economic benefits and welfare
gains associated with the AfCFTA. For instance, with full tariff elimination and a reduction in some NTBs, the long-term gains amount to US$17.96 billion in welfare, a 3 percent annual gain in GDP growth and 1.35 percent annual gain in terms of trade. There are also gains in per capita household utility, domestic output and intra-African trade.
However, the analysis also reveals that the gains are not evenly distributed. Some countries suffer losses in welfare, GDP, terms of trade, allocative efficiency and investment though these losses are confined to a handful of countries and sectors and tend to reduce overtime with a number of countries achieving net gains in the medium and long term. Still, while there is a need to reduce NTBs and increase efficiency in intra-African trade, there is also a need for strategies to reduce losses in some countries. The technological benefits and productivity spillovers of reduced NTBs are
AFREXIMBANK AFRICAN TRADE REPORT 2018 25
also worth noting and suggest the need to pay attention to trade efficiency to reduce border, transit and other administrative costs in trade that create inefficiencies.
2.4 Policy Framework and Conditions for Success6
Political factors are important in the creation and success of the AfCFTA, as the degree of integration depends on commitments of individual countries to integrate institutions and share sovereignty. With the complexity of the AfCFTA agenda, political will and leadership, institutional weaknesses and multiple capacity constraints will inevitably threaten the credibility and sustainability of the agenda. The trade-off between economies of scale and heterogeneity costs7 is an appropriate starting point to gain insights into the political economy of institutional integration. A full implementation of the AfCFTA would require diverse countries in Africa to create shared institutions for providing public functions and policies. Using common institutions, with cost spread over the 1.2 billion African population in the AfCFTA space, enables the achievement of economy of scale benefits for the provision of public goods. With shared institutions in the large free trade area, costs emanating from negative externalities can also be internalised.
The African continent is large, with diverse cultural, political and economic systems. As such, individual country preferences for public goods and policies may be incompatible with the preferences of other countries or sub-regions. Thus, greater heterogeneity8 and political costs can be expected in the provision of public goods.9 Heterogeneity can also be beneficial. Diverse preferences and characteristics can encourage economic agents on the continent to specialise in the production of different rival goods and services. However, conflict may arise from low heterogeneity, where the diverse groups have comparable choices for
particular rival goods (for example, specific resources and territories).10 In the case of non-rival goods (such as public policies and common institutions), heterogeneous preferences convey greater political costs and a higher probability of strife at the country level. Thus, the heterogeneity of traits and preferences in the African population spread across 55 countries can be expected to be mostly beneficial when economic agents interact about rival goods and mostly costly when they interact about non-rival goods. As a result, diversity in the choice of public goods can limit the integration of institutions needed for full implementation of the AfCFTA.
The complexity of the political economy implications of the AfCFTA can be understood at a more practical level by adopting the five-lens approach proposed by Vanheukelom et al. (2016) to reveal some specific (regional) political dynamics. This approach aims to unpack the fundamental political and economic factors that could drive or limit the advancement of the AfCFTA. It consists of structural or foundational factors; formal or informal rules of the game; actors, agencies and incentives; sector-specific technical and political characteristics; and exogenous factors. This approach enables a systematic examination of how various factors shape the pursuit of the African agenda.11
2.4.1 Infrastructure and logistics: Role of development finance institutions
According to the African Development Bank (AfDB), Africa has lost a cumulative 25 percent in forgone growth in the last two decades due to inadequate infrastructure, which harms trade through its impacts on costs. This effect is amply demonstrated in the empirical literature. For instance, Limão and Venables (2001) quantify the impact of infrastructure on transport costs. In addition, Bougheas et al. (1999) link infrastructure to transport costs and hence to trade. Burn et al. (2005) show that the
26 CHAPTER TWO AFRICAN TRADE REPORT 2018
quality of physical infrastructure is critical to trade. Iwanow and Kirkpatrick (2009) construct aggregated indicators of trade facilitation and infrastructure and find a positive impact of the indicators on exports. Portugal-Perez and Wilson (2012) examine the impact of soft and hard infrastructure on the export performance of developing countries and suggest that trade facilitation measures have a positive impact on export performance. It can be inferred from these empirical studies that the success of the AfCFTA is intrinsically linked to extensive infrastructure development and finance. Thus, improving infrastructure, which is now a trade constraint, could enable African countries to engage more fully in intra-regional trade and reap the benefits of economic globalisation.
The AfDB suggests that Africa needs US$130–$170 billion a year to close its infrastructure gap,12 an amount that exceeds the ability of African governments to finance alone. The evidence suggests that infrastructure investment capital is available to make up the difference. What is lacking are bankable projects. Infrastructure investments involve long-term commitments and multiple risks, including completion risks arising from policy and regulatory uncertainly and revenue risks relating to a project’s ability not only to repay its debts but also to generate an adequate return for investors. Development finance institutions (DFIs) can make infrastructure projects more bankable by contributing capital, technical expertise and capacity where the private sector cannot. Specifically, DFIs, by having a developmental mandate that extends beyond financing, can contribute to project bankability by participating in the creation of an enabling environment that solves (or at the very least improves on) regulatory and institutional challenges. DFIs can also provide a range of targeted risk mitigation products and have the ability to be a loss absorber.13
Trade financing (trade credit, insurance and guarantees) is needed during the
import-export phase as well as during the production of goods and services for export. Lack of financing at any stage from production through export can constrain the flow of transactions and significantly shrink the increase in the intra-African trade expected from the AfCFTA. The financial sector in Africa is strongly risk-averse. Banks that have trade finance expertise and experience provide credit mainly to firms with the strongest reputations and that can provide high collateral, leaving emerging firms, particularly in new sectors, out in the cold. Such biases can exacerbate balance of payments difficulties and can impede building a robust investment-export nexus and promoting economic diversification. DFIs can ease financing bottlenecks by overcoming critical limitations in credit provision to catalyse expansion in trade financing. This includes providing loans directly to firms and underwriting political risks to support and encourage trade and outward investment.
2.4.2 Strong regional value chains
The common challenges to the development and strengthening of regional value chains in Africa have been unreliable and poor infrastructure, tariffs and NTBs, poor access to finance, political uncertainty and insufficient knowledge of regional markets. If the remaining countries in Africa that have not yet signed on to the AfCFTA were to do so, that would increase options for developing or strengthening regional value chains by making it easier for firms to trade across the continent. Once again, massive investments in infrastructure are needed in most African countries to enable building regional value chains. Also important is to prioritise improvements in the domestic political environment in African countries, to ensure reliable and smooth trade across African destinations. Political instability often disrupts production, which affects not only the domestic market but also regional markets and value chains. Further, macroeconomic stability and policies are needed to improve access to credit so that
AFREXIMBANK AFRICAN TRADE REPORT 2018 27
firms can expand from the domestic market to intra-regional trade.
2.5 Implications
The AfCFTA aims to create a single market for goods and services on the continent and to boost intra-African trade. The potential economic benefits are clear and supported by trade theory, which posits that a continent-wide free trade area would lead to specialisation among African countries in goods in which they have a comparative advantage, thus improving efficiency in the use of productive resources and increasing output. The AfCFTA commits African economies to the removal of trade barriers on imports (tariffs and quotas), which will reduce import costs and, consequently,
consumer prices. Consumers will benefit by being able to consume a larger variety of African products in the single market. These supply and demand effects together engender welfare gains in the form of consumer surpluses in importing African countries (Saygili et al. 2017).
Downstream manufacturers in importing countries also stand to gain through declining production costs as the costs of imported raw materials and intermediate inputs falls. This may improve the competitiveness of domestic producers and enable African economies to integrate into global value chains. Competitive pressures resulting from the AfCFTA can enhance the efficiency of domestic firms by requiring improvements in resource allocation and in innovation to compete in the liberalised
28 CHAPTER TWO AFRICAN TRADE REPORT 2018
environment. Thus, implementing the AfCFTA has the potential to enhance the efficiency of African firms. Structural transformation may also result from the AfCFTA as the skill and technology content of African countries’ exports improve. For example, 43 percent of goods traded within Africa are manufactured products.14 In addition, the technology content of intra-African trade exceeds that of African trade with the rest of the world (UNCTAD 2018). Medium- and high-technology manufactures comprise 25.4 percent and 14.1 percent of trade within Africa. Intra-African trade also has a higher industrial content than African countries’ trade with the rest of the world (UNCTAD 2011).
Besides the cost advantages, the AfCFTA would allow African domestic firms to access a 1.2 billion strong market (including a
growing middle class) and thus to benefit from economies of scale. Expanding markets offer important opportunities to develop regional value chains that can enhance diversification and competitiveness and consolidate and integrate production infrastructure and processes across borders. Constrained access to markets limits the growth of firms. Therefore, for domestic firms, getting rid of local market constraints may improve growth prospects and access to finance and technology in the global economy.
There are, however, notable challenges. If large firms gain a dominant position in the African market, they may crowd out small and medium-size firms. This suggests a need for complementary policies, including consumer protection and competition policies, to ensure a smooth transition.
AFREXIMBANK AFRICAN TRADE REPORT 2018 29
Full implementation of the AfCFTA would require the diverse countries in Africa to create shared institutions to provide public functions. There are clear economies of scale advantages in spreading these costs across the AfCFTA area.
Higher heterogeneity and political costs can be expected as a result of countries’ diverse cultural, political and economic arrangements if some countries’ preferences for public goods and policies are incompatible with the preferences of other countries or sub-regions on the continent. Heterogeneity can also be source of value in the AfCFTA area if differences across the continent stimulate economic agents to
specialise in the production of different rival goods and services, whiles simultaneously learning from each other. And when there is little heterogeneity, conflict may arise because interest groups may have similar preferences for particular rival goods.15 In the case of heterogeneous choices over non-rival goods (common institutions), greater political costs and a higher probability of strife at the country level can be expected.
To reap the enormous potential benefits of the AfCFTA, it is necessary that all African countries join. The sooner that the remaining nations join the AfCFTA, the sooner all countries will be able to realise these benefits.
END
3Chapter Three
AFREXIMBANK AFRICAN TRADE REPORT 2018 31
The Operating Environment
3.1 The Global Economic Environment
3.1.1 Output Development
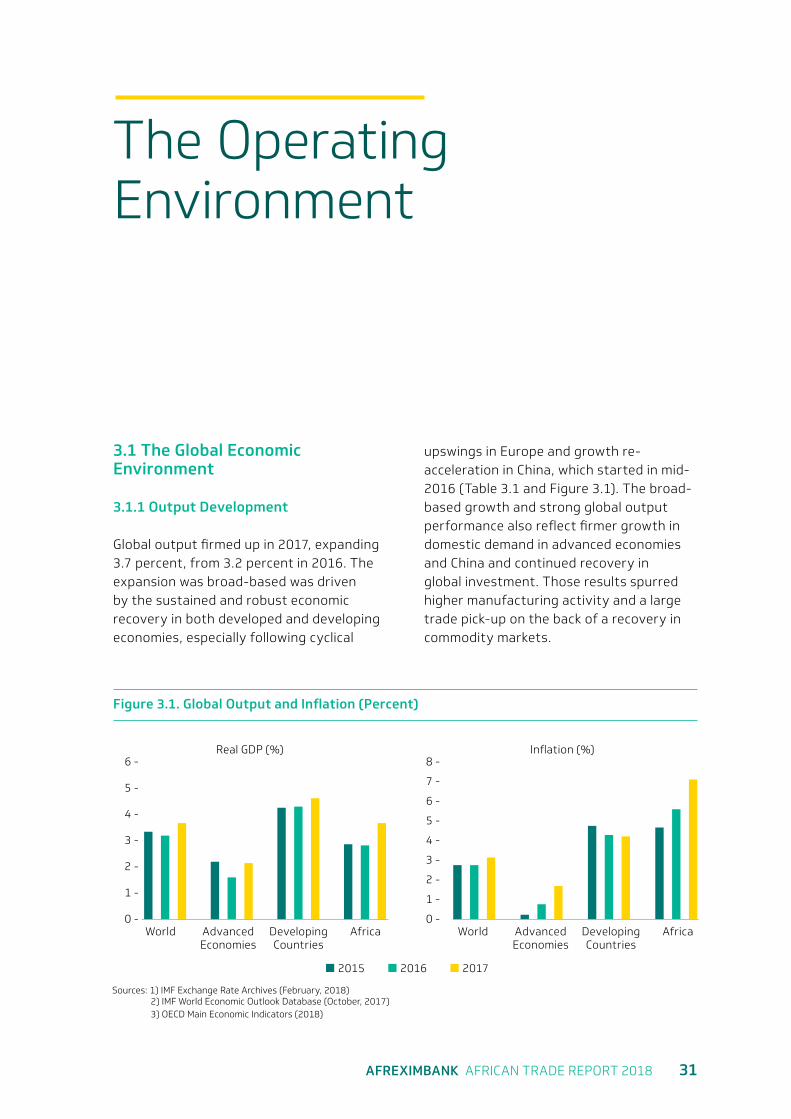
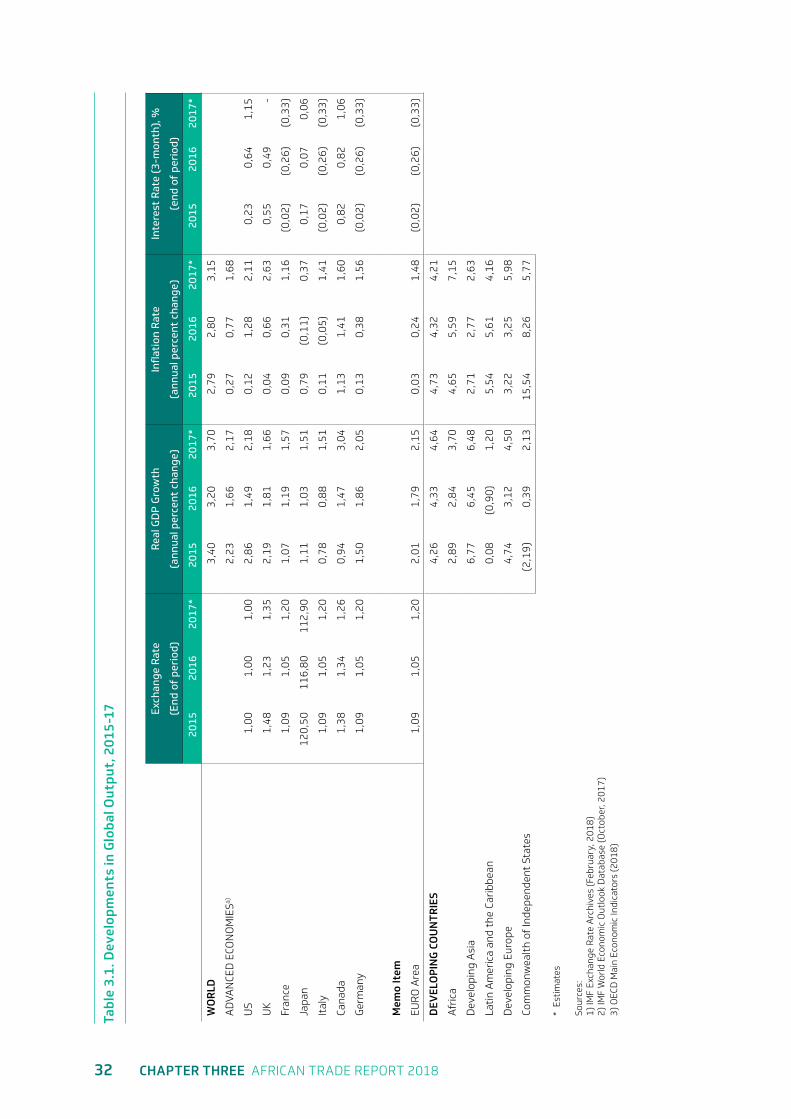
Global output firmed up in 2017, expanding 3.7 percent, from 3.2 percent in 2016. The expansion was broad-based was driven by the sustained and robust economic recovery in both developed and developing economies, especially following cyclical
upswings in Europe and growth re-acceleration in China, which started in mid-2016 (Table 3.1 and Figure 3.1). The broad-based growth and strong global output performance also reflect firmer growth in domestic demand in advanced economies and China and continued recovery in global investment. Those results spurred higher manufacturing activity and a large trade pick-up on the back of a recovery in commodity markets.
Figure 3.1. Global Output and Inflation (Percent)
6 -
4 - 5 -
5 - 7 -
3 -
3 -
1 - 1 -
8 -
4 -
6 -
2 -2 -
0 - 0 -Advanced Economies
Advanced Economies
World WorldAfrica AfricaDeveloping Countries
Developing Countries
Inflation (%)Real GDP (%)
2015 2016 2017
Sources: 1) IMF Exchange Rate Archives (February, 2018) 2) IMF World Economic Outlook Database (October, 2017) 3) OECD Main Economic Indicators (2018)
32 CHAPTER THREE AFRICAN TRADE REPORT 2018
Tabl
e 3.
1. D
evel
opm
ents
in G
loba
l Out
put,
201
5-17 Ex
chan
ge R
ate
Real
GD
P G
row
thIn
flat
ion
Rat
e In
tere
st R
ate
(3-m
onth
), %
(End
of
peri
od)
(ann
ual p
erce
nt c
hang
e)(a
nnua
l per
cent
cha
nge)
(end
of
peri
od)
2015
2016
2017
*20
1520
1620
17*
2015
2016
2017
*20
1520
1620
17*
WO
RLD
3,4
0 3
,20
3,7
0 2
,79
2,8
0 3
,15
AD
VAN
CED
ECO
NO
MIE
Sa) 2
,23
1,6
6 2
,17
0,2
7 0
,77
1,6
8
US
1,0
0 1
,00
1,0
0 2
,86
1,4
9 2
,18
0,1
2 1
,28
2,1
1 0
,23
0,6
4 1
,15
UK
1,4
8 1
,23
1,3
5 2
,19
1,8
1 1
,66
0,0
4 0
,66
2,6
3 0
,55
0,4
9 -
Fran
ce 1
,09
1,0
5 1
,20
1,0
7 1
,19
1,5
7 0
,09
0,3
1 1
,16
(0,
02)
(0,
26)
(0,
33)
Japa
n 1
20,5
0 1
16,8
0 1
12,9
0 1
,11
1,0
3 1
,51
0,7
9 (
0,11
) 0
,37
0,1
7 0
,07
0,0
6
Ital
y 1
,09
1,0
5 1
,20
0,7
8 0
,88
1,5
1 0
,11
(0,
05)
1,4
1 (
0,02
) (
0,26
) (
0,33
)
Cana
da 1
,38
1,3
4 1
,26
0,9
4 1
,47
3,0
4 1
,13
1,4
1 1
,60
0,8
2 0
,82
1,06
Ger
man
y 1
,09
1,0
5 1
,20
1,5
0 1
,86
2,0
5 0
,13
0,3
8 1
,56
(0,
02)
(0,
26)
(0,
33)
Mem
o It
em
EUR
O A
rea
1,0
9 1
,05
1,2
0 2
,01
1,7
9 2
,15
0,0
3 0
,24
1,4
8 (
0,02
) (
0,26
) (
0,33
)
DEV
ELO
PIN
G C
OU
NTR
IES
4,2
6 4
,33
4,6
4 4
,73
4,3
2 4
,21
Afr
ica
2,8
9 2
,84
3,7
0 4
,65
5,5
9 7
,15
Dev
elop
ing
Asi
a 6
,77
6,4
5 6
,48
2,7
1 2
,77
2,6
3
Lati
n A
mer
ica
and
the
Cari
bbea
n 0
,08
(0,
90)
1,2
0 5
,54
5,6
1 4
,16
Dev
elop
ing
Euro
pe
4,7
4 3
,12
4,5
0 3
,22
3,2
5 5
,98
Com
mon
wea
lth
of In
depe
nden
t St
ates
(
2,19
) 0
,39
2,1
3 1
5,54
8
,26
5,7
7
* E
stim
ates
Sour
ces:
1)
IMF
Exch
ange
Rat
e A
rchi
ves
(Feb
ruar
y, 2
018)
2)
IMF
Wor
ld E
cono
mic
Out
look
Dat
abas
e (O
ctob
er, 2
017)
3)
OEC
D M
ain
Econ
omic
Indi
cato
rs (
2018
)
AFREXIMBANK AFRICAN TRADE REPORT 2018 33
Supported by higher-than-projected growth during the third quarter of 2017, advanced economies recorded 2.2 percent growth in 2017, up from 1.7 percent in 2016. The economies driving this performance included Germany, Japan, the Republic of Korea and the United States, which posted growth rates above historical trends. Growth was further boosted by stronger business investment—partly reflecting a recovery, rising profits and improved external demand in the energy sector—by higher private investment and consumption as household incomes rise and by diminishing drag from capacity adjustment in the energy sector. In the United States, output grew by an estimated 2.3 percent in 2017, up from 1.6 percent in 2016. In Japan, output expanded by about 1.7 percent in 2017, up from 0.9 percent in 2016, setting the country on the path of one of its strongest growth performances in decades. In addition to the favorable global economic and trade environment, the country’s remarkable performance in 2017 reflects firming domestic demand, a gradual recovery in consumer spending and robust investment supported by fiscal stimulus.
In the Euro area, growth gained substantial momentum, culminating in output expansion of 2.4 percent in 2017, up from 1.8 percent in 2016. Growth partly reflects the continued stimulative stance of the European Central Bank bond-buying programme, coupled with improved global demand and investment and stronger private consumption.
Strong domestic demand in China and continued recovery in other key developed countries underpinned growth among developing market economies. As a result of rebound in the industrial sector, a resilient property market and strong export growth, aggregate output expanded by 6.9 percent in China during 2017. Growing private consumption and services supported strong and robust economic growth in India, with output expanding by 6.7 percent. Brazil’s return to positive growth during the first quarter of 2017 (after eight quarters
of contraction) reflects strong export performance and a slowdown in the decline of domestic demand. Brazil recorded an annualised growth rate of 1 percent in 2017, compared with a contraction of 3.5 percent in 2016. Notwithstanding the uncertainty related to the renegotiation of the North American Free Trade Agreement (NAFTA) and tightening of monetary policy over the past two years, Mexico continued its growth momentum, while recovering domestic and external demand supported growth in Russia and Turkey. Growth in developing countries as a group strengthened to 4.6 percent in 2017, from 4.3 percent in 2016.
3.1.2 Price Developments
Inflation at the global level increased to 3.2 percent in 2017, up from 2.8 percent in 2016, on account of increasing commodity prices, especially firming up oil prices in 2017 following the slow recovery in the second half of 2016 (see Table 3.1 and Figure 3.1). Core inflation in advanced economies remained below central bank targets, notwithstanding the relative increase in general price levels. In the Euro area, core inflation remained low, while Japan witnessed negative core inflation for six months through July. In the United States—where core inflation is higher, though below the 2 percent target—the annual change in the core household consumption expenditure deflator declined because of the higher overall consumer price level. Developing market economies witnessed decreasing inflationary expectations with consumer price inflation falling for the second consecutive year, to 4.2 percent inflation in 2017, down marginally from 4.3 percent in 2016.
3.2 Output and Price Developments in Africa
3.2.1 Output Development
In line with the foregoing global output developments, real output growth in
34 CHAPTER THREE AFRICAN TRADE REPORT 2018
Table 3.2 Africa: Real GDP Growth, 2015 - 17 (annual percent change)
Country Name 2015 2016 2017Algeria 3,70 3,30 1,46Angola 3,01 -0,67 1,48Benin 2,10 4,03 5,40Botswana -1,70 4,29 4,48Burkina Faso 4,03 5,87 6,38Burundi -3,96 -1,04 0,00Cameroon 5,77 4,67 3,97Cape Verde 1,01 3,82 3,99Central African Republic 4,80 4,53 4,75Chad 1,77 -6,43 0,60Comoros 1,03 2,16 3,30Congo, Dem. Rep. of 6,92 2,40 2,78Congo, Rep. of 2,62 -2,81 -3,63Côte d’Ivoire 8,94 7,71 7,63Djibouti 6,50 6,50 7,00Egypt 4,37 4,30 4,10Equatorial Guinea -9,13 -9,69 -7,39Eritrea 4,78 3,67 3,26Ethiopia 10,41 7,96 8,46Gabon 3,88 2,08 0,96Gambia 4,30 2,22 3,00Ghana 3,84 3,47 5,89Guinea 3,51 6,63 6,66Guinea-Bissau 5,11 5,09 5,00Kenya 5,71 5,85 5,02Lesotho 2,53 2,36 4,64Liberia 0,02 -1,64 2,57Libya -10,29 -2,98 55,09Madagascar 3,12 4,18 4,34Malawi 2,95 2,27 4,50Mali 5,96 5,79 5,30Mauritania 0,92 1,74 3,76Mauritius 3,50 3,90 3,90Morocco 4,55 1,22 4,82Mozambique 6,59 3,85 4,75Namibia 5,99 1,08 0,79Niger 3,96 5,03 4,20Nigeria 2,65 -1,62 1,00Rwanda 8,87 5,93 6,16Sao Tome and Principe 3,96 4,10 5,00Senegal 6,46 6,74 6,80Seychelles 4,98 4,48 4,06Sierra Leone -20,49 6,07 6,03Somalia 3,60 3,20 2,42South Africa 1,30 0,28 0,70South Sudan -0,17 -13,83 -6,26Sudan 4,88 3,05 3,75Swaziland 1,10 -0,01 0,25Tanzania 6,95 6,95 6,50Togo 5,30 5,00 5,00Tunisia 1,10 1,00 2,33Uganda 5,67 2,32 4,44Zambia 2,92 3,42 3,98Zimbabwe 1,42 0,65 2,81
Sources: IMF (2017) World Economic Outlook Database (October)
AFREXIMBANK AFRICAN TRADE REPORT 2018 35
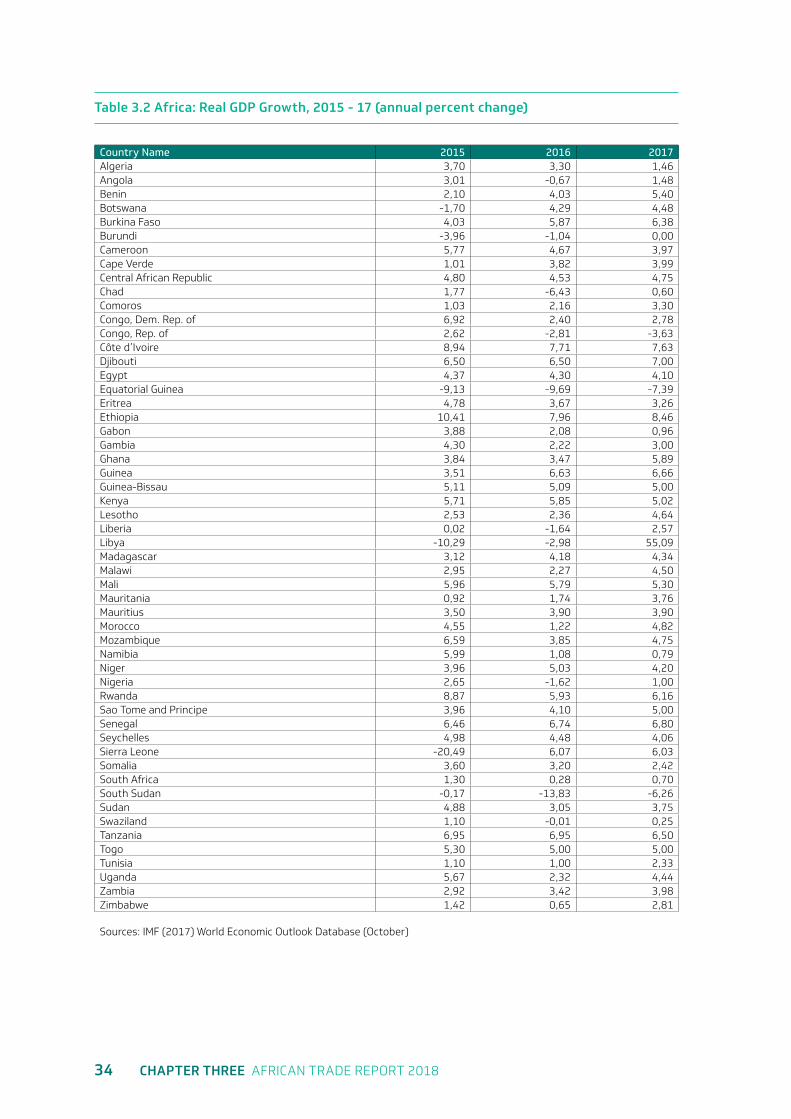
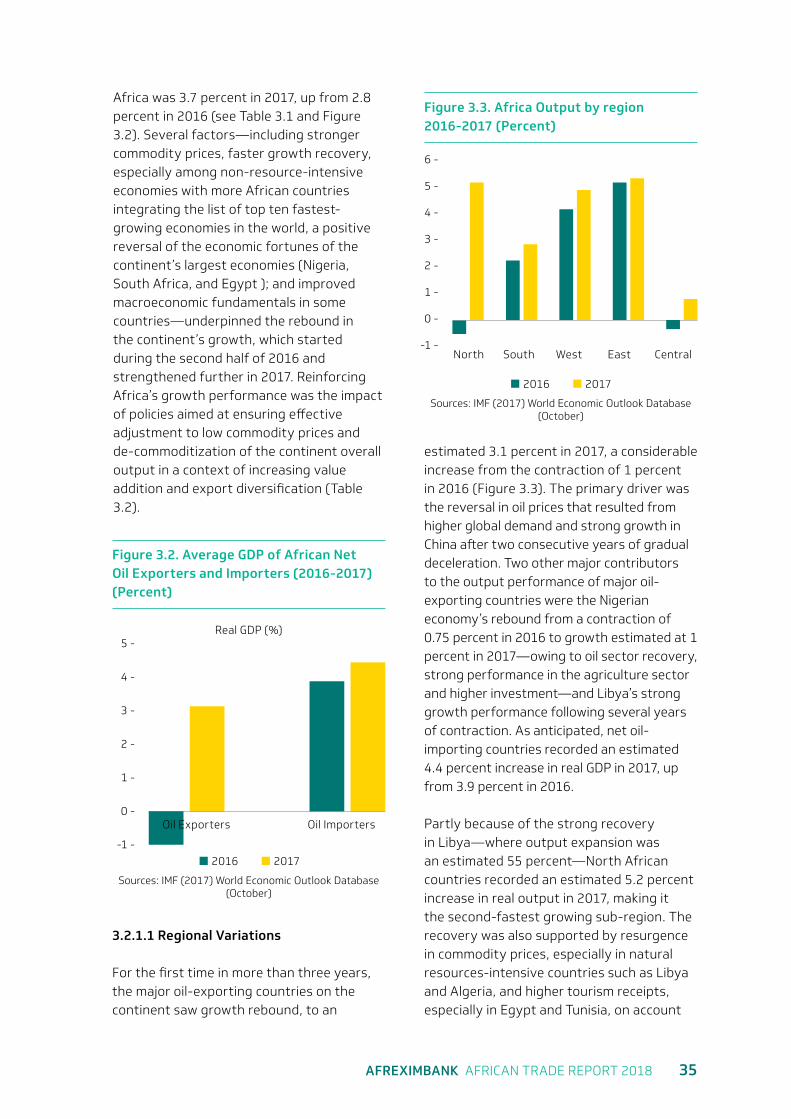
Africa was 3.7 percent in 2017, up from 2.8 percent in 2016 (see Table 3.1 and Figure 3.2). Several factors—including stronger commodity prices, faster growth recovery, especially among non-resource-intensive economies with more African countries integrating the list of top ten fastest-growing economies in the world, a positive reversal of the economic fortunes of the continent’s largest economies (Nigeria, South Africa, and Egypt ); and improved macroeconomic fundamentals in some countries—underpinned the rebound in the continent’s growth, which started during the second half of 2016 and strengthened further in 2017. Reinforcing Africa’s growth performance was the impact of policies aimed at ensuring effective adjustment to low commodity prices and de-commoditization of the continent overall output in a context of increasing value addition and export diversification (Table 3.2).
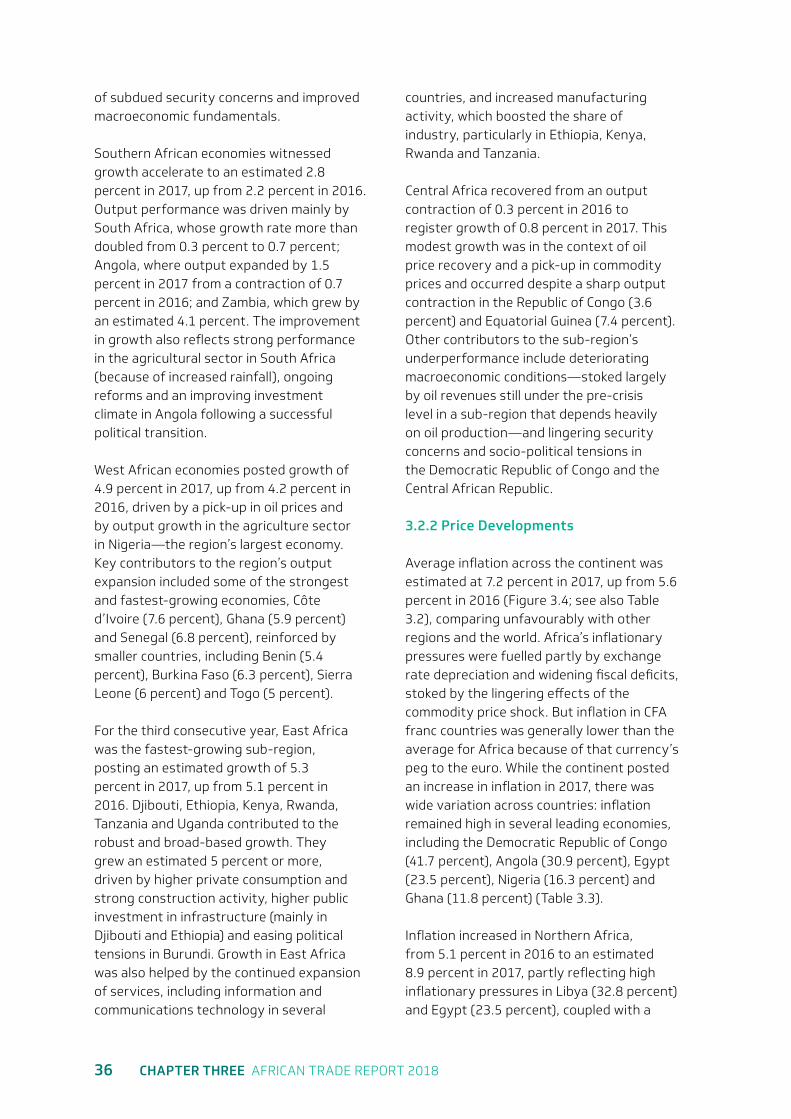
estimated 3.1 percent in 2017, a considerable increase from the contraction of 1 percent in 2016 (Figure 3.3). The primary driver was the reversal in oil prices that resulted from higher global demand and strong growth in China after two consecutive years of gradual deceleration. Two other major contributors to the output performance of major oil-exporting countries were the Nigerian economy’s rebound from a contraction of 0.75 percent in 2016 to growth estimated at 1 percent in 2017—owing to oil sector recovery, strong performance in the agriculture sector and higher investment—and Libya’s strong growth performance following several years of contraction. As anticipated, net oil-importing countries recorded an estimated 4.4 percent increase in real GDP in 2017, up from 3.9 percent in 2016.
Partly because of the strong recovery in Libya—where output expansion was an estimated 55 percent—North African countries recorded an estimated 5.2 percent increase in real output in 2017, making it the second-fastest growing sub-region. The recovery was also supported by resurgence in commodity prices, especially in natural resources-intensive countries such as Libya and Algeria, and higher tourism receipts, especially in Egypt and Tunisia, on account
Figure 3.3. Africa Output by region 2016-2017 (Percent)
North WestSouth East Central
6 -
2 -
4 -
-1 -
5 -
1 -
3 -
0 -
2016 2017
Real GDP (%)
Oil Exporters Oil Importers
3 -
5 -
1 -
-1 -
2 -
4 -
0 -
2016 2017
Figure 3.2. Average GDP of African Net Oil Exporters and Importers (2016-2017) (Percent)
3.2.1.1 Regional Variations
For the first time in more than three years, the major oil-exporting countries on the continent saw growth rebound, to an
Sources: IMF (2017) World Economic Outlook Database (October)
Sources: IMF (2017) World Economic Outlook Database (October)
36 CHAPTER THREE AFRICAN TRADE REPORT 2018
of subdued security concerns and improved macroeconomic fundamentals.
Southern African economies witnessed growth accelerate to an estimated 2.8 percent in 2017, up from 2.2 percent in 2016. Output performance was driven mainly by South Africa, whose growth rate more than doubled from 0.3 percent to 0.7 percent; Angola, where output expanded by 1.5 percent in 2017 from a contraction of 0.7 percent in 2016; and Zambia, which grew by an estimated 4.1 percent. The improvement in growth also reflects strong performance in the agricultural sector in South Africa (because of increased rainfall), ongoing reforms and an improving investment climate in Angola following a successful political transition.
West African economies posted growth of 4.9 percent in 2017, up from 4.2 percent in 2016, driven by a pick-up in oil prices and by output growth in the agriculture sector in Nigeria—the region’s largest economy. Key contributors to the region’s output expansion included some of the strongest and fastest-growing economies, Côte d’Ivoire (7.6 percent), Ghana (5.9 percent) and Senegal (6.8 percent), reinforced by smaller countries, including Benin (5.4 percent), Burkina Faso (6.3 percent), Sierra Leone (6 percent) and Togo (5 percent).
For the third consecutive year, East Africa was the fastest-growing sub-region, posting an estimated growth of 5.3 percent in 2017, up from 5.1 percent in 2016. Djibouti, Ethiopia, Kenya, Rwanda, Tanzania and Uganda contributed to the robust and broad-based growth. They grew an estimated 5 percent or more, driven by higher private consumption and strong construction activity, higher public investment in infrastructure (mainly in Djibouti and Ethiopia) and easing political tensions in Burundi. Growth in East Africa was also helped by the continued expansion of services, including information and communications technology in several
countries, and increased manufacturing activity, which boosted the share of industry, particularly in Ethiopia, Kenya, Rwanda and Tanzania.
Central Africa recovered from an output contraction of 0.3 percent in 2016 to register growth of 0.8 percent in 2017. This modest growth was in the context of oil price recovery and a pick-up in commodity prices and occurred despite a sharp output contraction in the Republic of Congo (3.6 percent) and Equatorial Guinea (7.4 percent). Other contributors to the sub-region’s underperformance include deteriorating macroeconomic conditions—stoked largely by oil revenues still under the pre-crisis level in a sub-region that depends heavily on oil production—and lingering security concerns and socio-political tensions in the Democratic Republic of Congo and the Central African Republic.
3.2.2 Price Developments
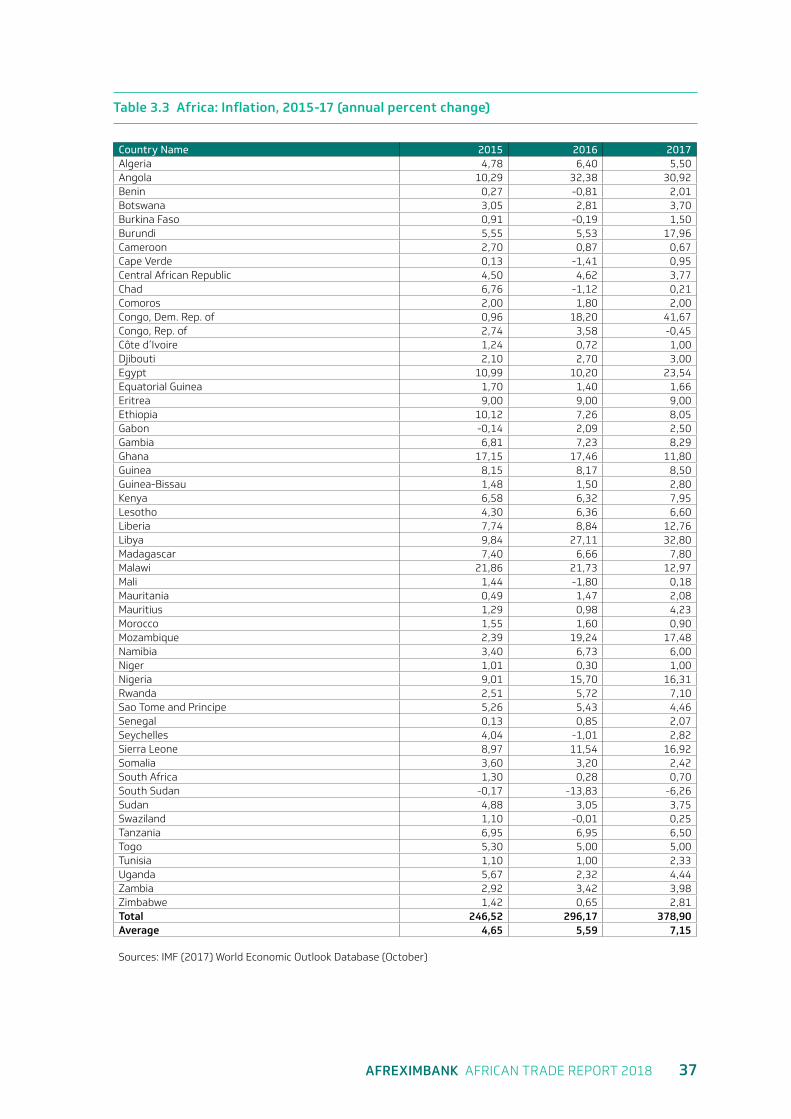
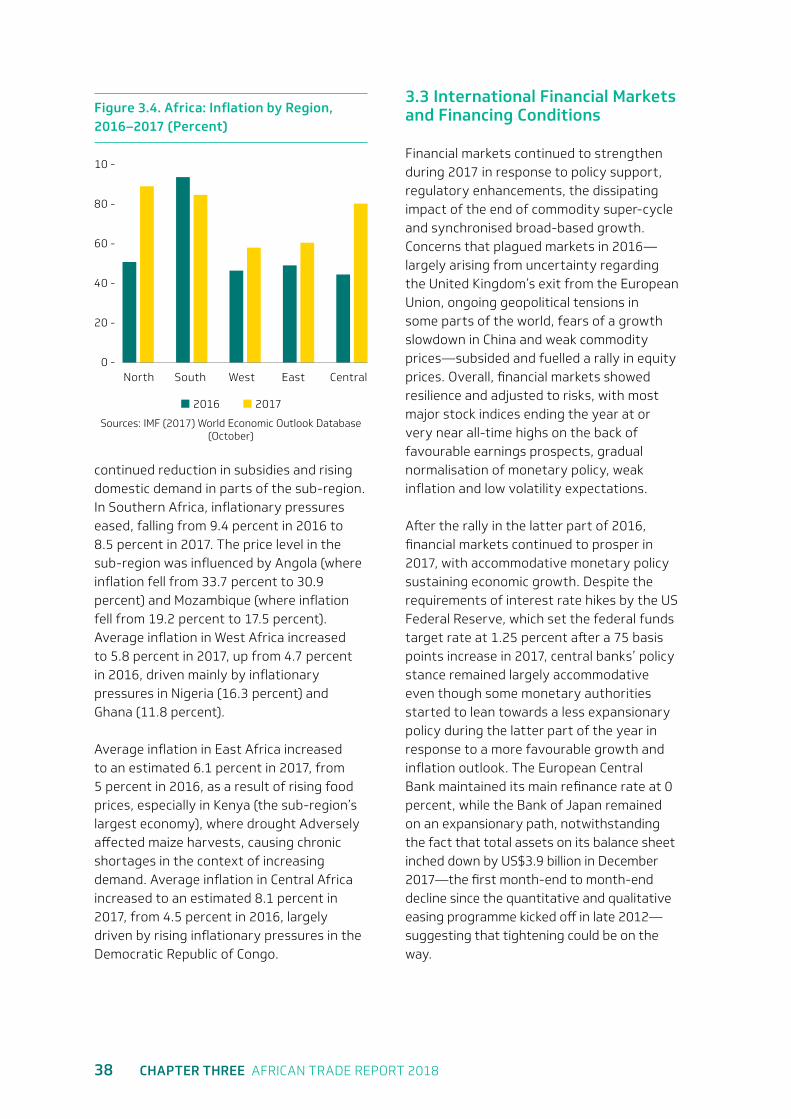
Average inflation across the continent was estimated at 7.2 percent in 2017, up from 5.6 percent in 2016 (Figure 3.4; see also Table 3.2), comparing unfavourably with other regions and the world. Africa’s inflationary pressures were fuelled partly by exchange rate depreciation and widening fiscal deficits, stoked by the lingering effects of the commodity price shock. But inflation in CFA franc countries was generally lower than the average for Africa because of that currency’s peg to the euro. While the continent posted an increase in inflation in 2017, there was wide variation across countries: inflation remained high in several leading economies, including the Democratic Republic of Congo (41.7 percent), Angola (30.9 percent), Egypt (23.5 percent), Nigeria (16.3 percent) and Ghana (11.8 percent) (Table 3.3).
Inflation increased in Northern Africa, from 5.1 percent in 2016 to an estimated 8.9 percent in 2017, partly reflecting high inflationary pressures in Libya (32.8 percent) and Egypt (23.5 percent), coupled with a
AFREXIMBANK AFRICAN TRADE REPORT 2018 37
Table 3.3 Africa: Inflation, 2015-17 (annual percent change)
Country Name 2015 2016 2017Algeria 4,78 6,40 5,50Angola 10,29 32,38 30,92Benin 0,27 -0,81 2,01Botswana 3,05 2,81 3,70Burkina Faso 0,91 -0,19 1,50Burundi 5,55 5,53 17,96Cameroon 2,70 0,87 0,67Cape Verde 0,13 -1,41 0,95Central African Republic 4,50 4,62 3,77Chad 6,76 -1,12 0,21Comoros 2,00 1,80 2,00Congo, Dem. Rep. of 0,96 18,20 41,67Congo, Rep. of 2,74 3,58 -0,45Côte d’Ivoire 1,24 0,72 1,00Djibouti 2,10 2,70 3,00Egypt 10,99 10,20 23,54Equatorial Guinea 1,70 1,40 1,66Eritrea 9,00 9,00 9,00Ethiopia 10,12 7,26 8,05Gabon -0,14 2,09 2,50Gambia 6,81 7,23 8,29Ghana 17,15 17,46 11,80Guinea 8,15 8,17 8,50Guinea-Bissau 1,48 1,50 2,80Kenya 6,58 6,32 7,95Lesotho 4,30 6,36 6,60Liberia 7,74 8,84 12,76Libya 9,84 27,11 32,80Madagascar 7,40 6,66 7,80Malawi 21,86 21,73 12,97Mali 1,44 -1,80 0,18Mauritania 0,49 1,47 2,08Mauritius 1,29 0,98 4,23Morocco 1,55 1,60 0,90Mozambique 2,39 19,24 17,48Namibia 3,40 6,73 6,00Niger 1,01 0,30 1,00Nigeria 9,01 15,70 16,31Rwanda 2,51 5,72 7,10Sao Tome and Principe 5,26 5,43 4,46Senegal 0,13 0,85 2,07Seychelles 4,04 -1,01 2,82Sierra Leone 8,97 11,54 16,92Somalia 3,60 3,20 2,42South Africa 1,30 0,28 0,70South Sudan -0,17 -13,83 -6,26Sudan 4,88 3,05 3,75Swaziland 1,10 -0,01 0,25Tanzania 6,95 6,95 6,50Togo 5,30 5,00 5,00Tunisia 1,10 1,00 2,33Uganda 5,67 2,32 4,44Zambia 2,92 3,42 3,98Zimbabwe 1,42 0,65 2,81Total 246,52 296,17 378,90Average 4,65 5,59 7,15
Sources: IMF (2017) World Economic Outlook Database (October)
38 CHAPTER THREE AFRICAN TRADE REPORT 2018
continued reduction in subsidies and rising domestic demand in parts of the sub-region. In Southern Africa, inflationary pressures eased, falling from 9.4 percent in 2016 to 8.5 percent in 2017. The price level in the sub-region was influenced by Angola (where inflation fell from 33.7 percent to 30.9 percent) and Mozambique (where inflation fell from 19.2 percent to 17.5 percent). Average inflation in West Africa increased to 5.8 percent in 2017, up from 4.7 percent in 2016, driven mainly by inflationary pressures in Nigeria (16.3 percent) and Ghana (11.8 percent).
Average inflation in East Africa increased to an estimated 6.1 percent in 2017, from 5 percent in 2016, as a result of rising food prices, especially in Kenya (the sub-region’s largest economy), where drought Adversely affected maize harvests, causing chronic shortages in the context of increasing demand. Average inflation in Central Africa increased to an estimated 8.1 percent in 2017, from 4.5 percent in 2016, largely driven by rising inflationary pressures in the Democratic Republic of Congo.
3.3 International Financial Markets and Financing Conditions
Financial markets continued to strengthen during 2017 in response to policy support, regulatory enhancements, the dissipating impact of the end of commodity super-cycle and synchronised broad-based growth. Concerns that plagued markets in 2016—largely arising from uncertainty regarding the United Kingdom’s exit from the European Union, ongoing geopolitical tensions in some parts of the world, fears of a growth slowdown in China and weak commodity prices—subsided and fuelled a rally in equity prices. Overall, financial markets showed resilience and adjusted to risks, with most major stock indices ending the year at or very near all-time highs on the back of favourable earnings prospects, gradual normalisation of monetary policy, weak inflation and low volatility expectations.
After the rally in the latter part of 2016, financial markets continued to prosper in 2017, with accommodative monetary policy sustaining economic growth. Despite the requirements of interest rate hikes by the US Federal Reserve, which set the federal funds target rate at 1.25 percent after a 75 basis points increase in 2017, central banks’ policy stance remained largely accommodative even though some monetary authorities started to lean towards a less expansionary policy during the latter part of the year in response to a more favourable growth and inflation outlook. The European Central Bank maintained its main refinance rate at 0 percent, while the Bank of Japan remained on an expansionary path, notwithstanding the fact that total assets on its balance sheet inched down by US$3.9 billion in December 2017—the first month-end to month-end decline since the quantitative and qualitative easing programme kicked off in late 2012—suggesting that tightening could be on the way.
Figure 3.4. Africa: Inflation by Region, 2016–2017 (Percent)
North WestSouth East Central
10 -
40 -
80 -
20 -
60 -
0 -
2016 2017
Sources: IMF (2017) World Economic Outlook Database (October)
AFREXIMBANK AFRICAN TRADE REPORT 2018 39
The Bank of England bucked the trend by raising its policy rate from 0.25 percent to 0.5 percent—the first rate hike since 2008—in what it called a “gradual and limited” cycle to counter inflation. The US Federal Reserve also started unwinding its US$4.4 trillion balance sheet during the last quarter of 2017, by initially reducing bond purchases to US$10 billion per month with a plan to increasing it to U$50 billion per month by early 2019. Consistent with still subdued market expectations of inflation, bond markets remained largely muted, with yield curves flat as short-term rates rose more than long-term rates.
Driven by the synchronised upswing in global activity and developments in the United States, global equity markets continued to rally in 2017. The Japanese stock market was among the best performers of developed countries (in local currency terms), with the Nikkei 225 index rising to levels last seen in
1992. In the United States, the benchmark S&P 500 index finished with a return of 19.4 percent, and the Dow Jones Industrial Average hit an all-time high in December 2017 (within a few points of 25,000), ending the year up more than 25 percent. London’s benchmark FTSE 100 index rose by more than 8.3 percent, to an all-time high of 7,687 points. European stocks also continued to make progress, helped by upbeat economic numbers, particularly in manufacturing and services growth. The Euro Stoxx 50 index rose to its highest level in more than two years, and Germany’s Dax index hit a record high of 13,478 points in December 2017. Conversely, EU bond yields remained relatively flat, given continued quantitative easing bond purchases by the European Central Bank.
Markets in developing economies were boosted by the rally in oil prices as well as a recovery in the prices of base metals and
40 CHAPTER THREE AFRICAN TRADE REPORT 2018
iron ore. The MSCI’s World Equity Index, which tracks 47 countries, ended the year 22 percent higher. Although these gains primarily reflected stock market movements in China, India and other Asian economies, Latin American countries, especially Argentina, Peru and Brazil—also rallied significantly with the recovery of commodity prices. Sovereign debts also enjoyed support from international bond investors as improving credit quality and high running yields made these bonds attractive relative to developed market offerings.
The dollar index, which represents a basket of currencies dominated by the euro, dropped 9.9 percent in 2017, its worst performance since 2003. After a year of excess volatility following the June 2016
Brexit referendum, the pound sterling recovered in 2017, ending the year 10 percent higher against the US dollar. The euro clawed back lost ground in 2016, ending the year 14 percent higher against the US dollar, while the Japanese yen ended the year 3.8 percent up against the US dollar. Meanwhile, the Chinese yuan gained 6.3 percent against the US dollar on the back of stronger-than-expected growth in China. The South African rand ended the year 9.8 percent firmer against the US dollar, partly on an improved growth outlook and political environment.
A weaker dollar, combined with attractive yields, strong growth and further opening of bond markets, saw capital flows to developing economies strengthen in 2017.
AFREXIMBANK AFRICAN TRADE REPORT 2018 41
According to the Institute for International Finance, 2017 was the strongest year on aggregate since 2014, as portfolio flows to developing markets reached US$235 billion. Financing conditions remained largely accommodative in 2017 as policymakers continued attempts to stoke growth and steer inflation towards prescribed targets. Despite three interest rate hikes by the US Federal Reserve, US Treasury yields ended the year slightly lower, as continued undershooting of inflation target kept a lid on bond yields. In the UK bond market, yields on the 10-year gilt also ended the year marginally lower despite the Bank of England raising interest rates. Financing conditions in China saw some tightening as the country tries to contain and reduce systemic threats to its financial system, with the central bank keeping liquidity tight as it seeks to flush
out speculative financing and force local governments to keep their debt levels under control.
Notwithstanding the generally favourable global environment, financing conditions remained tight in Africa, with limited liquidity occasioned by the lingering effect of the end of the commodity super-cycle and the withdrawal of a large number of international financial institutions from the African market in response to an increasingly stringent compliance and regulatory environment and implementation of sanctions. Challenges surrounding letters of credit confirmation resulting from the large-scale withdrawal of major banks, among others, meant that access to funds by African entities remained difficult or was at a higher premium relative to overall global financing conditions.
END
4Chapter Four
AFREXIMBANK AFRICAN TRADE REPORT 2018 43
Trade and the Trading Environment
4.1 Global Trade
Growth in global merchandise trade accelerated to 4.7 percent in 2017, from 1.8 percent in 2016. This turnaround in global trade marked the end of five years of stagnation since 2011 where global merchandise trade achieved a growth rate of 5.2 percent. According to the World Trade Organization (World Trade Statistical Review 2017/18), trade exceeded US$33 trillion in 2017, on the back of a surge in world merchandise exports—which rose by 11 percent, to US$17.2 trillion, from US$15.46 trillion in 2016—and strong import demand across regions.
The acceleration of growth in world merchandise trade in 2017 was driven largely by synchronised expansion in global output and firm recovery in global demand; a sustained pick-up in oil prices and other primary commodities; robust growth in China; and recovery in other large developing economies such as Brazil and Russia, which emerged from recession. The synchronised growth in the global economy also meant that both developed and developing regions contributed to stronger global trade in 2017, though developing regions remained the main drivers of trade. In effect, growth in merchandise imports in developing countries picked up to 7.2 percent in 2017, from 1.9 percent in 2016, supported by strong output performance, particularly in Asia, while growth in merchandise exports was 5.7 percent in 2017, up from 2.3 percent
in 2016. In developed countries, growth in merchandise imports was 3.1 percent in 2017, up from 2 percent in 2016, while growth in exports quickened to 3.5 percent in 2017, from 1.1 percent in 2016.
Asia was the fastest-growing region in 2017, with exports posting growth of 6.7 percent in 2017, up from 2.3 percent in 2016, and imports posting growth of 9.6 percent in 2017, up from 3.5 percent, reflecting a pick-up in economic activity in the region, led by China with strong trade flows. The value of China’s merchandise imports increased to US$1.84 trillion in 2017, from US$1.59 trillion in 2016, while merchandise exports increased to US$2.3 trillion in 2017, from US$2.1 trillion in 2016.
In South and Central America, trade growth recovered in 2017 on the back of a sustained recovery in prices of oil and other primary commodities. Accordingly, merchandise imports in the region grew by 4 percent in 2017, after a contraction of 6.8 percent in 2016, while growth in exports strengthened to 2.9 percent in 2017, up from 1.9 percent in 2016. Brazil’s recovery from recession, alongside improvement in the socio-political environment and macroeconomic management in the country, significantly contributed to boost trade performance in the region.
In North America, both imports and exports experienced strong growth, with growth in imports accelerating to 4 percent in 2017,
44 CHAPTER FOUR AFRICAN TRADE REPORT 2018
from less than 1 percent in 2016, while exports quickened to 4.2 percent, from 0.6 percent in 2016. This performance resulted from synchronised acceleration in imports and exports in Canada, Mexico, and the United States, which are members of the North American Free Trade Agreement (NAFTA). Trade flows in Europe also continued to expand, with growth in exports increasing to 3.5 percent in 2017, up from just over 1 percent in 2016, though growth in imports decelerated to 2.5 percent in 2017, from to 3.1 percent in 2016.
4.2 Global Trade Environment
Despite the strong recovery in 2017, the global trading environment was dominated by uncertainty following the rise of protectionism and beggar-thy-neighbour policies, especially in leading advanced economies (See Box 4.1). In particular, after Brexit, the US presidential election was dominated by the protection of uncompetitive US special interests and industries a major departure from the liberal US-led rules-based international trade regimes that had been promoted by both Democrats and Republicans as the
cornerstone of US global engagement since the 1930s.
Once in the White House, President Trump quickly followed through on his protectionist agenda by withdrawing the United States from the Trans-Pacific Partnership (TPP), which was negotiated under the previous administration (President Barack Obama’s) but never ratified by Congress. The withdrawal was subsequently reinforced by an Executive Order to renegotiate or terminate any existing trade or investment agreement or trade relation that, on a net basis, is unfavourable to the economy and interests of the United States. The Executive Order requires the review of all bilateral, plurilateral and multilateral trade agreements and investment agreements to which the United States is a party and all trade relations with countries that are governed by the rules of the World Trade Organization (WTO) and with which the United States does not have a free trade agreement but with which the United States runs a significant trade deficit in goods.
Following the withdrawal from the TPP, in 2016, the Trump Administration suspended negotiations between the United States
AFREXIMBANK AFRICAN TRADE REPORT 2018 45
and the European Union under the Trans-Atlantic Trade and Investment Partnership. The first agreement subject to review under the new Executive Order was NAFTA between the United States, Canada and
Mexico. To reduce the trade deficit with NAFTA partners—especially with Mexico, with which the deficit stood at US$63.2 billion in 2016—renegotiation of NAFTA commenced in August 2017 and is ongoing.
In response to lackluster growth, a widening trade deficit, falling real wages and the quest for sustained economic recovery, President Trump has made import tariffs and the departure from multilateral trade arrangements the center piece of his administration’s economic policies, even though consensus among policymakers and economists suggested that technological changes, rather than international trade, had been the main driver of labor market changes observed in recent decades. The looming generalised global trade war initiated by the current U.S. Administration through its “Buy American” and “America First” policy stance holds important implications for growth prospects globally and in Africa, both directly and indirectly.
Indirectly, the disruption of supply chains associated with the raising of tariffs and the renegotiation of existing trade agreements to reduce the U.S. trade deficits and rebalance trade could undermine the growth of world merchandise trade, which fell to its lowest level after the global financial crisis and has been recovering steadily, though in 2015 world merchandise trade grew less than global output. For instance, even though the U.S. trade deficit with Mexico reflects the fact that imports from Mexico often include US value-added in the increasingly integrated North American
supply chains, the Trump Administration has already taken a number of measures intended to narrow the trade deficit and boost U.S. job growth.1 While in line with the “America First” policy shift measures to punish companies seeking to move operations overseas are likely to stymie trade and investment flows and disrupt regional and global supply chains, which have enhanced the competitiveness of U.S. corporations by enabling them to take advantage of low-cost inputs. For instance, tightening rules of origin requirements or the introduction of a 5-year sunset-clause is likely to impact Mexico’s booming auto sector, which has benefited from NAFTA as major manufacturers have made the country a top export hub. In addition to depressing global trade and investment, the Trump Administration’s approach to NAFTA could have knock-on effects for China’s exports to Mexico—worth US$36 billion in 2017, a significant share of which relates inputs to the auto industry.
China and the EU, which collectively account for over half of the U.S.’s trade deficit (over 32% and 19% respectively in 2017) and who are among the leading global trading nations and Africa’s leading
1 According to the OECD, over 45 percent of
Mexican exports comprise foreign value
added.
Box 4.1: Global Trade War: Implications for Africa
46 CHAPTER FOUR AFRICAN TRADE REPORT 2018
trade partners have not been spared from the current U.S. Administration’s trade onslaught. Following the imposition of tariffs on solar panels and washing machines, U.S. President Donald Trump’s announced plans to introduce a 25 percent tariff on steel imports and a 10 percent tariff on aluminum imports. The Trump Administration has also threatened to impose duties on up to $450 billion of Chinese imports and a 20 percent tariff on cars form the EU. China accounts for the lion’s share of the U.S.’s trade deficit (over 32% in 2017). The US is the largest market for EU car exports, amounting to US$41 billion total in 2017, with Germany alone accounting for over half of this value. In response to the imposition of duties on steel and aluminum, a number of countries, including China, the EU, India and Turkey have threatened to impose retaliatory tariffs on U.S. products, with both China and the EU initiating WTO complaints against the. U.S.
Implementation of measures to curb a trade surplus in a context where a China is undergoing a process of rebalancing from export and investment-led growth to consumption-led growth and the EU continues to struggle to stimulate growth following the debt crisis poses potential downside risks to growth and may lead to output deceleration. Should such an occurrence materialize, the costs and implications for Africa could be pronounced as China and the EU remain the region’s largest trading partners—collectively accounting for about 50 percent of Africa’s total trade in 2017. The impact on Africa could be especially pronounced given that that the region has become heavily dependent on China in recent years. For instance, IMF research analyzing Africa’s rising exposure to China has shown that a 1% decline in China’s
domestic investment growth is associated with an average 0.6% decline in African countries’ growth. The extent seems to be even more pronounced for resource-rich countries, especially oil exporters.
Conversely, efforts by the U.S. to redress trade imbalances may also present opportunities for Africa, as manufacturing companies, especially Chinese, seek to relocate to Africa to take advantage of lower costs and preferential access into the U.S. market afforded by the African Growth and Opportunity Act (AGOA)—provided AGOA benefits are retained. A total of 36 African countries currently enjoy trade preferences with the U.S under AGOA while others enjoy preferences through bilateral trade agreements (e.g. Egypt’s QIZ2 and Morocco’s FTA), and although no actions have been taken in respect of agreements with African countries, it could be expected that they will also be subject to review under Trump Administrations Executive Order to renegotiate or terminate any existing trade or investment agreement, or trade relation that, on a net basis, is unfavourable to the United States’ economy and interest. However, given the relatively small trade deficit the U.S. runs with Africa (US$4.8 billion in 2016, after three consecutive years of surpluses accumulated by the USA, figure B4.1) and the unlikelihood of the deficit widening in the short to medium term given that the U.S. is on the path to energy independence—the bulk
2 Qualified Industrial Zones (QIZ) are designated
geographical areas within Egypt that enjoy a
duty-free status with the United States. The
QIZ which started operating in 7 designated
areas in 2005 now covers 15 industrial
zones with nearly 700 qualified companies
amounting to over $1 billion annual revenues.
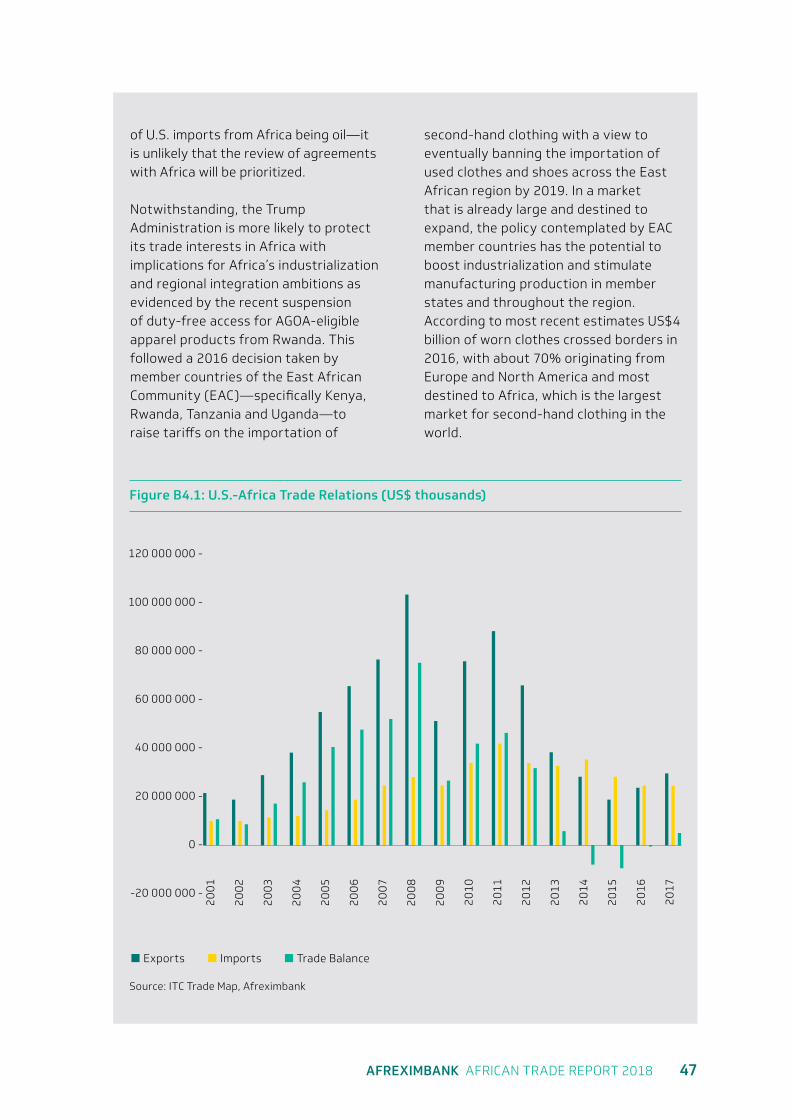
AFREXIMBANK AFRICAN TRADE REPORT 2018 47
of U.S. imports from Africa being oil—it is unlikely that the review of agreements with Africa will be prioritized.
Notwithstanding, the Trump Administration is more likely to protect its trade interests in Africa with implications for Africa’s industrialization and regional integration ambitions as evidenced by the recent suspension of duty-free access for AGOA-eligible apparel products from Rwanda. This followed a 2016 decision taken by member countries of the East African Community (EAC)—specifically Kenya, Rwanda, Tanzania and Uganda—to raise tariffs on the importation of
second-hand clothing with a view to eventually banning the importation of used clothes and shoes across the East African region by 2019. In a market that is already large and destined to expand, the policy contemplated by EAC member countries has the potential to boost industrialization and stimulate manufacturing production in member states and throughout the region. According to most recent estimates US$4 billion of worn clothes crossed borders in 2016, with about 70% originating from Europe and North America and most destined to Africa, which is the largest market for second-hand clothing in the world.
Figure B4.1: U.S.-Africa Trade Relations (US$ thousands)
Source: ITC Trade Map, Afreximbank
Exports Imports Trade Balance
120 000 000 -
100 000 000 -
80 000 000 -
60 000 000 -
40 000 000 -
20 000 000 -
0 -
20
01
20
05
20
09
201
3
20
03
20
07
201
1
201
5
20
02
20
06
201
0
201
4
20
04
20
08
201
2
201
6
201
7
-20 000 000 -
48 CHAPTER FOUR AFRICAN TRADE REPORT 2018
In response, the USTR announced that it was reviewing trade benefits to these countries after a petition by the Secondary Materials and Recycled Textiles Association (SMART) that East African restrictions on imports of used clothing “imposed significant hardship” on the U.S. used-clothing industry and violated AGOA rules. The East African Community is one of the most important markets for US used clothing exports, with direct American exports to the EAC member countries estimated at US$53 million and representing about 19.5% of the sub-region’s imports of used clothing (worth US$274 million) in 2015. Kenya, Tanzania and Uganda subsequently backed away from plans to impose the restrictions. However, the decision by Rwanda to continue with the tariff increases and the eventual ban, resulted in the USTR suspending duty-free access for Rwanda. While not significant in terms of trade value—Rwanda exported approximately US$460,000 worth of textiles and apparel to the US in 2016—the move does show that the “America First” policy articulated and implemented by the Trump Administration is not confined to the US’s largest trading partners and clearly illustrates the constraints and challenges posed to African countries on the path to industrialization and economic integration both at the regional and continental level.
The action by the USTR action was pursued even though the U.S. enjoys a large trade surplus with these countries (worth US$150 million in 2017). The threat and unilateral withdrawal of AGOA or other trade preferences creates uncertainty and could discourage potential investments in manufacturing capacity on the continent while also turning investments made to benefit
from AGOA into sunk costs. This challenge faced by the region on the industrial development path is exacerbated by the inability of African countries to strengthen their bargaining power in international trade negotiations both at the regional and continental level, especially as the region contemplates the transition towards the African Continental Free Trade Area (AfCFTA).
As evidenced from the EAC instance, the tough stance taken by the Trump Administration on trade and the preference for bilateral trade agreements over multilateral trade agreements can hold serious implications for Africa’s integration agenda. Although the decision to hike import duties on worn clothes and eventually phase out imports of such goods was a collective move by member countries of the EAC, leading countries backed down in the face of threats to suspend the benefits extended under AGOA, exposing the large and growing regional market to continued dumping and in the process undermining the burgeoning domestic textile and apparel industry. Through bilateral agreements, the U.S. will be able to exert more influence on partners with which it has stronger trade relationships, including Angola, Rwanda, Ethiopia, Gabon, Egypt, South Africa and Liberia—which have a combined share of over 66% of U.S. trade with Africa. The preference of the Trump Administration to engage individual African countries as opposed to a unified Africa is a major threat and risk to ongoing efforts to deepen the process of economic integration in Africa. In the short term mitigating that risk will call for even stronger commitment towards the implementation of the AfCFTA by African leaders.
AFREXIMBANK AFRICAN TRADE REPORT 2018 49
Despite a strong stance on China during the election campaign, President Trump did not immediately follow through on his promises to raise tariffs against China and label the country a currency manipulator. However, in a push for more balanced trade, the United States reached a 10-point trade deal with China that opens the Chinese market to US credit rating agencies and credit card companies, lifts the Chinese ban on US beef imports and accept US shipments of liquefied natural gas. In return, Chinese banks are allowed to enter the US market. Despite the apparent softening of President Trump’s stance, the proclivity to protectionism remains, evidenced by the national security review of US use of Chinese steel and renewed threats to impose tariffs on steel and aluminium products.
Amid growing anti-trade sentiments globally and increasing preference for bilateral trade agreements, especially from leading developed economies, ministers of WTO member countries met from 10 to 13 December 2017 in Buenos Aires, Argentina, to decide on the future of multilateral trade negotiations. After three days of deliberations, the conference failed to reach consensus on any substantive issues. Disagreement between members who were unable to reaffirm the centrality of the multilateral trading system and the development dimension of the WTO Doha Development Agenda led to plurilateral discussions between several members on a range of issues, including e-commerce and investment facilitation.
At the December 2017 conference, 70 WTO members (including three African countries—Benin, Nigeria and Togo) announced plans to pursue structured discussions with the aim of developing a multilateral framework on investment facilitation. The proponents, which account for around 73 percent of trade and 66 percent of inward foreign direct investment, agreed to meet and discuss how to
organize outreach activities (workshops and seminars) and structured discussions. On e-commerce WTO members agreed to continue the work under the Work Programme on Electronic Commerce and agreed to maintain the current practice of not imposing customs duties on electronic transmissions at least until the 2019 ministerial conference.
WTO membership remained unchanged at the end of 2017, with 164 members covering over 98 percent of global trade. Despite the challenges facing the multilateral system, no country has terminated its membership, and 20 candidates—including Algeria, Ethiopia, Sudan, São Tomé and Príncipe, Equatorial Guinea and Libya—are currently negotiating for membership. The only African countries that are not a WTO member or not negotiating WTO membership are Eritrea and South Sudan.
Efforts to enhance the WTO trade facilitation agenda continued, as did implementation of capacity-building and training programmes. In 2017 the WTO’s landmark Trade Facilitation Agreement entered into force, as did an amendment to the Agreement on Trade-Related Aspects of Intellectual Property Rights (TRIPS). The Trade Facilitation Agreement entered into force on 22 February 2017 after two-thirds of WTO members had ratified it. By the end of 2017, 126 members had ratified it, with 112 of them notifying commitments. By speeding up the movement of goods across borders, the Trade Facilitation Agreement is expected to reduce trade costs globally by an average of 14 percent. The protocol amending the TRIPS Agreement entered into force on 23 January 2017 after ratification by two-thirds of WTO members. The protocol eases poorer WTO members’ access to medicines by allowing generic versions of patented medicines to be produced under compulsory licences for export to countries that cannot manufacture the medicines for themselves (WTO 2018).
50 CHAPTER FOUR AFRICAN TRADE REPORT 2018
The WTO also continued its key role in resolving trade disputes among members through its dispute settlement mechanism. As in previous years, both developed and developing country members were involved in the dispute settlement mechanism, both as complainants and as respondents. During 2017, WTO members filed 17 requests for consultations, the first step in the dispute settlement system, compared with 16 in 2016. Canada, Qatar and the United States filed the most disputes in 2017, with three each, followed by Russia and Ukraine with two each. The US veto of the appointment of new judges to the WTO’s Appellate Body slowed the handling of trade disputes and could halt the appeals process after the next judge retires in September 2018.
The review period also saw negotiations for regional and preferential trade agreements among countries and between regions, including mega-regional trade agreements such as the Trans-Pacific Partnership and Regional Comprehensive Economic Partnership (RCEP). Following the withdrawal of the United States, 11 of the original TPP signatories16 (which account for some 13 percent of world trade) agreed on core elements of a new trade pact to be implemented without the United States. The agreement is now called the Comprehensive and Progressive Agreement for Trans-Pacific Partnership (CPTPP). Negotiations towards the conclusion of the 16-country RCEP also continued in 2017. RCEP is a proposed free trade agreement between the 10 member states of the Association of Southeast Asian Nations17 and the six states with which ASEAN has existing free trade agreements.18 In 2017, prospective RCEP member states included 3.4 billion people and had a total GDP of US$49.5 trillion (in purchasing power parity terms), or approximately 39 percent of global GDP.
During 2017, 14 regional trade agreements and three accessions to existing regional trade agreements were notified to the WTO. Agreements notified included those
between the European Union and Canada, between China and Georgia, between India and Thailand, between Argentina and Brazil and between Turkey and Malaysia. African countries notified several regional trade agreements in 2017: the European Union–Southern African Development Community Economic Partnership Agreement, the European Union–Ghana Free Trade Agreement and the Southern African Customs Union–Mercosur Preferential Trade Agreement.
In addition, under the auspices of the African Union, African countries advanced negotiations for establishing the African Continental Free Trade Area (AfCFTA). Negotiations continued in 2017 and reached an important milestone in 2018. The AfCFTA which brought together 55 African countries with a total population of more than 1.2 billion people and a combined GDP exceeding US$2.5 trillion and will make the continent the largest free trade area ever created since the formation of the WTO. Apart from granting easier access to Africa’s large and growing market, the AfCFTA will enable members to draw on economies of scale to accelerate the process of diversification and transformation of their economies and in the process boost intra-African trade. It should also enhance competitiveness at the industry and enterprise levels through better allocation of resources and development of regional value chains. Moreover, growth opportunities offered by the AfCFTA could enhance flow of foreign direct investment and shift focus from natural resources to industry and manufacturing.
In 2017, the WTO continued providing technical assistance and training programmes on dispute settlement, trade-related intellectual property rights, regional trade agreements, sanitary and phytosanitary issues, trade in services and trade policy analysis to member countries. In July 2017, the WTO hosted the Global Review of Aid for Trade on the theme “Promoting
AFREXIMBANK AFRICAN TRADE REPORT 2018 51
Trade, Inclusiveness and Connectivity for Sustainable Development”. The conference underlined the important part played by trade—and the key role of Aid for Trade—in delivering growth, reducing poverty and achieving the Sustainable Development Goals. The WTO also undertook 350 technical assistance activities, including e-learning, global and regional training courses, academic programmes, and national and regional workshops aimed at giving government officials from developing countries a better understanding of WTO agreements. Approximately 18,500 participants undertook technical assistance activities during the year (WTO 2018).
The WTO’s Enhanced Integrated Framework, a multi-agency initiative, accelerated its
activities in 2017, approving 23 new projects to help the Least Developed Countries use trade as a tool for growth. In 2017, the Standards and Trade Development Facility, a global partnership, allocated US$4.2 million to help developing countries meet international standards for food safety and plant and animal health and to access global markets.
4.3 African External Reserves and Exchange Rate Developments
Sustained recovery in commodity prices, oil prices in particular, and the resultant pick-up in export receipts in resource- and commodity-dependent economies benefited African countries’ reserve holdings in 2017.
52 CHAPTER FOUR AFRICAN TRADE REPORT 2018
These developments helped reverse the downward trend in Africa’s reserve position in 2016. In this regard, Africa’s stock of foreign reserves, which contracted by about 9.4 percent in 2016, to US$396.63 billion, recovered, growing by 6.3 percent in 2017, to US$421.53 billion (Table 4.1). The gradual but steady recovery in oil prices has helped to improve the overall reserve position of the region during the review period, in part reflecting the fact that over 45 percent of Africa’s export earnings derive from oil revenues. The recovery in oil prices and production lifted foreign exchange reserves by about 22.1 percent in Gabon, 13.1 percent in Libya and 50 percent in Nigeria during the review period.
The reversal in the trajectory of Africa’s foreign exchange reserves was also driven partly by rising capital flows into the region. At the same time, it was supported by an improving political governance and investment climate, which are gradually improving the macroeconomic environment and business confidence and thus attracting foreign investors. These developments also increased tourist arrivals and further boosted the reserve position of major tourist-dependent economies in the region. Accordingly, reserves growth in 2017 was strong in Egypt (54.7 percent), Mauritius (20.5 percent) and Morocco (8 percent). In the context of gradual firming up of external reserves, average import coverage rose slightly in 2017, to 7.3 months, from 6.6 months in 2016, and remained well above the International Monetary Fund’s recommended external reserves threshold of 3 months.
The higher export receipts driven by the general recovery in commodity prices, which is reducing fiscal and current account deficits, led to a remarkable turnaround for many African currencies in 2017. Accordingly, many African currencies appreciated against the US dollar (Table 4.2).
During 2017, the best-performing African currencies were those of members of
monetary unions. For instance, the CFA franc, which is the common currency of 15 mainly francophone countries19 and is pegged to the euro, appreciated by about 12.3 percent against the US dollar as economic recovery in the euro area continued to gather momentum. Similarly, the Common Monetary Area in Southern Africa, which comprises Lesotho, Namibia, South Africa and Swaziland, also saw their currency appreciate against the US dollar by about 9.9 percent in 2017 thanks to increasing business confidence grounded on successful political transition and strong prospects for better macroeconomic management owing to new macroeconomic stabilisation policies in South Africa. These developments have reduced inflationary pressure and narrowed fiscal deficits.
Other currencies that performed well in 2017 included those of Mozambique, Morocco, Mauritius and Zambia. The Mozambican metical appreciated by 10.7 percent against the US dollar in 2017, and the Moroccan dirham appreciated by 8.1 percent. The Mauritian rupee appreciated by 6.6 percent, while the Zambian kwacha appreciated by 4.3 percent. The Egyptian pound also performed relatively well, appreciating by 2 percent against the US dollar following a wave of reforms, including an increase in the value-added tax, a cut in energy subsidies and float of the currency, along with International Monetary Fund support programmes, which have renewed investors’ confidence in the Egyptian market and in the process supported the national currency.
Among the worst-performing African currencies was the Democratic Republic of Congo franc, which depreciated by 41.9 percent against the US dollar in 2017, due to a widening current-account deficit, heightened inflationary pressures and socio-political tensions in the country. The Sierra Leone depreciated by 35.1 percent, the Liberian dollar by 24.1 percent, and the Gambian dalasi by 11.7 percent.
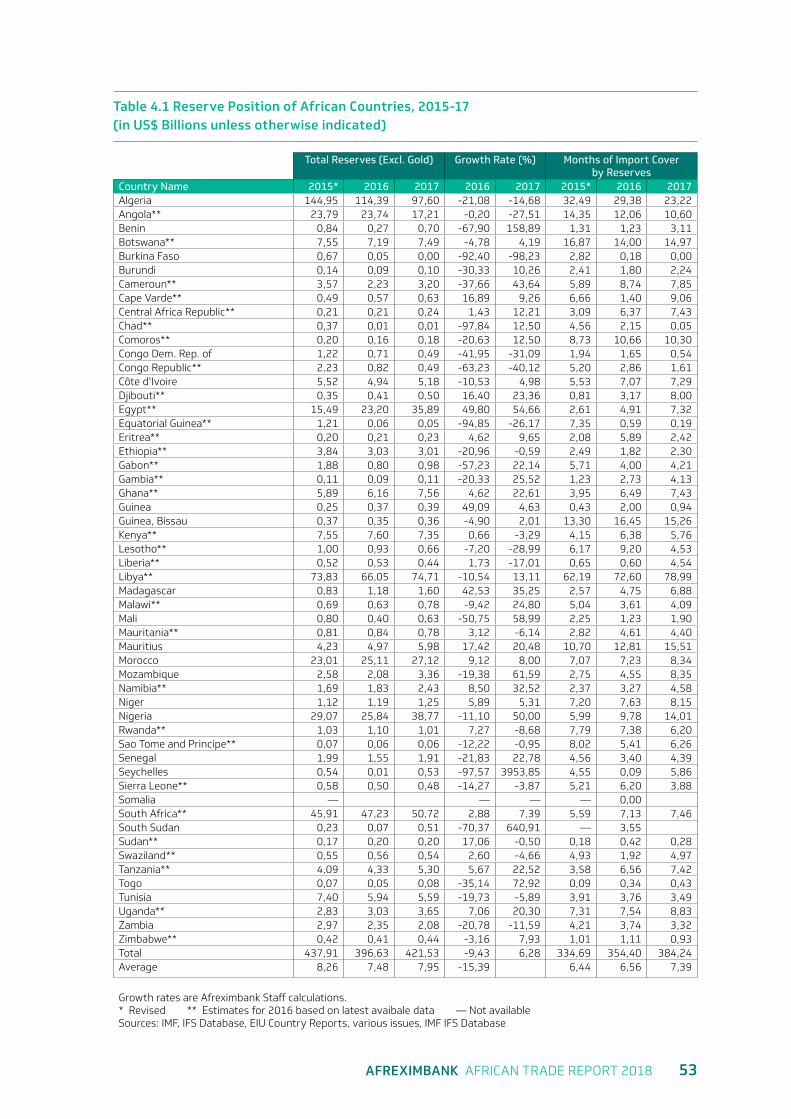
AFREXIMBANK AFRICAN TRADE REPORT 2018 53
Table 4.1 Reserve Position of African Countries, 2015-17 (in US$ Billions unless otherwise indicated)
Total Reserves (Excl. Gold) Growth Rate (%) Months of Import Cover by Reserves
Country Name 2015* 2016 2017 2016 2017 2015* 2016 2017Algeria 144,95 114,39 97,60 -21,08 -14,68 32,49 29,38 23,22Angola** 23,79 23,74 17,21 -0,20 -27,51 14,35 12,06 10,60Benin 0,84 0,27 0,70 -67,90 158,89 1,31 1,23 3,11Botswana** 7,55 7,19 7,49 -4,78 4,19 16,87 14,00 14,97Burkina Faso 0,67 0,05 0,00 -92,40 -98,23 2,82 0,18 0,00Burundi 0,14 0,09 0,10 -30,33 10,26 2,41 1,80 2,24Cameroun** 3,57 2,23 3,20 -37,66 43,64 5,89 8,74 7,85Cape Varde** 0,49 0,57 0,63 16,89 9,26 6,66 1,40 9,06Central Africa Republic** 0,21 0,21 0,24 1,43 12,21 3,09 6,37 7,43Chad** 0,37 0,01 0,01 -97,84 12,50 4,56 2,15 0,05Comoros** 0,20 0,16 0,18 -20,63 12,50 8,73 10,66 10,30Congo Dem. Rep. of 1,22 0,71 0,49 -41,95 -31,09 1,94 1,65 0,54Congo Republic** 2,23 0,82 0,49 -63,23 -40,12 5,20 2,86 1,61Côte d'Ivoire 5,52 4,94 5,18 -10,53 4,98 5,53 7,07 7,29Djibouti** 0,35 0,41 0,50 16,40 23,36 0,81 3,17 8,00Egypt** 15,49 23,20 35,89 49,80 54,66 2,61 4,91 7,32Equatorial Guinea** 1,21 0,06 0,05 -94,85 -26,17 7,35 0,59 0,19Eritrea** 0,20 0,21 0,23 4,62 9,65 2,08 5,89 2,42Ethiopia** 3,84 3,03 3,01 -20,96 -0,59 2,49 1,82 2,30Gabon** 1,88 0,80 0,98 -57,23 22,14 5,71 4,00 4,21Gambia** 0,11 0,09 0,11 -20,33 25,52 1,23 2,73 4,13Ghana** 5,89 6,16 7,56 4,62 22,61 3,95 6,49 7,43Guinea 0,25 0,37 0,39 49,09 4,63 0,43 2,00 0,94Guinea, Bissau 0,37 0,35 0,36 -4,90 2,01 13,30 16,45 15,26Kenya** 7,55 7,60 7,35 0,66 -3,29 4,15 6,38 5,76Lesotho** 1,00 0,93 0,66 -7,20 -28,99 6,17 9,20 4,53Liberia** 0,52 0,53 0,44 1,73 -17,01 0,65 0,60 4,54Libya** 73,83 66,05 74,71 -10,54 13,11 62,19 72,60 78,99Madagascar 0,83 1,18 1,60 42,53 35,25 2,57 4,75 6,88Malawi** 0,69 0,63 0,78 -9,42 24,80 5,04 3,61 4,09Mali 0,80 0,40 0,63 -50,75 58,99 2,25 1,23 1,90Mauritania** 0,81 0,84 0,78 3,12 -6,14 2,82 4,61 4,40Mauritius 4,23 4,97 5,98 17,42 20,48 10,70 12,81 15,51Morocco 23,01 25,11 27,12 9,12 8,00 7,07 7,23 8,34Mozambique 2,58 2,08 3,36 -19,38 61,59 2,75 4,55 8,35Namibia** 1,69 1,83 2,43 8,50 32,52 2,37 3,27 4,58Niger 1,12 1,19 1,25 5,89 5,31 7,20 7,63 8,15Nigeria 29,07 25,84 38,77 -11,10 50,00 5,99 9,78 14,01Rwanda** 1,03 1,10 1,01 7,27 -8,68 7,79 7,38 6,20Sao Tome and Principe** 0,07 0,06 0,06 -12,22 -0,95 8,02 5,41 6,26Senegal 1,99 1,55 1,91 -21,83 22,78 4,56 3,40 4,39Seychelles 0,54 0,01 0,53 -97,57 3953,85 4,55 0,09 5,86Sierra Leone** 0,58 0,50 0,48 -14,27 -3,87 5,21 6,20 3,88Somalia — — — — 0,00South Africa** 45,91 47,23 50,72 2,88 7,39 5,59 7,13 7,46South Sudan 0,23 0,07 0,51 -70,37 640,91 — 3,55Sudan** 0,17 0,20 0,20 17,06 -0,50 0,18 0,42 0,28Swaziland** 0,55 0,56 0,54 2,60 -4,66 4,93 1,92 4,97Tanzania** 4,09 4,33 5,30 5,67 22,52 3,58 6,56 7,42Togo 0,07 0,05 0,08 -35,14 72,92 0,09 0,34 0,43Tunisia 7,40 5,94 5,59 -19,73 -5,89 3,91 3,76 3,49Uganda** 2,83 3,03 3,65 7,06 20,30 7,31 7,54 8,83Zambia 2,97 2,35 2,08 -20,78 -11,59 4,21 3,74 3,32Zimbabwe** 0,42 0,41 0,44 -3,16 7,93 1,01 1,11 0,93Total 437,91 396,63 421,53 -9,43 6,28 334,69 354,40 384,24Average 8,26 7,48 7,95 -15,39 6,44 6,56 7,39
Growth rates are Afreximbank Staff calculations. * Revised ** Estimates for 2016 based on latest avaibale data — Not availableSources: IMF, IFS Database, EIU Country Reports, various issues, IMF IFS Database
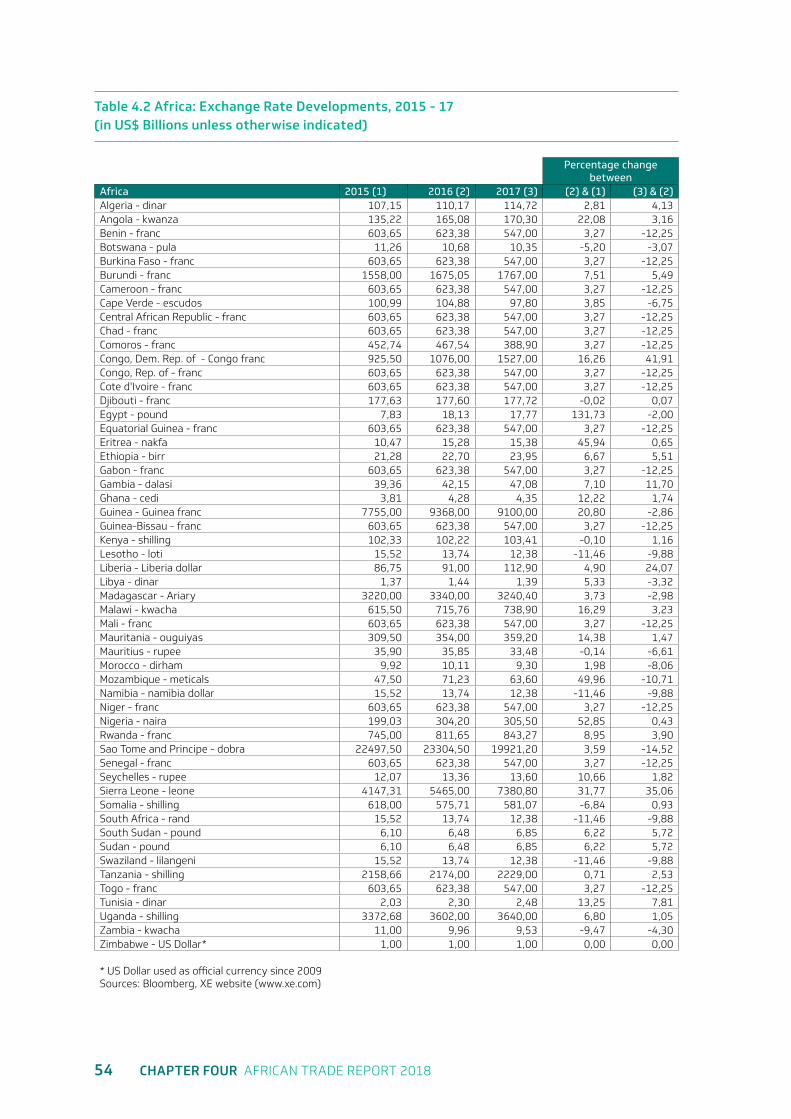
54 CHAPTER FOUR AFRICAN TRADE REPORT 2018
Table 4.2 Africa: Exchange Rate Developments, 2015 - 17 (in US$ Billions unless otherwise indicated)
Percentage change between
Africa 2015 (1) 2016 (2) 2017 (3) (2) & (1) (3) & (2)Algeria - dinar 107,15 110,17 114,72 2,81 4,13Angola - kwanza 135,22 165,08 170,30 22,08 3,16Benin - franc 603,65 623,38 547,00 3,27 -12,25Botswana - pula 11,26 10,68 10,35 -5,20 -3,07Burkina Faso - franc 603,65 623,38 547,00 3,27 -12,25Burundi - franc 1558,00 1675,05 1767,00 7,51 5,49Cameroon - franc 603,65 623,38 547,00 3,27 -12,25Cape Verde - escudos 100,99 104,88 97,80 3,85 -6,75Central African Republic - franc 603,65 623,38 547,00 3,27 -12,25Chad - franc 603,65 623,38 547,00 3,27 -12,25Comoros - franc 452,74 467,54 388,90 3,27 -12,25Congo, Dem. Rep. of - Congo franc 925,50 1076,00 1527,00 16,26 41,91Congo, Rep. of - franc 603,65 623,38 547,00 3,27 -12,25Cote d'Ivoire - franc 603,65 623,38 547,00 3,27 -12,25Djibouti - franc 177,63 177,60 177,72 -0,02 0,07Egypt - pound 7,83 18,13 17,77 131,73 -2,00Equatorial Guinea - franc 603,65 623,38 547,00 3,27 -12,25Eritrea - nakfa 10,47 15,28 15,38 45,94 0,65Ethiopia - birr 21,28 22,70 23,95 6,67 5,51Gabon - franc 603,65 623,38 547,00 3,27 -12,25Gambia - dalasi 39,36 42,15 47,08 7,10 11,70Ghana - cedi 3,81 4,28 4,35 12,22 1,74Guinea - Guinea franc 7755,00 9368,00 9100,00 20,80 -2,86Guinea-Bissau - franc 603,65 623,38 547,00 3,27 -12,25Kenya - shilling 102,33 102,22 103,41 -0,10 1,16Lesotho - loti 15,52 13,74 12,38 -11,46 -9,88Liberia - Liberia dollar 86,75 91,00 112,90 4,90 24,07Libya - dinar 1,37 1,44 1,39 5,33 -3,32Madagascar - Ariary 3220,00 3340,00 3240,40 3,73 -2,98Malawi - kwacha 615,50 715,76 738,90 16,29 3,23Mali - franc 603,65 623,38 547,00 3,27 -12,25Mauritania - ouguiyas 309,50 354,00 359,20 14,38 1,47Mauritius - rupee 35,90 35,85 33,48 -0,14 -6,61Morocco - dirham 9,92 10,11 9,30 1,98 -8,06Mozambique - meticals 47,50 71,23 63,60 49,96 -10,71Namibia - namibia dollar 15,52 13,74 12,38 -11,46 -9,88Niger - franc 603,65 623,38 547,00 3,27 -12,25Nigeria - naira 199,03 304,20 305,50 52,85 0,43Rwanda - franc 745,00 811,65 843,27 8,95 3,90Sao Tome and Principe - dobra 22497,50 23304,50 19921,20 3,59 -14,52Senegal - franc 603,65 623,38 547,00 3,27 -12,25Seychelles - rupee 12,07 13,36 13,60 10,66 1,82Sierra Leone - leone 4147,31 5465,00 7380,80 31,77 35,06Somalia - shilling 618,00 575,71 581,07 -6,84 0,93South Africa - rand 15,52 13,74 12,38 -11,46 -9,88South Sudan - pound 6,10 6,48 6,85 6,22 5,72Sudan - pound 6,10 6,48 6,85 6,22 5,72Swaziland - lilangeni 15,52 13,74 12,38 -11,46 -9,88Tanzania - shilling 2158,66 2174,00 2229,00 0,71 2,53Togo - franc 603,65 623,38 547,00 3,27 -12,25Tunisia - dinar 2,03 2,30 2,48 13,25 7,81Uganda - shilling 3372,68 3602,00 3640,00 6,80 1,05Zambia - kwacha 11,00 9,96 9,53 -9,47 -4,30Zimbabwe - US Dollar* 1,00 1,00 1,00 0,00 0,00
* US Dollar used as official currency since 2009Sources: Bloomberg, XE website (www.xe.com)
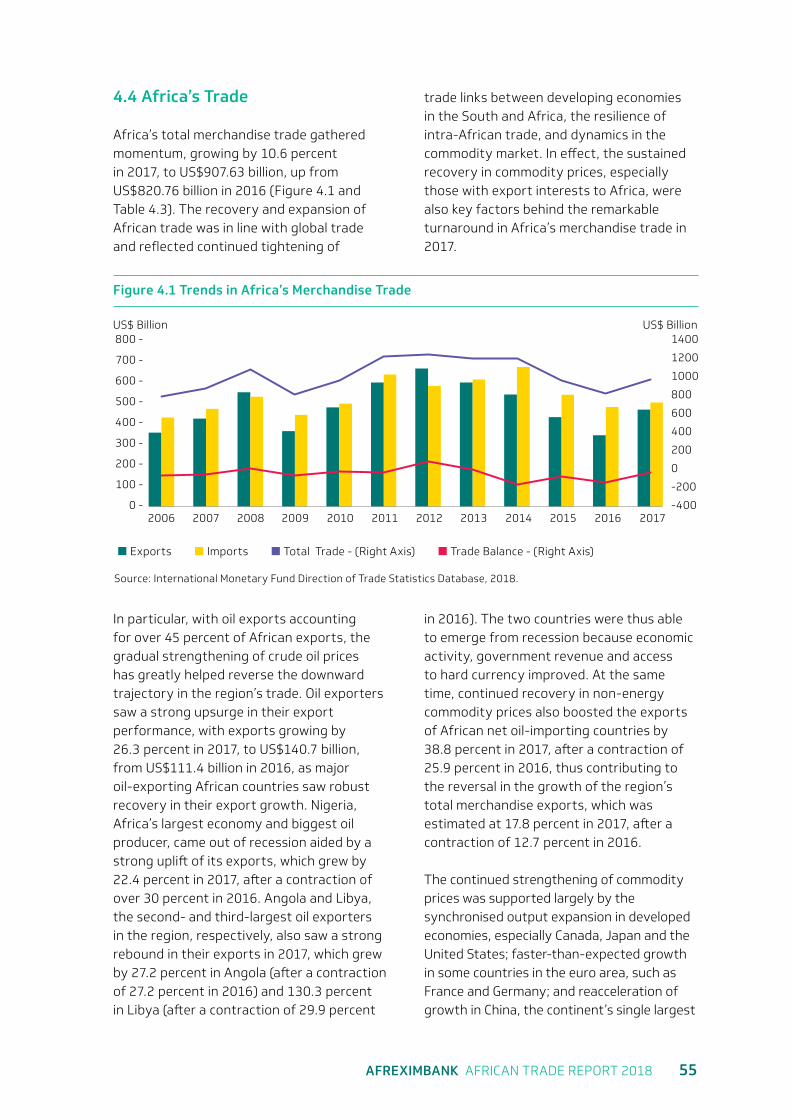
AFREXIMBANK AFRICAN TRADE REPORT 2018 55
4.4 Africa’s Trade
Africa’s total merchandise trade gathered momentum, growing by 10.6 percent in 2017, to US$907.63 billion, up from US$820.76 billion in 2016 (Figure 4.1 and Table 4.3). The recovery and expansion of African trade was in line with global trade and reflected continued tightening of
trade links between developing economies in the South and Africa, the resilience of intra-African trade, and dynamics in the commodity market. In effect, the sustained recovery in commodity prices, especially those with export interests to Africa, were also key factors behind the remarkable turnaround in Africa’s merchandise trade in 2017.
800 -US$ Billion US$ Billion
1400
400 - 600
600 - 1000
200 - 200
700 - 1200
300 - 400
2006 2010 20142008 2012 20162007 2011 20152009 2013 2017
500 - 800
100 - 0
0 - -400
-200
Exports Imports Total Trade - (Right Axis) Trade Balance - (Right Axis)
Source: International Monetary Fund Direction of Trade Statistics Database, 2018.
Figure 4.1 Trends in Africa’s Merchandise Trade
In particular, with oil exports accounting for over 45 percent of African exports, the gradual strengthening of crude oil prices has greatly helped reverse the downward trajectory in the region’s trade. Oil exporters saw a strong upsurge in their export performance, with exports growing by 26.3 percent in 2017, to US$140.7 billion, from US$111.4 billion in 2016, as major oil-exporting African countries saw robust recovery in their export growth. Nigeria, Africa’s largest economy and biggest oil producer, came out of recession aided by a strong uplift of its exports, which grew by 22.4 percent in 2017, after a contraction of over 30 percent in 2016. Angola and Libya, the second- and third-largest oil exporters in the region, respectively, also saw a strong rebound in their exports in 2017, which grew by 27.2 percent in Angola (after a contraction of 27.2 percent in 2016) and 130.3 percent in Libya (after a contraction of 29.9 percent
in 2016). The two countries were thus able to emerge from recession because economic activity, government revenue and access to hard currency improved. At the same time, continued recovery in non-energy commodity prices also boosted the exports of African net oil-importing countries by 38.8 percent in 2017, after a contraction of 25.9 percent in 2016, thus contributing to the reversal in the growth of the region’s total merchandise exports, which was estimated at 17.8 percent in 2017, after a contraction of 12.7 percent in 2016.
The continued strengthening of commodity prices was supported largely by the synchronised output expansion in developed economies, especially Canada, Japan and the United States; faster-than-expected growth in some countries in the euro area, such as France and Germany; and reacceleration of growth in China, the continent’s single largest
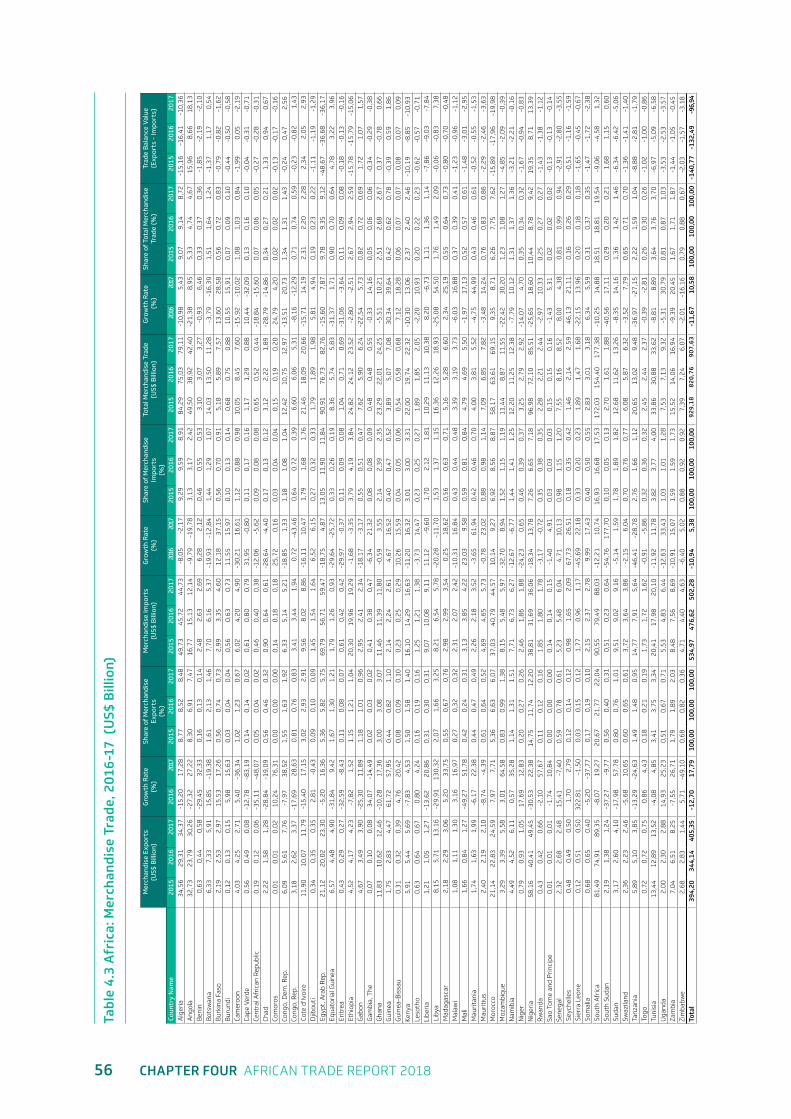
56 CHAPTER FOUR AFRICAN TRADE REPORT 2018
Tabl
e 4.
3 A
fric
a: M
erch
andi
se T
rade
, 201
6-17
(U
S$ B
illio
n)
Mer
chan
dise
Exp
orts
(U
S$ B
illio
n)G
row
th R
ate
(%
)Sh
are
of M
erch
andi
se
Expo
rts
(%)
Mer
chan
dise
Impo
rts
(US$
Bill
ion)
Gro
wth
Rat
e
(%)
Shar
e of
Mer
chan
dise
Im
port
s
(%)
Tota
l Mer
chan
dise
Tra
de
(US$
Bill
ion)
Gro
wth
Rat
e (
%)
Shar
e of
Tot
al M
erch
andi
se
Trad
e (%
)Tr
ade
Bal
ance
Val
ue
(Exp
orts
- Im
port
s)
Coun
try
Nam
e 20
1520
1620
1720
1620
1720
1520
1620
1720
1520
1620
1720
1620
1720
1520
1620
1720
1520
1620
1720
1620
1720
1520
1620
1720
1520
1620
17A
lger
ia34
,56
29,3
134
,37
-15,
2017
,28
8,77
8,52
8,48
49,7
345
,72
44,7
3-8
,05
-2,1
79,
299,
598,
9184
,29
75,0
379
,11
-10,
985,
439,
079,
148,
72-1
5,16
-16,
41-1
0,36
Ang
ola
32,7
323
,79
30,2
6-2
7,32
27,2
28,
306,
917,
4716
,77
15,1
312
,14
-9,7
9-1
9,78
3,13
3,17
2,42
49,5
038
,92
42,4
0-2
1,38
8,95
5,33
4,74
4,67
15,9
68,
6618
,13
Ben
in0,
630,
440,
58-2
9,45
32,3
30,
160,
130,
142,
482,
632,
696,
282,
120,
460,
550,
533,
103,
073,
27-0
,93
6,46
0,33
0,37
0,36
-1,8
5-2
,19
-2,1
0B
otsw
ana
6,33
7,33
5,91
15,8
5-1
9,38
1,61
2,13
1,46
7,70
6,16
5,37
-19,
93-1
2,84
1,44
1,29
1,07
14,0
313
,50
11,2
8-3
,79
-16,
391,
511,
641,
24-1
,37
1,17
0,54
Bur
kina
Fas
o2,
192,
532,
9715
,53
17,2
60,
560,
740,
732,
993,
354,
6012
,18
37,1
50,
560,
700,
915,
185,
897,
5713
,60
28,5
80,
560,
720,
83-0
,79
-0,8
2-1
,62
Bur
undi
0,12
0,13
0,15
5,98
15,6
30,
030,
040,
040,
560,
630,
7311
,55
15,9
70,
100,
130,
140,
680,
750,
8810
,55
15,9
10,
070,
090,
10-0
,44
-0,5
0-0
,58
Cam
eroo
n4,
034,
252,
715,
40-3
6,34
1,02
1,23
0,67
6,02
4,20
4,90
-30,
2116
,61
1,12
0,88
0,98
10,0
58,
457,
60-1
5,92
-10,
021,
081,
030,
84-1
,99
0,05
-2,1
9Ca
pe V
erde
0,56
0,49
0,08
-12,
78-8
3,19
0,14
0,14
0,02
0,61
0,80
0,79
31,9
5-0
,80
0,11
0,17
0,16
1,17
1,29
0,88
10,4
4-3
2,09
0,13
0,16
0,10
-0,0
4-0
,31
-0,7
1Ce
ntra
l Afr
ican
Rep
ublic
0,19
0,12
0,06
-35,
11-4
8,07
0,05
0,04
0,02
0,46
0,40
0,38
-12,
06-5
,62
0,09
0,08
0,08
0,65
0,52
0,44
-18,
84-1
5,60
0,07
0,06
0,05
-0,2
7-0
,28
-0,3
1Ch
ad2,
221,
581,
28-2
8,84
-19,
090,
560,
460,
320,
900,
640,
61-2
8,64
-4,4
00,
170,
130,
123,
122,
221,
89-2
8,79
-14,
860,
340,
270,
211,
330,
940,
67Co
mor
os0,
010,
010,
0210
,24
76,3
10,
000,
000,
000,
140,
180,
1825
,72
0,16
0,03
0,04
0,04
0,15
0,19
0,20
24,7
94,
200,
020,
020,
02-0
,13
-0,1
7-0
,16
Cong
o, D
em. R
ep.
6,09
5,61
7,76
-7,9
738
,52
1,55
1,63
1,92
6,33
5,14
5,21
-18,
851,
331,
181,
081,
0412
,42
10,7
512
,97
-13,
5120
,73
1,34
1,31
1,43
-0,2
40,
472,
56Co
ngo,
Rep
.3,
182,
623,
37-1
7,69
28,6
30,
810,
760,
833,
413,
441,
940,
72-4
3,46
0,64
0,72
0,39
6,60
6,06
5,31
-8,1
6-1
2,29
0,71
0,74
0,59
-0,2
3-0
,82
1,43
Cote
d'Iv
oire
11,9
010
,07
11,7
9-1
5,40
17,1
53,
022,
932,
919,
568,
028,
86-1
6,11
10,4
71,
791,
681,
7621
,46
18,0
920
,66
-15,
7114
,19
2,31
2,20
2,28
2,34
2,05
2,93
Djib
outi
0,34
0,35
0,35
2,81
-0,4
30,
090,
100,
091,
451,
541,
646,
526,
150,
270,
320,
331,
791,
891,
985,
814,
940,
190,
230,
22-1
,11
-1,1
9-1
,29
Egyp
t, A
rab
Rep
.21
,12
20,0
223
,30
-5,2
016
,36
5,36
5,82
5,75
69,7
956
,71
59,4
7-1
8,75
4,87
13,0
511
,90
11,8
490
,91
76,7
382
,76
-15,
607,
879,
789,
359,
12-4
8,67
-36,
68-3
6,17
Equa
tori
al G
uine
a6,
574,
484,
90-3
1,84
9,42
1,67
1,30
1,21
1,79
1,26
0,93
-29,
64-2
5,72
0,33
0,26
0,19
8,36
5,74
5,83
-31,
371,
710,
900,
700,
644,
783,
223,
96Er
itre
a0,
430,
290,
27-3
2,59
-8,4
30,
110,
080,
070,
610,
420,
42-2
9,97
-0,3
70,
110,
090,
081,
040,
710,
69-3
1,06
-3,6
40,
110,
090,
08-0
,18
-0,1
3-0
,16
Ethi
opia
4,52
4,17
4,23
-7,8
21,
521,
151,
211,
0420
,30
19,9
619
,29
-1,6
8-3
,35
3,79
4,19
3,84
24,8
224
,12
23,5
2-2
,80
-2,5
12,
672,
942,
59-1
5,78
-15,
79-1
5,06
Gab
on4,
673,
493,
90-2
5,30
11,8
91,
181,
010,
962,
952,
412,
34-1
8,17
-3,1
70,
550,
510,
477,
625,
906,
24-2
2,54
5,73
0,82
0,72
0,69
1,72
1,07
1,57
Gam
bia,
The
0,07
0,10
0,08
34,0
7-1
4,49
0,02
0,03
0,02
0,41
0,38
0,47
-6,3
421
,32
0,08
0,08
0,09
0,48
0,48
0,55
-0,3
314
,16
0,05
0,06
0,06
-0,3
4-0
,29
-0,3
8G
hana
11,8
310
,62
12,4
6-1
0,28
17,3
63,
003,
083,
0711
,46
11,3
911
,80
-0,5
93,
552,
142,
392,
3523
,29
22,0
124
,25
-5,5
110
,21
2,51
2,68
2,67
0,37
-0,7
80,
66G
uine
a1,
752,
834,
4761
,72
57,9
50,
440,
821,
102,
142,
242,
614,
6716
,52
0,40
0,47
0,52
3,89
5,07
7,08
30,3
439
,64
0,42
0,62
0,78
-0,3
90,
591,
86G
uine
a-B
issa
u0,
310,
320,
394,
7620
,42
0,08
0,09
0,10
0,23
0,25
0,29
10,2
615
,59
0,04
0,05
0,06
0,54
0,58
0,68
7,12
18,2
80,
060,
070,
070,
080,
070,
09Ke
nya
5,91
5,44
5,69
-7,8
34,
531,
501,
581,
4016
,10
14,2
916
,63
-11,
2016
,32
3,01
3,00
3,31
22,0
019
,74
22,3
2-1
0,30
13,0
62,
372,
402,
46-1
0,19
-8,8
5-1
0,93
Leso
tho
0,63
0,64
0,67
0,80
4,24
0,16
0,19
0,16
1,25
1,21
1,38
-3,7
314
,47
0,23
0,25
0,27
1,89
1,85
2,05
-2,2
010
,93
0,20
0,22
0,23
-0,6
2-0
,57
-0,7
1Li
beri
a1,
211,
051,
27-1
3,62
20,8
60,
310,
300,
319,
0710
,08
9,11
11,1
2-9
,60
1,70
2,12
1,81
10,2
911
,13
10,3
88,
20-6
,73
1,11
1,36
1,14
-7,8
6-9
,03
-7,8
4Li
bya
8,15
5,71
13,1
6-2
9,91
130,
322,
071,
663,
258,
216,
545,
78-2
0,28
-11,
701,
531,
371,
1516
,36
12,2
618
,93
-25,
0854
,50
1,76
1,49
2,09
-0,0
6-0
,83
7,38
Mad
agas
car
2,18
2,29
3,06
5,20
33,7
50,
550,
670,
762,
982,
993,
540,
2518
,62
0,56
0,63
0,71
5,16
5,28
6,60
2,34
25,1
90,
550,
640,
73-0
,80
-0,7
0-0
,48
Mal
awi
1,08
1,11
1,30
3,16
16,9
70,
270,
320,
322,
312,
072,
42-1
0,31
16,8
40,
430,
440,
483,
393,
193,
73-6
,03
16,8
80,
370,
390,
41-1
,23
-0,9
6-1
,12
Mal
i1,
660,
841,
27-4
9,27
51,7
80,
420,
240,
313,
133,
854,
2223
,03
9,58
0,59
0,81
0,84
4,79
4,69
5,50
-1,9
717
,13
0,52
0,57
0,61
-1,4
8-3
,01
-2,9
5M
auri
tani
a1,
741,
631,
99-6
,17
22,3
80,
440,
470,
492,
262,
183,
52-3
,65
61,9
40,
420,
460,
704,
003,
815,
52-4
,75
44,9
90,
430,
460,
61-0
,52
-0,5
5-1
,53
Mau
riti
us2,
402,
192,
10-8
,74
-4,3
90,
610,
640,
524,
694,
655,
73-0
,78
23,0
20,
880,
981,
147,
096,
857,
82-3
,48
14,2
40,
760,
830,
86-2
,29
-2,4
6-3
,63
Mor
occo
21,1
422
,83
24,5
97,
977,
715,
366,
636,
0737
,03
40,7
944
,57
10,1
49,
276,
928,
568,
8758
,17
63,6
169
,15
9,35
8,71
6,26
7,75
7,62
-15,
89-1
7,96
-19,
98M
ozam
biqu
e3,
293,
395,
583,
0164
,58
0,83
0,99
1,38
8,15
5,48
5,97
-32,
708,
941,
521,
151,
1911
,44
8,87
11,5
5-2
2,42
30,2
01,
231,
081,
27-4
,85
-2,0
9-0
,39
Nam
ibia
4,49
4,52
6,11
0,57
35,2
81,
141,
311,
517,
716,
736,
27-1
2,67
-6,7
71,
441,
411,
2512
,20
11,2
512
,38
-7,7
910
,12
1,31
1,37
1,36
-3,2
1-2
,21
-0,1
6N
iger
0,79
0,93
1,05
17,6
912
,83
0,20
0,27
0,26
2,46
1,86
1,88
-24,
230,
650,
460,
390,
373,
252,
792,
92-1
4,07
4,70
0,35
0,34
0,32
-1,6
7-0
,94
-0,8
3N
iger
ia58
,16
40,4
149
,45
-30,
5322
,38
14,7
511
,74
12,2
038
,81
31,6
936
,06
-18,
3413
,78
7,26
6,65
7,18
96,9
872
,10
85,5
1-2
5,65
18,6
010
,44
8,78
9,42
19,3
58,
7113
,39
Rw
anda
0,43
0,42
0,66
-2,1
057
,67
0,11
0,12
0,16
1,85
1,80
1,78
-3,1
7-0
,72
0,35
0,38
0,35
2,28
2,21
2,44
-2,9
710
,33
0,25
0,27
0,27
-1,4
3-1
,38
-1,1
2Sa
o To
me
and
Pri
ncip
e0,
010,
010,
01-1
,74
10,8
40,
000,
000,
000,
140,
140,
15-1
,40
4,91
0,03
0,03
0,03
0,15
0,15
0,16
-1,4
35,
310,
020,
020,
02-0
,13
-0,1
3-0
,14
Sene
gal
2,32
2,68
2,48
15,4
1-7
,40
0,59
0,78
0,61
5,23
5,48
6,04
4,71
10,1
30,
981,
151,
207,
558,
168,
528,
004,
380,
810,
990,
94-2
,91
-2,8
0-3
,55
Seyc
helle
s0,
480,
490,
501,
702,
790,
120,
140,
120,
981,
652,
0967
,73
26,5
10,
180,
350,
421,
462,
142,
5946
,13
21,1
10,
160,
260,
29-0
,51
-1,1
6-1
,59
Sier
ra L
eone
0,12
0,51
0,50
322,
81-1
,50
0,03
0,15
0,12
1,77
0,96
1,17
-45,
6922
,18
0,33
0,20
0,23
1,89
1,47
1,68
-22,
1513
,96
0,20
0,18
0,18
-1,6
5-0
,45
-0,6
7So
mal
ia0,
680,
650,
40-5
,20
-37,
770,
170,
190,
102,
152,
372,
789,
9917
,43
0,40
0,50
0,55
2,83
3,01
3,18
6,34
5,59
0,31
0,37
0,35
-1,4
7-1
,72
-2,3
8So
uth
Afr
ica
81,4
974
,91
89,3
5-8
,07
19,2
720
,67
21,7
722
,04
90,5
579
,49
88,0
3-1
2,21
10,7
416
,93
16,6
817
,53
172,
0315
4,40
177,
38-1
0,25
14,8
818
,51
18,8
119
,54
-9,0
6-4
,58
1,32
Sout
h Su
dan
2,19
1,38
1,24
-37,
27-9
,77
0,56
0,40
0,31
0,51
0,23
0,64
-54,
7617
7,70
0,10
0,05
0,13
2,70
1,61
1,88
-40,
5617
,11
0,29
0,20
0,21
1,68
1,15
0,60
Suda
n3,
172,
604,
10-1
7,98
57,7
80,
800,
761,
019,
519,
029,
16-5
,14
1,59
1,78
1,89
1,82
12,6
811
,62
13,2
6-8
,35
14,1
61,
361,
421,
46-6
,34
-6,4
2-5
,06
Swaz
iland
2,36
2,23
2,46
-5,6
810
,65
0,60
0,65
0,61
3,72
3,64
3,86
-2,1
56,
040,
700,
760,
776,
085,
876,
32-3
,52
7,79
0,65
0,71
0,70
-1,3
6-1
,41
-1,4
0Ta
nzan
ia5,
895,
103,
85-1
3,29
-24,
631,
491,
480,
9514
,77
7,91
5,64
-46,
41-2
8,78
2,76
1,66
1,12
20,6
513
,02
9,48
-36,
97-2
7,15
2,22
1,59
1,04
-8,8
8-2
,81
-1,7
9To
go0,
720,
720,
750,
864,
430,
180,
210,
191,
731,
721,
62-0
,91
-5,8
60,
320,
360,
322,
452,
442,
37-0
,39
-2,8
10,
260,
300,
26-1
,02
-1,0
0-0
,86
Tuni
sia
13,4
412
,89
13,5
2-4
,08
4,85
3,41
3,75
3,34
20,4
117
,98
20,1
0-1
1,92
11,7
83,
823,
774,
0033
,86
30,8
833
,62
-8,8
18,
893,
643,
763,
70-6
,97
-5,0
9-6
,58
Uga
nda
2,00
2,30
2,88
14,9
325
,23
0,51
0,67
0,71
5,53
4,83
6,44
-12,
6333
,43
1,03
1,01
1,28
7,53
7,13
9,32
-5,3
130
,79
0,81
0,87
1,03
-3,5
3-2
,53
-3,5
7Za
mbi
a7,
046,
518,
25-7
,55
26,7
11,
791,
892,
038,
487,
568,
69-1
0,91
15,0
71,
591,
591,
7315
,52
14,0
616
,94
-9,3
920
,45
1,67
1,71
1,87
-1,4
4-1
,05
-0,4
5Zi
mba
bwe
2,68
2,83
1,44
5,71
-49,
100,
680,
820,
364,
714,
404,
63-6
,40
5,02
0,88
0,92
0,92
7,39
7,24
6,07
-2,0
1-1
6,16
0,79
0,88
0,67
-2,0
3-1
,57
-3,1
8To
tal
394,
2034
4,14
405,
35-1
2,70
17,7
910
0,00
100,
0010
0,00
534,
9747
6,62
502,
28-1
0,94
5,38
10
0,00
100,
0010
0,00
92
9,1
88
20
,76
90
7,6
3-1
1,67
10,5
8 10
0,00
100,
0010
0,00
-140
,77
-132
,49
-96,
94
AFREXIMBANK AFRICAN TRADE REPORT 2018 57
trading partner—all of which lifted global demand and investments in commodity markets. Major supply constraints, especially adverse weather conditions, held back production in parts of North and South America and Africa, which undermined agricultural output, while lingering conflicts, militant activity and refugee movements in many parts of the world, including some parts of Africa and Eastern Europe, disrupted economic activity. Both issues put upward pressure on commodity prices and lifted exports. Continued production restraints by the Organization of Petroleum Exporting Countries members and non-members sustained crude oil prices. These developments, alongside firmer prices for some commodities, including, cotton, copper, lead, aluminum and zinc, contributed significantly to lift Africa’s exports during the year.
Despite these developments, Africa’s merchandise exports still confront with multiple challenges. The most critical are high costs related to poor quality of infrastructure and logistics, low processing capacity and overwhelming dominance of primary commodities and natural resources in Africa’s exports, which expose the region to recurrent adverse commodity terms-of-trade shocks. These challenges remain key constraints to enhancing the international competitiveness of Africa’s products, as reflected by the difficulties that African exporters in the European Union and other international markets face.
Africa’s total merchandise imports posted a strong recovery, growing by an estimated 5.4 percent in 2017, to US$502.28 billion, after a contraction of 10.9 percent in 2016, but remained below the US$534.97 billion in 2015 (Figure 4.1 and Table 4.3). The resurgence of growth in Africa’s imports was driven largely by recovery in foreign reserves, as export receipts rebounded on account of sustained improvement in commodity prices, spurred by strengthening global demand—developments that attest
to the progressive consolidation of gains realised during the recovery process, towards normalisation of economic activities.
In this generalised recovery, where most countries implemented difficult reforms, including measures to ease rationing on foreign reserves, oil-exporting African countries saw imports rise (albeit slightly) by 0.3 percent in 2017, after a contraction of 16.9 percent in 2016, supported by robust import growth in Nigeria (13 percent). This modest increase derives from the fact that the group was the hardest hit by the sharp decline in oil prices and the consequent dry-out of foreign reserves and other related macroeconomic challenges.
However, net oil importers realised significant gains, with the value of their imports growing by 7 percent in 2017, to US$444.73 billion, from US$415.7 billion in 2016. This development arose as revenues from non-oil commodities improved, while adjustments to increasing oil price bills remained gradual, especially while oil prices remained much lower than the pre-crisis level. Hence, strong import growth in several large countries, including Côte d’Ivoire (10.5 percent), Egypt (4.9 percent), Kenya (16.3 percent), Morocco (9.3 percent), South Africa (10.7 percent) and Uganda (33.4 percent), significantly contributed to the increase in Africa’s merchandise imports in 2017. Furthermore, the appreciation of several African currencies against the US dollar, especially those pertaining to a monetary union, combined with the gradual recovery of foreign reserves and improving macroeconomic environment increased the import capacity of many oil-importing countries. Accordingly, 9 out of the 15 countries in the CFA franc zone saw imports growth increase in 2017, as did 3 of the 4 members of the Common Monetary Area in Southern Africa.
African governments and the private sector are embarking on ambitious initiatives
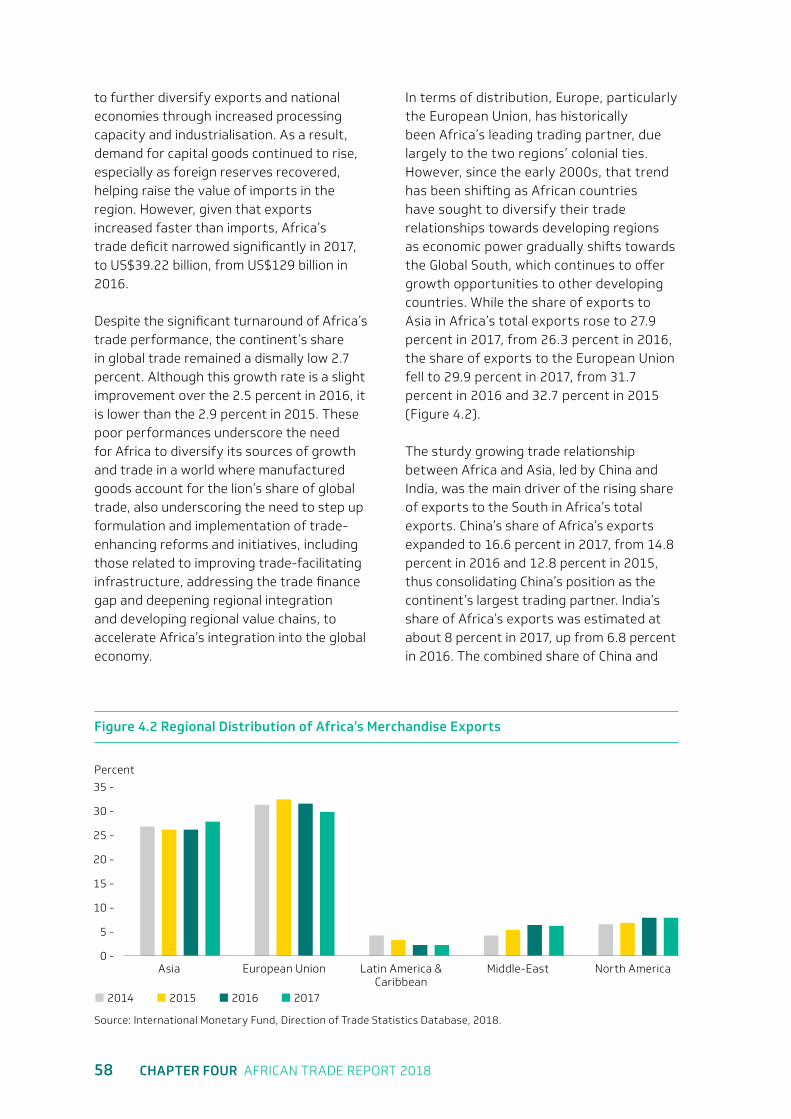
58 CHAPTER FOUR AFRICAN TRADE REPORT 2018
to further diversify exports and national economies through increased processing capacity and industrialisation. As a result, demand for capital goods continued to rise, especially as foreign reserves recovered, helping raise the value of imports in the region. However, given that exports increased faster than imports, Africa’s trade deficit narrowed significantly in 2017, to US$39.22 billion, from US$129 billion in 2016.
Despite the significant turnaround of Africa’s trade performance, the continent’s share in global trade remained a dismally low 2.7 percent. Although this growth rate is a slight improvement over the 2.5 percent in 2016, it is lower than the 2.9 percent in 2015. These poor performances underscore the need for Africa to diversify its sources of growth and trade in a world where manufactured goods account for the lion’s share of global trade, also underscoring the need to step up formulation and implementation of trade-enhancing reforms and initiatives, including those related to improving trade-facilitating infrastructure, addressing the trade finance gap and deepening regional integration and developing regional value chains, to accelerate Africa’s integration into the global economy.
In terms of distribution, Europe, particularly the European Union, has historically been Africa’s leading trading partner, due largely to the two regions’ colonial ties. However, since the early 2000s, that trend has been shifting as African countries have sought to diversify their trade relationships towards developing regions as economic power gradually shifts towards the Global South, which continues to offer growth opportunities to other developing countries. While the share of exports to Asia in Africa’s total exports rose to 27.9 percent in 2017, from 26.3 percent in 2016, the share of exports to the European Union fell to 29.9 percent in 2017, from 31.7 percent in 2016 and 32.7 percent in 2015 (Figure 4.2).
The sturdy growing trade relationship between Africa and Asia, led by China and India, was the main driver of the rising share of exports to the South in Africa’s total exports. China’s share of Africa’s exports expanded to 16.6 percent in 2017, from 14.8 percent in 2016 and 12.8 percent in 2015, thus consolidating China’s position as the continent’s largest trading partner. India’s share of Africa’s exports was estimated at about 8 percent in 2017, up from 6.8 percent in 2016. The combined share of China and
Source: International Monetary Fund, Direction of Trade Statistics Database, 2018.
Figure 4.2 Regional Distribution of Africa’s Merchandise Exports
2014 2015 2016 2017
30 -
5 -
10 -
20 -
0 -
15 -
25 -
Asia European Union Latin America & Caribbean
Middle-East North America
35 -
Percent
AFREXIMBANK AFRICAN TRADE REPORT 2018 59
India in Africa’s exports has expanded over the last three years, to 24.6 percent in 2017, from 21.6 percent in 2016 and 20.9 percent in 2015. Despite the growing trade relationships between the two regions, Africa’s exports to Asia remained dominated by primary commodities related to energy, metals and minerals and by agricultural raw materials.
Africa’s exports to the Middle East continued to expand, though at a slower pace—6.3 percent in 2017, compared with 6.5 percent in 2016, but higher than the 5.5 percent in 2015 (Figure 4.2). The expansion arose as Africa pursued deeper cooperation with the Middle East, especially with members of the Gulf Cooperation Council (GCC), through investment promotion and trade and finances. The bulk of Africa’s merchandise exports to the Middle East is petroleum gases, coal, petroleum oil (not crude), gold and diamonds.
Since 2015, the share of Africa’s exports to Latin America and the Caribbean has remained weak, estimated at less than 3 percent over the last three years. The weak performance may be attributed to the wave of economic challenges, including a deep recession and prolonged political crisis that faced Brazil, the main destination of Africa exports, and financial difficulties in Argentina, the second-largest destination of Africa’s exports.
Europe remains the largest export destination for Africa, though the European Union’s share of Africa’s exports in 2017 was estimated at 29.9 percent, down slightly from the 31.7 percent in 2016 and the 32.7 percent in 2015 (see Figure 4.2), and significantly much lower than the 50 percent of Africa’s exports that went to the European Union in the early 2000s. The steady decline and decreasing position of Europe in the destination of African
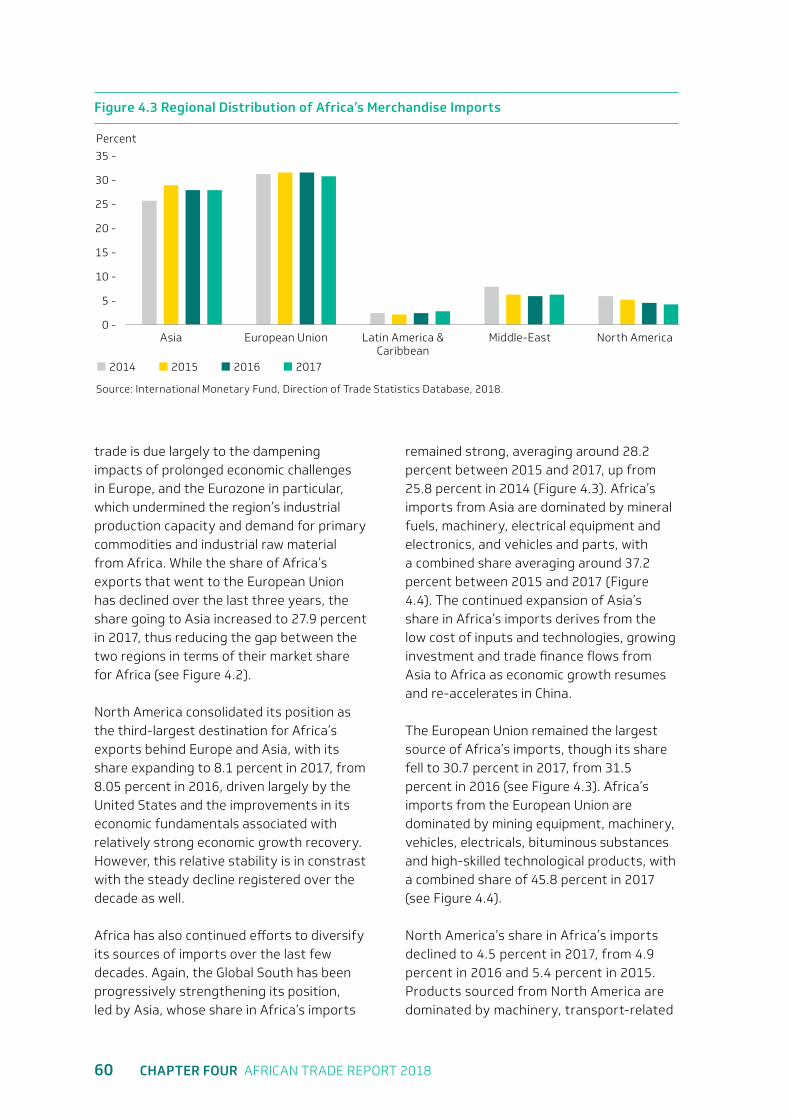
60 CHAPTER FOUR AFRICAN TRADE REPORT 2018
Source: International Monetary Fund, Direction of Trade Statistics Database, 2018.
2014 2015 2016 2017
30 -
5 -
10 -
20 -
0 -
15 -
25 -
Asia European Union Latin America & Caribbean
Middle-East North America
35 -
Percent
trade is due largely to the dampening impacts of prolonged economic challenges in Europe, and the Eurozone in particular, which undermined the region’s industrial production capacity and demand for primary commodities and industrial raw material from Africa. While the share of Africa’s exports that went to the European Union has declined over the last three years, the share going to Asia increased to 27.9 percent in 2017, thus reducing the gap between the two regions in terms of their market share for Africa (see Figure 4.2).
North America consolidated its position as the third-largest destination for Africa’s exports behind Europe and Asia, with its share expanding to 8.1 percent in 2017, from 8.05 percent in 2016, driven largely by the United States and the improvements in its economic fundamentals associated with relatively strong economic growth recovery. However, this relative stability is in constrast with the steady decline registered over the decade as well.
Africa has also continued efforts to diversify its sources of imports over the last few decades. Again, the Global South has been progressively strengthening its position, led by Asia, whose share in Africa’s imports
remained strong, averaging around 28.2 percent between 2015 and 2017, up from 25.8 percent in 2014 (Figure 4.3). Africa’s imports from Asia are dominated by mineral fuels, machinery, electrical equipment and electronics, and vehicles and parts, with a combined share averaging around 37.2 percent between 2015 and 2017 (Figure 4.4). The continued expansion of Asia’s share in Africa’s imports derives from the low cost of inputs and technologies, growing investment and trade finance flows from Asia to Africa as economic growth resumes and re-accelerates in China.
The European Union remained the largest source of Africa’s imports, though its share fell to 30.7 percent in 2017, from 31.5 percent in 2016 (see Figure 4.3). Africa’s imports from the European Union are dominated by mining equipment, machinery, vehicles, electricals, bituminous substances and high-skilled technological products, with a combined share of 45.8 percent in 2017 (see Figure 4.4).
North America’s share in Africa’s imports declined to 4.5 percent in 2017, from 4.9 percent in 2016 and 5.4 percent in 2015. Products sourced from North America are dominated by machinery, transport-related
Figure 4.3 Regional Distribution of Africa’s Merchandise Imports
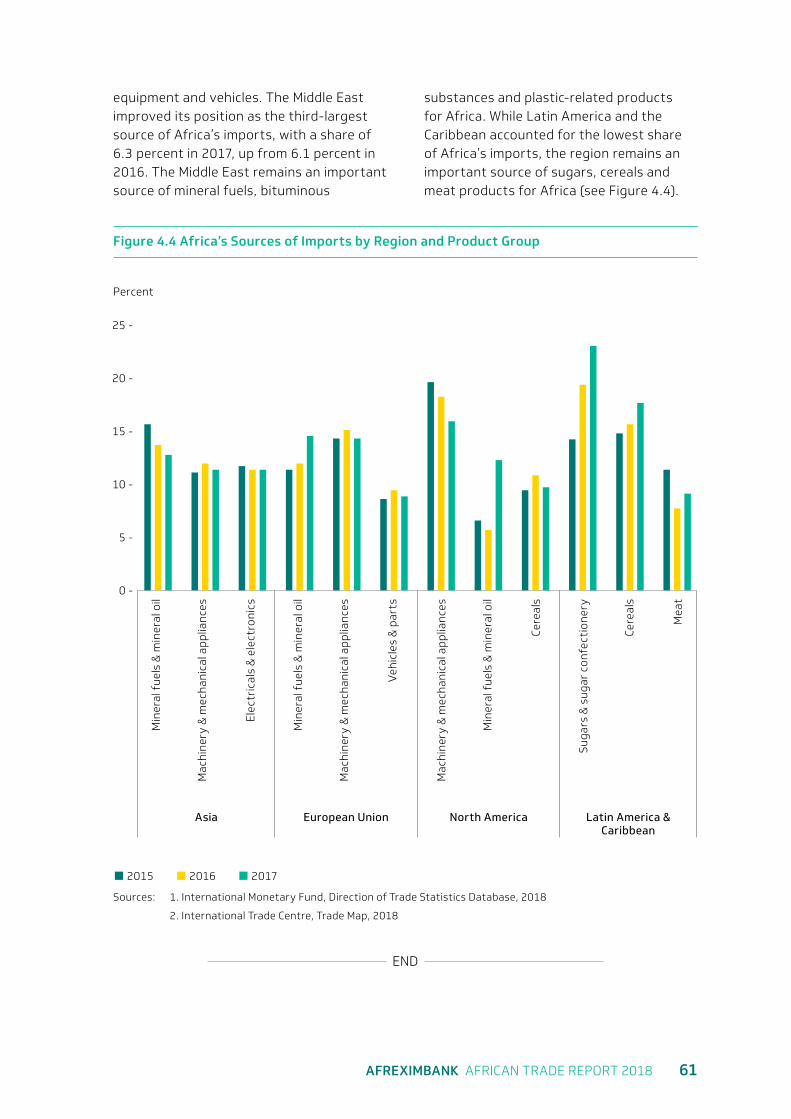
AFREXIMBANK AFRICAN TRADE REPORT 2018 61
equipment and vehicles. The Middle East improved its position as the third-largest source of Africa’s imports, with a share of 6.3 percent in 2017, up from 6.1 percent in 2016. The Middle East remains an important source of mineral fuels, bituminous
substances and plastic-related products for Africa. While Latin America and the Caribbean accounted for the lowest share of Africa’s imports, the region remains an important source of sugars, cereals and meat products for Africa (see Figure 4.4).
END
Figure 4.4 Africa’s Sources of Imports by Region and Product Group
Sources: 1. International Monetary Fund, Direction of Trade Statistics Database, 2018
2. International Trade Centre, Trade Map, 2018
2015 2016 2017
Percent
25 -
15 -
5 -
20 -
10 -
0 -
Min
eral
fue
ls &
min
eral
oil
Mac
hine
ry &
mec
hani
cal a
pplia
nces
Min
eral
fue
ls &
min
eral
oil
Suga
rs &
sug
ar c
onfe
ctio
nery
Mac
hine
ry &
mec
hani
cal a
pplia
nces
Asia European Union North America Latin America & Caribbean
Min
eral
fue
ls &
min
eral
oil
Mac
hine
ry &
mec
hani
cal a
pplia
nces
Cere
als
Elec
tric
als
& e
lect
roni
cs
Cere
als
Veh
icle
s &
par
ts
Mea
t
5Chapter Five
AFREXIMBANK AFRICAN TRADE REPORT 2018 63
Dynamics in Commodity Markets
Progress continues in weaning Africa from overdependence on commodities. African Export-Import Bank programmes such as the Africa Commodities Initiative contribute to higher value addition by supporting processing and industrial capacities in various commodity sectors, in line with the Bank’s strategic pillar to promote industrialisation and export development. The prices of energy, agriculture and base metals, which are important for and linked to the economic outlook for African economies, are closely monitored by the Bank. Commodity exports account for more than 75 percent of merchandise exports and around 70 percent of export earnings for around 40 African countries.
Overall, 2017 was a year of two halves in commodity markets, with prices sloping lower in the first half of the year before recouping their losses in the second half. This is reflected in the Bloomberg Commodity Index which ended the year marginally higher compared with the start of the year but below the highs in February 2017. Overall, the index gained 0.75 percent in 2017 compared with 12.1 percent in 2016, resulting in the most compressed 12-month range for the index in 22 years. In contrast, the Afreximbank Commodities Price Index (ACPI) had a more robust performance with the composite increasing by 14.8 percent during 2017 following a gain of 35.4 percent in 2016. This positive trend in the Bank’s index in the period under review is explained mainly by the continued recovery in the price of energy (oil and gas), but also for precious metals, which are weighted to reflect their
contribution to export revenues on the continent. Concurrently, the ACPI energy sub-index rose 17.1 percent, the precious metals sub-index rose 22.6 percent and the base metal sub-index increased by 29.9 percent, in contrast to the agriculture sub-index which fell 11.1 percent during 2017. More generally, the trend in commodity prices is attributable partly to currency movements associated with a peak in the US dollar in the first half of the year (H1-2017) and its gradual decline during the second half of 2017 (H2-2017).
In agricultural markets, despite a moderate midyear rally in grain prices over concerns about dry weather in Europe, agricultural commodity prices generally trended lower throughout 2017. The Bloomberg Agriculture Subindex was 12.5 percent weaker in December 2017, after a gain of 3.7 percent in December 2016, due largely to benign weather conditions. With international climate models indicative of El Niño weather conditions, yields for some commodities were boosted by good soil moisture levels, which helped keep prices low throughout 2017.
After the sustained slump that took hold of the cocoa market in 2016, prices found support near US$1,800 per tonne and traded in a tight range for most of 2017—compared with 2016—between US$1,800 and US$2,200 per tonne. This sluggish performance was attributable to weak fundamentals, with estimates from the International Cocoa Organization pointing to a market surplus of 382,000 tonnes in the 2016/2017 season—the biggest since 1981.
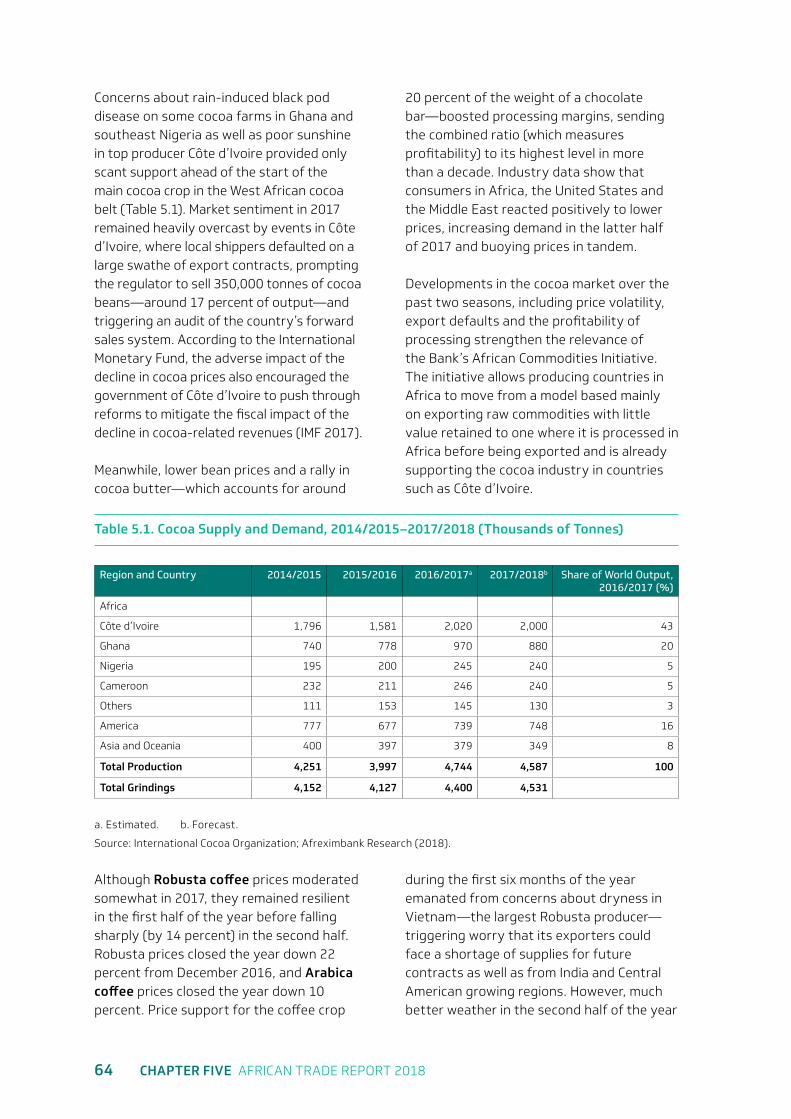
64 CHAPTER FIVE AFRICAN TRADE REPORT 2018
Concerns about rain-induced black pod disease on some cocoa farms in Ghana and southeast Nigeria as well as poor sunshine in top producer Côte d’Ivoire provided only scant support ahead of the start of the main cocoa crop in the West African cocoa belt (Table 5.1). Market sentiment in 2017 remained heavily overcast by events in Côte d’Ivoire, where local shippers defaulted on a large swathe of export contracts, prompting the regulator to sell 350,000 tonnes of cocoa beans—around 17 percent of output—and triggering an audit of the country’s forward sales system. According to the International Monetary Fund, the adverse impact of the decline in cocoa prices also encouraged the government of Côte d’Ivoire to push through reforms to mitigate the fiscal impact of the decline in cocoa-related revenues (IMF 2017).
Meanwhile, lower bean prices and a rally in cocoa butter—which accounts for around
20 percent of the weight of a chocolate bar—boosted processing margins, sending the combined ratio (which measures profitability) to its highest level in more than a decade. Industry data show that consumers in Africa, the United States and the Middle East reacted positively to lower prices, increasing demand in the latter half of 2017 and buoying prices in tandem.
Developments in the cocoa market over the past two seasons, including price volatility, export defaults and the profitability of processing strengthen the relevance of the Bank’s African Commodities Initiative. The initiative allows producing countries in Africa to move from a model based mainly on exporting raw commodities with little value retained to one where it is processed in Africa before being exported and is already supporting the cocoa industry in countries such as Côte d’Ivoire.
Table 5.1. Cocoa Supply and Demand, 2014/2015–2017/2018 (Thousands of Tonnes)
Region and Country 2014/2015 2015/2016 2016/2017a 2017/2018b Share of World Output, 2016/2017 (%)
Africa
Côte d’Ivoire 1,796 1,581 2,020 2,000 43
Ghana 740 778 970 880 20
Nigeria 195 200 245 240 5
Cameroon 232 211 246 240 5
Others 111 153 145 130 3
America 777 677 739 748 16
Asia and Oceania 400 397 379 349 8
Total Production 4,251 3,997 4,744 4,587 100
Total Grindings 4,152 4,127 4,400 4,531
a. Estimated. b. Forecast.
Source: International Cocoa Organization; Afreximbank Research (2018).
Although Robusta coffee prices moderated somewhat in 2017, they remained resilient in the first half of the year before falling sharply (by 14 percent) in the second half. Robusta prices closed the year down 22 percent from December 2016, and Arabica coffee prices closed the year down 10 percent. Price support for the coffee crop
during the first six months of the year emanated from concerns about dryness in Vietnam—the largest Robusta producer—triggering worry that its exporters could face a shortage of supplies for future contracts as well as from India and Central American growing regions. However, much better weather in the second half of the year
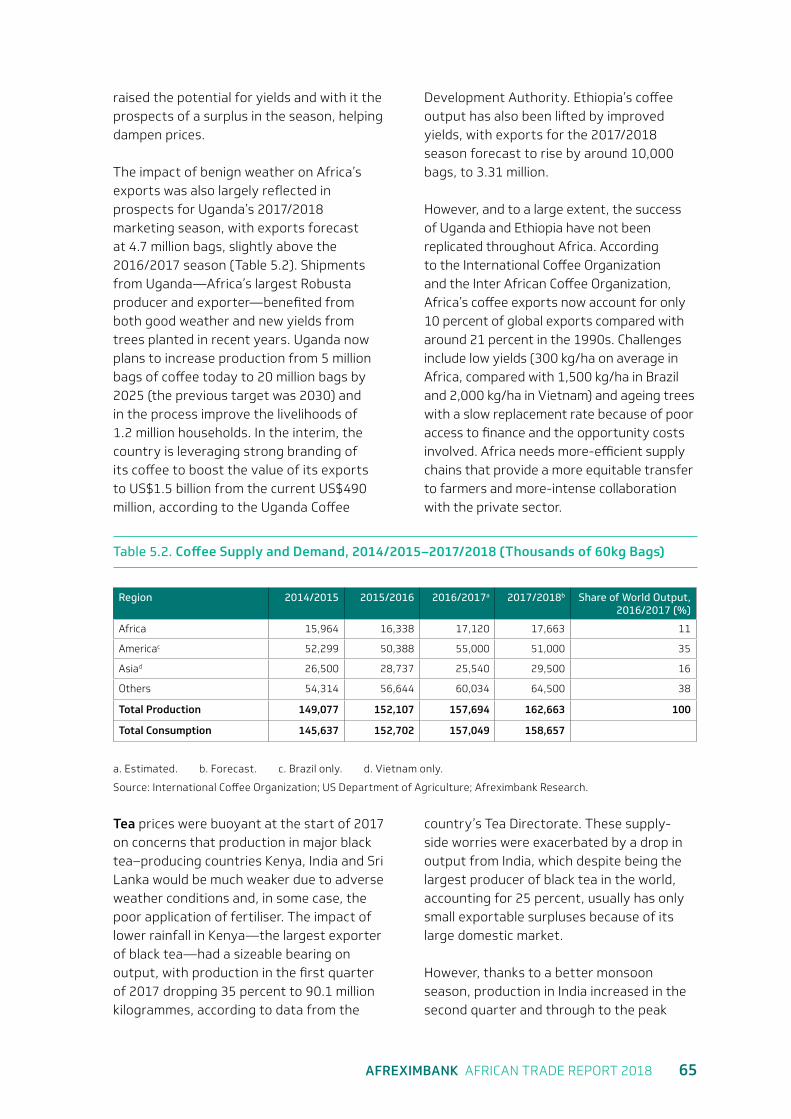
AFREXIMBANK AFRICAN TRADE REPORT 2018 65
raised the potential for yields and with it the prospects of a surplus in the season, helping dampen prices.
The impact of benign weather on Africa’s exports was also largely reflected in prospects for Uganda’s 2017/2018 marketing season, with exports forecast at 4.7 million bags, slightly above the 2016/2017 season (Table 5.2). Shipments from Uganda—Africa’s largest Robusta producer and exporter—benefited from both good weather and new yields from trees planted in recent years. Uganda now plans to increase production from 5 million bags of coffee today to 20 million bags by 2025 (the previous target was 2030) and in the process improve the livelihoods of 1.2 million households. In the interim, the country is leveraging strong branding of its coffee to boost the value of its exports to US$1.5 billion from the current US$490 million, according to the Uganda Coffee
Development Authority. Ethiopia’s coffee output has also been lifted by improved yields, with exports for the 2017/2018 season forecast to rise by around 10,000 bags, to 3.31 million.
However, and to a large extent, the success of Uganda and Ethiopia have not been replicated throughout Africa. According to the International Coffee Organization and the Inter African Coffee Organization, Africa’s coffee exports now account for only 10 percent of global exports compared with around 21 percent in the 1990s. Challenges include low yields (300 kg/ha on average in Africa, compared with 1,500 kg/ha in Brazil and 2,000 kg/ha in Vietnam) and ageing trees with a slow replacement rate because of poor access to finance and the opportunity costs involved. Africa needs more-efficient supply chains that provide a more equitable transfer to farmers and more-intense collaboration with the private sector.
Table 5.2. Coffee Supply and Demand, 2014/2015–2017/2018 (Thousands of 60kg Bags)
Region 2014/2015 2015/2016 2016/2017a 2017/2018b Share of World Output, 2016/2017 (%)
Africa 15,964 16,338 17,120 17,663 11
Americac 52,299 50,388 55,000 51,000 35
Asiad 26,500 28,737 25,540 29,500 16
Others 54,314 56,644 60,034 64,500 38
Total Production 149,077 152,107 157,694 162,663 100
Total Consumption 145,637 152,702 157,049 158,657
a. Estimated. b. Forecast. c. Brazil only. d. Vietnam only.
Source: International Coffee Organization; US Department of Agriculture; Afreximbank Research.
Tea prices were buoyant at the start of 2017 on concerns that production in major black tea–producing countries Kenya, India and Sri Lanka would be much weaker due to adverse weather conditions and, in some case, the poor application of fertiliser. The impact of lower rainfall in Kenya—the largest exporter of black tea—had a sizeable bearing on output, with production in the first quarter of 2017 dropping 35 percent to 90.1 million kilogrammes, according to data from the
country’s Tea Directorate. These supply-side worries were exacerbated by a drop in output from India, which despite being the largest producer of black tea in the world, accounting for 25 percent, usually has only small exportable surpluses because of its large domestic market.
However, thanks to a better monsoon season, production in India increased in the second quarter and through to the peak
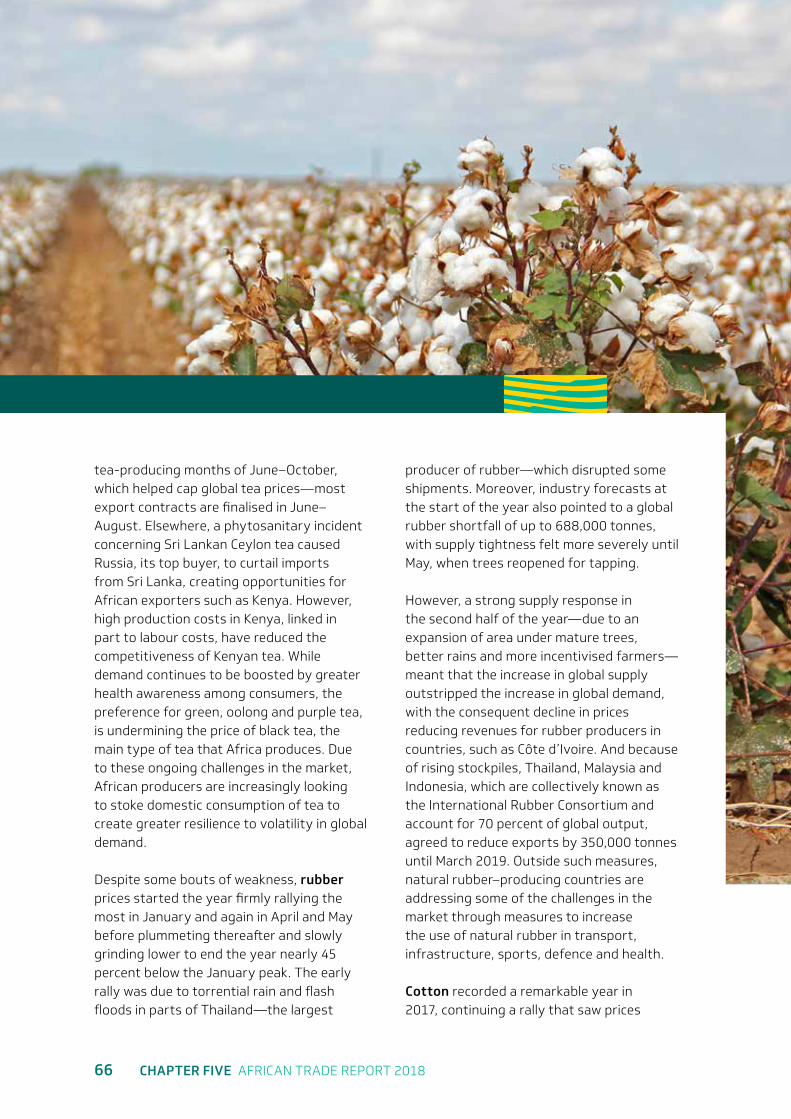
66 CHAPTER FIVE AFRICAN TRADE REPORT 2018
tea-producing months of June–October, which helped cap global tea prices—most export contracts are finalised in June–August. Elsewhere, a phytosanitary incident concerning Sri Lankan Ceylon tea caused Russia, its top buyer, to curtail imports from Sri Lanka, creating opportunities for African exporters such as Kenya. However, high production costs in Kenya, linked in part to labour costs, have reduced the competitiveness of Kenyan tea. While demand continues to be boosted by greater health awareness among consumers, the preference for green, oolong and purple tea, is undermining the price of black tea, the main type of tea that Africa produces. Due to these ongoing challenges in the market, African producers are increasingly looking to stoke domestic consumption of tea to create greater resilience to volatility in global demand.
Despite some bouts of weakness, rubber prices started the year firmly rallying the most in January and again in April and May before plummeting thereafter and slowly grinding lower to end the year nearly 45 percent below the January peak. The early rally was due to torrential rain and flash floods in parts of Thailand—the largest
producer of rubber—which disrupted some shipments. Moreover, industry forecasts at the start of the year also pointed to a global rubber shortfall of up to 688,000 tonnes, with supply tightness felt more severely until May, when trees reopened for tapping.
However, a strong supply response in the second half of the year—due to an expansion of area under mature trees, better rains and more incentivised farmers—meant that the increase in global supply outstripped the increase in global demand, with the consequent decline in prices reducing revenues for rubber producers in countries, such as Côte d’Ivoire. And because of rising stockpiles, Thailand, Malaysia and Indonesia, which are collectively known as the International Rubber Consortium and account for 70 percent of global output, agreed to reduce exports by 350,000 tonnes until March 2019. Outside such measures, natural rubber–producing countries are addressing some of the challenges in the market through measures to increase the use of natural rubber in transport, infrastructure, sports, defence and health.
Cotton recorded a remarkable year in 2017, continuing a rally that saw prices
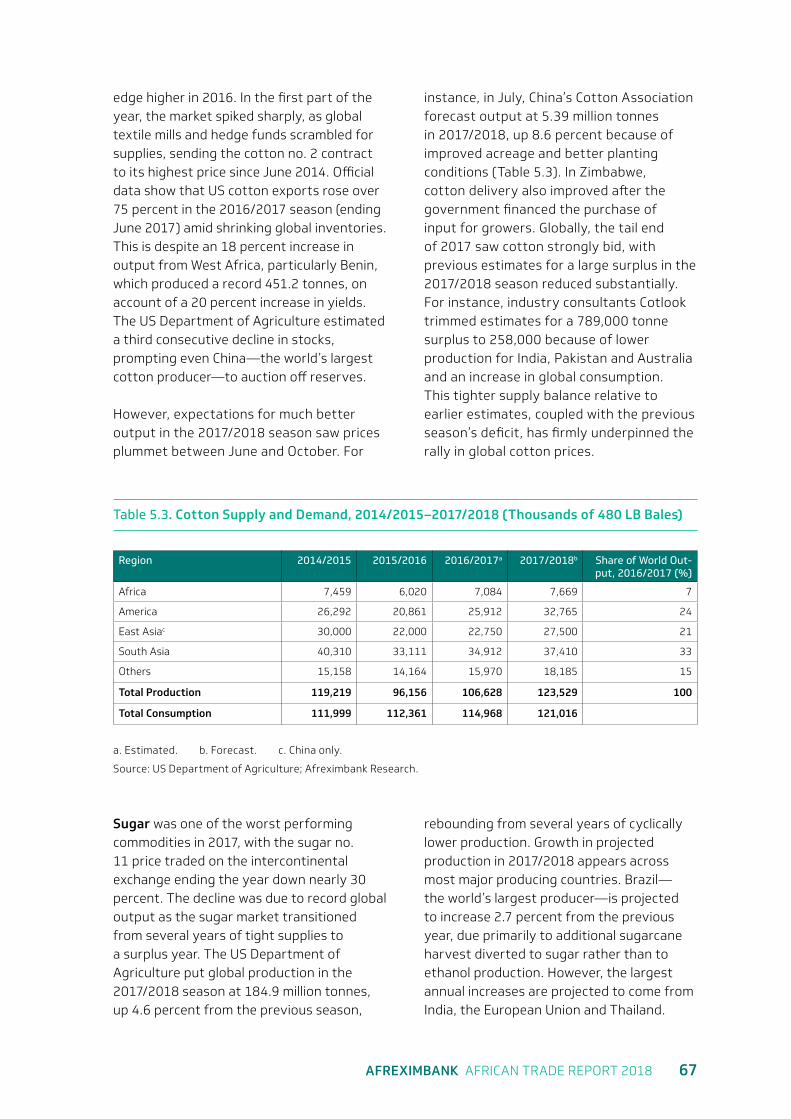
AFREXIMBANK AFRICAN TRADE REPORT 2018 67
edge higher in 2016. In the first part of the year, the market spiked sharply, as global textile mills and hedge funds scrambled for supplies, sending the cotton no. 2 contract to its highest price since June 2014. Official data show that US cotton exports rose over 75 percent in the 2016/2017 season (ending June 2017) amid shrinking global inventories. This is despite an 18 percent increase in output from West Africa, particularly Benin, which produced a record 451.2 tonnes, on account of a 20 percent increase in yields. The US Department of Agriculture estimated a third consecutive decline in stocks, prompting even China—the world’s largest cotton producer—to auction off reserves.
However, expectations for much better output in the 2017/2018 season saw prices plummet between June and October. For
instance, in July, China’s Cotton Association forecast output at 5.39 million tonnes in 2017/2018, up 8.6 percent because of improved acreage and better planting conditions (Table 5.3). In Zimbabwe, cotton delivery also improved after the government financed the purchase of input for growers. Globally, the tail end of 2017 saw cotton strongly bid, with previous estimates for a large surplus in the 2017/2018 season reduced substantially. For instance, industry consultants Cotlook trimmed estimates for a 789,000 tonne surplus to 258,000 because of lower production for India, Pakistan and Australia and an increase in global consumption. This tighter supply balance relative to earlier estimates, coupled with the previous season’s deficit, has firmly underpinned the rally in global cotton prices.
Table 5.3. Cotton Supply and Demand, 2014/2015–2017/2018 (Thousands of 480 LB Bales)
Region 2014/2015 2015/2016 2016/2017a 2017/2018b Share of World Out-put, 2016/2017 (%)
Africa 7,459 6,020 7,084 7,669 7
America 26,292 20,861 25,912 32,765 24
East Asiac 30,000 22,000 22,750 27,500 21
South Asia 40,310 33,111 34,912 37,410 33
Others 15,158 14,164 15,970 18,185 15
Total Production 119,219 96,156 106,628 123,529 100
Total Consumption 111,999 112,361 114,968 121,016
a. Estimated. b. Forecast. c. China only.
Source: US Department of Agriculture; Afreximbank Research.
Sugar was one of the worst performing commodities in 2017, with the sugar no. 11 price traded on the intercontinental exchange ending the year down nearly 30 percent. The decline was due to record global output as the sugar market transitioned from several years of tight supplies to a surplus year. The US Department of Agriculture put global production in the 2017/2018 season at 184.9 million tonnes, up 4.6 percent from the previous season,
rebounding from several years of cyclically lower production. Growth in projected production in 2017/2018 appears across most major producing countries. Brazil—the world’s largest producer—is projected to increase 2.7 percent from the previous year, due primarily to additional sugarcane harvest diverted to sugar rather than to ethanol production. However, the largest annual increases are projected to come from India, the European Union and Thailand.
68 CHAPTER FIVE AFRICAN TRADE REPORT 2018
Additionally, the elimination of production quotas for sugarbeet-producing Member States in the European Union and the removal of export limits for EU sugar have reduced the need for foreign supplies as more productive regions in France, Germany, Poland and the United Kingdom boost output. Meanwhile, Africa’s sugar output in the 2017/2018 season remained relatively flat, despite rising consumption. However, efforts are under way in Nigeria, Africa’s top sugar importer, to achieve 100 percent self-sufficiency in sugar by 2023 and meet demand for 1.8 million tonnes a year. Nigeria remains a net importer, as are Cameroon and Kenya, which experienced shortfalls in supply during the season.
There were large price swings in the soybean market in 2017 as bullish and bearish sentiment traded places throughout the marketing year. Initial forecasts for a strong global harvest based on higher crop estimates for Argentina, Brazil, Paraguay and South Africa gave way to the possibility of a short soybean crop in the United States as drought conditions slashed the quality rating for the harvest. However, yield concerns in the United States proved to be unfounded, as yields increased compared with the previous season. This, coupled with strong planting intentions by US farmers for the 2017/2018 season, because of better returns on soybeans than on competing crops, helped cap soybean prices through the end of the year. Additionally, rising supply from South America encouraged more active soybean trade by several major importing countries, with global soybean imports for 2016/2017 forecast at a record 140 million tonnes. In Africa, Zimbabwe benefitted from competitive world prices after lifting a ban on soybean imports to solve an artificial shortage of cooking oil. Meanwhile China, the largest importer of soybeans, opportunistically boosted its buying by around 12 percent year-on-year, in anticipation of an increase in hog production.
Maize prices traded moderately higher during the first half of the year, although this trend was disrupted prior to the start of the harvesting season in the northern hemisphere. Increased prices in the first half of the year were due to a marginal decrease in production, with the US Department of Agriculture predicting a 3 percent drop in global output, mainly because of a decline in US production. There were also significant challenges in the corn basket of central and east Africa—Kenya, Tanzania and Zambia—where the adverse impact of sustained rain deficits on yields in March–May was acutely felt. In Kenya, the effect of drought conditions were worsened by an outbreak of fall armyworm. This prompted the government to waive import duties of white corn for food but also for yellow corn used for animal feed. Zambia fared better as higher corn area was enough to see a moderate increase in maize output, even with lower projected yields. Zambia suspended a 10 percent export duty on corn to facilitate sales to Kenya. Tanzania also experienced a reduction in corn yields, with the government temporarily banning corn exports. In all, global corn trade for the 2016/2017 trade year fell by 1.7 million tonnes, to 144.5 million tonnes, reflecting several major shortages.
Wheat prices generally traded higher in the first half of the year, following a pattern seen in most of the agricultural commodity complex. However, bullish momentum dropped considerably in July, with prices ending the year only marginally higher than at the start. The primary driver of higher prices was weather, as wheat yields came under pressure from the drought in the US grain belt, leaving commercial buyers exposed to the structural decline in high protein wheat in the United States, a key producer and exporter. But despite production shortfalls in the United States, global wheat output expanded tangibly in 2017, to around 752 million tonnes, up from 735 million tonnes in 2016, due especially to higher production in Russia. According
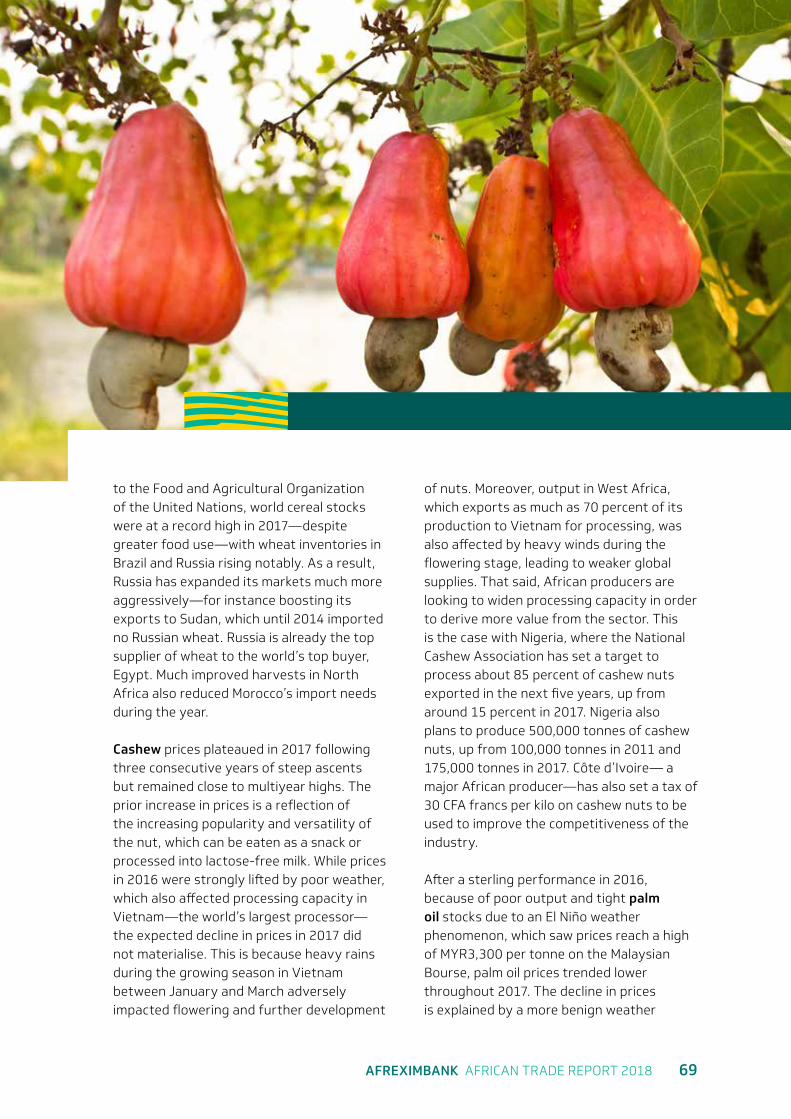
AFREXIMBANK AFRICAN TRADE REPORT 2018 69
to the Food and Agricultural Organization of the United Nations, world cereal stocks were at a record high in 2017—despite greater food use—with wheat inventories in Brazil and Russia rising notably. As a result, Russia has expanded its markets much more aggressively—for instance boosting its exports to Sudan, which until 2014 imported no Russian wheat. Russia is already the top supplier of wheat to the world’s top buyer, Egypt. Much improved harvests in North Africa also reduced Morocco’s import needs during the year.
Cashew prices plateaued in 2017 following three consecutive years of steep ascents but remained close to multiyear highs. The prior increase in prices is a reflection of the increasing popularity and versatility of the nut, which can be eaten as a snack or processed into lactose-free milk. While prices in 2016 were strongly lifted by poor weather, which also affected processing capacity in Vietnam—the world’s largest processor—the expected decline in prices in 2017 did not materialise. This is because heavy rains during the growing season in Vietnam between January and March adversely impacted flowering and further development
of nuts. Moreover, output in West Africa, which exports as much as 70 percent of its production to Vietnam for processing, was also affected by heavy winds during the flowering stage, leading to weaker global supplies. That said, African producers are looking to widen processing capacity in order to derive more value from the sector. This is the case with Nigeria, where the National Cashew Association has set a target to process about 85 percent of cashew nuts exported in the next five years, up from around 15 percent in 2017. Nigeria also plans to produce 500,000 tonnes of cashew nuts, up from 100,000 tonnes in 2011 and 175,000 tonnes in 2017. Côte d’Ivoire— a major African producer—has also set a tax of 30 CFA francs per kilo on cashew nuts to be used to improve the competitiveness of the industry.
After a sterling performance in 2016, because of poor output and tight palm oil stocks due to an El Niño weather phenomenon, which saw prices reach a high of MYR3,300 per tonne on the Malaysian Bourse, palm oil prices trended lower throughout 2017. The decline in prices is explained by a more benign weather
70 CHAPTER FIVE AFRICAN TRADE REPORT 2018
condition, leading to a significant recovery in output in Southeast Asia in 2017. And while the lower limit in prices was supported by strong demand from India in the first 10 months of the year, India’s demand tapered off in November, undermining the market, as speculation about higher duties prompted traders and refiners to reduce their purchases. Meanwhile, Africa continues to be a net palm oil importer, having bought around 6 million tonnes in the 2016/2017 season, with Nigeria, Kenya and South Africa among the top importers. Growing edible oil consumption compared with sluggish output has prompted non-traditional producers in Africa to prioritise domestic production. The government of Zambia is investing in palm oil plantations with a view to closing its import requirement of edible oil, which is estimated at around 120,000 tonnes a year. Longer term, Africa could be instrumental in raising global palm output due to restrictions on new plantings in Southeast Asia (which currently accounts for over 85 percent of palm oil output). Currently, the top three producers of palm oil in Africa are Nigeria, Ghana and Côte d’Ivoire, with a combined share of around 70 percent of African output.
Industrial metals consistently outperformed other commodities in 2017, supporting African producers the Democratic Republic of Congo, South Africa and Zambia. Industrial metal prices benefited from strong fundamentals, as the global recovery gathered pace, but also from concerns over production in China as well as short-term market cyclicality.
Copper was among the best-performing commodities in 2017, rising almost 27 percent, its biggest annual gain since 2010. Copper is often seen as a barometer of the global economy, and the synchronised global growth in 2017 was a bullish factor in the outlook for copper, especially with the US Federal Reserve and the European Central Bank more upbeat about prospects for growth in 2018. Aside from bullish prospects for global growth, labour disputes in Chile—
the largest producer—in the early part of the year reduced production and resulted in shortages. Data from the International Copper Study Group indicated a global copper deficit of 181,000 tonnes in the year to September 2017, compared with a deficit of 167,000 tonnes in the same period a year earlier. Favourable copper markets incentivised higher output in Zambia, Africa’s largest producer, which also benefited from stable power supply. Zambia’s copper output is estimated to have reached 800,000–850,000 tonnes in 2017, up from around 774,000 tonnes in 2016, with officials targeting an increase in output to up to 1 million tonnes in the near to medium term.
Demand and supply fundamentals were also broadly supportive for aluminum prices, with industry data showing a deficit of 27,000 tonnes in 2017 with a risk of further widening in 2018. Aluminium prices gathered steam in the last quarter of the year after data from China suggested that pollution curbs would reduce output. Aluminium production in China, which accounts for around 50 percent of global output, fell in the second half of the year as authorities also looked to reduce surplus capacity by closing some mills and smelters. Data from the International Aluminium Institute showed the intended effect of the policy in China: production slumped to its lowest in 21 months in December 2017, helping prop a market that had previously been plagued by oversupply. The buoyant aluminium market fuelled in part by export bans by Indonesia and Malaysia also attracted investments in Guinea from aluminium smelters in China, because Guinea is the largest reserves of bauxite in the world.
Tin ended the year lower after a remarkable performance in 2016. The tin market remains finely balanced, with strong demand emanating from the electronics sector, including the semiconductor and battery market. However, a moderate pickup in mine output in 2017 helped shore production from 340,000 tonnes to 360,000 tonnes,
AFREXIMBANK AFRICAN TRADE REPORT 2018 71
according to data from the International Tin Association, as higher prices incentivised production in Indonesia, Africa and China. Moreover, the removal of a 10 percent export duty in China—which accounts for around 48 percent of supply—at the start of 2017 led to an increase in Chinese supply in the market.
Zinc prices rose sharply in 2017 to their highest level since 2007 on very strong fundamentals. Zinc also benefited from a physically tight market, low inventories and weak levels of concentrate treatment charges in China, although the unexpected decision by China to raise borrowing costs undermined market confidence. Still, and according to the International Lead and Zinc Study Group, the global zinc market recorded a 401,000 tonne deficit in the first half of the year, as global refined zinc production fell by 0.6 percent while global usage rose 1.2 percent. Similarly, the lead market also recorded a deficit during the period, with usage rising 6.1 percent compared with output growth of only 3.8 percent, creating a shortfall of 173,000 tonnes.
In the precious metals market, gold prices improved steadily in 2017, rallying from around US$1,150 per troy ounce in January to close the year at around US$1,300 despite the US Federal Reserve’s tightening cycle, subdued inflation, robust equity markets and strong global growth. Gold prices were supported by market uncertainty, linked in part to geopolitical tensions and the outlook for US fiscal policy, supporting the role of bullion as a safe haven asset. Moreover, the consistent decline in the US dollar—highlighted by the downtrend in the US dollar index, which showed a strong negative correlation with the price of gold—also helped boost gold prices during the year.
Jewellery demand for gold increased for the first time since 2013, spurred by stable prices and improving economic conditions. Central banks also increased their gold reserves: official gold reserves grew by 371.4 tonnes, albeit at a lower rate compared with 2016.. On the supply front, although mine production rose to a record high of
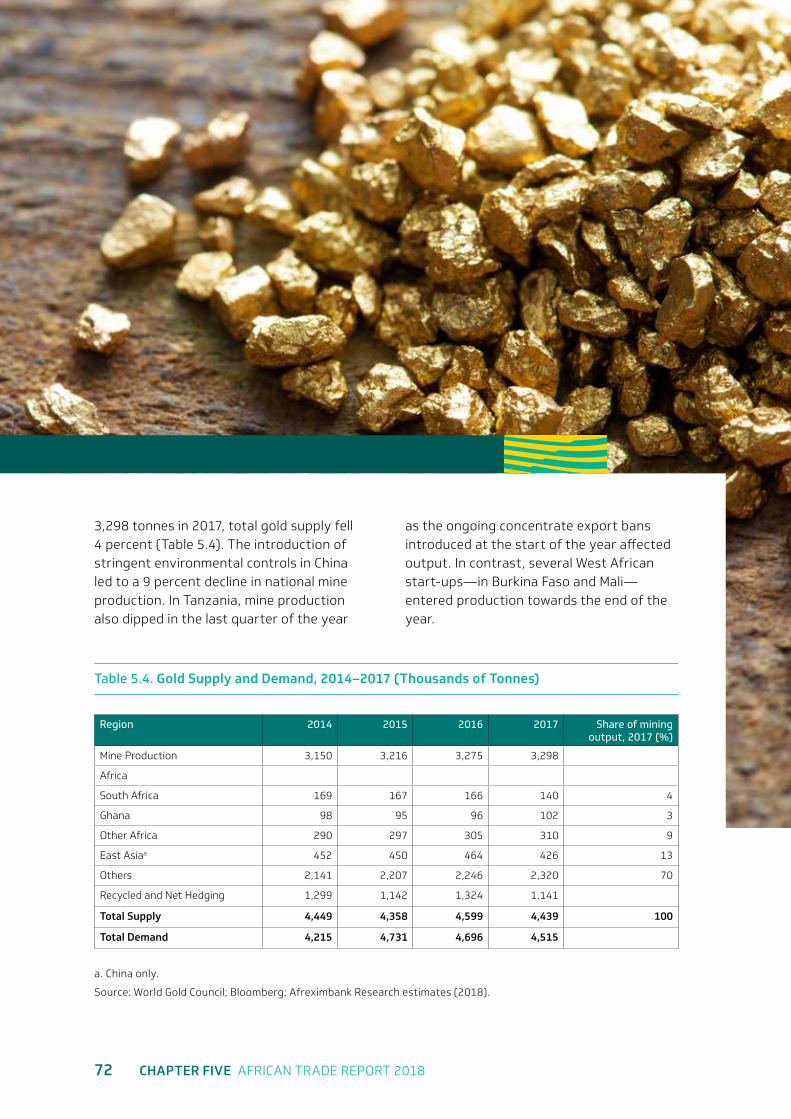
72 CHAPTER FIVE AFRICAN TRADE REPORT 2018
3,298 tonnes in 2017, total gold supply fell 4 percent (Table 5.4). The introduction of stringent environmental controls in China led to a 9 percent decline in national mine production. In Tanzania, mine production also dipped in the last quarter of the year
as the ongoing concentrate export bans introduced at the start of the year affected output. In contrast, several West African start-ups—in Burkina Faso and Mali—entered production towards the end of the year.
Table 5.4. Gold Supply and Demand, 2014–2017 (Thousands of Tonnes)
Region 2014 2015 2016 2017 Share of mining output, 2017 (%)
Mine Production 3,150 3,216 3,275 3,298
Africa
South Africa 169 167 166 140 4
Ghana 98 95 96 102 3
Other Africa 290 297 305 310 9
East Asiaa 452 450 464 426 13
Others 2,141 2,207 2,246 2,320 70
Recycled and Net Hedging 1,299 1,142 1,324 1,141
Total Supply 4,449 4,358 4,599 4,439 100
Total Demand 4,215 4,731 4,696 4,515
a. China only.
Source: World Gold Council; Bloomberg; Afreximbank Research estimates (2018).
AFREXIMBANK AFRICAN TRADE REPORT 2018 73
The price of silver rebounded in 2017, continuing on a recovery path after its slump in 2015, although its performance was more subdued compared with 2016 with silver prices underperforming that of other rare metals. Silver prices were buoyed at the start of the year on optimism that anticipated infrastructure and construction spending in the United States would increase demand—unlike other precious metals, silver has substantial industrial applications. However, this optimism proved short-lived because the proposed spending measures in the United States failed to quickly materialise, leading investors to back away from the metal and deeply denting sentiment for silver. Physical demand for silver was also down more than 50 percent, due partly to competing demand for
equities, which somewhat offset demand from the industrial sector.
Platinum prices averaged US$948.5 per troy ounce during 2017, compared with US$987.1 in 2016. Prices were affected by increasing production of around 2 percent, compared with global demand, which fell by around 7 percent, leaving the market with a surplus of around 315,000 ounces (Table 5.5). The drop in demand was due partly to a drop in the automotive industry—which uses the metal for catalytic converters—in Western Europe, although there was growth in commercial vehicles in China and the rest of the world. Demand from the jewellery sector also dropped, as did overall investment demand, although Exchange Traded Fund demand rebounded.
Table 5.5. Platinum Supply and Demand, 2015–2018 (Thousands of Ounces)
Country 2015 2016 2017 2018f Share of Refined Output, 2017 (%)
Refined Production 6,150 6,035 6,145 6,035
South Africa 4,465 4,255 4,385 4,355 71%
Zimbabwe 405 490 480 455 8%
North America 385 395 365 375 6%
Russia 715 715 725 660 12%
Other 180 180 190 185 3%
Recycling 1,710 1,855 1,905 1,960
Total Supply 7,905 7,920 8,080 7,975 100%
Total Demand 8,290 8,320 7,765 7,795
Source: World Platinum Investment Council; Afreximbank Research.
In the energy market, crude oil remained supported by the decision of the Organization of Petroleum Exporting Countries (OPEC) and its allies to reduce supplies until the end of 2018. Brent oil posted a second consecutive annual price increase in 2017 of 23.5 percent, after a decline of 13.2 percent in 2016. However, in the first half of 2017, prices plummeted 16 percent, dragged lower on concerns that rising US output—largely on account
of continuing shale output but also due to the recovery in Africa’s production—would undermine efforts by OPEC to contain supply. According to OPEC data, the organisation oversupplied markets by around 700,000 barrels per day in the first half of 2017, partly because of an increase in supply from Libya—which ramped up crude production the most in four years. Similarly, Nigeria, which had been exempted from OPEC cuts earlier in the year, also increased
74 CHAPTER FIVE AFRICAN TRADE REPORT 2018
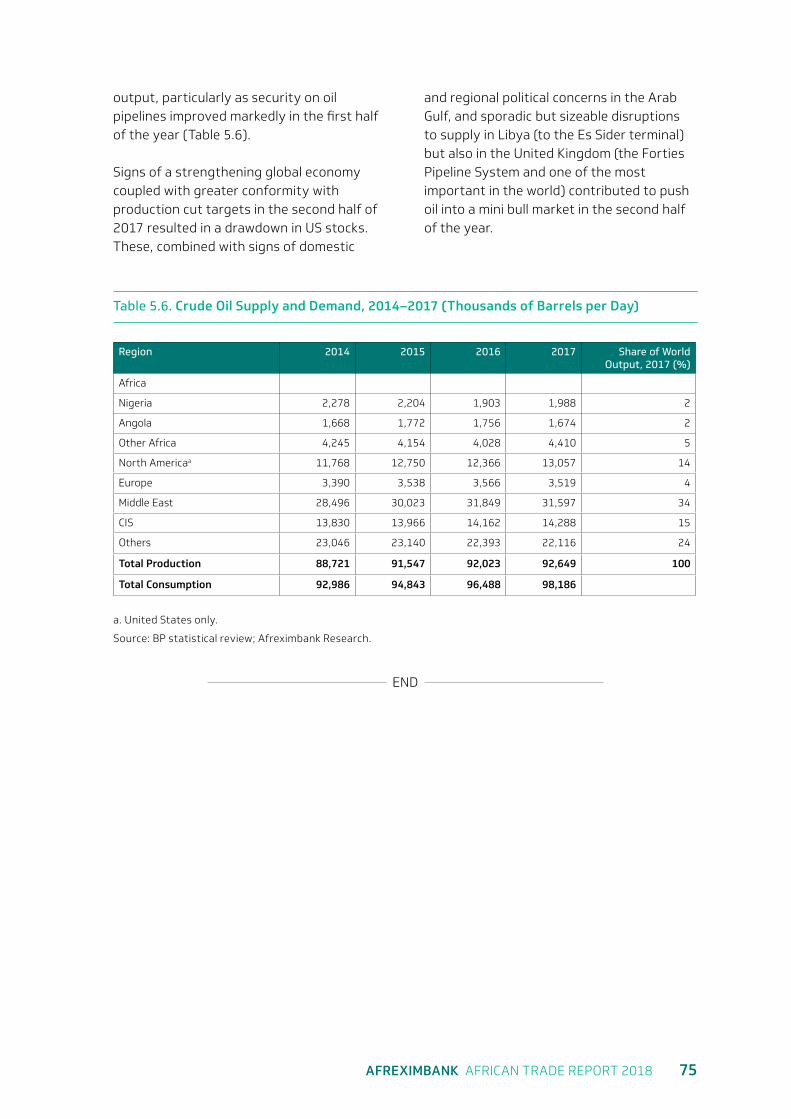
AFREXIMBANK AFRICAN TRADE REPORT 2018 75
output, particularly as security on oil pipelines improved markedly in the first half of the year (Table 5.6).
Signs of a strengthening global economy coupled with greater conformity with production cut targets in the second half of 2017 resulted in a drawdown in US stocks. These, combined with signs of domestic
and regional political concerns in the Arab Gulf, and sporadic but sizeable disruptions to supply in Libya (to the Es Sider terminal) but also in the United Kingdom (the Forties Pipeline System and one of the most important in the world) contributed to push oil into a mini bull market in the second half of the year.
END
Table 5.6. Crude Oil Supply and Demand, 2014–2017 (Thousands of Barrels per Day)
Region 2014 2015 2016 2017 Share of World Output, 2017 (%)
Africa
Nigeria 2,278 2,204 1,903 1,988 2
Angola 1,668 1,772 1,756 1,674 2
Other Africa 4,245 4,154 4,028 4,410 5
North Americaa 11,768 12,750 12,366 13,057 14
Europe 3,390 3,538 3,566 3,519 4
Middle East 28,496 30,023 31,849 31,597 34
CIS 13,830 13,966 14,162 14,288 15
Others 23,046 23,140 22,393 22,116 24
Total Production 88,721 91,547 92,023 92,649 100
Total Consumption 92,986 94,843 96,488 98,186
a. United States only.
Source: BP statistical review; Afreximbank Research.

6Chapter Six
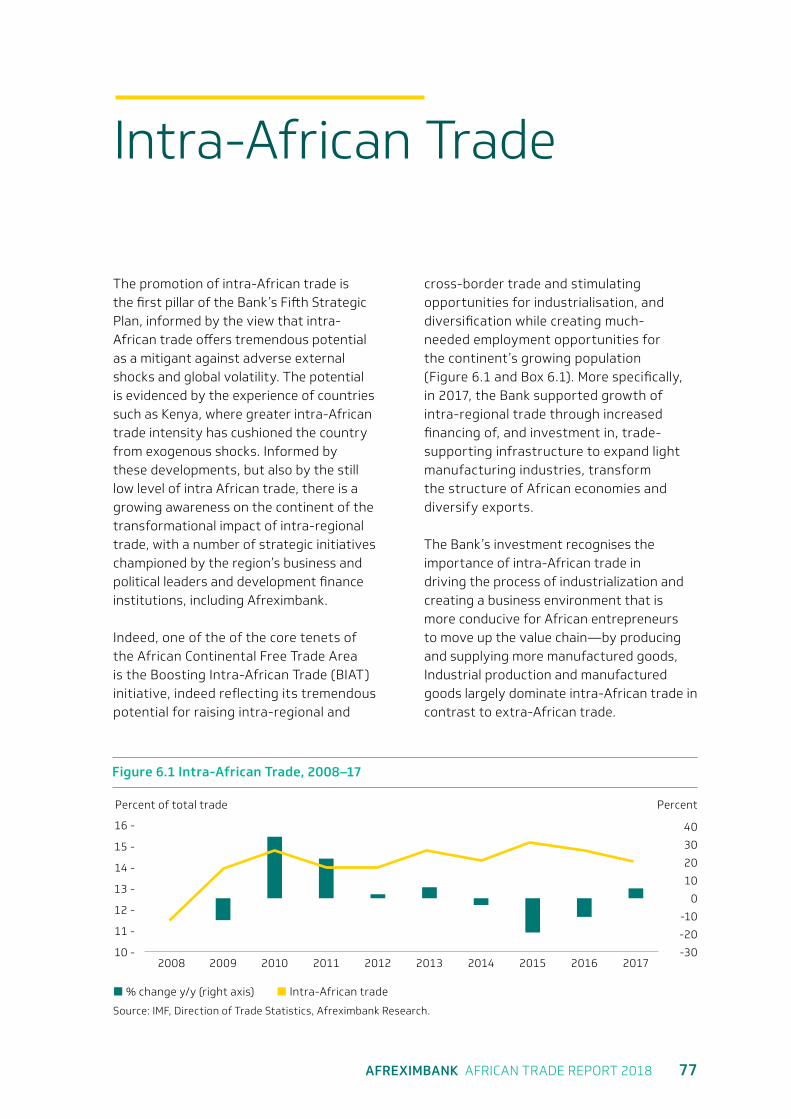
AFREXIMBANK AFRICAN TRADE REPORT 2018 77
Intra-African Trade
The promotion of intra-African trade is the first pillar of the Bank’s Fifth Strategic Plan, informed by the view that intra-African trade offers tremendous potential as a mitigant against adverse external shocks and global volatility. The potential is evidenced by the experience of countries such as Kenya, where greater intra-African trade intensity has cushioned the country from exogenous shocks. Informed by these developments, but also by the still low level of intra African trade, there is a growing awareness on the continent of the transformational impact of intra-regional trade, with a number of strategic initiatives championed by the region’s business and political leaders and development finance institutions, including Afreximbank.
Indeed, one of the of the core tenets of the African Continental Free Trade Area is the Boosting Intra-African Trade (BIAT) initiative, indeed reflecting its tremendous potential for raising intra-regional and
cross-border trade and stimulating opportunities for industrialisation, and diversification while creating much-needed employment opportunities for the continent’s growing population (Figure 6.1 and Box 6.1). More specifically, in 2017, the Bank supported growth of intra-regional trade through increased financing of, and investment in, trade-supporting infrastructure to expand light manufacturing industries, transform the structure of African economies and diversify exports.
The Bank’s investment recognises the importance of intra-African trade in driving the process of industrialization and creating a business environment that is more conducive for African entrepreneurs to move up the value chain—by producing and supplying more manufactured goods, Industrial production and manufactured goods largely dominate intra-African trade in contrast to extra-African trade.
Figure 6.1 Intra-African Trade, 2008–17
Source: IMF, Direction of Trade Statistics, Afreximbank Research.
16 -
% change y/y (right axis) Intra-African trade
11 -
12 -
14 -
10 - -30
-10
10
30
-20
0
20
40
13 -
15 -
2008 2010 20142012 20162009 2011 20152013 2017
Percent of total trade Percent
78 CHAPTER SIX AFRICAN TRADE REPORT 2018
The African Continental Free Trade Area (AfCFTA) signed by African governments earlier this year in Kigali, Rwanda, will be the largest free trade area created since the formation of the World Trade Organisation (WTO).1 The African Continental Free Trade Area will bring together 55 African countries with a combined population of more than 1.2 billion people and a combined gross domestic product (GDP) exceeding US$2.5 trillion.2 The AfCFTA has the potential for deepening the process of economic integration and accelerating the structural transformation of African economies as envisaged under the Lagos Plan of Action of 1980 and the Abuja Treaty of 1991.
The AfCFTA Agreement will provide a comprehensive and mutually beneficial trade agreement among the member states of the African Union, covering trade in goods and services, investment, intellectual property rights and competition policy. Negotiations towards the AfCFTA have been divided into two phases. Phase I negotiations covers Trade in Goods and Services and Dispute Settlement, while Phase
1 A total of 44 African countries signed the
AfCFTA Agreement in Kigali, including
its protocols, annexes, and appendices,
which form an integral part of the accord.
In addition, 47 countries also signed the
“Kigali Declaration” which, in the absence of
executive authority to sign the AfCFTA into
law, serves as an instrument demonstrating
support and solidarity for the agreement, and
30 countries signed a protocol on the free
movement of persons.
2 GDP in current prices.
II negotiations addresses Intellectual Property, Investment and Competition Policy (see Figure B6.1). The agreement signed in Kigali includes a framework agreement and protocols related to trade in goods and trade in services. With respect to trade in goods, the AfCFTA requires members to eliminate tariffs on 90 percent of their tariff lines, with the remaining 10 percent retained as either “sensitive” products with longer liberalisation periods, or as “excluded” products at the same tariff level. With regard to services, the protocol on trade in services provides that parties “shall undertake successive rounds of negotiations based on the principle of progressive liberalisation accompanied by the development of regulatory cooperation, and sectoral disciplines.” AfCFTA members have opted to use a positive list approach for services negotiations—only sectors explicitly identified are subject to liberalisation. In terms of the protocol, AfCFTA members are expected to identify nine priority sectors that will be subject to liberalisation.
Following signature, AfCFTA members, individually or as part of a customs union, are expected to develop and submit schedules of concessions for trade in goods detailing the 90 percent of products that are to be liberalised, the sensitive products to be liberalised over a longer time period, and the excluded products that are to be temporarily exempted from liberalisation. A related complement to the schedules of concessions for trade in goods is the list of product-specific rules of origin which is still being negotiated, as is
Box 6.1: African Continental Free Trade Area and Intra-African Trade Prospects
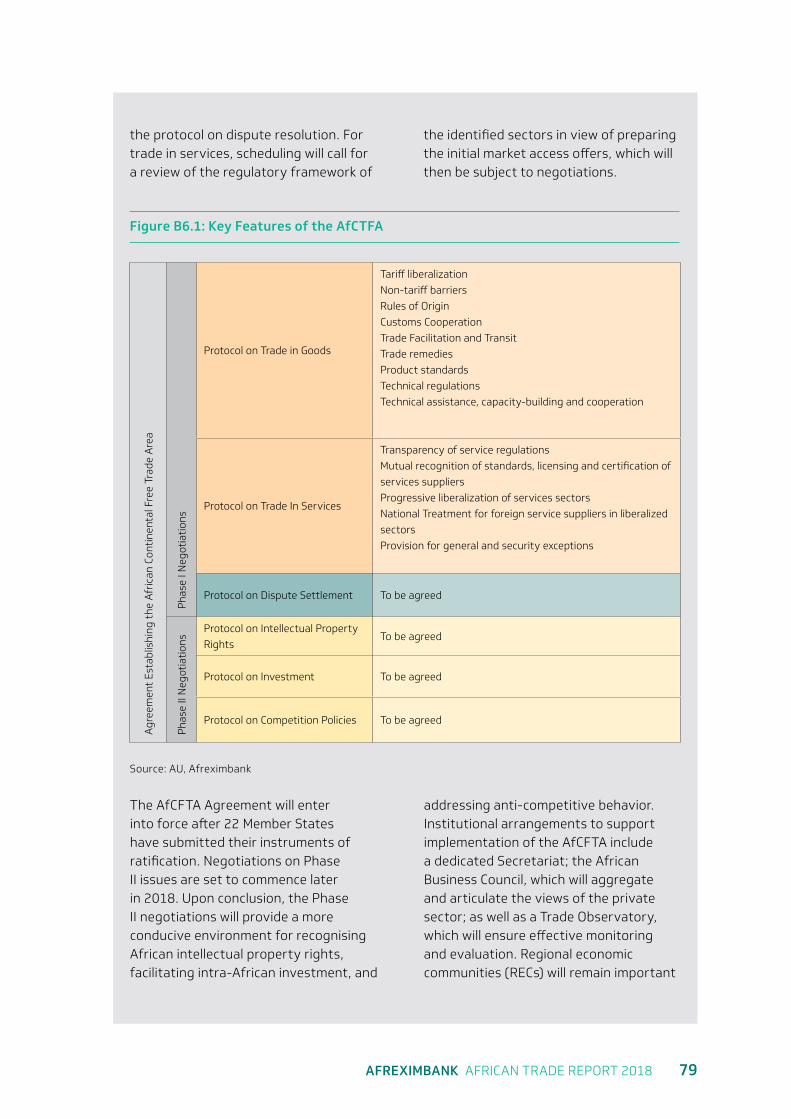
AFREXIMBANK AFRICAN TRADE REPORT 2018 79
the protocol on dispute resolution. For trade in services, scheduling will call for a review of the regulatory framework of
the identified sectors in view of preparing the initial market access offers, which will then be subject to negotiations.
Figure B6.1: Key Features of the AfCTFA
Agr
eem
ent
Esta
blis
hing
the
Afr
ican
Con
tine
ntal
Fre
e Tr
ade
Are
a
Pha
se I
Neg
otia
tion
s
Protocol on Trade in Goods
Tariff liberalization
Non-tariff barriers
Rules of Origin
Customs Cooperation
Trade Facilitation and Transit
Trade remedies
Product standards
Technical regulations
Technical assistance, capacity-building and cooperation
Protocol on Trade In Services
Transparency of service regulations
Mutual recognition of standards, licensing and certification of
services suppliers
Progressive liberalization of services sectors
National Treatment for foreign service suppliers in liberalized
sectors
Provision for general and security exceptions
Protocol on Dispute Settlement To be agreed
Pha
se II
Neg
otia
tion
s
Protocol on Intellectual Property
Rights To be agreed
Protocol on Investment To be agreed
Protocol on Competition Policies To be agreed
Source: AU, Afreximbank
The AfCFTA Agreement will enter into force after 22 Member States have submitted their instruments of ratification. Negotiations on Phase II issues are set to commence later in 2018. Upon conclusion, the Phase II negotiations will provide a more conducive environment for recognising African intellectual property rights, facilitating intra-African investment, and
addressing anti-competitive behavior. Institutional arrangements to support implementation of the AfCFTA include a dedicated Secretariat; the African Business Council, which will aggregate and articulate the views of the private sector; as well as a Trade Observatory, which will ensure effective monitoring and evaluation. Regional economic communities (RECs) will remain important
80 CHAPTER SIX AFRICAN TRADE REPORT 2018
partners coordinating the implementation and measures for resolving non-tariff barriers, harmonising standards and monitoring implementation.
Intra-African Trade Potential and Benefits of the AfCFTA
The AfCFTA is an important step towards rationalising Africa’s regional trade arrangements to deepen economic integration and draw on economies of scale and development of regional value chains to accelerate the process of structural transformation of African economies. Preliminary estimates and simulations suggest that under the AfCFTA intra-African trade will increase by 52.3 percent by 2022, and more than double within the first decade of implementation if the implementation of the AfCFTA is accompanied by robust trade facilitation measures.3 And in an environment where intra-African trade is dominated by products with increasingly high technological content the AfCFTA could significantly expand industrial production and accelerate the diversification of sources of growth, with intra-African trade in industrial products increasing by US$60 billion annually.
An integrated African market is also likely to see enhanced flow of foreign direct investment (FDI) and could shift FDI from natural resources to industry and manufacturing as investors seek to take advantage of increased market
3 For more details see Mevel and Karingi (2012).
Deepening Regional Integration in Africa: A
Computable General Equilibrium Assessment
of the Establishment of a Continental Free
Trade Area followed by a Continental Customs
Union.
size. Implementation of the AfCFTA will also enhance the integration of African economies into the global economy, and strengthen the process of engagement between Africa and its main trading partners, multilaterally within the World Trade Organization (WTO) framework and bilaterally with other trading partners such as Brazil, China, the European Union, India, and the United States.
Challenges and Risks to Implementation of the AfCFTA
While the AfCFTA provides an opportunity for Africa to boost intra-African trade and accelerate the process of structural transformation to reduce the vulnerability of its economies to external shocks, the implementation of the agreement will be complex given the large number, diverse nature and different stages of economic development of Member States. At the same time integration may carry significant adjustments costs for some countries, including fiscal adjustments. In this regard, implementation will need to be structured and sequenced appropriately and compensatory or adjustment mechanisms may need to be put in place to ensure broad-based gains for all Member States.
In addition, the realisation of the potential offered by the AfCFTA will hinge on a supportive and facilitative trade environment. In particular, effective implementation of the AfCFTA will require: (i) investments in trade facilitating infrastructure to ensure that the market access benefits are fully realized; (ii) implementation of the AU’s Action Plan for the Accelerated Industrial Development of Africa (AIDA); (iii) major investment in trade
AFREXIMBANK AFRICAN TRADE REPORT 2018 81
information, in particular the AU’s Trade Observatory and Afreximbank’s Trade Information Portal; (iv) effective implementation of the Programme for Infrastructure Development in Africa (PIDA); and (v) availability of appropriate trade finance and risk-bearing facilities that can facilitate the trade. Likewise, implementation of the Boosting Intra-African Trade (BIAT) Action Plan will provide the framework for the supportive policies and environment that are key to the AfCFTA’s success.
Afreximbank Interventions in Support of the AfCFTA
Given the alignment between the Bank’s Fifth Strategic Plan dubbed IMPACT 2021 and the ambitions of the AfCFTA, the Bank—which worked closely with the AU Commission during the period leading to the launch of the AfCFTA—will greatly benefit from its successful implementation and the transition towards an African Single Market. The Bank has among others prioritised intra-African trade, industrialisation and export development, and trade finance leadership as pillars of its strategy. In support of intra-African trade it will disburse about US$25 billion
dollars during the five years of Plan V implementation ending in 2021. To facilitate the confirmation of letters of credit in support of intra-African trade it has opened credit lines amounting to US$800 million to 55 banks across Africa and aims to extend such lines to at least 500 African banks by 2021. To diversify sources of growth and expand intra-African trade the Bank is supporting the development of industrial parks and special economic zones across the region.
The Bank is also working closely with the AU Commission to support implementation of the AfCFTA through a number of strategic initiatives, including the inaugural Intra-African Trade Fair this year in Cairo, Egypt, to connect African buyers and sellers; development of an intra-African Trade Payments and Settlement Platform that will facilitate the clearing and settlement of intra-African trade transactions in African currencies; the launch in 2018 of an African Customer Due Diligence Repository Platform (ACDIRP) aimed at improving access to trade finance by reducing compliance costs; and establishment of a Pan-African Private Sector Trade and Investment Committee to enhance African private sector participation in trade negotiations and investment policy formulation.
END
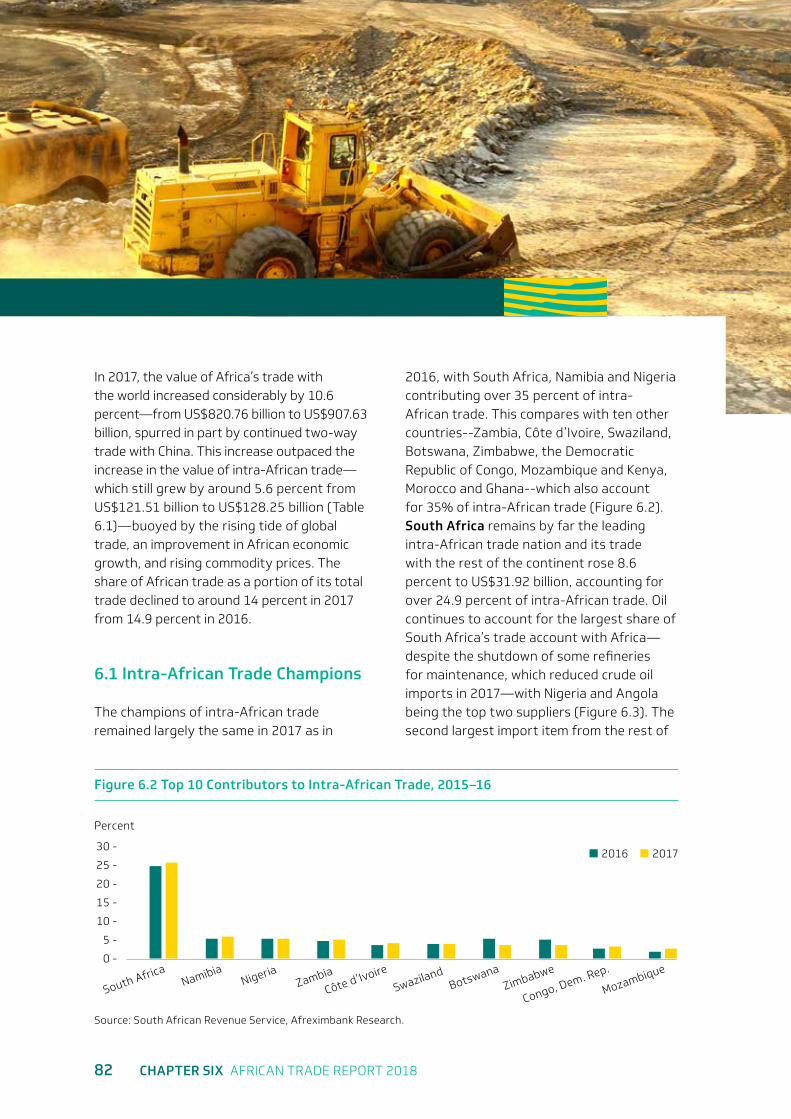
82 CHAPTER SIX AFRICAN TRADE REPORT 2018
In 2017, the value of Africa’s trade with the world increased considerably by 10.6 percent—from US$820.76 billion to US$907.63 billion, spurred in part by continued two-way trade with China. This increase outpaced the increase in the value of intra-African trade—which still grew by around 5.6 percent from US$121.51 billion to US$128.25 billion (Table 6.1)—buoyed by the rising tide of global trade, an improvement in African economic growth, and rising commodity prices. The share of African trade as a portion of its total trade declined to around 14 percent in 2017 from 14.9 percent in 2016.
6.1 Intra-African Trade Champions
The champions of intra-African trade remained largely the same in 2017 as in
2016, with South Africa, Namibia and Nigeria contributing over 35 percent of intra-African trade. This compares with ten other countries--Zambia, Côte d’Ivoire, Swaziland, Botswana, Zimbabwe, the Democratic Republic of Congo, Mozambique and Kenya, Morocco and Ghana--which also account for 35% of intra-African trade (Figure 6.2). South Africa remains by far the leading intra-African trade nation and its trade with the rest of the continent rose 8.6 percent to US$31.92 billion, accounting for over 24.9 percent of intra-African trade. Oil continues to account for the largest share of South Africa’s trade account with Africa—despite the shutdown of some refineries for maintenance, which reduced crude oil imports in 2017—with Nigeria and Angola being the top two suppliers (Figure 6.3). The second largest import item from the rest of
Figure 6.2 Top 10 Contributors to Intra-African Trade, 2015–16
Source: South African Revenue Service, Afreximbank Research.
25 -
30 -
Percent
20 -
15 -
10 -
5 -
0 -
South AfricaZambia
BotswanaNamibia
Côte d’IvoireZimbabwe
Nigeria
Swaziland
Congo, Dem. Rep.
Mozambique
2016 2017
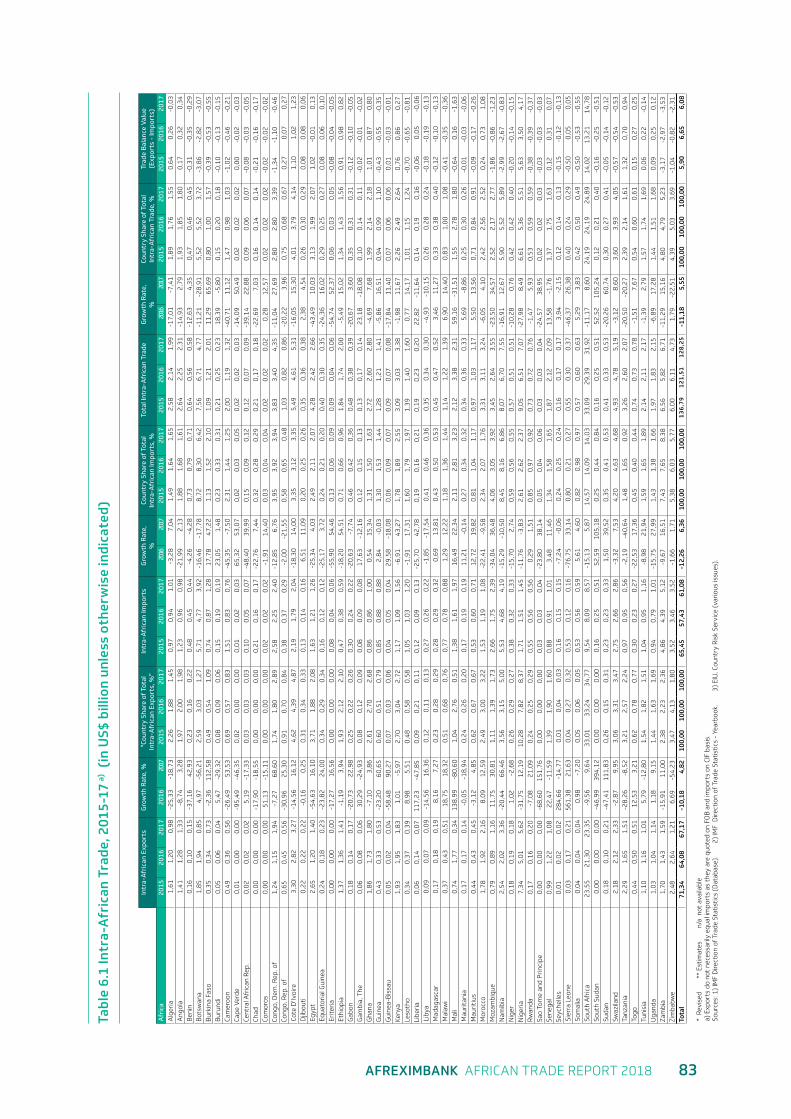
AFREXIMBANK AFRICAN TRADE REPORT 2018 83
Tabl
e 6.
1 In
tra-
Afr
ican
Tra
de, 2
015-
17 a)
(in
US$
bill
ion
unle
ss o
ther
wis
e in
dica
ted)
Intr
a-A
fric
an E
xpor
tsG
row
th R
ate,
%"C
ount
ry S
hare
of
Tota
l In
tra-
Afr
ican
Exp
orts
, %"
Intr
a-A
fric
an Im
port
sG
row
th R
ate,
%
Coun
try
Shar
e of
Tot
al
Intr
a-A
fric
an Im
port
s, %
Tota
l Int
ra-A
fric
an T
rade
Gro
wth
Rat
e,
%Co
untr
y Sh
are
of T
otal
In
tra-
Afr
ican
Tra
de, %
Trad
e B
alan
ce V
alue
(E
xpor
ts -
Impo
rts)
Afr
ica
2015
2016
2017
2016
2017
2015
2016
2017
2015
2016
2017
2016
2017
2015
2016
2017
2015
2016
2017
2016
2017
2015
2016
2017
2015
2016
2017
Alg
eria
1,61
1,20
0,98
-25,
33-1
8,73
2,26
1,88
1,45
0,97
0,94
1,01
-3,2
87,
041,
491,
641,
652,
582,
141,
99-1
7,01
-7,4
11,
891,
761,
550,
640,
26-0
,03
Ang
ola
1,41
1,28
1,33
-8,7
43,
281,
972,
001,
981,
230,
960,
98-2
1,99
2,13
1,88
1,68
1,61
2,64
2,25
2,31
-14,
932,
791,
931,
851,
800,
170,
320,
34B
enin
0,16
0,10
0,15
-37,
1642
,93
0,23
0,16
0,22
0,48
0,45
0,44
-4,2
6-4
,28
0,73
0,79
0,71
0,64
0,56
0,58
-12,
634,
350,
470,
460,
45-0
,31
-0,3
5-0
,29
Bot
swan
a1,
851,
940,
854,
97-5
6,21
2,59
3,03
1,27
5,71
4,77
3,92
-16,
46-1
7,78
8,72
8,30
6,42
7,56
6,71
4,77
-11,
21-2
8,91
5,52
5,52
3,72
-3,8
6-2
,82
-3,0
7B
urki
na F
aso
0,35
0,34
0,73
-2,3
611
2,58
0,49
0,54
1,09
0,74
0,87
1,28
17,7
847
,22
1,13
1,52
2,10
1,09
1,21
2,01
11,2
965
,69
0,80
1,00
1,57
-0,3
9-0
,53
-0,5
5B
urun
di0,
050,
060,
045,
47-2
9,32
0,08
0,09
0,06
0,15
0,19
0,19
23,0
51,
480,
230,
330,
310,
210,
250,
2318
,39
-5,8
00,
150,
200,
18-0
,10
-0,1
3-0
,15
Cam
eroo
n0,
490,
360,
56-2
6,49
53,5
30,
690,
570,
831,
510,
830,
76-4
5,35
-7,5
02,
311,
441,
252,
001,
191,
32-4
0,71
11,1
21,
470,
981,
03-1
,02
-0,4
6-0
,21
Cape
Ver
de0,
010,
000,
00-9
5,49
-46,
350,
020,
000,
000,
010,
020,
0365
,32
53,0
70,
020,
030,
050,
020,
020,
03-1
4,09
50,4
90,
020,
020,
020,
00-0
,02
-0,0
3Ce
ntra
l Afr
ican
Rep
.0,
020,
020,
025,
19-1
7,33
0,03
0,03
0,03
0,10
0,05
0,07
-48,
4039
,99
0,15
0,09
0,12
0,12
0,07
0,09
-39,
1422
,88
0,09
0,06
0,07
-0,0
8-0
,03
-0,0
5Ch
ad0,
000,
000,
00-1
7,90
-18,
550,
000,
000,
000,
210,
160,
17-2
2,76
7,44
0,32
0,28
0,29
0,21
0,17
0,18
-22,
697,
030,
160,
140,
14-0
,21
-0,1
6-0
,17
Com
oros
0,00
0,00
0,00
51,1
3-1
5,11
0,00
0,00
0,00
0,02
0,02
0,02
-1,9
114
,40
0,03
0,04
0,04
0,02
0,02
0,02
0,28
12,5
70,
020,
020,
02-0
,02
-0,0
2-0
,02
Cong
o, D
em. R
ep. o
f1,
241,
151,
94-7
,27
68,6
01,
741,
802,
892,
582,
252,
40-1
2,85
6,76
3,95
3,92
3,94
3,83
3,40
4,35
-11,
0427
,69
2,80
2,80
3,39
-1,3
4-1
,10
-0,4
6Co
ngo,
Rep
. of
0,65
0,45
0,56
-30,
9625
,30
0,91
0,70
0,84
0,38
0,37
0,29
-2,0
0-2
1,55
0,58
0,65
0,48
1,03
0,82
0,86
-20,
223,
960,
750,
680,
670,
270,
070,
27Co
te D
'Ivoi
re3,
302,
823,
27-1
4,56
16,1
24,
624,
394,
872,
191,
792,
04-1
8,30
14,0
03,
353,
123,
355,
494,
615,
31-1
6,05
15,3
04,
013,
794,
141,
101,
021,
23D
jibou
ti0,
220,
220,
22-0
,16
0,25
0,31
0,34
0,33
0,13
0,14
0,16
6,51
11,0
90,
200,
250,
260,
350,
360,
382,
384,
540,
260,
300,
290,
080,
080,
06Eg
ypt
2,65
1,20
1,40
-54,
6316
,10
3,71
1,88
2,08
1,63
1,21
1,26
-25,
344,
032,
492,
112,
074,
282,
422,
66-4
3,49
10,0
33,
131,
992,
071,
02-0
,01
0,13
Equa
tori
al G
uine
a0,
240,
180,
23-2
3,82
24,0
00,
340,
290,
340,
160,
120,
12-2
5,17
3,72
0,24
0,21
0,20
0,40
0,30
0,35
-24,
3616
,02
0,29
0,25
0,27
0,08
0,06
0,10
Erit
eria
0,00
0,00
0,00
-17,
2716
,56
0,00
0,00
0,00
0,08
0,04
0,06
-55,
9054
,46
0,13
0,06
0,09
0,09
0,04
0,06
-54,
7452
,37
0,06
0,03
0,05
-0,0
8-0
,04
-0,0
5Et
hiop
ia1,
371,
361,
41-1
,19
3,94
1,93
2,12
2,10
0,47
0,38
0,59
-18,
2054
,51
0,71
0,66
0,96
1,84
1,74
2,00
-5,4
915
,02
1,34
1,43
1,56
0,91
0,98
0,82
Gab
on0,
180,
140,
17-2
0,73
22,9
80,
250,
220,
260,
300,
240,
22-2
0,63
-7,7
40,
460,
420,
360,
480,
380,
39-2
0,67
3,60
0,35
0,31
0,31
-0,1
2-0
,10
-0,0
5G
ambi
a, T
he0,
060,
080,
0630
,29
-24,
930,
080,
120,
090,
080,
090,
0817
,63
-12,
160,
120,
150,
130,
130,
170,
1423
,18
-18,
080,
100,
140,
11-0
,02
-0,0
1-0
,02
Gha
na1,
861,
731,
80-7
,10
3,86
2,61
2,70
2,68
0,86
0,86
1,00
0,54
15,3
41,
311,
501,
632,
722,
602,
80-4
,69
7,68
1,99
2,14
2,18
1,01
0,87
0,80
Gui
nea
0,43
0,33
0,53
-23,
2060
,65
0,60
0,51
0,79
0,85
0,88
0,88
2,84
-0,0
31,
301,
531,
441,
281,
211,
41-5
,86
16,5
10,
940,
991,
10-0
,43
-0,5
5-0
,35
Gui
nea-
Bis
sau
0,05
0,02
0,04
-58,
4890
,27
0,07
0,03
0,06
0,04
0,05
0,04
29,5
8-1
8,08
0,06
0,09
0,07
0,09
0,07
0,08
-17,
8411
,40
0,07
0,06
0,06
0,01
-0,0
3-0
,01
Keny
a1,
931,
951,
831,
01-5
,97
2,70
3,04
2,72
1,17
1,09
1,56
-6,9
143
,27
1,78
1,89
2,55
3,09
3,03
3,38
-1,9
811
,67
2,26
2,49
2,64
0,76
0,86
0,27
Leso
tho
0,34
0,37
0,39
8,98
5,51
0,48
0,58
0,58
1,05
1,03
1,20
-1,9
117
,31
1,60
1,79
1,97
1,39
1,40
1,60
0,77
14,1
71,
011,
151,
24-0
,70
-0,6
5-0
,81
Libe
ria
0,06
0,14
0,07
117,
23-4
7,85
0,09
0,21
0,11
0,12
0,09
0,13
-25,
7042
,78
0,19
0,16
0,21
0,19
0,23
0,20
22,8
2-1
1,64
0,14
0,19
0,16
-0,0
60,
05-0
,06
Liby
a0,
090,
070,
09-1
4,56
16,3
60,
120,
110,
130,
270,
260,
22-1
,85
-17,
540,
410,
460,
360,
350,
340,
30-4
,93
-10,
150,
260,
280,
24-0
,18
-0,1
9-0
,13
Mad
agas
car
0,17
0,18
0,19
8,16
7,27
0,23
0,28
0,29
0,28
0,29
0,32
0,69
13,8
10,
430,
500,
530,
450,
470,
523,
4611
,27
0,33
0,38
0,40
-0,1
2-0
,10
-0,1
3M
alaw
i0,
370,
430,
5118
,75
18,3
20,
510,
680,
760,
770,
780,
881,
2912
,22
1,18
1,36
1,44
1,14
1,22
1,39
6,90
14,4
00,
831,
001,
08-0
,41
-0,3
5-0
,36
Mal
i0,
741,
770,
3413
8,99
-80,
601,
042,
760,
511,
381,
611,
9716
,49
22,3
42,
112,
813,
232,
123,
382,
3159
,16
-31,
511,
552,
781,
80-0
,64
0,16
-1,6
3M
auri
tani
a0,
170,
170,
14-0
,05
-18,
940,
240,
260,
200,
170,
190,
1911
,21
-0,1
40,
270,
340,
320,
340,
360,
335,
69-8
,86
0,25
0,30
0,26
-0,0
1-0
,03
-0,0
6M
auri
tius
0,44
0,43
0,45
-3,1
24,
850,
620,
670,
670,
530,
600,
7112
,72
19,8
20,
811,
041,
170,
971,
031,
175,
5013
,56
0,71
0,84
0,91
-0,0
9-0
,17
-0,2
6M
oroc
co1,
781,
922,
168,
0912
,59
2,49
3,00
3,22
1,53
1,19
1,08
-22,
41-9
,58
2,34
2,07
1,76
3,31
3,11
3,24
-6,0
54,
102,
422,
562,
520,
240,
731,
08M
ozam
biqu
e0,
790,
891,
1611
,75
30,8
11,
111,
391,
732,
661,
752,
39-3
4,04
36,4
84,
063,
053,
923,
452,
643,
55-2
3,50
34,5
72,
522,
172,
77-1
,86
-0,8
6-1
,23
Nam
ibia
2,54
2,02
3,36
-20,
4466
,46
3,56
3,15
5,00
5,53
4,68
4,19
-15,
29-1
0,50
8,45
8,16
6,86
8,07
6,70
7,55
-16,
9112
,67
5,90
5,52
5,89
-2,9
9-2
,67
-0,8
3N
iger
0,18
0,19
0,18
1,02
-2,6
80,
260,
290,
270,
380,
320,
33-1
5,70
2,74
0,59
0,56
0,55
0,57
0,51
0,51
-10,
280,
760,
420,
420,
40-0
,20
-0,1
4-0
,15
Nig
eria
7,34
5,01
5,62
-31,
7512
,19
10,2
87,
828,
371,
711,
511,
45-1
1,76
-3,8
32,
612,
622,
379,
056,
517,
07-2
7,98
8,49
6,61
5,36
5,51
5,63
3,50
4,17
Rw
anda
0,17
0,16
0,20
-7,0
821
,09
0,24
0,25
0,29
0,55
0,56
0,56
0,29
1,51
0,85
0,97
0,92
0,73
0,72
0,76
-1,4
75,
930,
530,
590,
59-0
,38
-0,3
9-0
,37
Sao
Tom
e an
d P
rinc
ipe
0,00
0,00
0,00
-68,
6015
1,76
0,00
0,00
0,00
0,03
0,03
0,04
-23,
8038
,14
0,05
0,04
0,06
0,03
0,03
0,04
-24,
5738
,95
0,02
0,02
0,03
-0,0
3-0
,03
-0,0
3Se
nega
l0,
991,
221,
0822
,47
-11,
591,
391,
901,
600,
880,
911,
013,
4811
,46
1,34
1,58
1,65
1,87
2,12
2,09
13,5
8-1
,76
1,37
1,75
1,63
0,12
0,31
0,07
Seyc
helle
s0,
010,
020,
0228
4,66
-14,
770,
010,
040,
030,
160,
150,
15-7
,24
-0,0
60,
240,
250,
240,
160,
170,
173,
94-2
,15
0,12
0,14
0,13
-0,1
5-0
,12
-0,1
3Si
erra
Leo
ne0,
030,
170,
2156
1,38
21,6
30,
040,
270,
320,
530,
120,
16-7
6,75
33,1
40,
800,
210,
270,
550,
300,
37-4
6,37
26,3
80,
400,
240,
29-0
,50
0,05
0,05
Som
alia
0,04
0,04
0,04
0,98
-7,2
00,
050,
060,
050,
530,
560,
595,
614,
600,
820,
980,
970,
570,
600,
635,
293,
830,
420,
500,
49-0
,50
-0,5
3-0
,55
Sout
h A
fric
a23
,55
21,3
023
,35
-9,5
69,
6433
,01
33,2
434
,77
9,54
8,09
8,57
-15,
135,
8714
,57
14,0
914
,03
33,0
929
,39
31,9
2-1
1,17
8,60
24,1
924
,19
24,8
914
,02
13,2
114
,78
Sout
h Su
dan
0,00
0,00
0,00
-46,
9939
4,12
0,00
0,00
0,00
0,16
0,25
0,51
52,5
910
5,18
0,25
0,44
0,84
0,16
0,25
0,51
52,5
210
5,24
0,12
0,21
0,40
-0,1
6-0
,25
-0,5
1Su
dan
0,18
0,10
0,21
-47,
4111
1,83
0,26
0,15
0,31
0,23
0,23
0,33
1,50
39,5
20,
350,
410,
530,
410,
330,
53-2
0,26
60,7
40,
300,
270,
41-0
,05
-0,1
4-0
,12
Swaz
iland
2,18
2,12
2,33
-2,8
79,
953,
063,
313,
472,
752,
662,
86-3
,32
7,53
4,20
4,63
4,68
4,93
4,78
5,19
-3,1
28,
603,
603,
934,
05-0
,57
-0,5
4-0
,53
Tanz
ania
2,29
1,65
1,51
-28,
26-8
,52
3,21
2,57
2,24
0,97
0,95
0,56
-2,1
9-4
0,64
1,48
1,65
0,92
3,26
2,60
2,07
-20,
50-2
0,27
2,39
2,14
1,61
1,32
0,70
0,94
Togo
0,44
0,50
0,51
12,5
33,
210,
620,
780,
770,
300,
230,
27-2
2,53
17,3
60,
450,
400,
440,
740,
730,
78-1
,51
7,67
0,54
0,60
0,61
0,15
0,27
0,25
Tuni
sia
1,10
1,16
1,01
5,79
-12,
801,
541,
821,
511,
040,
951,
16-8
,98
21,9
41,
591,
651,
892,
142,
112,
17-1
,39
2,79
1,57
1,74
1,69
0,06
0,22
-0,1
4U
gand
a1,
031,
041,
141,
189,
151,
441,
631,
690,
940,
791,
01-1
5,75
27,9
91,
431,
381,
661,
971,
832,
15-6
,89
17,2
81,
441,
511,
680,
090,
250,
12Za
mbi
a1,
701,
431,
59-1
5,91
11,0
02,
382,
232,
364,
864,
395,
12-9
,67
16,5
17,
437,
658,
386,
565,
826,
71-1
1,29
15,1
64,
804,
795,
23-3
,17
-2,9
7-3
,53
Zim
babw
e2,
482,
641,
216,
69-5
4,23
3,47
4,13
1,80
3,52
3,46
3,52
-1,6
61,
715,
386,
035,
776,
006,
114,
731,
79-2
2,51
4,39
5,03
3,69
-1,0
4-0
,82
-2,3
1To
tal
71,3
464
,08
67,1
7-1
0,18
4,82
100,
0010
0,00
100,
0065
,45
57,4
361
,08
-12,
266,
3610
0,00
100,
0010
0,00
13
6,7
91
21
,51
12
8,2
5-1
1,18
5,55
100,
0010
0,00
100,
005,
906,
656,
08
* R
evis
ed
**
Est
imat
es
n/
a n
ot a
vaila
ble
a) E
xpor
ts d
o no
t ne
cess
arily
equ
al im
port
s as
the
y ar
e qu
oted
on
FOB
and
impo
rts
on C
IF b
asis
.So
urce
s: 1
) IM
F D
irect
ion
of T
rade
Sta
tist
ics
(Dat
abas
e).
2)
IMF
Dire
ctio
n of
Tra
de S
tati
stic
s -
Year
book
.
3) E
IU, C
ount
ry R
isk
Serv
ice
(var
ious
issu
es).
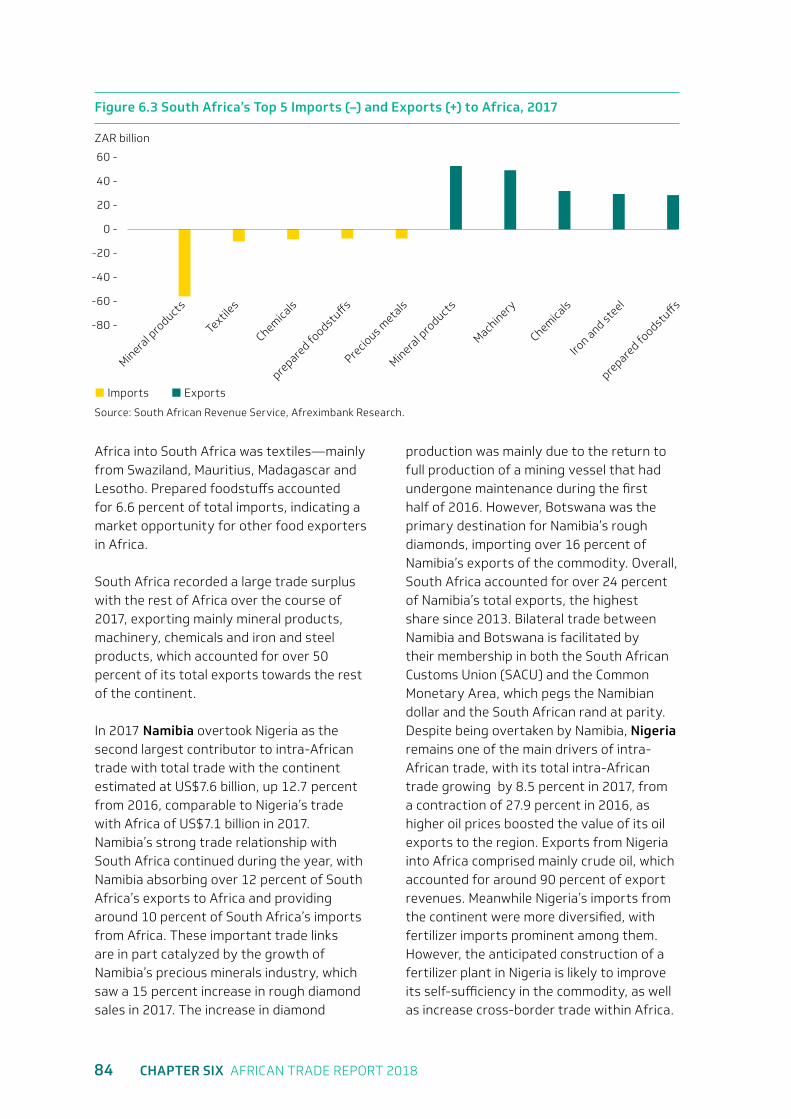
84 CHAPTER SIX AFRICAN TRADE REPORT 2018
Africa into South Africa was textiles—mainly from Swaziland, Mauritius, Madagascar and Lesotho. Prepared foodstuffs accounted for 6.6 percent of total imports, indicating a market opportunity for other food exporters in Africa.
South Africa recorded a large trade surplus with the rest of Africa over the course of 2017, exporting mainly mineral products, machinery, chemicals and iron and steel products, which accounted for over 50 percent of its total exports towards the rest of the continent.
In 2017 Namibia overtook Nigeria as the second largest contributor to intra-African trade with total trade with the continent estimated at US$7.6 billion, up 12.7 percent from 2016, comparable to Nigeria’s trade with Africa of US$7.1 billion in 2017. Namibia’s strong trade relationship with South Africa continued during the year, with Namibia absorbing over 12 percent of South Africa’s exports to Africa and providing around 10 percent of South Africa’s imports from Africa. These important trade links are in part catalyzed by the growth of Namibia’s precious minerals industry, which saw a 15 percent increase in rough diamond sales in 2017. The increase in diamond
production was mainly due to the return to full production of a mining vessel that had undergone maintenance during the first half of 2016. However, Botswana was the primary destination for Namibia’s rough diamonds, importing over 16 percent of Namibia’s exports of the commodity. Overall, South Africa accounted for over 24 percent of Namibia’s total exports, the highest share since 2013. Bilateral trade between Namibia and Botswana is facilitated by their membership in both the South African Customs Union (SACU) and the Common Monetary Area, which pegs the Namibian dollar and the South African rand at parity. Despite being overtaken by Namibia, Nigeria remains one of the main drivers of intra-African trade, with its total intra-African trade growing by 8.5 percent in 2017, from a contraction of 27.9 percent in 2016, as higher oil prices boosted the value of its oil exports to the region. Exports from Nigeria into Africa comprised mainly crude oil, which accounted for around 90 percent of export revenues. Meanwhile Nigeria’s imports from the continent were more diversified, with fertilizer imports prominent among them. However, the anticipated construction of a fertilizer plant in Nigeria is likely to improve its self-sufficiency in the commodity, as well as increase cross-border trade within Africa.
Figure 6.3 South Africa’s Top 5 Imports (–) and Exports (+) to Africa, 2017
Source: South African Revenue Service, Afreximbank Research.
20 -
40 -
60 -
ZAR billion
0 -
-20 -
-40 -
-60 -
-80 -
Mineral p
roduct
s
Textil
es
Chemica
ls
prepare
d foodst
uffs
Precio
us meta
ls
Mineral p
roduct
s
Machinery
Chemica
ls
Iron and st
eel
prepare
d foodst
uffs
Imports Exports
AFREXIMBANK AFRICAN TRADE REPORT 2018 85
6.2 Intra-African Trade Developments for Selected Countries
Zambia, Côte d’Ivoire and Swaziland all grew their share of intra-African trade, collectively accounting for almost 14 percent of intra-African trade in 2017, from around 13 percent in 2016. Zambia’s trade with Africa grew strongly in 2017, up 15.2 percent to US$6.7 billion. The growth in Zambia’s share of intra-African trade was mainly on account of its imports, which grew by around 16.5 percent that year to over US$5.1 billion, compared with exports to the continent which grew by only 11 percent to US$1.59 billion. Zambia’s main import trading partners on the continent are South Africa and the Democratic Republic of Congo, from which it imports inorganic chemicals, ores, slag and ash and copper. Mauritius is another key trading partner, from which Zambia imports mineral fuels, oil and derivative products as well as fertilizer. In the last quarter of 2017, experiencing a general uptick in economic activity, Zambia boosted its imports from Mauritius of mineral fuels, which are used as a raw material in a number of industries.
South Africa and the Democratic Republic of Congo still rank among the top export partners for Zambia. Zambia sells inorganic chemicals; pearls, precious stones and metals; heavy machinery and residues and waste from the food industry to South Africa. Some of its key exports to Democratic Republic of Congo are inorganic chemicals, sugars, soap, confectionery, beverages, soap and cereals. Elsewhere, the commitment by the leaders of both Zambia and Kenya to enhance bilateral ties and increase cooperation in a number of key sectors including tourism, transport, trade and investment should further bolster trade between the two countries and, more generally, overall intra-African trade.
Swaziland accounted for around 4 percent of total intra-African trade, moderately higher than the year prior. Remarkably, Swaziland recorded hefty two-way trade, although its imports slightly outpaced its exports. However, Swaziland’s intra-African trade was heavily concentrated with South Africa and Mozambique, exporting chemicals, textiles and prepared foodstuffs and importing mineral products and machinery, among other products.
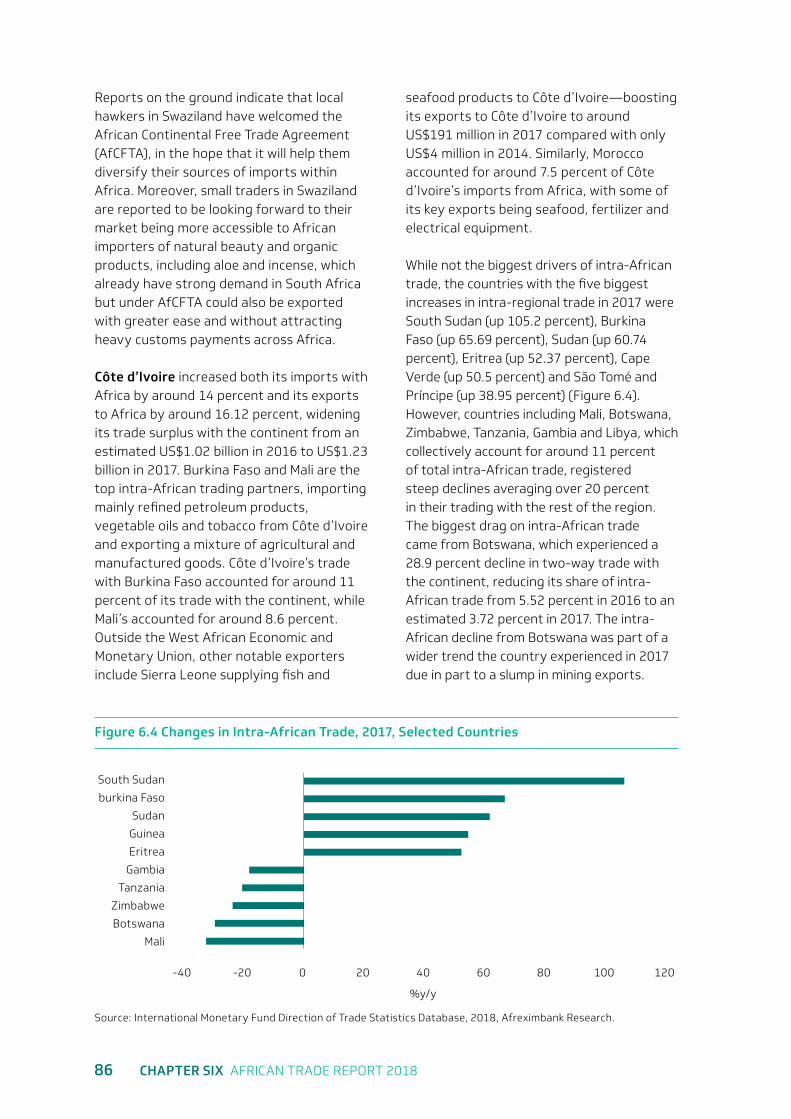
86 CHAPTER SIX AFRICAN TRADE REPORT 2018
Mineral f
uels
Reports on the ground indicate that local hawkers in Swaziland have welcomed the African Continental Free Trade Agreement (AfCFTA), in the hope that it will help them diversify their sources of imports within Africa. Moreover, small traders in Swaziland are reported to be looking forward to their market being more accessible to African importers of natural beauty and organic products, including aloe and incense, which already have strong demand in South Africa but under AfCFTA could also be exported with greater ease and without attracting heavy customs payments across Africa.
Côte d’Ivoire increased both its imports with Africa by around 14 percent and its exports to Africa by around 16.12 percent, widening its trade surplus with the continent from an estimated US$1.02 billion in 2016 to US$1.23 billion in 2017. Burkina Faso and Mali are the top intra-African trading partners, importing mainly refined petroleum products, vegetable oils and tobacco from Côte d’Ivoire and exporting a mixture of agricultural and manufactured goods. Côte d’Ivoire’s trade with Burkina Faso accounted for around 11 percent of its trade with the continent, while Mali’s accounted for around 8.6 percent. Outside the West African Economic and Monetary Union, other notable exporters include Sierra Leone supplying fish and
seafood products to Côte d’Ivoire—boosting its exports to Côte d’Ivoire to around US$191 million in 2017 compared with only US$4 million in 2014. Similarly, Morocco accounted for around 7.5 percent of Côte d’Ivoire’s imports from Africa, with some of its key exports being seafood, fertilizer and electrical equipment.
While not the biggest drivers of intra-African trade, the countries with the five biggest increases in intra-regional trade in 2017 were South Sudan (up 105.2 percent), Burkina Faso (up 65.69 percent), Sudan (up 60.74 percent), Eritrea (up 52.37 percent), Cape Verde (up 50.5 percent) and São Tomé and Príncipe (up 38.95 percent) (Figure 6.4). However, countries including Mali, Botswana, Zimbabwe, Tanzania, Gambia and Libya, which collectively account for around 11 percent of total intra-African trade, registered steep declines averaging over 20 percent in their trading with the rest of the region. The biggest drag on intra-African trade came from Botswana, which experienced a 28.9 percent decline in two-way trade with the continent, reducing its share of intra-African trade from 5.52 percent in 2016 to an estimated 3.72 percent in 2017. The intra-African decline from Botswana was part of a wider trend the country experienced in 2017 due in part to a slump in mining exports.
Figure 6.4 Changes in Intra-African Trade, 2017, Selected Countries
Source: International Monetary Fund Direction of Trade Statistics Database, 2018, Afreximbank Research.
South Sudan
Eritrea
Sudan
Tanzania
Botswana
burkina Faso
Gambia
Guinea
Zimbabwe
Mali
-40 0 40
%y/y
80-20 20 60 100 120
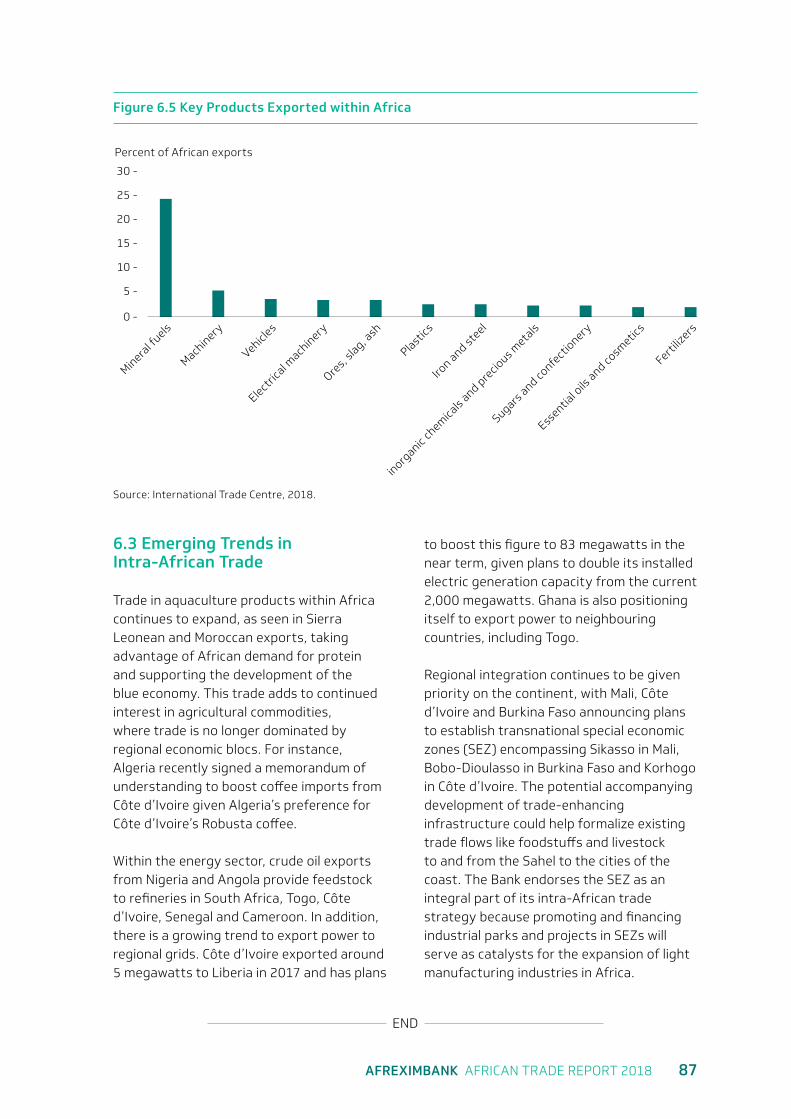
AFREXIMBANK AFRICAN TRADE REPORT 2018 87
6.3 Emerging Trends in Intra-African Trade
Trade in aquaculture products within Africa continues to expand, as seen in Sierra Leonean and Moroccan exports, taking advantage of African demand for protein and supporting the development of the blue economy. This trade adds to continued interest in agricultural commodities, where trade is no longer dominated by regional economic blocs. For instance, Algeria recently signed a memorandum of understanding to boost coffee imports from Côte d’Ivoire given Algeria’s preference for Côte d’Ivoire’s Robusta coffee.
Within the energy sector, crude oil exports from Nigeria and Angola provide feedstock to refineries in South Africa, Togo, Côte d’Ivoire, Senegal and Cameroon. In addition, there is a growing trend to export power to regional grids. Côte d’Ivoire exported around 5 megawatts to Liberia in 2017 and has plans
to boost this figure to 83 megawatts in the near term, given plans to double its installed electric generation capacity from the current 2,000 megawatts. Ghana is also positioning itself to export power to neighbouring countries, including Togo.
Regional integration continues to be given priority on the continent, with Mali, Côte d’Ivoire and Burkina Faso announcing plans to establish transnational special economic zones (SEZ) encompassing Sikasso in Mali, Bobo-Dioulasso in Burkina Faso and Korhogo in Côte d’Ivoire. The potential accompanying development of trade-enhancing infrastructure could help formalize existing trade flows like foodstuffs and livestock to and from the Sahel to the cities of the coast. The Bank endorses the SEZ as an integral part of its intra-African trade strategy because promoting and financing industrial parks and projects in SEZs will serve as catalysts for the expansion of light manufacturing industries in Africa.
Figure 6.5 Key Products Exported within Africa
Source: International Trade Centre, 2018.
END
20 -
25 -
30 -
Percent of African exports
15 -
10 -
5 -
0 -
Mineral f
uels
Machinery
Vehicles
Electric
al mach
inery
Ores,
slag, a
sh
Plastics
Iron and st
eel
inorganic
chem
icals
and pre
cious m
etals
Sugars and co
nfect
ionery
Essentia
l oils
and cosm
etics
Fertiliz
ers
7Chapter Seven
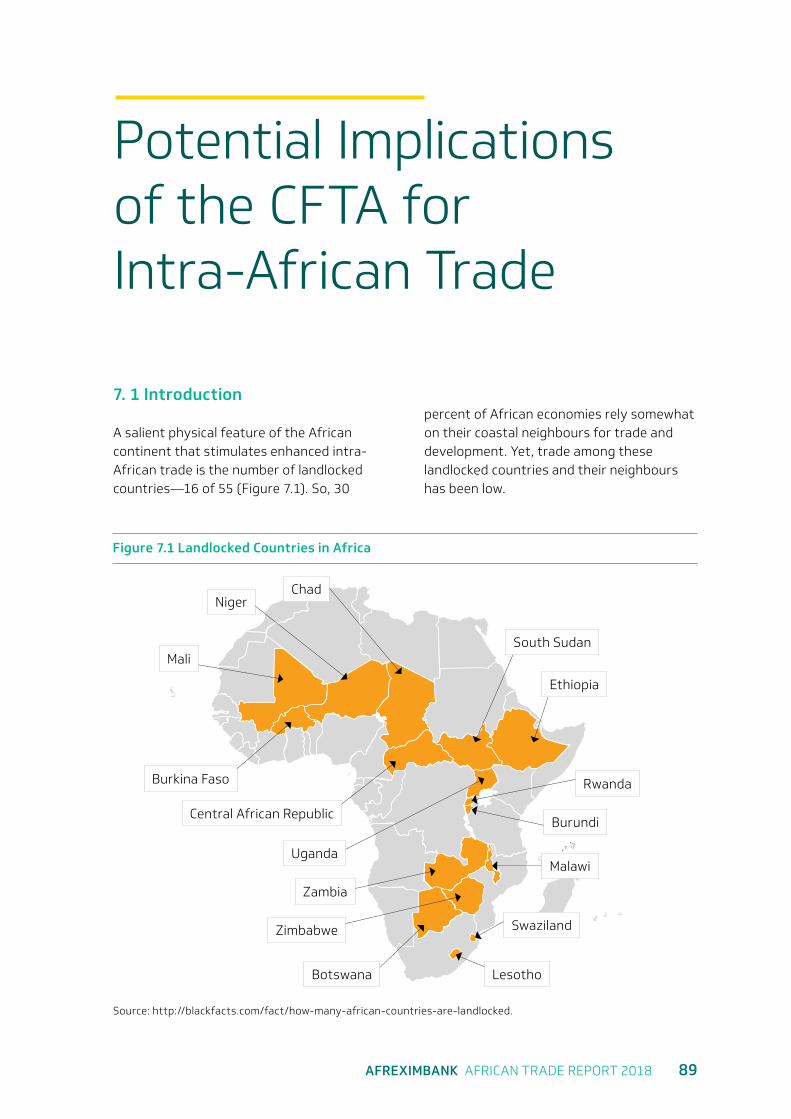
AFREXIMBANK AFRICAN TRADE REPORT 2018 89
Potential Implications of the CFTA for Intra-African Trade
7. 1 Introduction
A salient physical feature of the African continent that stimulates enhanced intra-African trade is the number of landlocked countries—16 of 55 (Figure 7.1). So, 30
percent of African economies rely somewhat on their coastal neighbours for trade and development. Yet, trade among these landlocked countries and their neighbours has been low.
Figure 7.1 Landlocked Countries in Africa
Source: http://blackfacts.com/fact/how-many-african-countries-are-landlocked.
ChadNiger
Mali
Burkina Faso
Central African Republic
South Sudan
Ethiopia
Malawi
Rwanda
Swaziland
Burundi
Lesotho
Uganda
Zambia
Zimbabwe
Botswana
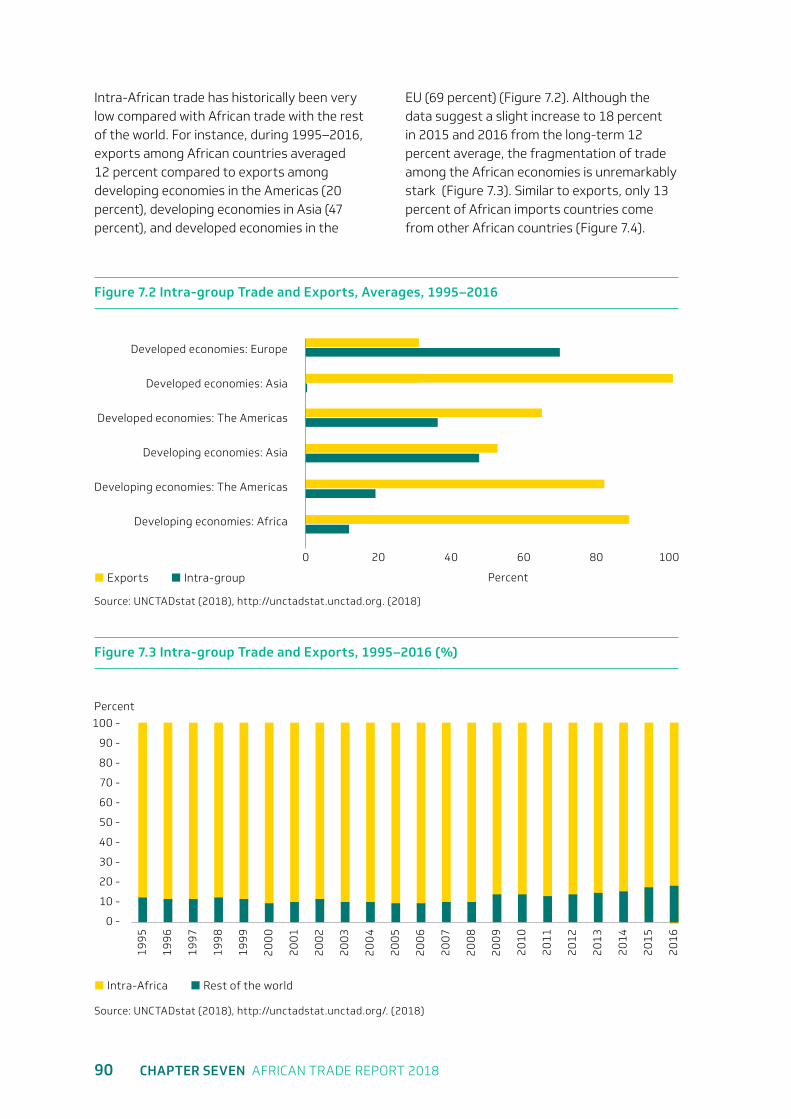
90 CHAPTER SEVEN AFRICAN TRADE REPORT 2018
Intra-African trade has historically been very low compared with African trade with the rest of the world. For instance, during 1995–2016, exports among African countries averaged 12 percent compared to exports among developing economies in the Americas (20 percent), developing economies in Asia (47 percent), and developed economies in the
EU (69 percent) (Figure 7.2). Although the data suggest a slight increase to 18 percent in 2015 and 2016 from the long-term 12 percent average, the fragmentation of trade among the African economies is unremarkably stark (Figure 7.3). Similar to exports, only 13 percent of African imports countries come from other African countries (Figure 7.4).
Figure 7.2 Intra-group Trade and Exports, Averages, 1995–2016
Figure 7.3 Intra-group Trade and Exports, 1995–2016 (%)
Source: UNCTADstat (2018), http://unctadstat.unctad.org/. (2018)
Source: UNCTADstat (2018), http://unctadstat.unctad.org. (2018)
Exports Intra-group
Percent100 -
60 -
80 -
40 -
10 -
90 -
50 -
1995
20
03
201
1
199
9
20
07
201
5
1997
20
05
201
3
20
01
20
09
199
6
20
04
201
2
20
00
20
08
201
6
199
8
20
06
201
4
20
02
201
0
20 -
70 -
30 -
0 -
Intra-Africa Rest of the world
Developed economies: Europe
Developing economies: Asia
Developed economies: Asia
Developing economies: The Americas
Developed economies: The Americas
Developing economies: Africa
0 20 40 60
Percent
80 100
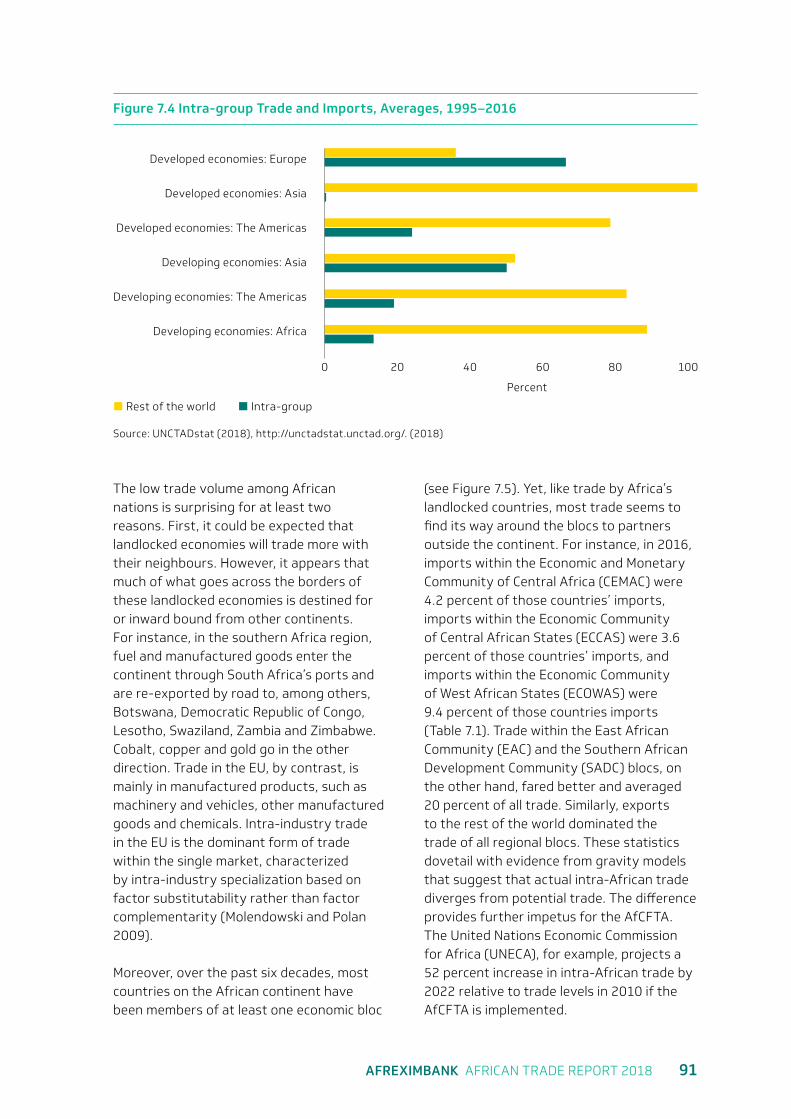
AFREXIMBANK AFRICAN TRADE REPORT 2018 91
The low trade volume among African nations is surprising for at least two reasons. First, it could be expected that landlocked economies will trade more with their neighbours. However, it appears that much of what goes across the borders of these landlocked economies is destined for or inward bound from other continents. For instance, in the southern Africa region, fuel and manufactured goods enter the continent through South Africa’s ports and are re-exported by road to, among others, Botswana, Democratic Republic of Congo, Lesotho, Swaziland, Zambia and Zimbabwe. Cobalt, copper and gold go in the other direction. Trade in the EU, by contrast, is mainly in manufactured products, such as machinery and vehicles, other manufactured goods and chemicals. Intra-industry trade in the EU is the dominant form of trade within the single market, characterized by intra-industry specialization based on factor substitutability rather than factor complementarity (Molendowski and Polan 2009).
Moreover, over the past six decades, most countries on the African continent have been members of at least one economic bloc
(see Figure 7.5). Yet, like trade by Africa’s landlocked countries, most trade seems to find its way around the blocs to partners outside the continent. For instance, in 2016, imports within the Economic and Monetary Community of Central Africa (CEMAC) were 4.2 percent of those countries’ imports, imports within the Economic Community of Central African States (ECCAS) were 3.6 percent of those countries’ imports, and imports within the Economic Community of West African States (ECOWAS) were 9.4 percent of those countries imports (Table 7.1). Trade within the East African Community (EAC) and the Southern African Development Community (SADC) blocs, on the other hand, fared better and averaged 20 percent of all trade. Similarly, exports to the rest of the world dominated the trade of all regional blocs. These statistics dovetail with evidence from gravity models that suggest that actual intra-African trade diverges from potential trade. The difference provides further impetus for the AfCFTA. The United Nations Economic Commission for Africa (UNECA), for example, projects a 52 percent increase in intra-African trade by 2022 relative to trade levels in 2010 if the AfCFTA is implemented.
Figure 7.4 Intra-group Trade and Imports, Averages, 1995–2016
Source: UNCTADstat (2018), http://unctadstat.unctad.org/. (2018)
Developed economies: Europe
Developing economies: Asia
Developed economies: Asia
Developing economies: The Americas
Developed economies: The Americas
Developing economies: Africa
0 20 40 60
Percent
80 100
Rest of the world Intra-group
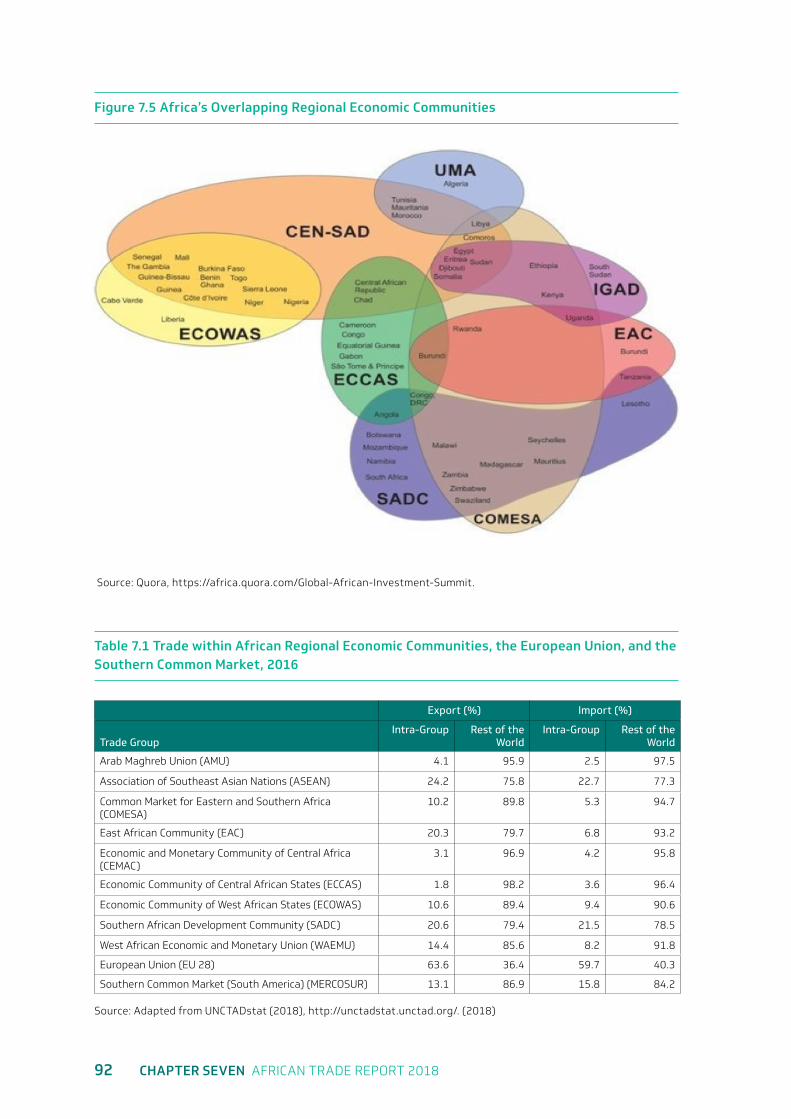
92 CHAPTER SEVEN AFRICAN TRADE REPORT 2018
Table 7.1 Trade within African Regional Economic Communities, the European Union, and the Southern Common Market, 2016
Export (%) Import (%)
Trade GroupIntra-Group Rest of the
WorldIntra-Group Rest of the
World
Arab Maghreb Union (AMU) 4.1 95.9 2.5 97.5
Association of Southeast Asian Nations (ASEAN) 24.2 75.8 22.7 77.3
Common Market for Eastern and Southern Africa (COMESA)
10.2 89.8 5.3 94.7
East African Community (EAC) 20.3 79.7 6.8 93.2
Economic and Monetary Community of Central Africa (CEMAC)
3.1 96.9 4.2 95.8
Economic Community of Central African States (ECCAS) 1.8 98.2 3.6 96.4
Economic Community of West African States (ECOWAS) 10.6 89.4 9.4 90.6
Southern African Development Community (SADC) 20.6 79.4 21.5 78.5
West African Economic and Monetary Union (WAEMU) 14.4 85.6 8.2 91.8
European Union (EU 28) 63.6 36.4 59.7 40.3
Southern Common Market (South America) (MERCOSUR) 13.1 86.9 15.8 84.2
Source: Adapted from UNCTADstat (2018), http://unctadstat.unctad.org/. (2018)
Figure 7.5 Africa’s Overlapping Regional Economic Communities
Source: Quora, https://africa.quora.com/Global-African-Investment-Summit.
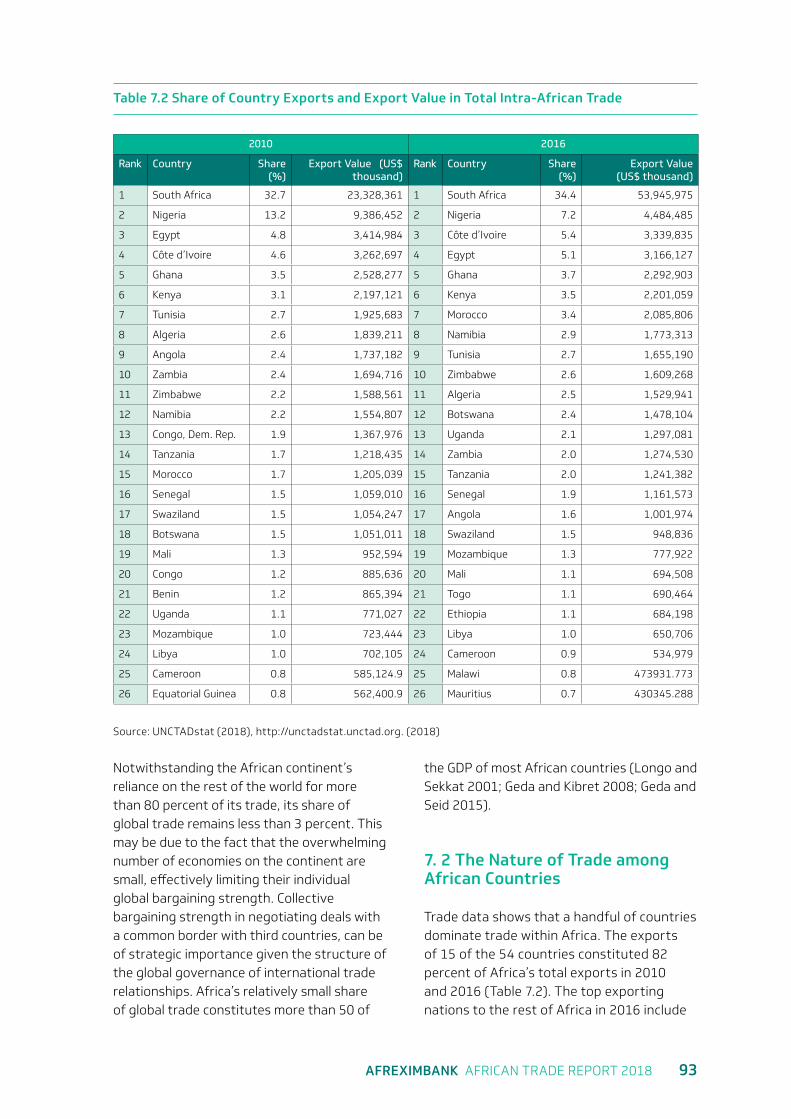
AFREXIMBANK AFRICAN TRADE REPORT 2018 93
Notwithstanding the African continent’s reliance on the rest of the world for more than 80 percent of its trade, its share of global trade remains less than 3 percent. This may be due to the fact that the overwhelming number of economies on the continent are small, effectively limiting their individual global bargaining strength. Collective bargaining strength in negotiating deals with a common border with third countries, can be of strategic importance given the structure of the global governance of international trade relationships. Africa’s relatively small share of global trade constitutes more than 50 of
the GDP of most African countries (Longo and Sekkat 2001; Geda and Kibret 2008; Geda and Seid 2015).
7. 2 The Nature of Trade among African Countries
Trade data shows that a handful of countries dominate trade within Africa. The exports of 15 of the 54 countries constituted 82 percent of Africa’s total exports in 2010 and 2016 (Table 7.2). The top exporting nations to the rest of Africa in 2016 include
Table 7.2 Share of Country Exports and Export Value in Total Intra-African Trade
2010 2016
Rank Country Share (%)
Export Value (US$ thousand)
Rank Country Share (%)
Export Value (US$ thousand)
1 South Africa 32.7 23,328,361 1 South Africa 34.4 53,945,975
2 Nigeria 13.2 9,386,452 2 Nigeria 7.2 4,484,485
3 Egypt 4.8 3,414,984 3 Côte d’Ivoire 5.4 3,339,835
4 Côte d’Ivoire 4.6 3,262,697 4 Egypt 5.1 3,166,127
5 Ghana 3.5 2,528,277 5 Ghana 3.7 2,292,903
6 Kenya 3.1 2,197,121 6 Kenya 3.5 2,201,059
7 Tunisia 2.7 1,925,683 7 Morocco 3.4 2,085,806
8 Algeria 2.6 1,839,211 8 Namibia 2.9 1,773,313
9 Angola 2.4 1,737,182 9 Tunisia 2.7 1,655,190
10 Zambia 2.4 1,694,716 10 Zimbabwe 2.6 1,609,268
11 Zimbabwe 2.2 1,588,561 11 Algeria 2.5 1,529,941
12 Namibia 2.2 1,554,807 12 Botswana 2.4 1,478,104
13 Congo, Dem. Rep. 1.9 1,367,976 13 Uganda 2.1 1,297,081
14 Tanzania 1.7 1,218,435 14 Zambia 2.0 1,274,530
15 Morocco 1.7 1,205,039 15 Tanzania 2.0 1,241,382
16 Senegal 1.5 1,059,010 16 Senegal 1.9 1,161,573
17 Swaziland 1.5 1,054,247 17 Angola 1.6 1,001,974
18 Botswana 1.5 1,051,011 18 Swaziland 1.5 948,836
19 Mali 1.3 952,594 19 Mozambique 1.3 777,922
20 Congo 1.2 885,636 20 Mali 1.1 694,508
21 Benin 1.2 865,394 21 Togo 1.1 690,464
22 Uganda 1.1 771,027 22 Ethiopia 1.1 684,198
23 Mozambique 1.0 723,444 23 Libya 1.0 650,706
24 Libya 1.0 702,105 24 Cameroon 0.9 534,979
25 Cameroon 0.8 585,124.9 25 Malawi 0.8 473931.773
26 Equatorial Guinea 0.8 562,400.9 26 Mauritius 0.7 430345.288
Source: UNCTADstat (2018), http://unctadstat.unctad.org. (2018)
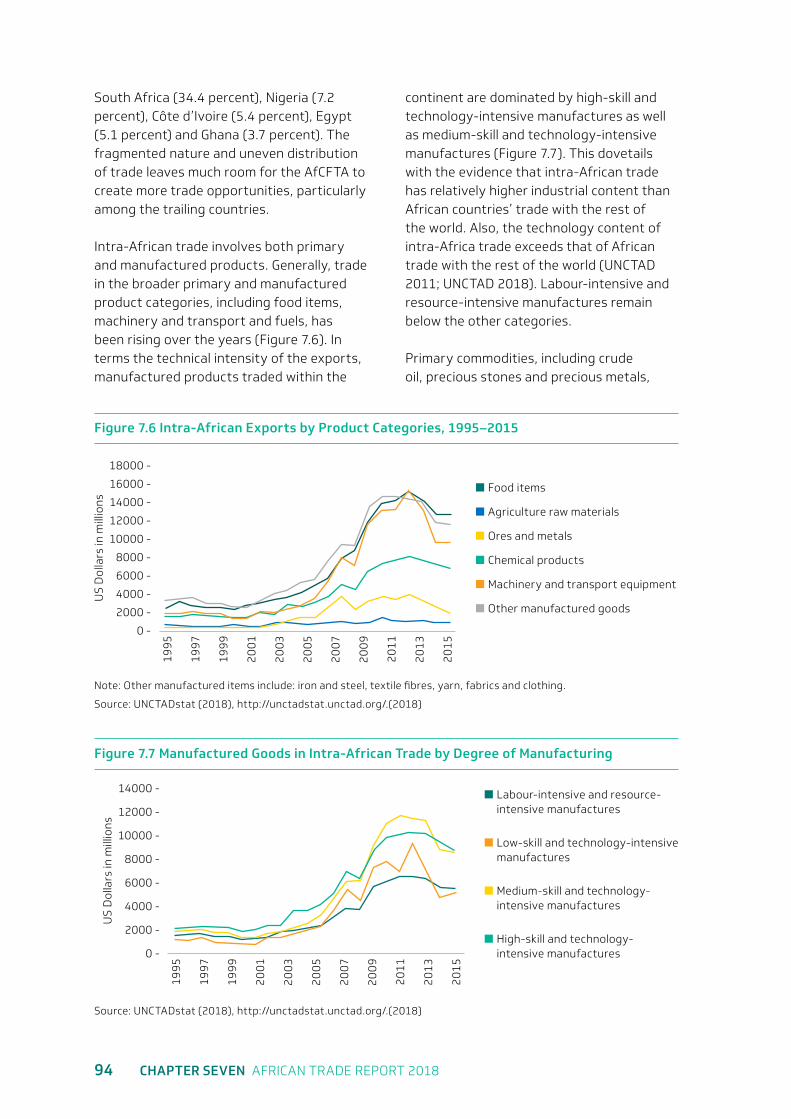
94 CHAPTER SEVEN AFRICAN TRADE REPORT 2018
South Africa (34.4 percent), Nigeria (7.2 percent), Côte d’Ivoire (5.4 percent), Egypt (5.1 percent) and Ghana (3.7 percent). The fragmented nature and uneven distribution of trade leaves much room for the AfCFTA to create more trade opportunities, particularly among the trailing countries.
Intra-African trade involves both primary and manufactured products. Generally, trade in the broader primary and manufactured product categories, including food items, machinery and transport and fuels, has been rising over the years (Figure 7.6). In terms the technical intensity of the exports, manufactured products traded within the
continent are dominated by high-skill and technology-intensive manufactures as well as medium-skill and technology-intensive manufactures (Figure 7.7). This dovetails with the evidence that intra-African trade has relatively higher industrial content than African countries’ trade with the rest of the world. Also, the technology content of intra-Africa trade exceeds that of African trade with the rest of the world (UNCTAD 2011; UNCTAD 2018). Labour-intensive and resource-intensive manufactures remain below the other categories.
Primary commodities, including crude oil, precious stones and precious metals,
Figure 7.7 Manufactured Goods in Intra-African Trade by Degree of Manufacturing
Figure 7.6 Intra-African Exports by Product Categories, 1995–2015
Note: Other manufactured items include: iron and steel, textile fibres, yarn, fabrics and clothing.
Source: UNCTADstat (2018), http://unctadstat.unctad.org/.(2018)
Source: UNCTADstat (2018), http://unctadstat.unctad.org/.(2018)
Food items
Agriculture raw materials
Ores and metals
Chemical products
Machinery and transport equipment
Other manufactured goods
18000 -
10000 -
2000 -
14000 -
6000 -
16000 -
8000 -
0 -
US
Dol
lars
in m
illio
ns
12000 -
4000 -
1995
20
03
199
9
20
07
201
3
1997
20
05
201
1
20
01
20
09
201
5
Labour-intensive and resource-intensive manufactures
Low-skill and technology-intensive manufactures
Medium-skill and technology-intensive manufactures
High-skill and technology-intensive manufactures
14000 -
10000 -
2000 -
6000 -
8000 -
0 -
US
Dol
lars
in m
illio
ns
12000 -
4000 -
1995
20
03
199
9
20
07
201
3
1997
20
05
201
1
20
01
20
09
201
5
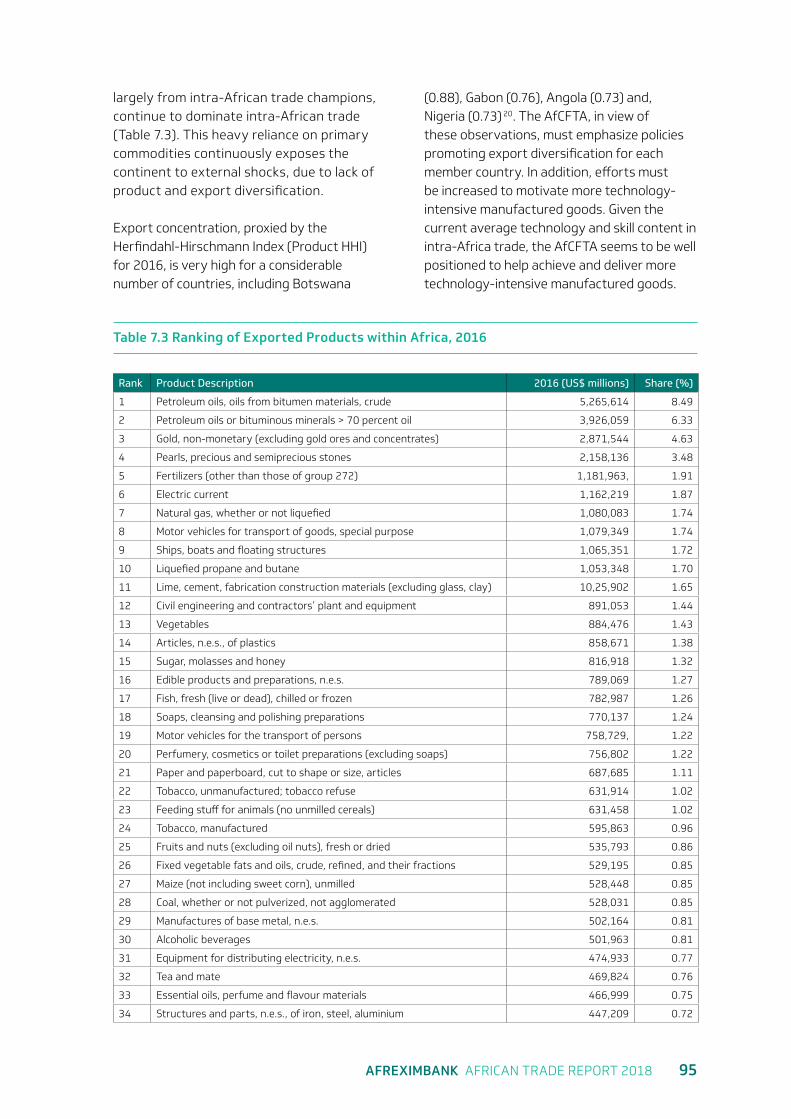
AFREXIMBANK AFRICAN TRADE REPORT 2018 95
largely from intra-African trade champions, continue to dominate intra-African trade (Table 7.3). This heavy reliance on primary commodities continuously exposes the continent to external shocks, due to lack of product and export diversification.
Export concentration, proxied by the Herfindahl-Hirschmann Index (Product HHI) for 2016, is very high for a considerable number of countries, including Botswana
(0.88), Gabon (0.76), Angola (0.73) and, Nigeria (0.73) 20. The AfCFTA, in view of these observations, must emphasize policies promoting export diversification for each member country. In addition, efforts must be increased to motivate more technology-intensive manufactured goods. Given the current average technology and skill content in intra-Africa trade, the AfCFTA seems to be well positioned to help achieve and deliver more technology-intensive manufactured goods.
Table 7.3 Ranking of Exported Products within Africa, 2016
Rank Product Description 2016 (US$ millions) Share (%)
1 Petroleum oils, oils from bitumen materials, crude 5,265,614 8.49
2 Petroleum oils or bituminous minerals > 70 percent oil 3,926,059 6.33
3 Gold, non-monetary (excluding gold ores and concentrates) 2,871,544 4.63
4 Pearls, precious and semiprecious stones 2,158,136 3.48
5 Fertilizers (other than those of group 272) 1,181,963, 1.91
6 Electric current 1,162,219 1.87
7 Natural gas, whether or not liquefied 1,080,083 1.74
8 Motor vehicles for transport of goods, special purpose 1,079,349 1.74
9 Ships, boats and floating structures 1,065,351 1.72
10 Liquefied propane and butane 1,053,348 1.70
11 Lime, cement, fabrication construction materials (excluding glass, clay) 10,25,902 1.65
12 Civil engineering and contractors’ plant and equipment 891,053 1.44
13 Vegetables 884,476 1.43
14 Articles, n.e.s., of plastics 858,671 1.38
15 Sugar, molasses and honey 816,918 1.32
16 Edible products and preparations, n.e.s. 789,069 1.27
17 Fish, fresh (live or dead), chilled or frozen 782,987 1.26
18 Soaps, cleansing and polishing preparations 770,137 1.24
19 Motor vehicles for the transport of persons 758,729, 1.22
20 Perfumery, cosmetics or toilet preparations (excluding soaps) 756,802 1.22
21 Paper and paperboard, cut to shape or size, articles 687,685 1.11
22 Tobacco, unmanufactured; tobacco refuse 631,914 1.02
23 Feeding stuff for animals (no unmilled cereals) 631,458 1.02
24 Tobacco, manufactured 595,863 0.96
25 Fruits and nuts (excluding oil nuts), fresh or dried 535,793 0.86
26 Fixed vegetable fats and oils, crude, refined, and their fractions 529,195 0.85
27 Maize (not including sweet corn), unmilled 528,448 0.85
28 Coal, whether or not pulverized, not agglomerated 528,031 0.85
29 Manufactures of base metal, n.e.s. 502,164 0.81
30 Alcoholic beverages 501,963 0.81
31 Equipment for distributing electricity, n.e.s. 474,933 0.77
32 Tea and mate 469,824 0.76
33 Essential oils, perfume and flavour materials 466,999 0.75
34 Structures and parts, n.e.s., of iron, steel, aluminium 447,209 0.72
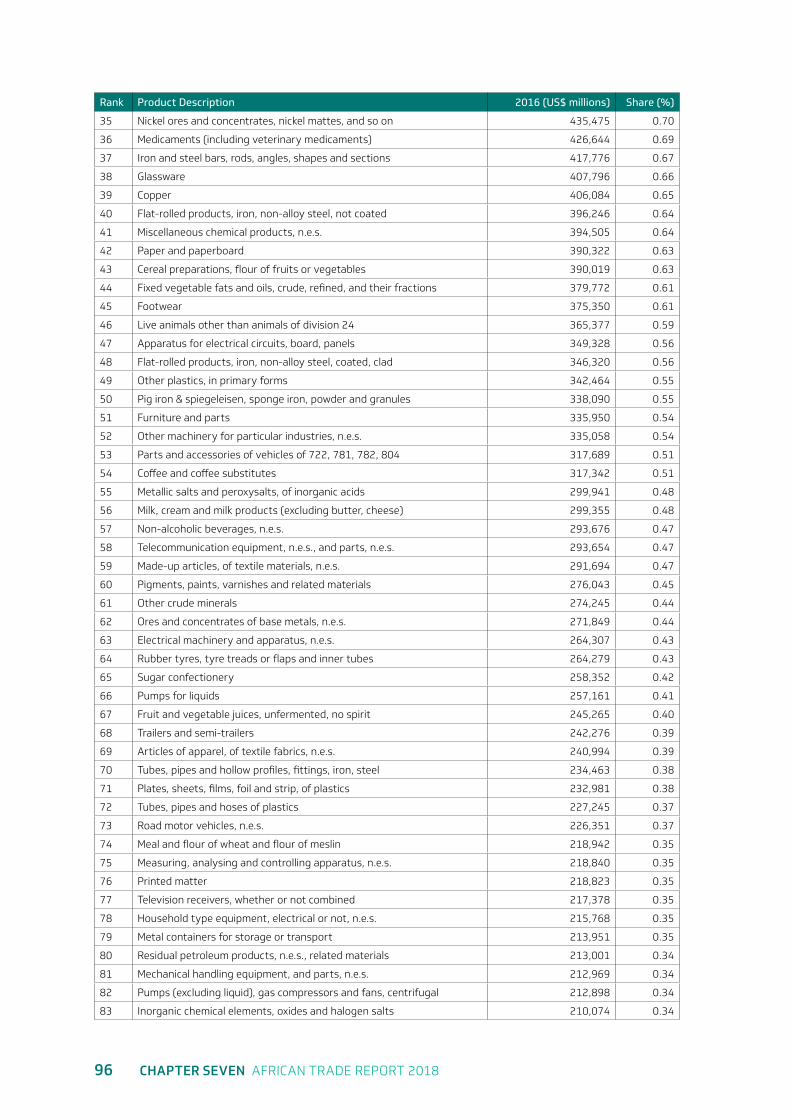
96 CHAPTER SEVEN AFRICAN TRADE REPORT 2018
Rank Product Description 2016 (US$ millions) Share (%)
35 Nickel ores and concentrates, nickel mattes, and so on 435,475 0.70
36 Medicaments (including veterinary medicaments) 426,644 0.69
37 Iron and steel bars, rods, angles, shapes and sections 417,776 0.67
38 Glassware 407,796 0.66
39 Copper 406,084 0.65
40 Flat-rolled products, iron, non-alloy steel, not coated 396,246 0.64
41 Miscellaneous chemical products, n.e.s. 394,505 0.64
42 Paper and paperboard 390,322 0.63
43 Cereal preparations, flour of fruits or vegetables 390,019 0.63
44 Fixed vegetable fats and oils, crude, refined, and their fractions 379,772 0.61
45 Footwear 375,350 0.61
46 Live animals other than animals of division 24 365,377 0.59
47 Apparatus for electrical circuits, board, panels 349,328 0.56
48 Flat-rolled products, iron, non-alloy steel, coated, clad 346,320 0.56
49 Other plastics, in primary forms 342,464 0.55
50 Pig iron & spiegeleisen, sponge iron, powder and granules 338,090 0.55
51 Furniture and parts 335,950 0.54
52 Other machinery for particular industries, n.e.s. 335,058 0.54
53 Parts and accessories of vehicles of 722, 781, 782, 804 317,689 0.51
54 Coffee and coffee substitutes 317,342 0.51
55 Metallic salts and peroxysalts, of inorganic acids 299,941 0.48
56 Milk, cream and milk products (excluding butter, cheese) 299,355 0.48
57 Non-alcoholic beverages, n.e.s. 293,676 0.47
58 Telecommunication equipment, n.e.s., and parts, n.e.s. 293,654 0.47
59 Made-up articles, of textile materials, n.e.s. 291,694 0.47
60 Pigments, paints, varnishes and related materials 276,043 0.45
61 Other crude minerals 274,245 0.44
62 Ores and concentrates of base metals, n.e.s. 271,849 0.44
63 Electrical machinery and apparatus, n.e.s. 264,307 0.43
64 Rubber tyres, tyre treads or flaps and inner tubes 264,279 0.43
65 Sugar confectionery 258,352 0.42
66 Pumps for liquids 257,161 0.41
67 Fruit and vegetable juices, unfermented, no spirit 245,265 0.40
68 Trailers and semi-trailers 242,276 0.39
69 Articles of apparel, of textile fabrics, n.e.s. 240,994 0.39
70 Tubes, pipes and hollow profiles, fittings, iron, steel 234,463 0.38
71 Plates, sheets, films, foil and strip, of plastics 232,981 0.38
72 Tubes, pipes and hoses of plastics 227,245 0.37
73 Road motor vehicles, n.e.s. 226,351 0.37
74 Meal and flour of wheat and flour of meslin 218,942 0.35
75 Measuring, analysing and controlling apparatus, n.e.s. 218,840 0.35
76 Printed matter 218,823 0.35
77 Television receivers, whether or not combined 217,378 0.35
78 Household type equipment, electrical or not, n.e.s. 215,768 0.35
79 Metal containers for storage or transport 213,951 0.35
80 Residual petroleum products, n.e.s., related materials 213,001 0.34
81 Mechanical handling equipment, and parts, n.e.s. 212,969 0.34
82 Pumps (excluding liquid), gas compressors and fans, centrifugal 212,898 0.34
83 Inorganic chemical elements, oxides and halogen salts 210,074 0.34
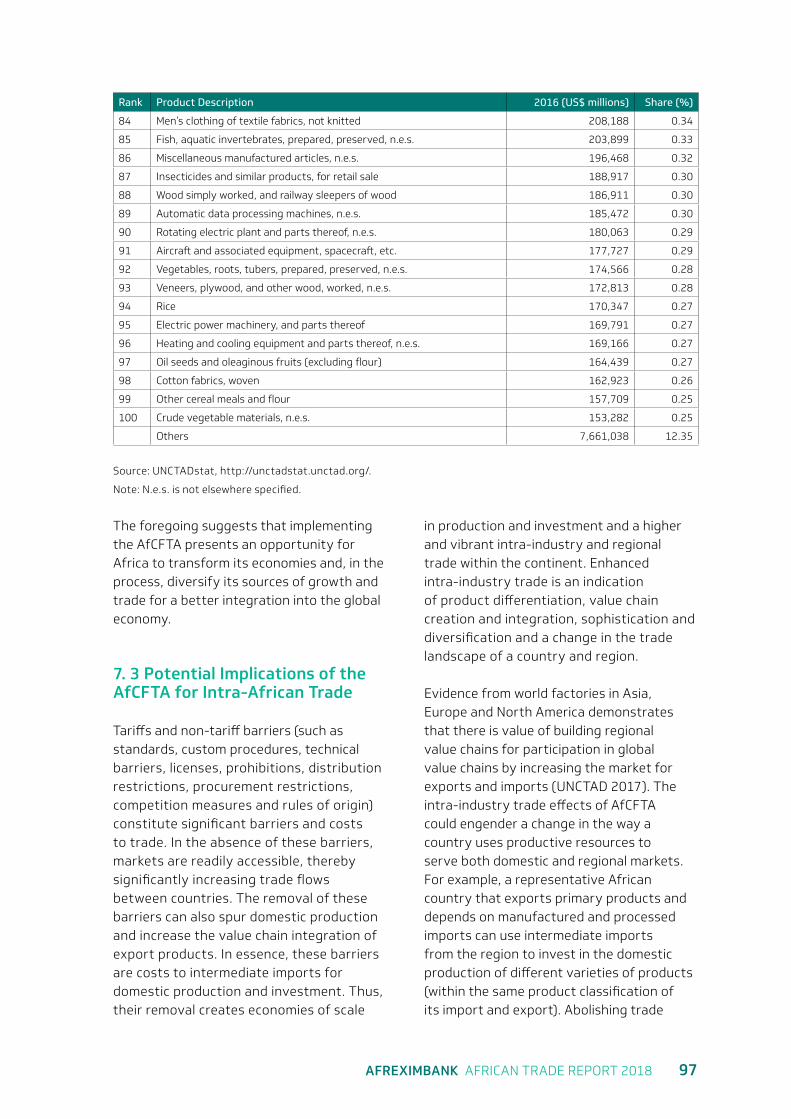
AFREXIMBANK AFRICAN TRADE REPORT 2018 97
Rank Product Description 2016 (US$ millions) Share (%)
84 Men’s clothing of textile fabrics, not knitted 208,188 0.34
85 Fish, aquatic invertebrates, prepared, preserved, n.e.s. 203,899 0.33
86 Miscellaneous manufactured articles, n.e.s. 196,468 0.32
87 Insecticides and similar products, for retail sale 188,917 0.30
88 Wood simply worked, and railway sleepers of wood 186,911 0.30
89 Automatic data processing machines, n.e.s. 185,472 0.30
90 Rotating electric plant and parts thereof, n.e.s. 180,063 0.29
91 Aircraft and associated equipment, spacecraft, etc. 177,727 0.29
92 Vegetables, roots, tubers, prepared, preserved, n.e.s. 174,566 0.28
93 Veneers, plywood, and other wood, worked, n.e.s. 172,813 0.28
94 Rice 170,347 0.27
95 Electric power machinery, and parts thereof 169,791 0.27
96 Heating and cooling equipment and parts thereof, n.e.s. 169,166 0.27
97 Oil seeds and oleaginous fruits (excluding flour) 164,439 0.27
98 Cotton fabrics, woven 162,923 0.26
99 Other cereal meals and flour 157,709 0.25
100 Crude vegetable materials, n.e.s. 153,282 0.25
Others 7,661,038 12.35
Source: UNCTADstat, http://unctadstat.unctad.org/.
Note: N.e.s. is not elsewhere specified.
The foregoing suggests that implementing the AfCFTA presents an opportunity for Africa to transform its economies and, in the process, diversify its sources of growth and trade for a better integration into the global economy.
7. 3 Potential Implications of the AfCFTA for Intra-African Trade
Tariffs and non-tariff barriers (such as standards, custom procedures, technical barriers, licenses, prohibitions, distribution restrictions, procurement restrictions, competition measures and rules of origin) constitute significant barriers and costs to trade. In the absence of these barriers, markets are readily accessible, thereby significantly increasing trade flows between countries. The removal of these barriers can also spur domestic production and increase the value chain integration of export products. In essence, these barriers are costs to intermediate imports for domestic production and investment. Thus, their removal creates economies of scale
in production and investment and a higher and vibrant intra-industry and regional trade within the continent. Enhanced intra-industry trade is an indication of product differentiation, value chain creation and integration, sophistication and diversification and a change in the trade landscape of a country and region.
Evidence from world factories in Asia, Europe and North America demonstrates that there is value of building regional value chains for participation in global value chains by increasing the market for exports and imports (UNCTAD 2017). The intra-industry trade effects of AfCFTA could engender a change in the way a country uses productive resources to serve both domestic and regional markets. For example, a representative African country that exports primary products and depends on manufactured and processed imports can use intermediate imports from the region to invest in the domestic production of different varieties of products (within the same product classification of its import and export). Abolishing trade
98 CHAPTER SEVEN AFRICAN TRADE REPORT 2018
barriers, therefore, not only benefits firms, households and government, but it also generates opportunities for countries to access intermediate imports for investment to boost productivity in related sectors for domestic consumption and exports. It also offers the opportunity to increase regional value chains by changing the regional trade structure, producing new and enhanced products and deepening the forward and backward linkages. The removal of barriers can also be envisaged as a technological improvement that enhances competitiveness, productivity and efficiency to increase the free flow of trade between two countries or regions and intensify intra-industry trade and regional value chains (Hertel et al. 2001; Fox et al. 2003; and Fugazza and Maur 2008).
There could be losers under AfCFTA , at least in the short term when some countries are unable to access the markets of member countries or experience reduced intra-African exports as a result of an increasingly competitive environment. However, intra-African trade remains very low and therefore offering great prospects for expansion and growth. At the same time, export growth losses contemplated could, be countered by the growth of domestic production through the economies of scale from the lower cost of intermediate imports, consumer surplus from the consumption of quality low- cost imported products and net welfare gains.
Overall, the potential intra-African trade effect of the AfCFTA is very promising and possible to gauge. A CGE simulation21 (Table 7.4) confirms that the AfCFTA will yield substantial benefits to the region in terms of African trade and cross-border investment. All regions experience considerable positive increases in intra-African exports and most countries experience an increase in exports to other African countries. The increase in intra-regional trade is higher for regions like Southern African Customs Union (SACU) region, which already has institutional arrangements advanced towards a more
integrated free trade area. The existence of a long-established harmonized tariff and steps in advancing a free trade area within SACU imply that the region has fewer tariff complexities and can take advantage of policies that further access into the rest of Africa.
Unsurprisingly, the Southern African Customs Union (SACU) region has the highest gain in terms of intra-African export flow, US$18.4 billion (inclusive of intra-SACU trade), with about 46 percent of it (US$8.4 billion) into the Southern African region, 19 percent (US$3.5 billion) into East Africa, 14.8 percent (US$2.7 billion) into West Africa and 11.8 percent (US$2.1 billion) into Central Africa. Gains in intra-SACU trade amounts to US$876 million. West Africa has the second highest gain in intra-African exports, US$12.99 billion, of which 65 percent (US$8.46 billion) is made up of intra–West African trade; 16 percent (US$2.1 billion), exports into the SACU region; and 8 percent (US$1.06 billion), exports into Central African region. North Africa comes third in increased intra-African trade with US$10.4 billion of exports into the continent, of which 43 percent (US$4.49 billion) is intra–North African trade and 25.7 percent (US$2.69 billion) is increased exports into West Africa. The total export increase from Southern African to the rest of Africa amounts to US$7.06 billion, with 45 percent (US$3.19 billion) being exports into the SACU region and approximately 19.9 percent (US$1.4 billion) flow into each of Southern Africa and Central Africa. East Africa records an export increase of US$3.8 billion in exports into Africa, of which 45 percent (US$1.7 billion) is intra–East African trade and 32.5 percent (US$1.25 billion) is exports into Central Africa. Finally, the Central African region has US$2.2 billion more in exports into Africa, with 57 percent (US$1.27 billion) flowing to Southern Africa and 25 percent (US$567 million) to West Africa.
These intra-African export figures show considerable growth of trade and increased
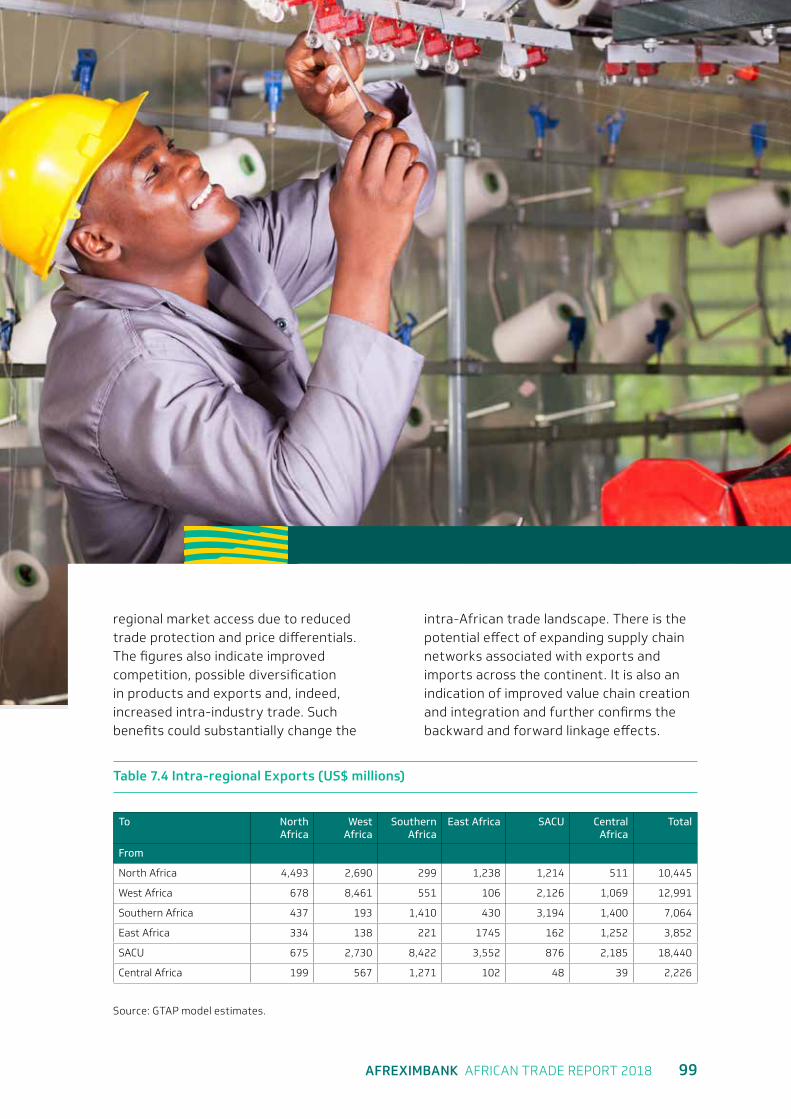
AFREXIMBANK AFRICAN TRADE REPORT 2018 99
regional market access due to reduced trade protection and price differentials. The figures also indicate improved competition, possible diversification in products and exports and, indeed, increased intra-industry trade. Such benefits could substantially change the
intra-African trade landscape. There is the potential effect of expanding supply chain networks associated with exports and imports across the continent. It is also an indication of improved value chain creation and integration and further confirms the backward and forward linkage effects.
Table 7.4 Intra-regional Exports (US$ millions)
To North Africa
West Africa
Southern Africa
East Africa SACU Central Africa
Total
From
North Africa 4,493 2,690 299 1,238 1,214 511 10,445
West Africa 678 8,461 551 106 2,126 1,069 12,991
Southern Africa 437 193 1,410 430 3,194 1,400 7,064
East Africa 334 138 221 1745 162 1,252 3,852
SACU 675 2,730 8,422 3,552 876 2,185 18,440
Central Africa 199 567 1,271 102 48 39 2,226
Source: GTAP model estimates.
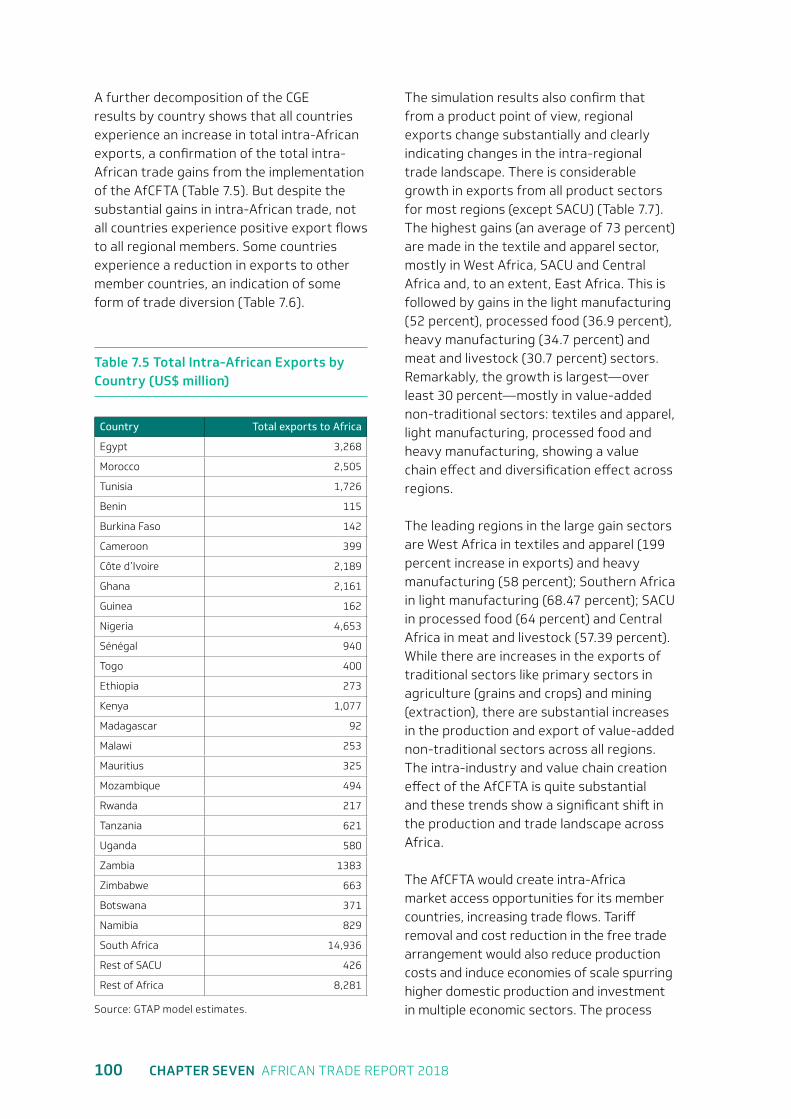
100 CHAPTER SEVEN AFRICAN TRADE REPORT 2018
A further decomposition of the CGE results by country shows that all countries experience an increase in total intra-African exports, a confirmation of the total intra-African trade gains from the implementation of the AfCFTA (Table 7.5). But despite the substantial gains in intra-African trade, not all countries experience positive export flows to all regional members. Some countries experience a reduction in exports to other member countries, an indication of some form of trade diversion (Table 7.6).
Table 7.5 Total Intra-African Exports by Country (US$ million)
Country Total exports to Africa
Egypt 3,268
Morocco 2,505
Tunisia 1,726
Benin 115
Burkina Faso 142
Cameroon 399
Côte d’Ivoire 2,189
Ghana 2,161
Guinea 162
Nigeria 4,653
Sénégal 940
Togo 400
Ethiopia 273
Kenya 1,077
Madagascar 92
Malawi 253
Mauritius 325
Mozambique 494
Rwanda 217
Tanzania 621
Uganda 580
Zambia 1383
Zimbabwe 663
Botswana 371
Namibia 829
South Africa 14,936
Rest of SACU 426
Rest of Africa 8,281
Source: GTAP model estimates.
The simulation results also confirm that from a product point of view, regional exports change substantially and clearly indicating changes in the intra-regional trade landscape. There is considerable growth in exports from all product sectors for most regions (except SACU) (Table 7.7). The highest gains (an average of 73 percent) are made in the textile and apparel sector, mostly in West Africa, SACU and Central Africa and, to an extent, East Africa. This is followed by gains in the light manufacturing (52 percent), processed food (36.9 percent), heavy manufacturing (34.7 percent) and meat and livestock (30.7 percent) sectors. Remarkably, the growth is largest—over least 30 percent—mostly in value-added non-traditional sectors: textiles and apparel, light manufacturing, processed food and heavy manufacturing, showing a value chain effect and diversification effect across regions.
The leading regions in the large gain sectors are West Africa in textiles and apparel (199 percent increase in exports) and heavy manufacturing (58 percent); Southern Africa in light manufacturing (68.47 percent); SACU in processed food (64 percent) and Central Africa in meat and livestock (57.39 percent). While there are increases in the exports of traditional sectors like primary sectors in agriculture (grains and crops) and mining (extraction), there are substantial increases in the production and export of value-added non-traditional sectors across all regions. The intra-industry and value chain creation effect of the AfCFTA is quite substantial and these trends show a significant shift in the production and trade landscape across Africa.
The AfCFTA would create intra-Africa market access opportunities for its member countries, increasing trade flows. Tariff removal and cost reduction in the free trade arrangement would also reduce production costs and induce economies of scale spurring higher domestic production and investment in multiple economic sectors. The process
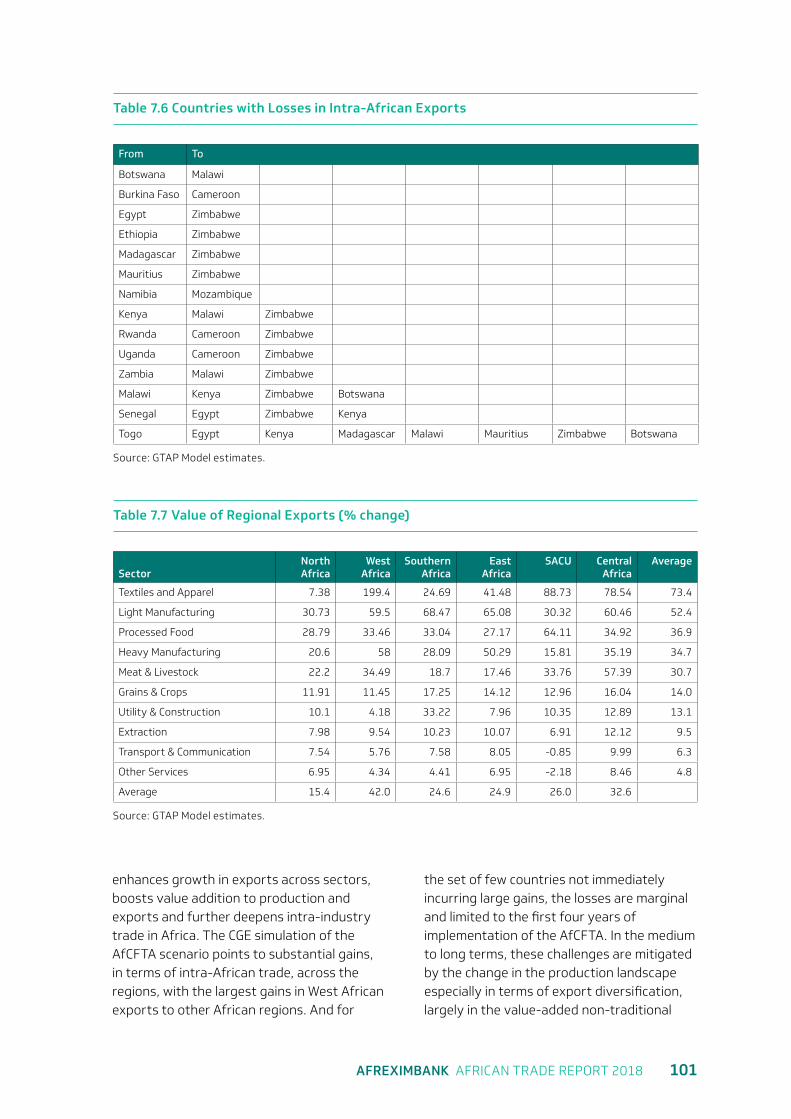
AFREXIMBANK AFRICAN TRADE REPORT 2018 101
Table 7.6 Countries with Losses in Intra-African Exports
From To
Botswana Malawi
Burkina Faso Cameroon
Egypt Zimbabwe
Ethiopia Zimbabwe
Madagascar Zimbabwe
Mauritius Zimbabwe
Namibia Mozambique
Kenya Malawi Zimbabwe
Rwanda Cameroon Zimbabwe
Uganda Cameroon Zimbabwe
Zambia Malawi Zimbabwe
Malawi Kenya Zimbabwe Botswana
Senegal Egypt Zimbabwe Kenya
Togo Egypt Kenya Madagascar Malawi Mauritius Zimbabwe Botswana
Source: GTAP Model estimates.
enhances growth in exports across sectors, boosts value addition to production and exports and further deepens intra-industry trade in Africa. The CGE simulation of the AfCFTA scenario points to substantial gains, in terms of intra-African trade, across the regions, with the largest gains in West African exports to other African regions. And for
the set of few countries not immediately incurring large gains, the losses are marginal and limited to the first four years of implementation of the AfCFTA. In the medium to long terms, these challenges are mitigated by the change in the production landscape especially in terms of export diversification, largely in the value-added non-traditional
Table 7.7 Value of Regional Exports (% change)
SectorNorth Africa
West Africa
Southern Africa
East Africa
SACU Central Africa
Average
Textiles and Apparel 7.38 199.4 24.69 41.48 88.73 78.54 73.4
Light Manufacturing 30.73 59.5 68.47 65.08 30.32 60.46 52.4
Processed Food 28.79 33.46 33.04 27.17 64.11 34.92 36.9
Heavy Manufacturing 20.6 58 28.09 50.29 15.81 35.19 34.7
Meat & Livestock 22.2 34.49 18.7 17.46 33.76 57.39 30.7
Grains & Crops 11.91 11.45 17.25 14.12 12.96 16.04 14.0
Utility & Construction 10.1 4.18 33.22 7.96 10.35 12.89 13.1
Extraction 7.98 9.54 10.23 10.07 6.91 12.12 9.5
Transport & Communication 7.54 5.76 7.58 8.05 -0.85 9.99 6.3
Other Services 6.95 4.34 4.41 6.95 -2.18 8.46 4.8
Average 15.4 42.0 24.6 24.9 26.0 32.6
Source: GTAP Model estimates.
102 CHAPTER SEVEN AFRICAN TRADE REPORT 2018
sectors like textiles and apparel, light manufacturing, processed food and heavy manufacturing—an indication of value chain and diversification effects across regions.
The potential benefits of the AfCFTA , most notably in terms of intra-African trade and value chain effects, can be realized even more easily if policy measures are taken to ensure that pre-emptive shock diffusers and subsequent shock absorbers for net intra-African trade losers are effectively implemented. These are necessary to allow all countries to gain from the AfCFTA. Pre-emptive shock diffusers could consist of a gradual removal of some nontariff barriers (such as technical and distribution barriers) for selected countries net losers to catch up. The subsequent shock absorbers will be in the form of grants or technical assistance (funded by development finance institutions) for such activities as restructuring disbanded institutions and
retraining personnel to be absorbed into allied institutions.
Technical capacity for all. Increased intra-African trade and regional integration have been subjects of academic and policy discussion, and the proposed AfCFTA could accelerate regional integration, it is likely to carry short-run adjustment costs for most countries—restructuring customs, tax revenue, standards structures and organizations and excise and allied trade tax administration units that lose functionality with the removal of tariff and nontariff measures. Success depends on the capacity of countries to fully take advantage of the intra-African trade benefits, so they need policies and technical help to help restructure their institutions. Revenue adjustment strategies—such as creating more effective and efficient tax collection and widening the tax net—will also be needed for countries that lose
AFREXIMBANK AFRICAN TRADE REPORT 2018 103
major revenue from the removal of tariffs. These technical challenges taken up by development finance institutions and the African Union.
Intra-African market readiness for all is another risk mitigating measure. Intra-African trade also comes with another cost—the sunk cost of entering new markets.
Meeting this requires an understanding and structuring of innovative financing instruments (such as factoring and reverse factoring) for domestic firms to be able to finance their entry and active participation. There are also market-related issues such as training and implementing harmonized sanitary and phytosanitary standards (SPS) across member countries.
END
104 CHAPTER EIGHT AFRICAN TRADE REPORT 2018
8Chapter Eight

AFREXIMBANK AFRICAN TRADE REPORT 2018 105
Prospects
Global growth is projected to strengthen to 3.9 percent in 2018, up from 3.7 percent in 2017, on the back of improving market sentiment, accommodative policies and strong global demand.
In developed economies, growth is also projected to accelerate—to 2.5 percent in 2018, from 2.2 percent in 2017, supported largely by accommodative policies, including the spillover effects of expansionary fiscal policy in the United States and the continued easing of lending conditions by the European Central Bank, which is expected to cushion the anticipated gradual rise in interest rates, while ensuring that gradual normalisation of monetary policy in the United States and United Kingdom does not increase financial market volatility.
Economic growth in the United States is projected to gather momentum, accelerating to 2.9 percent in 2018, up from 2.3 percent in 2017. The growth acceleration is expected to be driven by private investment led by corporate tax breaks; increasing public investment in infrastructure; growing consumption spending supported by strong consumer confidence; and robust employment growth.
In the eurozone, the recovery that began in 2017 is projected to continue with a slight increase in growth to 2.4 percent in 2018, from 2.3 percent in 2017, as still accommodative monetary policy, fiscal support and recovery in the labour market
are expected to generate stronger-than-expected demand through dynamic private consumption across the bloc.
Growth in developing economies is projected to accelerate slightly to 4.9 percent in 2018, from 4.8 percent in 2017, on the back of strong economic performance in developing Asia led by India and China—despite the ongoing process of rebalancing away from investment and industry towards the promotion of consumption and services—and by a pick-up in activity in Brazil and Russia.
In line with the synchronised broad-based global growth expansion, growth in the volume of merchandise trade is projected to remain strong at 4.4 percent in 2018, down slightly from 4.7 percent achieved in 2017. The continuing expansion of global trade is supported by stronger global economic growth, driven by recovery in most developed countries, especially by the strong pick-up in the United States and the expansion (though modest) in the eurozone, particularly in France. Also expected to support global trade performance in 2018 is the projected growth acceleration in developing economies, especially in the largest developing with some consolidating the gains made in the immediate aftermath of the recession.
African economies are projected to accelerate to 4.1 percent in the 2018, up from 3.7 percent in 2017. This performance is
106 CHAPTER EIGHT AFRICAN TRADE REPORT 2018
END
expected to be driven by continuing recovery in developed economies and by improving global demand with positive repercussions on commodity prices and Africa’s merchandise trade. The main factors expected to accelerate economic growth on the continent are continued growth acceleration in a number of large economies, most notably Egypt and Kenya, the strengthening of major oil-producing economies—especially Nigeria, Angola and Libya—and the (modest) growth in South Africa. Other growth-enhancing factors include continued implementation of reforms aimed at increasing consumer confidence and improving the business climate. Along with growing public spending, especially on infrastructure, these are expected to maintain the growth momentum of African economies.
Intra-African merchandise trade is projected to improve, supported by continuing efforts by African governments, both national and regional, to move away from their dependence on primary commodities and towards diversification through industrialisation and value addition. Financing infrastructure development will support cross-border trade. Enhancing processing capacity will accelerate the diversification of exports. And most important, ensuring a successful and speedy implementation of the AfCFTA after ratification will enable the continent to fully achieve the trade and economic integration so fundamental in helping the region contain adverse shocks and the long-term deterioration in its terms of trade.
While the transition towards the AfCFTA will mitigate risks in the medium and long term, trade and growth forecasts are fraught with downside risks in the short term. In particular, uncertainty about the arrangements surrounding the United Kingdom’s exit from the European Union, prompted by isolationist and rising beggar-thy-neighbour policies, constitutes a major downside risk to trade and growth prospects for the region, and globally. Already, this risk has been reflected in the imposition of tariffs outside the WTO rules-based system. Tariff escalation could materialise trade wars with adverse effects on trade and growth, weakening global demand.
At the same time, while the strengthening trade ties between Africa and China have enabled the former to diversify the direction of its trade, under expanding South-South trade, it has also exposed the region to growth deceleration in China—Africa’s single largest trading partner. Faster deceleration in growth, in a context of rebalancing, could undermine commodity markets and export revenues, especially in commodity-dependent economies. At the same time, the ongoing process of normalisation of monetary policy in the United States, reflected in the gradual tightening of interest rates could exacerbate capital outflows from emerging market economies with adverse implications on investment and growth. Other major downside risks are geopolitical and relate to political tensions, especially in parts of the Middle East, Asia and Africa.
AFREXIMBANK AFRICAN TRADE REPORT 2018 107
Endnotes1 The Tripartite Free Trade Area (TFTA) initiative, which covers about half the membership of
the African Union, is an agreement among the EAC, COMESA and SADC.
2 See https://au.int/sites/default/files/pages/3657-file-agenda2063_popular_version_en.pdf.
3 The Chapter largely draws on the African Export-Import Bank (2018) commissioned thematic research which provides full details of the analysis and conclusions reached.
4 The index varies between 1 (when exports are highlight concentrated on a few products) and 0 (when exports are equally distributed among several products).
5 The ESI ranges between 0 and 00; it takes a value of 0 if country i and j’s export patterns are very dissimilar and a value of 100 if their export patterns are very similar. The ESI can signal the level of competition among economies—countries with more similar export profiles are likely to be competitors in world trade. In addition, a low ESI could indicate greater potential for inter-industry trade with a regional trading arrangement, while a high ESI could indicate limited potential (Fundira 2013).
6 The full report details other conditions regarding the fiscal revenue losses and compensatory mechanism in the short-run and the long-run scenario for the win-win case for all countries.
7 See Alesina and Spolaore (1997, 2003), Spolaore (2006, 2014), and Spolaore (2015).
8 There are various measures of heterogeneity including ethnic and linguistic fractionalisation and polarisation, measures of genetic and linguistic distance and measures of historical and cultural diversity.
9 See Alesina et al. (2003); Alesina and La Ferrara (2005); Montalvo and Reynal-Querol (2005); Estebanet al. (2012); Desmet et al. (2012); Spolaore and Wacziarg (2012); and Arbatli et al (2013).
10 See Spolaore and Wacziarg (2012).
11 More details are provided in the full report.
12 https://www.iol.co.za/business-report/economy/african-infrastructure-is-lagging-behind-12786047.
13 Further details are provided in the full report.
14 See https://www.aljazeera.com/news/2018/03/african-continental-free-trade-area-afcfta-180317191954318.html.
108 AFREXIMBANK AFRICAN TRADE REPORT 2018
15 See Spolaore and Wacziarg (2012).
16 Australia, Brunei, Canada, Chile, Japan, Malaysia, Mexico, New Zealand, Peru, Singapore and Vietnam.
17 Brunei, Cambodia, Indonesia, Laos, Malaysia, Myanmar, the Philippines, Singapore, Thailand and Vietnam.
18 Australia, China, India, Japan, the Republic of Korea and New Zealand.
19 Benin, Burkina Faso, Cameroon, Central African Republic, Chad, Comoros, Côte d’Ivoire, Equatorial Guinea, Gabon, Guinea-Bissau, Mali, Niger, Republic of Congo, Senegal and Togo.
20 The index varies between 1 (when exports are highlight concentrated on a few products) and 0 (when exports are equally distributed among several products).
21 A computable general equilibrium (CGE) analysis using a Global Trade Analysis Project (GTAP) model was carried out to ascertain the impact of the AfCFTA on intra-Africa trade shows some positive intra-African trade effects. The policy scenario involved elimination of tariffs on all trade plus additional reduction in non-tariff barriers (NTBs) using the iceberg cost approach (see Fox et al. 2003; Fugazza and Maur 2008; Hertel et al. 2001, who applied the iceberg). The analysis used GTAP database version 9A, which contains 140 regions, 57 sectors and eight factors. Two aggregations were applied. In the first aggregation the 140 regions were aggregated to 32 regions (including 22 African countries with two regional aggregates of other African countries) and the 57 sectors to 22 sectors. The second aggregation had 11 regions (with Africa aggregated to six regions) and 10 commodities. Details are available on request.
AFREXIMBANK AFRICAN TRADE REPORT 2018 109
ReferencesAlesina, A., D. Arnaud, W. Easterly, S. Kurlat and R. Wacziarg. 2003. “Fractionalization”. Journal of Economic Growth 8 (2): 155–94.
Alesina, A., and E. La Ferrara. 2005. “Ethnic Diversity and Economic Performance”. Journal of Economic Literature 43 (3): 762–800.
Alesina, A., and E. Spolaore. 1997. “On the Number and Size of Nations”. Quarterly Journal of Economics 112 (4): 1027–56.
———. 2003. The Size of Nations. Cambridge, MA: MIT Press.
Arbatli, E., Q. Ashraf, and O. Galor. 2013. “The Nature of Civil Conflict”. Department of Economics Working Paper 2013-15, Brown University, Providence, RI.
AU (African Union). 2014. Action Plan for Boosting Intra-African Trade and Fast-Tracking the Establishment of a Pan-African Free Trade Area (FTA). Addis Ababa. https://au.int/en/newsevents/27214/action-plan-boosting-intra-african-trade-and-fast-tracking-establishment-pan.
———. 2018. Agreement Establishing the African Continental Free Trade Area. Addis Ababa. https://au.int/sites/default/files/treaties/34248-treaty-consolidated_text_on_cfta_-_en.pdf.
———. n.d. “CFTA: Continental Free Trade Area.” Addis Ababa. https://au.int/en/ti/cfta/about.
Bougheas, S., P. Demetriades and E. Morgenroth. 1999. “Infrastructure, Transport Costs and Trade”. Journal of International Economics 47: 169–89.
Briguglio, L., G. Cordina, N. Farrugia and S. Vella. 2009. “Economic Vulnerability and Resilience: Concepts and Measurements”. Oxford Development Studies 37 (3): 229–247.
Burn, J.-F., C. Carrère, P. Guillaumont and J. De Melo. 2005. “Has Distance Died? Evidence from a Panel Gravity Model”. World Bank Economic Review 19 (1): 99–120.
Desmet, K., I. Ortuño-Ortín and R. Wacziarg. 2012. “The Political Economy of Linguistic Cleavages”. Journal of Development Economics 97 (2): 322–38.
Esteban, J., L. Mayoral, and D. Ray. 2012. “Ethnicity and Conflict: An Empirical Study”. American Economic Review 102 (4): 1310–42.
Finger, J.M., and M.E. Kreinin. 1979. “A Measure of ‘Export Similarity” and Its Possible Uses”. The Economic Journal 89: 905–12.
110 AFREXIMBANK AFRICAN TRADE REPORT 2018
Fox, A., J.F. Francois and P. Londono-Kent. 2003. “Measuring Border Costs and Their Impact on Trade Flows: The United States–Mexican Trucking Case”. Unpublished manuscript.
Fugazza, M., and J.C. Maur. 2008. “Non-Tariff Barriers in CGE Models: How Useful for Policy?” Journal of Policy Modeling 30 (3): 475–90.
Fundira, T. 2013. An analysis of Africa’s export performance and export similarity for select countries within the Tripartite Free Trade Area market. Stellenbosch, South Africa: Tralac.
Geda, A., and E.H. Seid. 2015. “The Potential for Internal Trade and Regional Integration in Africa”. Journal of African Trade 2: 19–50.
Geda, A., and H. Kibret. 2008. “Regional Integration in Africa: A Review of Problems and Prospects with a Case Study of COMESA”. Journal of African Economics 17 (3): 357–94.
GTAP (Global Trade Analysis Project). 2018. Data Bases. West Lafayette, IN. https://www.gtap.agecon.purdue.edu/databases/v9/default.asp.
Hertel, T., D. Hummels, M. Ivanic and R. Keeny. 2007. “How Confident Can We Be of CGE-based Assessments of Free Trade Agreements?” Economic Modelling 24 (4): 611–35.
Hertel, T., T. Walmsley and K. Itakura. 2001. “Dynamic Effect of the ‘New Age’ Free Trade Agreement between Japan And Singapore”. Journal of Economic Integration 16 (4): 446–84.
Iwanow, T. and C. Kirkpatrick. 2009. “Trade Facilitation and Manufactured Exports: Is Africa Different?” World Development 37 (6): 1039–50.
Limão, N., and A.J. Venables. 2001. “Infrastructure, Geographical Disadvantage, Transport Costs and Trade”. World Bank Economic Review 15: 451–79.
Longo, R., and K. Sekkat. 2001. “Obstacles to Expanding Intra-Africa Trade”. Technical Paper 69, Organisation for Economic Co-operation and Development, Paris
Molendowski, E., and W. Polan. 2009. “Intra-Industry Trade and Revealed Comparative Advantage: Empirical Analysis of New Members States’ Economic Competitiveness (UE-8) on a Single Market between 2000 and 2007”. In Challenges for Analysis of the Economy, the Businesses, and Social Progress, edited by Péter Kovács, Katalin Szép and Tamás Katona, 133–56. Szeged, Hungary: Universitas Szeged Press.
Montalvo, J. G., and M. Reynal-Querol. 2005. “Ethnic Polarization, Potential Conflict and Civil Wars”. American Economic Review 95 (3): 796–816.
Portugal-Perez, A., and J.S. Wilson. 2012. “Export Performance and Trade Facilitation Reform: Hard and Soft Infrastructure”. World Development 40 (7): 1295–1307.
Saygili M., R. Peters and C. Knebel. 2017. “African Continental Free Trade Area: Challenges and Opportunities of Tariff Reductions”. Research Paper No. 15, United Nations Conference on Trade and Development, Geneva.
Spolaore, E. 2006. “National Borders and the Size of Nations”. In Oxford Handbook of Political Economy, edited by Barry R. Weingast and Donald A. Wittman, 778–98. Oxford, UK: Oxford University Press.
———. ed. 2014. Culture and Economic Growth. Cheltenham. UK: Edgar Edwin.
———. 2015. “The Political Economy of European Integration”. Working Paper 5247, CESifo Group, Munich.
Spolaore, E., and R. Wacziarg. 2012. “War and Relatedness”. Review of Economics and Statistics 98 (5): 925–39.
UNCTAD (United Nations Conference on Trade and Development). 2011. Economic Development in Africa Report 2011: Fostering Industrial Development in Africa in the New Global Environment. Geneva.
———. 2017. “The Role of Trade Policies in Building Regional Value Chains: Some Preliminary Evidence from Africa”. Research Paper 11, UNCTAD, Geneva.
——— . 2018. African Continental Free Trade Area: Challenges and opportunities of tariffs reductions. Geneva.
Vanheukelom, J., B. Byiers, S. Bilal and S. Woolfrey. 2016. “The political economy of regional
integration in Africa: What drives and constrains regional organisations?” Synthesis Report. Maastricht, Netherlands: European Centre for Development Policy Management.
World Bank. 2010. Global Economic Prospects 2010. Washington, DC.


HEADQUARTERS72B El Maahad El
Eshteraky Street, Roxy.Heliopolis, Cairo 11341, EgyptT +(202) 24564100/1/2/3/4
ABUJA BRANCHNo. 2 Gnassingbe
Eyadema Street AsokoroGarki, Abuja, NigeriaT +(234) 9 460 3160
HARARE BRANCHEastgate Building, 3rd Floor
Gold Bridge (North Wing)2nd Street, Harare,
ZimbabweT +(263) 24 2 700 904/[email protected]
ABIDJAN BRANCH3ème Etage, Immeuble CRRAE-UMOA, Angle Boulevard Botreau Roussel –
Rue Privée CRRAE-UMOA Abidjan, Côte d’IvoireT +(225) 2030 7300
AFREXIMBANK.COM
African Trade Report2018