Embed Size (px)
Citation preview
AFRL-RQ-WP-TP-2014-0130
STUDY OF A MULTI-PHASE HYBRID HEAT EXCHANGER-REACTOR (HEX REACTOR): PART I – EXPERIMENTAL CHARACTERIZATION (POSTPRINT) Nicholas Niedbalski and Debjyoti Banerjee Texas A&M University Douglas Johnson University of Dayton Research Institute Soumya S. Patnaik Mechanical and Thermal Systems Branch Power and Control Division NOVEMBER 2013
Approved for public release; distribution unlimited.
See additional restrictions described on inside pages
STINFO COPY
AIR FORCE RESEARCH LABORATORY AEROSPACE SYSTEMS DIRECTORATE
WRIGHT-PATTERSON AIR FORCE BASE, OH 45433-7542 AIR FORCE MATERIEL COMMAND
UNITED STATES AIR FORCE

NOTICE AND SIGNATURE PAGE
Using Government drawings, specifications, or other data included in this document for any purpose other than Government procurement does not in any way obligate the U.S. Government. The fact that the Government formulated or supplied the drawings, specifications, or other data does not license the holder or any other person or corporation; or convey any rights or permission to manufacture, use, or sell any patented invention that may relate to them. This report was cleared for public release by the USAF 88th Air Base Wing (88 ABW) Public Affairs Office (PAO) and is available to the general public, including foreign nationals. Copies may be obtained from the Defense Technical Information Center (DTIC) (http://www.dtic.mil). AFRL-RQ-WP-TP-2014-0130 HAS BEEN REVIEWED AND IS APPROVED FOR PUBLICATION IN ACCORDANCE WITH ASSIGNED DISTRIBUTION STATEMENT. *//Signature// //Signature// TRAVIS E MICHALAK THOMAS L. REITZ, Technical Advisor Program Manager Mechanical and Thermal Systems Branch Mechanical and Thermal Systems Branch Power and Control Division Power and Control Division Aerospace Systems Directorate //Signature// JOHN G. NAIRUS, Chief Engineer Power and Control Division Aerospace Systems Directorate This report is published in the interest of scientific and technical information exchange, and its publication does not constitute the Government’s approval or disapproval of its ideas or findings. *Disseminated copies will show “//Signature//” stamped or typed above the signature blocks.
REPORT DOCUMENTATION PAGE Form Approved OMB No. 0704-0188
The public reporting burden for this collection of information is estimated to average 1 hour per response, including the time for reviewing instructions, searching existing data sources, searching existing data sources, gathering and maintaining the data needed, and completing and reviewing the collection of information. Send comments regarding this burden estimate or any other aspect of this collection of information, including suggestions for reducing this burden, to Department of Defense, Washington Headquarters Services, Directorate for Information Operations and Reports (0704-0188), 1215 Jefferson Davis Highway, Suite 1204, Arlington, VA 22202-4302. Respondents should be aware that notwithstanding any other provision of law, no person shall be subject to any penalty for failing to comply with a collection of information if it does not display a currently valid OMB control number. PLEASE DO NOT RETURN YOUR FORM TO THE ABOVE ADDRESS.
1. REPORT DATE (DD-MM-YY) 2. REPORT TYPE 3. DATES COVERED (From - To) November 2013 Journal Article Postprint 01 October 2011 – 28 May 2013
4. TITLE AND SUBTITLE STUDY OF A MULTI-PHASE HYBRID HEAT EXCHANGER-REACTOR (HEX REACTOR): PART I – EXPERIMENTAL CHARACTERIZATION (POSTPRINT)
5a. CONTRACT NUMBER In-house
5b. GRANT NUMBER
5c. PROGRAM ELEMENT NUMBER 62203F
6. AUTHOR(S)
Nicholas Niedbalski and Debjyoti Banerjee (Texas A&M University) Douglas Johnson (University of Dayton Research Institute) Soumya S. Patnaik (AFRL/RQQM)
5d. PROJECT NUMBER 3145
5e. TASK NUMBER N/A
5f. WORK UNIT NUMBER
Q0LA 7. PERFORMING ORGANIZATION NAME(S) AND ADDRESS(ES) 8. PERFORMING ORGANIZATION Texas A&M University Department of Mechanical Engineering 3123 TAMU College Station, TX 77843 ------------------------------------------------- University of Dayton Research Institute 300 College Park Dayton, OH 45469
Mechanical and Thermal Systems Branch (AFRL/RQQM) Power and Control Division Air Force Research Laboratory Aerospace Systems Directorate Wright-Patterson Air Force Base, OH 45433-7542 Air Force Materiel Command, United States Air Force
REPORT NUMBER AFRL-RQ-WP-TP-2014-0130
9. SPONSORING/MONITORING AGENCY NAME(S) AND ADDRESS(ES) 10. SPONSORING/MONITORING Air Force Research Laboratory Aerospace Systems Directorate Wright-Patterson Air Force Base, OH 45433-7542 Air Force Materiel Command United States Air Force
AGENCY ACRONYM(S) AFRL/RQQM
11. SPONSORING/MONITORING AGENCY REPORT NUMBER(S)
AFRL-RQ-WP-TP-2014-0130
12. DISTRIBUTION/AVAILABILITY STATEMENT Approved for public release; distribution unlimited.
13. SUPPLEMENTARY NOTES PA Case Number: 88ABW-2013-2497; Clearance Date: 28 May 2013. Report published in International Journal of Heat and Mass Transfer 70 (2014). The U.S. Government is joint author of the work and has the right to use, modify, reproduce, release, perform, display, or disclose the work.
14. ABSTRACT This study focuses on gaining fundamental insights into the sparsely explored area of reacting multiphase flows in a compact heat exchanger. Chevron plate heat exchangers have been demonstrated to possess superior thermal performance, scalability, and mixing capability compared to more traditional shell-in-tube heat exchangers or stirred tank batch reactors. This study explores the hydrodynamic behavior of gas-evolving reacting flows in chevron plate heat exchangers. Experimental characterization of a plate heat exchanger/chemical reactor (in multi-phase flow configuration) utilizing high-speed video and axial pressure measurements was conducted. Existing correlations that were developed using air–water flow in PHEs predicted with acceptable accuracy the total pressure drop in the HEX reactor.
15. SUBJECT TERMS multi-phase flow, HEX Reactor, reacting flow, flow visualization, plate heat exchanger
16. SECURITY CLASSIFICATION OF: 17. LIMITATION OF ABSTRACT:
SAR
18. NUMBER OF PAGES
14
19a. NAME OF RESPONSIBLE PERSON (Monitor) a. REPORT Unclassified
b. ABSTRACT Unclassified
c. THIS PAGE Unclassified
Travis E. Michalak 19b. TELEPHONE NUMBER (Include Area Code)
N/A Standard Form 298 (Rev. 8-98)
Prescribed by ANSI Std. Z39-18
International Journal of Heat and Mass Transfer 70 (2014) 1078–1085
Contents lists available at ScienceDirect
International Journal of Heat and Mass Transfer
journal homepage: www.elsevier .com/locate / i jhmt
Study of a multi-phase hybrid heat exchanger-reactor (HEX reactor):Part I – Experimental characterization
0017-9310/$ - see front matter � 2013 Elsevier Ltd. All rights reserved.http://dx.doi.org/10.1016/j.ijheatmasstransfer.2013.10.066
⇑ Corresponding author at: A236, Building 18, 1950 5th St., Wright-Patterson AFB,OH 45433, United States. Tel.: +1 (425) 358 1295.
E-mail address: [email protected] (N. Niedbalski).
Approved for public release; distribution unlimited.
Nicholas Niedbalski a,b,⇑, Douglas Johnson c, Soumya S. Patnaik a, Debjyoti Banerjee b
a Air Force Research Laboratory, Aerospace Systems Directorate, Power and Controls Division, Mechanical and Thermal Systems Branch, 1950 5th St., WPAFB, OH 45433, United Statesb Texas A&M University, Department of Mechanical Engineering, 3123 TAMU, College Station, TX 77843, United Statesc University of Dayton Research Institute, 300 College Park, Dayton, OH 45469, United States
a r t i c l e i n f o a b s t r a c t
Article history:Available online 16 November 2013
Keywords:Multi-phase flowHEX reactorReacting flowFlow visualizationPlate heat exchanger
This study focuses on gaining fundamental insights into the sparsely explored area of reacting multiphaseflows in a compact heat exchanger. Chevron plate heat exchangers have been demonstrated to possesssuperior thermal performance, scalability, and mixing capability compared to more traditional shell-in-tube heat exchangers or stirred tank batch reactors. This study explores the hydrodynamic behaviorof gas-evolving reacting flows in chevron plate heat exchangers. Experimental characterization of a plateheat exchanger/chemical reactor (in multi-phase flow configuration) utilizing high-speed video and axialpressure measurements was conducted. Existing correlations that were developed using air–water flowin PHEs predicted with acceptable accuracy the total pressure drop in the HEX reactor.
� 2013 Elsevier Ltd. All rights reserved.
1. Introduction
The concept of using a compact heat exchanger as a continuousflow chemical reactor, termed as heat exchanger (HEX) reactors, iswell documented in the chemical engineering literature as dis-cussed by Anxionnaz et al. [1]. The authors cite high volumetricheat transfer capacities ranging from 1400 to 4000 kW/m3. Thisrepresents 2–3 orders-of-magnitude gain in the value of surface-area-to-volume-ratio when compared to that of batch reactors.Among the many classes of compact heat exchangers examinedby these authors, the gasketed plate heat exchangers (PHEs) offerboth high thermal performance and ease of maintenance. PHEscan be easily disassembled for inspection and maintenance (in con-trast, shell-and-tube heat exchangers require very elaborate main-tenance procedures due to the complexity of assembly/disassembly [1]). Also, the performance rating of a gasketed PHEcan be scaled-up simply by assembling additional plates. Theadvantages of vigorous mixing, high surface area and low volumemake the PHE-based HEX reactor an ideal platform for continuousdelivery/removal of heat into/from a reacting multi-phase flow [2].
Although the continuous flow HEX reactor represents a promis-ing approach to enhancing heat transfer in applications involvinghigh energy density gas-evolving reactions, the hydrodynamics ofcombined multiphase flow and chemical reaction within a PHEare not well understood. Therefore, the motivation of this study
is to gain insights into the nature of reacting multi-phase flowsin a PHE serving as a HEX reactor. The objective of this paper isto establish an experimental basis for the hydrodynamics of gas-evolving reacting flows using a model chemical reaction, and to as-sess the accuracy and suitability of existing correlations for voidfraction and pressure drop calculations in a chevron plate heat ex-changer. The hydrodynamic correlations evaluated in this paperare used in Part II, which focuses on developing numerical models.
2. Experimental methods and materials
2.1. Chevron plate heat exchangers
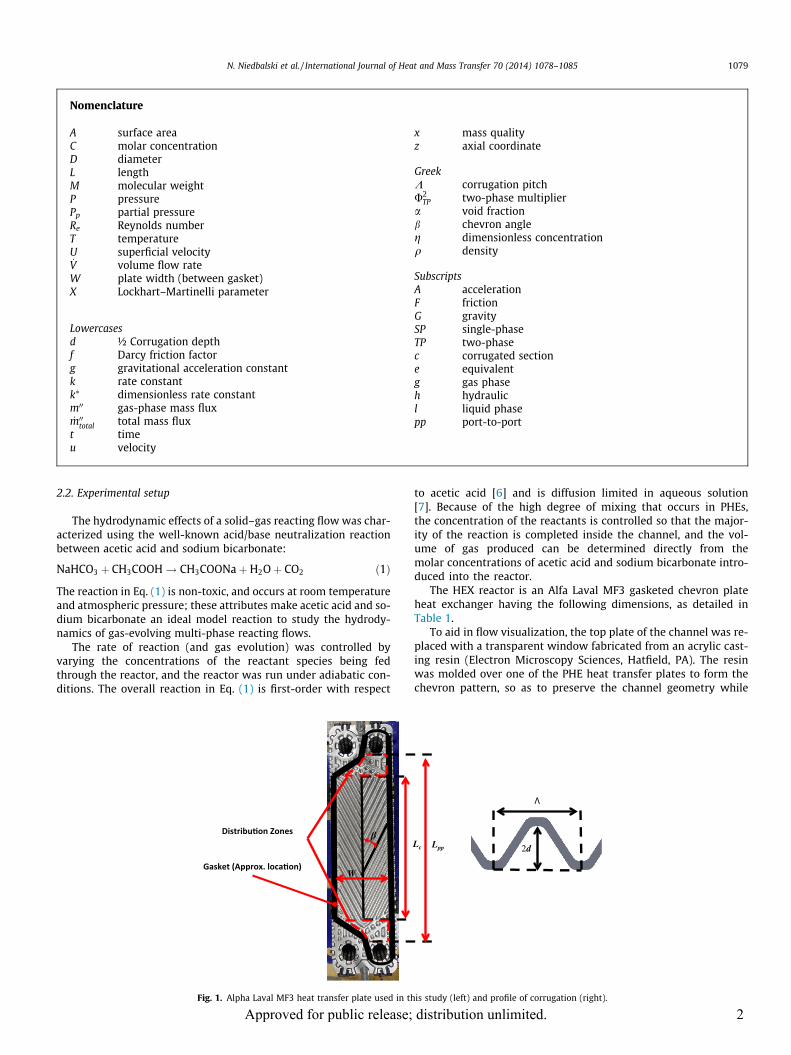
Chevron PHEs consist of a stack of thin heat transfer plates withcorrugated surfaces in the shape of a chevron (Fig. 1). These platesare separated by compliant gaskets, which, when the entire stack ismechanically compressed, seal the space in between a pair of mat-ing plates to form channels. The gasket also serves to direct thecold/hot streams to their respective ports, as can be seen inFig. 1. The chevron patterns of the upper and lower plates thatform an individual channel face opposite directions to form a tor-tuous network of crisscrossing passageways. Fluid streams direc-ted along the upper and lower corrugations interact to produceunique secondary flow patterns that give rise to enhanced convec-tive heat transfer [3-5]. Additional details of the experimental setup and measurements are provided in an earlier study [2].
1
Nomenclature
A surface areaC molar concentrationD diameterL lengthM molecular weightP pressurePp partial pressureRe Reynolds numberT temperatureU superficial velocity_V volume flow rateW plate width (between gasket)X Lockhart–Martinelli parameter
Lowercasesd ½ Corrugation depthf Darcy friction factorg gravitational acceleration constantk rate constantk⁄ dimensionless rate constantm00 gas-phase mass flux_m00total total mass flux
t timeu velocity
x mass qualityz axial coordinate
GreekK corrugation pitchU2
TP two-phase multipliera void fractionb chevron angleg dimensionless concentrationq density
SubscriptsA accelerationF frictionG gravitySP single-phaseTP two-phasec corrugated sectione equivalentg gas phaseh hydraulicl liquid phasepp port-to-port
N. Niedbalski et al. / International Journal of Heat and Mass Transfer 70 (2014) 1078–1085 1079
2.2. Experimental setup
The hydrodynamic effects of a solid–gas reacting flow was char-acterized using the well-known acid/base neutralization reactionbetween acetic acid and sodium bicarbonate:
NaHCO3 þ CH3COOH! CH3COONaþH2Oþ CO2 ð1Þ
The reaction in Eq. (1) is non-toxic, and occurs at room temperatureand atmospheric pressure; these attributes make acetic acid and so-dium bicarbonate an ideal model reaction to study the hydrody-namics of gas-evolving multi-phase reacting flows.
The rate of reaction (and gas evolution) was controlled byvarying the concentrations of the reactant species being fedthrough the reactor, and the reactor was run under adiabatic con-ditions. The overall reaction in Eq. (1) is first-order with respect
β
W
Fig. 1. Alpha Laval MF3 heat transfer plate used in th
Approved for public release;
to acetic acid [6] and is diffusion limited in aqueous solution[7]. Because of the high degree of mixing that occurs in PHEs,the concentration of the reactants is controlled so that the major-ity of the reaction is completed inside the channel, and the vol-ume of gas produced can be determined directly from themolar concentrations of acetic acid and sodium bicarbonate intro-duced into the reactor.
The HEX reactor is an Alfa Laval MF3 gasketed chevron plateheat exchanger having the following dimensions, as detailed inTable 1.
To aid in flow visualization, the top plate of the channel was re-placed with a transparent window fabricated from an acrylic cast-ing resin (Electron Microscopy Sciences, Hatfield, PA). The resinwas molded over one of the PHE heat transfer plates to form thechevron pattern, so as to preserve the channel geometry while
Lc Lpp 2d
is study (left) and profile of corrugation (right).
distribution unlimited. 2
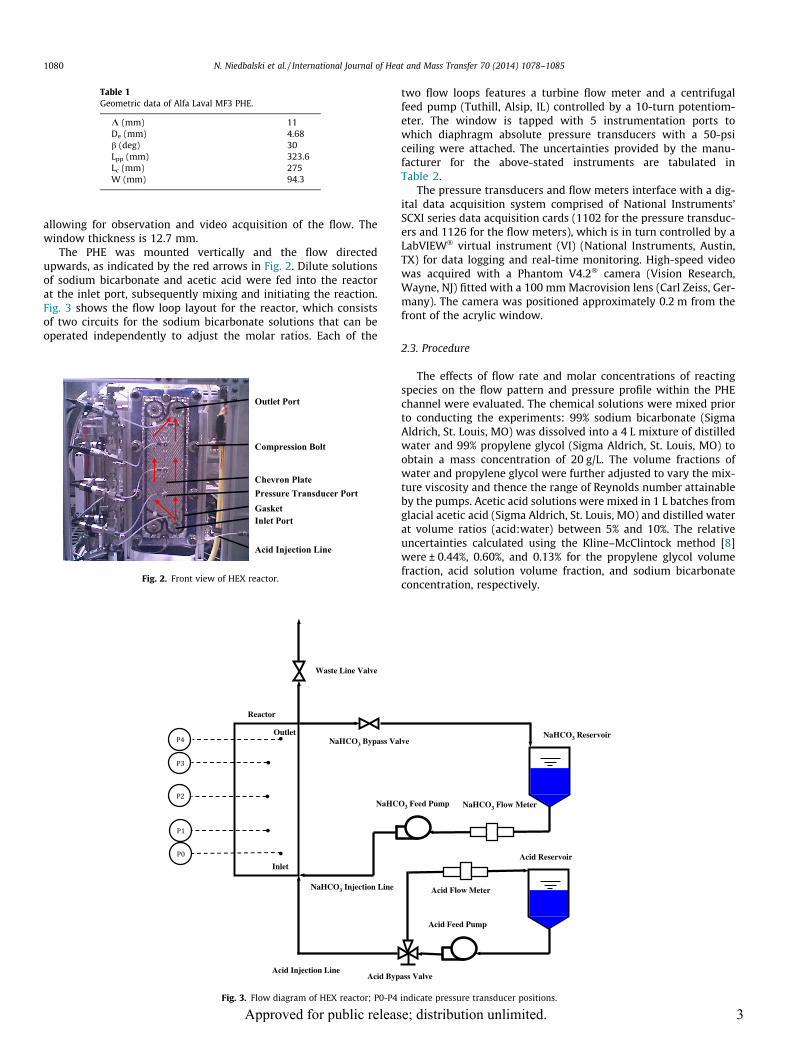
Table 1Geometric data of Alfa Laval MF3 PHE.
K (mm) 11De (mm) 4.68b (deg) 30Lpp (mm) 323.6Lc (mm) 275W (mm) 94.3
1080 N. Niedbalski et al. / International Journal of Heat and Mass Transfer 70 (2014) 1078–1085
allowing for observation and video acquisition of the flow. Thewindow thickness is 12.7 mm.
The PHE was mounted vertically and the flow directedupwards, as indicated by the red arrows in Fig. 2. Dilute solutionsof sodium bicarbonate and acetic acid were fed into the reactorat the inlet port, subsequently mixing and initiating the reaction.Fig. 3 shows the flow loop layout for the reactor, which consistsof two circuits for the sodium bicarbonate solutions that can beoperated independently to adjust the molar ratios. Each of the
Inlet Port
Outlet Port
Acid Injection Line
Pressure Transducer PortGasket
Chevron Plate
Compression Bolt
Fig. 2. Front view of HEX reactor.
Acid Byp
Waste Line Valve
NaHCO3 Bypass Va
NaHC
Reactor
Acid Injection Line
Inlet
Outlet
NaHCO3 Injection Line
Fig. 3. Flow diagram of HEX reactor; P0-P4
Approved for public releas
two flow loops features a turbine flow meter and a centrifugalfeed pump (Tuthill, Alsip, IL) controlled by a 10-turn potentiom-eter. The window is tapped with 5 instrumentation ports towhich diaphragm absolute pressure transducers with a 50-psiceiling were attached. The uncertainties provided by the manu-facturer for the above-stated instruments are tabulated inTable 2.
The pressure transducers and flow meters interface with a dig-ital data acquisition system comprised of National Instruments’SCXI series data acquisition cards (1102 for the pressure transduc-ers and 1126 for the flow meters), which is in turn controlled by aLabVIEW� virtual instrument (VI) (National Instruments, Austin,TX) for data logging and real-time monitoring. High-speed videowas acquired with a Phantom V4.2� camera (Vision Research,Wayne, NJ) fitted with a 100 mm Macrovision lens (Carl Zeiss, Ger-many). The camera was positioned approximately 0.2 m from thefront of the acrylic window.
2.3. Procedure
The effects of flow rate and molar concentrations of reactingspecies on the flow pattern and pressure profile within the PHEchannel were evaluated. The chemical solutions were mixed priorto conducting the experiments: 99% sodium bicarbonate (SigmaAldrich, St. Louis, MO) was dissolved into a 4 L mixture of distilledwater and 99% propylene glycol (Sigma Aldrich, St. Louis, MO) toobtain a mass concentration of 20 g/L. The volume fractions ofwater and propylene glycol were further adjusted to vary the mix-ture viscosity and thence the range of Reynolds number attainableby the pumps. Acetic acid solutions were mixed in 1 L batches fromglacial acetic acid (Sigma Aldrich, St. Louis, MO) and distilled waterat volume ratios (acid:water) between 5% and 10%. The relativeuncertainties calculated using the Kline–McClintock method [8]were ± 0.44%, 0.60%, and 0.13% for the propylene glycol volumefraction, acid solution volume fraction, and sodium bicarbonateconcentration, respectively.
ass Valve
Acid Feed Pump
lveNaHCO3 Reservoir
O3 Feed Pump
Acid Reservoir
Acid Flow Meter
NaHCO3 Flow Meter
indicate pressure transducer positions.
e; distribution unlimited. 3
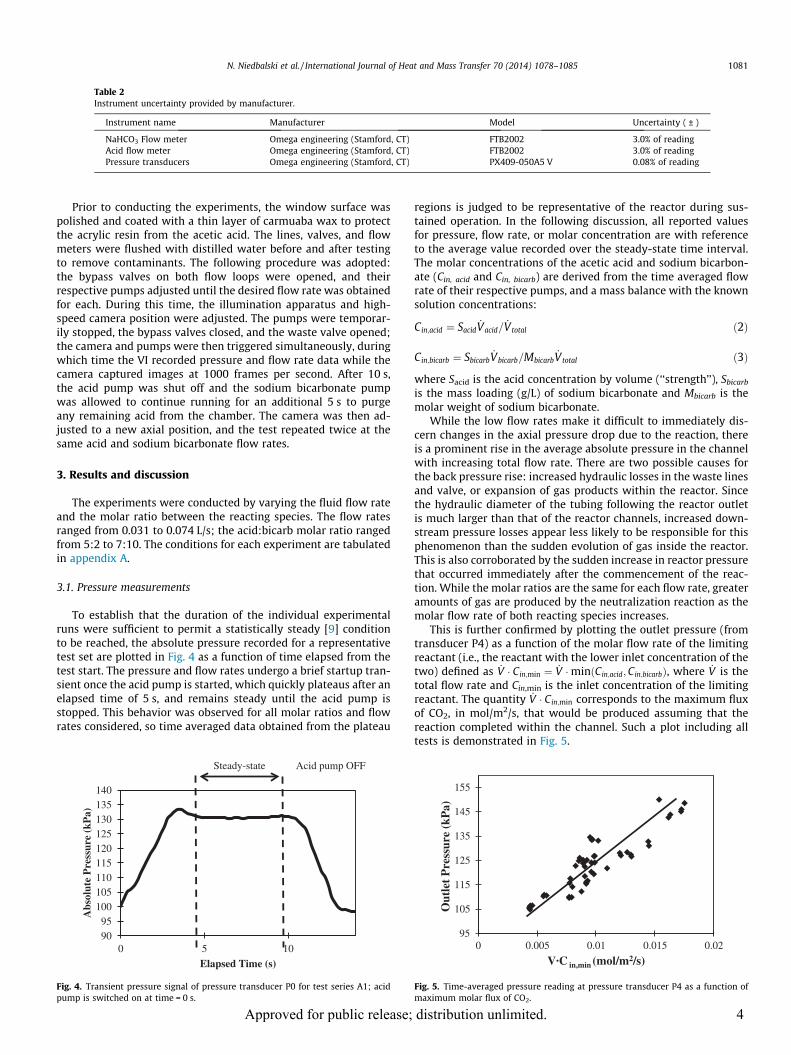
Table 2Instrument uncertainty provided by manufacturer.
Instrument name Manufacturer Model Uncertainty ( ± )
NaHCO3 Flow meter Omega engineering (Stamford, CT) FTB2002 3.0% of readingAcid flow meter Omega engineering (Stamford, CT) FTB2002 3.0% of readingPressure transducers Omega engineering (Stamford, CT) PX409-050A5 V 0.08% of reading
N. Niedbalski et al. / International Journal of Heat and Mass Transfer 70 (2014) 1078–1085 1081
Prior to conducting the experiments, the window surface waspolished and coated with a thin layer of carmuaba wax to protectthe acrylic resin from the acetic acid. The lines, valves, and flowmeters were flushed with distilled water before and after testingto remove contaminants. The following procedure was adopted:the bypass valves on both flow loops were opened, and theirrespective pumps adjusted until the desired flow rate was obtainedfor each. During this time, the illumination apparatus and high-speed camera position were adjusted. The pumps were temporar-ily stopped, the bypass valves closed, and the waste valve opened;the camera and pumps were then triggered simultaneously, duringwhich time the VI recorded pressure and flow rate data while thecamera captured images at 1000 frames per second. After 10 s,the acid pump was shut off and the sodium bicarbonate pumpwas allowed to continue running for an additional 5 s to purgeany remaining acid from the chamber. The camera was then ad-justed to a new axial position, and the test repeated twice at thesame acid and sodium bicarbonate flow rates.
3. Results and discussion
The experiments were conducted by varying the fluid flow rateand the molar ratio between the reacting species. The flow ratesranged from 0.031 to 0.074 L/s; the acid:bicarb molar ratio rangedfrom 5:2 to 7:10. The conditions for each experiment are tabulatedin appendix A.
3.1. Pressure measurements
To establish that the duration of the individual experimentalruns were sufficient to permit a statistically steady [9] conditionto be reached, the absolute pressure recorded for a representativetest set are plotted in Fig. 4 as a function of time elapsed from thetest start. The pressure and flow rates undergo a brief startup tran-sient once the acid pump is started, which quickly plateaus after anelapsed time of 5 s, and remains steady until the acid pump isstopped. This behavior was observed for all molar ratios and flowrates considered, so time averaged data obtained from the plateau
9095
100105110115120125130135140
0 5 10
Abs
olut
e P
ress
ure
(kP
a)
Elapsed Time (s)
Acid pump OFFSteady-state
Fig. 4. Transient pressure signal of pressure transducer P0 for test series A1; acidpump is switched on at time = 0 s.
Approved for public release;
regions is judged to be representative of the reactor during sus-tained operation. In the following discussion, all reported valuesfor pressure, flow rate, or molar concentration are with referenceto the average value recorded over the steady-state time interval.The molar concentrations of the acetic acid and sodium bicarbon-ate (Cin, acid and Cin, bicarb) are derived from the time averaged flowrate of their respective pumps, and a mass balance with the knownsolution concentrations:
Cin;acid ¼ Sacid_Vacid= _Vtotal ð2Þ
Cin;bicarb ¼ Sbicarb_Vbicarb=Mbicarb
_Vtotal ð3Þ
where Sacid is the acid concentration by volume (‘‘strength’’), Sbicarb
is the mass loading (g/L) of sodium bicarbonate and Mbicarb is themolar weight of sodium bicarbonate.
While the low flow rates make it difficult to immediately dis-cern changes in the axial pressure drop due to the reaction, thereis a prominent rise in the average absolute pressure in the channelwith increasing total flow rate. There are two possible causes forthe back pressure rise: increased hydraulic losses in the waste linesand valve, or expansion of gas products within the reactor. Sincethe hydraulic diameter of the tubing following the reactor outletis much larger than that of the reactor channels, increased down-stream pressure losses appear less likely to be responsible for thisphenomenon than the sudden evolution of gas inside the reactor.This is also corroborated by the sudden increase in reactor pressurethat occurred immediately after the commencement of the reac-tion. While the molar ratios are the same for each flow rate, greateramounts of gas are produced by the neutralization reaction as themolar flow rate of both reacting species increases.
This is further confirmed by plotting the outlet pressure (fromtransducer P4) as a function of the molar flow rate of the limitingreactant (i.e., the reactant with the lower inlet concentration of thetwo) defined as _V � Cin;min ¼ _V �minðCin;acid;Cin;bicarbÞ, where _V is thetotal flow rate and Cin,min is the inlet concentration of the limitingreactant. The quantity _V � Cin;min corresponds to the maximum fluxof CO2, in mol/m2/s, that would be produced assuming that thereaction completed within the channel. Such a plot including alltests is demonstrated in Fig. 5.
95
105
115
125
135
145
155
0 0.005 0.01 0.015 0.02
Out
let
Pre
ssur
e (k
Pa)
V·C in,min (mol/m2/s)
Fig. 5. Time-averaged pressure reading at pressure transducer P4 as a function ofmaximum molar flux of CO2.
distribution unlimited. 4
1082 N. Niedbalski et al. / International Journal of Heat and Mass Transfer 70 (2014) 1078–1085
Although we could not verify the remaining quantity of unre-acted species at the reactor outlet, the assumption of (approxi-mately) full conversion within the reactor was checked bymeasuring the reaction times in a stirred beaker, which were typ-ically 2 or 3 s; the residence times achieved in this study were inthe range of 1.5–3 s based on a reactor volume of 101 mL(±1 mL). Additionally, Sahoo and Sata reported reaction half-timesthat were less than one second [7], and that the kinetics were lim-ited by mixing time. Because of the high degree of agitation occur-ring in the reactor, and the residence times close to the observedrelease of gasses in a stirred beaker, it can be concluded that thereaction is most likely very close to completion upon reachingthe reactor outlet.
Comparing the change in the values of back pressure rise at dif-ferent flow rates, it was clear that the frictional and gravitationalpressure drop are not significant factors determining the reactorconditions. However, it is well understood that the prediction ofthermal performance of heat exchangers is closely tied to the pre-diction of frictional pressure drop and therefore the utility of thefrictional pressure drop measurements in predicting reactor ther-mal performance will be discussed in Part II of this study.
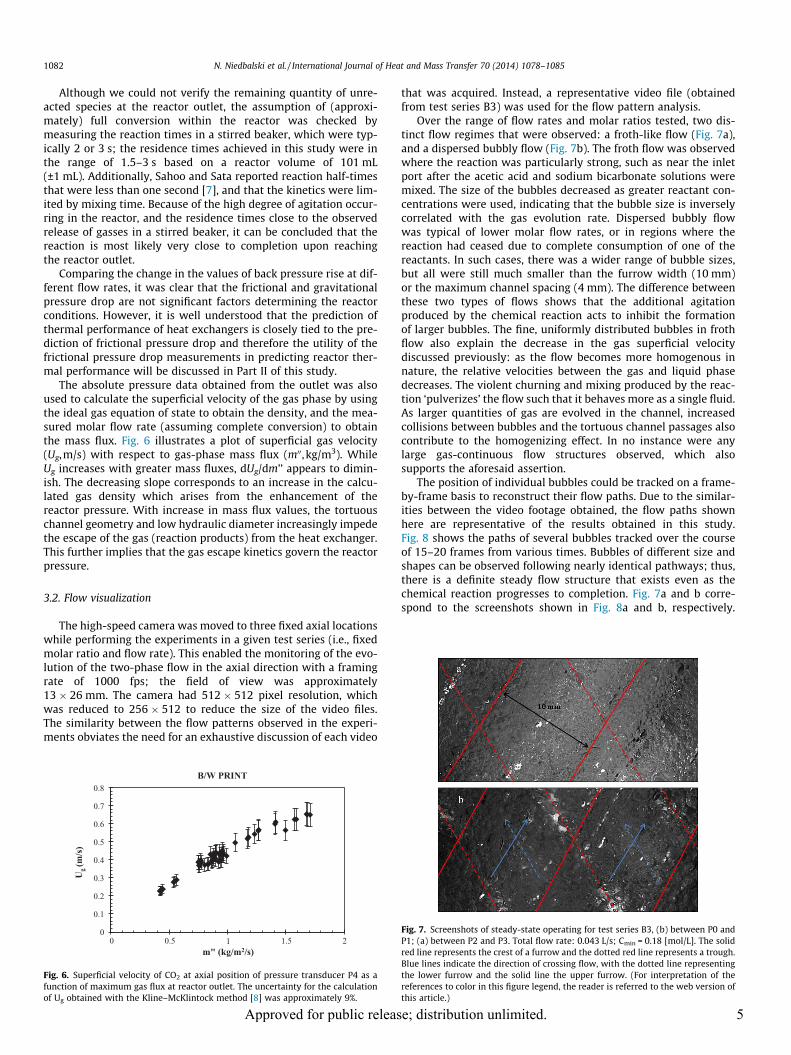
The absolute pressure data obtained from the outlet was alsoused to calculate the superficial velocity of the gas phase by usingthe ideal gas equation of state to obtain the density, and the mea-sured molar flow rate (assuming complete conversion) to obtainthe mass flux. Fig. 6 illustrates a plot of superficial gas velocity(Ug,m/s) with respect to gas-phase mass flux (m00, kg/m3). WhileUg increases with greater mass fluxes, dUg/dm’’ appears to dimin-ish. The decreasing slope corresponds to an increase in the calcu-lated gas density which arises from the enhancement of thereactor pressure. With increase in mass flux values, the tortuouschannel geometry and low hydraulic diameter increasingly impedethe escape of the gas (reaction products) from the heat exchanger.This further implies that the gas escape kinetics govern the reactorpressure.
3.2. Flow visualization
The high-speed camera was moved to three fixed axial locationswhile performing the experiments in a given test series (i.e., fixedmolar ratio and flow rate). This enabled the monitoring of the evo-lution of the two-phase flow in the axial direction with a framingrate of 1000 fps; the field of view was approximately13 � 26 mm. The camera had 512 � 512 pixel resolution, whichwas reduced to 256 � 512 to reduce the size of the video files.The similarity between the flow patterns observed in the experi-ments obviates the need for an exhaustive discussion of each video
0
0.1
0.2
0.3
0.4
0.5
0.6
0.7
0.8
Ug(m
/s)
0 0.5 1 1.5 2m" (kg/m2/s)
B/W PRINT
Fig. 6. Superficial velocity of CO2 at axial position of pressure transducer P4 as afunction of maximum gas flux at reactor outlet. The uncertainty for the calculationof Ug obtained with the Kline–McKlintock method [8] was approximately 9%.
Approved for public releas
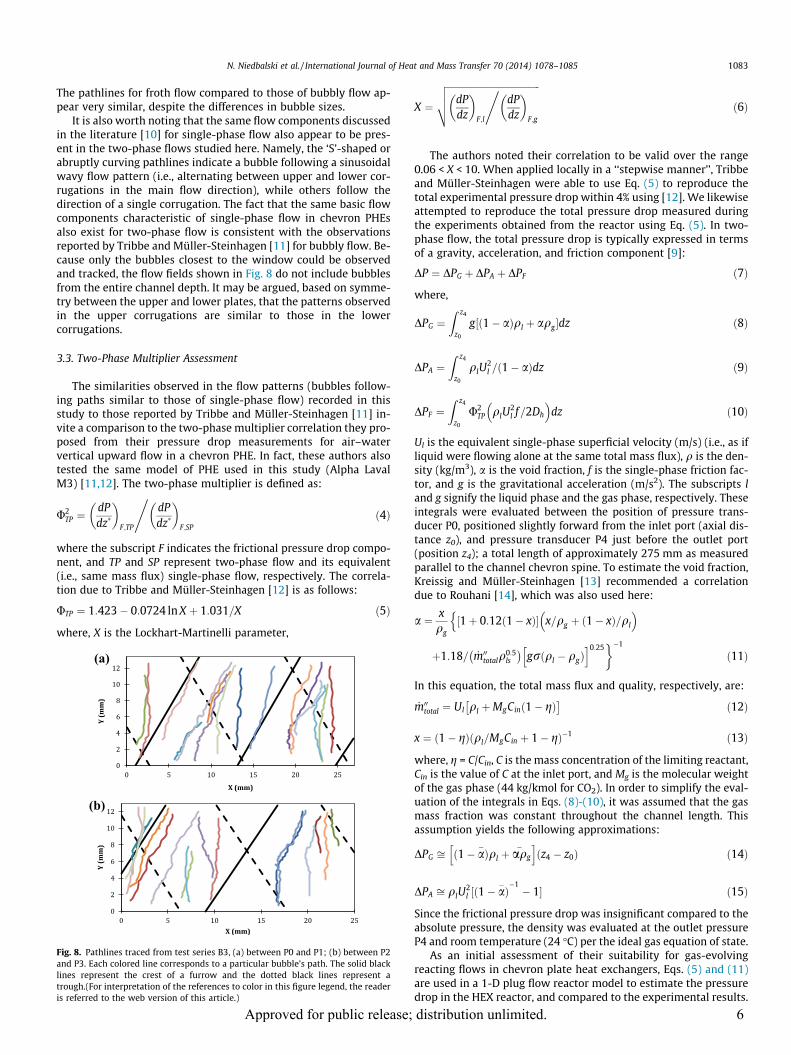
that was acquired. Instead, a representative video file (obtainedfrom test series B3) was used for the flow pattern analysis.
Over the range of flow rates and molar ratios tested, two dis-tinct flow regimes that were observed: a froth-like flow (Fig. 7a),and a dispersed bubbly flow (Fig. 7b). The froth flow was observedwhere the reaction was particularly strong, such as near the inletport after the acetic acid and sodium bicarbonate solutions weremixed. The size of the bubbles decreased as greater reactant con-centrations were used, indicating that the bubble size is inverselycorrelated with the gas evolution rate. Dispersed bubbly flowwas typical of lower molar flow rates, or in regions where thereaction had ceased due to complete consumption of one of thereactants. In such cases, there was a wider range of bubble sizes,but all were still much smaller than the furrow width (10 mm)or the maximum channel spacing (4 mm). The difference betweenthese two types of flows shows that the additional agitationproduced by the chemical reaction acts to inhibit the formationof larger bubbles. The fine, uniformly distributed bubbles in frothflow also explain the decrease in the gas superficial velocitydiscussed previously: as the flow becomes more homogenous innature, the relative velocities between the gas and liquid phasedecreases. The violent churning and mixing produced by the reac-tion ‘pulverizes’ the flow such that it behaves more as a single fluid.As larger quantities of gas are evolved in the channel, increasedcollisions between bubbles and the tortuous channel passages alsocontribute to the homogenizing effect. In no instance were anylarge gas-continuous flow structures observed, which alsosupports the aforesaid assertion.
The position of individual bubbles could be tracked on a frame-by-frame basis to reconstruct their flow paths. Due to the similar-ities between the video footage obtained, the flow paths shownhere are representative of the results obtained in this study.Fig. 8 shows the paths of several bubbles tracked over the courseof 15–20 frames from various times. Bubbles of different size andshapes can be observed following nearly identical pathways; thus,there is a definite steady flow structure that exists even as thechemical reaction progresses to completion. Fig. 7a and b corre-spond to the screenshots shown in Fig. 8a and b, respectively.
Fig. 7. Screenshots of steady-state operating for test series B3, (b) between P0 andP1; (a) between P2 and P3. Total flow rate: 0.043 L/s; Cmin = 0.18 [mol/L]. The solidred line represents the crest of a furrow and the dotted red line represents a trough.Blue lines indicate the direction of crossing flow, with the dotted line representingthe lower furrow and the solid line the upper furrow. (For interpretation of thereferences to color in this figure legend, the reader is referred to the web version ofthis article.)
e; distribution unlimited. 5
N. Niedbalski et al. / International Journal of Heat and Mass Transfer 70 (2014) 1078–1085 1083
The pathlines for froth flow compared to those of bubbly flow ap-pear very similar, despite the differences in bubble sizes.
It is also worth noting that the same flow components discussedin the literature [10] for single-phase flow also appear to be pres-ent in the two-phase flows studied here. Namely, the ‘S’-shaped orabruptly curving pathlines indicate a bubble following a sinusoidalwavy flow pattern (i.e., alternating between upper and lower cor-rugations in the main flow direction), while others follow thedirection of a single corrugation. The fact that the same basic flowcomponents characteristic of single-phase flow in chevron PHEsalso exist for two-phase flow is consistent with the observationsreported by Tribbe and Müller-Steinhagen [11] for bubbly flow. Be-cause only the bubbles closest to the window could be observedand tracked, the flow fields shown in Fig. 8 do not include bubblesfrom the entire channel depth. It may be argued, based on symme-try between the upper and lower plates, that the patterns observedin the upper corrugations are similar to those in the lowercorrugations.
3.3. Two-Phase Multiplier Assessment
The similarities observed in the flow patterns (bubbles follow-ing paths similar to those of single-phase flow) recorded in thisstudy to those reported by Tribbe and Müller-Steinhagen [11] in-vite a comparison to the two-phase multiplier correlation they pro-posed from their pressure drop measurements for air–watervertical upward flow in a chevron PHE. In fact, these authors alsotested the same model of PHE used in this study (Alpha LavalM3) [11,12]. The two-phase multiplier is defined as:
U2TP ¼
dPdz�
� �F;TP
dPdz�
� �F;SP
,ð4Þ
where the subscript F indicates the frictional pressure drop compo-nent, and TP and SP represent two-phase flow and its equivalent(i.e., same mass flux) single-phase flow, respectively. The correla-tion due to Tribbe and Müller-Steinhagen [12] is as follows:
UTP ¼ 1:423� 0:0724 ln X þ 1:031=X ð5Þ
where, X is the Lockhart-Martinelli parameter,
(a)
(b)
Fig. 8. Pathlines traced from test series B3, (a) between P0 and P1; (b) between P2and P3. Each colored line corresponds to a particular bubble’s path. The solid blacklines represent the crest of a furrow and the dotted black lines represent atrough.(For interpretation of the references to color in this figure legend, the readeris referred to the web version of this article.)
Approved for public release;
X ¼
ffiffiffiffiffiffiffiffiffiffiffiffiffiffiffiffiffiffiffiffiffiffiffiffiffiffiffiffiffiffiffiffiffiffiffiffiffiffiffiffidPdz
� �F;l
,dPdz
� �F;g
vuut ð6Þ
The authors noted their correlation to be valid over the range0.06 < X < 10. When applied locally in a ‘‘stepwise manner’’, Tribbeand Müller-Steinhagen were able to use Eq. (5) to reproduce thetotal experimental pressure drop within 4% using [12]. We likewiseattempted to reproduce the total pressure drop measured duringthe experiments obtained from the reactor using Eq. (5). In two-phase flow, the total pressure drop is typically expressed in termsof a gravity, acceleration, and friction component [9]:
DP ¼ DPG þ DPA þ DPF ð7Þ
where,
DPG ¼Z z4
z0
g½ð1� aÞql þ aqg �dz ð8Þ
DPA ¼Z z4
z0
qlU2l =ð1� aÞdz ð9Þ
DPF ¼Z z4
z0
U2TP qlU
2l f=2Dh
� �dz ð10Þ
Ul is the equivalent single-phase superficial velocity (m/s) (i.e., as ifliquid were flowing alone at the same total mass flux), q is the den-sity (kg/m3), a is the void fraction, f is the single-phase friction fac-tor, and g is the gravitational acceleration (m/s2). The subscripts land g signify the liquid phase and the gas phase, respectively. Theseintegrals were evaluated between the position of pressure trans-ducer P0, positioned slightly forward from the inlet port (axial dis-tance z0), and pressure transducer P4 just before the outlet port(position z4); a total length of approximately 275 mm as measuredparallel to the channel chevron spine. To estimate the void fraction,Kreissig and Müller-Steinhagen [13] recommended a correlationdue to Rouhani [14], which was also used here:
a ¼ xqg
1þ 0:12ð1� xÞ½ � x=qg þ ð1� xÞ=ql
� �n
þ1:18= _m00totalq0:5ls
� �grðql � qgÞh i0:25
�1
ð11Þ
In this equation, the total mass flux and quality, respectively, are:
_m00total ¼ Ul ql þMgCinð1� gÞ �
ð12Þ
x ¼ ð1� gÞðql=MgCin þ 1� gÞ�1 ð13Þ
where, g = C/Cin, C is the mass concentration of the limiting reactant,Cin is the value of C at the inlet port, and Mg is the molecular weightof the gas phase (44 kg/kmol for CO2). In order to simplify the eval-uation of the integrals in Eqs. (8)-(10), it was assumed that the gasmass fraction was constant throughout the channel length. Thisassumption yields the following approximations:
DPG ffi ð1� a�Þql þ aq
�g
h iðz4 � z0Þ ð14Þ
DPA ffi qlU2l ½ð1� a
�Þ�1� 1� ð15Þ
Since the frictional pressure drop was insignificant compared to theabsolute pressure, the density was evaluated at the outlet pressureP4 and room temperature (24 �C) per the ideal gas equation of state.
As an initial assessment of their suitability for gas-evolvingreacting flows in chevron plate heat exchangers, Eqs. (5) and (11)are used in a 1-D plug flow reactor model to estimate the pressuredrop in the HEX reactor, and compared to the experimental results.
distribution unlimited. 6
144
145
146
147
148
149
150
151
152
153
154
0 50 100 150 200 250
Abs
olut
e P
ress
ure
(kP
a)
Axial Position (mm)
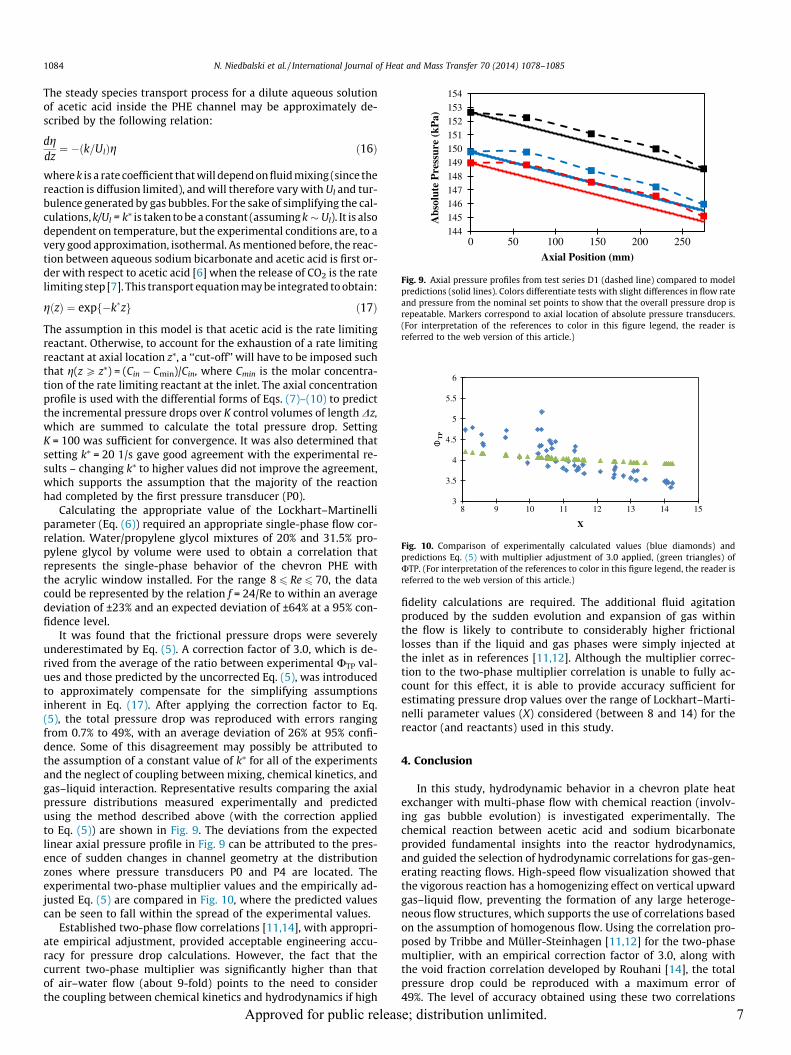
Fig. 9. Axial pressure profiles from test series D1 (dashed line) compared to modelpredictions (solid lines). Colors differentiate tests with slight differences in flow rateand pressure from the nominal set points to show that the overall pressure drop isrepeatable. Markers correspond to axial location of absolute pressure transducers.(For interpretation of the references to color in this figure legend, the reader isreferred to the web version of this article.)
3
3.5
4
4.5
5
5.5
6
8 9 10 11 12 13 14 15
TP
X
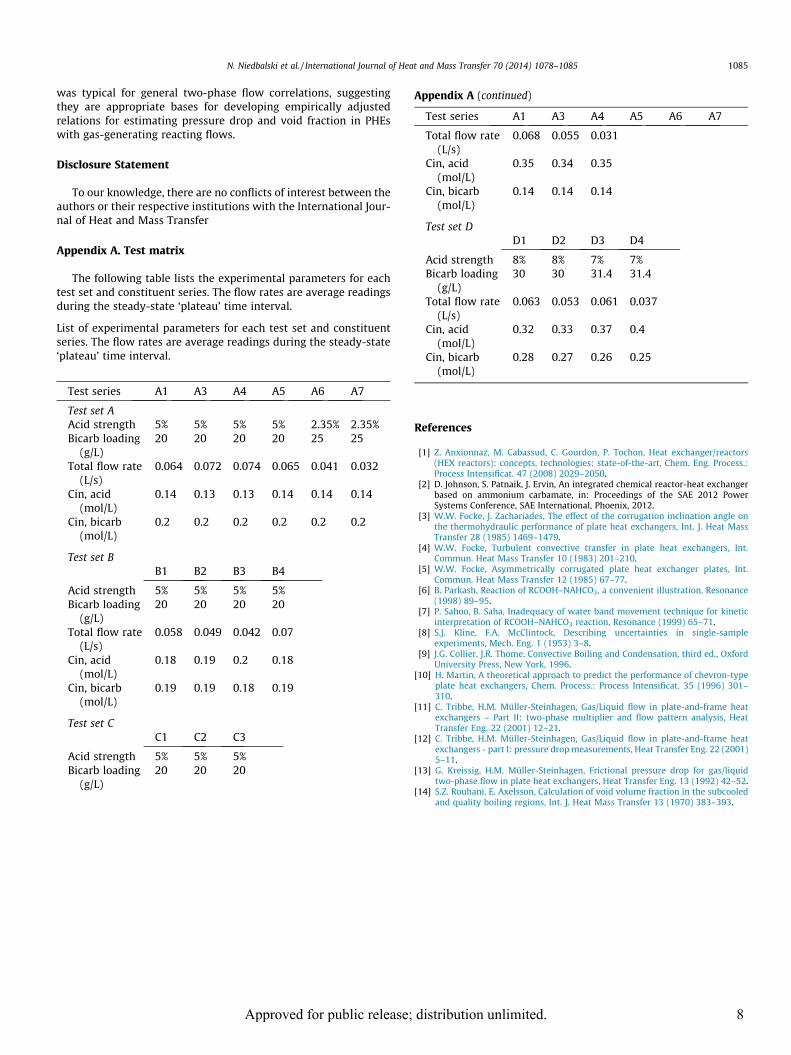
Fig. 10. Comparison of experimentally calculated values (blue diamonds) andpredictions Eq. (5) with multiplier adjustment of 3.0 applied, (green triangles) ofUTP. (For interpretation of the references to color in this figure legend, the reader isreferred to the web version of this article.)
1084 N. Niedbalski et al. / International Journal of Heat and Mass Transfer 70 (2014) 1078–1085
The steady species transport process for a dilute aqueous solutionof acetic acid inside the PHE channel may be approximately de-scribed by the following relation:
dgdz¼ �ðk=UlÞg ð16Þ
where k is a rate coefficient that will depend on fluid mixing (since thereaction is diffusion limited), and will therefore vary with Ul and tur-bulence generated by gas bubbles. For the sake of simplifying the cal-culations, k/Ul = k⁄ is taken to be a constant (assuming k � Ul). It is alsodependent on temperature, but the experimental conditions are, to avery good approximation, isothermal. As mentioned before, the reac-tion between aqueous sodium bicarbonate and acetic acid is first or-der with respect to acetic acid [6] when the release of CO2 is the ratelimiting step [7]. This transport equation may be integrated to obtain:
gðzÞ ¼ expf�k�zg ð17Þ
The assumption in this model is that acetic acid is the rate limitingreactant. Otherwise, to account for the exhaustion of a rate limitingreactant at axial location z⁄, a ‘‘cut-off’’ will have to be imposed suchthat g(z P z⁄) = (Cin � Cmin)/Cin, where Cmin is the molar concentra-tion of the rate limiting reactant at the inlet. The axial concentrationprofile is used with the differential forms of Eqs. (7)–(10) to predictthe incremental pressure drops over K control volumes of length Dz,which are summed to calculate the total pressure drop. SettingK = 100 was sufficient for convergence. It was also determined thatsetting k⁄ = 20 1/s gave good agreement with the experimental re-sults – changing k⁄ to higher values did not improve the agreement,which supports the assumption that the majority of the reactionhad completed by the first pressure transducer (P0).
Calculating the appropriate value of the Lockhart–Martinelliparameter (Eq. (6)) required an appropriate single-phase flow cor-relation. Water/propylene glycol mixtures of 20% and 31.5% pro-pylene glycol by volume were used to obtain a correlation thatrepresents the single-phase behavior of the chevron PHE withthe acrylic window installed. For the range 8 6 Re 6 70, the datacould be represented by the relation f = 24/Re to within an averagedeviation of ±23% and an expected deviation of ±64% at a 95% con-fidence level.
It was found that the frictional pressure drops were severelyunderestimated by Eq. (5). A correction factor of 3.0, which is de-rived from the average of the ratio between experimental UTP val-ues and those predicted by the uncorrected Eq. (5), was introducedto approximately compensate for the simplifying assumptionsinherent in Eq. (17). After applying the correction factor to Eq.(5), the total pressure drop was reproduced with errors rangingfrom 0.7% to 49%, with an average deviation of 26% at 95% confi-dence. Some of this disagreement may possibly be attributed tothe assumption of a constant value of k⁄ for all of the experimentsand the neglect of coupling between mixing, chemical kinetics, andgas–liquid interaction. Representative results comparing the axialpressure distributions measured experimentally and predictedusing the method described above (with the correction appliedto Eq. (5)) are shown in Fig. 9. The deviations from the expectedlinear axial pressure profile in Fig. 9 can be attributed to the pres-ence of sudden changes in channel geometry at the distributionzones where pressure transducers P0 and P4 are located. Theexperimental two-phase multiplier values and the empirically ad-justed Eq. (5) are compared in Fig. 10, where the predicted valuescan be seen to fall within the spread of the experimental values.
Established two-phase flow correlations [11,14], with appropri-ate empirical adjustment, provided acceptable engineering accu-racy for pressure drop calculations. However, the fact that thecurrent two-phase multiplier was significantly higher than thatof air–water flow (about 9-fold) points to the need to considerthe coupling between chemical kinetics and hydrodynamics if high
Approved for public releas
fidelity calculations are required. The additional fluid agitationproduced by the sudden evolution and expansion of gas withinthe flow is likely to contribute to considerably higher frictionallosses than if the liquid and gas phases were simply injected atthe inlet as in references [11,12]. Although the multiplier correc-tion to the two-phase multiplier correlation is unable to fully ac-count for this effect, it is able to provide accuracy sufficient forestimating pressure drop values over the range of Lockhart–Marti-nelli parameter values (X) considered (between 8 and 14) for thereactor (and reactants) used in this study.
4. Conclusion
In this study, hydrodynamic behavior in a chevron plate heatexchanger with multi-phase flow with chemical reaction (involv-ing gas bubble evolution) is investigated experimentally. Thechemical reaction between acetic acid and sodium bicarbonateprovided fundamental insights into the reactor hydrodynamics,and guided the selection of hydrodynamic correlations for gas-gen-erating reacting flows. High-speed flow visualization showed thatthe vigorous reaction has a homogenizing effect on vertical upwardgas–liquid flow, preventing the formation of any large heteroge-neous flow structures, which supports the use of correlations basedon the assumption of homogenous flow. Using the correlation pro-posed by Tribbe and Müller-Steinhagen [11,12] for the two-phasemultiplier, with an empirical correction factor of 3.0, along withthe void fraction correlation developed by Rouhani [14], the totalpressure drop could be reproduced with a maximum error of49%. The level of accuracy obtained using these two correlations
e; distribution unlimited. 7
N. Niedbalski et al. / International Journal of Heat and Mass Transfer 70 (2014) 1078–1085 1085
was typical for general two-phase flow correlations, suggestingthey are appropriate bases for developing empirically adjustedrelations for estimating pressure drop and void fraction in PHEswith gas-generating reacting flows.
Disclosure Statement
To our knowledge, there are no conflicts of interest between theauthors or their respective institutions with the International Jour-nal of Heat and Mass Transfer
Appendix A. Test matrix
The following table lists the experimental parameters for eachtest set and constituent series. The flow rates are average readingsduring the steady-state ‘plateau’ time interval.
List of experimental parameters for each test set and constituentseries. The flow rates are average readings during the steady-state‘plateau’ time interval.
Test series
A1 A3 A4App
A5
roved f
A6
or pub
A7
Test set A
Acid strength 5% 5% 5% 5% 2.35% 2.35% Bicarb loading(g/L)
20 20 20 20 25 25Total flow rate(L/s)
0.064
0.072 0.074 0.065 0.041 0.032Cin, acid(mol/L)
0.14
0.13 0.13 0.14 0.14 0.14Cin, bicarb(mol/L)
0.2
0.2 0.2 0.2 0.2 0.2Test set B
B1 B2 B3 B4Acid strength
5% 5% 5% 5% Bicarb loading(g/L)
20 20 20 20Total flow rate(L/s)
0.058
0.049 0.042 0.07Cin, acid(mol/L)
0.18
0.19 0.2 0.18Cin, bicarb(mol/L)
0.19
0.19 0.18 0.19Test set C
C1 C2 C3Acid strength
5% 5% 5% Bicarb loading(g/L)
20 20 20lic release; d
Appendix A (continued)
Test series
istribution unli
A1
mited.
A3
A4 A5 A6 A7Total flow rate(L/s)
0.068
0.055 0.031Cin, acid(mol/L)
0.35
0.34 0.35Cin, bicarb(mol/L)
0.14
0.14 0.14Test set D
D1 D2 D3 D4Acid strength
8% 8% 7% 7% Bicarb loading(g/L)
30 30 31.4 31.4Total flow rate(L/s)
0.063
0.053 0.061 0.037Cin, acid(mol/L)
0.32
0.33 0.37 0.4Cin, bicarb(mol/L)
0.28
0.27 0.26 0.25References
[1] Z. Anxionnaz, M. Cabassud, C. Gourdon, P. Tochon, Heat exchanger/reactors(HEX reactors): concepts, technologies: state-of-the-art, Chem. Eng. Process.:Process Intensificat. 47 (2008) 2029–2050.
[2] D. Johnson, S. Patnaik, J. Ervin, An integrated chemical reactor-heat exchangerbased on ammonium carbamate, in: Proceedings of the SAE 2012 PowerSystems Conference, SAE International, Phoenix, 2012.
[3] W.W. Focke, J. Zachariades, The effect of the corrugation inclination angle onthe thermohydraulic performance of plate heat exchangers, Int. J. Heat MassTransfer 28 (1985) 1469–1479.
[4] W.W. Focke, Turbulent convective transfer in plate heat exchangers, Int.Commun. Heat Mass Transfer 10 (1983) 201–210.
[5] W.W. Focke, Asymmetrically corrugated plate heat exchanger plates, Int.Commun. Heat Mass Transfer 12 (1985) 67–77.
[6] B. Parkash, Reaction of RCOOH–NAHCO3, a convenient illustration, Resonance(1998) 89–95.
[7] P. Sahoo, B. Saha, Inadequacy of water band movement technique for kineticinterpretation of RCOOH–NAHCO3 reaction, Resonance (1999) 65–71.
[8] S.J. Kline, F.A. McClintock, Describing uncertainties in single-sampleexperiments, Mech. Eng. 1 (1953) 3–8.
[9] J.G. Collier, J.R. Thome, Convective Boiling and Condensation, third ed., OxfordUniversity Press, New York, 1996.
[10] H. Martin, A theoretical approach to predict the performance of chevron-typeplate heat exchangers, Chem. Process.: Process Intensificat. 35 (1996) 301–310.
[11] C. Tribbe, H.M. Müller-Steinhagen, Gas/Liquid flow in plate-and-frame heatexchangers – Part II: two-phase multiplier and flow pattern analysis, HeatTransfer Eng. 22 (2001) 12–21.
[12] C. Tribbe, H.M. Müller-Steinhagen, Gas/Liquid flow in plate-and-frame heatexchangers - part I: pressure drop measurements, Heat Transfer Eng. 22 (2001)5–11.
[13] G. Kreissig, H.M. Müller-Steinhagen, Frictional pressure drop for gas/liquidtwo-phase flow in plate heat exchangers, Heat Transfer Eng. 13 (1992) 42–52.
[14] S.Z. Rouhani, E. Axelsson, Calculation of void volume fraction in the subcooledand quality boiling regions, Int. J. Heat Mass Transfer 13 (1970) 383–393.
8