Embed Size (px)
Citation preview

AFRRI FLOOD RISK STUDY
Ross County, Ohio February 2004 Ohio Department of Natural Resources, Division of Water Floodplain Management Program

TABLE OF CONTENTS Page SECTION 1: INTRODUCTION 3 1.1 Purpose of Study 3 1.2 Coordination 3 1.3 Authority and Acknowledgements 3 SECTION 2: AREA STUDIED 5 2.1 Scope of Study 5 2.2 Special Problems 5 2.3 Community Flood History 5 2.4 Risk Assessment and Vulnerability Analysis 7 SETION 3: HYDROLOGY 9 3.1 Previous Studies 9 3.2 Summary of Analysis 9 3.3 Summary of Discharges (Table) 9 SECTION 4: HYDRAULICS 10 4.1 Previous Studies 10 4.2 Summary of Analysis 10 4.3 Surveying and Mapping 10 REFERENCES FLOODWAY DATA TABLE FLOOD PROFILE On the Cover: Flooding over Kellenberger Road on January 6, 2004.
2

SECTION 1: INTRODUCTION 1.1 Purpose of Study Ross County was chosen to participate in the Appalachian Flood Risk Reduction Initiative (AFRRI). AFRRI is a pilot program being offered to fifteen Appalachian communities in Ohio. The program provides communities with planning / technical assistance and a small grant to produce a natural hazard mitigation plan that is compliant with the Federal Disaster Mitigation Act of 2000, and engineering services to produce a detailed flood study for an approximately 1 mile reach of watercourse. The ultimate goal of AFRRI is to increase the community’s sustainability, including enhancing its economic vitality, by addressing natural hazards – especially flooding -- through planning, hazard identification and risk assessment. As part of the grant, Ross County requested that a detailed flood study be performed for approximately a one-mile reach of Kinnikinnick Creek to identify areas currently at risk of flooding. The Ohio Department of Natural Resources (ODNR) conducted field surveys of the channel, floodplain, and hydraulic structures along Kinnikinnick Creek. The measurements obtained from the field survey were used to develop 100-year flood profiles as well as a map depicting the extent of the floodplain and floodway along the studied reach of Kinnikinnick Creek. This study should be used to supplement the Flood Insurance Study for Ross County produced by the Federal Emergency Management Agency. The detailed flood data generated from this study should enable local officials to make an informed decision regarding the development potential, and flood risks of sites covered by this study. 1.2 Coordination Areas of detailed flood study in this report were identified by community officials when applying to participate in AFRRI. ODNR, Division of Water staff scoped out each study reach requested to determine feasibility. Where the study reach was determined feasible, ODNR staff commenced with the study. Where the study reach was determined not to be feasible, ODNR staff requested that the community select another study reach. 1.3 Authority and Acknowledgements As the statutory state agency responsible for the coordination of floodplain management activities throughout Ohio, the ODNR, Division of Water, performs a variety of activities related to floodplain management including: Coordinating the National Flood Insurance Program, providing technical assistance to state agencies and local communities, acting as Ohio’s repository of flood map data,
3

and preparing technical data on floods and floodplain management (Ohio Revised Code 1521.13). This initiative is within the scope of the Division of Water’s statutory authority and complements both the mission and strategic direction of the Division’s Floodplain Management Program. Funds for AFRRI are provided by the U.S. Department of Commerce -- Economic Development Administration, the Ohio Governor’s Office of Appalachia, the Ohio Emergency Management Agency (OEMA) and ODNR.
4

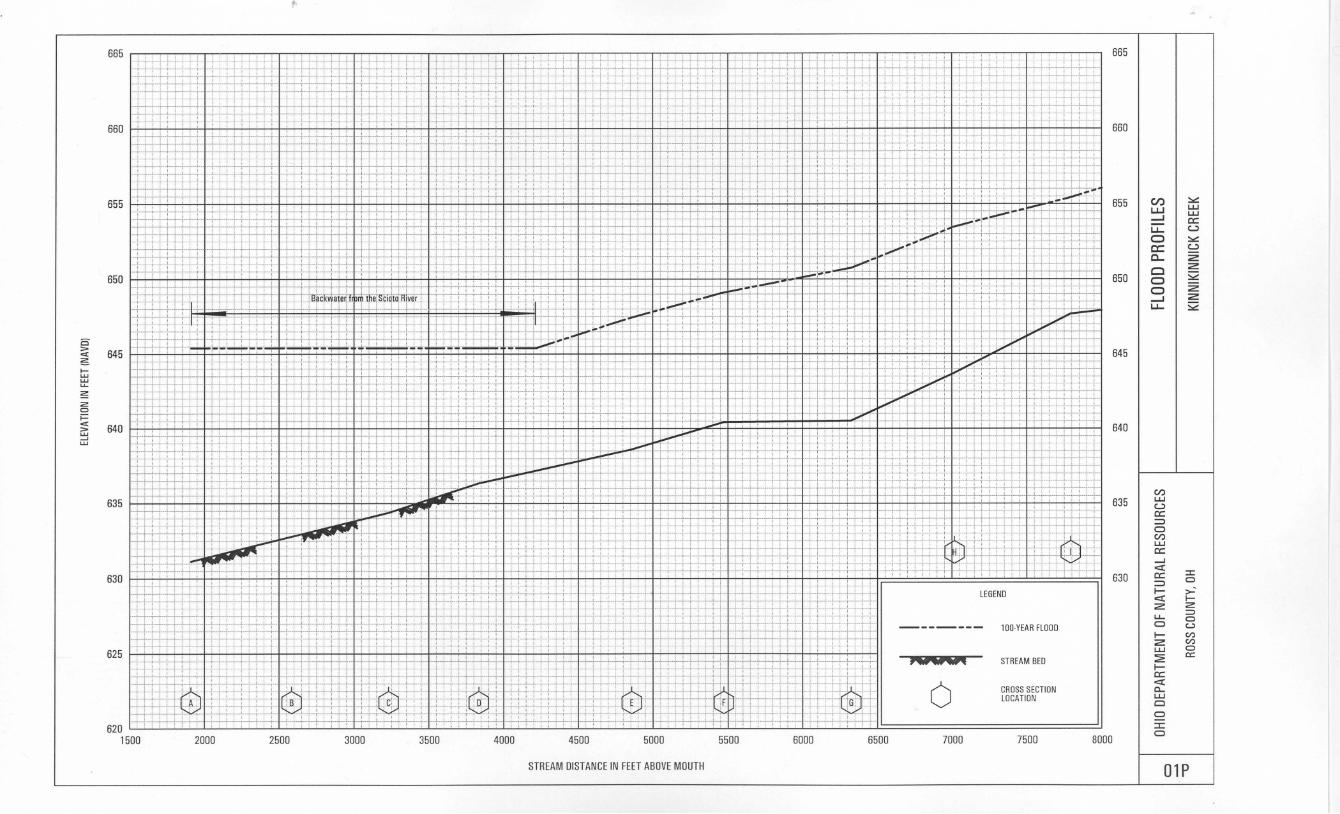
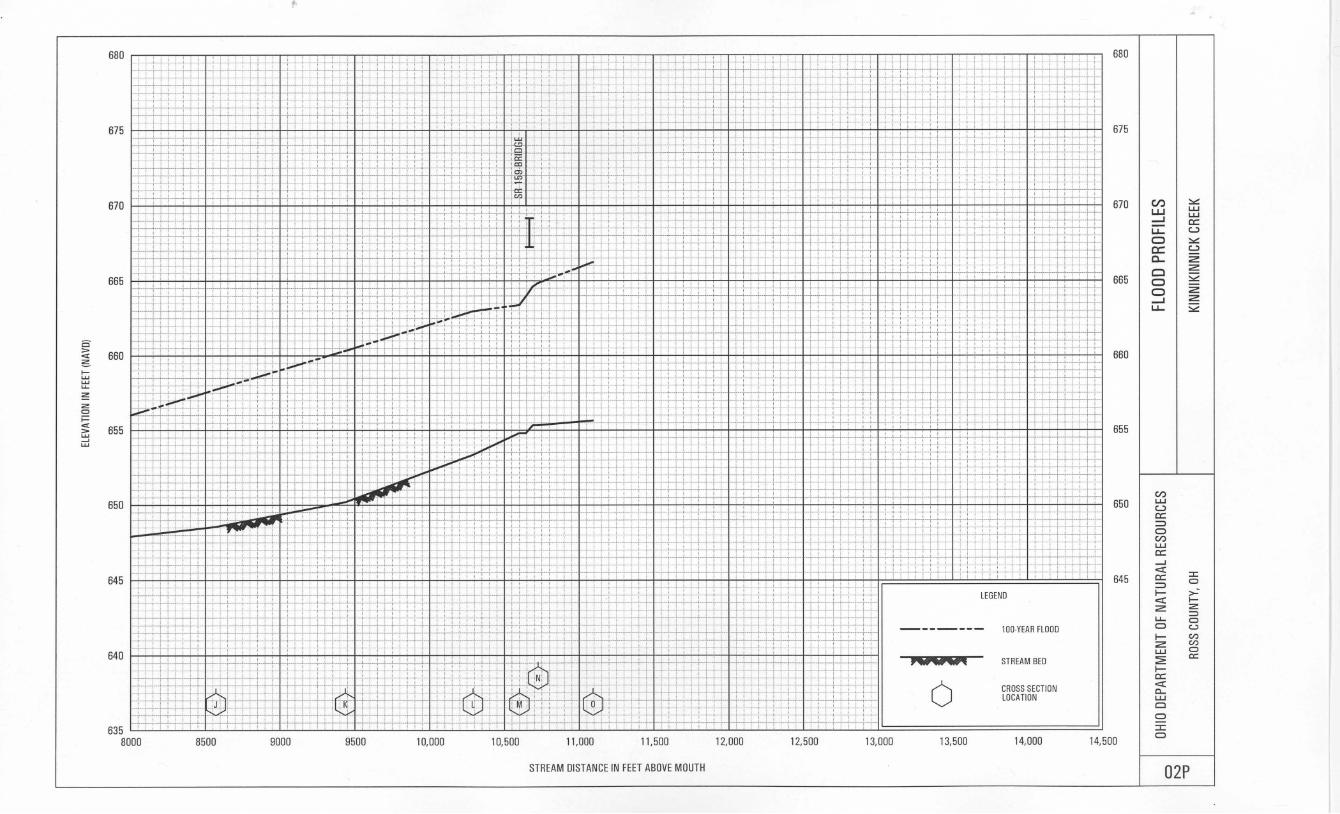
SECTION 2: AREA STUDIED 2.1 Scope of Study This flood study extends from the confluence of the Scioto River and Kinnikinnick Creek to just upstream of the State Route 159 Bridge over Kinnikinnick Creek. A 100-year flood elevation was determined for the Scioto River at the confluence with Kinnikinnick Creek. The 100-year flood elevation profile and floodway limits were determined for the entire studied reach of Kinnikinnick Creek. 2.2 Special Problems None. 2.3 Community Flood History Floods are the most frequently occurring natural disaster in Ross County, in the State of Ohio, and in the United States. There are mapped floodplain areas in portions of every township in Ross County as well as in the City of Chillicothe, and the Villages of Bainbridge, South Salem, and Frankfort. The major source of flooding in Ross County is the Scioto River and its tributaries. The most frequent flooding occurs during the winter and early spring. Major flood events have occurred in the Scioto River valley in March 1913, January 1937, and January 1959. The 1913 flood had a recurrence interval of 350 years, and was one of the worst floods ever to occur in Ohio and Ross County. This flood caused 467 deaths statewide, 18 of those casualties occurred in Chillicothe. Approximately 75% of the City of Chillicothe was flooded. The following table profiles the flood history of Ross County.
5
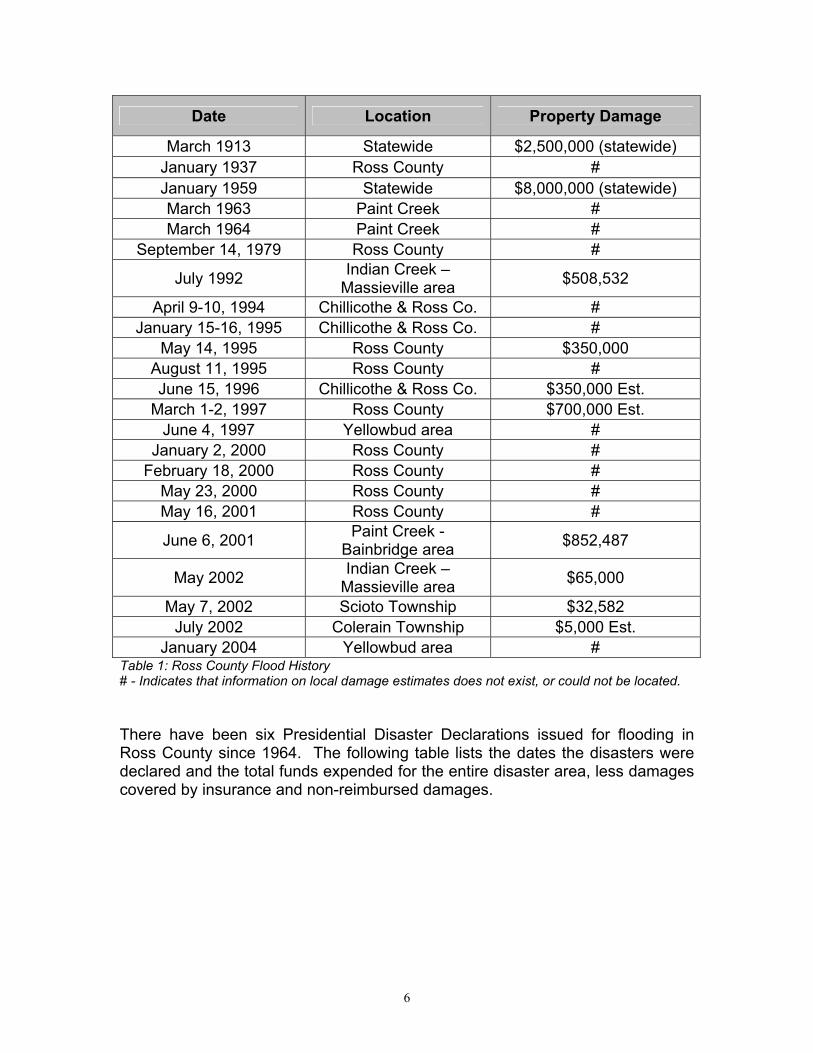
Date Location Property Damage
March 1913 Statewide $2,500,000 (statewide) January 1937 Ross County # January 1959 Statewide $8,000,000 (statewide) March 1963 Paint Creek # March 1964 Paint Creek #
September 14, 1979 Ross County #
July 1992 Indian Creek – Massieville area $508,532
April 9-10, 1994 Chillicothe & Ross Co. # January 15-16, 1995 Chillicothe & Ross Co. #
May 14, 1995 Ross County $350,000 August 11, 1995 Ross County # June 15, 1996 Chillicothe & Ross Co. $350,000 Est.
March 1-2, 1997 Ross County $700,000 Est. June 4, 1997 Yellowbud area #
January 2, 2000 Ross County # February 18, 2000 Ross County #
May 23, 2000 Ross County # May 16, 2001 Ross County #
June 6, 2001 Paint Creek - Bainbridge area $852,487
May 2002 Indian Creek – Massieville area $65,000
May 7, 2002 Scioto Township $32,582 July 2002 Colerain Township $5,000 Est.
January 2004 Yellowbud area # Table 1: Ross County Flood History # - Indicates that information on local damage estimates does not exist, or could not be located. There have been six Presidential Disaster Declarations issued for flooding in Ross County since 1964. The following table lists the dates the disasters were declared and the total funds expended for the entire disaster area, less damages covered by insurance and non-reimbursed damages.
6
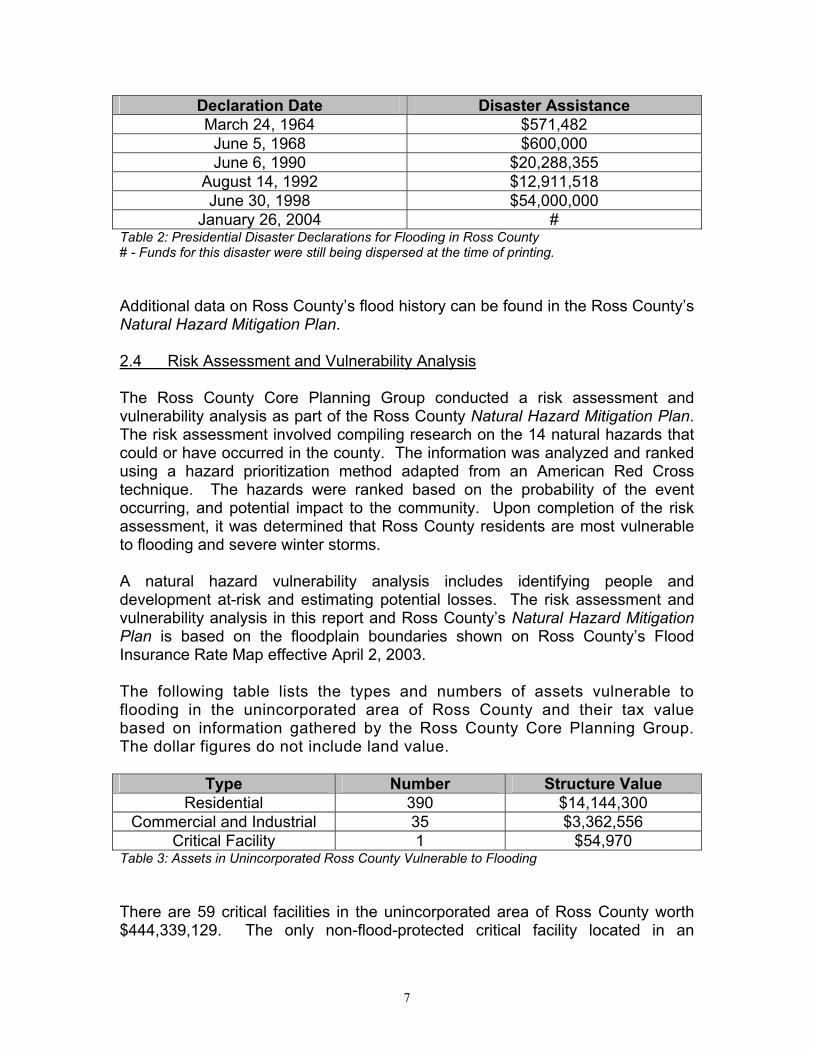
Declaration Date Disaster Assistance March 24, 1964 $571,482
June 5, 1968 $600,000 June 6, 1990 $20,288,355
August 14, 1992 $12,911,518 June 30, 1998 $54,000,000
January 26, 2004 # Table 2: Presidential Disaster Declarations for Flooding in Ross County # - Funds for this disaster were still being dispersed at the time of printing. Additional data on Ross County’s flood history can be found in the Ross County’s Natural Hazard Mitigation Plan. 2.4 Risk Assessment and Vulnerability Analysis The Ross County Core Planning Group conducted a risk assessment and vulnerability analysis as part of the Ross County Natural Hazard Mitigation Plan. The risk assessment involved compiling research on the 14 natural hazards that could or have occurred in the county. The information was analyzed and ranked using a hazard prioritization method adapted from an American Red Cross technique. The hazards were ranked based on the probability of the event occurring, and potential impact to the community. Upon completion of the risk assessment, it was determined that Ross County residents are most vulnerable to flooding and severe winter storms. A natural hazard vulnerability analysis includes identifying people and development at-risk and estimating potential losses. The risk assessment and vulnerability analysis in this report and Ross County’s Natural Hazard Mitigation Plan is based on the floodplain boundaries shown on Ross County’s Flood Insurance Rate Map effective April 2, 2003. The following table lists the types and numbers of assets vulnerable to flooding in the unincorporated area of Ross County and their tax value based on information gathered by the Ross County Core Planning Group. The dollar figures do not include land value.
Type Number Structure Value Residential 390 $14,144,300
Commercial and Industrial 35 $3,362,556 Critical Facility 1 $54,970
Table 3: Assets in Unincorporated Ross County Vulnerable to Flooding There are 59 critical facilities in the unincorporated area of Ross County worth $444,339,129. The only non-flood-protected critical facility located in an
7

identified flood hazard area is the Franklin Township Fire Station on Stoney Creek Road. The most developed floodplain areas are within the unincorporated areas of Ross County. The highest concentration of floodplain development is in the City of Chillicothe. The total population in Ross County is 73,345 according to cenus data taken in 2000. The total population in the unincorporated area of Ross County is 47,394. The population living in the floodplain is estimated to be 975.
8
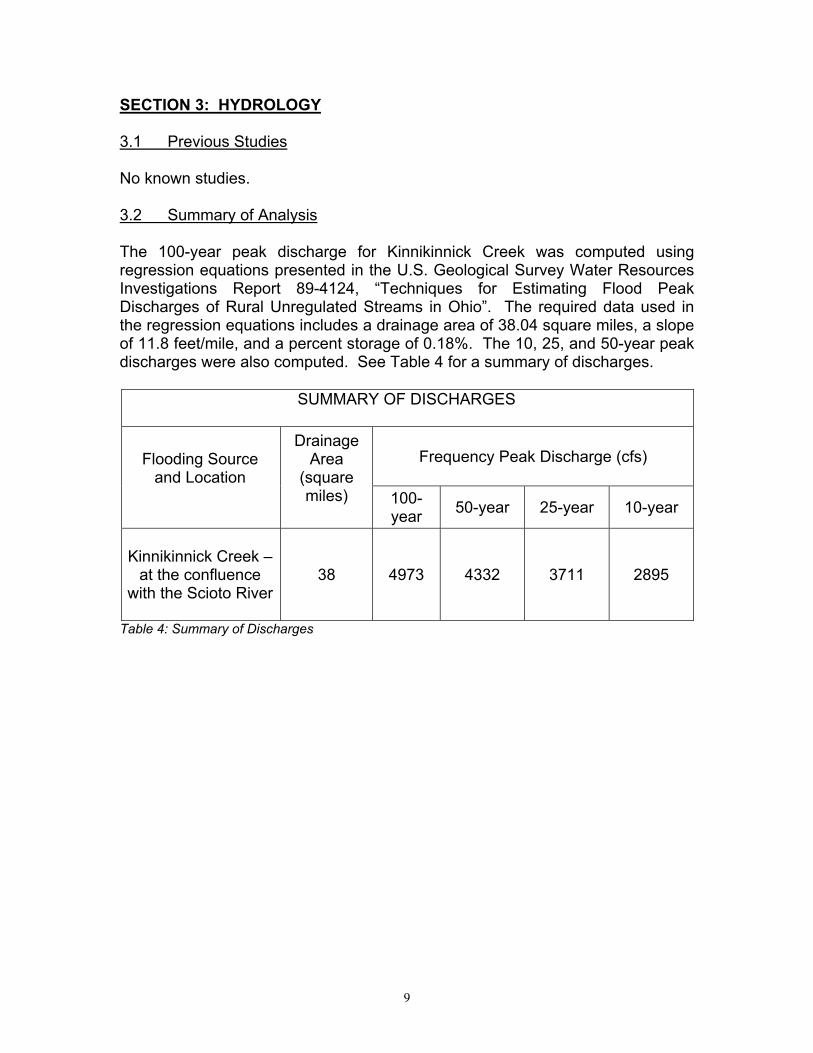
SECTION 3: HYDROLOGY 3.1 Previous Studies No known studies. 3.2 Summary of Analysis The 100-year peak discharge for Kinnikinnick Creek was computed using regression equations presented in the U.S. Geological Survey Water Resources Investigations Report 89-4124, “Techniques for Estimating Flood Peak Discharges of Rural Unregulated Streams in Ohio”. The required data used in the regression equations includes a drainage area of 38.04 square miles, a slope of 11.8 feet/mile, and a percent storage of 0.18%. The 10, 25, and 50-year peak discharges were also computed. See Table 4 for a summary of discharges.
SUMMARY OF DISCHARGES
Frequency Peak Discharge (cfs) Flooding Source and Location
Drainage Area
(square miles)
100-year 50-year 25-year 10-year
Kinnikinnick Creek –
at the confluence with the Scioto River
38 4973 4332 3711 2895
Table 4: Summary of Discharges
9

SECTION 4: HYDRAULICS 4.1 Previous Studies The Corps of Engineers had previously developed flood profiles for the 1, 2, 5, 10, 20, 50, 100, 200, 500, and 1000 year flood intervals for the Scioto River. These profiles were completed in 1988. 4.2 Summary of Analyses Hydraulic analysis of Kinnikinnick Creek was performed to determine the 100-year flood elevations as well as floodway elevations and extents. Cross section data and geometric data for bridges were obtained from field surveys. Locations of the cross sections are shown on the Flood Profile. Channel and overbank roughness coefficients used in the hydraulic computations were estimated by field inspection and use of aerial photographs of Kinnikinnick Creek and floodplain areas. Manning’s roughness coefficients were in the range of .03 to .045 for the channel and .03 to .15 for the overbanks. The Army Corps of Engineers step-backwater program, HEC-RAS, was used to develop the 100-year flood profile for Kinnikinnick Creek. The downstream starting water surface elevation used in the model for Kinnikinnick Creek was calculated using the normal depth equation. However, the controlling 100-year flood elevation at the downstream cross sections is due to backwater from the Scioto River. 4.3 Surveying and Mapping The best base mapping available for this study is the digital orthophoto quarter quadrangles and the USGS 7.5 minute quadrangle maps. No detailed mapping was available. Therefore, all of the cross sections used in the hydraulic analyses were field surveyed. Various additional surveyed points were obtained to aid in the floodplain delineation. An adjustment to the field survey points was performed using AutoDesk’s AutoCAD program to rectify the points to straight cut-lines perpendicular to the floodplain before importing the data into the HEC-RAS model. A custom GIS application designed for the Division of Water was used to import the cross sections into HEC-RAS.
10

REFERENCES Chow, Ven Te, David R. Maidment, and Larry W. Mays, Applied Hydrology, McGraw-Hill, New York, 1988. Ross County Core Planning Group, Natural Hazard Mitigation Plan, December 2003. Schmidlin, Thomas W. and Jeanne Applehans, Thunder in the Heartland A Chronicle of Outstanding Weather Events in Ohio, 1996. U.S. Army Corps of Engineers, HEC-RAS River Analysis System Hydraulic Reference Manual, User’s Manual, and Applications Guide, Hydrologic Engineering Center, 1998. U.S. Army Corps of Engineers, HEC-GeoRAS An Application for Support of HEC-RAS using ARC/INFO version 3.0, Hydrologic Engineering Center, 2000. U.S. Geological Survey Water Resources Investigations Report 89-4124, “Techniques for Estimating Flood Peak Discharges of Rural Unregulated Streams in Ohio”, 1990.
11

FLOODING SOURCE FLOODWAY BASE FLOOD WATER SURFACE ELEVATION
CROSS SECTION DISTANCE1 WIDTH (FEET)
SECTION AREA
(SQ.FEET)
MEAN VELOCITY
(FEET/SEC)
CONTROLLING (FEET NAVD)
WITHOUT FLOODWAY (FEET NAVD)
WITH FLOODWAY (FEET NAVD)
INCREASE3 (FEET)
Kinnikinnick Creek
A 1984 112 856 5.8 645.42 643.0 643.1 0.2B 2659 733 4135 1.2 645.42 643.7 644.1 0.4C 3305 408 1708 2.9 645.42 643.8 644.3 0.5D 3910 371 1211 4.1 645.42 644.2 644.9 0.7E 4933 149 727 6.8 647.4 647.4 648.0 0.6F 5547 311 1379 3.6 649.1 649.1 650.1 1.0G 6400 78 593 8.4 650.7 650.7 651.4 0.7H 7093 274 1125 4.4 653.5 653.5 654.2 0.7I 7869 372 1439 3.5 655.4 655.4 656.3 0.9J 8647 290 1072 4.6 657.7 657.7 658.1 0.4K 9512 77 577 8.6 660.3 660.3 660.6 0.2L 10365 140 895 5.6 663.0 663.0 663.7 0.7M 10676 72 513 9.7 663.4 663.4 664.0 0.6N 10801 100 714 6.9 664.9 664.9 665.4 0.5O 11169 207 1150 4.3 666.2 666.2 666.6 0.4
Notes: 1. Feet above mouth. 2. Backwater from the Scioto River is the controlling water surface elevation at these sections. 3. Values represent results calculated prior to rounding water surface elevation figures.
FLOODWAY DATA TAB
LE 5
ROSS COUNTY, OHIO KINNIKINNICK CREEK