Embed Size (px)
Citation preview

AFTER PARISINEQUALITY, FAIR SHARES, AND THE CLIMATE EMERGENCY
DECEMBER 2018
SIGNATORIES
INTERNATIONAL
•••••••••••••••••••••••••
REGIONAL
•
••
•
•
•••••
••••
••
AFRICA
••••
••
•
•
•
•••
•••
ASIA
•••••
•
•
•
•••••••••
••••••
••
•
•
••••••
•••••••
•••••••••
••••
•••••••
••
••
•
•••
••••
•••••
••••••
EUROPE
•••
••
••••
••••••
••
•••••
•
LATIN AMERICA
•••••
•
NORTH AMERICA
••••
••
•••••
••
••••••••••••••••••••••
•
•••
OCEANIA
•
••
•••
INTRODUCTION
Civil Society Equity Review
between within
A NEW CONTEXT: RESPONDING TO THE IPCC 1.5°C REPORT
Special Report on Global Warming of 1.5°C
Equity is not a moral or academic nicety, but a practical necessity
in meeting the Paris goals. “ ”
specific
•�
•�Summary for Policymakers
•�
Summaries for Policymakers
EQUITY AND AMBITION
Why is equity necessary?
mean
Equity among nations and among individuals6
inequity among countriesinequality
It is not enough for national pledges to be based on climate science; they must also be fair.
“ ”
among individuals
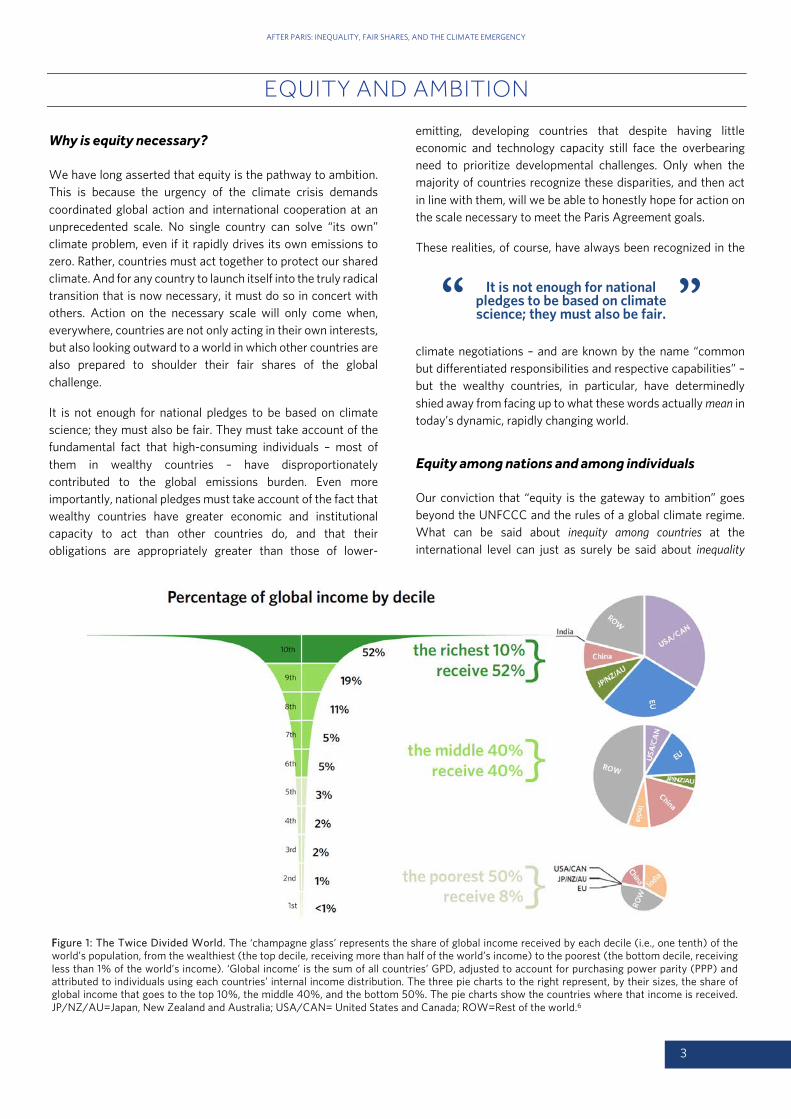
more than half

New York Times
THE LOW ENERGY DEMAND 1.5°C PATHWAY
EQUITY BETWEEN COUNTRIES: THE FAIR SHARE
ASSESSMENT OF NDCs
Civil Society Equity Review

Selected national pledges, against three benchmarks
For these countries, their fair share of the global effort can only be met by enabling mitigation in other countries.
additional mitigation beyond their fair shares
Mitigation Finance
BBOX 2: EQUITY SETTINGS EXPLAINED
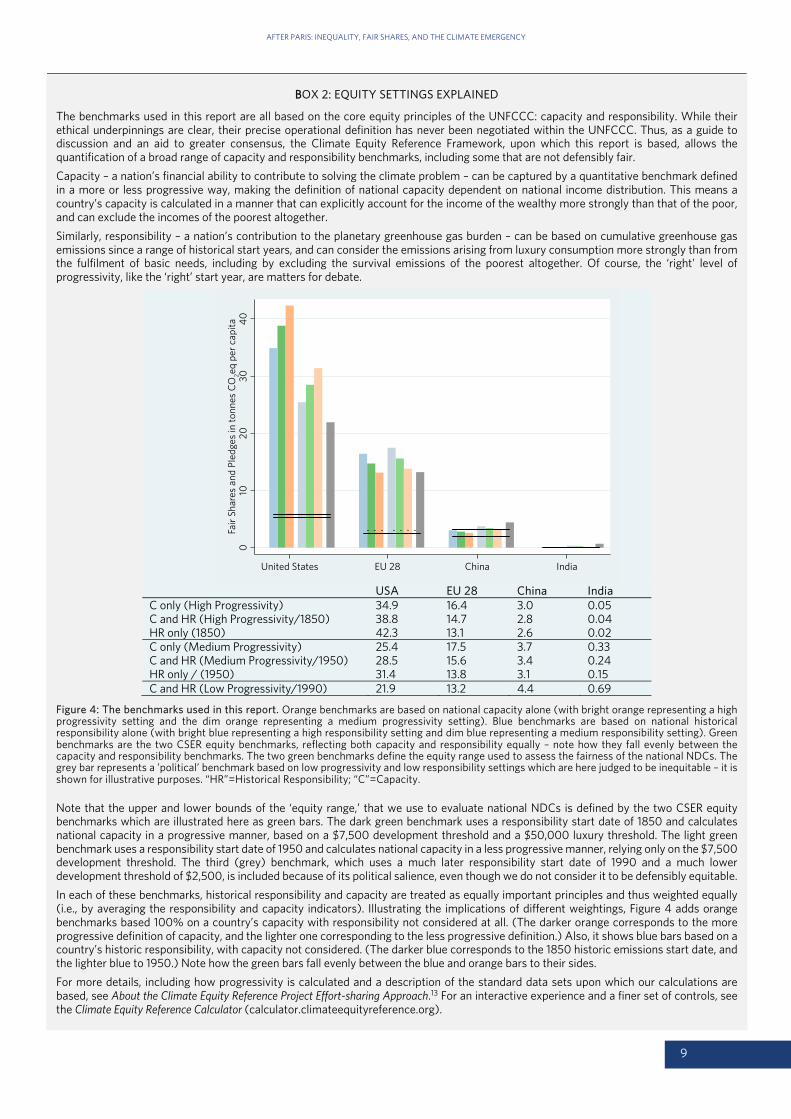
The benchmarks used in this report are all based on the core equity principles of the UNFCCC: capacity and responsibility. While their ethical underpinnings are clear, their precise operational definition has never been negotiated within the UNFCCC. Thus, as a guide to discussion and an aid to greater consensus, the Climate Equity Reference Framework, upon which this report is based, allows the quantification of a broad range of capacity and responsibility benchmarks, including some that are not defensibly fair.
Capacity – a nation’s financial ability to contribute to solving the climate problem – can be captured by a quantitative benchmark defined in a more or less progressive way, making the definition of national capacity dependent on national income distribution. This means a country’s capacity is calculated in a manner that can explicitly account for the income of the wealthy more strongly than that of the poor, and can exclude the incomes of the poorest altogether.
Similarly, responsibility – a nation’s contribution to the planetary greenhouse gas burden – can be based on cumulative greenhouse gas emissions since a range of historical start years, and can consider the emissions arising from luxury consumption more strongly than from the fulfilment of basic needs, including by excluding the survival emissions of the poorest altogether. Of course, the ‘right’ level of progressivity, like the ‘right’ start year, are matters for debate.
USA EU 28 China India C only (High Progressivity) 34.9 16.4 3.0 0.05 C and HR (High Progressivity/1850) 38.8 14.7 2.8 0.04 HR only (1850) 42.3 13.1 2.6 0.02 C only (Medium Progressivity) 25.4 17.5 3.7 0.33 C and HR (Medium Progressivity/1950) 28.5 15.6 3.4 0.24 HR only / (1950) 31.4 13.8 3.1 0.15 C and HR (Low Progressivity/1990) 21.9 13.2 4.4 0.69
Figure 4: The benchmarks used in this report. Orange benchmarks are based on national capacity alone (with bright orange representing a high progressivity setting and the dim orange representing a medium progressivity setting). Blue benchmarks are based on national historical responsibility alone (with bright blue representing a high responsibility setting and dim blue representing a medium responsibility setting). Green benchmarks are the two CSER equity benchmarks, reflecting both capacity and responsibility equally – note how they fall evenly between the capacity and responsibility benchmarks. The two green benchmarks define the equity range used to assess the fairness of the national NDCs. The grey bar represents a ’political’ benchmark based on low progressivity and low responsibility settings which are here judged to be inequitable – it is shown for illustrative purposes. “HR”=Historical Responsibility; “C”=Capacity.
Note that the upper and lower bounds of the ‘equity range,’ that we use to evaluate national NDCs is defined by the two CSER equity benchmarks which are illustrated here as green bars. The dark green benchmark uses a responsibility start date of 1850 and calculates national capacity in a progressive manner, based on a $7,500 development threshold and a $50,000 luxury threshold. The light green benchmark uses a responsibility start date of 1950 and calculates national capacity in a less progressive manner, relying only on the $7,500 development threshold. The third (grey) benchmark, which uses a much later responsibility start date of 1990 and a much lower development threshold of $2,500, is included because of its political salience, even though we do not consider it to be defensibly equitable.
In each of these benchmarks, historical responsibility and capacity are treated as equally important principles and thus weighted equally (i.e., by averaging the responsibility and capacity indicators). Illustrating the implications of different weightings, Figure 4 adds orange benchmarks based 100% on a country’s capacity with responsibility not considered at all. (The darker orange corresponds to the more progressive definition of capacity, and the lighter one corresponding to the less progressive definition.) Also, it shows blue bars based on a country’s historic responsibility, with capacity not considered. (The darker blue corresponds to the 1850 historic emissions start date, and the lighter blue to 1950.) Note how the green bars fall evenly between the blue and orange bars to their sides.
For more details, including how progressivity is calculated and a description of the standard data sets upon which our calculations are based, see About the Climate Equity Reference Project Effort-sharing Approach.13 For an interactive experience and a finer set of controls, see the Climate Equity Reference Calculator (calculator.climateequityreference.org).
010
2030
40
Fair
Sha
res
and
Pled
ges
in to
nnes
CO
2eq p
er c
apita
United States EU 28 China India
EQUITY WITHIN COUNTRIES Equity Settings Explained
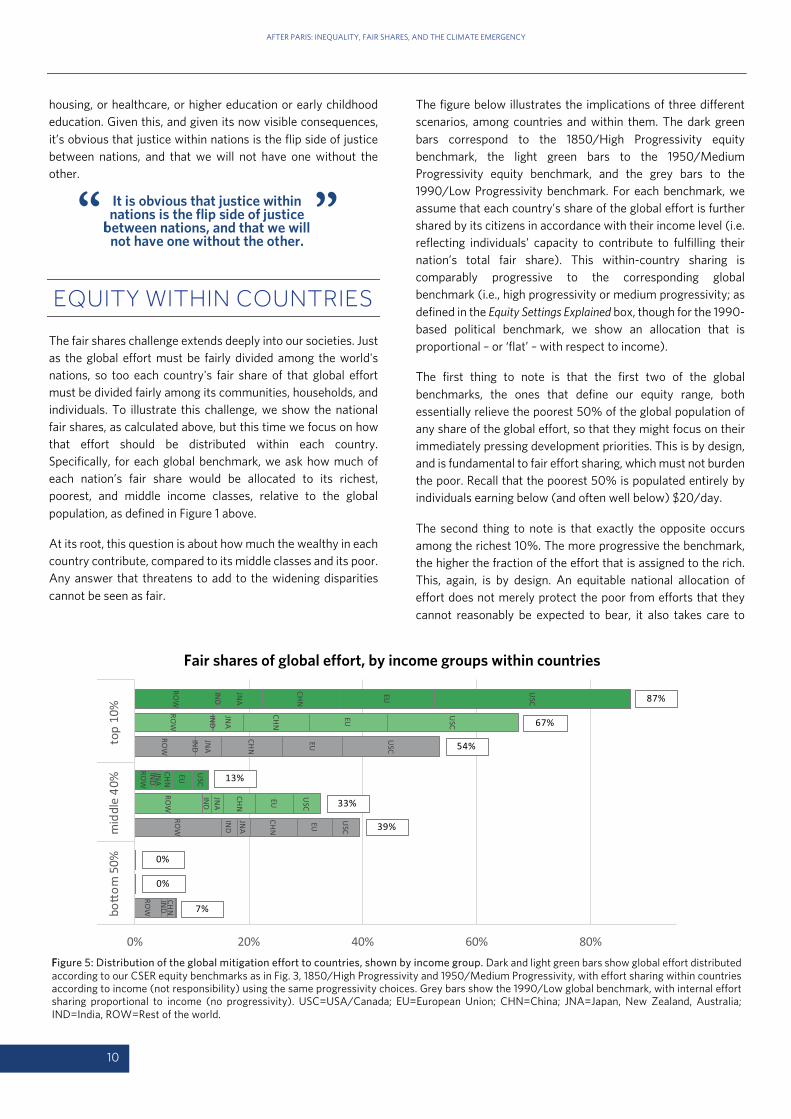
Fair shares of global effort, by income groups within countries
It is obvious that justice within nations is the flip side of justice
between nations, and that we will not have one without the other.
“ ”
IMPLICATIONS AND RECOMMENDATIONS
•
• quantified
•

•
•
�
CONCLUSION
�
ABOUT THE CIVIL SOCIETY EQUITY REVIEW GROUP
ONLINE METHODOLOGY APPENDIX
The greatest effort of the climate transition must ultimately be borne by the people who have the wealth, and this has to be true both
within countries and between them.
“ ”
APPENDIX: THE IPCC 1.5°C REPORT ON EQUITY. SOME QUOTES FROM THE SUMMARY FOR POLICYMAKERS
�
Global Warming of 1.5°C, n IPCC special report on the impacts of global warming of 1.5°C above pre-industrial levels and related global greenhouse gas emission pathways, in the context of strengthening the global response to the threat of climate change, sustainable development, and efforts to eradicate poverty
// / /
Nature Energy // / /
Proceedings of the National Academy of Sciences of the United States of America // / /
Climate Code Red// / / /
What lies beneath? The scientific understatement of climate risks
// / /
//
World Income Inequality Database
// / /
Calculations for the Climate Equity Reference Calculator (CERc)
// / /
“Extreme Carbon Inequality// / / / /
/
The New York Times// / / / / / /
Aggregate Effect of the Intended Nationally Determined Contributions: An Update. Synthesis Report by the Secretariat. // / / / /
/ /
ENDNOTES

// /
// /
Global Warming of 1.5°C // /
Carbon and inequality: from Kyoto to Paris, a paper published by
// / /
/// // /
Collapse: How Societies Choose to Fail or Succee
wwww.civilsocietyreview.org