Embed Size (px)
Citation preview
May 19, 2014 1
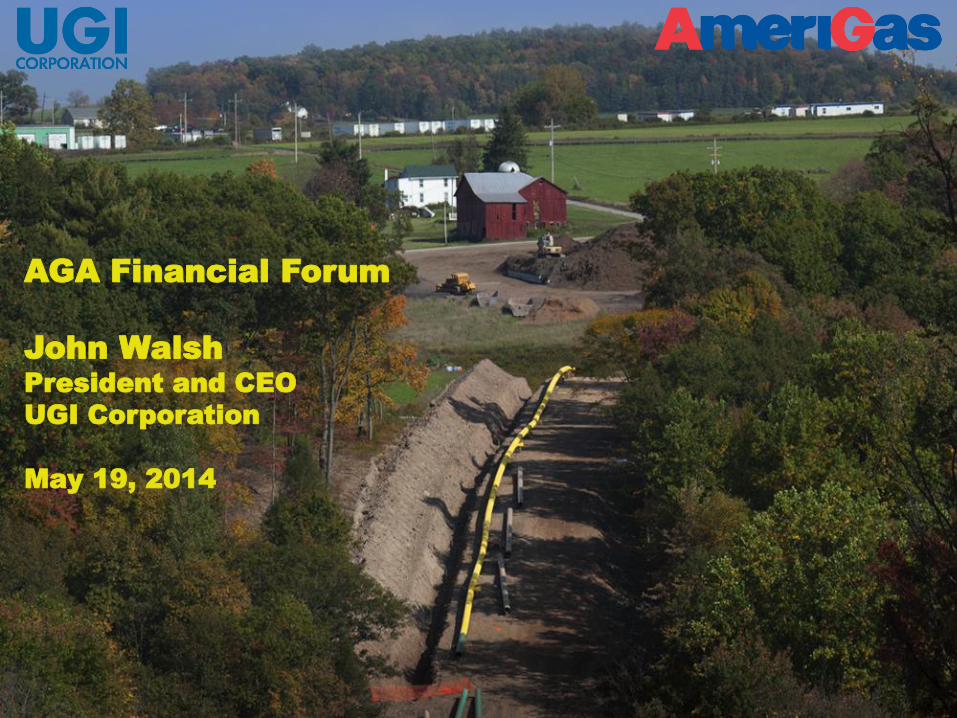
AGA Financial Forum
John Walsh
President and CEO
UGI Corporation
May 19, 2014

May 19, 2014 2
This presentation contains certain forward-looking statements that management
believes to be reasonable as of today’s date only. Actual results may differ
significantly because of risks and uncertainties that are difficult to predict and many
of which are beyond management’s control. You should read UGI’s Annual Report on
Form 10-K and quarterly reports on Form 10-Q for a more extensive list of factors
that could affect results. Among them are adverse weather conditions, cost volatility
and availability of all energy products, including propane, natural gas, electricity and
fuel oil, increased customer conservation measures, the impact of pending and
future legal proceedings, domestic and international political, regulatory and
economic conditions including currency exchange rate fluctuations (particularly the
euro), the timing of development of Marcellus Shale gas production, the timing and
success of our commercial initiatives and investments to grow our business, and our
ability to successfully integrate acquired businesses, and achieve anticipated
synergies. UGI undertakes no obligation to release revisions to its forward-looking
statements to reflect events or circumstances occurring after today.
About This Presentation

May 19, 2014 3May 19, 2014
Introduction
UGI Corporation
John Walsh President and CEO
Kirk Oliver CFO
Dan Platt Treasurer
Simon Bowman Manager, Investor Relations and Treasury
UGI Utilities
Robert Beard President and CEO

May 19, 2014 4May 19, 2014
UGI Corporation (NYSE: UGI) is a distributor and marketer of energy products
and services including natural gas, propane, butane, and electricity.
About UGI Corporation
*100% GP interest and 25% of outstanding LP units
Domestic Propane
(NYSE: APU*)UGI International UGI Utilities
Midstream &
Marketing
AmeriGas also operates in
Hawaii and Alaska

May 19, 2014 5May 19, 2014
Commitment to Investors
Cash flow
$250 MM-$290 MM*
Organic investment and M&A1
$125 MM-$150 MM*
Incremental earnings growth
3-6%
Dividends
$125 MM-
$140 MM*
6-10% annual earnings growth
4% annual dividend growth
*multi-year average forecast1 after business unit CAPEX
Base business earnings growth
3-4%
May 19, 2014 6May 19, 2014
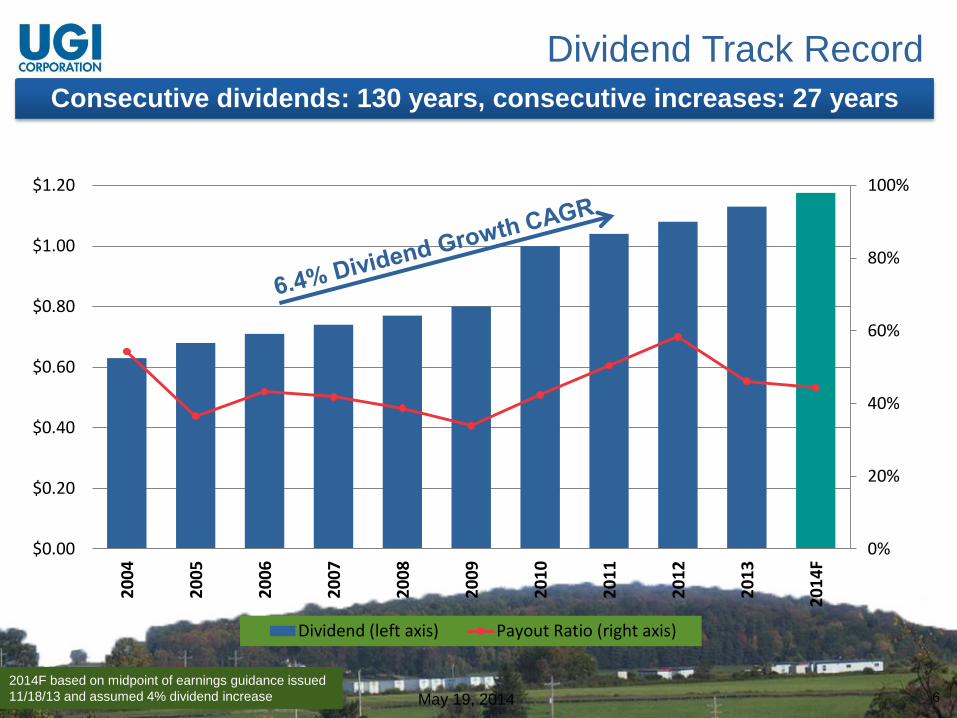
Consecutive dividends: 130 years, consecutive increases: 27 years
Dividend Track Record
0%
20%
40%
60%
80%
100%
$0.00
$0.20
$0.40
$0.60
$0.80
$1.00
$1.20
20
04
20
05
20
06
20
07
20
08
20
09
20
10
20
11
20
12
20
13
20
14
F
Dividend (left axis) Payout Ratio (right axis)
2014F based on midpoint of earnings guidance issued
11/18/13 and assumed 4% dividend increase

May 19, 2014 7May 19, 2014
Total Shareholder Return Through 3/31/14
0.0%
8.0%
16.0%
24.0%
UGI S&P 500 S&P 500Utilities
S&P 400Midcap
1 Year Total Return
0.0%
4.0%
8.0%
12.0%
16.0%
UGI S&P 500 S&P 500Utilities
S&P 400Midcap
3 Year Total Return
0.0%
4.0%
8.0%
12.0%
16.0%
20.0%
24.0%
28.0%
UGI S&P 500 S&P 500Utilities
S&P 400Midcap
5 Year Total Return
0.0%
4.0%
8.0%
12.0%
16.0%
UGI S&P 500 S&P 500Utilities
S&P 400Midcap
10 Year Total Return
0.0%
4.0%
8.0%
12.0%
16.0%
20.0%
UGI S&P 500 S&P 500Utilities
S&P 400Midcap
15 Year Total Return
0.0%
4.0%
8.0%
12.0%
16.0%
UGI S&P 500 S&P 500Utilities
S&P 400Midcap
20 Year Total Return

May 19, 2014 8
Business Unit Overview

May 19, 2014 9May 19, 2014
UGI Utilities: Overview
Pennsylvania’s 2nd largest gas utility
46 of the 67 PA counties served
~ 13,000 miles of main
~ 600,000 gas customers
~ 62,000 electric customers

May 19, 2014 10May 19, 2014
UGI Utilities: Growth Initiatives
Attractive and growing service area
-
2,000
4,000
6,000
8,000
10,000
12,000
14,000
16,000
1995 1996 1997 1998 1999 2000 2001 2002 2003 2004 2005 2006 2007 2008 2009 2010 2011 2012 2013
Total Residential Customer Additions
Residential New Homes Residential Conversions Residential Upgrades
>250,000 potential customers within close proximity to UGI’s mains

May 19, 2014 11May 19, 2014
UGI Utilities: Services
Infrastructure replacement
• All cast iron main replaced by 2027 and all bare steel by
2043
Distribution System Improvement Charge (DSIC)
• DSIC approved in 2012 provides a quarterly surcharge to
recover cost of infrastructure updates
Committed to serving customers in Pennsylvania

May 19, 2014 12May 19, 2014
UGI Utilities: Services
GET Gas program: Improving accessibility of natural gas
• Innovative way to make natural gas available to more
Pennsylvanians
• Program utilizes a standard 10-year repayment period
designed to reach unserved or underserved areas
Committed to serving customers in Pennsylvania

May 19, 2014 13
Business Unit Overview

May 19, 2014 14May 19, 2014
15% market share*
> 1 billion gallons sold
> 47,000 ACE distribution points
8,500 employees
> 2,500 Distributionlocations
> 100 brands
AmeriGas: Overview
Largest player in a fragmented industry
Goal: 3-4% EBITDA growth, 5% distribution growth annually
* Source: LP Gas magazine
May 19, 2014 15May 19, 2014
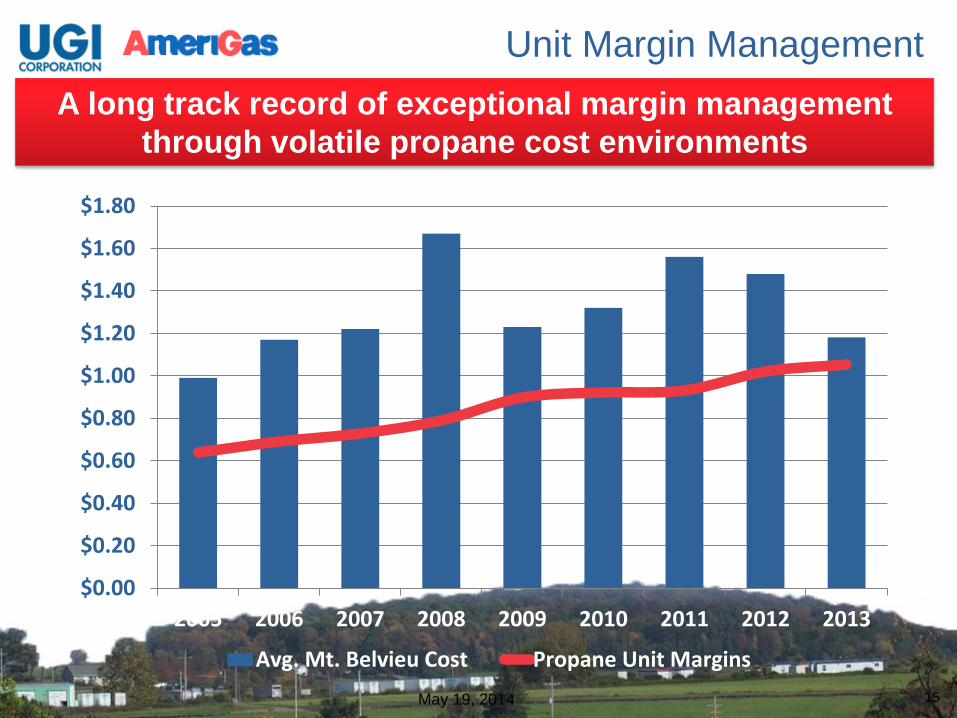
Unit Margin Management
A long track record of exceptional margin management
through volatile propane cost environments
$0.00
$0.20
$0.40
$0.60
$0.80
$1.00
$1.20
$1.40
$1.60
$1.80
2005 2006 2007 2008 2009 2010 2011 2012 2013
Avg. Mt. Belvieu Cost Propane Unit Margins
May 19, 2014 16May 19, 2014
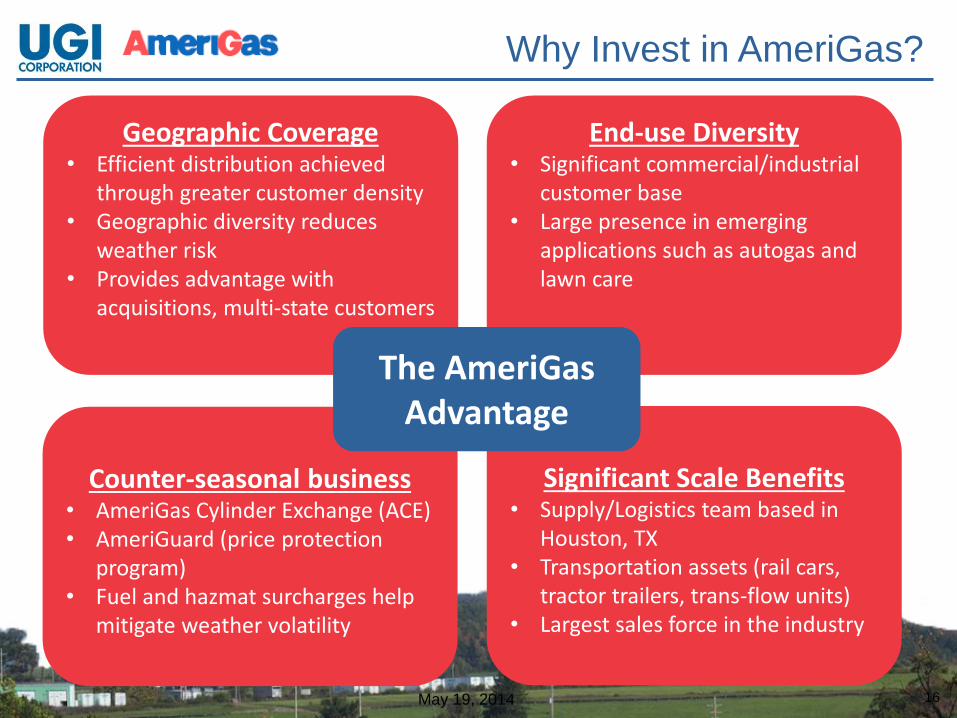
Why Invest in AmeriGas?
Geographic Coverage• Efficient distribution achieved
through greater customer density• Geographic diversity reduces
weather risk• Provides advantage with
acquisitions, multi-state customers
Significant Scale Benefits• Supply/Logistics team based in
Houston, TX• Transportation assets (rail cars,
tractor trailers, trans-flow units)• Largest sales force in the industry
Counter-seasonal business• AmeriGas Cylinder Exchange (ACE)• AmeriGuard (price protection
program)• Fuel and hazmat surcharges help
mitigate weather volatility
End-use Diversity• Significant commercial/industrial
customer base• Large presence in emerging
applications such as autogas and lawn care
The AmeriGas Advantage

May 19, 2014 17May 19, 2014
AmeriGas: Growth Initiatives
3 Key Strategic Growth Initiatives
Description Size Growth Contribution
AmeriGas Cylinder
Exchange (ACE)
Counter-seasonal summer grilling tank exchange
< 10% of AmeriGas
EBITDA
4-6% Expected annual EBITDA growth
National Accounts
Utilizes nationwide footprint to serve commercial
customers in multiple locations
< 5% of AmeriGas
EBITDA4-6% Expected annual
EBITDA growth
Acquisitions
Nationwide footprint provides for highly
synergistic, immediately accretive acquisition
opportunities
Varies~ 3% Expected annual
EBITDA growth

May 19, 2014 18
Business Unit Overview
May 19, 2014 19May 19, 2014
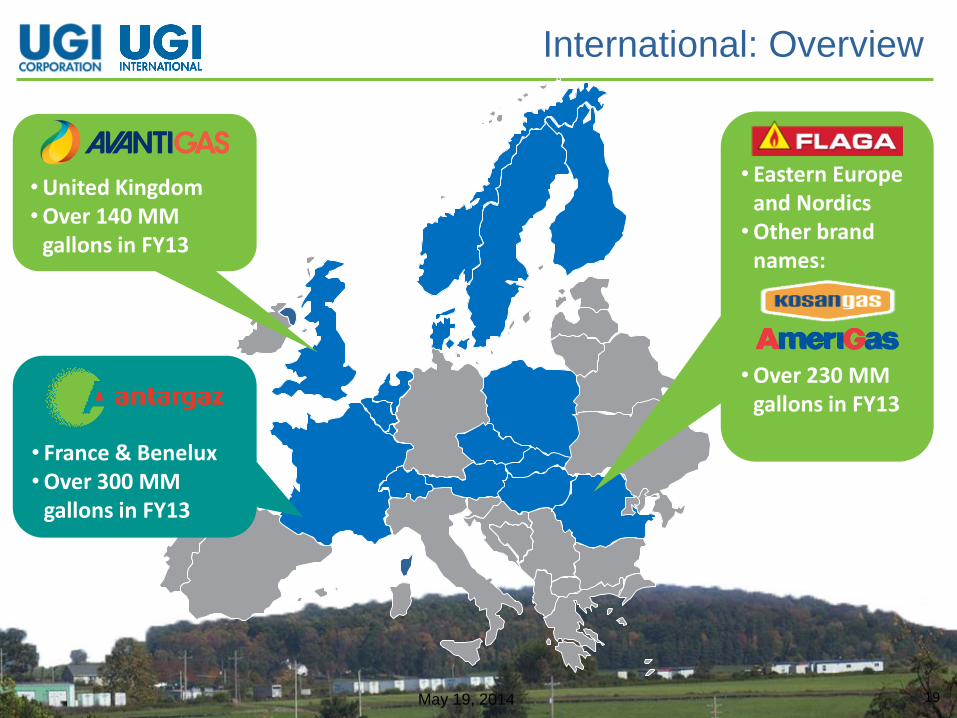
International: Overview
• United Kingdom• Over 140 MM
gallons in FY13
• Eastern Europe and Nordics
• Other brand names:
• Over 230 MM gallons in FY13
• France & Benelux• Over 300 MM
gallons in FY13

May 19, 2014 20May 19, 2014
200 €
300 €
400 €
500 €
600 €
700 €
200 €
300 €
400 €
500 €
600 €
700 €
2005 2006 2007 2008 2009 2010 2011 2012 2013
Avg. Platt's Cost Propane Unit Margins
LP
G U
nit
Ma
rgin
s
(€/T
)
Avg
. Pla
tt’s C
os
t (€/T
)
Antargaz Margin History
Unit Margin Management
$0.20
$0.60
$1.00
$1.40
$1.80
$0.20
$0.60
$1.00
$1.40
$1.80
2005 2006 2007 2008 2009 2010 2011 2012 2013Avg. Mt. Belvieu Cost Propane Unit Margins
Pro
pa
ne
Un
it
Ma
rgin
s (
$/g
all
on
) Avg
. Mt. B
elv
ieu
Co
st
AmeriGas Margin History
Exceptional unit margin management through volatile periods

May 19, 2014 21May 19, 2014
Austria
HungaryDenmark
PolandCzech
RepublicRomania
Switzerland
SlovakiaFinland
Sweden
Norway
UKFrance
Benelux
EBITDA Contribution
FY08 EBITDA: €104 MM
FY13 EBITDA: €171 MM *
Increased diversification through acquisitions and integration
* Updated 7/1/2014

May 19, 2014 22May 19, 2014
International: Growth Initiatives
Both acquisition and organic growth opportunities
Organic Growth Opportunities
• Natural gas marketing (France)
• Heating oil to LPG conversions (Nordics)
• Residential customer growth (Poland)
• Strategic partnerships (UK)
Acquisition Opportunities
• Bolt-on acquisitions in Eastern Europe and the UK
• Greenfield expansion in Western Europe
• Natural gas marketing in Western Europe

May 19, 2014 23
Business Unit Overview

May 19, 2014 24May 19, 2014
Midstream & Marketing: Overview
Marketing
Natural Gas
• ~ 100 Bcf
• > 30,000 locations
• 36 LDCs
Power
• > 2 MM MWhrs
• > 10,000 locations
• 20 EDCs
Midstream
Pipelines/Gathering
• Auburn System
Storage (15 Bcf)
• Meeker & Tioga – 14 Bcf• Wharton – 1 Bcf
Peaking• Temple (1.25 Bcf LNG
storage capacity)
• Propane Air (0.40 Bcfcapacity in 6 plants)
Generation
• Hunlock: 130 MWs combined cycle
• Conemaugh: 102 MWs coal-fired
• Renewable energy: ~ 17 MWs

May 19, 2014 25May 19, 2014
Marketing and Generation
Marketing
Strategy: Target small and medium-size businesses that value our services (hedging, management of energy requirements)
• Little commodity exposure
• Excellent sales team
• No speculative trading
• Very high customer retention
Generation
Generation assets provide balancing support for power marketing business and reduce supplier credit
• Former utility plants that have been expanded
• Not expected to be a significant source of earnings going forward
May 19, 2014 26May 19, 2014
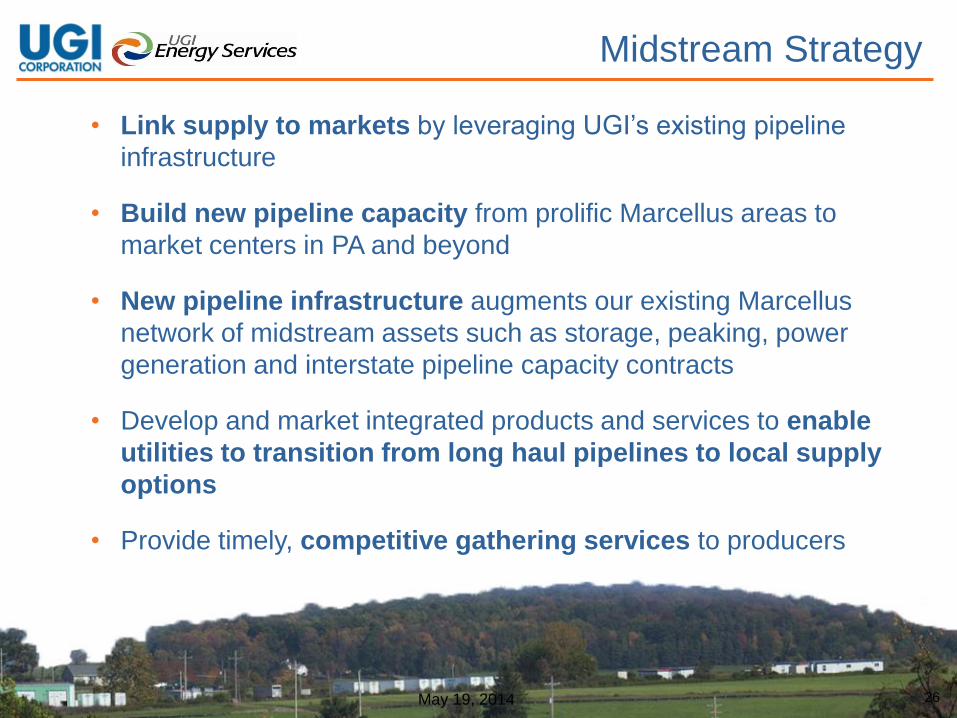
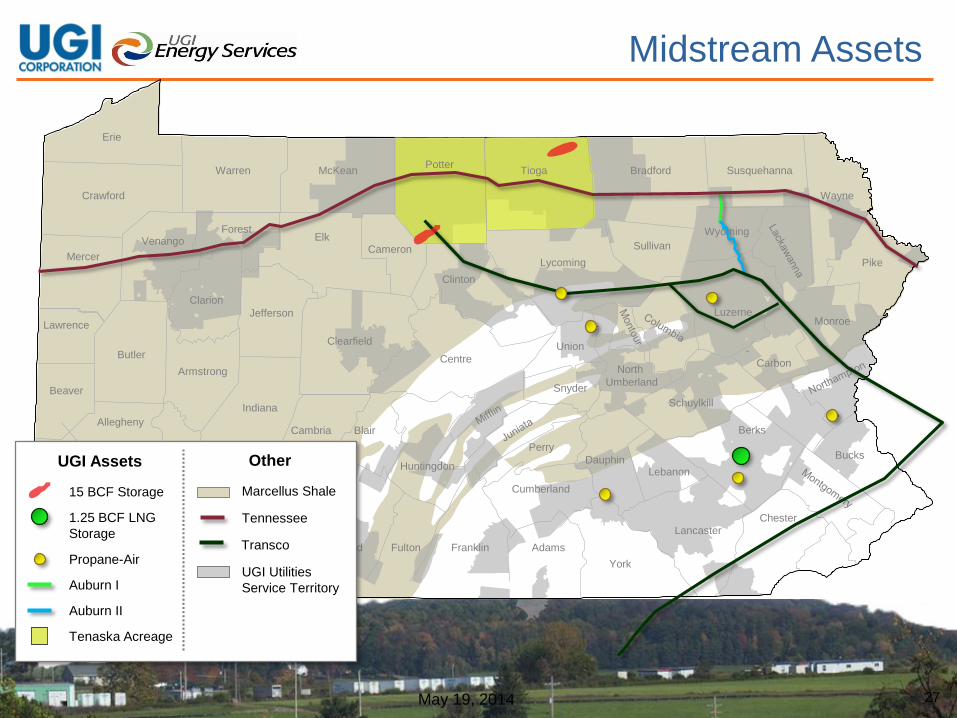
• Link supply to markets by leveraging UGI’s existing pipeline
infrastructure
• Build new pipeline capacity from prolific Marcellus areas to
market centers in PA and beyond
• New pipeline infrastructure augments our existing Marcellus
network of midstream assets such as storage, peaking, power
generation and interstate pipeline capacity contracts
• Develop and market integrated products and services to enable
utilities to transition from long haul pipelines to local supply
options
• Provide timely, competitive gathering services to producers
Midstream Strategy
May 19, 2014 27May 19, 2014
Erie
Crawford
Warren McKean Bradford Susquehanna
Wayne
Pike
Monroe
Bucks
Chester
Lancaster
York
AdamsFranklinFultonBedfordSomersetFayetteGreene
Washington
Beaver
Lawrence
Mercer
VenangoForest
ElkCameron
Clinton
Lycoming
Sullivan
Luzerne
Carbon
Schuylkill
Berks
LebanonDauphin
Cumberland
Perry
Huntingdon
BlairCambria
Westmoreland
Allegheny
Butler
Armstrong
Indiana
Clarion
Jefferson
Clearfield
Centre
Union
Snyder
North
Umberland
Wyoming
PotterTioga
Midstream Assets
15 BCF Storage
1.25 BCF LNG
Storage
Propane-Air
Marcellus Shale
Auburn I
Auburn II
Tennessee
Transco
Tenaska Acreage
UGI Utilities
Service Territory
UGI Assets Other

May 19, 2014 28May 19, 2014
Auburn Gathering System
• Auburn I: 9-mile 12” pipeline
running from Tennessee Pipeline to
Wyoming County (aqua)
• Auburn II: 28-mile 20” pipeline
running from Wyoming County to
Transco (green)
• Total current investment: > $160
million
• Shippers include Citrus, Cabot, and
UGI PNG
• Announced phase III expansion
on May 6, 2014
Midstream Assets

May 19, 2014 29May 19, 2014
New Midstream Projects
Auburn III
• Two phases:
• Additional compression at
Manning Compressor Station
• 9-mile 24” loop of Auburn I
• Auburn Gathering System capacity
expanded by 200,000 Dth/d to
470,000 Dth/d by fall 2015
• Brings total investment in
Auburn Gathering System to
~ $230 million
• Supported by long-term
agreements
Union Dale Lateral
• 6-mile 12” pipeline to move locally-
produced natural gas to UGI PNG,
one of UGI’s utilities
• Capable of moving up to 100,000
Dth/d by fall of 2014
• Shippers include Cabot and UGI PNG
• Supported by long-term agreements
Auburn Loop
Union Dale Lateral
Auburn II
May 19, 2014 30
In conclusion

May 19, 2014 31May 19, 2014
Why Invest in UGI?
Significant Cash Generation Diversification
Growth and Income Strong Track Record
UGI generates over $125 million of free cash flow annually for reinvestment
This is after satisfying all subsidiaries’ debt service, ongoing capex, and paying our dividend
UGI provides diversified exposure to• Commodities• Geographies
While benefiting from the common operating attributes our businesses share. This Diversification = less risk, diversified income / cash flow, & multiple capital reinvestment opportunities
UGI is a balanced growth and income investment
We are committed to delivering 6% to 10% EPS growth and 4% annual dividend growth
UGI has a strong track record of meeting or exceeding our commitments:• 130 years of uninterrupted dividends• 27 years of consecutive dividend increases• Exceptional EPS and dividend growth history• Successful capital reinvestment
• Customer Segments• Supply Chain
4 Reasons to Invest in UGI:
May 19, 2014 32May 19, 2014
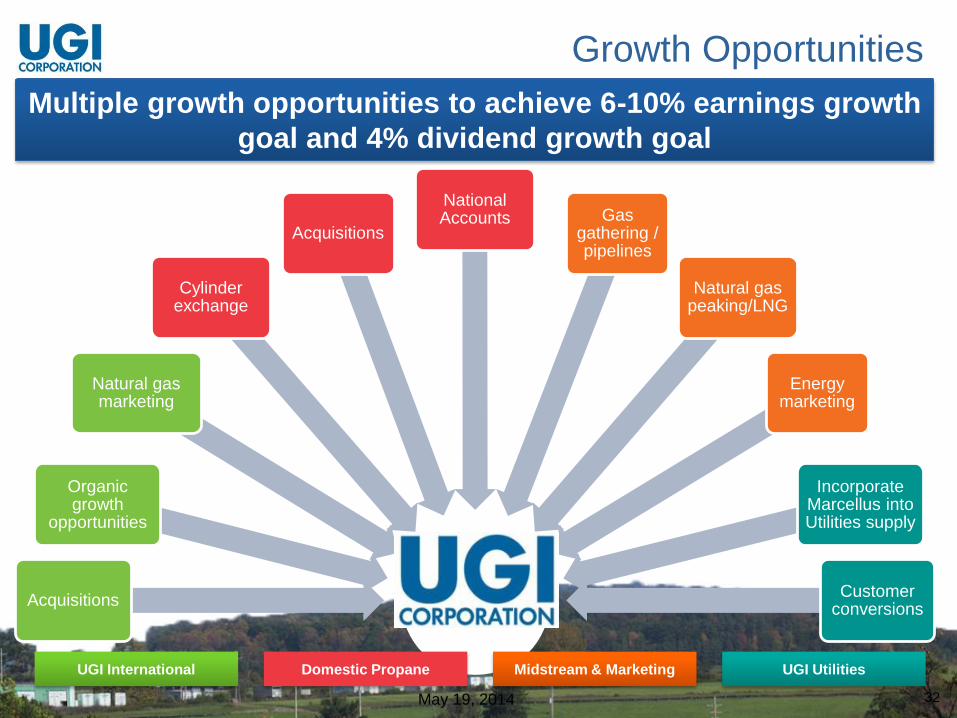
Growth Opportunities
UGI CorpAcquisitions
Organic growth
opportunities
Natural gas marketing
Cylinder exchange
Acquisitions
National Accounts Gas
gathering / pipelines
Natural gas peaking/LNG
Energy marketing
Incorporate Marcellus into Utilities supply
Customer conversions
Domestic PropaneUGI International UGI UtilitiesMidstream & Marketing
Multiple growth opportunities to achieve 6-10% earnings growth
goal and 4% dividend growth goal

May 19, 2014 33May 19, 2014
Total Shareholder Return Through 3/31/14
0.0%
8.0%
16.0%
24.0%
UGI S&P 500 S&P 500Utilities
S&P 400Midcap
1 Year Total Return
0.0%
4.0%
8.0%
12.0%
16.0%
UGI S&P 500 S&P 500Utilities
S&P 400Midcap
3 Year Total Return
0.0%
4.0%
8.0%
12.0%
16.0%
20.0%
24.0%
28.0%
UGI S&P 500 S&P 500Utilities
S&P 400Midcap
5 Year Total Return
0.0%
4.0%
8.0%
12.0%
16.0%
UGI S&P 500 S&P 500Utilities
S&P 400Midcap
10 Year Total Return
0.0%
4.0%
8.0%
12.0%
16.0%
20.0%
UGI S&P 500 S&P 500Utilities
S&P 400Midcap
15 Year Total Return
0.0%
4.0%
8.0%
12.0%
16.0%
UGI S&P 500 S&P 500Utilities
S&P 400Midcap
20 Year Total Return

May 19, 2014 34
Questions?

May 19, 2014 35
Appendix
May 19, 2014 36
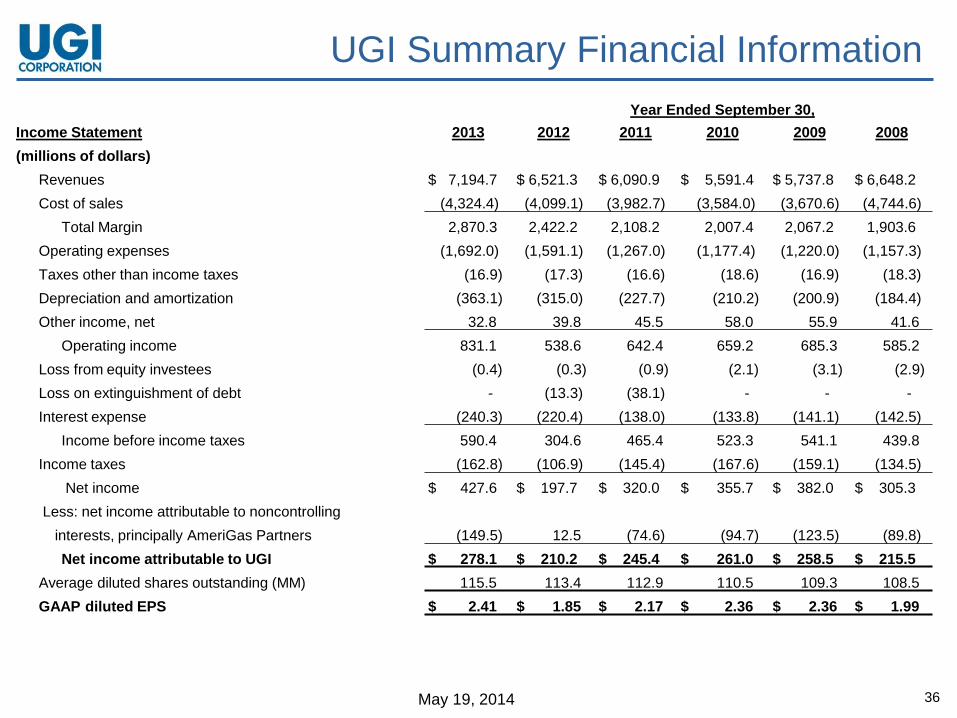
UGI Summary Financial Information
Year Ended September 30,
Income Statement 2013 2012 2011 2010 2009 2008
(millions of dollars)
Revenues $ 7,194.7 $ 6,521.3 $ 6,090.9 $ 5,591.4 $ 5,737.8 $ 6,648.2
Cost of sales (4,324.4) (4,099.1) (3,982.7) (3,584.0) (3,670.6) (4,744.6)
Total Margin 2,870.3 2,422.2 2,108.2 2,007.4 2,067.2 1,903.6
Operating expenses (1,692.0) (1,591.1) (1,267.0) (1,177.4) (1,220.0) (1,157.3)
Taxes other than income taxes (16.9) (17.3) (16.6) (18.6) (16.9) (18.3)
Depreciation and amortization (363.1) (315.0) (227.7) (210.2) (200.9) (184.4)
Other income, net 32.8 39.8 45.5 58.0 55.9 41.6
Operating income 831.1 538.6 642.4 659.2 685.3 585.2
Loss from equity investees (0.4) (0.3) (0.9) (2.1) (3.1) (2.9)
Loss on extinguishment of debt - (13.3) (38.1) - - -
Interest expense (240.3) (220.4) (138.0) (133.8) (141.1) (142.5)
Income before income taxes 590.4 304.6 465.4 523.3 541.1 439.8
Income taxes (162.8) (106.9) (145.4) (167.6) (159.1) (134.5)
Net income $ 427.6 $ 197.7 $ 320.0 $ 355.7 $ 382.0 $ 305.3
Less: net income attributable to noncontrolling
interests, principally AmeriGas Partners (149.5) 12.5 (74.6) (94.7) (123.5) (89.8)
Net income attributable to UGI $ 278.1 $ 210.2 $ 245.4 $ 261.0 $ 258.5 $ 215.5
Average diluted shares outstanding (MM) 115.5 113.4 112.9 110.5 109.3 108.5
GAAP diluted EPS $ 2.41 $ 1.85 $ 2.17 $ 2.36 $ 2.36 $ 1.99

May 19, 2014 37
UGI EPS Reconciliation
Reconciliation of Adjusted EPS to GAAP EPS Year Ended September 30,
2013 2012 2011 2010 2009 2008
GAAP Net Income $ 278.1 $ 210.2 $ 245.4 $ 261.0 $ 258.5 $ 215.5
Adjustments:
Net unrealized gains (losses) on unsettled commodity derivatives $ 0.1 $ 10.1 $ 11.4
Net unrealized gains (losses) on settled commodity derivatives $ 4.2 $ (1.2) $ 6.0
Acquisition and transition expenses $ (3.2) $ (13.3)
Loss on early extinguishment of debt at AmeriGas $ (2.2) $ (10.3)
Loss from discontinuance of cash flow hedge accounting at AmeriGas $ (3.9)
Loss on termination of interest rate protection at AmeriGas $ (5.2)
Gain/loss related to French Competition Authority $ 9.4 $ (10.0)
Gain on sale of 50% ownership of Energy Venture
Gains from sale of AmeriGas storage terminals $ 10.4
Gain from sale of Atlantic Energy LLC - UGI Energy Services $ 17.2
Loss on renewable energy partnership $ (3.7)
Adjusted Net Income $ 280.7 $ 216.8 $ 232.8 $ 249.0 $ 258.1 $ 215.5
GAAP EPS $ 2.41 $ 1.85 $ 2.17 $ 2.36 $ 2.36 $ 1.99
Adjusted EPS $ 2.43 $ 1.91 $ 2.06 $ 2.25 $ 2.36 $ 1.99
Diluted Shares Outstanding 115.5 113.4 112.9 110.5 109.3 108.5

May 19, 2014 38
UGI Long-term Debt
Year Ended Sep 30,
UGI Utilities: 2013 2012
Term Loan Credit Agreement $ 175.0 $ -
Senior Notes:
6.375%, due September 2013 $ - $ 108.0
5.75%, due September 2016 $ 175.0 $ 175.0
6.21%, due September 2036 $ 100.0 $ 100.0
Medium-Term Notes:
5.37%, due August 2013 $ - $ 25.0
5.16%, due May 2015 $ 20.0 $ 20.0
7.37%, due October 2015 $ 22.0 $ 22.0
5.64%, due December 2015 $ 50.0 $ 50.0
6.17%, due June 2017 $ 20.0 $ 20.0
7.25%, due November 2017 $ 20.0 $ 20.0
5.67%, due January 2018 $ 20.0 $ 20.0
6.50%, due August 2033 $ 20.0 $ 20.0
6.13%, due October 2034 $ 20.0 $ 20.0
Total UGI Utilities $ 642.0 $ 600.0
Other $ 12.9 $ 12.4
Total long-term debt $ 3,609.4 $ 3,514.3
Less: current maturities $ (67.2) $ (166.7)
Total long-term debt due after one
year $ 3,542.2 $ 3,347.6
Long-term Debt: Year Ended Sep 30,
AmeriGas Propane: 2013 2012
AmeriGas Partners Senior Notes:
7.00%, due May 2022 $ 980.8 $ 980.8
6.75%, due May 2020 $ 550.0 $ 550.0
6.50%, due May 2021 $ 270.0 $ 270.0
6.25%, due August 2019 $ 450.0 $ 450.0
HOLP Senior Secured Notes $ 32.0 $ 55.6
Other $ 17.3 $ 21.6
Total AmeriGas Propane $ 2,300.1 $ 2,328.0
UGI International:
Antargaz Senior Facilities term loan, due
through March 2016 $ 514.0 $ 488.7
Flaga term loan, due September 2016 $ 52.0 $ -
Flaga term loan, due through September
2016 $ 54.1 $ 51.4
Flaga term loan, due October 2016 $ 25.8 $ 24.6
Flaga term loan, due through June 2014 $ 1.9 $ 3.6
Other $ 6.6 $ 5.6
Total UGI International $ 654.4 $ 573.9

May 19, 2014 39
AmeriGas Propane Cash Flow Reconciliation
2006 2007 2008 2009 2010 2011 2012 2013
Net Cash Provided by Operating Activities 179.5$ 207.1$ 180.2$ 367.5$ 218.8$ 188.9$ 344.4$ 356.9$
Add: Acquisition and Transition expenses 46.2 26.5
Exclude the impact of working capital changes:
Accounts Receivable 21.0 17.1 51.3 (74.1) 47.9 65.6 (78.7) 42.3
Inventories 9.0 18.8 19.0 (57.8) 24.6 20.5 (53.1) (2.3)
Accounts Payable (7.6) (17.8) (8.1) 58.1 (15.6) (25.7) 34.6 0.2
Collateral Deposits - - 17.8 (17.8) - -
Other Current Assets (15.1) (0.3) 5.3 (16.2) 4.4 (2.9) (11.9) (2.0)
Other Current Liabilities - 12.3 (10.4) 21.6 (10.5) 37.4 (24.1) 42.1
Provision for Uncollectible Accounts (10.8) (9.5) (15.9) (9.3) (12.5) (12.8) (15.1) (16.5)
Other cash flows from operating activities, net 6.0 (4.9) 1.4 (0.3) (2.1) 2.8 (1.0) 7.6
(A) Distributable cash flow before capital expenditures 182.0 222.9 240.7 271.5 254.9 273.8 241.3 454.8
Capital Expenditures:
Growth (47.1) (46.6) (33.7) (41.2) (42.1) (39.0) (40.5) (39.2)
Heritage acquisition transition capital (17.6) (20.4)
(B) Maintenance (23.6) (27.2) (29.1) (37.5) (41.1) (38.2) (45.0) (51.5)
Expenditures for property, plant and equipment (70.7) (73.8) (62.8) (78.7) (83.2) (77.2) (103.1) (111.1)
Distributable cash flow (A-B) 158.4$ 195.7$ 211.6$ 234.0$ 213.8$ 235.6$ 196.3$ 403.3$
Divided by: Distributions paid 130.8$ 154.7$ 144.7$ 165.3$ 161.6$ 171.8$ 271.8$ 327.0$
Equals: Distribution Coverage 1.2 1.3 1.5 1.4 1.3 1.4 0.7 1.2
Distribution rate per limited partner unit - end of year 2.32$ 2.44$ 2.56$ 2.68$ 2.82$ 2.96$ 3.20$ 3.36$
Year Ended September 30,

May 19, 2014 40May 19, 2014
AmeriGas Supplemental Information: Footnotes
The enclosed supplemental information contains a reconciliation of Earnings before interest expense, income taxes, depreciation and amortization ("EBITDA") and Adjusted EBITDA to Net Income.
EBITDA and Adjusted EBITDA are not measures of performance or financial condition under accounting principles generally accepted in the United States ("GAAP"). Management believes EBITDA and Adjusted EBITDA are meaningful non-GAAP financial measures used by investors to compare the Partnership's operating performance with that of other companies within the propane industry. The Partnership's definitions of EBITDA and Adjusted EBITDA may be different from those used by other companies.
EBITDA and Adjusted EBITDA should not be considered as alternatives to net income (loss) attributable to AmeriGas Partners, L.P. Management uses EBITDA to compare year-over-year profitability of the business without regard to capital structure as well as to compare the relative performance of the Partnership to that of other master limited partnerships without regard to their financing methods, capital structure, income taxes or historical cost basis. Management uses Adjusted EBITDA to exclude from AmeriGas Partners’ EBITDA gains and losses that competitors do not necessarily have to provide additional insight into the comparison of year-over-year profitability to that of other master limited partnerships. In view of the omission of interest, income taxes, depreciation and amortization from EBITDA and Adjusted EBITDA, management also assesses the profitability of the business by comparing net income attributable to AmeriGas Partners, L.P. for the relevant years. Management also uses EBITDA to assess the Partnership's profitability because its parent, UGI Corporation, uses the Partnership's EBITDA to assess the profitability of the Partnership, which is one of UGI Corporation’s industry segments. UGI Corporation discloses the Partnership's EBITDA in its disclosures about its industry segments as the profitability measure for its domestic propane segment.

May 19, 2014 41
AmeriGas Propane EBITDA Reconciliation
Year Ended September 30,
(millions of dollars) 2013 2012 2011 2010 2009
Net income attributable to AmeriGas Partners, L.P. 1 221.6 $ 11.0 $ 138.5 $ 165.3 $ 224.6
Income tax expense 1.5 1.9 0.4 3.2 2.6
Interest expense 165.4 142.6 63.5 65.1 70.4
Depreciation and amortization 202.9 169.2 94.7 87.4 83.8
EBITDA 591.4 324.7 297.1 321.0 381.4
Add back: Loss on extinguishment of debt 13.3 38.1
Add back: Heritage Propane acquisition and transition expense 26.5 46.2
Exclude: Gain on sale of storage facility (39.9)
Add back: Litigation reserve adjustment 12.2
Exclude: Cumulative effect of accounting changes 7.0
Adjusted EBITDA $ 617.9 $ 384.2 $ 335.2 $ 340.2 $ 341.5

May 19, 2014 42
International Propane
(millions of dollars, except where otherwise indicated) 2013 2012 2011 2010 2009 2008
Income Statement - UGI International
Revenues $ 2,179.2 $ 1,946.0 $ 1,488.7 $ 1,059.5 $ 955.3 $ 1,124.8
Cost of sales (1,498.4) (1,325.8) (970.8) (582.1) (429.5) (651.9)
Total Margin 680.8 620.2 517.9 477.4 525.8 472.9
Operating expenses, net of other income (452.1) (429.2) (361.2) (300.0) (317.9) (311.4)
Depreciation and amortization (81.7) (79.2) (70.6) (60.4) (56.5) (54.7)
Operating income 147.0 111.8 86.1 117.0 151.4 106.8
Loss from equity investees (0.4) (0.0) (0.9) (2.1) (3.1) (2.9)
Interest expense (30.4) (30.9) (28.2) (25.4) (26.6) (29.7)
Income before income taxes 116.2 80.9 57.0 89.5 121.7 74.2
Income taxes (33.4) (15.8) (15.7) (30.4) (43.7) (20.7)
Noncontrolling interests (0.1) (0.0) (0.3) (0.3) 0.3 (1.2)
Net income attributable to UGI $ 82.7 $ 65.1 $ 41.0 $ 58.8 $ 78.3 $ 52.3
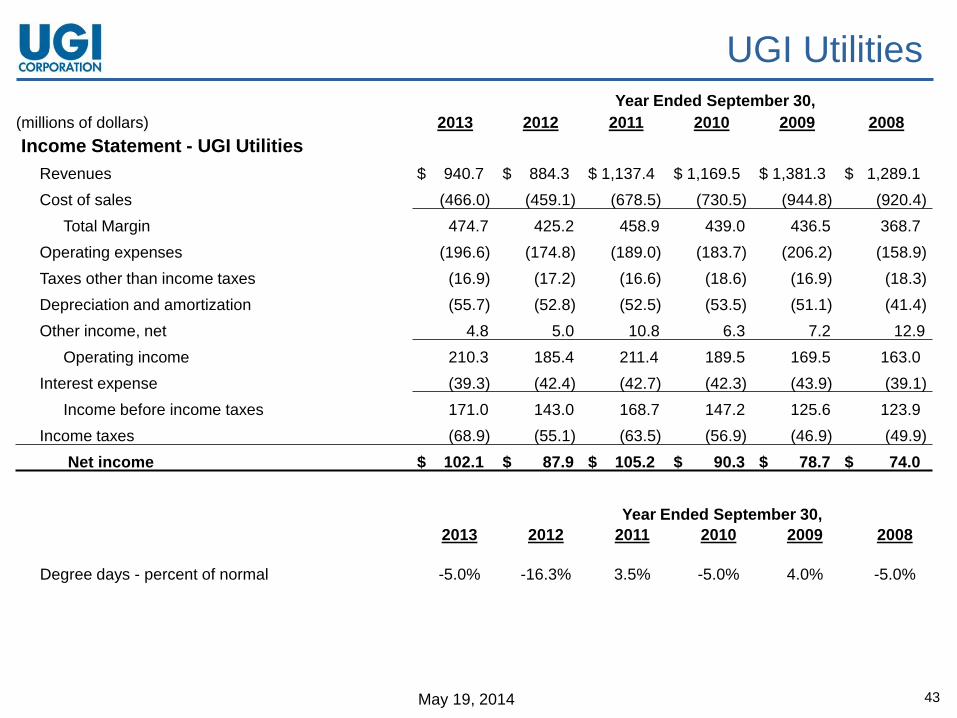
May 19, 2014 43
UGI Utilities
Year Ended September 30,
(millions of dollars) 2013 2012 2011 2010 2009 2008
Income Statement - UGI Utilities
Revenues $ 940.7 $ 884.3 $ 1,137.4 $ 1,169.5 $ 1,381.3 $ 1,289.1
Cost of sales (466.0) (459.1) (678.5) (730.5) (944.8) (920.4)
Total Margin 474.7 425.2 458.9 439.0 436.5 368.7
Operating expenses (196.6) (174.8) (189.0) (183.7) (206.2) (158.9)
Taxes other than income taxes (16.9) (17.2) (16.6) (18.6) (16.9) (18.3)
Depreciation and amortization (55.7) (52.8) (52.5) (53.5) (51.1) (41.4)
Other income, net 4.8 5.0 10.8 6.3 7.2 12.9
Operating income 210.3 185.4 211.4 189.5 169.5 163.0
Interest expense (39.3) (42.4) (42.7) (42.3) (43.9) (39.1)
Income before income taxes 171.0 143.0 168.7 147.2 125.6 123.9
Income taxes (68.9) (55.1) (63.5) (56.9) (46.9) (49.9)
Net income $ 102.1 $ 87.9 $ 105.2 $ 90.3 $ 78.7 $ 74.0
Year Ended September 30,
2013 2012 2011 2010 2009 2008
Degree days - percent of normal -5.0% -16.3% 3.5% -5.0% 4.0% -5.0%

May 19, 2014 44
Midstream & Marketing
(millions of dollars) 2013 2012 2011 2010 2009 2008
Income Statement - Energy Services
Revenues $ 1,040.8 $ 859.4 $ 1,059.7 $ 1,145.9 $ 1,224.7 $ 1,619.5
Cost of sales (876.8) (730.9) (920.0) (1,010.7) (1,098.5) (1,495.4)
Total Margin 164.0 128.5 139.7 135.2 126.2 124.1
Operating expenses, net of other income (56.4) (53.4) (48.8) (7.5) (52.9) (39.8)
Depreciation and amortization (17.6) (12.7) (8.0) (7.7) (8.5) (7.0)
Operating income 90.0 62.4 82.9 120.0 64.8 77.3
Interest expense (3.2) (4.8) (2.7) (0.2) - -
Income before income taxes 86.8 57.6 80.2 119.8 64.8 77.3
Income taxes (34.3) (19.9) (27.7) (51.6) (26.7) (32.0)
Net income attributable to UGI (*) $ 52.5 $ 37.7 $ 52.5 $ 68.2 $ 38.1 $ 45.3
(*) Includes after tax gain from the sale of Atlantic Energy of $17.2

May 19, 2014 45May 19, 2014
Commodity Marketing
Strategy: Target small & medium-size businesses that value our services (hedging, management of energy requirements)
$0
$20,000
$40,000
$60,000
$80,000
19
98
19
99
20
00
20
01
20
02
20
03
20
04
20
05
20
06
20
07
20
08
20
09
20
10
20
11
20
12
20
13
Commodity Marketing Margin (000s)
Natural Gas Retail Power Other
Enron collapse
Katrina/Rita price spike
Commodity spike to ~$13/Dth and drop to
~$3/Dth
22% warmer than normal winter

May 19, 2014 46
Frequently Asked Questions
Is natural gas making significant inroads on areas traditionally served by heating oil?
• Yes. Natural gas is less expensive and more convenient for consumers• Most conversions take place within 75-100 feet from the main
• A significant number of heating oil customers remain “resident” along these mains and are prime candidates for
conversion
• In FY2013, UGI Utilities converted over 15,000 customers to natural gas and the vast majority of these were converted
from heating oil
Is natural gas also making significant inroads on areas traditionally served by propane?
• No. Natural gas conversions typically extend only 75-100 feet from the main – most propane users
are outside of this reach• AmeriGas estimates that it loses less than 3,000 customers annually to natural gas (out of a customer base of 2
million)
• In FY13, UGI Utilities converted over 15,000 customers to natural gas and less than 200 of these were converted from
propane
• Most propane customers reside in less densely-populated areas well off the gas grid, making conversions less
attractive to gas utility companies
Does UGI Energy Services’ marketing business have significant energy exposure?
• No. UGI Energy Services’ energy marketing business adheres to a fulfillment business model• Volumes are hedged when a price commitment is made by a customer
• UGI does not employ any traders or engage in speculative trading
• UGI does not have a large asset base to protect (our small amount of electric generation is sold into the market)
• Average length of contract is ~9 months for gas customers, ~12 months for electric customers
FAQs

May 19, 2014 47
Investor Relations:610-337-7000
Simon Bowman (x3645)


![Data Book AGA 60 D · Aluminium for version AGA 076 - AGA 106 [8] With gasket in NBR only for version single phase AGA 106 . CENTRIFUGAL PUMPS AGA CONSTRUCTIONS 60Hz 301 EBARA Pumps](https://img.pdfslide.net/doc/110x75/5e694725e04bf5741b5a9b0e/data-book-aga-60-d-aluminium-for-version-aga-076-aga-106-8-with-gasket-in-nbr.jpg)