Embed Size (px)
Citation preview
AGE AND GROWTH OF THE WHITEFISH IN LAKE SUPERIOR
By WILLIAM R. DRYER, Fishery Biologi.tBUREAU of COMMERCIAL FISHERIES
ABSTRACT
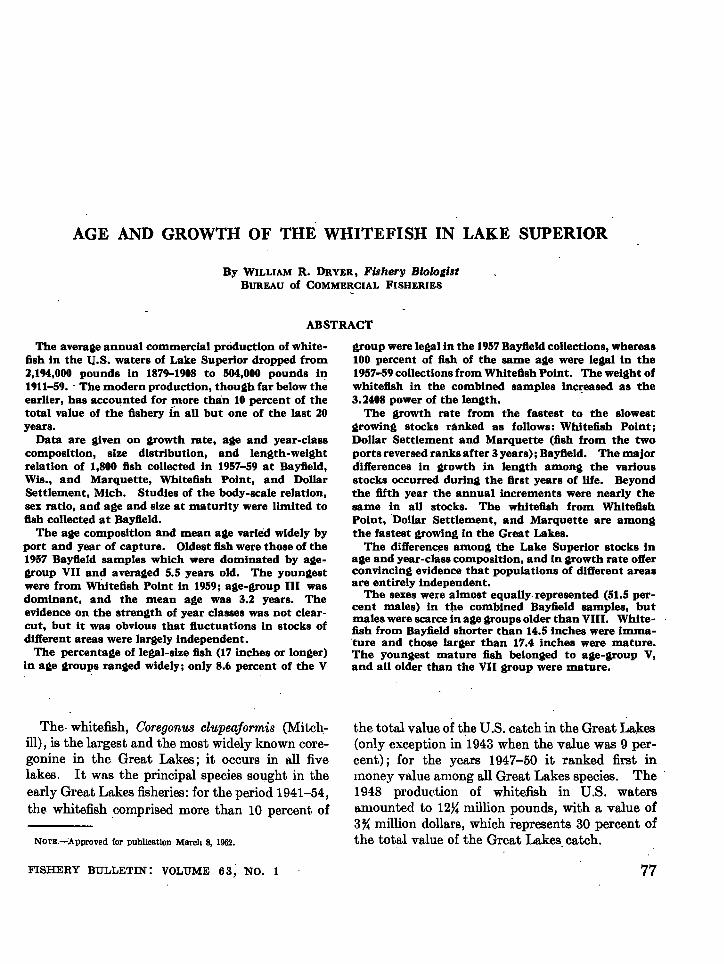
The average annual commercial prOduction of whitefish in the U.S. waters of Lake Superior dropped from2,194,000 pounds in 1879-1908 to 504,000 pounds in1911-59•. The modern production, though far below theearlier, has accounted for more than 10 percent of thetotal value of the fishery in all but one of the last 20years.
Data are given on growth rate, age and year-classcomposition, size distribution, and length-weightrelation of 1,800 fish collected in 1957-59 at Bayfield,Wis., and Marquette, Whitefish Point, and DollarSettlement, Mich. Studies of the body-scale relation,sex ratio, and age and size at maturity were limited tofish collected at Bayfield.
The age composition and mean age varied widely byport and year of capture. Oldest fish were those of the1957 Bayfield samples which were dominated by agegroup VII and averaged 5.5 years old. The youngestwere from Whitefish Point in 1959; age-group III wasdominant, and the mean age was 3.2 years. Theevidence on the strength of year classes was not c1earcut, but it was obvious that ftuctuations in stocks ofdifferent areas were largely independent.
The percentage of legal-size fish (17 inches or longer)in age groups ranged widely; only 8.6 percent of the V
The· whitefish, Coregonus clupeaformis (Mitch,ill), is the largest and the most widely known coregonine in the Great Lakes; it occurs in all fivelakes. It was the principal species sought in theearly Great Lakes fisheries: for the period 1941-54,the whitefish comprised more than 10 percent, of
NOTE.-Approved for publication March 8, 1962.
FISHERY BULLETIN: VOLUME 63, NO. I
group were legal in the 1957 Bayfield collections, whereas100 percent of fish of the same age were legal in the1957-59 collections from Whitefish Point. The weight ofwhitefish in the combined samples incJ;eased as the3.2408 power of the length.
The growth rate from the fastest to the slowestgrowing stocks ranked as follows: Whitefish Point;Dollar Settlement and Marquette (fish from the twoports reversed ranks after 3 years); Bayfield. The majord"tfferences in growth in length among the variousstocks occurred during the first years of life. Beyondthe fifth year the annual increments were nearly thesame in all stocks. The whitefish from WhitefishPoint, "Dollar Settlement, and Marquette are amongthe fastest growing in the Great Lakes.
The differenc~s among the Lake Superior stocks inage and year-class composition, and in growth rate ofterconvincing evidence that populations of different areasare entirely independent.
The sexes were almost equally. represented (51.5 percent males) in the combined Bayfield samples, butmales were scarce in age groups older than VIII. Whitefish from Bayfield shorter than 14.5 inches were imma"ture and those larger than 17.4 inches were mature.The youngest mature fish belonged to age-group V,and all older than the VII group were mature.
the total value of the U.S. catch in the Great Laltes(only exception in 1943 when the value was 9 percent) j for the years 1947-50 it ranked first inmoney value among all Great Lakes species. The1948 production of whitefish in U.S. watersamounted to 12}~ million pounds, with a value of3% million dollars, which represents 30 percent ofthe total value of the Great Lakes. catch.
77
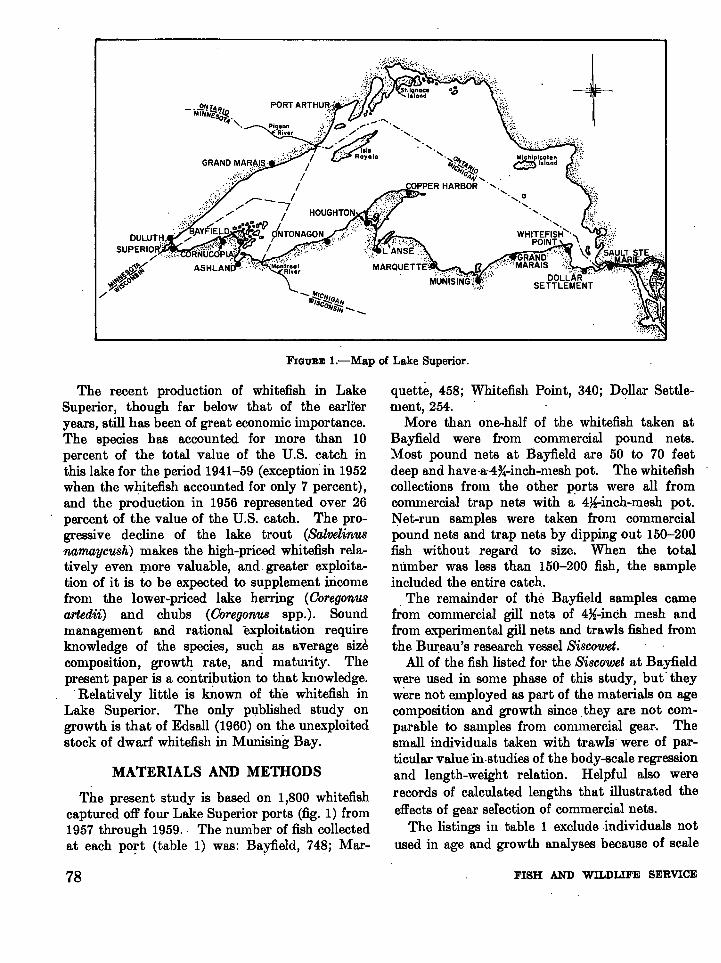
FIGURE I.-Map of Lake Superior.
The recent production of whitefish in LakeSuperior, though far below that of the earlIeryears, still has been of great economic importance.The species has accounted for more than 10percent of the total value of the U.S. catch inthis lake for the period 1941-59 (exception in 1952when the whitefish accounted for only 7 percent),and the production in 1956 represented over 26percent of the value of the U.S. catch. The progressive decline of the lake trout (Salvelinusnamaycush) makes the high-priced whitefish relatively even ~:nore valuable, and. greater exploitation of it is to be expected to supplement iricomefrom the lower-priced lake herring (Ooregonusartedii) and chubs (Ooregonus spp.). Soundmanagement and rational exploitation requireknowledge of the species, suc~ as average sizecomposition, growth rate, and maturity. Thepresent paper is a contribution to that knowledge.
.Relatively little is known of the whitefish inLake Superior. The only pl,lblished study ongrowth is that of Edsall (1960) on the unexploitedstock of dwarf whitefish in Munising Bay.
MATERIALS AND METHODS
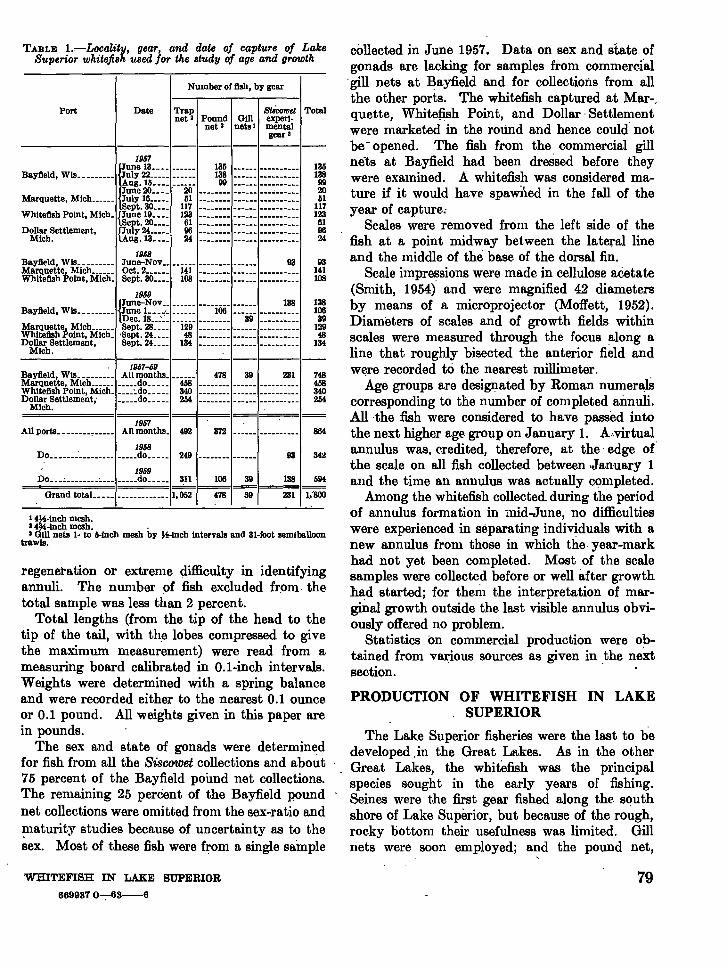
The present study is based on 1,800 whitefishcaptured off four Lake Superior ports (fig. 1) from1957 through 1959.· The number of fish collectedat each po~t (table 1) was: Ba;vfield, 748; Mar-
78
quette, 458; Whitefish Point, 340; Dollar Settlement, 254.
More than one-half of the whitefish taken atBayfield were from commercial pound nets.Most pound nets at Bayfield are 50 to 70 feetdeep and have-a-4%-inch-mesh pot. The whitefishcollections from the other ports were all fromcommercial trap nets with a: 4}Hnch-mesh pot.Net-run samples were taken from commercialpound nets and trap nets by dipping out 150-200fish without regard to size. When the totalnumber was less than 150-200 fish, the sampleincluded the entire catch.
. The remainder of the Bayfield samples camefrom commercial gill nets of 4~-inch mesh andfrom experimental gill nets and trawls fished fromthe Bw:eau's research vessel Siscowet.
All of the fish listed for the Siscowet at Bayfieldwere used in some phase of this study, but" theywere not employed as part of the materials on agecomposition and growth since .they are not comparable to samples from conmiercial gear-. Thesmall individuals taken with trawls· were of particular value "in-studies of the body-scale regressionand length-weight relation. Helpful also. wel'erecords of calculated lengths that illustrated theeffects of gear sefection of commercial nets.
The listings in table 1 exclude .individuals notused in age and growth analyses because of scale
FISH AND WILDLIFE SERVICE
-------1----\·----------
TABLE l.~Locality, gear, and date of capture of LakeSuperior whitefish used for the study of age and growth
I 4joi-lnch mesh.I 4~-lnch mesh. .I 01\1 nets 1- to 5-inch mesh by joi·lnch Intervals and 31·foot semibelloon
trawls.
1969Do ~ ~ do_____ 311 106 39 138 594====
Orand totaL. 1,052 478 39 231 \.,1100
PRODUCTION OF WHITEFISH IN LAKE. SUPERIOR
The Lake Superior fisheries were the last to bedeveloped,in the Great Lakes. As in the otherGreat Lakes, the whitefish was the prineipalspecies seught in the early years of fishing.Seines were the first gear fished along the southshore of Lake Superior, but because of the rough,roeky bottom their usefulness was limited. Gillnets were soon employed; and the pound net,
collected in June 1957. Data on sex and state ofgonads are lacking for samples from commercIal.gill nets at Bayfield and for collections from allthe other ports. The whitefish captured at Mar-,quette, Whitefish Point, and Dollar· Settlementwere marketed in the round and hence could notbe- opened. The fish from the. commercial gillnets at Bayfield had been dressed before theywere examined. A whitefish was considered mature if it would have spawiied in the fall of theyear of capture;
Scales were removed from the left side of thefish at a point midway between the late:ral lineand the middle of the base of the dorsal fin.
Scale impressions were made in cellulose acetate(Smith, 1954)' and were magnified 42 diametersby means of a microprojector (Moffett, 1952).Diameters of scales and of growth fields withinscales were measured through the focus along aline that roughly bisected the anterior field andwere recorded to the nearest millimeter.
Age groups are designated by Roman numer~lscorresponding to the number of completed aimuli.All·the fish were considered to have passed intothe next higher age group on January 1. A.·virtualannulus was, credited, therefore, at the' edge ofthe scale on all fish collected between ,January 1and the time an annulus was actually c9mpleted.
Among the whitefish colleeted. during the periodof annulus formation in mid-June, no difficultieswere experienced in separating individuals with anew annulus from those in which the· year-markhad not yet been completed. Most of the sealesamples were collected before or well after growthhad started; for thenl the interpretation of marginal growth outside the last visible annulus obviously offered no problem.
Statistics on commereial production were obtained from vro:ious sources as given in ,the nextsection. .
93141108
13810639
12948
134
135138992051
117123
619624
93 342
372 864
Date Trap 81,coIPe/ Totalnet' Pound Oill experl-
net' nets I mentalgear I
Number ofllsh, by gear
Port
1968Do do_____ 249 _
1967
~une 13.___ 135 _
Baylleld, Wls_ _ July 22_____ 138 • _
Uu~e Jg~::~ c--i2o- -----~- ====== ==========Marquette, Mlch______ July 16_____ 51 • _ept.3O____ 117 _
Whitellsh Point, Mlch_ {June 19____ 123 _Sept. 20____ 61 _
Dollar Settlement, {JUlY 24_____ 96 _Mich. Aug. 13_ ___ 24 _
1968Baylleld, Wls June-Nov__ 93Marquette, Mich______ Oct. 2______ 141 _Whltellsh Point, Mlch_ Sept. 30____ lOS • _
1969
{
June-Nov__ 138Baylleld, Wls June L __.,_ 106 _. . _
Dec. 18_____ 39 • _Marquette, Mlch______ Sept. 28____ 129 • • •Whltellsh Point, Mich_ -Sept. 24____ 48 _Dollar Settlement, Sept. 24____ 134 _
Mich.
regeneration or extreme difficulty in identifyingannuli. The number 9f fish excluded fr.om. thetotal sample was less than 2 percent.
Total lengths (from the tip of the head to thetip of the tail, with th.e lobes compressed to givethe maximum measurement) were read from ameasuring board calibrated in O.l-inch intervals.Weights were determined with a spring balanceand were recorded either to the nearest 0.1 ounceor 0.1 pound. All weights given in this paper arein pounds.
The sex and state of gonads were determinedfor fish from all the Siscowet collections and about75 percent of the Bayfield pound net collections.The remaining 25 percent of the Bayfield poundnet collections were omitted from the sex-ratio andmaturity studies because of uncertainty as to the~ex. Most of these fish were from a single sample
. 1967-69Baylleld, WIs All months_ 478 39 231 748Marquette, Mich do_____ 458 458Whltellsh Point, Mich :do_____ 340 340Dollar Settlement,' do_____ 254 254
Mich.",;;;~====I====I==~=~=
1967All ports • All months_ 492
WHITEFISH IN LAKE SUPERIOR
669981 0-;-63-6
79
introduced iD. this country from Scotland in 1836,was established in Whitefish B~y about 1860.The pound net was first fished 'in the ApostleIslands area in 1871, and by 1885 about 125 werein. use. Only 40 pound nets were fished in the
.Apostle Islands in 1960. The trap net, whichwas invented by Lake Ontario fishermen in 1865,was int.roduced in Lake Superior during the early1900's. This net was not adapted for takingwhitefish until the 1930's and since then has beenimport.ant only in Michigan. The use of trapnets is prohibited in Wisconsin and Minnesotawaters. The first st.eamer was introduced in 1871,and the first motor boat appeared at Marquette,Mich., in .1899.
Up to 1890 whitefish were the principal speciesin the commercial product.ion in United "Stateswaters of Lake Superior (Koelz, 1926).. Betwe~n1891 and' 1899 the lake trou~ occupied first place,and in the early 1900's large-scale .production oflake herring placed them in first rank. The whitefish has held third position behind the lake herringand lake trout up to the recent collapse of the laketrout fishery.
The statistical records of whitefish productionin Lake Superior (table 2) came from varioussources. The figUres through 1940 are fromGallagher and Van Oost.en (1943). The U.S.data for 1941-59 are from Lake Fisheries issuedby the Bureau of· Commercial Fisheries. Thelater recor4s for Ontario were issued by theProvine.e. .
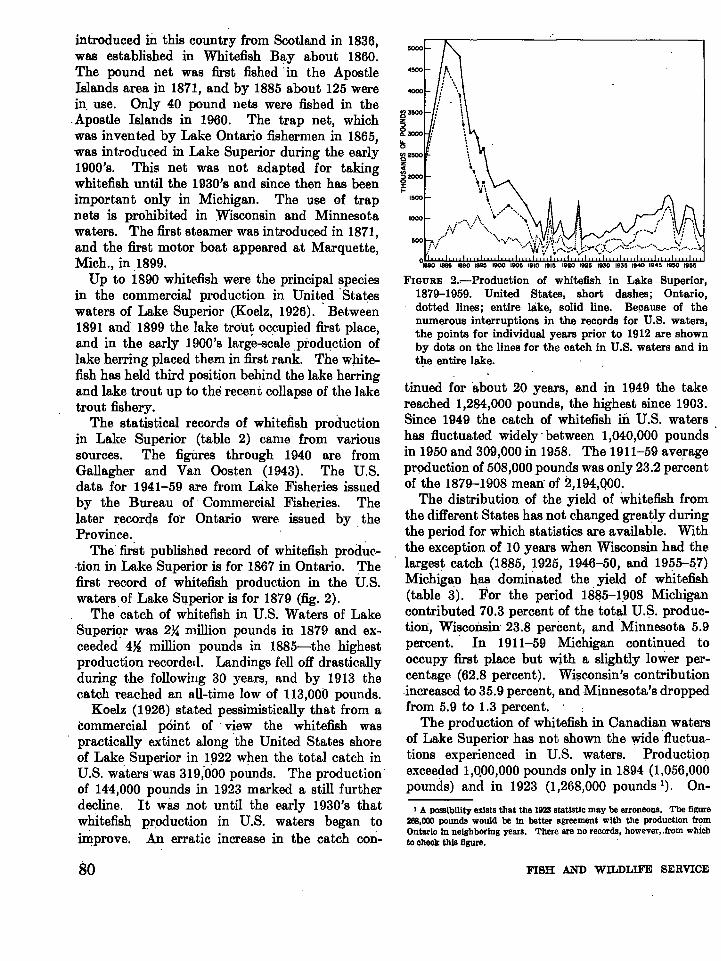
The' first published record of whitefish prod~c·tion in Lake Superior is for 1867 in Ontario. Thefirst record of whitefish production in the U.S.watersof Lake Sqperior is for 1879 (fig. 2).
The catch of whit.efish in U.S. Waters of LakeSuperil?r was 2X million pounds in 1879 and exceeded 4~ million pounds in 1885-t.he highestproduction recorded. Landings fell off drasticallyduring t.he followiug 30 years, and by 1913 thecatch l'eached an aU-t.ime low of 113,000 pounds.
Koelz (1926) stated pessimistically that from acommercial point of' view the whitefish waspractically extinct along 'the United States shoreof Lake Superior in 1922 when the total catch inU.S. waters'was 319;000 pounds. The production'of 144,000 pounds in 1923 marked a still furtherdecline. It was not until the early 1930's thatwhitefish, production in U.S. waters began tounprove. An erratic increase in the catch con-
80
O"~88:;"O~1885~IB::;90~IB~";'-"~900~'90~."7."~'O~I.!:!;I.~'.2~O '=1.~2.~,.:k!",,~,:':!:.,':U. ~'.40:!!-':!:'.~'.~'.~50~'~••~.FIGURE 2.~Production of whitefish in Lake Superior,
1879-1959. United States, short dashes; Ontario,dotted lines; entire bike, solid line. Be~ause of thenumerous interruptions in the records for U.S. waters,the points for individual years prior to 1912 are shownby dots on the lines for the catch in U.S. waters and int~e entire lake.
tinued for 'about 20 years, and in 1949 the takereached 1,284,000 pounds, the highest since 1903.Since 1949 the catch of whitefish iii U.S. watershas fluctuated widely' between 1,040,000 pounds .in 1950 and 309,000 in 1958. The 1911-59 averagepl'9duction of 508,000 pounds was only 23:2 percentof the 1879-1908 mean of 2,194,QOO.
The distribution of the yield of whitefish fromthe different States has not ehanged greatly duringthe period for whieh statistics are available. Withthe exception of 10 years when Wisconsin had thelargest catch (18.85, 1925, 1946-50, and 1955-5.7)Michigan has dominated the yield of whitefish(table 3). For the period 18~5-1.908 Michigancontributed 70.3 percent of the total U.S. production, Wisconsin' 23.8 percent, and 'Minnesota 5.9percent.· In 1911-59 Michigan continued tooccupy first place but with a slightly lower pereentage (62.8 percent). Wi~consin's contribution.increased to 35.9 percent, and Minnesota's droppedfrom 5.9 to 1.3 percent. .
The production of whitefish in Canadian watersof Lake Superior has not shown the ~de 'fluctuations experienced in U.S. waters. Productionexeee~ed 1,0.00,000 pounds only in 1894 (1,056,000pounds) and in 1923 (1,268,000 pounds I). On-
I A POSSlbllity eslsts thst the 1923 statistic msy be erroneous. The figure268,000 pounds wonld be In better agreement wtth the production fromOntario In neighboring years. There are no records, however, .from whichto check this figure.
FISH AND WILDLIFE SERVICE
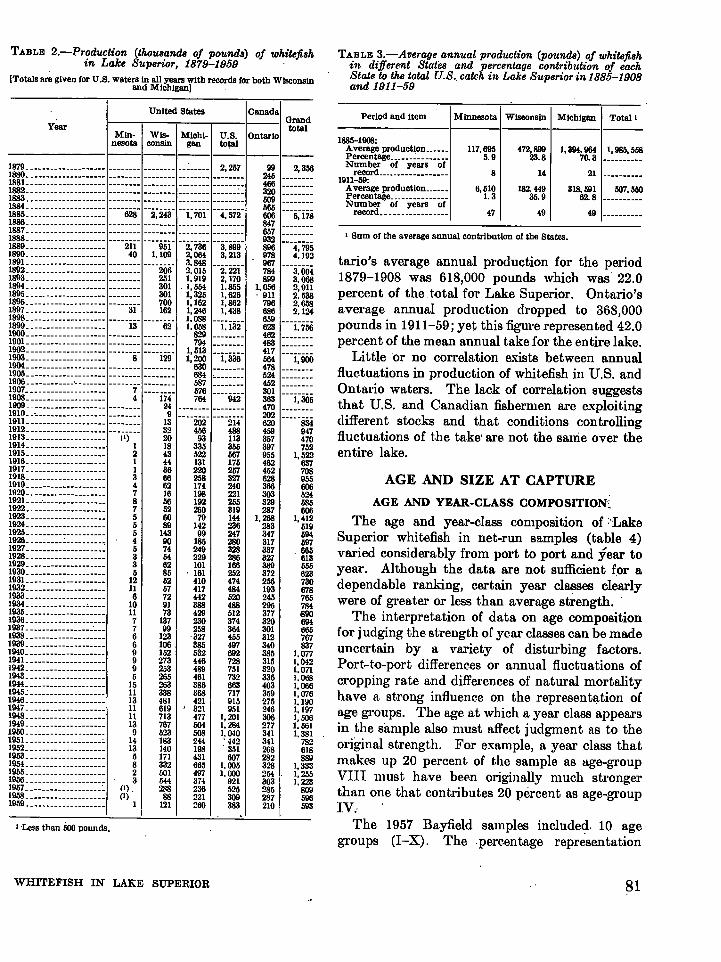
TABLE 2.-Production (thou8and8 oj pound8) oj whitefi8hin Lake Superior, 1879-1959 .
[Totals are given for U.s. waters In all years with records for hoth Wisconsinand Michigan)
TABLE 3.-Average annual production (pound8) oj whitefi8hin different Stat"e8 and percentage contribution oj eachState to the total U.S" catch if~ Lake Superior in 1885-1908and 1911-59
--------1------------ _MIn- Wls- Mlchl- U.S. Ontario
nesota consin gan to~
1 'Less than 500 pOWlds.
50
58
tario's average annual production for the period1879-1908 was 618,000 pounds which was' 22.0percent of the total for Lake Superior. Ontario'saverage annual production dropped to 368,000pounds in 1911-59; yet this figure represented 42.0percent of the mean annual take for the entire lake.
Little or no correlation exists between annualfluetuations in production of whitefish in U.S. andOntario waters. The lack of correlation suggeststhat U.S. and Canadian fishermen are exploitingdifferent stocks and that conditions controllingfluctuations of the take' are not the sarrie over theentire lake.
• Sum of the average annual contribution of the States.
AGE AND SIZE AT CAPTURE
AGE AND YEAR-CLASS COMPOSITION'~
The age and year-class composition of :'LakeSuperior whitefish in net-run samples (table 4)varied considerably from port to port and year toyear. Although the data are not sufficient (or adependable ranking, certain year classes clearlywere of greater or less t.han average strength..
The interpretation of data on age compositionfor judging the strength of year classes (',an be madeuncertain by a variety of disturbing factors.Port.-t.o-port differenees or annual fluctuations ofcropping rate and differences of natural mortalityhave a st.rong infIuenee on the represent~tion ofage groups. The age at which a year class appeal'sin the sample also must affect judgment as to theoriginal strength. For example, a year class thatmakes up 20 percent of t,he sample as age-groupVIII must have been originally much strongerthan one that contributes 20 percent as age-groupIV."
The 1957 Bayfield samples include~. 10 agegroups (I-X). The ·pereentage representation
Period and Item Minnesota Wisconsin Mlehigan Total'
1885-1908:Average product~on______ 117,695 472,899 1.394,964 1,985,5Percentage_______________ 5.9 23.8 70.3 ---------Numher of years ofrecord___ . ______________ 8 14 21 ---------1911-59:Average productlon______ 6,510 182. 449 318.591 507,5Percentage_______________ 1.3 35.9 62.8 ---------Number of years ofrecord. ________________ 47 49 49 ---------
Orandtotal
99 2,356245466320509565606 5,178847657932896 4,795978 4,192967784 3,004899 3,068
1.056 2,911, 911 2,538
796 2,658686 2,124659623 1.756462483417564 1,900478524452301 ---i;305363470202620 834459 947357 470397 752955 1,522462 637452 708628 955366 606303 524329 585287 606
1,268 1,412283 519347 594317 597337 . 665327 613389 555372 623256 730193 678245 765295 784377 BOO320 694301 665312 767340 837385 1,077315 1,042320 1,071336 1,068403 1,066359 1,076275 1.190246 1,197306 1,506277 1.561341 1,381341 782268 618282 889328 1,333254 . 1,255303 1,223285 809287 596210 593
Canada
2.2212,1701.8551,6261,8621,438
--i:i32-
United States
Year
1879 ~_____ 2,2571880 _1881. _1882 :_1883. _1884 _1885____________________ 628 2,243 1,701 4,5721886 _1887 _1888 _1889_ 211 951 2,736 3,8991890_ 40 1,109 2,064 3,2131891.___________________ 3.8481892_ 206 2,0151893____________________ 251 1,9191894_.__________________ 301.1,5541895____________________ 301 1,3251896 • .______ 700 1,1621897 _ 31 162 1,2461898____________________ 1.0881899_ 13 62 1, 0581900 -_______ 8291901____________________ 7941902____________________ 1,513 _1903____________________ 8 129 1,200 1,3361904____________________ 6301905 ._____ 6841906 ,________ 5871907____________________ 7 .___ 576 _1908_ 4 174 764 9421909. 24 _1910 __.__________________ 9 _1911. 13 202 2141912____________________ 32 456 4881913____________________ I'> 20 93 1131914____________________ 1 18 335 3551915_ _ 2 43 522 5671916_ 1 44 131 1751917_ 1 36 220 2571918 .__ 3 66 258 3271919____________________ 4 62 174 2401920_ • .____________ 7 16 198 2211921. .________________ 8 56 192 2551922____________________ 7 52 260 3191923_ 5 60 79 1441924_ .__________________ 5 89 142 2361925_ 5 143 99 2471926 : " 4 90 185 2801927. 5 74 249 3281928_ 3 54 229 2861929_ 3 62 101 1661930_ 5 85, 161 252193\.___________________ 12 52 410 4741932____________________ 11 57 417 4841933____________________ 6 72 442 5201934 ,____ 10 91 388 4881935____________________ 11 73 429 5121936_ 7 137 230 3741937 .___ 7 99 258 3641938____________________ 6 123 ,327 4551939_ 6 106 385 4971940____________________ 9 152 532 6921941.___________________ 9 273 446 7281942_ 9 253 489 7511943_ 5 265 461 7321944____________________ 15 263 386 6631945: ._______ 11 338 368 7171946_ 13 481 421 9151947. 11 619 321 9511948_ 11 713 477 1,2011949 .________________ 13 767 504 1,2841950 • 9 523 508 1,0401951. , 14 183 244 : 4421952____________________ 13 140 198 3511953 .________________ 5 171 431 6071954____________________ 8 332 665 1,0051955 2 501 4971,0001956____________________ 3 544 374 9211957. • ~ ('). 288 236 5251958____________________ ('> 88 221 3091959. ._______________ 1 121 260 383
WHITEFISH IN LAKE SUPERIOR 81
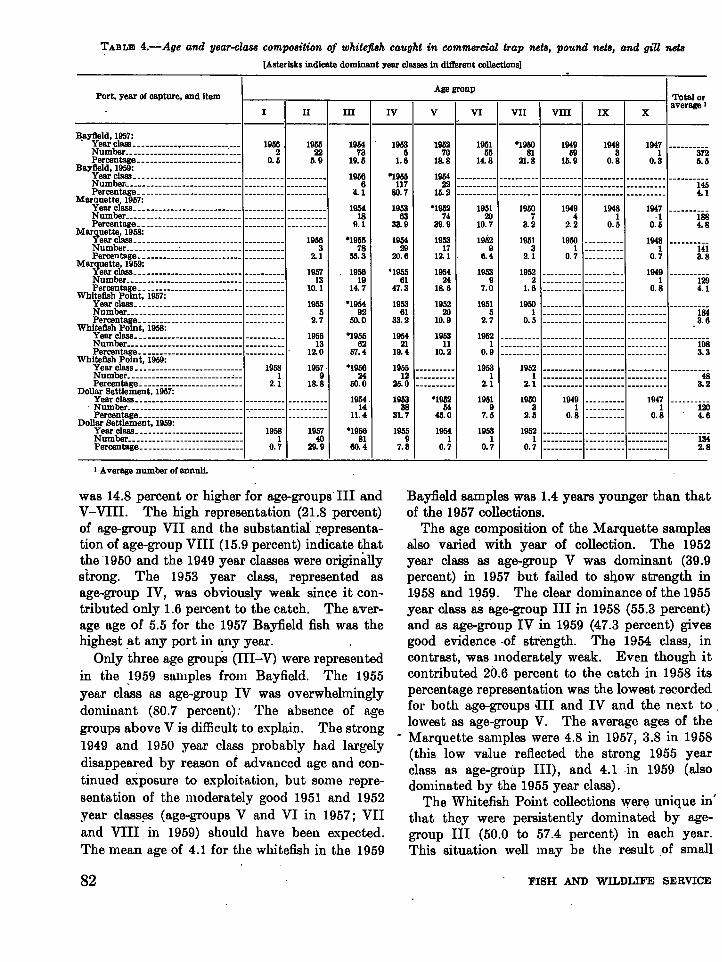
TABLE 4.-Age and year-cla88 comp08ition of whitefi8h caught in commercial trap net8, pound net8, and giU net8[Asterisks indicate dominant year classes in dillerent collections)
xIXVIIIVIIV VIIVIIIIII
Age group II---,.---,.---.,.---.,.---.,.---.,.---.,.---.,.---.,.---i Total or
average IPort, year of capture, and Item
------------1---------------------------------
°1952 195174 20
39.9 10.7
1953 195217 9
12.1· 6.4
1954 195324 9
18.6 7.0
19471 372
0.3 6.6
1950 1949 1948 19477 4 1 ·1
3.2 2.2 0.5 0.5
1951 1950 19483 1 1
2.1 0.7 0.7
1952~--------- ---------. 1949
2 ---------- --------.- 11.6 ---------- ---------- 0.8
19491 _0.8 _
483.2
1342.8
1204.6
1083.3
1294.1
1843.6
1413.8
1884.8
1454.1
1947I
0.8
19483
0.8
194959
15.9
1952I
2.1
19503
2.5
1952I
0.7
19501
0.5
°195081
21.8
19515
2.7
19621
0.9
19531
2.1
19519
7.5
19531
0.7
195155
14. 8
195220
10.9
195311
10.2
195270
18. 8
19M22
15.2
°195254
45.0
19541
0.7
19M 195373 6
19.5 1.6
1956 °19556 117
4.1 80.7
1954 195318 63
9.1 33.9
°1955 195478 29
115.3 20.6
1956 '195519 61
14.7 47.3
°1954 195392 61
50.0 33.2
°1955 195462 21
57.4 19.4
°1956 195524 12
50.0 25.0
1954. 195314 38
11. 4 31.7
°1956 195581 9
60.4 7.3
Bayfield, 1957:• Year class ._______________ 1956 1955Number. :___ 2 22Percentage_ _ 0.5 5. 9
Bayfield, 1959:Year class_. •Number~ _Percentage _
Marquette. 1957:Year class _Number _Percentage _
Marquette, 1958:Year class_ __ 1956Number. 0__ 3Percentage_ _ _ 2. 1
Marquette, 1959:Year class___________________________ 1957Number __ 13Percentage_ _ 10. 1
Whitefish Point, 1957:Year class __ • _ 1955Number 5Percentage__________________________ 2.7
Whitefish Polil.t, 1958:Year class_ __ 1956Number. • 13Percentage . 12.0
Whitefish Point, 1959:Year class_ •• 1958 1957·Number "__ 1 9Percentage__________________________ 2.1 18.8
Dollar Settlement, 1957:Year class_. • _
. ~:..:~ge:::::::::::::::::::::::::: ~::::::::: ::::::::::Dollar Settlement, 1959:Year class .______________________ 1958 1957
Number_____________________________ 1 40Percentage_ 0.7 29.9
I Average number of annuli.
was 14.8 percent or higher for age-groups' III andV-VIII. The high representation (21.8 percent)of age-group VII and the substantial J,'epresentation of age-group VIII (15.9 percent) indicate thatthe "1950 and the 1949 year classes were originaJlystrong. The 1953 year class, represented asage-group IV, was obviously weak since it contributed only 1.6 pereent to the catch. The average age of 5.5 for the 1957 Bayfield fish was thehighest .at any port in any year.
Only three age groups (III-V) were representedin the .1959 samples from Bayfield. The 1955year class as age-group IV was overwhelminglydominant (80.7 percent): The absence of agegroups above V is difficult to explain. The strong1949 and 1950 year class probably had largelydisappeared by reason of advanced age and continued exposure to exploit,ation, but some representation of the moderately good 1951 and 1952year class~ (age-groups V and VI in 1957; VIIand VIII in 1959) should have been expected.The mean age of 4.1 for the whitefish in the 1959
Bayfield samples was 1.4 years younger than thatof the 1957 collections.
The age composition of the Marquette samplesalso varied with year of collection. The 1952year class as age-group V was dominant (39.9percent) in 1957 but failed to s40w strength in1958 and 1959. The clear dominance of the 1955year class as age-group III in 1958 (55.3 percent)and as age-group IV in 1959 (47.3 percent) givesgood evidence -of str·ength. The 1954 class, incontrast, was moderately weak. Even though itcontributed 20.6 percent to the catch in 1958 itspercentage representation was the lowest reeordedfor both age-groups HI and IV and the next to .lowest as age-group V. The average ages of the
- Marquette samples were 4.8 in 1957, 3.8 in 1958(this low value reflected the strong 1955 yearclass as age-groiIp III), and 4.1 ·in 1959 (alsodominated by the 1955 year class).
The Whitefish Point collections wer~ unique in'that they were persistently dominated by agegroup III (50.0 to 57.4 percent) in each year.This situation well may be the result of small
82 FISH AND WILDLIFE SERVICE
fluctuations in' year-class strength Ilnd a highmortality rate due to the intensive trap net fisheryin the area. Most of the whitefish at- WhitefishPoint attain legal size during their fourth year ofgrowth (age-group III) and consequently becomevulnerable to the fishery. Few individuals maysurvive to represent the older age groups in subsequent years. Large percentages of the fish inage groups younger than III undoubtedly escapefrom the 4~-inch-mesh trap· nets. Because ofpersistent dominance by a single age group.
. judgments of year-class strength at WhitefishPoint are not considered possible. The mean ageof the Whitefish Point samples varied little fromyear to year-3.6 in 1957, 3.3 in 1958, and 3.2 in1959.
The 1952 year class dominated (45.0 percent)the trap'net samples at Dollar Settlement as agegroup V in 1957. No samples were collected ill1958. but in 1959 the 1956 year class dominatedstrongly (~0.4 percent) as age-group III. Undoubtedly both the 1952 and 1956 year classeswere strong, but lack of data from 1958 makesevaluation of relative strength difficult. The 1954and 1955 year classes appear to have been weakat Dollar Settlement. The mean age of theDollar Settlement whitefish was 4.6 in 1957 and2.8 in 1959.
Little 'evidence exists for lakewide similarity offluctuations of year-class strength. The 1955year class was strong at Bayfield and Marquette
but weak at Dollar Settlement. The 1952 yearclass was strong at Marquette and Dollar Settlement but only moderate at Bayfield. The 1949and 1950 year classes. which were strong at Bayfield, seemingly were too old to be represented incatches at the other ports. The 1956 year classexhibited strength at Dollar Settlement only. Notwo ports agreed in the appearance of a weakyear class.
LENGTH AND WEIGHT OF THE AGE GROUPS
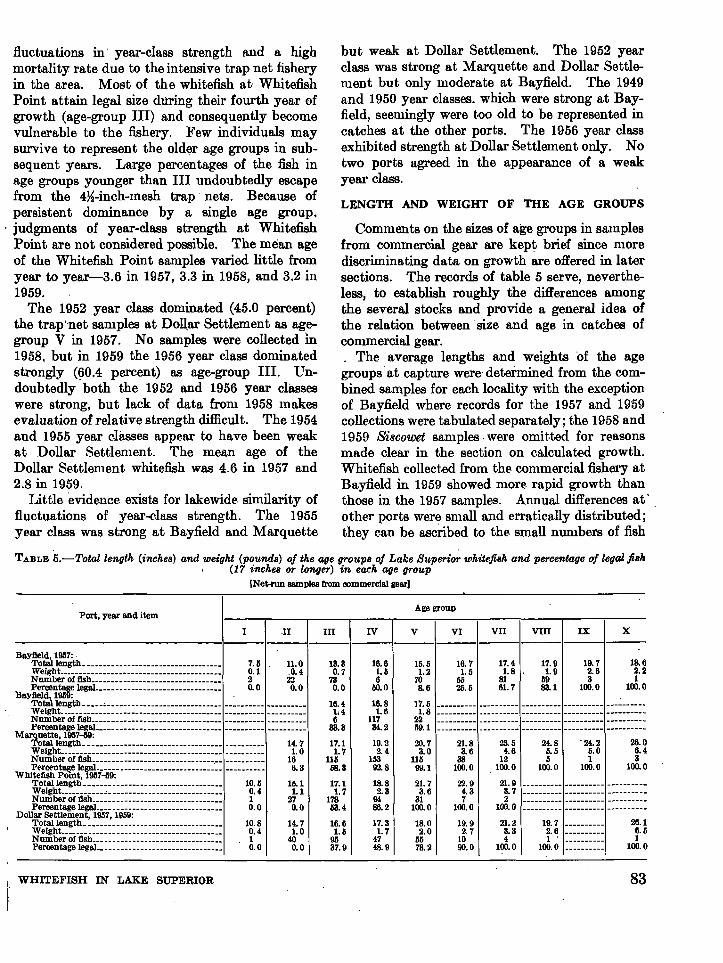
Comments on the sizes of age groups in samplesfrom commercial gear are kept brief since morediscriminating data on growth are offered in latersections. The records of table 5 serve, nevertheless, to establish roughly the differences amongthe several stocks and provide a general idea ofthe relation between· size and age in catches ofcommercial gear.. The average lengths and weights 'of the agegroups'at capture were' determined from the combined samples for each locality with the exceptionof Bayfield where records for the 1957 and 19'59collections were tabulated separately; the 1958 and1959 Siscowet samples· were omitted for reasonsmade clear in the section on calculated growth.Whitefish collected from the commercial fishery atBayfield in 1959 showed more rapid growth thanthose in the 1957 samples. Annual differences at'other ports were small and elTatically distributed;they can be ascribed to the small nWllbers of fish
. .TABLE 5.-Totallength (inches) and weight (pounds) of the age groups of Lake Sltperior 'whitefish and percentage of legal fish
, (17 inches or longer) in eat:h age groupINet-nm samples from commercial gear)
Port, year and itemAge group
I .11 III IV v VI VII VIII IX X--------------·1------------------------------
26.16.6I
100.0
18.62.21
100.0
19.72.63
100.0
19.7 _2.6 _1 . _
100.0 _
17.4 17.91.8. 1.9
81 6961.7 83.1
21.23.34
100.0
16.71.5
5.525.6
15.51.2
708.6
21.7 22.93.6 4.3
31 7100.0 100.0
18.0 19.92.0 2.7
55 1078.2 90.0
17.5 ._~ •1.8 -.--------
22 • _59.1 • _
20.7 21.8 23.5 24.8 . 24.2 26.03.0 3.6 4.6 6.5 5.0 6.4
115 38 12 5 1 399.1 100.0 100.0 100.0 100.0 100.0
21.9 _3.7 _2 _. .. __ ........ _.. ~ __ ~ .. _.. _..100.0 • _
13.3 16.60.7 1.5
73 60.0 50.0
16.4 16.81,4 1.66 U7
33.3 34.2
17.1 19.21.7 2.4
U5 15358.3 92.8
17.1 18.81.7 2.3
178 9453.4 86.2
16.6 17.31.5 1.7
93 4737.9 48.9
15.11.1
270.0
14.71.0
400.0
11.0.0.4220.0
7.50.120.0
Bayfield, 1937: .Total length ._. _Weight _Number of Ilsh _Percentage legal _
Bayfield, 1939: .Total length " • _Weight. • _Number of flsh • _Percentage legal • _
Mar~~~::~e~:ot1~~:-------------------------------- 14.7Weight_________________________________________ 1.0
~~=~~e~~=~~=================:====:=:::::::=:::::= 1~. 3Whitefish Pomt, 1937--59:Totallengtb___________________________________ 10.6Weight , .____________________ 0.4Number of flsh_________________________________ 1Percentage legal .____________________ 0.0
Dollar Settlement, 1937, 1939: .
~:I~~~_~~~~_~~:::::::::::::::::::::=::::::::::: Ig: ~Number of fish_________________________________ 1Percentage legal__ 0.0
WHITEFISH IN LAKE SUPERIOR 83
in some age groups. The sexes were also combined in t.hese dat.a. Sex differences in t.he averagelengt.hs and weights at capture were not appreciable in samples for which records of sex wereavailable."' .
Some of the differences in the average lengthsand weights of whitefish of the same age grpupsfrom different localities were striking. The 1957Bayfield whitefish were the smallest fish, age forage, of all the collectiops. The average size of theV-group fish, for example, was 6.2 inches shorterand 2.4 pounds lighter t.han V-group fish "fromWhitefish Point. Indeed, the weight of the White- ""fish Point. fish at. t.his age was 3 times that ofBayfield fish. Age-group VII was the youngestat. Bayfield in which the average lengt.h exceededt.he minimum legal size of 17 inches. The meanweIght of the 1957 Bayfield whitefish increasedless than one-half pound from their fourt.h t.o t.heireighth growing season (from 1.5 t.o 1.9 pounds).
The 1959 Bayfield whitefish averaged smallert.han whitefish from the other ports, but. werelarger than those in the 1957 Bayfield collecttons.The average length of t.he V-group fish, for example, was 17.5 inches, 0.5 inch above the legalminimum and 2 inches longer, than the V group in.1957. The weight advantage of the 1959 V groupamounted to 0.6 pound.
The available evidence suggests that a temporary improvement in the growth rate of whitefishaccounted for the greater size of the age groups in
. the 1959 samples. Details are not. given here sine.ethe materials were not. suitable for a thoroughstudy of annual fluctuations of growth. Theyleft. little doubt, .nevertheless, that growth in1954-57 was substantially more rapid than inthe preceding 5 or 6 years (the growth rate droppedsharply in 1958). Since whitefish normally growmuch more rapidly in the early than in the lateyears of life, the rel~tively young fish of t.he 1959samples were in good position to benefit from the1954-57 period of heightened growth rat.e. Thewhitefish caught. in 1957 had also lived duringmost of the period of exceptional growth, but theywere of such advanced age that. this improvedgrowt.h did not. add mat.erially to t.heir size.
Differences among the average sizes of the fishfrom other areas of the lake were small at someages and substanthi.! at others. "Among age groupsrepi'esented by 16 or more fish at. each locality, t.hedifferences between the largest and smallest fish
84
increased from 0.4 inch and 0.1 pound in age-groupII to 3.7 inches and 1.6 pounds in age-group V.Somewhat puzzling is the t:0nsistency with whi~h
the age groups in samples from Whitefish Pointwere larger than those from Dollar Settlement.The t.wo collecting localities are barely. 30 milesapart (Whitefish Point is at the northwest.ernentrance to Whitefish Bay and Dollar Settlement'at the southern end). The diffe.rence appearsalmost surely to be real, but the true extent of theseparation of the two stocks remains to be learned.
The percent.age of legal-size whitefish in theage groups was influenced strongly. by differencesin the growth of fish taken at the various ports(table 5). Not one whitefish in any sample waslegal as age-group I, and only one was legal size asage-group II (a .17.1-inch fish captured at Marque.t,t.e in 1959). At. Bayfield in 1957 the first.whit.efish reached legal size as age-group IV, andage-group IX was the first in which all of the fishwere legal size. In 1959 at Bayfield, 33.3 percentof t.he. III-group fish were legal size and 59.1 percent had reached legal sjze as age-group V.
Much larger percentages of fish reached legal. size in the younger age groups at the ports east ofBayfield. More than 50 percent of the III-groupfish were legal.size at Marquette and' WhitefishPoint., and all were legal at age-group V at Whitefish Point and at age-group VI at Marquette. Itwas not until age-group VII was reached that allthe fish were legd size at Dollar Settlement.
LENGTH DISTRIBUTION
Dat.a on the length-frequency dist.ribution of theage groups (tables 6,7, and 8) provide comparisonsby age group between the stocks with the slowestand fastest. growth and show the length distributions of the combined age groups for the 1957and 1959 Bayfield samples and the conibinedcollec.tions at. Marquette, Whitefish Point, 'andDollar Settlement..
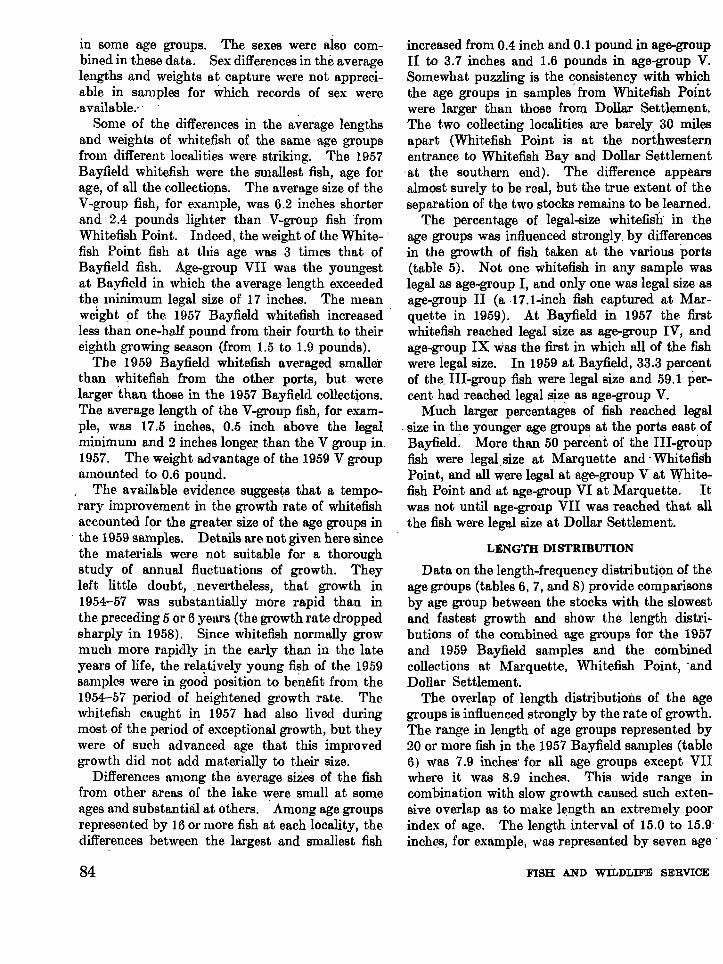
The overlap of length dist.ributions of the agegroups is influenced st.rongly by t.he rat.e of growth.The range in length of age groups represented by20 or more fish in the 1957 Bayfield samples (table6) was 7.9 inches' for all age groups except VIIwhere it was 8.9 inches. This wide range incombination with slow growth caused such ext.ensive overlap as to make length an extremely poorindex of age. The length interval of 15.0 to 15.9inches, for example, was represented by seven age'
FISH AND WILDLIFE SERVICE
TABLE 6.-Length distribution o(fQhitejish taken oJ! Bayjield, 1957
T.,tal length (lnch~~)
Age group
I . II III IV V VI VII VIII IX x--------------1-----------------..-------.--.-_.--
il0:gj.0-71:iO:.9:~_:_:_=_-:_:_:_:_:_-_=:_-_=:_:_-_=-_=:_:_:_:_:~:_~_:_-_=:__::__::_:_:__::_:_:_:_:_:_:_-_=:_:__: =_=_=_=_=_=_=_=_~_=_ --------r =-====----- ====------ ---------- ---------- --~------- ------ ---- ---------- -------------i- ====== ========== ========== ========== ========== ====.====== ==========9 4 c .. : _
!i:~~H::::::::::::::::::::::::::::::::::::::::.:::: :::::=_=_=_=_=_ =======-_~= Ii ---------- --------1:" ==~======= ========== ==::======= ========== ==========.21 2 1 114.0-14.9..__________________________________________ 18 19 ·4 1 :=:=:=:=== =~======== ==========
~~:&=~~:L========================================= ========== __: ~_ g ~ ~ ~ ~ ~ ---------- ----------K&=~~:L==================~====================== ========== ========== ========== ~ ~ ~ ~ 24 ========== =========:19.0-19.9 ._.__________________ 1 1 5 Ig --------2- ~_~
~:&=~:&======::------------------------------------ 1 3 2 1 . ~__22.0-22.9__ .. :::::::::::::::::::::::::::::::::::: :::::::::: :::::::::: :::::::::: :::::::::: :::::::::: :::::::::: ~. .. _~_ --------r :::::::::: :::::::::::
-------.-----------------------T.,tal number________________________________ 2 22 73 6 70 55 81 59 3 1Average length_______________________________ 7.5 1"1.0 13.3 16.6 15.5 16.7 17.4 17.9 19.7 18.6
----------1---1--------
TABLE S.-Length distribution oj" whitefish 'cattght . incommercial pound nets, tr~p nets, and gill nets
1.0-7.9___________________________ 2 .~ _8.0-8.9___________________________ 1 ._9.0-9.9___________________________ 310.0-10.9...__ '"___________________ 13 ======== ======== ------r ------·i11.0-11.9 -__________ 13 1 _12.0-12.9_________________________ 18 .___ -I 2-13.11-13.9_________________________ 25· 1 5 514.0-14.0_________________________ 42 3 9 11 2415.1)-15.9_________________________ 53 23 12 36 6516.11-16.9_________________________ 76 64 52 70 4017.0-17.9_________________________ 60 36 86 71- 5918.0-18.9_________________________ 38 11 61 53· 3119.0-19.9_________________________ 18 5 56 29" 1120.0-20.9_________________________ 7 3 53 22 521.0-21.9__.______________________ ·2 53 17· 422.0-22.9 .__________________ 1 41 9 223.0-23.9 .___ 14 10 424.0-24.9_________________________ 10 425.0-25.9.________________________ 4 126.0-26.9 ._____ 4 1·21.0-27.9 ._______ 1 _
1-----1-------
25417.046.1
458 34019.3 18.083.6 63.5
Mar- Whitp~ Dollarquette fish· Settle·
Point mentBayfield
1957 1959 1957--D9 1957-59 1951,1959
Total length (inrlU's)
TotSl number_______________ 372 145Average length c___ 15.8 16.9Perrentage legaL___________ 33.9 37.9TABLE 7.-Length distribution of whitefish taken off White-
fish Point, 1957-1959 .
groups (II-VIII). The span of ages was sb:: at·16:0-16.9 inches and several other I-inch intervalshad spans of five age groups'. Slow growth andbroad length ranges also caused the distributionsof five age groups to lie across the legal size limitof 17 inches.
The range in length of the age· groups in the1957-59 Whitefish Point samples(table 7) was alsolarge (9.9 inches at age-gro~p IV and 4.9 to 7.9inches in other age groups represented by morethan 20 fish) but overlapping was reduced by morerapid growth. . Because of the good growth and ascarcity of older fish, overlap did not exceed fourage groups at any I-inch interval. .T4e lengthdistributions of only three groups (III-V) fellacross the minimum legal size of 17 inches.
The lengths of. the 1957 Bayfield samples, agegroups combined, ranged from 7.0 to 22.9 inches
--------I-~------------
Total number•• ._ 1 21 118 94 31 7 2Averagelengtb. 10.5 15.1 17.1 18.8 21.7 22.9 21.9
10.0-10.9_____________________ 1 _
g:g:~kL::::::::::::::::::: :::::: ----i- :::::: :::::: :::::: :::::: ::::::13.0-13.9 . . ._____ 5·14.0-14.9_____________________ 4 --~-5- ----2- ====== :===== ======15.0-15.9__ . - 9 25 2 _16.0-16.9_ 8 53 9 . .__11.0-17.9_ 51 19 1 _18.0-18.9 ,_________________ 30 20 3 _19.0-19.9_ 7 21 1 _20.0-20.9 ._____ 7 9 5 1. _21.0-21.9 ._.__ 8 7 1 122.0-22.9 .. 2 6 1:!3.0-23.9 .__ ~ . .._ 2 4 4 _24.0-24.9 .__ 4 . _25.0-25.9 . ,.__ 1 _
T.,tal 1~I1gth (inches)Age group
I II III IV V VI VII
and had a· mean of only 15,8 inches (table 8).Only 33.9 perce~lt of the fish were legal size. Incontrast, the 1959 Bayfield whitefish had a rangeof only 6.9 inches, from .14.0 to 20.9 iriehes. Themean length in 1959 was 16.9 inches, and 37.9percent of the fish were legal size.
The length distributions of the fish from MarqueUe, Whit.efish POil)t, and Dollar Sett.Iementwere similar. The range from the shortest. to thelongest fish was 15.9 inches at Whitefish Point and16.9 inches at Marquette and Dollar Settlement.The average lengths of the whitefish from theseports ranged from 17.0 inches at Dollar Settlement.to 19.3 inches at Marquette. The percentage of
WHITEFISH IN LAKE SUPERIOR 85
I Actualaveragell for !Ish grouped by J.i-inclJ intervals.
legal-size fish in the total catches varied considerably-36.1 percent at Dollar Settlement, 63.5percent at Whitefish Point, and 83.6 percent atMarquette.
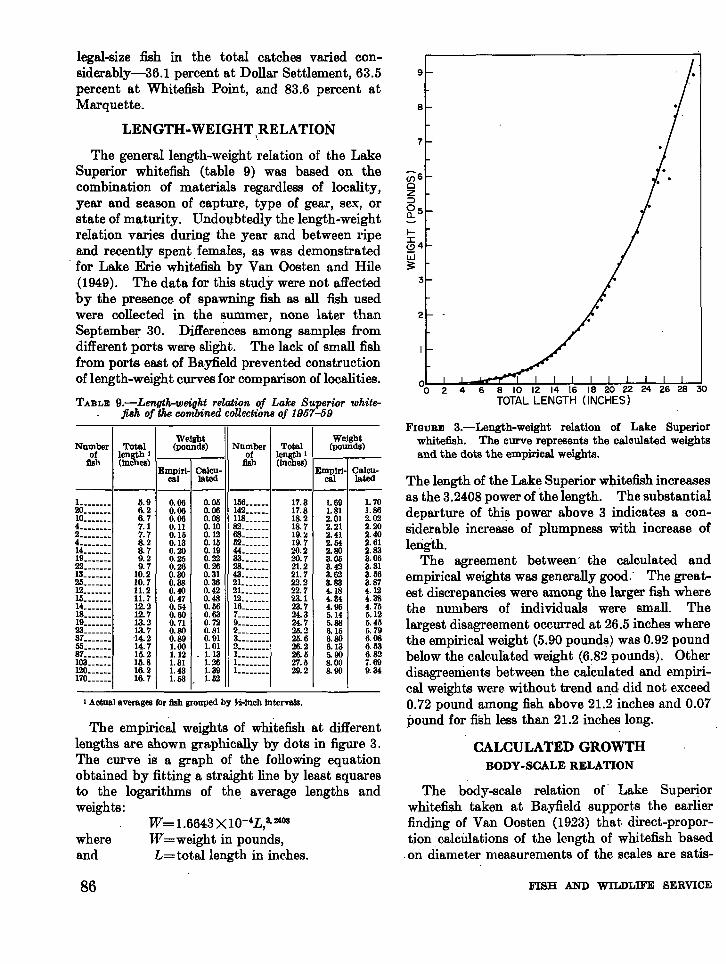
LENGTH-WEIGHT RELATION\
The empirical weights of whitefish at differentlengths are shown graphically by dots in figure 3.The curve is a graph of the following equationobtained by fitting a straight line by least squaresto the logarithms of the average lengths andweights:
FIGURE 3.-Length-weight relation of Lake Superiorwhitefish. The curve represents the calculated weightsand the dots the empirical weights.
The length of the Lake Superior whitefish increasesas the 3.2408 power of the length. The substantialdeparture of this power above 3 indicates a considerable increaSe of plumpness with increase oflerig"th.
The agreement between" the calculated andempirical weights was generally good: The greatest discrepancies were among the larger fish wherethe numbers of individuals were small. Thelargest disagreement occurred at 26.5 inches wherethe empirical weight (5.90 pound~) was 0.92 poundbelow the caleulated weight (6.82 pounds). Otherdisagreements between the calculated and empirical weights wt'xe without trend and did not exceed0.72 pound among fish above 21.2 inches and 0.07pound for fish less than 21.2 inches long.
CALCULATED GROWTHBODY-SCALE RELATION
The body-scale .relation of" Lake Superiorwhitefish taken at Bayfield supports the earlierfinding of Van Oosten (1923) that direct-proportion calcUlations of the lengt,h of whitefish based
"on diameter measurements of the scales are satis-
w= 1.6643 X 10⁻⁴L,3.2408
. W= weight in pounds,L= total length in inches.
whereand
Wl'lght
I IWeight
Number Total (pounds) Number Total (pounds)of len~h I of len~hl
llsb (inc ell) fish (In as)Empirl- Calen- Emplri- Calen-
cal lared cal mood-------------------L _______
5.9 0.06 0.05 156______ 17.3 1.69 1.7020_______6.2 0.06 0.06 142______ 17.8 1. 81 1.8610_______ 6.7 0.06 0.08 118______ 18. 2 2.01 2.024________7.1 0.11 0.10
82_______18.7 2.21 2.202________
7.7 0.15 0.1268_______
19.~ 2.41 2.404________8.2 0.13 0.15 52_______ 19.7 2.54 2.6114_______ 8.7 0.20 0.19
44_______20.2 2.80 2.8319_______
9.2 0.25 0.2233_______
20.7 3. 0Ii 3.0622_______ 9.7 0.26 0.2628_______
21.2 3.42 3.3113_______10.2 0.30 0.31 43_______ 21.7 3.62 3.5625_______10.7 0.38 0.36 2L. _____ 22.2 3.83 3.8712_______ 11.2 0.40 0.42 21. ______ 22.7 4.18 4.1215_______ 11.7 0.47 0.48 12_______ 23.1 4.34 4.3814_______ 12.2 0.54 0.56 16_______ 23.7 4.95 4.7518_______ 12.7 0.60 0.63 7________ 24.3 5.14 5.1219_______ 13.2 0.71 0.72 9________ 24.7 5.88 5.4523_______ 13.7 0.80 0.81 2________ 25.2 6.15 5.7937_______ -14.2 0.89 0.91
3________25.6 6.80 6.0855_______
14.7 1.00 1.012________
26.2 6.13 6.5387_______ 15.2 1.12 1.131._______
26. 5 5.90 6. 82103______ 15.8 1. 31 1. 26
1._______27.5 8.00 7.69120______ 16.2 1. 43 1.39
1. _______29.2 8.90 9.34170______ 16.7 1.53 1.52
The general length-weight relation of the LakeSuperior whitefish (table 9) was based on thecombination of materials regardless of locality,year and season of captur~, type of gear, sex, orstate of maturity. Undou.btedly the length-weightrelation varies during the year and between ripeand recently spent females, as was demonstrated
"for Lake Erie whitefish by Van Oosten and Hile(1949). The data for this study were not affectedby the presence of spawning fish as all fish usedwere collected in the summer, none later thanSeptember 30. Differences among samples fromdifferent ports were slight. The lack of small fishfrom ports east of Bayfield prevented constructionof length-weight curves for comparison of localities.
TABLE 9.-Length-weight relation 0/ Lake Superior !ohite-. fish 0/ the cOll~bined collections 0/1957-59
86 FISH AND WILDLIFE SERVICE
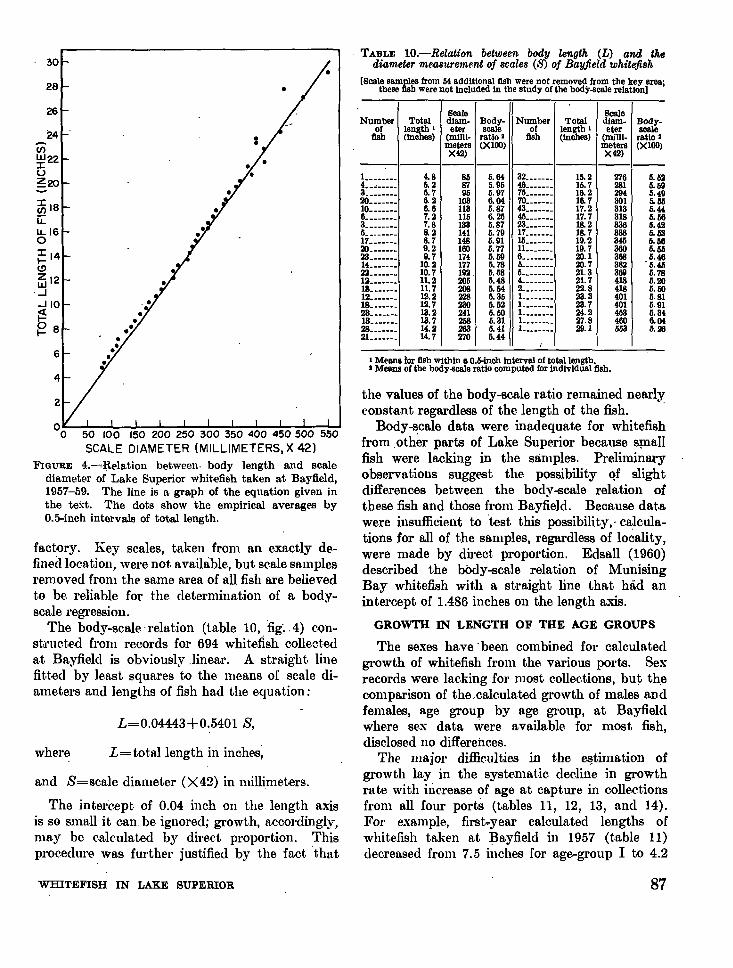
and S=scale diamet.er (X42) in millimeters.
The intercept of 0.04 inch on the lengt.h axisis so small it. can be ignored; growth, accordingly,may be calculat.ed by direct proport.ion. Thisprocedure was further justified by the fact t.hat
I Means tor fish within a O.6-inch Interval of totallengtb.I Means of the body-scale ratio computed for individual fish.
the values of t.he body-scale rat.io remained nearlyconstant regardless of t,he length of the fish. "
Body-scale data were inadequate for whitefishfrom other parts of Lake Superior because s!Jlallfish were lacking in the samples. Preliminaryobservations suggest the possibility Qf slightdifferences between the body-scale relation ofthese fish and those from Bayfield. Because dat.awere insufficient to "test. t.his possibility,· calculations for all of the samples, regardless of locality,were made by direct. proportion. Edsall (1960)described the body-scale relat,ion of MunisingBay whitefish with a straight line that had anintercept of 1.486 inches on the length axis.
GROWTH IN LENGTH OF THE AGE GROUPS
The sexes have' been combined for calculatedgrowth of whitefish from t.he various ports. Sexrecords were laeking for most eolleetions, but thecomparison of t.he.calculated growth of males andfemales, age group by age group, at Bayfieldwhere sex data were available for most fish,disclosed no differences.
The major difficult.ies in t,he ~timat.ion ofgrowth lay in the systematie decline in growthrat.e with increase of age at. capture in collectionsfrom all four ports (tables 11, 12, 13, and ]4).For example, first~year calculated lengths ofwhit.efish taken at Bayfield in 1957 (table 11)decreased from 7.5 inches for age-group I to 4.2
Scale ScaleNumber Total dlam· Body- Number Total dlam. Body-
of length I eter scale of length I eter scalefish Cinches) (mllll- ratio I fish (inches) (mill!. ratio I
meters (X100) meters (X100)X42) X 42)
---------- ----------1._______
4.8 85 5.64 32_______ 15.2 276 6.624._, _____ 5.2 87 5.95 46_______ 16.7 281 5.693________6.7 96 6.97
75_______16.2 294 5.4920. ______ 6.2 103 6.04
70_______16. 7 301 5.5510. ______ 6.6 113 5.87 43_______ 17.2 313 6.446. _______ 7.2 116 6.25 45_______ 17.7 318 5.663________
7.8 133 5.8723_______
18.2 336 6.426________8.2 141 6.79
17_______18. 7 338 6.63
17. ______ 8.7 148 6.9115_______
19.2 345 6.6620_____•• 9.2 160 6.77 11.______ 19.7 360 6.6623_______9.7 174 6.59
6________20.1 368 6.4614_______ 10.2 177 5.7S
5________20.7 382 . 5.45
22_______ 10.7 192 6.58 .6________
21. 3 369 5.7812_______ 11.2 205 5.484________
21. 7 418 6.20111.._____ 11.7 208 5.642________
22.8 418 5.6012. ______ 12.2 228 5.35
1._______23.3 401 5.8118_______ 12.7 230 5.52
1________23.7 401 5.9123. ______ 13.2 241 6.50
1________24.2 453 6.3413_______ 13.7 258 5.31
1._______27.8 460 6.0428. ______ 14.2 263 6.41 L _____ ._ 29.1 563 5.2621_______
14.7 270 5.44 ,
. TA.BLE lO.-Relation between body length (L) and thediameter meaSttremem of scales (8) of Bayfield whitefish
[Bcale samples from 54 additional fish were not removed from the key area;these fish were not included in the study of the hody-scale relation]•
L=0.04443+0.5401 S,
L=t.ot.allength in inches;where
26
4
28
6
30
24en~22u~20
V518i::Lu..16o~14(,!)
~12"-I-110~~8
50 100 150 200 250 300 350 400 450 500 550
SCALE DIAMETER (MILLIMETERS, X 42)FIGURE 4.~Relation between. body length and Bcale
diameter of Lake Superior whit.efish taken at Bayfield,1957-59. The line is a graph of the equation given inthe text. The dots show the empirical averages byO.5-inch intervals of total length.
fact.ory. Key scales, t.aken from an exact.ly defineCI location, were not. avaihible, but scale samplesremoved from the same area of aU fish are believedt.o be reliable for the determinat.ion of a bodyscale regression.
The body-scale -relation (table 10, fig'." 4) construct.ed from records for 694 whit.efish collectedat Bayfield is obviously.linear. A straight. linefitt.ed by least squares t.o t.he means of scale diameters and lengths of fish had t.he equation:
WHITEFISH IN LAKE SUPERIOR 87
TABLE H.-Calculated total length (inc-hes) of whitefish ta-ken at Bayfield in 1957 and 1959 and average cal.wlated lengths Jor. each year s collections and lor the combined collections
[In the bottom section the numbers of !Ish are in parenthese.sl
Calcu\ated length at end of year of lifeAge and year of capture Number 1---,.----,---,---,---,---,---,---.,----.----
__.____________ offish __i 2 3. 4 5 6 7 8_L_9_I_l_0_
15.9 _14.8 16.8 _13.8 _ 15.8 17.5 _14.0 16.1 18.3 19.7 _~2 U8 m6 n9 a6
-----i4:il- :::::::::: :::::::::: :::::::::: :::::::::: ::::::::::17.0 " _13.612. 411.711.811.2
U -·---iO.-3- ------:--- --:-:-:--: :---:-:::: :--------- :-----:-:: :::::::::- ::-------- ---.------5.4 8.8 -----i2:6- ::_:_:_::__ :::_: ::::::::: _:::::.: : __ :::::::: ::::::::::5.3 9.9 14.2 . • . _5.2 8.4 11.4 15.3 . _5. 6 8. 9 12. 4 111.14.2 6.9 9.6 12.25.3 8.2 11. 2 14.4~2 6.7 8.9 nl4.6 6. 5 8. 3 10. 1~6 6.1 ~9 9.6~8 ~9 8.0 9.7~4 6.3 8.2 9.8
22273
66
117702255815931
I 1957__ . • .' _II 1957__ . . _
III 1957__ . . .. _1959 • c _
IV 1957 • • . _1959 • ... _
V 1957 . __1959 . • _
VI 1957 . _VII 1957 . . _
VIII 1957 ~ _IX 1957 . . _X 1957 _
Average:1957' . _
1959__ • _
1957,1959 , _
4.7(372)5.5
(145)5.1
7.3(370)8.8
(145)8.0
9.5(348)12.3(145)10.9
10.8(275)15.8(139)13.3
ml U8 m4 al m5 ~2(269) (199) (144) (63) (4) (I)17.0 . __ ,, _
(22) .. • • _
~O' m7 m3 ~O n4 ~1
1 Based on successive addition of grand average increments bcyond theseventh year of life. .
, Unwelghted mean average lengths for the 1957 and 19fo9 samples tnroullb
the first 5 years of me; lengths for larer years obtained by successive additionof Sllnual increments for tbe.llsb of the 1957 sample.
.inches for age-group V. Second-year calc.ulatedlengths decreased from 10.3 inches for the IIgroup to 6.1 inches for VIII group. Similardiscrepancies occurred in the data for all of thecollections. Second-year calculated lengths, forexample, decreased from 11.6 inches for the IIgroup to 7.9 inches for the VI group at Ma,rquet.te(table 12), from 12.2 inches for the II group to8.4 inches for the VII group at Whitefish Point,(table 13), and from 11.7 inches for the II groupto 8.0 inches for the V group at. Dollar Settlement(table 14).
The high calculated lengths of the younger agegroups and the low values for the older fish canbe traced to two major sources: gear selectionof the larger fish in the younger age groups, andthe progressive d_estruction of the faster growing
fish of a year class as they attain the legal lengthof· 17 inches. Gear selection leads t.o overesti.mates of growth of the younger age groups,and the selective destruct,ion of the faster growingfish modifies progressively the growth characteristics of the survivors, and thus leads to successivelylllOre severe underesti.mates of the growth thatwould occur if the stock were not subjected tothis type of exploitation. The selective destruct.ion can end only when the smallest membersof the year class reach legallengt.h.
A comparison of calc-ulate.d lengths of whitefishtaken by the Siscowet with those tltken from commercial gear at Bayfield in 1959 (tal?le 15) illust.rates. bias through gear selection. The calculated lengths of fish from the commereialsamples were nearly alwtl,ys higher than the
TABLE 12.-Calculated total length (inches) oj wMtefish take·n off Marquette, 1957-59
[In the bottom section the numbers of fish are In parentheses]
Age groupCalculated length at end of year of life
~~'tts~r I---.,----·,....------,---j--....,------;------;,-------;,-------;,---2 3 4 5 6 7 8 9 10
------------1----------------------------------II. . . _III. . _IV_. . _V . _VL _VII . . _VIIL . _IX . .. . _x ,, _
l~g ~:g I~:~ -----iii!- :~:::::::: :::::::::: :::::::::: :::::::::: :::::::::: :::::::::: ::::::::::m u ~:g ~U ~~:~ -----iil.-li- :::::::::: :::::::::: :::::::::: :::::::::: ::::::::::38 5.2 7.9 10.6 13.7 17.3 20.5 . _12 5.6 8.1 10.5 13.2 16.1 19.4 21.8 . _5 5.3 8.0 11.1 14.2 17.8 20.9 23.0 24.3 _1 4.5 6.6 8.6 10.1 11.2 13.2 17.0 18.9 23.1 _3 5.5 8.0 9.4 11.9 14.-0 16.8 19.2 21.8 23.4 25.0-----------------------------------
Orand average I.~-----------------':":":'::":'~I (~~) (~i2) ~~~)I :g2~) ~M)' ~5g) 2M) 22.(g) 25.(~) 26(~)
I BlII!ed on successive addition of mean increments in the 9th and lOth years or life.
88 FISH AND WILDLIFE SERVICE
-----1-----------------
1 Based on addition of the Increments in the seventh year of lIle.
Orand average '_ 6.6 11.2 14.7 17.6 20.4 21. 7 23.3(340) (339) (312) (134) (40) (9) (2)
TABLE 13.~Calc1llated total length (t:nches) of whitefishtaken off Whitefish Point, 1957-59
[In the bottom section the numbers of fish are In parentheses)
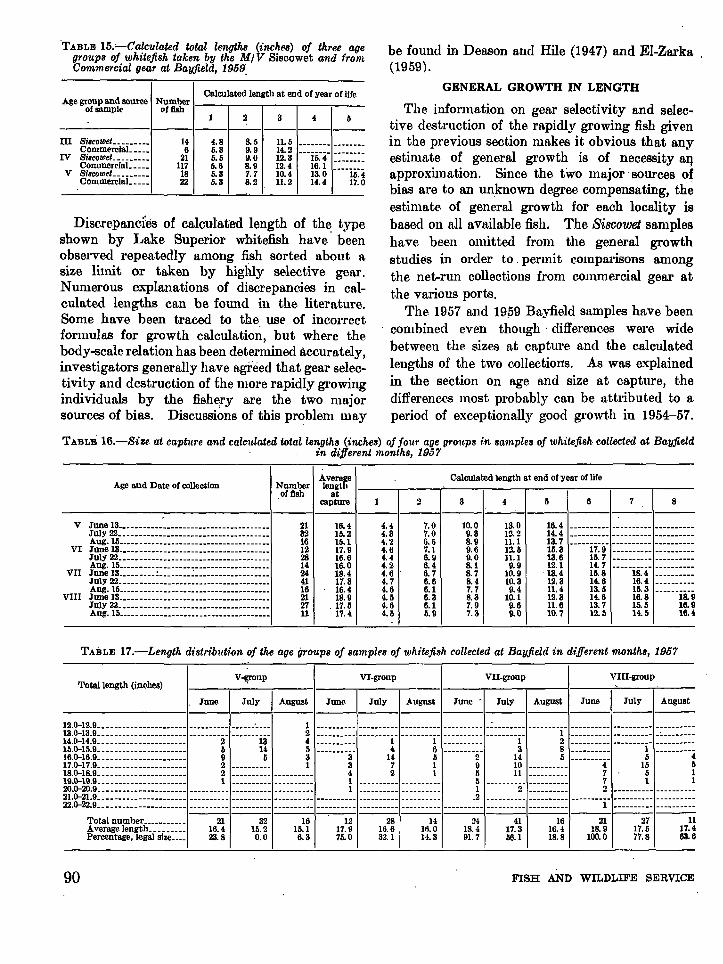
those taken later. The shift was progressive;the lengths of fish taken in .June were greaterthan for ,those taken in July; the lengths of fishtaken in July were greater than for those taken inAugust. The length distributions of the agegroups (table 17) also show a systematic decreasein size as the 'summer progressed. With onlyone exception (August V-group sample) the percentage of legal fish in each of the age groupsdecreased as the season advanced.
The pound net fishery for whitefish begins atBayfield about mid-June, and legal-siz~ fish areselected immediately from the population. - Asthe season progresses the number of legal-sizewhitefish in the commercial catch, despite sunimergrowth, -declines until middle and late Augul!ltwhen operations cease because production levelsmake it economieally inlpossible .to continue.In 1957,44.7 percent of the whitefish in the entire'June sample were legal size. In July, 37·.9 percent were legal, and by August only -16.3 werelegal, a reduction of 28.4 in the percentage sinceJune.
Since the growth rate of the Bay.field whitefishis so slow, the number ,of legal-size fish takenfrom the fishery far exceeds the number of undersized fish growing to legal size during the earlysummer fishing season.
Records on the progress of the season's growth(table 18) suggest that one-third or more of thetotal growth occurs after August 15' which isabout the time that the heavy pound netting ends.This growth, though less than 1 inch, is sufficientto bring a good' number of whitefish into legalsize ,I:llnge by the following spring when poundnetting is resumed.
76532
Calculated length at end of year of lIle
1 6. 8 _27 6.8 12. 2 _
178 6.7 11.7 15.1 _94 6.7 10.6 14.3 17.8 _31 6.4 10.5 14.2 17.8 20.9 _7 5.5 8.7 12.8 15.9 19.0 22.3 _2 5.1 8.4 11.8 14.9 17.5 19.8 21.4
Num·b~hof 1---..,.---....,...,--;----,,.----..,.--Age group
calculated lengths from the Si.sco'we.t saniples.The differences were particularly great for agegroups III and V but were limited in age-group IV.Whitefish collected by the Siscowet were takenfrom small-mesh trawls (2~-inch-mesh body;'~-in~h-mesh cod end) and experimental" gill netswith mesh sizes ranging from 1 to 5 inches by'~~inch intervals. The commercial samples weretaken from 4%-inch-mesh pound nets and 4}!;-inchmesh 'gill nets. Undoubtedly only the largermembers. of t,he younger age groups were retained 'by the large meshes of the commercialgear, whereas most sizes were retained by theSisco1Vet gear.
The effec,t of the progressive destruction of thefaster growing fish is illustrated by records forwhitefish samples collected in 1957 at Bayfield.in Jun~, July, and August (table 16). Thegrowth of members of t,he same age group takenin succes~ive' months differed widely. With fewexceptions, whitefish at age-groups V to VIIItaken earlier' in the season had greater lengths atcapture and higher c81culated lengths than did
1 _II _III _IV _V ~ _VI. c_VII. _
TABLE 14.~Calculatedtotal length (inches) of whitefish taken off Dollar Settlement, 1957-59
[In the bottom section the numbers of fish are in parentheses)
76532
Calculated length at end of year of life~~~: ---~----;---.,....,---...----:-.-------;----..,.----,-----,--
8 9 10
Age group
--_·_---------1---------- -------.-------------------I. : : _II. _III. _IV : ,V _VL _VIL _VIIL _X _
14095475510411
7.0 : ---------- ----------6.3 11.7 ._ --.------- ----------6.3 9.9 14.2 ----------
, 6.0 9.1 12.5 16.1 ----------5.1 8.0 10.6 14.1 17.2 . __5.3 8.6 B.3 13.4 16.5 19.1 ----------5.4 8.1 10.4 12.3 14.8 17.7 20.2 _5.5 9.5 11.5 13.1 15.7 17.-1 18.7 19.4 ----------5.0 8.1 9.9 11.4 14.7 18.1 22.1 23.4 24.4 25.8-------------------_.-------------
Orand average I 5.9 '9.5 12.7 14.8 ,16.9 18.6 20.3 21. 4 22.4 23.8.--.--------------- .. -------- (254) , (253) (213) (118) I.m (16) (6) (2) (1) (1)
I Based on successive addition of the mean Increments in the 9th and 10th years of life.
WHITEFISH IN LAKE SUPERIOR 89 .
"TABLE 15.'-Calculated total lengths (inches) of three agegroups of whitefish taken by the M/V Siscowet and (romCommercial gear at Bayfield, 1959.
be found in Deason and Hile (1947) and EI-Zarka(1959).
Age group and source NumberCalculated length at end of year of lffe
ofs"mple (If fish1 2 3 4 5
----------III Si,~owet.________ 14 4.8 8.5 11. 5 -------- -..------CommerclaL ____ 6 5.3 9.9 14.2 -..------IV Si,rowef._________ 21 5.5 9.0 12.3 15.4 -.. ------Commercial _____ 117 5.6 8.9 12.4 16.1 -0--i5:4V Si,cowel. ________ 18 5.3 1.7 10.4 13.0
CommerciaL ____ 22 5.3 8.2 11.2 14.4 17.0
Diserepanefes of calculated length of th~ typeshown by Lake Superior whitefish have beenobserved repeatedly among fish sorted ttbout asize limit or taken by highly selective gear.Numerous explanations of discrepaneies in ealculated lengths can be found in the literature.Some have been traced to the use of ineorreetformulas for growth ealculation, but where thebody-seale relation has been determined Reeurately,investigators generally have agreed that gear selectivity and destruction of the more rapidly growingindividuals by the fish~ry are the two majorsources of bias. Diseussions of this problem may
GENERAL GROWTH IN LENGTH
The information on gea.r selectivity and selective destruction of the rapidly growing fish givenin the previous section makes it obvious that anyestimate of general growth is of necessity aI).
approximation. Since the two major" sources ofbias are to an unknown degree compensating, theestimate of general growth for eaeh locality isbased on all available fish. The Siscowet sampleshave been omitted from the general growthstudies in order to" permit comparisons amongthe net-run eolleetions from commercial gear atthe various ports.
The 1957 and 1959 Bayfield samples have beencombined even though' differences were widebetween the sizes at capture and the ealculatedlengths of the two eolleetiolls. As was explainedin the section on age and size at eapture, thedifferences most probably ean be attributed to aperiod of exceptionally good growth in 1954-57.
TABLE 16.-Size at capture and calcu/.ated total /.engths (inches) of four age groups in samp/.es of whitefish collected at Bayfie/.din different months, 1957
Calculated length at end of year of lifeAver~~~'K~~r 16~~t I I---,---r----;----,---,---,---,---
capture 2 3 4 5 6 7 8
Age and Date of collection
---------------1------------------"-------------V
June 13____0_________________________________21 16.4 4.4 7.0 10.0 13.0 16.4 ---------- -------- ...- ----------July 22____0_________________________________32 15.2 4.3 7.0 9.3 12.2 14.4 ---------- ---------- ----------Aug. 15____0_________________________________16 15.1 4.2 6.5 8.9 11.1 13.7 -----i7:ii ---------- ----------
VIJune 13____0_________________________________
12 17.9 4.6 7.1 9.6 12.5 15.3 -------- ...- ----------July 22____0_________________________________2Il 16.6 4.4 6.9 9.0 11.1 13.6 15.7 ... --------- -----_ .. ---Aug. 15______________________________________14 16.0 4.2 6.4 8.1 9.9 12.1 14.7 ----------
VII June 13.________ ~________ : ___________________ 24 18.4 4.6 6.7 8.7 10.9 "13.4 15.8 18.4July 22______________________________________41 17.3 4.7 6.6 8.4 10.3 12.3 14.6 16.4Aug. 15______________________________________16 16.4 4.6 6.1 7.7 9.4 11.4 13. 5 15.3 ------iaiiVIII
June 13______________________________0_______21 18.9 4.5 6.3 8.3 10.1 12.3 14.6 16.8July 22______________________________0_______27 17.5 4.6 6.1 7.9 9.6 11.6 13.7 15.5 16.9Aug. 15______________________________________11 17.4 4.5 5.9 7.3 9.0 10.7 12.5 14.5 16.4
TABLE 17.-Length d7'stdbution of the age groups of samples of whitefish collected at Bayfield in different months, 1957
VIII-groUpVII-groupVI-groupTotal length (inches)
_________I""_J_UO_6 JU_I_Y__A_u_gu_s_t _JU_O_6_1_JU_l_Y__A_U_gu_s_t _Ju_n_e_. _J_Ul_Y__A_u_gUS_t _Ju_n_e J_Ul_Y__A_u_gu_st_
~~:t~~t=========::==::::===: ::=:==:=:: ::::==':==: ~ ---------- ----0----- ---------- ------.--- ---------- ----·---i- ::=::::::: :::::::::: :~:==:=:=:14.0-14.9______________________ 2 13 4 ---------- --------i- --------i- ---------- --------i- 2 • _15.0-15.9______________________ 5 14 5 4 6 3 8 1 _16.0-16.9______________________ 9 5 3 3 14 5 2 14 5 5 417.0-17.9______________________ 2 1 3 7 1 9 10 0_____ 4 15 518.0-18.9______________________ 2 __0 0_ 4 2 1 5 11 0_____ 7" 5 119.0-19.9______________________ 1 0_ 1 5 __ ._ .. 7 1 120.0-20.9 0_ 1 1 2 2 0 _
21.0-21.9 ._____ .2 . • _22.0-22.9 . 0_ 1 0 _
Totaloumber --2-1 -----a2--1-6~--2-8--1-4 -----;---4-1 --1-6 --2-1--2-7---11Averagelength 16.4 15.2 15.1 17.9 16.6 16.0 18.4 17.3 16.4 18.9 17.5 17.4Percenta,,"C, legal size.___ 23.8 0.0 6.3 75.0 32.1 1·1. 3 91. 7 56.1 18.8 100.0 77.8 63.6
90 FISH AND WILDLIFE SERVICE
---------1---1---------
TABLE IS.-Amount 0{8ea80n'8 growth in length (inche8) oj, Jour age group8 oj Bayfield whitefi8h up to and Jollowing
A1tgU8t 15, 1957
oo~---ll-:-'--;'2--+3---:4!;-----i5;---t6--+7---,sf,-----!g,----,!,JIOYEAR OF LIFE
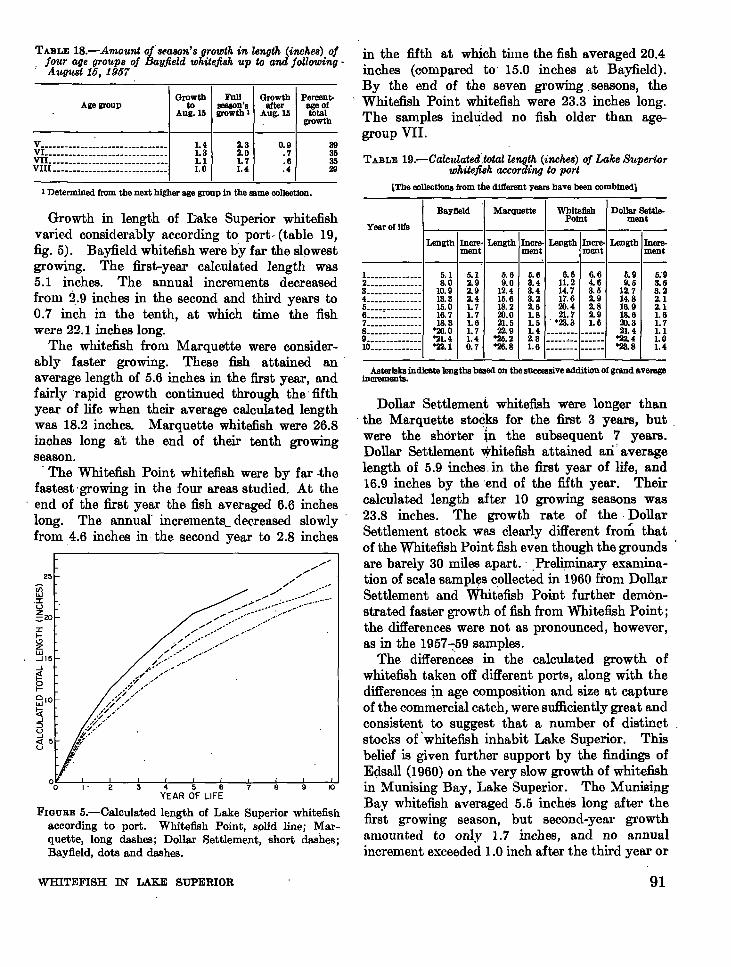
FIGURE 5.-Calculated length of Lake Superior whitefishaccording to port. Whitefish Point, solid line; Marquette, long dashes; Dollar Settlement, short dashes;Bayfield, dots and dashes.
Baylleld Marquette Wbltellsb Dollar Settle-
Year of lifePoint ment
Length Inere- Length Incre- Length Incre- Length Incre-ment ment ment ment
----------L __•__________
5.1 5.1 6.6 6.6 6.6 6.6 5.9 5:92___••_________ 8.0 2.9 9.0 3.4 11.2 4.6 9.5 3.63______________10.9 2.9 12.4 3.4 14.7 3.5 12.7 3.24______________13.3 2.4 16.6 3.2 17.6 2.9 14.8 2.1
~::::::::::::::15.0 1.7 18.2 2.6 20.4 2.8 16.9 2.116.7 1.7 20.0 1.8 21.7 2.9 18.6 1.67____ •_________18.3 1.6 21.5 1.5 . ·23.3 1.6 20.3 1.78___________• __
·20.0 1.7 22.9 1.4 ------- .. ------ 21.4 1.19._____________·21.4 1.4 ·25.2 2.3 -----~-- ------ "22. 4 1.010_____________·22.1 0.7· ·26.8 1.6 -------. ------ ·23.8 1.4
in the fifth at which time the fish averaged 20.4inches (compared to' 15.0 inches at Bayfield).By the end of the seven growing .seasons, theWhitefish Point whitefish were 23.3 inches long.The samples included no fish older than agegroup VII.
TABLE 19.-Calcltlated·.totallength (inche8) oj Lake S1tperiorwhitefi8h according to port
[The collections from the dlfterent years have been combined]
In~::'~.indlcate lengths based on the successive addition of grand aveflll!8
Dollar Settlement whitefish were longer than. the Marquette sto~~ for the first 3 years, but .were the shorter ~n the subsequent 7 years.Dollar Settlement whitefish attained an' averagelength of 5.9 inehes.in the first year of life, and16.9 inches by the ·end of the fifth year. Theircalculated length after 10 growing seasons was23.8 inches. The growth rate of the· DollarSettlement stock was dearly different from thatof the Whitefish Point fish even though the groundsare barely 30 miles apart...Preliminary examination of scale samples collected in 1960 from DollarSettlement and Whitefish Point further demonstrated faster growth of fish from Whitefish Point;the differenees were not as pronounced, however,as in the 1957-:-59 samples.
The differences in the calculated growth ofwhitefish taken off different ports, along with thedifferences in age composition and size at captureof the commercial catc.h, were sufficiently great andconsistent to suggest t,hat a number of distinctstoeks o(whitefish inhabit Lake Superior. Thisbelief is given further support by the findings ofE~sall (1960) on the very slow growth of whitefishin Munising Bay, Lake Superior. The MunisingBay whitefish averaged 5.5 inehes long after thefirst growing season, but sec.ond-year growthamounted to only 1.7 inehes, and no annualineremellt exceeded 1.0 inc.h after the third year or
39353529
0.9.7.6.4
Growth Percent-III'ter age of
Aug. 15 totalgrowth
2.32.01.71.4
FullSlllI8OIl'Sgrowth I
1.41.31.11.0
Growthto
Aug. 15Age group
I Determined from the next higher lIlle group In the ssme collection.
Growth in length of Dake Superior whitefishvaried considerably according to port- (table 19,fig. 5). Bayfield whitefish were by far the slowestgrowing. The first-year calculated length was5.1 inches. The annual increments decreasedfrom 2.9 inches in the second and third years to0.7 inch in the tenth, at which time the fishwere 22.1 inches long.
The whitefish from Marquette were considerably faster growing. These fish. attained an'av:erage length of 5.6 inches in the first year, andfaIrly 'rapid growth continued through the· fifthyear of life when their average calculated lengthwas 18.2 inches. Marquette whitefish were 26.8inches long a't the end of their tenth growingseason.
. The Whitefish Point whitefish were by far -thefastest 'growing in the four areas studied. At theend of the first year the fish averaged 6.6 incheslong. The annual' increments_ deereased slowlyfrom 4.6 inches in· the second year to 2.8 inches
WHITEFISH IN LAKE SUPERIOR 91
----1------------------
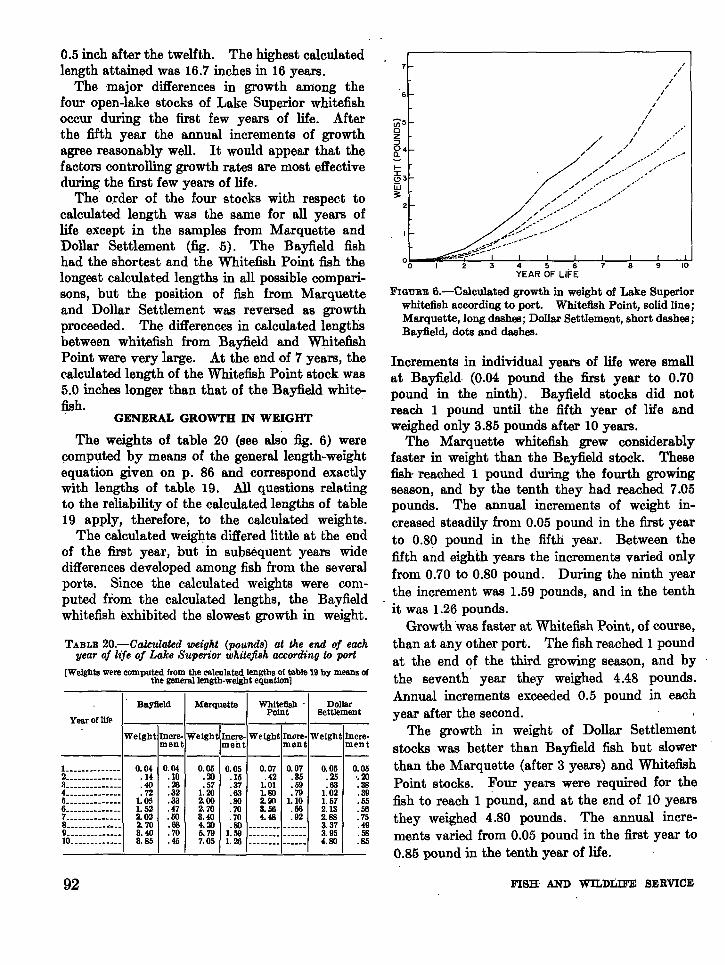
TABLE 20.-Calculated weight (pOUnd8) at the end oj eachyear oj life of Lake Superior whitefi8h according to port
[Weights were computed from the C11lculated lengths of table 19 by means ofthe general length-weight equation]
L _____________0.04 0.04 0.05 0.05 0.07 0.07 0.05 0.052______________.14 .10 .20 .15 .42 .35 .25 ·.20a______________.40 .26 .57 .37 1.01 .09 .63 .384______________.72 .32 1.20 .63 1.80 .79 1.02 .395______________
1.05 .33 2.00 .80 2.90 1.10 1.57 .556______________1.52 .47 2.70 .70 3.56 .66 2.13 .567______________2.02 .50 3.40 .70 4.48 .92 2.88 .758__________ •___2. 70 .68 4.20 .80 -------- ------ 3.37 .499______________3.40 .70 5.79 1.09 -------- ------ 3.95 .5810. ____________3.85 .45 7.05 1.26 -------- --._.... 4.80 .85
92
7
6
ti)5oz~
~4
FISH' AND WILDLIFE SERVICE
,I,
I,I
I,I,
I
I' /
/ II .,//1 / .
~~:.:<~:::::::.::::::/ ..-
..;<.~::> ..-....• ~e::-.:::;-(:.:-::_.... I _1
oO!:--"!'I"'"""=':::!-z--:!3~----=-4 --;5~---:6-"'"""*"7 -~8~~9--;:IO:;-'YEAR OF LIFE
FIGURE 5.-Calculated growth in weight of Lake Superiorwhitefish according to port. Whitefish Point, solid line;Marquette, long dashes; Dollar Settlement, short dashes;Bayfield, dots and dashes.
Increments in individual years of life were smallat Bayfield. (0.04 pound the first year to 0.70pound in the ninth). Bayfield stocks did notreach 1 pound until the fifth year of life andweighed only 3.85 pounds after 10 years.
The Marquette whitefish grew considerablyfaster in weight than the Bayfield stock. Thesefish- reached 1 pound during the fourth growingseason, and by the tenth they had reached 7.05pounds. The annual increments of weight increased steadily from 0.05 pound in the first yearto 0.8~ pound in the fifth year. Between thefifth and eighth years the increments varied onlyfrom 0.70 to 0.80 pound. During the ninth yearthe increment was 1.59 pounds, and in the tenthit was 1.26 pounds.
Growth 'was faster at Whitefish Point, of course,than at any other port. The fish reae-hed 1 poundat the end of the third growing season, and bythe seventh' year they weighed 4.48 pounds.Annual increments exceeded 0.5 pound in eachyear after the second.
The growth in weight of Dollar Settlementstoe-ks was better than Bayfield fish but slowerthan the Marquette (after 3 years) and WhitefishPoint stocks. Four years were required for thefish to reach 1 pound, and at the end of 10 yearsthey weighed 4.80 pounds. The annual increments varied from 0.05 pound in the first year to0.85 pound in the tenth year of life.
Whitefish • DollarPoint Settlement
MarquetteBayfield
Weight lncre- Weight lncre- Weight lncre- Weight Incre-ment mei1t ment ment
Year ofllfp
GENERAL GROWTH IN WEIGHT
The weights of table 20 (see also fig. 6) were~mputed by means of the general length-weightequation given on p. 86 and correspond exactlywith lengths of table 19. All questions relatingto the reliability of the calculated lengths of table19 apply, therefore, to the calculated weights.
The calculated weights differed little at the endof the first year, but in subsequent years widedifferences developed among fish from the severalports. Since the calculated weights were computed from the calculated lengths, the Bayfieldwhitefish exhibited the slowest growth in weight.
0.5 inch after the twelfth. The highest calculatedlength attained was 16.7 inches in 16 years.
The major differences in growth am:ong thefour open-lake stocks of Lake Superior whitefishoccur during the first few years of life. Afterthe fifth year the annual increments of growthagree reasonably well. It would appear that thefactors controlling growth rates are most effectiveduring the first few years of life.
The' o.rder of the four stocks with respec.t tocalculated length was the same for all years oflife except in the samples from Marquette andDollar Settlement (fig. ·5). The Bayfield fishhad the shortest and the Whitefish Point fish thelongest calculated lengths in all possible comparisons, but the position of fish from Marquetteand Dollar Settlement was reversed as growthproceeded. The differences in calculated lengthsbetween whitefish from Bayfield and WhitefishPoint were very large. At the end of 7 years, thecalculated length of the Whitefish Point stock was5.0 inches longer than that of the Bayfield whitefish. .
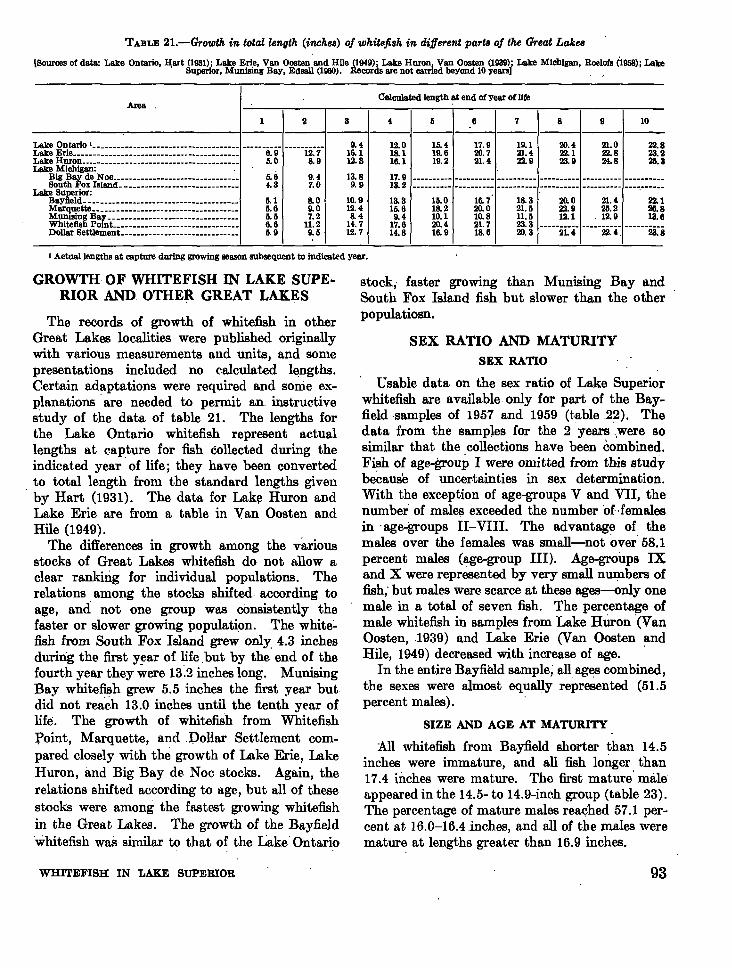
TABLE 21.-Growth in total length (inches) of whitefish in different parts of the Great Lakes
[Bources of data: Lake Ontario, Hart (1931); Lake Erie, Van Oosten and Hile (1949); Lake Huron, Van Oosten (1939){' Lake Michigan, Roelofs (1958); Lake, Buperior. Munising Bay, Edsall (1960). Records are not carried beyond 10 years . ,
AreaCalculated length at end of year of life
2 3 4 5 6 7 8 9 10
------,.---------1----1---·1------------------------22.823.225.8
21.022.824.8
20.422.123.9
19.121.422.9
17.920.721.4
15.419.619.2
12.018.116.117.9 - __• _13.2 " _
13.3 15.0 16.7' 18.3 20.0 21.4 22.115. 6 18. 2 20. 0 21. 5 22. 9 25. 2 26. 89,4 10. 1 10. 8 11. 5 12. 1 . 12. 9 13. 617.6 20.4 21. 7 23. 3 _
14.8 16. 9 18.6 20.3 21.4 22. 4. 23.8
9.416.112.3
13.89.9
10.912.48.4
14.712.7
9.47.0
8.09.07.2
11.29.5
5.64.3
5.15.65.56.65.9
Lake Ontario , _Lake Erie__________________________________________ 6.9 12. 7Lake Huron________________________________________ 5.0 8.9Lake Michigan: .Big Bay de Noc • _
Bouth Fox Island _
L~:~E:J~r~ _Marquette _Munising Bay _Whitefish Point _Dollar Bettlement _
I Actual lengths at capture during growing season subsequent to indicated year.
GROWTH OF WHITEFISH IN LAKE SUPERIOR AND OTHER GREAT LAKES
The records of growth of whitefish in otherGreat Lakes localities were published originallywith various measurements and units, and somepresentations included no calculated l~ngths.
Certain adaptations were required and sonie explanations .are needed to permit an. instructivestudy of the data of table 21. The lengths forthe Lake Ontario whitefish represent actuallengths at capture for fish collected during theindicated year of life; they have been convertedto total length from the standard lengths given
. by Hart (1931). The data for Lak~ Huron andLake Erie are from a table in Van Oosten andHile (1949).
The differences in growth among the variousstocks of Great Lakes whitefish do not allow aclear ranking for individual populations. Therelations among the stocks shifted according toage, and not one group was consistently thefaster or slower growing populati9n. The white:'fish from South Fox Island grew only 4.3 inchesduring the first y~ar of life.but by the end of thefourth year they were 13~2 inches long. MunisingBay whitefish grew 5.5 inches the first year butdid not reach 13.0 inches until the tenth year oflife. The growth of whitefish from Whitefishfoint, Marquette, and .Dollar Settlement compared closely with the growth of Lake Erie, LakeHuron, and Big Bay de Noc stocks. Again, therelations shifted according to age, but all of thesestocks were among the fastest growing whitefishin the Great Lakes. The growth of the Bayfield'whitefish was similar to that of the Lake" Ontario
stock; faster growing than Munising Bay andSouth Fox Island fish but slower than the otherpopulatiosn.
SEX RATIO AND MATURITYSEX RATIO
Usable data on the sex ratio of Lake Superiorwhitefish are available only for part of the Bayfield ·samples of 1957 and 1959 (t,able .22). Thedata from the sampJes for the 2'years ""were sosimilar that the collec.tions have been combined.Fish of age-group I were omitted from this studybecause of uncertainties in sex determination.With the exception of age-groups V and VII, thenumber of males exceeded the numberof.·femalesin -age":groups II-VIII. The advantage of themales over the females was small-not over 58.1percent males (age-group III). Age-groups IXand X were represented by very small numbers offish; but males were scarce at these ages--only onemale in a total of seven fish. The percentage ofmale whitefish in samples from Lake HUron '(VanOosten, ,1939) and Lake Erie (Van Oosten andHile, 1949) decreased with increase of age. '
In the entire Bayfield sample, all ages combined,the sexes were almost equally repre~ented (51.5percent males).
SIZE AND AGE AT MATURITY
All whitefish from Bayfield shorter than 14.5inches were immature, and all fish longer than17.4 inches were mature. The first mature' maleappeared in the 14.5- to 14.9-inch group (table 23).The percentage of mature males rea~hed 57.1 percent at 16.0-16.4 .inches, and all of the males weremature at lengths greater than 16.9 inches.
WHITEFISH IN LAKE SUPERIOR 93
TAl!LE 22.-86.'1: ratio of whitefiBh taken at Bayfield[Based on the comblned collections of 1967 and 1959]
Age group " Number of Number of Percentagemales fema\e8 males
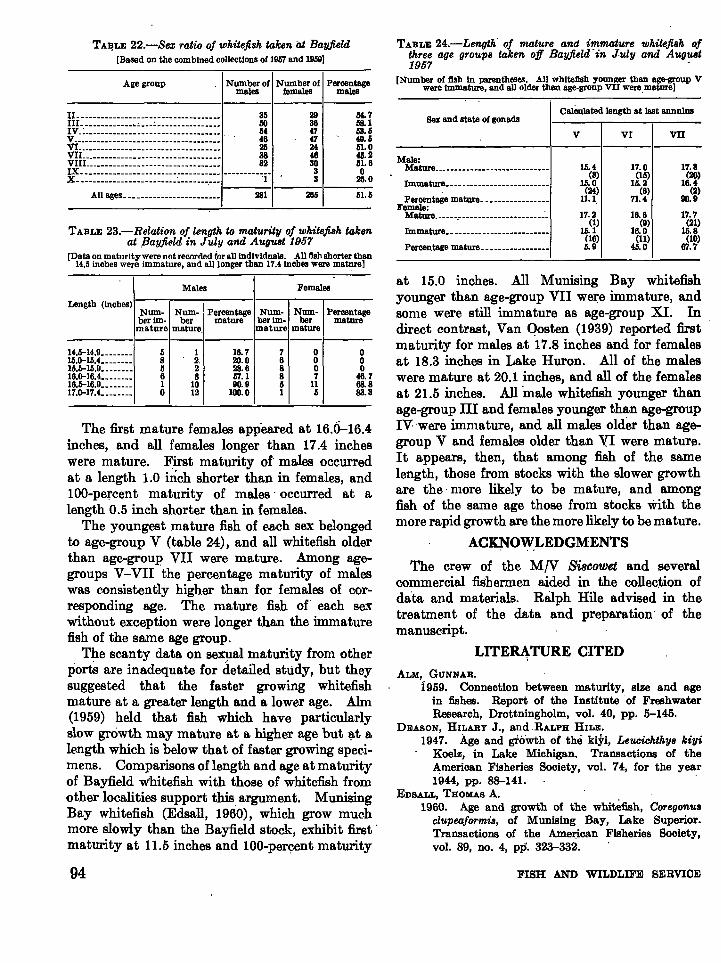
TABLE 24.-Length' of mature and immature whitefiBh ojthree age groupB taken off Bayfield"in July and AUgUBt1957
[Number of fish In PllI'Bntheses. All whitefish younller than age-group Vwere Immature, and all older than age-group VII were mature]
TABLE 23.-Relation of length to maturity oj whitefiBh takenat ,Bayfield in July and AuguBt 1957
[Data on maturity were not recorded for all individuals. All fish shorter than14.5 inches were immature, and all longer than 17.41ncbes were mature]
2936~7
~724~63033
266
5~. 758.153.5~.5
51.0~.251. 6o
25.0
51. 5
Se% and state of gonadsCalculated length at lest annulus
V VI VII
Male:Mature.._____________ ••• ________•__ 16.4 17.0 17.3Immature. _________________________ (3) (15) (20)
16.0 15.2 16.4
Percentage mature__ • _••_._______ ._(24) (6) (2)
11.1 71.~ 90.9Female:Mature..____.______________________'_ 17.2 16. 6 17.7
Immature•• ______________•_________ (I) (9) (21)16.1 16.0 16.8
Percentage mature __ • ____•_________ (16) (11) (10)5.9 ~.O 67.7
Males Females
Length (Inches)Num- Num· Percentage Num· Num- Percentageber im- ber mature berlm· ber maturemature mature mature mature
14.5-14.9________ 5 1 16.7 7 0 015.0-15.4. _______ 8 2, 20.0 6 0 015.5-15.9________
il 2 28.6 8 0 016.0-16.4._______ 8 57.1 8 7 46.716.5-16.9________ 10 90.9 5 11 68.817.o-17.~________ 12 100.0 1 5 83.3
The first mature females appeared at 16.6-16.4inches, and all females longer than 17.4 incheswere mature. First maturity of males occurredat a length 1.0 inch shorter than in females, and100-percent maturity of males" occurred at alength 0.5 inch shorter than in females.
The youngest mature fish of each sex belongedto age-group V (table 24), and all whitefish olderthan age-group VII were mature. Among agegroups V-VII the percentage maturity of maleswas eonsistently higher than for females of corresponding age. The mature fish of each sexwithout exception were longer than the immaturefish of the same age group.
The scanty data on sexl1al maturity from otherports are inadequate for detailed study, but theysuggested that the faster growing whitefishmature at a greater length and a lower age. Aim(1959) held that fish which have particularlyslow growth may mature at a higher age but I;\t alength which is below that of faster growing specimens. Comparisonfi of length and age at maturityof Bayfield whitefish with those of whitefish fromother localities support this, argument. MunisingBay whitefish (Edsall, 1960), which grow muehmore slowly than the Bayfield stock, exhibit first'maturity at 11.5 inches and 100-percent maturity
94
at 15.0 inches. Ail Munising Bay whitefishyounger than age-group VII were immature, andsome were still immature as age-group XI. Indirect contrast, Van qosten (1939) reported firstmaturity for males at 17.8 inches and for femalesat 18.3 inches in Lake Huron. All of the maleswere mature at 20.1 inches, and all of the femalesat 21.5 inches. All 'male whitefish younger thanage-group III and females younger than age-groupIV "Were immature, and all males older than agegroup V and females older than VI were mature.It appears, then, that among fish of the samelength, those from stocks with the slower growthare the· more likely to be mature, and amongfish of the same age those from stocks with themore rapid growth are the more likely to be mature.
ACKNOW.LEDGMENTS
The crew of the MN Siscowet and severalcommercial fishermen aided in the collection ofda"ta and materials. Ralph Hile advised'in thetreatment of the data and preparation' of themanuscript.
LITE~TURE CITED
ALM, GUNNAR.1959. Connection between maturity, size and age
in fishes. Report of the Institute of FreshwaterResearch, Drottningholm, vol. 40, pp. 5-145.
DEASON, HILARY J., and,RALPH HILE.1947. Age and groWth of the kiyi, LeucichthYB kiyi
Koelz, in Lake Michigan. Transactions of theAmerican Fisheries Society, vol. 74, for the year1944, pp. 88-141. '
EDSALL, THOMAS A.1960. Age and growth of the whitefish, CorllgonUB
clupeaformiB, of Munising Bay, Lake Superior.Transactions of the Ameljcan Fisheries Society,vol. 89, no. 4, pp. 323-332.
FISH AND WILDLIFE SERVICE
EL-ZARKA, SALAH EL-DIN.1959. Fluctuations in the population of yellow
perch, Perea ftaIJe8een8 (Mitchill), in Saginaw Bay,Lake Huron. U.S. Fish and Wildlife Service,Fishery Bulletin 151, vol. 59, pp. 365-415.
GALLAGHER, HUBERT R., and JOHN VAN OOSTEN.1943. Supplemental report of the United States
members of' the International Board of Inquiryfor the Great Lakes Fisheries. InternationalBoard of Inquiry for the Great Lakes FisheriesReport and Supplement, pp. 25-213.
HART, JOHN LAWSON.1931. The growth of the whitefish, Coregonu8
elupeaformi8 (Mitchill). Contributions to Canadian Biology and Fisheries, N.S., vol. 6, no. 20,pp. 427-444.
KOELZ, WALTER N.1926. Fishing industry of the Great Lakes. Depart
ment of Commerce, Report of U.S. Commissionerof Fisheries for 1925, Appendix II, pp. 553-617.
MOFFETT, JAMES W.1952. The study and interpretation of fish scales.
The Science Counselor, vol. 15, no.· 2, pp. 40-42.ROELOFS, EUGENE W.
1958. Age and growth of whitefish, Coregonu8
WHITEFISH IN LAKE SUPERIOR
669937 0-63-7
elupeaformis (Mitchill), in Big Bay de Noc andnorthern Lake Michigan. Transactions of t~e'
American Fisheries Society, vol. 87-, for the year1957, pp. 190-199.
SMITH, STANFORD H.1954. Method of producing impressions of fish scales
without using heat. U.S. Fish and Wildlife Service,Progressive Fish-Culturist, vol. 16, no. 2 (April),pp.75-78.
VAN OOSTEN, JOHN.1923. The whitefishes (Coregonu8 elupeaformi8).
A study of the scales of whitefishes of known ages.Zoologica, Scientific Contributions of the NewYork Zoological Society, vol. 2, no. 17, pp. 380-412.
VAN OOSTEN, JOHN.1939. The age, growth, sexual maturity, and sex
ratio of the common whitefish, Coregonu8 elupeaformis (Mitchill), of Lake HUron. Papers of theMichigan Academy of Science, Arts, and Letters,vol. 24, for the year 1938, part 2, pp. 195-221.
VAN OOSTEN, JOHN, and RALPH HILE.1949. Age and growth of the lake whitefish, Core
gonU8 elupeaforl1~i8 (Mitchill), in Lake Erie. Transactions of the American Fisheries Society, vol. 77,for the year 1947, pp. 178-249.
95