Embed Size (px)
Citation preview
AGE AT MARRIAGE AND FERTILITY IN JAVA-BALI:A QUESTION OF NATURAL OR CONTROLLED FERTILITY
Sri Moertiningsih Adioetomo
A thesis submitted in partial fulfillment for the degree of Master of Arts in Demography
M.A. Programme in Demography,
Development Studies Centre, Australian National University,
Canberra.November 1 981
by
DECLARATION
Except where otherwise indicated,
this thesis is my own work.
November, 1981 Sri Moertiningsih Adioetomo

ACKNOWLEDGEMENT
I wish to express my appreciation to many individuals and institutions especially the Faculty of Economics University of
Indonesia, the Australian National University and the Australian
Development Assistance Bureau who made possible both the opportunity
to study in Australia as well as the completion of this thesis.
Many thanks go to all who provided the invaluable assistance,
guidance and moral support which was needed during the preparation of
the work. My deepest gratitude is to my family for their constant
source of love, patience and understanding while I was away from home.
My intellectual debt is to Dr. Peter F. McDonald, my supervisor.
November, 1981 S.M. Adioetomo.
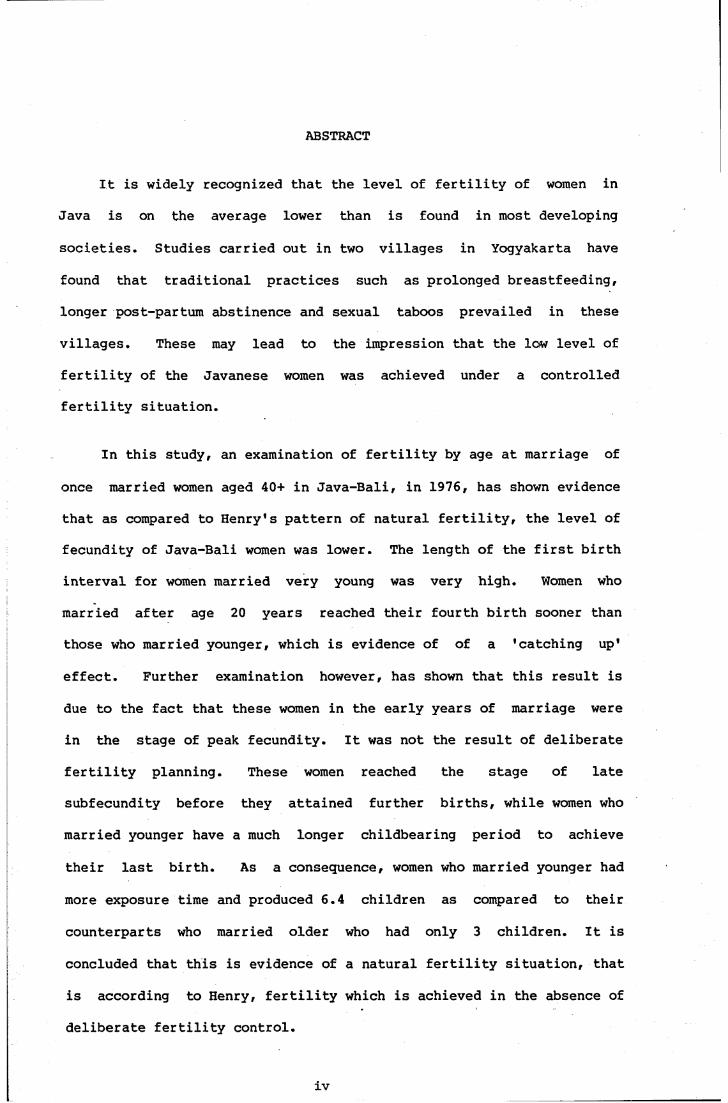
ABSTRACT
It is widely recognized that the level of fertility of women in
Java is on the average lower than is found in most developing
societies. Studies carried out in two villages in Yogyakarta have
found that traditional practices such as prolonged breastfeeding,
longer post-parturn abstinence and sexual taboos prevailed in these
villages. These may lead to the impression that the low level of
fertility of the Javanese women was achieved under a controlled
fertility situation.
In this study, an examination of fertility by age at marriage of
once married women aged 40+ in Java-Bali, in 1976, has shown evidence
that as compared to Henry's pattern of natural fertility, the level of
fecundity of Java-Bali women was lower. The length of the first birth
interval for women married very young was very high. Women who
married after age 20 years reached their fourth birth sooner than
those who married younger, which is evidence of of a 'catching up'
effect. Further examination however, has shown that this result is
due to the fact that these women in the early years of marriage were
in the stage of peak fecundity. It was not the result of deliberate
fertility planning. These women reached the stage of late
subfecundity before they attained further births, while women who
married younger have a much longer childbearing period to achieve
their last birth. As a consequence, women who married younger had
more exposure time and produced 6.4 children as compared to their
counterparts who married older who had only 3 children. It is
concluded that this is evidence of a natural fertility situation, that
is according to Henry, fertility which is achieved in the absence of
deliberate fertility control.
iv

CONTENTSPage
ACKNOWLEDGEMENTS iiiABSTRACT ivLIST OF TABLES viiLIST OF FIGURES x
CHAPTER 1. INTRODUCTION 1
1.1. THE RELATION BETWEEN AGE AT MARRIAGE ANDFERTILITY: A LITERATURE REVIEW 31.1.1. NATURAL FERTILITY 81.1.2. CONTROLLED FERTILITY 91.1.3. EVIDENCE FROM INDONESIAN STUDIES 11
1.2. AIM OF PRESENT STUDY 13
CHAPTER 2. AGE AT MARRIAGE 15
2.1. LEVELS AND TRENDS IN AGE AT MARRIAGE 152.2. MEAN AGE AT MARRIAGE * 182.3. FACTORS INFLUENCING AGE AT MARRIAGE 222.4. DIFFERENTIAL AGE AT MARRIAGE OF
WOMEN IN JAVA-BALI, 1976 262.4.1. DIFFERENTIAL BY TYPE OF PLACE
OF RESIDENCE 332.4.2. DIFFERENTIAL BY EDUCATION 34
CHAPTER 3. FERTILITY 40
3.1. LEVELS AND TRENDS IN FERTILITYIN JAVA-BALI 40
3.2. RELIABILITY OF CHILDREN EVER BORN DATA 433.3. FACTORS AFFECTING FERTILITY 44
CHAPTER 4. THE IMPACT OF AGE AT MARRIAGE ON FERTILITYOF WOMEN IN JAVA-BALI, 1976 54
4.1. THE CONCEPT OF NATURAL AND CONTROLLEDFERTILITY 54
4.2. THE IMPACT OF AGE AT MARRIAGE ONFERTILITY 56
4.3. CHILDREN EVER BORN BY AGE AT MARRIAGE 594.4. FIRST BIRTH INTERVAL 65

4.5. AGE AT FIRST BIRTH AND THE TIMING OFSUBSEQUENT BIRTH 74
4.6. AGE AT COMPLETION OF CHILDBEARING 82
92CHAPTER 5. SUMMARY AND CONCLUSION
102REFERENCES
APPENDIX I. SUPAS 110APPENDIX II. FREQUENCY DISTRIBUTIONS OF WOMEN ACCORDING
TO AGE AT MARRIAGE, SUPAS I, SUPAS II 113APPENDIX III. THE CALENDAR OF LIFE EVENTS CHART 114
APPENDIX IV. TOTAL FERTILITY RATES FOR MAJOR AREAS OF INDONESIA BASED ON DATA FROM THE 1971CENSUS AND 1976 INTERCENSAL SURVEY, STAGE 2 115
APPENDIX V. PERCENTAGE OF WOMEN ONCE MARRIED, AGED 40+ACCORDING TO THE LENGTH OF FIRST BIRTH INTERVAL 116
vii
LIST OF TABLES
TableNumber
2.1 Mean Age at Marriage by Age Groups by Region by Type of Residence, by Levels of Education, Java-Bali, 1976 Indonesia Fertility Survey
2.2 Associaton Between Background Variables: Within Specified Category of Background Variable, The Percentage Distribution According to Other Background Variables
2.3 Percentage Ever Married Among Women, Aged 15-19 Years by Regencies and Municipalities, by Education, For the Province of Yogyakarta and Central Java, 1971 Population Census
2.4 Number and Percentages of Women Aged 25+ by Levels of Education, Java-Bali, 1976 Indonesia Fertility Survey
2.5 Mean Age at Marriage of Women Aged 25+ by Type of Place of Residence and Levels of Education, Java-Bali, 1976 Indonesia Fertility Survey
3.1 Mean Children Ever Born by Age Groups of Women, For Ever Married Women by Province, Java-Bali, 1976 Indonesia Fertility Survey
3.2 Mean Children Even Born to Women by Age Groups, by Place of Residence and Education, Java-Bali, 1976 Indonesia Fertilty Survey
3*3 Mean Children Ever Born to Women Aged 40+ by Type of Place of Residence and Levels of Education, Java-Bali,1976 Indonesia Fertility Survey
4.1 Mean Number of Children Ever Born (Completed Parity) for Women Aged 40+ in Java-Bali by Age at Marriage, Java- Bali, 1976 Indonesia Fertility Survey
4.2 Mean Children Ever Born for All Ever Married Women y Age at Marriage and by Duration of Marriage, Java-Bali,1976 Indonesia Fertility Survey
4.3 Average Years Since First Marriage and Average Years Spent in Marital State, Ever Married Women Aged 40+
4.4 Mean Number of Children Ever Born (Completed Parity)For Women Aged 40+ and Once Married by Age at Marriage, Java-Bali, 1976 Indonesia Fertility Survey
Page
27
29
31
36
38
47
49
52
60
62
64
65

viii
TableNumber
4.5
4.5a
4.6
4.7
4.8
4.9
4.10
4.11
4.12
4.15
5.1
5.2
Mean Length of First Birth Interval (in Months) For Once Married Women, Aged 40+ and For Women Married 5-14 Years Before the Survey by Age at Marriage, Java-Bali, 1976 Indonesia Fertility Survey
Mean Delay of First Conception (in Months) for Women in Taiwan, 1962 and for Women in Java-Bali aged 40+ and for Women With Duration of Marriage of 5-14 Years by Age at MarriageAverage Age at First Birth for Women Aged 40+ Who Married Once, by Age at Marriage, Java-Bali, 1976 Indonesian Fertilty SurveyAverage Number of Children Born to Women Aged 40+ Who Once Married by Age at First Marriage, Java-Bali, 1976 Indonesia Fertilty SurveyFirst, Second, Third and Fourth Birth Intervals (in Months) for Women Aged 40+, Once Married by Age at Marriage, Java-Bali, 1976 Indonesia Fertility SurveyMean Number of Children Ever Born for Once Married Women by Age at Marriage and by Duration of Marriage, Java- Bali, 1976 Indonesia Fertility SurveyMean of Estimated Ages at Birth of Last Child by Various Methods of Calculations and by Age at Marriage, Women Aged 40+, Java-Bali, 1976 Indonesia Fertility SurveyPercentage Distribution of Women Aged 40+ and 45+ by Length of Open Interval, Java-Bali, 1976 Indonesia Fertility SurveyPercentage Distribution of Women Aged 40+ Whose Open Interval Less Than 60 Months, Java-Bali, 1976 Indonesia Fertility Survey
Estimated Ages by Which 25, 50, 70, 75, 85, 90, 95 and 100 Percent of Women Aged 40+ Have Given Birth Their Last Child, by Various Methods of Calculation, Java-Bali, 1976 Indonesia Fertility Survey
Summary Findings of the Computation of Indices of the Impact of Age at Marriage on Fertility of Java-Bali Women Aged 40+, Once Married, 1976 Indonesia Fertility SurveySummary Findings of the Computation of Indices of the Impact of Age at Marriage on Fertility of Urban Women Aged 40+, Once Married, Java, 1976 Indonesia Fertility Survey
Page
68
70
75
76
79
81
84
86
87
90
93
99

TableNumber
5*3 Summary Findings of the Computation of Indices of the Impact of Age at Marriage on Fertility of Rural Women Aged 40+, Once Married, Java-Bali, 1976 Indonesia Fertility Survey
5.4 Summary Findings of the Computation of Indices of theImpact of Age at Marriage on Fertility of Women With Less Than Three Years of Schooling, Aged 40+ and Once Married, Java-Bali, 1976 Indonesia Fertility Survey
5*5 Summary Findings of the Computation of Indices of the Impact of Age at Marriage on Fertility of Women With 4 Years of Schooling and Over, Aged 40+ and Once Married, Java-Bali, 1976 Indonesia Fertility Survey

X
LIST OF FIGURES
FigureNumber Page
2.1 Percentage of Women According to Age at Marriage,SUPAS II, SUPAS III (1976 Indonesia FertilitySurvey). 19
4.1 Completed Parity for Women Aged 40+ as Compared to Henry's Pattern of Natural and Controlled Fertility (by Age at Marriage).
4.2 Mean Delay of First Conception (in Months) of Taiwanese Women (1962), For Java-Bali Women Aged 40+ and For Women With 5-14 Years of Marriage Duration by Age at Marriage
4.3 The Length of Time Between First Marriage to F^rst Second, Third, and Fourth Birth, For Women Aged 40+ by Age at Marriage, Java-Bali, 1976 Indonesia Fertility Survey
5.1 The Length of time (in Years) Between Marriage to First, Fourth and Last Birth by Age at Marriage,Java-Bali, 1936 Indonesia Fertility Survey
80
96
CHAPTER 1
INTRODUCTION
Indonesia's population problem is Java's population problem.
Java, together with Bali, which comprise only seven percent of
Indonesia's total land area, were in 1971, occupied by 67 percent of
its total population. Java's population has also been growing
rapidly, at about 1.9 percent during the 1960s. This has been
attributed to its high fertility, although not as high as fertility in
other islands, which has resulted in the high percentage of population
in younger age groups (40 percent are children less than 15 years old
in 1971) . As this situation is considered by the government of the
Republic of Indonesia to be hampering economic development, the
government took the responsibility to institute a national family
planning program. A new body was established to coordinate the
implementation of this program, which was called the National Family
Planning Coordinating Board. This new body started its activities in
the early 1970s, focusing initially on Java-Bali.
Within a relatively short period of time this family planning
program has been widely praised for its successful achievements.
Meanwhile, the government has also been aware that other factors,
beyond family planning, might also contribute to the reduction of
fertility. Such factors are, for instance, increasing education and
age at marriage of women. It is widely recognized that Javanese women
enter marriage very early and that . marriage is almost universal.

Page 2
Early marriage is considered as having a negative effect on family
welfare and upon the health of mothers and children as well, while,
from the demographic point of view, early marriage is associated with
high fertility. In 1974 the Government of Indonesia was successful in
establishing a new marriage law in which age at marriage was
restricted to a minimum of 16 years for girls and 18 years for boys.
Recently the National Family Planning Coordinating Board has also
started a campaign against early marriage through television and other
mass media. This campaign suggests to women that they should postpone
marriage as well as their first birth until an older age.
For policy makers, raising the age at marriage of women in a
society can be viewed as a policy intervention to reduce the fertility
level and hence retard the population growth. This effect could
operate in several ways. First, an increased age at marriage reduces
the period of women's childbearing risk, potentially leading to lower
completed fertility. Second, it increases the average length of a
generation, thus lowering the intrinsic rate of population growth.
Thirdly, postponement of age at marriage may lead to temporal delay of
births, that is births that would have occurred this year, occur at
some future time. Although the effect of age at marriage on fertility
and population growth appears simple, the issue could become
complicated, especially when the increase in age at marriage is not
accompanied by a change in target family size. The reduction of the
period of risk, for instance, could be offset by shortening of birth
intervals in the case where family size norms are maintained. If the
same family size is still maintained with a net reproduction rate of
1.8 for example, a shift in the mean length of a generation from 26 to
29 years would only change the annual intrinsic rate of population
Page 3
growth from 2.26 percent to 2.03 percent.
Considering such possibilities, it is suggested that study of the
impact of age at marriage on fertility should also pay attention to
behavioural factors in regard to age at marriage. Because of this,
analysis at the aggregate level should be supplemented by individual
level of analysis. This present study aims at observing the relation
between age at marriage and fertility of women in Java-Bali using data
collected in 1976. Firstly, however, a review of literature will be
presented to throw some light on the evidence of the relation between
age at marriage and fertility.
1.1. THE RELATION BETWEEN AGE AT MARRIAGE AND FERTILITY:A LITERATURE REVIEW
The negative relation between age at marriage and fertility has
long been recognized. The lower birth rate recorded in Montreaux,
France around 1860 and in Lucerne, Switzerland around 1870 were
suspected to be the result of the rising age at marriage (Bickel, 1947
cited in Walle, 1972). The rapid population growth in the latter half
of the eighteenth century in England, according to Habakkuk (1965) ,
was due to declining age at marriage. This relation attracted much
discussion in the 19th century following Malthus' proposal of 'moral
restraint' that is, postponement of marriage as a preventive check
against population growth. It has also been suggested that the
demographic change occurring in Western Europe in the 16th and the
17th century was due to the rising age at marriage and the reduction
of proportions marrying, resulting in a decline from high to moderate
levels of fertility of about 35 births per thousand population
(Hajnal, 1965a; Ryder, 1967).
Page 4
In his study of the development of nuptiality in Europe before
1900, Hajnal (1965b), found that a specific pattern of marriage
emerged in Europe in 16th century and became more common in the 17th
century. He called this the Western Europen marriage pattern and it
was characterized by a late age at marriage and a high proportion
remaining unmarried at age 50. The Eastern or 'non-European' marriage
pattern, with a relatively low age at marriage and high proportions
ever married prevailed in Eastern Europe. This classification is now
useful for comparison between developed and developing countries
around the world.
Nowadays, most of the developed countries, according to Henry and
Piotrow (1970), have a Western European marriage pattern with late age
at marriage accompanied now by low marital fertility, while some of
the developing countries are still in the stage of early and universal
marriage with high fertility rates. However, with improvements of
contraceptives technology and the widespread practice of fertility
regulation since the 1920s, it is possible now that a couples can
marry early but postpone having children with the use of
contraception. Within this context, Ryder (1967) has suggested that
there are four phases of the nuptiality-fertility process which a
society must go through to achieve the stage which he called 'modern
fertility'. These are:
1. High nuptiality (low age at marriage and high
proportions marrying) and high marital fertility. This
pattern prevailed in Western Europe before 1500 but
still exists in most of the developing countries today.

Page 5
2. Low nuptiality (high age at marriage and high
proportions not marrying) and high marital fertility.This is a transition from low to higher age at marriage
before the invention of modern birth control techniques in the 19th century.
3. Low nuptiality and low fertility, which reflects the widespread practice of fertility regulation.
4. High nuptiality and low fertility when the postponement
of marriage is considered as not necessary due to the availability of contraceptive.
Another demographer, Judah Matras (1965) viewed the change in the pattern of nuptiality and fertility as a result of changing social behaviour and he developed a schema which he called the 'social
strategy of family formation'. In this formulation he included the prevalence of fertility control as part of four strategies:
A. Early marriage and uncontrolled fertility.B. Early marriage and controlled fertility.C. Late marriage and uncontrolled fertility.D. Late marriage and controlled fertility.
The highest fertility is found in strategy A. From this point a society can arrive at the low level of fertility in strategy D by way
of an increase in age at marriage (strategy C), or by efficient use of contraceptives by way of strategy B. There is also a possibility that the path to low fertility will move from a strategy A via strategy C
to D and eventually to B, more or less as postulated by Ryder.

Page 6
Attempts have also been made to measure the impact of
postponement of marriage on fertility. Coale and Tye (1961) examined
the age pattern of fertility among the Malays and Chinese in Singapore
around 1956-1958. At that time, both these group had high fertility.
From this study they found a contradiction between the level of the
net reproduction rate and the crude birth rate. The Malay women in
this case had a higher crude birth rate than the Chinese, that is 47.9
as compared to 42.1 but had a lower net reproduction rate of 2.64 as
compared to 2.88. Applying a stable population age distribution
combined with the Chinese female mortality, they found that the Malay
women consistently had a higher intrinsic rate of female births and a
higher intrinsic rate of natural increase. This higher fertility of
Malay women was a result of the fact that they married early and
therefore had their children at an earlier age on average than the
Chinese women. In other words, the length of generation was shorter
among the Malays.
Later Agarwala (1967) in his study of Indian women found that
women who married at 14-19 years of age, who had completed their
childbearing period had larger number of children ever born than their
counterparts who married at age 19 or older. Standardizing the
marriage pattern he came to the conclusion that if the mean age at
marriage of Indian women had been 19.0, rather than 15.6 years in
1961-1962, the crude birth rate of India would have been 21.2 percent
less during this period. Based on a projection it would have been
29.2 percent less in the period 1991-1992. Leasure (1963) using the
Bolivian marriage pattern, found that when the singulate mean age at
marriage changed from 22.5 to 27.5 years, the birth rate declined from
41 to 30 per thousand.
Page 7
The studies mentioned above were based on an aggregate level of analysis using measures such as the crude birth rate, gross and net reproduction rates, proportions marrying and the mean length of generation. In these methods of analysis, the rising age at marriage is considered to reduce the proportions married in the younger age groups which in turn has an effect in reducing fertility (age specific
fertility rate) in these age groups. The rising age at marriage then
has two effects: the reduction of the net reproduction rate and the prolongation of the length of a generation. These will both retard population growth (Leasure, 1963; Henry and Piotrow, 1979: M-107,
figure 1). Coale and Tye (1961), for example, have even demonstrated that the rising age at marriage is able to reduce the birth rate and the population growth rate even when completed family size is not reduced. Some studies, however, have found that the relation of age at marriage and fertility is not always negative. Das (1967), examining completed family size of women in Kerala, Mysore and Madras, found that women in Kerala who married later had higher fertility as compared to their counterparts in Mysore and Madras who married earlier. In this case he considered that socio-cultural factors
probably offset the impact of early age at marriage. Furthermore, Hawthorn (1970) , although accepting that age at marriage and proportions marrying are very significant determinants of fertility,
stated that the relation between age at marriage and fertility is not simple and straightforward. He believed that behavioural factors might contribute to the relationship.
In order to look more closely at the relationship between these
two variables, an individual level analytical approach is suggested in order to examine the subsequent fertility behaviour of women after
Page 8
marriage. This approach is suggested due to the fact that, in most cultures, most births occur after marriage, while many factors could influence the behaviour of women in respect of age at marriage (Davis
and Blake, 1956). Based on the individual level analytical approach,
Henry (1976: 91-95) postulated that the impact of age at marriage on fertility depends on whether ferility is natural or controlled. As
this dichotomy will be the principal focus in this thesis, it is
discussed at some length.
1.1.1. NATURAL FERTILITY
According to Henry, in a traditional society where there is no
deliberate control of fertility, age at marriage determines the age at which a woman is exposed to natural fertility. In this case early marriage is associated with longer exposure to childbearing and therefore higher fertility (Henry, 1976; Yaukey, 1973; Henry and
Piotrow, 1979). With natural fertility the difference in fertility by age at marriage is, therefore, largely due to the difference in the length of the childbearing period. Biological factors such as early or late subfecundity are the important factors affecting fertility of individuals. It is assumed that with natural fertility, age specific marital fertility does not vary according to age at marriage (Henry, 1976; Trussell, Menken and Coale, 1979).
Bumpass (1979) has argued that the key link between age at
marriage and fertility is the extent to which age at marriage marks the beginning of childbearing. In a society where premarital sexual relations prevail or where the marriage ceremony does not signal the consummation of marriage the negative relation might be distorted. It
Page 9
is suggested that the latter was the case with the positive relation
found between age at marriage and fertility in comparing women in Madras and Mysore in one side and Kerala on the other side as
explained earlier (Das, 1967; Hawthorn, 1970).
1.1.2. CONTROLLED FERTILITY
In a controlled fertility population, the length of the childbearing period can be influenced by the practice of fertility
limitation. Fertility at a given age can be very different according to whether women have been married for a long or short period of time (Henry, 1976; Trussell, Menken and Coale, 1979). In younger ages,
women who marry later have higher age specific marital fertility than women who marry early. This evidence is considered to be the result of a 'catching up effect' because women who marry later are less
likely to postpone their early births (Trussell, Menken and Coale, 1979; Busfield, 1972; Henry and Piotrow, 1979; McDonald, Ruzicka and Caldwell, forthcoming). In a low fertility population with
effective contraception, the differential in completed fertility by age at marriage is not very apparent after other factors are controlled.
Ruzicka (1977) has found that in Australia, the impact of age at
marriage is shown markedly in the time distribution of the first
birth. For women who marry earlier, the distribution has a bimodal curve with the early peak reflecting the prevalence of premarital pregnancies. For those who marry later, the timing distribution of the first birth has only one mode reached the duration of 8 to 10 month. Meanwhile, Bumpass and Mburugu (1977) focusing on the timing

Page 10
of initial exposure, suggest that the age at first birth has a
stronger relation with completed fertility than age at first marriage.
Recent studies of the relation between age at marriage and fertility have shown results that agree very closely to Henry's hypotheses (In Taiwan by Freedman and Casterline, 1979; in Korea by
Coale, Goldman and Cho, 1979; in South Asia by D'Souza, 1979; and in
the World Fertility Survey countries by McDonald, Ruzicka and Caldwell, forthcoming). As an example, in Korea, the catching up
effect was found before 1960 when there was little voluntary control of fertility. Marital fertility increased due to the shortened birth intervals among the later marriers. This situation continued for a
while after 1960 but subsequently there was a decline of marital fertility due to the availability of contraception and abortion. Age at marriage continued to increase (Coale, Goldman and Cho, 1979). In
Taiwan, examination by duration of marriage shows that in early marriage durations (0 - 59 months after first marriage) the relation between age at marriage and age specific marital fertility is positive. Increasing age at marriage is followed by increasing age
specific marital fertility and shortened birth intervals. From the fifth year of marriage the positive relation diminishes because those
who marry later make more use of birth control. According to Freedman and Casterline (1979), the wife's age at marriage ultimately has a strong negative relation with completed fertility.
Data for many countries included in the World Fertility Survey
are more interesting because Henry's controlled fertility model was found to be even applicable in societies with high fertility levels. McDonald, Ruzicka and Caldwell (forthcoming) therefore, warned that

Page 11
estimations of the impact of change in age at marriage upon fertility which ignore the clear relationship between age at marriage and subsequent marital fertility might be misleading.
From another point of view, age at marriage is often considered
as a function of socio-cultural behaviour, since marriage represents the social sanction of sexual activity and childbearing (Mauldin et al., 1978; A1 Haddar, 1977; Henry and Piotrow, 1979). In studying
the impact of age at marriage on fertility therefore, one should give attention to factors influencing age at marriage. McDonald, Ruzicka and Caldwell (forthcoming) believed that late age at marriage only
occurs within a millieu of broad social change involving changes in the role of women, education, family, economic structure and more parcicularly, change in the relationship of parents and their children. As one interesting example, it has been quite often mentioned that women who married later are likely to have higher education, whilst women who have higher education are also likely to
have better knowledge and greater usage of contraception. A model of
this kind of relationship developed by Davis and Blake (1956) where age at marriage is placed as an intermediate variable intervening
between socio-cultural factors and fertility will be highly suitable for analysis.
1.1.3. EVIDENCE FROM INDONESIAN STUDIES.
Examination of this relationship in Indonesia has been made using
the 1971 Census data by Cho, Suharto, McNicoll and Mamas (1980) and
the 1973 Fertility-Mortality Survey by McDonald, Jasin and Jones (1976). In these studies, a consistently positive pattern of
Page 12
relationship between age at marriage and fertility was found on a regional basis, that is women in Java who marry early have lower fertility than women from other islands (Sumatera and Sulawesi) who
marry later. Cho, Suharto, McNicoll and Mamas (1980) stated that this unexpected result is due to the differences in behaviour with respect to marital fertility. Longer birth intervals, prolonged breastfeeding
and abstinence appear to influence the fertility of Javanese women
(Singarimbun and Manning, 1976 cited in Cho, Suharto, McNicoll and Mamas, 1980). As a comparison, Cho stated that Korea, in 1962 had an
equal fertility level with Indonesia in 1971 but the pattern of
fertility was different due to the diffrences in age at marriage and proportions marrying. Women in Korea, in this case, married later and
therefore had lower age specific fertility rates at ages under 25 years. At older ages (25 and above) the age specific fertility rates were higher in Korea. The average age at marriage of Korean women in
1962 was 22 years, while for Indonesian women in 1971, it was 19 years (using the singulate mean age at marriage).
Detailed individual level studies carried out in small villages in Yogyakarta, by Hull (1976: 36) in Maguwoharjo and by Singarimbun
and Manning (1976: 61) in Mojolama, found an inverse relation between
age at marriage and fertility. Women aged 45-49 years at the time of the survey in Maguwoharjo who married before their fifteenth birthday
had at least one and a half children more on average than women who married at 20 years or older. The difference was smaller among women in Mojolama (Singarimbun and Manning, 1976: 61) with the average number of children born to women aged 45+ and married before 15 years old being around 5.3 compared to 4.4 for those married after aged 21years.
Page 13
Studies of age at marriage in Java have found a tendency toward increasing age at marriage (Muliakusuma, 1976). Fertility, at the same time, has also declined to some extent (Sinquefield, 1978; Hull
et al., 1977; Hull and Mantra, 1981). The question arises as to
whether there is any relation between the increasing age at marriage and the declining fertility. The following two chapters will deal
respectively with age at marriage and fertility of women in Java-Bali.
1.2. AIM OF PRESENT STUDY
This study aims to examine the impact of age at marriage on fertility of women in Java-Bali using findings from the 1976 Indonesia
Fertility Survey or SUPAS III*. The examination will be based on analysis of the behaviour of individual women. Subsequent fertility behaviour of women following first marriage will be observed, especially the first birth, interbirth intervals, age at last birth and the length of the childbearing span. The results will then be compared with Louis Henry's hypothesis related to the impact of age at marriage on fertility. As has been stated in the literature review,
this hypothesis suggests that the impact of age at marriage on fertility depends on whether fertility is natural or controlled.
The study is based on data collected from the 1976 Indonesia Fertility Survey (SUPAS III) carried out by the Central Bureau of Statistics of the Republic of Indonesia. This survey covered 9155 ever married women aged 15-49 years from the areas of Java and Bali.
* For complete information about SUPAS III, see Appendix I. The data used in this thesis have been derived from the Standard Recoded Tape provided by the World Fertility Survey, London.
Page 14
The 1976 Indonesia Fertility Survey questionnaire was derived from the World Fertility Survey core questionnaire with some additional questions about the family planning program. The questionnaire
consisted of two parts, a household schedule and an individual
questionnaire. The household schedule collected basic information on characteristics of household members, including name, sex, age and
marital status. From this schedule respondents were selected for the individual schedule. Respondents had to be ever married women living in the household, aged between 15-49 years at the time of survey. The
individual questionnaire included questions under the following headings:
1. Respondent's background
2. Marriage history3. Maternity history4. Contraceptive knowledge and use
5. Family planning
6. Work history7. Husband's background.
CHAPTER 2
AGE AT MARRIAGE
This chapter will deal with the average age at marriage of women in Java-Bali according to the 1976 Indonesia Fertility Survey. First,
levels and trends in age at marriage findings from earlier studies will be presented. Second, the distribution of the mean age at marriage and the reliabity of the 1976 Indonesia Fertility Survey data
will be examined in brief to get some indication of the quality of
data. Third, from the available literature, factors which might influence the timing of first marriage of women will be presented. Finally, differential age at marriage of women in Java-Bali will be examined by background variables specifically type of place of residence and the level of education of women.
2.1. LEVELS AND TRENDS IN AGE AT MARRIAGE
Information on age at marriage has been collected through several surveys. The socio-economic surveys in the 1960s, the 1961 and the 1971 population censuses provided data on marital status of women from
which one can derive proportions of women married or single in a certain age group. The proportions single are the basic source for calculation of an index called the singulate mean age at marriage
(SMAM). More detailed questions on the actual age at marriage of women as part of complete marital histories have been asked in the 1973 Fertility-Mortality Survey conducted by the Demographic
Page 16
Institute, University of Indonesia and the 1976 Indonesia Fertility Survey or SUPAS III, while in SUPAS II*), only marital status and the actual age at marriage were obtained. The index SMAM, although it
provides a simple and convenient way to estimate the average age at
marriage, does not represent a very accurate index if applied in a changing marriage situation. Its cross sectional approach,
furthermore, will give a misleading impression of the trend in age at marriage. Proportions never married and the actual age at marriage statistics examined by current age of women (birth cohort analysis)
are considered as more reliable measures than the singulate mean age at marriage.
Analysis of trends in age at marriage in Indonesia have been conducted based on the proportion of women never married by age. Examination of the rounds of the National Socio-Economic Survey in the 1960s shows that there was a tendency toward increasing age at marriage. The proportions never married of women aged 15-19 increased
from 49.6 percent in 1963 to 56.4 percent in 1971 (McNicoll and Mamas, 1973; Cho, Suharto, McNicoll and Mamas, 1980). The 1973 Fertility- Mortality Survey also indicated that there has been a decrease in the
proportions of ever married women in the younger age groups. The percentage of women married before age 15 from this survey, examined by birth cohorts, decreases from 28.4 percent for the 35-39 age group
of women to 23.7 percent for the 15-24 age group (Martokusumo, 1978). The median age at marriage, which is the age by which half of the women in the age group have been married, also showed an increasing
trend in the Fertility-Mortality Survey findings. The median age
*) See Appendix I

Page 17
increased from 15.9 for women aged 45-49 to 16.5 for women aged 20-24
domiciled in rural West Java, and for the same age group from 17.1 to
18.0 for rural Central Java, from 16.2 to 16.7 for rural East Java,
and from 19.2 to 19.5 for Bali. The increase in age at marriage of
urban women was higher than that for rural women (Muliakusuma,
1976; Table II.3: 14).
The SUPAS II data collected from a very large sample households
in 1976 also show an increase in the median age at marriage, the range
being from 16.0 for women aged 30-49 to 17.2 for women aged 20-24 in
West Java and for the same age groups from 16.8 to 18.0 in Central
Java and from 16.5 to 17.9 in East Java. In Bali however, a small
decline was observed from 20.7 to 20.1 years (McDonald;, 1978, Table 2:
6) .
SUPAS III, or the 1976 Indonesia Fertility Survey confirmed an
increasing trend in age at marriage. The cumulative percentages of
women married before a certain age (from 13 to 25 years) have
decreased. This decrease begins to be evident for women aged less
than 25 at the time of the survey. For the older age group of women,
these percentages do not differ very much. However, the change is
most marked for those aged less than 20 years. The percentage of
women married before age 15 years for each birth cohort has thus
rapidly decreased from 40 percent among women aged 45-49 to 14 percent
for women aged 15-19. The median ages have also shown an increasing
trend, that is from 15.3 to 17.3 years from women aged 45-49 to those
aged 20-24 (Central Bureau of Statistics and the World Fertility
Survey, 1978, Vol. I, Table 4.1.: 30).

Page 18
The above studies indicate, therefore, that although not very
substantial, there has been an increase in age at marriage among women
in Java-Bali during the last decade.
2.2. MEAN AGE AT MARRIAGE
Instead of median age at marriage, the analysis of the timing of
first marriage of women in Java-Bali in 1976 will be based on the mean
age at marriage, that is, the arithmetic average of ages at first
marriage. It is said that mean age at marriage is skewed to the right
due to the fact that first marriages still occur long after the modal
age at first marriage, so that the mean is sometimes considered as
less informative as a measure of central tendency. Findings from this
survey, hovewer, show only a very slight difference between the median
and the mean age at marriage (Central Bureau of Statistics and the
World Fertility Survey, 1978, Vol. I, Table 4.1.: 30). The mean,
therefore, has been used in this study because of its ease of
computation.
In this survey women were asked what year they were married for
the first time. If the calendar year could not be obtained, then the
approximate age at which they were married was asked. Due to the fact
that most women could not answer the first question, the computation
of mean age at marriage from the World Fertility Survey Standard
Recoded Tape is based on the reported age at first marriage.
It is commonly found that age information from Indonesian
demographic surveys suffers from age mistatements especially age
heaping in the ages ending with digits of 0 or 5 (Iskandar, 1970;

PERCENTAGE D
ISTRIBUTION
Page 19
Figure 2.1.PERCENTAGE OF WOMEN IN JAVA-BALI ACCORDING TO AGE AT MARRIAGE
SUPAS II, SUPAS III.
SUPAS IISUPAS III
10 12 16 18 26 28 32 34AGE AT MARRIAGE (in years)
Source: 1. SUPAS II: Special Tabulation from the Regional Analysis, Demographic Institute University of Indonesia (forthcoming).
2. SUPAS III: Based on the distribution of the subset of World Fertility Survey Standard Recoded Tape: 1976 Indonesian Fertility Survey.
McDonald, Yasin and Jones, 1976). Due to this consideration, the distribution of age at first marriage from this survey will be examined and compared to findings from the SUPAS II. The SUPAS II
Page 20
distribution of age at first marriage is expected to have lower
sampling variability due to its larger sample (see Appendix I). The distributions from the surveys are shown in Figure 2.1. Both curves
show relatively smooth distributions of age at first marriage. A very slight indication of digital preference is evident in the data for SUPAS III for the ages 15 and 25 years. Overall, however, digital preference is not very prominent (Central Bureau of Statistics and
World Fertility Survey, 1978, Vol. Is 31).
While the two distributions show similar patterns, the levels of
age at marriage are not consistent. Figures from the SUPAS III show a lower ages at marriage compared to those from SUPAS II. In SUPAS III, more women reported ages at marriage of 13 years or less. Considering the fact that the SUPAS III sample was subsampled from SUPAS II, this inconsistency is unacceptable. McDonald (1978), who also found this inconsistency has recommended the use of the SUPAS II data because of
its larger sample. Quality of data resulting from a sample survey, however, is not determined only by the coverage of the study, but also factors such as respondent errors, quality of interviewers, the
questionnaires and the organization of fieldwork. From the respondents side, the quality of information collected was determined very much by the level of education of respondents. Respondents who
have higher education, are more likely to report better dates and ages (MacDonald, Simpson and Whitefield, 1978), but since the SUPAS III
respondents are also a subsample of SUPAS II, one might expect the
same quality of data resulting from them. The problem then arises that if there are age mistatements and the degree of mistatement is not the same in SUPAS II and SUPAS III, it is difficult to check which
data set is the more reliable. Meanwhile, the World Fertility Survey
Page 21
in London, did a reliability study of the SUPAS III data. The reliability of data in this case is defined as 'the extent to which measurement remains constant as it is repeated under conditions taken to be constant'. This examination of the reliability of the SUPAS III
data was based on interviews with some of the respondents of the SUPAS
III using exactly the same questions, but three months after the first survey. The result of this reliability study shows that if a two year
difference in age at marriage is considered as acceptable, then the percentage of acceptable answers was 78.2 percent (MacDonald, Simpson and Whitefield, 1978: 23) .
Interviewers used in the SUPAS III data collection were mostly
university students who had been given two weeks training before fieldwork. In this training, definitions and precise meaning of questions as well as questionaire instructions were emphasized. In the fieldwork, the interviewers were supposed to use a chart of the calendar of life events (see Appendix III), which was very helpful in checking the consistency of respondent's answers. This chart,
although it had a tendency to push events into the latter childbearing
period (telescoping tendency) was felt to be very helpful in locating the events in time. Moreover, completed questionnaires were directy checked on the spot by the field editor. In terms of incentive, rewards to the interviewers in SUPAS III were much better than in SUPAS II. On the basis of the discussion, therefore, the author favours SUPAS III as a source of data on age at marriage.
Page 22
2.3. FACTORS INFLUENCING AGE AT MARRIAGE.
The fact that there has been differences in the timing and
frequency of first marriage has led to the question of why women in
some societies marry early while in other societies later marriage occurs?
Studies concerning marriage done within the context of sociology and anthropology have paid little attention to age at marriage. There is very little evidence showing how socio-cultural factors influence the timing of first marriage. Hawthorn (1970: 86) concluded that:
Less is probably known about the social determinants of age at marriage and proportions marrying than about determinants of any other important demographic variable.
The kinship system or family type may influence age at first marriage. In an extended family system where marriage does not necessarily imply formation of a new, separate household, marriage might occur early. In a nuclear family system, on the other hand, resources needed for
formation of a household could become a strong constraint on the timing of first marriage (Hawthorn, 1970).
In a tradition of parentally arranged marriages, girls are encourage to marry early (Blake, 1967). Social norms on the
appropriate age at marriage and the stigma associated with being unmarried usually reinforce the prevailing age pattern of marriage. It has been observed that the unavailability of alternatives to
marriage such as education and female employment outside the family is associated with the prevalence of early marriage (Dixon, 1977;Germain, 1975).
Page 23
While most researchers have tried to explain factors which might
influence age at marriage from different perceptions, McDonald (1981) has tried to summarize and develop a framework for analysis. Age at marriage according to him, is a part of marriage customs that develop in each culture in relation to the functions that marriage fulfils in
the society. Functions of marriage that have been observed in most cultures can be classified into three categories: economic, social
and personal. With regard to the economic functions, marriage may mark the setting up of a new separate household, it may provide a
means of economic security, a basis for the division of labour, or it may be a means for the exchange of wealth. The social functions of
marriage furthermore, serve an important element in the maintenance or transformation of the social structure, which may be seen in the following ways: marriage strengthens or weakens social differentiation, it forms or strengthens social and political alliances, serves to continue the family lineage, provide a means of social control of sexual activity, and sometimes marriage might also be considered as establishing the social prestige of those involved. Marriage can provide certain major personal functions when marriage is seen as the only socially acceptable vehicle for sexual gratification; and as a source of affection, love and emotional support. Marriage may also mark the initiation into full, adult membership of the
society that brings with it freedoms and responsibilities. Finally
marriage is maybe seen as a means for achieving spiritual reward in the religious sense.
Aside from factors influencing age at marriage, the acceptable ages at which a woman should marry for the first time, however, have
not been stated very clearly in the literature. In Hindu society,
Page 24
there is a believe that preadolescent marriage is ideal. Before the
1890s it was reported that the proper age at marriage for a girl was 8
years old. Later, after 1890, the mean age at marriage was reported
to be 12.5 years. This young age at marriage occurs in relation to
the belief that a girl can only enter heaven when she has married.
Moslem laws permit a girl to be married irrespective of age but
consummation of marriage must wait until she has reached puberty
(Goode, 1963: 104-105). while according to Christian Law, a girl is
permitted to be married at 12 years. More recently, governments or
civil authorities have considered their responsibilities to establish
laws on the minimum age at marriage. To prevent the prevalence of
early marriage, China's marriage law of 1950, restricted girls to
marry until they were at least 18 years old. Indonesia in 1974,
established a law that stipulates a minimum age at marriage tor a girl
of 16 and a boy of 18 years.
Recent studies on the factors influencing age at marriage have
•> concluded that modernization, industrialization and urbanization have
* a very strong influence on the increase of age at marriage (Henry and
Piotrow, 1979; Duza and Baldwin, 1977). More specifically, these
include education and economic activity of women, the urban
environment as well and the changing characteristics of husbands. It
is best to consider therefore, using the individual level of analysis
to examine the impact of female education and place of residence on
the age at marriage of women.
Studies in Java have found a pattern of early and arranged
marriage. Girls were reported to marry soon after their first
menstruation. In Mojokuto, Geertz (1961) observed that in the past,

Page 25
girls married at age 8 or 9 years old, but in the 1950s the average
age at first marriage for a girl was 16 years old. Gille and Pardoko
(1966) found that the mean age at marriage for girls in two villages
in East Java was around 15.7 years. They found also that the age at
first marriage corresponds to the age at first menstruation. The earlier the age at menstruation, the earlier the age at marriage. The prevalence of early marriage was also found in West Java (McDonald and
Abdurrahman, 1974). On the other hand, Hull (1976) and Singarimbun and Manning (1976) found a higher age at marriage among women in Maguwoharjo (17.8 years) and in Mojolama (17.4 years). All of these
studies have suspected that the system of early marriage is favourable to the parents of the girl. Parents of Javanese girls felt that to marry their daughter is a major responsibility of the parents. Geertz (1961) found that the first marriage of a girl is an important occasion that can bring respect to the parents, a pivotal moment and a point of time at which kinship relations are extended. Others have
stated that parents marry their daughters as soon as they reach puberty, because the parents do not want them to disgrace the parents through extra marital relationships (Geertz, 1961; McDonald and
Abdurrahman, 1974). In most societies in Java, there is still a stigma on a girl who does not marry when she becomes of marriageable age in the eyes of the society. She is disparagingly referred to as a
'perawan tua' or 'perawan jomlo' meaning an old maid. Hull (1976)
found that the marriage ceremony is sometimes not followed by the consummation of the marriage. Such marriages lead to divorce due to
the fact that the girl does not like the parents' choice.
Page 26
As a developing country, Indonesia has experienced the effects of
modernization and industrialization. The impact, however, is difficult to measure. Due to data limitations, the impact of only two variables on age at first marriage will be examined, namely education and type of place of residence.
2.4. DIFFERENTIAL AGE AT MARRIAGE OF WOMEN IN JAVA-BALI, 1976.
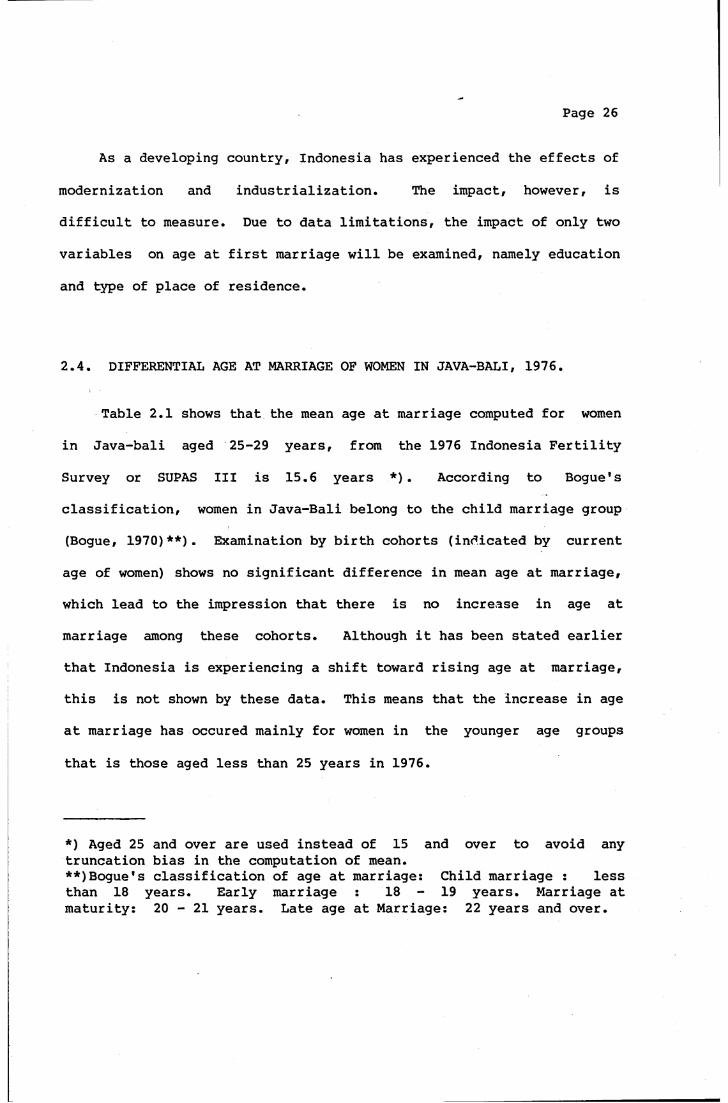
Table 2.1 shows that the mean age at marriage computed for women in Java-bali aged 25-29 years, from the 1976 Indonesia Fertility
Survey or SUPAS III is 15.6 years *). According to Bogue's classification, women in Java-Bali belong to the child marriage group (Bogue, 1970)**). Examination by birth cohorts (indicated by current age of women) shows no significant difference in mean age at marriage, which lead to the impression that there is no increase in age at marriage among these cohorts. Although it has been stated earlier that Indonesia is experiencing a shift toward rising age at marriage, this is not shown by these data. This means that the increase in age at marriage has occured mainly for women in the younger age groups
that is those aged less than 25 years in 1976.
*) Aged 25 and over are used instead of 15 and over to avoid any truncation bias in the computation of mean.**)Bogue's classification of age at marriage: Child marriage : less than 18 years. Early marriage : 1 8 - 1 9 years. Marriage at maturity: 20 - 21 years. Late age at Marriage: 22 years and over.
Page 27
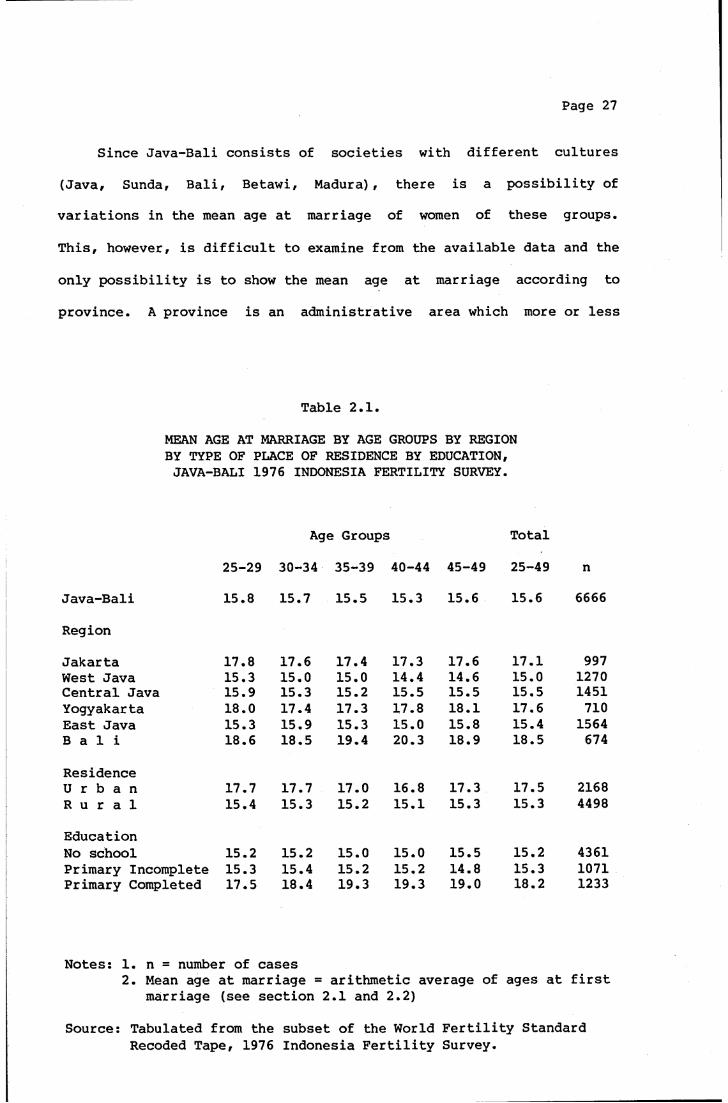
Since Java-Bali consists of societies with different cultures (Java, Sunda, Bali, Betawi, Madura), there is a possibility of variations in the mean age at marriage of women of these groups.
This, however, is difficult to examine from the available data and the
only possibility is to show the mean age at marriage according to province. A province is an administrative area which more or less
Table 2.1.MEAN AGE AT MARRIAGE BY AGE GROUPS BY REGION BY TYPE OF PLACE OF RESIDENCE BY EDUCATION, JAVA-BALI 1976 INDONESIA FERTILITY SURVEY.
Age Groups Total25-29 30-34 35-39 40-44 45-49 25-49 n
Java-Bali 15.8 15.7 15.5 15.3 15.6 15.6 6666
RegionJakarta 17.8 17.6 17.4 17.3 17.6 17.1 997West Java 15.3 15.0 15.0 14.4 14.6 15.0 1270Central Java 15.9 15.3 15.2 15.5 15.5 15.5 1451Yogyakarta 18.0 17.4 17.3 17.8 18.1 17.6 710East Java 15.3 15.9 15.3 15.0 15.8 15.4 1564B a l i 18.6 18.5 19.4 20.3 18.9 18.5 674
ResidenceU r b a n 17.7 17.7 17.0 16.8 17.3 17.5 2168R u r a l 15.4 15.3 15.2 15.1 15.3 15.3 4498
EducationNo school 15.2 15.2 15.0 15.0 15.5 15.2 4361Primary Incomplete 15.3 15.4 15.2 15.2 14.8 15.3 1071Primary Completed 17.5 18.4 19.3 19.3 19.0 18.2 1233
Notes: 1. n = number of cases2. Mean age at marriage = arithmetic average of ages at first
marriage (see section 2.1 and 2.2)
Source: Tabulated from the subset of the World Fertility Standard Recoded Tape, 1976 Indonesia Fertility Survey.
Page 28
represents the larger ethnic groups. The Sundanese occupy most of West Java and the Balinese the province of Bali, while the Javanese occupy most of Central Java, Yogyakarta and East Java. The mean ages at marriage by province show that there are two categories of average
age at first marriage (Table 2.1 ). Women in West Java, Central Java and East Java have a lower mean age at marriage, that is 15.0; 15.5
and 15.4 respectively, while women in Jakarta, Yogyakarta and Bali married somewhat older, that is on average at ages 17.5; 17.8 and19.1 respectively. It is not surprising to find that in Jakarta, the major metropolitan area, women married at older ages. The high age at marriage of Balinese women may be due to the religious factor. Most of the Balinese population are Hindus, but in contrast to the Indian Hindus who marry very early (Goode, 1963: 232), the Balinese marry at a relatively late age. According to the religious law in Bali, a girl should remain at home with her parents until she finds a partner that is suitable for her. Parents of Balinese girls will marry their daughter a couple of years later after the girl has her first menstruation. Furthermore, the girl should be ready to maintain her husband's temple when she gets married. Sometimes the marriage is postponed due to the fact that the girl is not ready to perform the ritual ceremony at her husband's temple (A1 Haddar, 1977).
The reason for the later marriage for women in Yogyakarta is not clear. Spatially, Yogyakarta lies in the center of Javanese culture. One might, therefore, expect girls in Yogyakarta to marry early like
their counterparts in Central and East Java. This finding seems to be reliable, however, since two other surveys in Mojolama (Singarimbun and Manning,1976) and in Maguwoharjo (Hull, 1976) found consistent figures that is 17.4 and 17.8 years respectively.
Page 29
Table 2.2.
ASSOCIATION BETWEEN BACKGROUND VARIABLES: WITHIN SPECIFIED CATEGORY OF BACKGROUND VARIABLE, THE PERCENTAGE DISTRIBUTION
ACCORDING TO OTHER BACKGROUND VARIABLES.
Level ofType of Place Province Education
(1) (2) (1) (2) (3) (4) (5) (6) (1) (2) (3)Java-Bali 16 84 6 28 28 3 32 2 48 35 17 100
Residence(1) Urban 35 19 16 2 26 1 100 26 34 41 100(2) Rural 0 30 30 3 34 3 100 52 36 12 100Province(1) Jakarta 100 0 100 27 39 40 100(2) West Java 11 89 100 40 40 20 100(3) Central
Java 9 91 100 53 35 12 100(4) Yogyakarta 12 88 100 55 26 20 100(5) East Java 12 88 100 53 34 13 100(6) Bali 9 91 100 58 27 15 100Education(1) No School 8 92 100 3 24 31 3 36 3 100(2) Primary In
complete 15 85 100 5 32 28 2 32 1 100(3) Primary
Completed-»- 38 62 100 14 35 20 3 26 2 100
Source: Based on Central Bureau of Statistics and World FertilitySurvey, 1978: Principal Report, Vol. I, Table 3.8; page: 25.
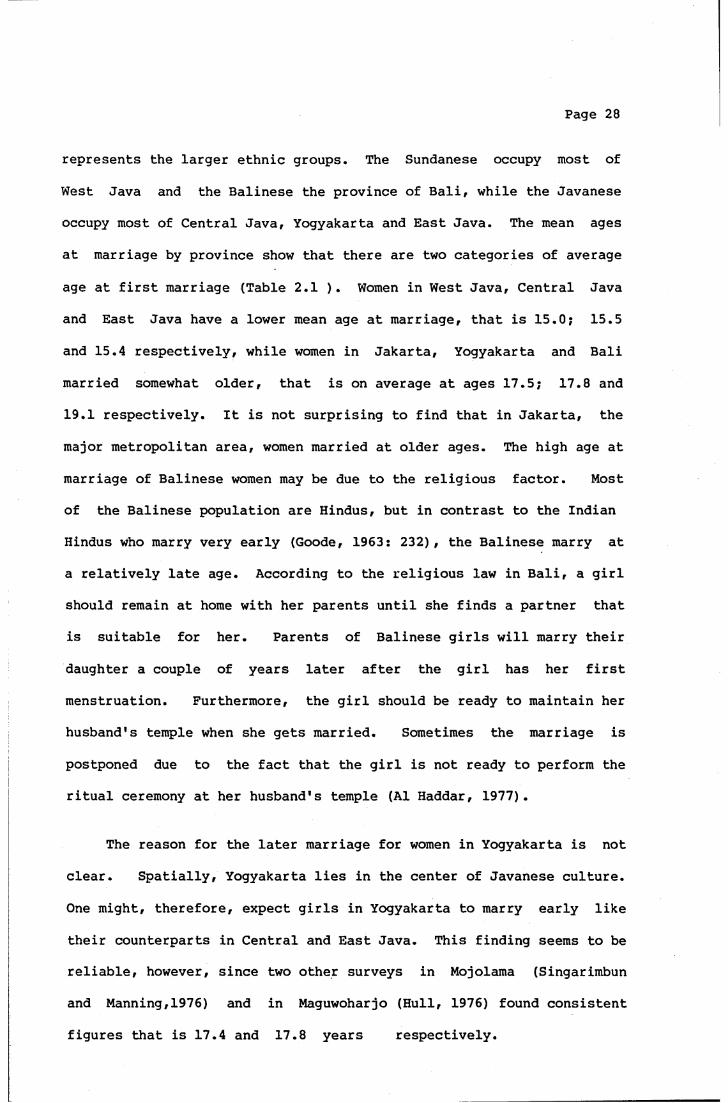
Biro Pusat Statistics (1980) has suggested that the high age at marriage in Yogyakarta might be attributed to the fact that there is a
famous and old university in Yogyakarta and that the city of Yogyakarta is known as the city of students. Data on the level of education of women in Yogyakarta, however, show that half of the respondents in this province have never gone to school, while another 26 percent have only attained incomplete primary school (Table 2.2.).
Page 30
Is it possible that the education environment is able to influence the
age at marriage although the individual person herself is not educated at all? Further examination of this question is done using the 1971
population census data. Table 2.3. shows the percentage ever married
among women aged 15-19 years by level of education and by 'kabupaten' (regencies) from both the province of Yogyakarta and Central Java as well. From this Table, it is seen that in any part of Yogyakarta the percentages ever married women were low, much lower than the percentages of ever married women in other 'kabupaten' in Central Java. This evidence supports the findings from 1976 Indonesia
Fertility Survey that women in Yogyakarta, although they have low education marry later. On closer examination of Table 2.3 two kinds of pattern emerge, that is, regencies which lie in the coastal areas
of Northern Central Java nave on the average high percentages ( ^40percent) of ever married women aged 15-19. These kabupaten are: Pekalongan, Pemalang, Tegal, Brebes, Semarang, Kendal, Demak, Grobogan, Pati, Rembang, Blora and Batang. These are the kabupaten where the people are mostly strong followers of Islam. Historically, Islam was introduced in these coastal areas, especially in Demak, Rembang and Blora. The second pattern is evident in the remaining 'kabupaten' with some exceptions like Sragen, Purbolinggo and Wonogiri that lie in the southern part of Central Java. These remaining
'kabupaten' have lower percentages of ever married women aged 15-19 years. Although people in these areas are officially Muslim, their traditions are likely to be more influenced by Javanese philosophy,
which places greater emphasis on rational thought than on religious

Page 31
Table 2.3.PERCENTAGE EVER MARRIED AMONG WOMEN,AGED 15-19 YEARS, BY REGENCIES AND MUNICIPALITIES, BY EDUCATION, FOR THE
PROVINCE OF YOGYAKARTA AND CENTRAL JAVA,THE 1971 POPULATION CENSUS.
Level of EducationTotal
Regencies N.S. P.I. P.C. Women N
Yogyakarta**Bantul 15.7 12.7 13.9 13.8 n oSleman 18.6 11.0 11.3 12.5 121Gunung Kidul 27.3 24.5 15.0 22.0 152Kulon Progo 11.4 12.2 19.0 16.2 74Kodya Yogyakarta*** 13.4 10.3 6.2 7.1 91
Central Java**Banyumas 30.3 40.7 30.9 34.9 428Purbolinggo 51.9 53.3 45.2 50.4 325Cilacap 47.9 55.1 42.4 50.6 748Banjarnegara 38.2 52.9 46.4 46.4 284Magelang 23.6 34.7 28.9 30.5 312Temanggung 25.0 32.8 26.4 29.6 155Wonosobo 35.1 42.6 35.8 38.1 207Purworejo 26.1 33.2 27.4 28.9 255Kebumen 34.1 35.9 31.0 33.2 327Pekalongan* 63.1 55.4 47.7 56.2 268Pemalang* 48.5 60.5 47.2 58.8 462Tegal* 57.3 56.2 50.4 55.8 437Brebes* 50.1 61.0 46.0 53.9 681Semarang* 40.3 40.1 33.0 37.5 316Kendal* 50.2 56.6 45.1 52.5 343Demak* 57.8 49.4 50.1 52.4 374Grobogan* 41.0 48.0 50.4 47.2 377Pati* 48.3 50.2 41.1 47.2 416Jepara* 54.9 51.3 45.7 51.1 355Rembang* 58.1 65.0 41.2 58.7 272Blora* 59.7 59.0 43.3 55.0 416Kudus 26.2 36.4 22.1 28.0 194Klaten 18.4 15.9 14.9 16.1 208Boyolali 24.5 27.7 15.0 22.3 192Sragen 52.4 41.4 27.4 43.7 323Sukoharjo 31.0 31.4 19.2 27.1 190Karanganyar 43.2 39.7 21.4 36.0 148Wonogiri 57.8 45.1 27.1 43.1 350Batang 47.5 45.8 49.5 47.3 202Magelang 61.1 21.3 12.9 16.5 88Pekalongan*)***) 30.0 23.0 14.3 19.4 81Tegal*)***) 39.2 31.5 17.0 23.9 79Semarang*)***) 29.7 24.4 15.2 18.8 359Salatiga*)***) 15.2 15.4 11.5 12.4 57Surakarta*)***) 34.4 17.9 10.3 13.3 176

Table 2
Notes :
Page 32
.3 (Continued)
N.S. = No SchoolP.I. = Primary IncompleteP.C. = Primary Completed +
* Regencies and Municipalities located in the Northern coastal areas.
** Provinces.*** KODYA = Municipalities.
Source: Subset of the 1971 Indonesian Population Census.

Page 33
belief. Although this is not convincing evidence, the impression is
gained that culture and religion have an influence on age at marriage of women in Yogyakarta as well as Central Java.
The discussion above serves to give a brief background on the evidence of age at marriage by province and some awareness of cultural
influences. Due to the small numbers in the sampled provinces, analysis of the impact of age at marriage on fertility in chapter 4
will be carried out only for women in Java-Bali as a whole.
2.4.1. DIFFERENTIAL BY TYPE OF PLACE OF RESIDENCE.
Type of place of residence in the 1976 Indonesia Fertility Survey, that is urban and rural areas, was defined in the sample design and not by responses on the individual questionnaires. Sample areas were classified as urban and rural in accordance with the definition used in the 1971 population census (Central Bureau of Statistics and World Fertility Survey, 1978). This classification is not based on the size of locality but on a number of socio-economic charactteristics. Urban areas have the following characteristics:
1. The majority of the work force of the area should be
engaged in non-agricultural activities.
2. The area should have certain institutional arrangements and facilities such as a hospital or clinic, junior high
school and electricity supply.In total only 18 percent of the population of Java-Bali lived in urban areas, of which 30 percent lived in Jakarta. The Indonesia Fertility
Survey findings as shown in Table 2.1, show that on average women in urban areas married about two years older than women in rural areas.
Page 34
This difference can be attributed to the differences in the
characteristics of urban and rural areas as explained above. Due to
the greater availability of educational opportunities and of electricity, people in urban areas have more access to information
through the school system and the mass media, which may have contributed to women delaying their first marriage. On the other hand, rural women are believed to hold more closely to tradition than their counterparts in urban areas and the influences of education and other sources of information are less in rural areas. Age at marriage
by tyPe of place of residence together with education will be examined later in this chapter.
2.4.2. DIFFERENTIAL BY EDUCATION.
Education has multiple effects on an individual person. Through literacy, education gives access to more sources of information, which may lead the person to broader perspectives in their thoughts. Education can also act as a socialization process and inculcates social values that form one's attitudes and patterns of behaviour.
Education, furthermore, is often related to employment opportunities and status of the individual involved (Cochrane, 1979: 29). For women especially, education may be an alternative to early marriage. A girl who is still attending school delays her marriage. Since education is believed to provide job opportunities (normally outside the house), it is also expected that education may provide a
non-familial role for women. It is hypothesized therefore, that education determines the timing of first marriage. The higher the education of a woman, the later the first marriage. This causal
Page 35
relation between education and age at marriage, however, is mostly
found in the developed countries, where a girl has her own right to
decide whether to marry, when to marry, and whom to marry. It also
occurs in the situation of ample availability of alternatives to
marriage. In traditional society, where early and arranged marriage
is still prevalent, the direction of the causal relation might be the
reverse, that is the age at marriage may determine education. When
parents think that the time has come for their daughter to get
married, or when they think that their daughter has attained puberty,
or when a man has come to ask the parents to marry their daughter, or
when parents think that their daughter has reached a suitable age for
marriage according to norms and values in their cultures, they will
asked their daughter to leave school and get married and be a good
wife. The prevalence of arranged marriage, however, is decreasing.
Younger women tend to choose their own husband (Geejrtz, 1961). A more
recent study by Kasto (forthcoming) in 1978 showed that among women
aged 45 and over, 10 percent had chosen their own husband compared
with almost 50 percent among women aged less than 30.
The 1976 Indonesia Fertility Survey for Java-Bali shows an
interesting finding in that there was no difference in age at first
marriage between women who had never been to school and those who had
few years of schooling, that is incomplete primary education. The
average age at marriage for women with no schooling is 15.2 years,
while for those with a few years of schooling is 15.3 years.
Compositional factors might affect these figures, about two thirds (65
percent) of the women aged 25 and over in this survey, had no
education at all, while 16.1 percent had incomplete primary schooling.
The remaining 18.5 percent had at least completed primary schooling
Page 36
Table 2.4.
NUMBERS AND PERCENTAGES OF WOMEN AGED 25+ BY LEVELS OF EDUCATION JAVA-BALI, 1976 INDONESIA FERTILITY SURVEY.
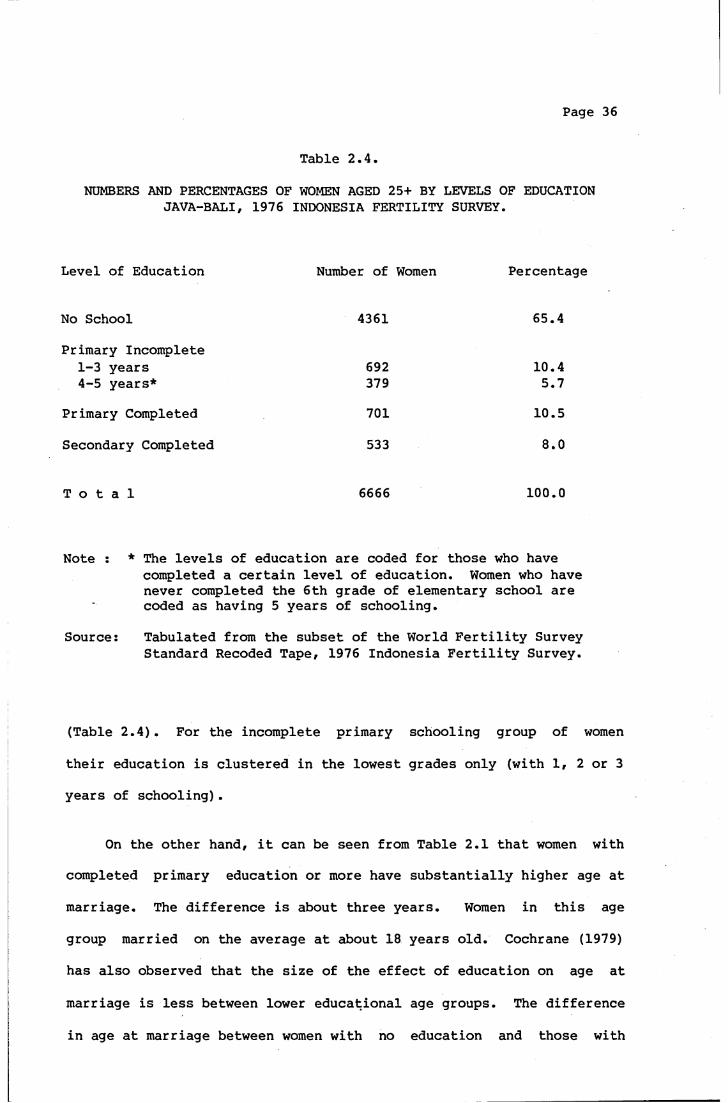
Level of Education Number of Women Percentage
No School 4361 65.4
Primary Incomplete 1-3 years 692 10.44-5 years* 379 5.7
Primary Completed 701 10.5
Secondary Completed 533 8.0
T o t a l 6666 100.0
Note : * The levels of education are coded for those who havecompleted a certain level of education. Women who have never completed the 6th grade of elementary school are coded as having 5 years of schooling.
Source: Tabulated from the subset of the World Fertility SurveyStandard Recoded Tape, 1976 Indonesia Fertility Survey.
(Table 2.4). For the incomplete primary schooling group of women
their education is clustered in the lowest grades only (with 1, 2 or 3
years of schooling) .
On the other hand, it can be seen from Table 2.1 that women with
completed primary education or more have substantially higher age at
marriage. The difference is about three years. Women in this age
group married on the average at about 18 years old. Cochrane (1979)
has also observed that the size of the effect of education on age at
marriage is less between lower educational age groups. The difference
in age at marriage between women with no education and those with
Page 37
primary education is estimated about 2 years in Korea, one year in
Malaysia, 0.6 year in Nepal, 0.5-0.9 in India, and 0.6 in Nigeria. No difference in age at marriage, furthermore, is found in Chimbote between women who have no education and those with 1 to 5 years of
schooling. (Chung, 1972; Lapierre-Adamcyk, 1972; Malaysian World Fertility Survey, 1977; Nepal World Fertility Survey, 1977; Nayar, 1974; Stycos, 1968 cited in Cochrane, 1979: 88). Cochrane has also suggested that the difference in age at marriage between women who have completed primary education and those with secondary education is rather substantial. It is considered that secondary education directly conflicts with marriage, that is as an alternative to early marriage but independent of the job market. However, the size of the effect of hiaher education on age at marriage, according to Cochrane (1979), varied among nations.
As has been suggested in an earlier section, education might be part of the explanation of the difference of age at first marriage between urban and rural women. Women in urban areas tend to have more
opportunities for higher education and thus more alternatives to early marriage. Table 2.5 shows the mean age at marriage by type of place of residence and by education as well. The pattern of the difference between education groups still persists for both urban and rural women. The differences however, are less for rural women than that
for urban women. Standardizing for education resulted in a
standardized mean age at marriage for urban women of 16.3 years, that
is one year lower than the average unstandardized figure. For rural women, no significant difference is found between the standardized mean age at marriage (15.4 years). These results lead to the
conclusion that education has hardly any effect on the level of age at

Page 38
Table 2.5.
MEAN AGE AT MARRIAGE OF WOMEN AGED 25+ BY TYPE OF PLACE OF RESIDENCE AND LEVELS OF EDUCATION, JAVA-BALI, 1976
INDONESIA FERTILITY SURVEY.
No School Incomplete Completed TotalStandard
ized
Urban 15.7(1054)
16.1(280)
19.8(834)
17.3(2168)
16.3
Rural 15.1(3307)
15.2(791)
16.9(400)
15.2(4498)
15.4
Total 15.2(4361)
15.3(1071)
18.2(1234)
15.5(6666)
15.6
Notes : 1) For definition of mean age at marriage, see text,section 2.2.
2) Figures in parentheses = unweighted number of cases.Source : Tabulated from the subset of the World Fertility
Survey Standard Recoded Tape, 1976 Indonesia Fertility Survey.
marriage in rural areas, but its effect on the level in urban areas is significant. Overall, however, it is evident that education has a greater effect on age at marriage than type of place of residence.
SUMMARY.
In this chapter, the examination of the mean age at marriage of women in Java-Bali using data collected from the 1976 Indonesia Fertility Survey (SUPAS III) has found that women in Java-Bali married young, that is 15.6 years on average. Although there is a tendency toward increasing age at marriage those who were aged 25 to 50 years

Page 39
at the time of the survey, experienced very little change in age at marriage.
This study has also found that there is a variability in age at marriage particularly associated with education or with culture. Although we believe that age at marriage is related to the function of marriage in the society, it is not possible from SUPAS III, to derive any conclusion about age at marriage and.the functions of marriage in Java-Bali, but it is likely that those who married at older ages were the leaders of social change which has been growing in momentum with
the spread of education.
The remainder of this thesis is concerned with fertility and in particular the question as to whether persons with differing age at
marriage had different patterns of childbearing.
CHAPTER 3
FERTILITY
In this chapter, findings on levels and trends of fertility from earlier studies will be examined. Second, measures of ferility which will be used in the analysis of fertility from the 1976 Indonesia
Fertility Survey and their reliability will be briefly discussed. Third, from the literature, factors which are considered as having an influence on fertility will be presented, and finally levels of
fertility or Java-Bali women in 1976 and the differences by urban and rural residence and by education will be analyzed.
3.1. LEVELS AND TRENDS IN FERTILITY IN JAVA-BALI.
Before the 1971 Population Census was carried out, studies of fertility were faced by the problem of lack of reliable data. The
1961 Population Census was only partially processed, while the multiround Socio-Economic Surveys of the 1960s were marred by sample size and design (Hull and Mantra, 1981). The 1971 Population Census
was the first census to provide fertility data in greater detail. Estimation of fertility levels has been based on the 'own children method' which utilizes data on children living in the household
matched with 'possible mothers' living in the same household*). This
*) Introduced by W.H. Grabill and developed by Lee-Jay Cho (Grabill and Cho, 1965; Cho, 1973).
Page 41
Census also contained a question on the number of children a woman has
had at the time of the census. Later in 1973 the Demographic Institute University of Indonesia carried out a large scale sample survey covering major islands of Indonesia, with 55,484 ever married women aged 15-49 as respondents. This was called Fertility-Mortality
Survey. This survey collected detailed information on the fertility,
mortality and socio-economic background of respondents. Questions on the pregnancy history of women as well as the number of children ever born were asked in this survey. Age specific marital fertility rates were derived from this survey using the pregnancy history techniques (Bogue and Bogue, Manual no 4). The 1976 Indonesia Fertility Survey (SUPAS III) also collected data on the pregnancy history (called
maternity history by the World Fertility Survey) of women and the
number of children ever born.
Although these surveys and the census may provide better and more consistent estimates of fertility, analyses using data from these sources have to be carried out in greater awareness of the quality of the data. The most severe problem is that information on fertility collected in Indonesia is often suspected to suffer from memory lapse errors. This applies especially to the older women who forget the
dates of births and ages of their children. This problem may have led to understatement of parity levels, as is indicated by data on children ever born to women aged 40 years and above (Cho, Suharto, McNicoll and Mamas, 1980).
Estimates of the crude birth rate in Java before the 1971 Population Census were usually between 40 or 50 births per thousand people. Widjojo (1970) estimated the crude birth rate to be around 45
Page 42
during the 1930s and 1940s, and 47 during the 1950s and 1960s. The estimates of the crude birth rate derived from the 1971 Population
Census was 42 births per thousand population. For Java-Bali, the
total fertility rate estimated from this census was 5.2 children per women for the period of 1961-1970 (Cho et al, 1976). The total fertility rate derived from the 1973 Fertility-Mortality Survey was around 5.1 for the period of 1965-1970 while the SUPAS III findings provided a total fertility estimate of 5.3 for the period of 1967-1970. For the subsequent period, that is 1970-1975, a slight decrease is shown in the level of fertility of Java-Bali (Sinquefield and Sungkono, 1979, Table 1: 45), to 4.6 children per woman. This means that there was a decline of about 14 percent in fertility from 1967 to 1975. Other studies using the same data source also confirmed that there has been a tendency towards declining fertility in Java-Bali in the 1970 (Hull and Mantra, 1979; Cho, Suharto, McNicoll and Mamas, 1980; Hull, Singarimbun and Hull, 1977).
The extent of fertility decline is not equal between provinces in
Java and Bali. The greatest decline was achieved by the province of East Java (-17.0) followed by Bali (-15.5) while West Java achieved the smallest fertility decline (-8.5) (Hull and Mantra, 1981, Table 9.3 , see Appendix IV). What are the causes for the decline in
fertility? There is no doubt that this tendency is associated with national development and modernization, as well as being a result of the family planning program carried out by the National Family Planning Coordinating Board since the beginning of the 1970s. Hull, Singarimbun and Hull (1977) , and Sinquefield and Sungkono (1979), however, claimed that part of the fertility decline can be attributed
to the increasing age at marriage and the consequent decreasing

Page 43
proportions married among young women. The contribution of rising age
at marriage can be detected by the use of Coale's fertility indexes, that is If (overall fertility), Ig (marital fertility), Im (proportions married) and Ih (non marital fertility). In the case of
negligible non-marital fertility, If (overall fertility) is a product of marital fertility and the proportions married (Coale, 1965). The calculation of fertility indexes by Sinquefield and Sungkono (1979)
has shown declining marital fertility (Ig) from .558 to .546 for the
period of 1967-1971 to 1976 and the decreasing proportions married (Im) from .75 in 1971 to .71 in 1976.
This computation suggests that at the aggregate level there is a negative relation between age at marriage and fertility in Java-Bali. This impression, however, should be checked further by examination of the impact of age at marriage on fertility behaviour of individual
women. Does higher age at marriage lead to changes in the subsequent
fertility behaviour of the women concerned or not? This question will be considered in chapter 4.
3.2. RELIABILITY OF CHILDREN EVER BORN DATA.
Data on children ever born, that is the number of children ever
born to a woman up to the survey date, were obtained from the
individual questionnaire as a response to the question: 'How many children do you have?' Considerable care was taken with this question through the use of probe and filter questions. Women were asked about how many sons and daughters they had, how many of them were living in the household with the women, how many were living elsewhere and how

Page 44
many of their children had died. This was done in an attempt to avoid
misreporting of the number of children by mothers. Misreporting of children had been quite pronounced in previous fertility surveys in Indonesia. Women sometimes suffered from recall lapse, especially older women who had to report experience dating back many years from the time of the survey. This memory lapse was very apparent in cases where the child died soon after birth or when the child did not live
with the mother anymore. MacDonald, Simpson and Whitefield (1978: 26, 30) who conducted the assessment of the reliability of the 1976 Indonesia Fertility Survey Data, also considered this deficiency.
The result of the post-enumeration study, however, showed that there was a high level of consistency of answers in the fertility section*). They, therefore, concluded that the children ever born data in the 1976 Indonesia Fertility Survey are reasonably reliable.
3.3. FACTORS AFFECTING FERTILITY.
Efforts to explain fertility differences within groups of a
society or accross societies have a long history. In 1945 Notestein and the 'Princeton School' introduced the demographic transition theory to explain the differences between fertility in the developed and the developing countries. This theory, however, has failed to
adequately explain the process of demographic change in the European countries (Jones, 1977). Since then, observation on the causes and
variation in fertility have focused on the socio-economic and cultural
*)As much as eighty percent of women in the post enumeration survey gave consistent answers as those in the first interview.
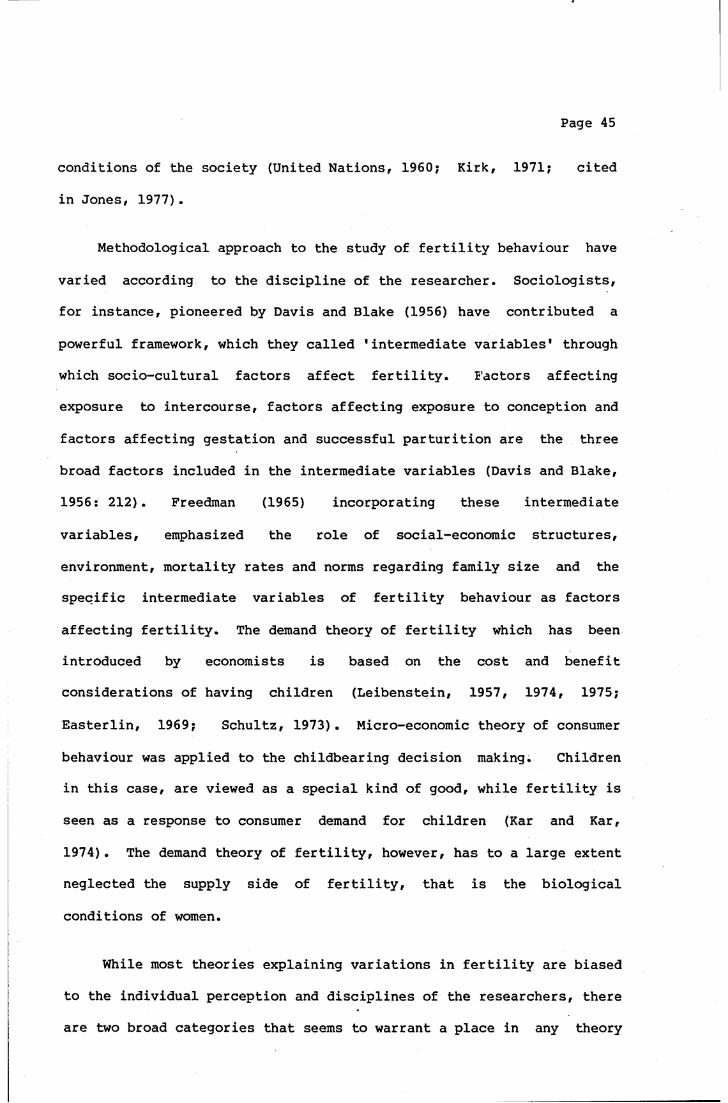
Page 45
conditions of the society (United Nations, 1960; Kirk, 1971; cited
in Jones, 1977).
Methodological approach to the study of fertility behaviour have
varied according to the discipline of the researcher. Sociologists,
for instance, pioneered by Davis and Blake (1956) have contributed a
powerful framework, which they called 'intermediate variables' through
which socio-cultural factors affect fertility. 1 actors affecting
exposure to intercourse, factors affecting exposure to conception and
factors affecting gestation and successful parturition are the three
broad factors included in the intermediate variables (Davis and Blake,
1956: 212). Freedman (1965) incorporating these intermediate
variables, emphasized the role of social-economic structures,
environment, mortality rates and norms regarding family size and the
specific intermediate variables of fertility behaviour as factors
affecting fertility. The demand theory of fertility which has been
introduced by economists is based on the cost and benefit
considerations of having children (Leibenstein, 1957, 1974, 1975;
Easterlin, 1969; Schultz, 1973). Micro-economic theory of consumer
behaviour was applied to the childbearing decision making. Children
in this case, are viewed as a special kind of good, while fertility is
seen as a response to consumer demand for children (Kar and Kar,
1974). The demand theory of fertility, however, has to a large extent
neglected the supply side of fertility, that is the biological
conditions of women.
While most theories explaining variations in fertility are biased
to the individual perception and disciplines of the researchers, there
are two broad categories that seems to warrant a place in any theory
Page 46
of fertility determinants that is: biological factors and behavioural
factors. Biological factors are those that can be considered as constraining the reproductive processes and determining fecundity or the potential supply of births, while behavioural factors, are those
that modify the extent to which the biological maximum is realized (Schultz, 1974: 3). In many studies, reproductive behaviour is often associated with the parents' socio-economic characteristics. In the following examination of differential fertility, therefore, characteristics of mothers will be used to explain fertility. Unfortunately, the characteristics of couples collected by the World Fertility Survey were very limited and have been considered inadequate to explain variations in fertility (Miro, forthcoming). Because of this, in this study, only two variables will be considered: these are the type of place of residence and the levels of education of women.
Table 3.1 shows the mean number of children ever born from the data collected in the 1976 Indonesia Fertility Survey. From this Table, it is seen that on average, women in Java-Bali aged 45 years and over have a completed parity of about 5 children. The mean parity for all women in the survey is 3.5 children. Again, due to the consideration that cultural factors might affect the level of
fertility, children ever born will be examined by region (provinces).
From the same Table, it is found that women in Jakarta have the largest number of children, that is 6.1 children per woman. Women in
East Java, on the other hand, have the smallest number of children,
that is 4.7. Women from the rest of the provinces, that is West Java, Bali and Central Java are recorded as having the same level of
completed parity. It is surprising to note that women in Jakarta,
which is a metropolitan and capital city, have in fact the highest
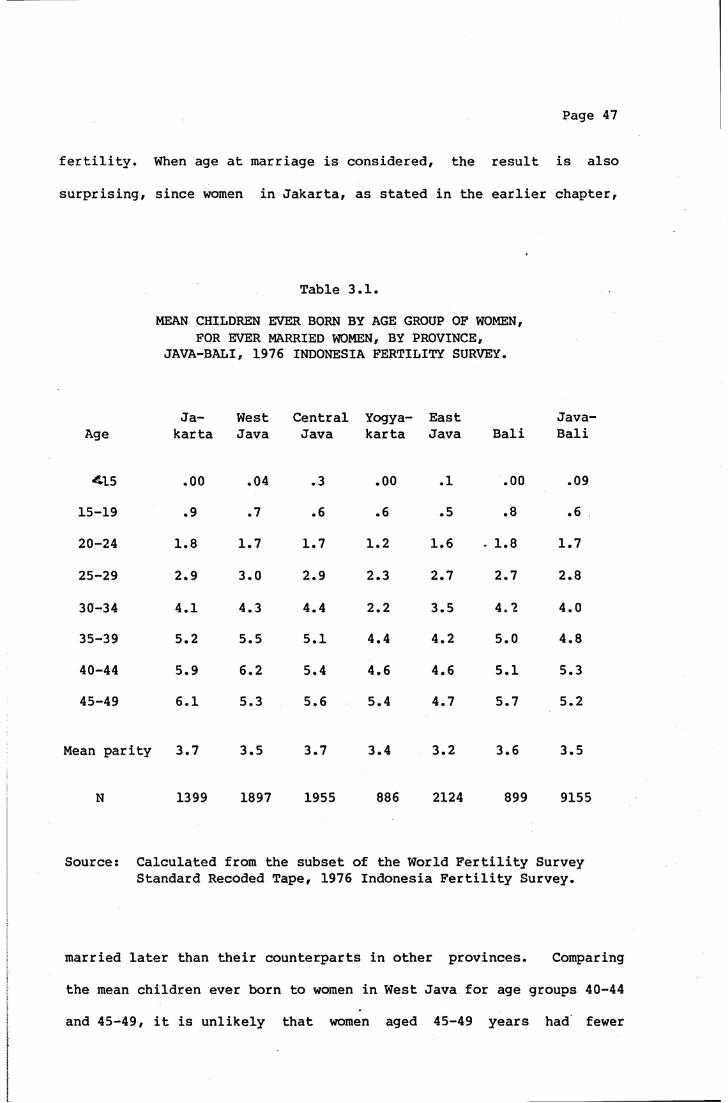
Page 47
fertility. When age at marriage is considered, the result is also
surprising, since women in Jakarta, as stated in the earlier chapter,
Table 3.1.MEAN CHILDREN EVER BORN BY AGE GROUP OF WOMEN,
FOR EVER MARRIED WOMEN, BY PROVINCE,JAVA-BALI, 1976 INDONESIA FERTILITY SURVEY.
AgeJakarta
WestJava
CentralJava
Yogya'karta
EastJava Bali
Java-Bali
4,15 .00 .04 .3 .00 .1 .00 .0915-19 .9 .7 .6 .6 .5 .8 .620-24 1.8 1.7 1.7 1.2 1.6 - 1.8 1.725-29 2.9 3.0 2.9 2.3 2.7 2.7 2.8
30-34 4.1 4.3 4.4 2.2 3.5 4.2 4.035-39 5.2 5.5 5.1 4.4 4.2 5.0 4.840-44 5.9 6.2 5.4 4.6 4.6 5.1 5.345-49 6.1 5.3 5.6 5.4 4.7 5.7 5.2
Mean parity 3.7 3.5 3.7 3.4 3.2 3.6 3.5
N 1399 1897 1955 886 2124 899 9155
Source: Calculated from the subset of the World Fertility SurveyStandard Recoded Tape, 1976 Indonesia Fertility Survey.
married later than their counterparts in other provinces. Comparing
the mean children ever born to women in West Java for age groups 40-44 and 45-49, it is unlikely that women aged 45-49 years had fewer

Page 48
children (5.3) than those aged 40-44 years (6.2). Some researchers
prefer to use measure for women aged 40-44 years since the fertility
for those 45-49 years old is suspected to suffer from recall lapse. If this is the case, women in West Java can also be considered as
having high fertility. The 1971 Population Census also recorded higher fertility for women in Jakarta, West Java and Bali than among the ethnic Javanese in East Java, Central Java and Yogyakarta (Cho et al., 1976). In their study of Javanese in a small village near Yogyakarta, Singarimbun and Manning (1976) found that cultural factors
have influenced the level of fertility of women in this area. Traditional practices such as prolonged breastfeeding, longer post-partum amenorrhoea and sexual intercourse taboos were found to suppress the level of fertility in this village.
Further examination of fertility differences in terms of place of
residence and level of education of women will be done only for women in Java-Bali as a whole because of the small numbers of women in the sample.
With regard of the type of place of residence, Table 3.2 shows
that women aged 45 and over who reside in urban areas have slighty fewer children than those who reside in rural areas, that is 5.1 as compared to 5.2 children. An examination of all ever married women by age groups shows that except for ages 30-34 and 45-49, all age groups
of women in urban areas have higher fertility than those in rural
areas. Studies from the 1973 Fertility-Mortality Survey have also found only a slight difference in the level of fertility between urban and rural women (McDonald, Yasin and Jones, 1976: 6), while Hatmadji and Budi Soeradji (1980) found a tendency for urban women in the SUPAS
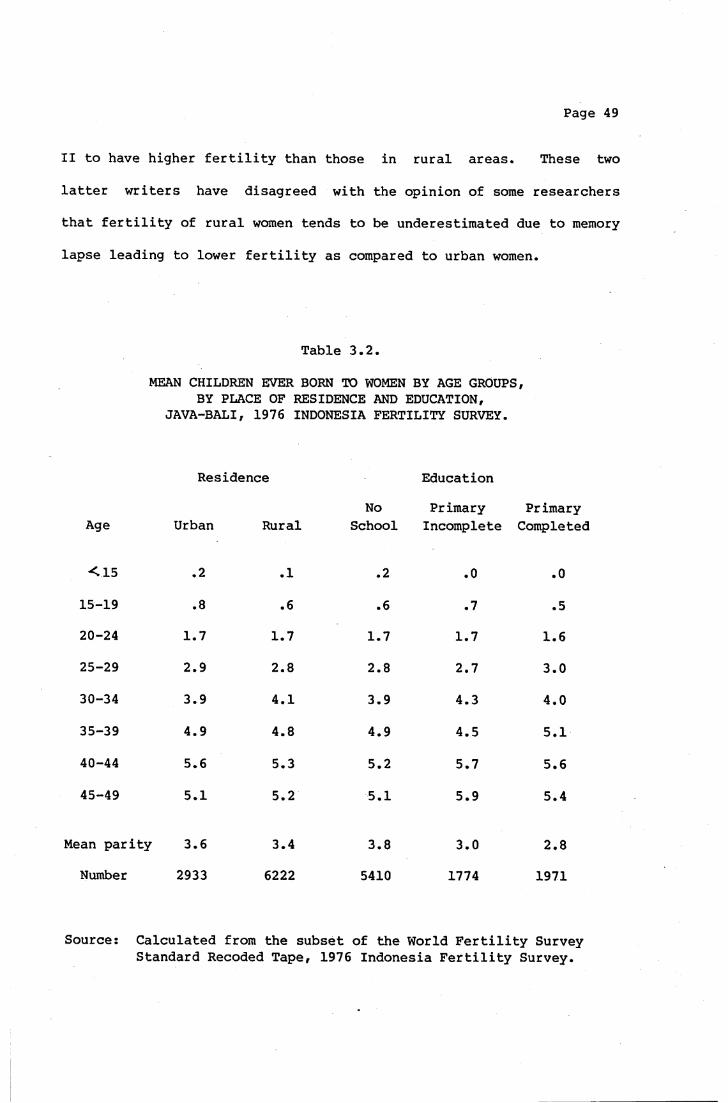
Page 49
II to have higher fertility than those in rural areas. These two
latter writers have disagreed with the opinion of some researchers that fertility of rural women tends to be underestimated due to memory
lapse leading to lower fertility as compared to urban women.
Table 3.2.
MEAN CHILDREN EVER BORN TO WOMEN BY AGE GROUPS, BY PLACE OF RESIDENCE AND EDUCATION,
JAVA-BALI, 1976 INDONESIA FERTILITY SURVEY.
Residence EducationNo Primary Primary
Age Urban Rural School Incomplete Completed
<15 .2 .1 .2 .0 .015-19 .8 .6 .6 .7 .520-24 1.7 1.7 1.7 1.7 1.625-29 2.9 2.8 2.8 2.7 3.030-34 3.9 4.1 3.9 4.3 4.035-39 4.9 4.8 4.9 4.5 5.140-44 5.6 5.3 5.2 5.7 5.645-49 5.1 5.2 5.1 5.9 5.4
Mean parity 3.6 3.4 3.8 3.0 2.8Number 2933 6222 5410 1774 1971
Source: Calculated from the subset of the World Fertility SurveyStandard Recoded Tape, 1976 Indonesia Fertility Survey.
Page 50
Generally, women in urban areas are considered as having more
access to education, information , modernization and other influences from the developed world, that might lead to changes in their
behaviour, in this case toward a lower target family size. In the developed countries, indeed, it is found that in urban areas fertility is lower than in rural areas. This is the case for instance, in Poland, Yugoslavia and Australia. In the developing countries
however, the pattern of relation varies (Lucas, 1980: 82). In Korea and Pakistan according to Lucas (1980), urban fertility is higher while in Sri Lanka urban fertility is lower as compared to rural fertility.
Considering the very slight differences in fertility of urban and rural women in Java-Bali from the 1976 Indonesia Fertility Survey and also noting that urban women tend to marry later than rural women,
this indicates that urban and rural women must have different marital fertility. Because of this, in chapter 4, the fertility behaviour of women subsequent to marriage will be compared.
Table 3.2 also shows that women aged 45 and over who have never
gone to school have fewer children (5.1) than those who have attended but not completed primary school (5.9) and those who have completed their primary school and over (5.4). The inverted U-shaped pattern of
relation is evident at most ages with the exception of age group 35-39. Earlier studies in Indonesia have also found a similar pattern including findings from the 1971 Population Census, the 1973
Fertility-Mortality Survey and the 1974 survey in Maguwoharjo, a small village near Yogyakarta (Hull, 1976: 3). Furthermore, two similar
findings from the developed countries, which were cosidered by Nayar
Page 51
(1974) as contrary to the regular pattern of relation between fertility and education, were found in Great Britain in 1951-1952 and in the Netherlands in 1947.
In recent years, the pattern of relation between education and
fertility has created much discussion among demographers. While
McGreevey and Birdsall (1974); Simon (1974), Mason et al. (1971) felt confident about the negative relation between these two variables, Hull (1976), Cochrane (1979), Hermalin and Mason (1981) and Jain (1981) believe that the relation is not always negative. Cochrane (1979) concludes that a small amount of education in least
literate societies might initially increase women's fertility. The most probable explanation for this, according to her, is that education tends to encourage women to give up traditional practices such as prolonged breastfeeding and longer post-partum amenorrhoea which suppress fertility, while the practice of contraception is still very limited. Hull (1976) in her explanation of the inverted U-shaped pattern in Java stated that women who were not educated were those from lower socio-economic strata. In turn, lower socio-economic status women were those observed as having less marital stability,
more foetal death, and greater practice of abstinence so that their fertility was lower.
The number of children ever born was further examined for women aged 40 years by type of place of residence as well as by education
(Table 3.3). From this Table it is seen that for urban women, the inverted U-shaped pattern by level of education still persists with women who have some years of schooling (primary incomplete) having the highest number of children ever born. This however, might be

Page 52
influenced by the small number of rural women in the sample who have
completed primary school. Figures standardized for place of residence confirms that inverted U-shaped pattern by education for all women
still persist. Standardized figures eliminating the effect of education show no difference with the unstandardized ones, which leads to the conclusion that education distribution plays no part in explaining
the similarity of fertility levels in urban and in rural areas.
Table 3.3.MEAN CHILDREN EVER BORN TO WOMEN AGED 40+ BY TYPE OF
PLACE OF RESIDENCE AND BY LEVELS OF EDUCATION, JAVA-BALI, 1976 INDONESIA FERTILITY SURVEY.
-• NoResidence School
Urban 5.4(1448)
Rural 5.2(1286)
Total 5.2(1734)
Standardized 5.2(1803)
EducationPrimary Primary
Incomplete Completed
5.7 5.2(75) (176)5.8 6.0(167) (39)
5.8 5.5(242) (215)
5.8 5.1(272) (139)
Standard-Total ized
5.4 5.42(699) (353)5.3 5.32
(1492) (1861)
5.3(2191)
5.33
Notes : Figures in parentheses refer to the number of cases -unweighted.
Source: Tabulated from the subset of the World Fertility SurveyStandard Recoded Tape, 1976 Indonesia Fertility Survey.

Page 53
In this chapter, the direct effects on fertility of two
socio-economic variables, education and place of residence, have been
considered. It was not possible to consider other effects because of the severely limited nature of the explanatory variables collected in the World Fertility Survey (Miro, forthcoming). In the next chapter,
attention will be focused on one of the intermediate variables of fertility, age at marriage, and its impact on subsequent fertilitybehaviour.

CHAPTER 4
THE IMPACT OF AGE AT MARRIAGE ON FERTILITY OF WOMEN IN JAVA-BALI, 1976.
The differences in fertility presented in the earlier chapter do not take account of the role played by age at marriage. The purpose
of the present chapter therefore, is to examine the impact of age at
marriage on the fertility of women in Java-Bali using findings from the 1976 Indonesian Fertility Survey (SUPAS III). As has been pointed
out in the literature review, the impact of age at marriage on
fertility depends upon the extent to which fertility is natural or
controlled (Henry, 1976 : 91-95). Thus, it might be useful to reiterate what is meant by natural and controlled fertility.
4.1. THE CONCEPT OF NATURAL AND CONTROLLED FERTILITY.
The concept of natural and controlled fertility, according to Henry (1961), applies to fertility of the couples living in long term
sexual unions, whether or not these couples are legally married. Natural fertility is defined as fertility achieved in a population where there is no deliberate use of birth control. Controlled
fertility on the other hand, is fertility where the behaviour of couples is bound to parity, that is, the number of children they have. Under controlled fertility, behaviour is modified in order to achieve a certain number of children. In short, controlled fertility implies that couples aim at a target family size, while with natural fertility they do not. Behaviour that affects fertility but is independent of

Page 55
parity such as prolonged breastfeeding, abstinence during lactation
and sexual intercourse taboos are, according to this definition, considered to be consistent with natural fertility.
Although this definition is quite clear, one might have difficulties in identifying whether a population has natural or
controlled fertility. For natural fertility, it must be established
that a population has no deliberate birth control, or where control is very limited that it does not affect fertility. Secondly, it is very difficult to know whether or not practices which lead to birth spacing
are deliberate attempts to control fertility. Some researchers have identified natural fertility through judgement, based on consideration
of time, place, thought, culture or type of society. Henry (1961)
suggested that the fertility of rural France was not natural around the years 1750 to 1790, while for the governing classes in Geneva fertility was natural for those who were born before 1650. He considered furthermore, that for many non-European populations there was strong evidence to suggest a virtual complete absence of birth
control, either in the past or up to the time he made this study
(1961). More recently, Knodel (1978) in disputing an earlier view of Wrigley (1966), claimed that the fertility of women in rural Germany
was natural in the pre-industrial era. To prove his case he made use
of analysis of age at marriage and age at last birth.
In this chapter, the impact of age at marriage on fertility in Java-Bali will be analyzed in terms of variables which represent the subsequent fertility behaviour of women following first marriage. These include the first birth interval, age at first birth, the intervals between first and second birth, between second and third,
Page 56
between third and fourth birth and age at last birth, all in relation
to age at marriage of women. Through these variables then, the fertility of women in Java-Bali will be evaluated as to whether it is
natural or controlled. Completed parity, that is the children ever born to women aged 40 years and above will be used as the fertility measure.
Because the data refer to women aged 40 and over in 1976, this study largely refers to fertility in Java-Bali before the implementation of the National Family Planning Program. The study will, therefore, serve as a benchmark for future studies on the impact of the program.
4.2. THE IMPACT OF AGE AT MARRIAGE ON FERTILITY.
Fertility is basically a result of three steps or processess: intercourse, conception and parturition. These three steps were called intermediate variables by Davis and Blake (1956). Henry (1961)
stated that these three processes are determined by both physiological
and behavioural factors. One might say that fertility is a result of a series of happenings during the span of the childbearing period; that is, the length of time between the onset of childbearing till the end of the reproductive life of a woman. In traditional society where
fertility is usually natural or where there is very little control of fertility, the onset of the childbearing period begins with the age at
entry into sexual union, that is the age at which a woman is exposed to the risk of conception. If there is very little evidence of premarital intercourse, and if the wedding ceremony is followed by
consummation, the age at first marriage can be treated as equal to the
Page 57
age at entry into sexual union. Thus, age at marriage, marks the
beginning of the childbearing period. Under natural conditions women
who marry early will have a longer childbearing period and thus are
expected to have a larger number of children, as compared to women who
marry later who would be expected to have a smaller number of
children. The difference in completed parity between women marrying
early and those marrying later, in the natural fertility situation, is
due to the difference in the length of the childbearing period. The
pattern of age specific marital fertility rates will show a high
fertility level in the peak of the childbearing ages slowly
diminishing as the age of women increases and finally ending up at
zero at the end of the reproductive life. This shows the impact of
the absence of fertility control where women are still reproducing
until menopause. In natural fertility, it is assumed that age
specific marital fertility is not related to age at marriage of women
(Henry, 1961; Henry, 1976; Knodel, 1978). The age specific marital
fertility rates will not differ greatly between age at marriage groups
because fertility at any age will be determined by fecundity and not
by the number of children that a women has.
With controlled fertility, age at marriage does not always mark
the beginning of the childbearing period. With the use of
contraception or other means of fertility control, a woman's age at
entry into sexual union is not always equal to the age at which she is
exposed to the childbearing risk. A woman in this case, might marry
early but postpone having a baby. On the other hand, a woman might
marry later (due to education, participation in the work force and so
on), but want to have children quickly to make up for the time lost
due to marrying late. Both early or later marriers will finish
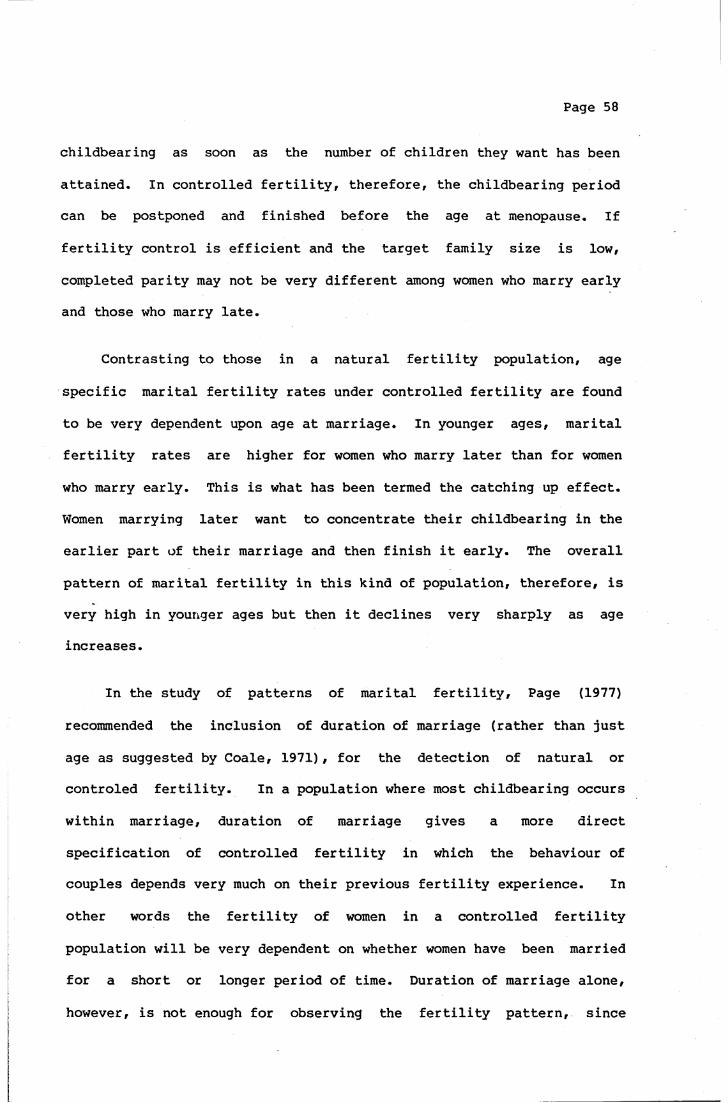
Page 58
childbearing as soon as the number of children they want has been
attained. In controlled fertility, therefore, the childbearing period can be postponed and finished before the age at menopause. If
fertility control is efficient and the target family size is low, completed parity may not be very different among women who marry early and those who marry late.
Contrasting to those in a natural fertility population, age
specific marital fertility rates under controlled fertility are found
to be very dependent upon age at marriage. In younger ages, marital fertility rates are higher for women who marry later than for women who marry early. This is what has been termed the catching up effect. Women marrying later want to concentrate their childbearing in the earlier part of their marriage and then finish it early. The overall
pattern of marital fertility in this kind of population, therefore, is very high in younger ages but then it declines very sharply as age increases.
In the study of patterns of marital fertility, Page (1977)
recommended the inclusion of duration of marriage (rather than just
age as suggested by Coale, 1971), for the detection of natural or controled fertility. In a population where most childbearing occurs
within marriage, duration of marriage gives a more direct specification of controlled fertility in which the behaviour of couples depends very much on their previous fertility experience. In
other words the fertility of women in a controlled fertility
population will be very dependent on whether women have been married for a short or longer period of time. Duration of marriage alone,
however, is not enough for observing the fertility pattern, since
Page 59
childbearing is also influenced by a physiological factor, that is the fecundity which diminishes as age increases. Duration of marriage together with age, according to Page, provides a better basis for
explaining parity, since it has several advantages. First, it
indicates clearly what proportion of the total childbearing period is completed. Second, with duration of marriage, it is possible to
follow the fertility experience of a marriage cohort, that is a group cf women married for the first time at the same time. Such analysis, although it starts with cross-sectional data, is in fact not restricted to cross sectional fluctuation which sometimes leads to
misleading interpretation.
4.3. CHILDREN EVER BORN BY AGE AT MARRIAGE
Table 4.1 shows children ever born by age at marriage for women age 40 years and over. The use of age 40 years and over as a measure of completed parity in this analysis is necessary because of the small number of cases of women using aged 45 years and over. From this
Table it is seen that women who married before their fifteenth
birthday have on the average 2 children more than those who married at age 25 years or older. However, the differences in the mean numbers of children ever born between women who married before age 15 years
and those who married at ages 15-17 and 18-19 years are negligible. A marked decline begins only for women married at age 20 years or older.
This pattern of declining fertility by age at marriage agrees
only in part with Henry's hypothesis on decreasing completed fertility due to increasing age at marriage. While Henry's pattern shows a sharp decline of fertility starting with women married at ages 20
Page 60
Table 4.1.MEAN NUMBER OF CHILDREN EVER BORN (COMPLETED PARITY) FOR WOMEN AGED 40+ IN JAVA-BALI BY AGE AT MARRIAGE,
JAVA-BALI, 1976 INDONESIA FERTILITY SURVEY.
Age at
inr—1
V 15-17 18-19
Java-Bali 5.4 5.5 5.4Number 797 685 298
MarriageAll
20-21 22-24 25+ Women
4 6 4.7 2.9 5.3188 111 112 2191
Source: Tabulated from the subset of the World Fertility SurveyStandard Recoded Tape, 1976 Indonesia Fertility Survey.
years and older, the pattern for Java-Bali women, however, shows a sharp decline for women married at ages 20-21 but no further decline for women married at ages 22-24 years old (figure 4.1). Furthermore,
the levels of completed parity of Java-Bali women in this figure, are lower compared with Henry's level of natural fertility. As Henry's hypothesis were derived from European populations, he does not specify
the pattern of fertility of those marrying below age 20 years.
Further examination of children ever born by duration of marriage
(Table 4.2) shows that in the first 20 years of marriage parity is
about the same among women who married at ages 15 to 24 years. There is a tendency for a slight increase in parity for women married at ages 18-19 and 20-21, however, this difference dissapears when the duration of marriage reaches 15-19. This similar parity among women married 15-19 years before the survey leads to an impression that in the earlier years of marriage, parity does not depend very much on the
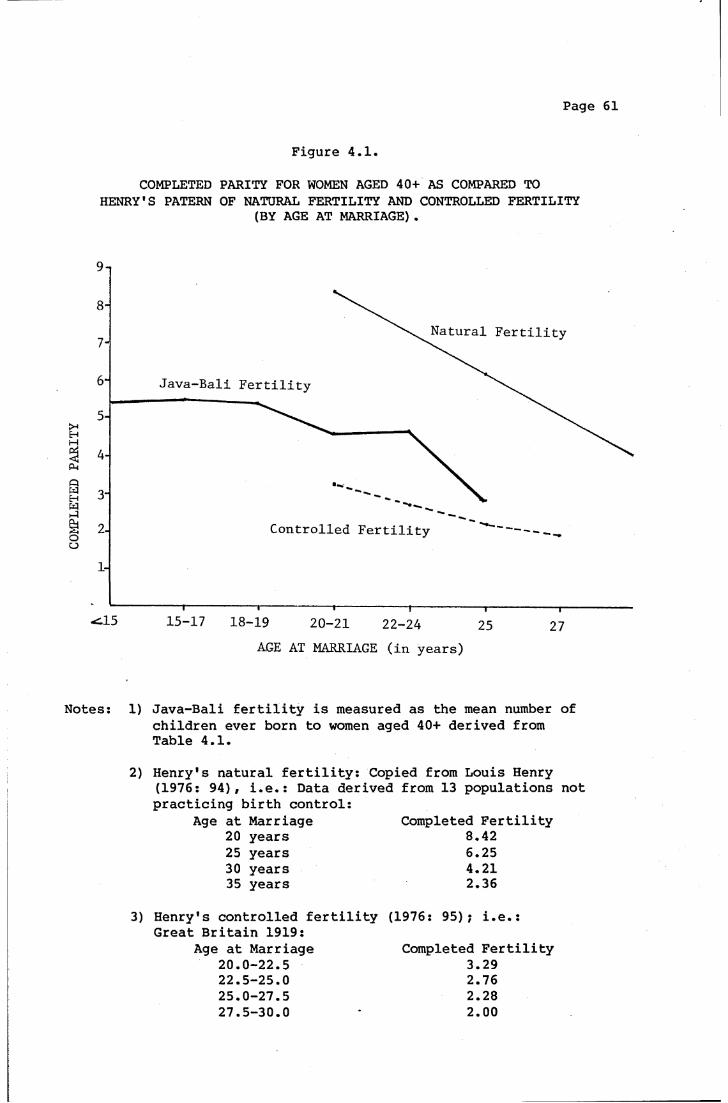
COMPLETED
PARITY
Page 61
Figure 4.1.
COMPLETED PARITY FOR WOMEN AGED 40+ AS COMPARED TO HENRY'S PATERN OF NATURAL FERTILITY AND CONTROLLED FERTILITY
(BY AGE AT MARRIAGE).
Natural Fertility
Java-Bali Fertility
Controlled Fertility
15-17 18-19 20-21 22-24AGE AT MARRIAGE (in years)
Notes: 1) Java-Bali fertility is measured as the mean number ofchildren ever born to women aged 40+ derived from Table 4.1.
2) Henry's natural fertility: Copied from Louis Henry (1976: 94), i.e.: Data derived from 13 populations not practicing birth control:
Age at Marriage 20 years 25 years 30 years 35 years
Completed Fertility 8.42 6.25 4.21 2.36
Henry's controlled fertility (1976: 95); i.e.:Great Britain 1919:
Age at Marriage20.0- 22.522.5- 25.025.0- 27.527.5- 30.0
Completed Fertility 3.29 2.76 2.28 2.00
3 )

Page 62
Table 4.2.MEAN CHILDREN EVER BORN FOR ALL EVER MARRIED WOMEN BY AGE AT MARRIAGE AND BY DURATION OF MARRIAGE,
JAVA-BALI, 1976 INDONESIA FERTILITY SURVEY.
Durationof
Marriage <15 15-17
0-4 .51 .78
5-9 1.77 2.1710-14 3.12 3.3015-19 4.03 4.56
20-24 4.88 5.2525-29 5.23 5.6430-34 5.31 5.3635+ 5.64
Number
Note : N = Number of
Age at Marriage 18-19 20-21 22-24
.71 .98 .80 2.23 2.57 2.15 3.44 3.51 3.46 4.33 4.23 4.30
5.41 4.23 4.98 5.31 5.45 5.11 4.88
cases.
All25+ Women N
.49 .73 17451.79 2.07 15413.01 3.26 14013.67 4.27 13653.02 5.00 1317
5.38 10345.32 62b5.64 124
9155
Source: Tabulated from the subset of the World Fertility SurveyStandard Recoded Tape, 1976 Indonesia Fertility Survey.
age at marriage, and thus, the difference of the completed parity by age at marriage is largely due to the differences in the length of the childbearing period. The fewer children born to women married before
the age of 15 years in the first 20 years of marriage might be due to the effect of adolescent subfecundity, while for those who married after age 25 years the lower fertility might be due to the effect of late subfecundity. Another possibility for the lower fertility for

Page 63
women married before 15 years is that it might be due to the
prevalence of marital disruption. It is widely recognized that
Java-Bali has a relatively high level of divorce. Divorce is
especially frequent among those who married very young, usually
associated with marriage arranged by parents. Women who experience
marital disruption will have shorter exposure to childbearing and thus
perhaps a smaller number of children. A study using the same source
of data in comparison with other World Fertility Survey countries done
by McDonald, Ruzicka and Caldwell (forthcoming) has noted that in
Java-Bali a high percentage of marital dissolution was reported among
women within the first five years of their first marriage. The
percentage was 39 percent among women married before their fifteenth
birthday, 31 percent for women with age at marriage 15-16 years, and
for women married at 17-19 and 20 years and over, 21 and 16 percent
respectively (McDonald, Ruzicka and Caldwell, forthcoming, Table 9) .
These authors, furthermore, have also noted that the remarriage rate
was also high among divorcees in Java, so that the number of years
since first marriage differs only slightly (Table 4.3).
From Table 4.3 it can be seen that the differences between the
expected years and the actual years spent in the married state are
very small, ranging from 2.3 years for those married at age 18 and
above to 4.1 years for those married at 13-14 years with an average
difference of 3.2 years for total women. Will these short differences
affect the fertility level of the women concerned? Some researchers
have noted that those who divorce are in fact those who were unhappy
with their marriage and thus who were less fertile (Thornton, 1977).
This statement is supported by evidence from the study by McDonald,
Ruzicka and Caldwell (forthcoming). These authors have confirmed that

Page 64
Table 4.3.AVERAGE YEARS SINCE FIRST MARRIAGE AND AVERAGE YEARS
SPENT IN THE MARRIED STATE, EVER MARRIED WOMEN AGED 40+.
Age at First Marriage<13 13-14 15-17 18-19 20+ Total
Average years sincefirst marriage 33.2 30.4 28.4 25.7 21.3 28.5Average years spentin the married state 29.6 26.3 25.2 23.4 19.0 25.3
Source: Copied from McDonald, Ruzicka and Caldwell (forthcoming,Table 8).
among those first marriage which were dissolved within the first five years of marriage, 55 percent had zero parity (McDonald, Ruzicka and
Caldwell, forthcoming, Table 20). Sri Poedjiastuti (1979), using the same data set, concluded that women who experienced marital disruption experienced only 75 percent of the fertility of those with no disruption of marriage.
Because of the possible impact of divorce, further examination of the 1976 Indonesian Fertility Survey will be restricted to once married women only. Table 4.4 shows the mean number of children ever
born by age at marriage for once married women. This Table shows a clear relation between age at marriage and fertility. The difference of fertility among women married before age 15 years and those who
married at age 25 years and above is 3.4 children compared with a
difference for all ever married women of 2.5 children (Table 4.1). The sharp decline in fertility is still evident for women married at
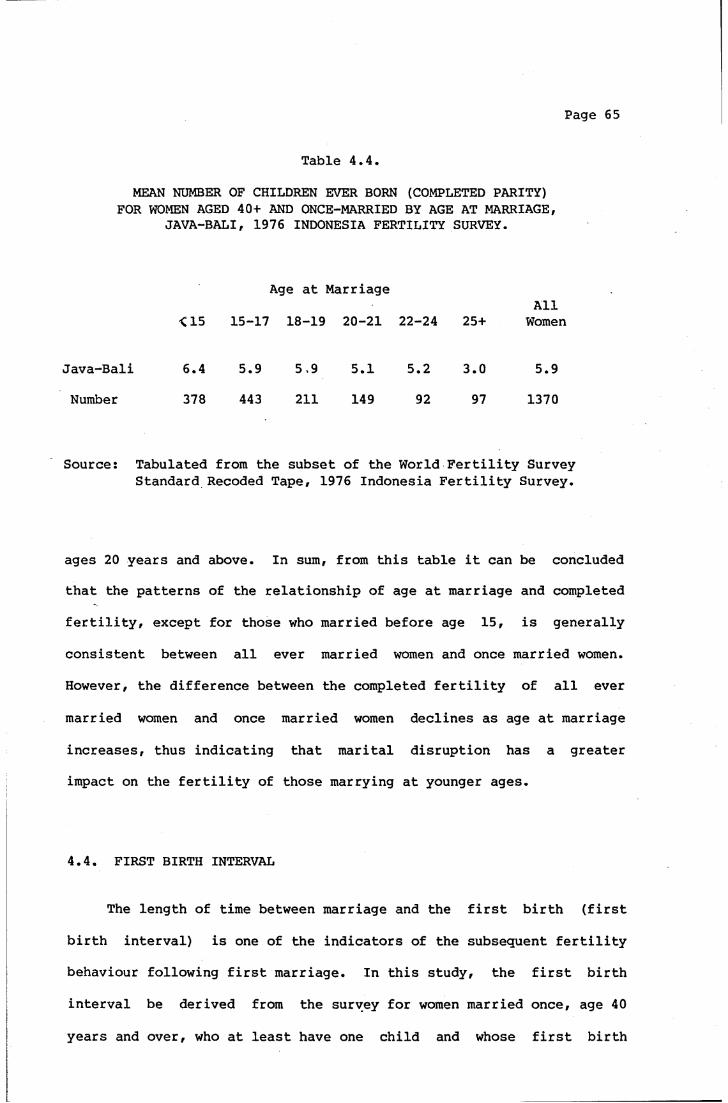
Page 65
Table 4.4.MEAN NUMBER OF CHILDREN EVER BORN (COMPLETED PARITY)
FOR WOMEN AGED 40+ AND ONCE-MARRIED BY AGE AT MARRIAGE, JAVA-BALI, 1976 INDONESIA FERTILITY SURVEY.
Age at Marriage
<15 15-17 18-19 20-21 22-24 25+All
Women
Java-Bali 6.4 5.9 5.9 5.1 5.2 3.0 5.9Number 378 443 211 149 92 97 1370
Source: Tabulated from the subset of the World Fertility SurveyStandard Recoded Tape, 1976 Indonesia Fertility Survey.
ages 20 years and above. In sum, from this table it can be concluded that the patterns of the relationship of age at marriage and completed fertility, except for those who married before age 15, is generally consistent between all ever married women and once married women. However, the difference between the completed fertility of all ever
married women and once married women declines as age at marriage increases, thus indicating that marital disruption has a greater impact on the fertility of those marrying at younger ages.
4.4. FIRST BIRTH INTERVAL
The length of time between marriage and the first birth (first birth interval) is one of the indicators of the subsequent fertility behaviour following first marriage. In this study, the first birth interval be derived from the survey for women married once, age 40
years and over, who at least have one child and whose first birth
Page 66
interval was not less than 8 months, to exclude premarital pregnancy.
Table 4.5 shows that the first birth interval for women aged 40 +(first row) varies with age at marriage. Women who married before their fifteenth birthday have the longest birth interval (42.5 months). The interval then decreases with increasing age at marriage with the lowest birth interval being reached by the women who married at ages 22-24 years old, but then the interval rises again for women
married at 25 years or older. The birth interval represents the result of a physiological factor that is the level of fecundity and behavioural factors such as the pattern of sexual intercourse and the practice of contraception. Physiologically human fecundity depends on the age of the women. It is difficult however, to measure the fecundity level of a woman since the first menstruation is sometimes unovulatory and the age at first menstruation is found to differ from population to population (Leridon, 1977: 8-9). The most popular measure to estimate the fecundity of a woman is fecundability. The
term fecundability as defined by Gini (1924: 889-92 cited by Leridon,1977: 22) means the probability that a married woman conceives during a month, in the absence of any Malthusian or neo-Malthusian
practice intended to limit procreation. It is calculated from the time of first marriage to the first conception. Fecundability of
women varies with age, and according to Henry (1965: 342 cited in
Jain, 1969: 79):
Fecundability of a woman is zero until some age a, then it increases to some age b, passes through a constant maximum from age b to age y and then decreases until age z when it becomes zero again.
This pattern is supported by Vincent'.s data on newly wed French women which show that the fecundability doubled between ages 15 and 20 years
Page 67
(1961: 212-13 cited in Leridon, 1977: 370) and by Jain (1969: 80,
Table 4) on data for Taichung (Taiwan) women. The Taichung data showed that the lowest fecundability was found among women aged 15, it then increases to a maximum between ages 21 and 25 and then started to decline from age 26 onwards. Studies by Berquo et al. (1968 cited by
Leridon 1977: 35-31) of women of Sao Paulo have also found the same pattern of fecundability by age.
According to these various findings, the pattern of fecundability by age forms ’an inverted U-shaped' The low level of fecundability in
younger ages is attributed to adolescent subfecundity while the decline at the later ages is due to late subfecundity. The relation of fecundability and age at marriage is formed within the assumptions that if fertility is natural and premarital conception is rare and marriage is consummated soon after the date at first marriage, then age at marriage can be used in the measurement of the age at which a woman reaches a certain level of fecundability. The pattern of fecundability by age at marriage furthermore, will resemble the pattern of fecundability by age.
Examining the first birth interval for women in Java-Bali in Table 4.5, which is also illustrated in figure 4.2, the pattern of first birth intervals by age at marriage is broadly U-shaped. This pattern corresponds with Henry's pattern of fecundability by age. Women who married before age 15 years have a very low fecundability
and thus have a longer first birth interval. The interval then
declines with increasing age at marriage, reaching a somewhat constant level of fecundability between ages 20 to 24 years. The average first
birth interval for women married at age 25 years and over is higher

Page 68
again indicating the start of declining fecundability by age.
Table 4.5.
MEAN LENGTH OF FIRST BIRTH INTERVAL (IN MONTHS) FOR ONCE-MARRIED WOMEN AGED 40+ AND FOR WOMEN MARRIED 5-14 YEARS
BEFORE THE SURVEY BY AGE AT MARRIAGE,JAVA-BALI, 1976 INDONESIA FERTILITY SURVEY.
<15 15-17 18-19 20-21 22-24 25+ Total N
Women aged 40+ 42.5 34.7 32.4 25.6 22.8 24.8 25.5 1177
Women with marriage duration of 5-14 years 32.1 25.9 20.6 19.2 17.9 22.7 25.8 1920
Note : *) The first birth interval for women aged 40+ is restrictedto women with intervals of more than 8 months and less than 144 months (12 years), see Appendix V and text 4.4.
Source: Tabulated from the subset of the World Fertility SurveyStandard Recoded Tape, 1976 Indonesia Fertility Survey.
Although the pattern of first birth intervals for Java-Bali women
corresponds with Henry's pattern of fecundability by age, it is also necessary to examine whether the level, that is the length of first birth interval is consistent with a natural fertility situation. In
this case, a comparison will be made using Jain's data on the mean delay of first conception by age at marriage of the Taiwanese women in 1962 (Jain, 1969: 79, Table 3). The mean delay of first conception in
Jain's study is the length of time from marriage to the first conception in the absence of birth control practices (copied in Table 4.5a, first row). These data take account of the fact that a first

MEAN D
ELAY O
F FIRST
CONCEPTION
(in months)
Page 69
Figure 4.2.
MEAN DELAY OF FIRST CONCEPTION (IN MONTHS) OF TAIWANESE WOMEN (1962), FOR JAVA-BALI WOMEN AGED 40+ AND FOR JAVA-BALI WOMEN WITH
5-14 YEARS OF MARRIAGE DURATION BY AGE AT MARRIAGE.
durationTaiwan 1962
16 17 18 19 20 21 22 23 24 25 26AGE AT MARRIAGE (in years)
Notes : 1) The age at marriage data for the Java-Bali women isgrouped into %15, 15-17, 18-19, 20-21, 22-24 and 25 years and over.
2) The rate of pregnancy loss for Java-Bali women is assumed to be the same as for Taiwanese women in 1962 (see text).
Source: Table 4.5a.
conception may have ended in a pregnancy loss which is not the case
for birth interval data.Pregnancy losses in Jain's study were found to be about 7 percent of conceptions on the average (Jain, 1969: 80, Table 49). For the purpose of comparison, therefore, it was necessary to derive the mean delay until first conception for Java-Bali women. First, the mean length of first birth intervals for women in Java-Bali
were reduced by the average gestation period of nine months to obtain

MEAN
DEL
AY O
F FIRST
CONC
EPTI
ON (IN
MONT
HS)
FOR
WOME
N IN
TAIW
AN 1
962
AND
FOR
WOME
N IN J
AVA-
BALI
AGE
D 40
+ AN
D FOR
WOME
N WI
TH D
URAT
ION
OF M
ARRI
AGE
OF 5
-14
YEAR
S BY A
GE A
T MA
RRIA
GE.
Page 70
4 CTvLO .CM 00
CO V£> h 0. • CO o
LPv • •0- C\J Pi •HC\J CO •<— t— •H -P
P-i e coO -P Cm
O P i CO O-P> 4-> «M CD
■0" . X dO CDC\J LPv CD CD TO 4^
tiO -P 0 CD COCO > dD Pi
CO ^— •H CD •H CO *o . • Pi CD 0 0 0 ^. CM 00 Pi CQ 0 0 PO H
C\J CO ■<— CÜ ^ TO > H *e CÖ 0
CD CQ P +>e do •H 0 t HO CO 0 0
CM • Pi H 0 0 - 0 0CM CO Cm CO 0 -H 0 0
CÖ e eCD £ O PSe !* ^ 0 00
■0- •H i—1 LPv 0 0CD T-- . 4-> cO •H • cO E
CM c o CM -P i—1 ■’M* OcO . • Cm CD 0 0 £
•H LPv cn O O pq 0 W)Pi ,— Cm 1 rH 0 0Pi CM PO 0 PP 4-> 0CO O * -P <M > 0 0 0
S CM c - W) O 0 E4 0 00 >-D JjS 00 CD £
cO r - i -P P i—1 rH -Ht — CO O 0 0 0
CD cn . CD Pi CM > 4^ E4•r— 00 LP t - , 0 P 0
< . • -P CD 0 0 O «Mo PO o 4 J Cm O
CM T— CO 4-> •H 0CM •H 4 ^ -H p 0
00 • 4 3 OP O 0T— CT> 0 P‘ 0 , 0 Cm 0
O 0 ü 4-3 pq•H O O P O 4 °-P O O -H 0
■0" Oft O ü rOl 4J oc - » CD CO 0 4-5T— O O H H 0
T-- 0 o 0 0 -r -3 rHO -P P P TO 0o 0 •H *H 0 0
P - 00 V £ ) •H CM C)_| £0V O » • • -P .. 0T— T— CP LP\ CO ttf) Cm Ch CO
T— CM t— P 0 o o pq 0•H *H 4-* *HCm >50 0
cO 0 H O 0LPv cm -p r l CJO E 0r— O 0 0 O
O 0 CTi H• >> 0 rH
fP \ cO o 0 Ch > jT— T— t—1 *H 0 0 O O
LPv • • CD -P 0 0 0*— T— «r- T ! f t g CD - d CÖV CP C\J CD S O 0
0 o r" “* *H dD0 0 CO 0 fP \ 0 0 0CD CD CD O pq 0 Pe e S o 0 -P f t f to o 0£ £ Cm 0
0co£
•HcO
Eh
•HI—I +cO OpqicO>cO
r0CDt*0CÖ
•HrHcOpqCÜ>CÖ*“5
0 O PicO P ® CD O Ctf >s *H CO
H -H ' s h cO P - P P
1 0 cOL T i O E
CO(D
O£5 Source:
1) F
rom
Jain
(1969:
79,
Tabl
e 3).
2) a
nd 3
) Re
comp
uted
from
Tabl
e 4.5*
Page 71
the mean intervals from marriage to the conception of the first live birth. Since this result still suffers from the exclusion of pregnancy losses, adjustment then, had to be made to obtain the mean
delay of the first conception. The overall rate of pregnancy loss for
Java-Bali women recorded in the 1976 Indonesia Fertility Survey was six percent. It is not possible to calculate the loss rate for first
pregnancies because the way the data are coded, but as loss rates are
usually higher for first pregnancies, it may be preferable to employ an estimate of about seven percent, the same as that recorded for the
Taiwanese women in 1962. For this seven percent of women , the delay of the first live birth is longer because they have in fact experienced more than one conception plus the length of thepregnancies. In the Indonesia Fertility Survey, 88 percent of pregnancy losses were early foetal deaths rather than late foetal deaths. Therefore, the average length of time from conception to
termination could be estimated at about three months for reported pregnancy losses. Under the assumption of natural fertility, the length of time from marriage to the first conception will be almost
the same as the length of time from termination of the first pregnancy to the second conception*). If it is assumed that no women have more than one pregnancy loss prior to their first live birth, the mean
delay of conception of the first live birth will be equal to (.93 x + .07 y), where x is the length of time from marriage to the first concepton for women experiencing no pregnancy loss. Since the
*)This assumption had neglected post-abortive ammenhorrhoea, however, if we incorporate this, which mean y h (2x+3), the result will show only a slight difference.

Page 72
length of time from marriage to the first conception is assumed to be
equal to that from termination of the first pregnancy to the second
conception, y in this case will be equal to (2x + 3) months. The
equation derived for the adjustment of pregnancy losses for Java-Bali
women is then: (.93 x + .07 (2x +3)) is equal to the first birth
interval for women in Java-Bali minus nine months, where x is the
length of time from marriage to the first conception (mean delay of
first conception). The result of this calculation are shown in Table
4.5a (second and third row) and are represented in figure 4.2. From
figure 4.2 it is evident that the estimated mean delay of first
conception of women in Java-Bali aged 40+ shows a consistent pattern
by age at marriage with the Taiwan data but a higher level of mean
delay of first conception. In trying to interpret this long mean
delay of first conception for women in Java-Bali aged 40+ two possible
explanations will be discussed. First, the Java-Bali women may be
generally less fecund as compared to the Taiwanese women. It is
difficult however, to prove this point. Frisch (1979) has suggested
that poor nutrition might be the cause of low fecundity. On the other
hand, Bongaarts (1979) has warned that the impact of nutrition on
fertility is apparent only under conditions of severe famine. Women
in Java-Bali aged 40-49 years at the time of survey are those who were
born between 1927 and 1936 most of whom would have married in the
1940s or soon afterwards. Considering that in the 1940s, the
Indonesian were struggling for their Independence from the Dutch and
Japanese colonialism, it is likely that at that time the poor
nutrition was prevalent among the people of Java-Bali. Further
examination of the first pregnancy interval for younger women, that is
for those who married 5-14 years before the survey (Table 4.5 and
Page 73
Figure 4.2) shows that first pregnancy interval for these women is
much lower than for the women aged 40 years and over at the time of
the survey. This findings give some credence to the view that
fecundity in Java-Bali has been influenced by the level of nutrition.
Women who married 5-14 years before the survey, are those from
marriage cohort 1962-1971. Although in the early 1960s, the
Indonesian economic situation was very bad, the later 1960s and the
early 1970s are considered as a time of rising prosperity in Indonesia
and therefore these marriage cohorts of women may have had better
nutrition than those marrying in the 1940s and early 1950s. These
suggestion, however, still need to be proven, especially using data on
direct relationship between food intake and fecundability,which
unfortunately such studies are rarely done in Indonesia.
The second possible explanation of long intervals can be traced
through the behavoiural factors of Java-Bali women following first
marriage. Earlier studies have found that the wedding ceremony is
sometimes not followed by immediate consummation of first marriage.
This is found especially among women who married very young and where
the marriage was arranged by parents (Gille and Pardoko, 1966;
Singarimbun and Manning, 1976; Hull, 1976). In their studies of two
villages in East Java , Gille and Pardoko found that 88 percent of
women married before age 13 did not consummate their first marriage
until they were 15, while two thirds of the women married at ages
13-14 delayed the consummation of their marriage. On the other hand,
most women who married at ages 15-16 consummated their first marriage
soon after the wedding ceremony. Gille and Pardoko have also noted
that the longest first birth interval prevails among women married at
very young ages and have associated this with the delay of

Page 74
consummation. Hull (1976: 34-35) in her study in Maguwoharjo, found that 24 percent of first marriages had a delay in consummation or were never consummated. Meanwhile, Singarimbun and Manning (1976: 20,31)
found that 40 percent of first marriages had a delay in consummation
up to 2 years while 18.3 percent of women had never consummated their first marriage. These writers furthermore noted that the women who
had a delayed consummation were those who were old (age 45 years and over) and had married very young.
Considering the prevalence of delayed consummation of first marriage found in these studies mentioned above, it is likely that the
very long first pregnancy interval of women age 40+ and married before or at the age of 15 years can be partially attributed to delayed consummation of first mariage. The long first birth interval for women married after aged 17 years however, is not likely to be explained by the prevalence of delayed consummation. In addition, practice of contraception is unlikely to have prevailed at that time, especially prior to the first birth. To summarize this discussion, it is likely that both of the two possible factors mentioned above have made some contribution to the long first pregnancy intervals of women aged 40 years and over.
4.5. AGE AT FIRST BIRTH AND THE TIMING OF SUBSEQUENT BIRTHS.
As a further step in the examination of the impact of age at
marriage on fertility, this section will deal with age at first birth. Age at marriage when combined with the length of the first birth
interval determines the age at first birth. In a population where premarital birth is rare , age at marriage tends to set the lower
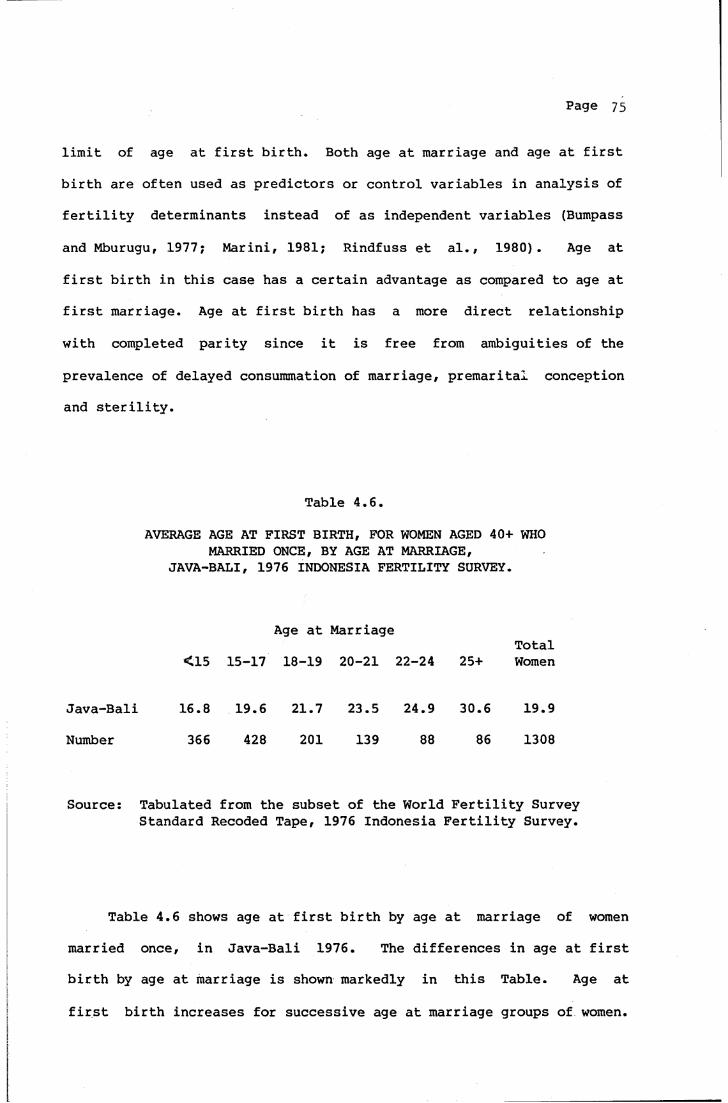
Page 75
limit of age at first birth. Both age at marriage and age at first
birth are often used as predictors or control variables in analysis of
fertility determinants instead of as independent variables (Bumpass
and Mburugu, 1977; Marini, 1981; Rindfuss et al., 1980). Age at
first birth in this case has a certain advantage as compared to age at
first marriage. Age at first birth has a more direct relationship
with completed parity since it is free from ambiguities of the
prevalence of delayed consummation of marriage, premarital*. conception
and sterility.
Table 4.6.
AVERAGE AGE AT FIRST BIRTH, FOR WOMEN AGED 40+ WHO MARRIED ONCE, BY AGE AT MARRIAGE,
JAVA-BALI, 1976 INDONESIA FERTILITY SURVEY.
<15
Java-Bali 16.8
Number 366
Age at Marriage
15-17 18-19 20-21
19.6
428
21.7
20123.5
139
Total22-24 25+ Women
24.9 30.6 19.9
88 86 1308
Source: Tabulated from the subset of the World Fertility SurveyStandard Recoded Tape, 1976 Indonesia Fertility Survey.
Table 4.6 shows age at first birth by age at marriage of women
married once, in Java-Bali 1976. The differences in age at first
birth by age at marriage is shown markedly in this Table. Age at
first birth increases for successive age at marriage groups of women.
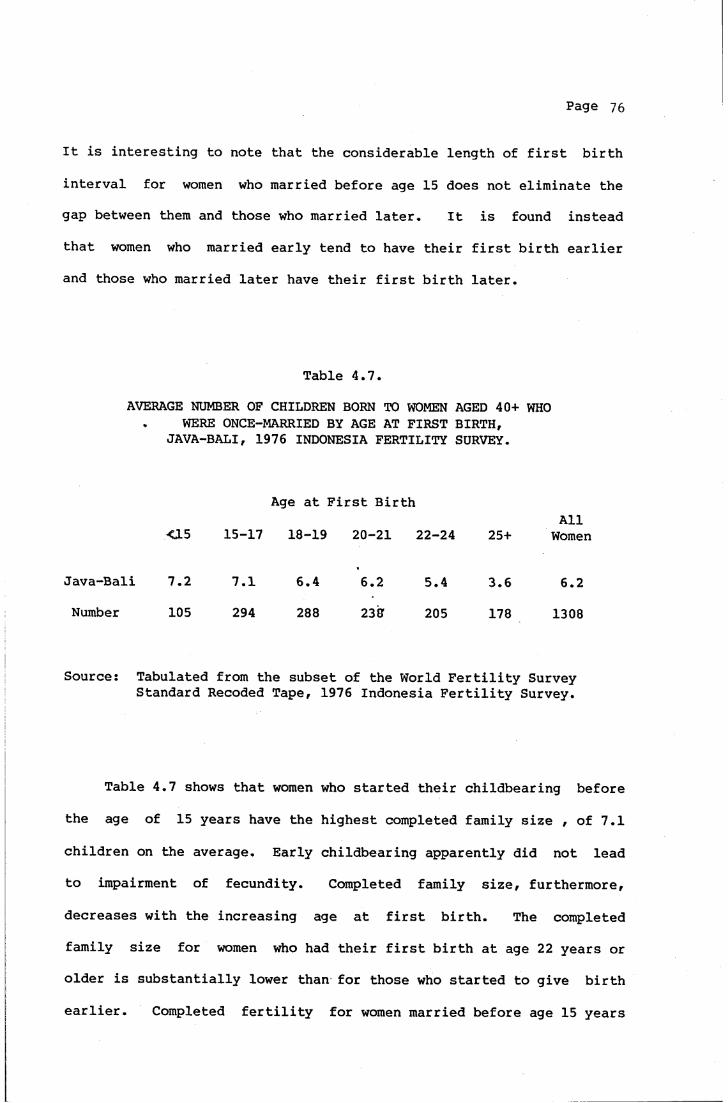
Page 76
It is interesting to note that the considerable length of first birth
interval for women who married before age 15 does not eliminate the gap between them and those who married later. It is found instead that women who married early tend to have their first birth earlier and those who married later have their first birth later.
Table 4.7.AVERAGE NUMBER OF CHILDREN BORN TO WOMEN AGED 40+ WHO
. WERE ONCE-MARRIED BY AGE AT FIRST BIRTH, JAVA-BALI, 1976 INDONESIA FERTILITY SURVEY.
Age at First BirthAll
<15 15-17 18-19 20-21 22-24 25+ Women
Java-Bali 7.2 7.1 6.4 6.2 5.4 3.6 6.2Number 105 294 288 23S 205 178 1308
Source: Tabulated from the subset of the World Fertility SurveyStandard Recoded Tape, 1976 Indonesia Fertility Survey.
Table 4.7 shows that women who started their childbearing before the age of 15 years have the highest completed family size , of 7.1
children on the average. Early childbearing apparently did not lead to impairment of fecundity. Completed family size, furthermore,
decreases with the increasing age at first birth. The completed family size for women who had their first birth at age 22 years or older is substantially lower than for those who started to give birth
earlier. Completed fertility for women married before age 15 years
Page 77
(the youngest age at marriage group) is double that of those whose
first birth occured at age 25 years or older (oldest age at marriage
group). This finding is conssistent with that of Bumpass and Mburugu(1977) who stated that the age at first birth has a stronger relation
with fertility than age at marriage. Bumpass, Rindfuss and Janosik(1978) in their study of age at first birth and the pace of subsequent fertility have found that married women who had their first birth before their 20th birthday, have their second, third and fourth births sooner than their counterparts who have their first birth after the age of 20 years. The timing of first birth, thus, according to them, has a strong influence on the rapidity of childbearing.
The length of the first, second, third and fourth birth intervals calculated for women in Java-Bali in 1976 are shown in Table 4.8. There is no difference between the later intervals for women married before age 15 and those married at ages 15-17 years. This finding is likely to support the earlier discussion that the fairly long first birth interval for women married before age 15 years can be attributed
to early subfecundity and the prevalence of delayed consummation of first marriage. Table 4.8 also shows that the length of birth intervals decreases wth increasing birth order for all age at marriage groups. The rapidity of the timing of subsequent births, however, is
not equal for each age at marriage group. Women who married after age 20 years have a shorter interval from the time of their first marriage
to the fourth birth. Women who married at ages 20-21, 22-24 and 25+
reached their fourth birth within 9.8, 9.1 and 8.8 years repectively. Women who married younger need more years (more than 11 years) to achieve their fourth birth. This difference is slightly less when the timing is measured from the first to the fourth birth. Women who
Page 78
marry later therefore, achieve their fourth birth within a shorter duration of marriage (Figure 4.3). This situation corresponds with Henry's hypothesis that women who marry later tend to make up for the
time lost due to marrying late. While Henry proved his hypothesis
Page 79
Table 4.8.FIRST, SECOND, THIRD AND FOURTH BIRTH INTERVALS (IN MONTHS)
FOR WOMEN AGED 40+, ONCE-MARRIED BY AGE AT MARRIAGE, JAVA-BALI, 1976 INDONESIA FERTILITY SURVEY.
BirthAge at Marriage
Intervals <15 15-17 18-19 20-21 22-24 25+ Total N
FirstSecondThirdFourth
42.537.034.832.9
34.736.032.532.3
32.436.331.029.0
25.635.6 30.9 30.3
22.830.7 29.925.7
24.831.026.223.4
25.535.932.731.4
1177122411891080
From Marriage to 4th Birth
in months in years
147.212.3
135.511.3
128.711.3
122.49.8
109.19.1
105.48.8
125.510.5
From First Birth to Fourth Birth
in months in years
104.58.7
100.88.4
95.68.0
91.97.7
86.37.2
80.66.7
100.08.3
Notes : First birth interval is the length of time between marriageand first birth, computed for women who at least had one child (see Appendix V).Second birth interval is the length of time between first birth and second birth, computed for women who had at least two children.Third birth interval is the length of time between second and third births, computed for women who had at least three children.Fourth birth interval is the length of time between third and fourth birth, computed for women who had at least four children.
Source: Tabulated from the subset of the World Fertility SurveyStandard Recoded Tape, 1976 Indonesia Fertility Survey.
using data on age specific marital fertility rates (Henry, 1976: 91-95), findings from this survey on children ever born by duration of
marriage also show a similar tendency. Table 4.9 shows that in the

DURA
TION
OF
MARR
IAGE
(in
mont
hs)
Page 80
Figure 4.3.
THE LENGTH OF TIME BETWEEN FIRST MARRIAGE TO FIRST, SECOND, THIRD AND FOURTH BIRTH, FOR WOMEN AGED 40+ BY AGE AT MARRIAGE,
JAVA-BALI, 1976 INDONESIA FERTILITY SURVEY.
140 -
120 - .._J3-4th Birth
100 -
0-3rd Birth
0-2nd Birth
0-lst Birth
15-17 18-19 20-21 22-24AGE AT MARRIAGE (in years)
Source: Table 4.8.
earlier years of marriage (0-9), the fertility tends to increase with
increasing age at marriage. This is shown markedly by women who
married at age 20-21 years. While such a tendency was considered by
Henry to indicate a situation of controlled fertility, the findings
from this survey, however, need to be considered further. An
inconsistency is shown when we follow the duration of marriage up to
15-19 years. The figures from this Table show that at the duration of
marriage of 15-19 years, the differences of fertility by age at
marriage disappear, and the mean number of children ever born is about
the same among the age at marriage groups. It is likely then that the
early rapid childbearing of women married at age 20 years and over is
Page 81
Table 4.9.MEAN NUMBER OF CHILDREN EVER BORN FOR ONCE-MARRIED WOMEN
BY AGE AT MARRIAGE AND DURATION OF MARRIAGE, JAVA-BALI, 1976 INDONESIA FERTILITY SURVEY.
Age at MarriageDuration ofMarriage <15 15-17 18-19
0-4 .5 .8 .7
5-9 2.0 2.3 2.3
10-14 3.5 3.5 3.715-19 4.6 5.1 4.520-24 5.7 5.9 6.125-29 6.1 6.2 5.630-34 6.4 5.7 5.9
35+ 6.9
Number
All20-21 22-24 25+ Women N
1.0 .8 .5 .8 1650
2.6 2.3 1.8 2.2 1263
3.8 3.8 3.0 3.6 10454.5 4.5 3.7 4.7 898
4.9 5.6 3.7 5.7 8135.8 6.8 6.1 607
6.1 318
6.9 57
6651
Source: Tabulated from the subset of the World Fertility SurveyStandard Recoded Tape, 1976 Indonesia Fertility Survey.
more due to their higher level of fecundity as compared to women
married younger, than to fertility control. The women who married
earlier then catch up when they themselves reach the ages of peak fecundity by which time later marriers are experiencing reduced
fecundity at older ages. The net result is similar fertility after15-19 years of marriage
Page 82
4.6. AGE AT COMPLETION OF CHILDBEARING.
Information on age at last birth, that is the age at which women bear their last child, is often used as a variable indicating the timing of completion of the childbearing period. It can also be used in detecting whether fertility of a population is produced under
natural or controlled fertility behaviour. With natural fertility and the absence of birth control practice, it is hypothesized that the age
at which women complete their childbearing period will not differ significantly between women who marry early and those who marry later because women continue to reproduce until fecundity drops to zero. In
turn age at menopause is presumed to be independent of age at marriage and childbearing experience. In a controlled fertility population, the age at completion of childbearing will depend on the target family
size. Women who initiate childbearing early will cease their childbearing earlier chan those who started later. This is due to the
situation that since completed parity is not very different among women who marry later, women who marry early will have more time to achieve their target family size before reaching the end of the reproductive period (Day, 1965; Young, 1977; Knodel, 1978;
Trussell, Menken and Coale, 1979; Walle and Knodel, 1980). In this section, age at last birth of women from Java-Bali will be examined to see its relation with age at marriage of the women in order to see whether the age at completion of childbearing of these women is
influenced by natural or controlled fertility behaviour.
Information on age at completion of childbearing, however, can only be estimated, since in the 1976 Indonesian Fertility Survey the
sample covered women only up to age 49 years at the time of the
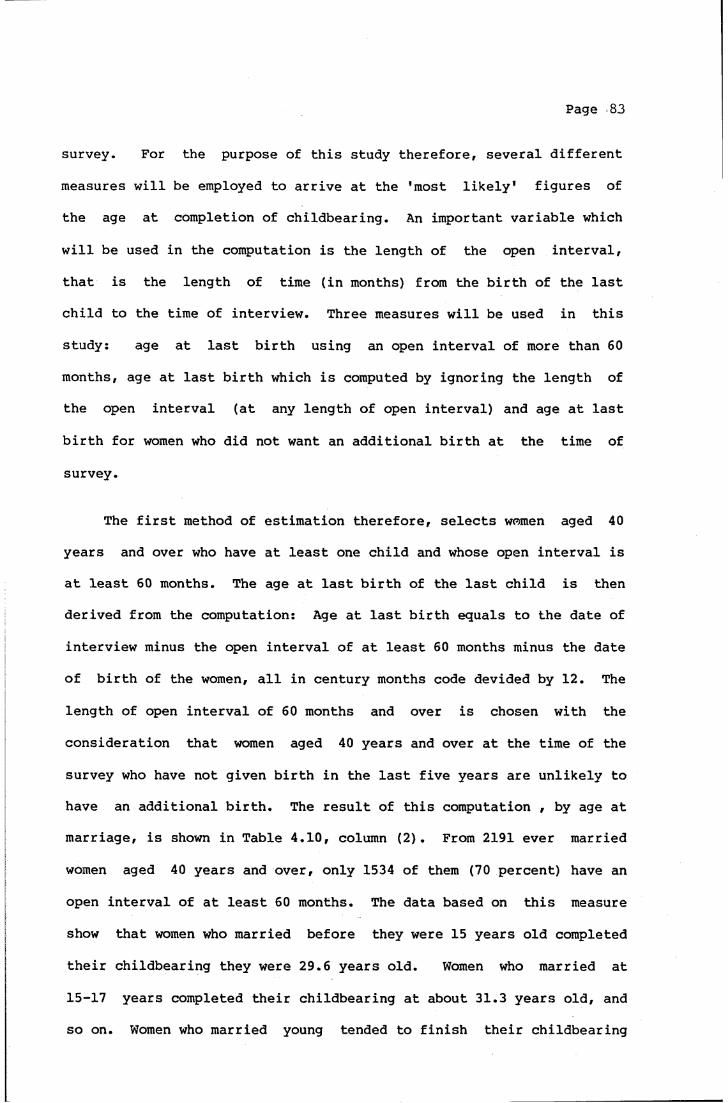
Page 83
survey. For the purpose of this study therefore, several different measures will be employed to arrive at the 'most likely' figures of the age at completion of childbearing. An important variable which
will be used in the computation is the length of the open interval, that is the length of time (in months) from the birth of the last child to the time of interview. Three measures will be used in this study: age at last birth using an open interval of more than 60 months, age at last birth which is computed by ignoring the length of the open interval (at any length of open interval) and age at last
birth for women who did not want an additional birth at the time of
survey.
The first method of estimation therefore, selects women aged 40 years and over who have at least one child and whose open interval is at least 60 months. The age at last birth of the last child is then derived from the computation: Age at last birth equals to the date of
interview minus the open interval of at least 60 months minus the date of birth of the women, all in century months code devided by 12. The
length of open interval of 60 months and over is chosen with the consideration that women aged 40 years and over at the time of the
survey who have not given birth in the last five years are unlikely to have an additional birth. The result of this computation , by age at marriage, is shown in Table 4.10, column (2). From 2191 ever married
women aged 40 years and over, only 1534 of them (70 percent) have an
open interval of at least 60 months. The data based on this measure show that women who married before they were 15 years old completed
their childbearing they were 29.6 years old. Women who married at 15-17 years completed their childbearing at about 31.3 years old, and so on. Women who married young tended to finish their childbearing
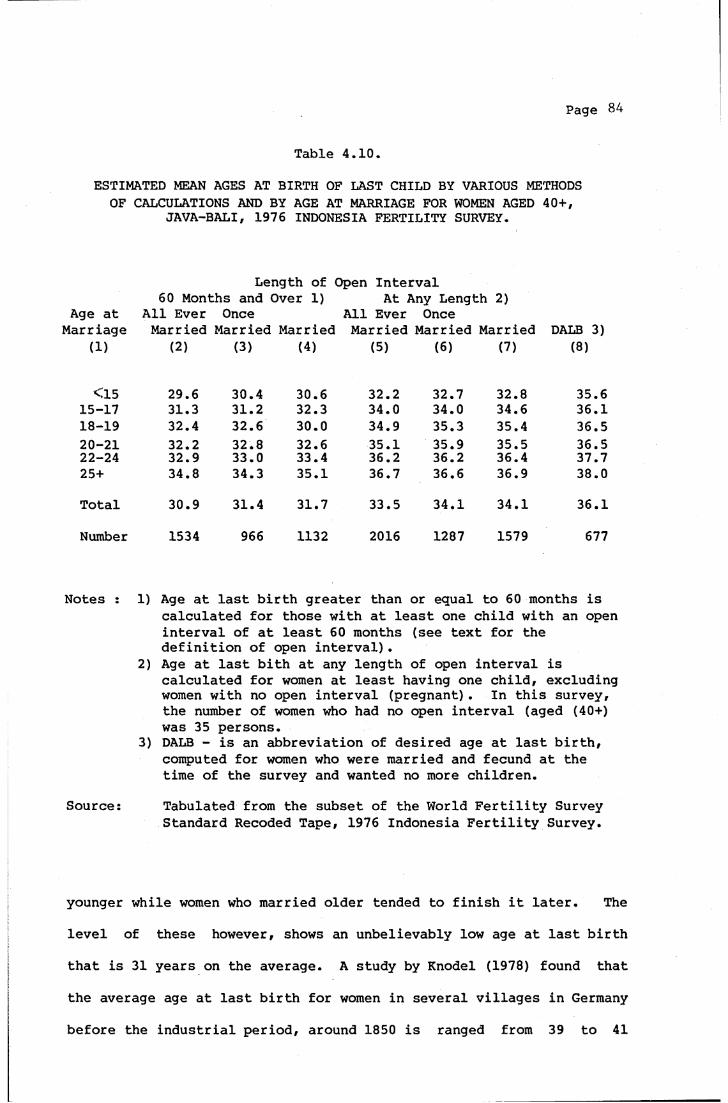
Page 84
Table 4.10.ESTIMATED MEAN AGES AT BIRTH OF LAST CHILD BY VARIOUS METHODS OF CALCULATIONS AND BY AGE AT MARRIAGE FOR WOMEN AGED 40 + ,
JAVA-BALI, 1976 INDONESIA FERTILITY SURVEY.
Length of Open Interval60 Months and 1Over 1) At Any Length 2)
Age at All Ever Once All Ever OnceMarriage Married Married Married Married Married Married DALB 3)
(1) (2) (3) (4) (5) (6) (7) (8)
<15 29.6 30.4 30.6 32.2 32.7 32.8 35.615-17 31.3 31.2 32.3 34.0 34.0 34.6 36.118-19 32.4 32.6 30.0 34.9 35.3 35.4 36.520-21 32.2 32.8 32.6 35.1 35.9 35.5 36.522-24 32.9 33.0 33.4 36.2 36.2 36.4 37.725+ 34.8 34.3 35.1 36.7 36.6 36.9 38.0Total 30.9 31.4 31.7 33.5 34.1 34.1 36.1Number 1534 966 1132 2016 1287 1579 677
Notes : 1) Age at last birth greater than or equal to 60 months iscalculated for those with at least one child with an open interval of at least 60 months (see text for the definition of open interval).
2) Age at last bith at any length of open interval is calculated for women at least having one child, excluding women with no open interval (pregnant). In this survey, the number of women who had no open interval (aged (40+) was 35 persons.
3) DALB - is an abbreviation of desired age at last birth, computed for women who were married and fecund at the time of the survey and wanted no more children.
Source: Tabulated from the subset of the World Fertility Survey Standard Recoded Tape, 1976 Indonesia Fertility Survey.
younger while women who married older tended to finish it later. The level of these however, shows an unbelievably low age at last birth that is 31 years on the average. A study by Knodel (1978) found that
the average age at last birth for women in several villages in Germany before the industrial period, around 1850 is ranged from 39 to 41

Page 85
years old. He considered that the level of these ages at last birth
represented a natural fertility situation. Knodel's finding,furthermore, is fairly consistent with the results of a simulation model derived to estimate the age at last birth under condition of natural fertility, which ranges from 41 to 43 years (Trussell, 1979). On the other hand, Day (1965), in his study of Australian women using
1954 census data, found that half of the respondents had completed their childbearing by the age of 31.1 years using an open interval of 5 years, or 34.4 years using an open interval of 9 years.Furthermore, the age by which 75 percent of women had completed their childbearing was found to be 37 years old. In trying to look for an explanation of this substantially low age at last birth found using an
open interval of at least 60 months, one should remember that these
findings were derived from all ever married women including those who, at the time of the survey, were divorced, separated or widowed. From the composition of respondents by marital status, it is found that as much as 21.3 percent of women aged 40 and over were not in the married state at the time of the survey. Since extramarital fertility is very rare in Indonesia, the high percentage of women not married in the survey may contribute to the low age at last birth. Further examination, therefore, was made for women once married and for women
who were currently married. The results, however, show similar
patterns and levels (Table 4.10, columns (3) and (4)). These results indicate that there is only a very slight influence of marital status on the age at last birth using this method. Therefore, the use of an open interval of at least 60 months to derive the age a last birth is suspected to have deficiencies. An examination of the distribution of
the open interval of women aged 40 years and over shows that 23.5
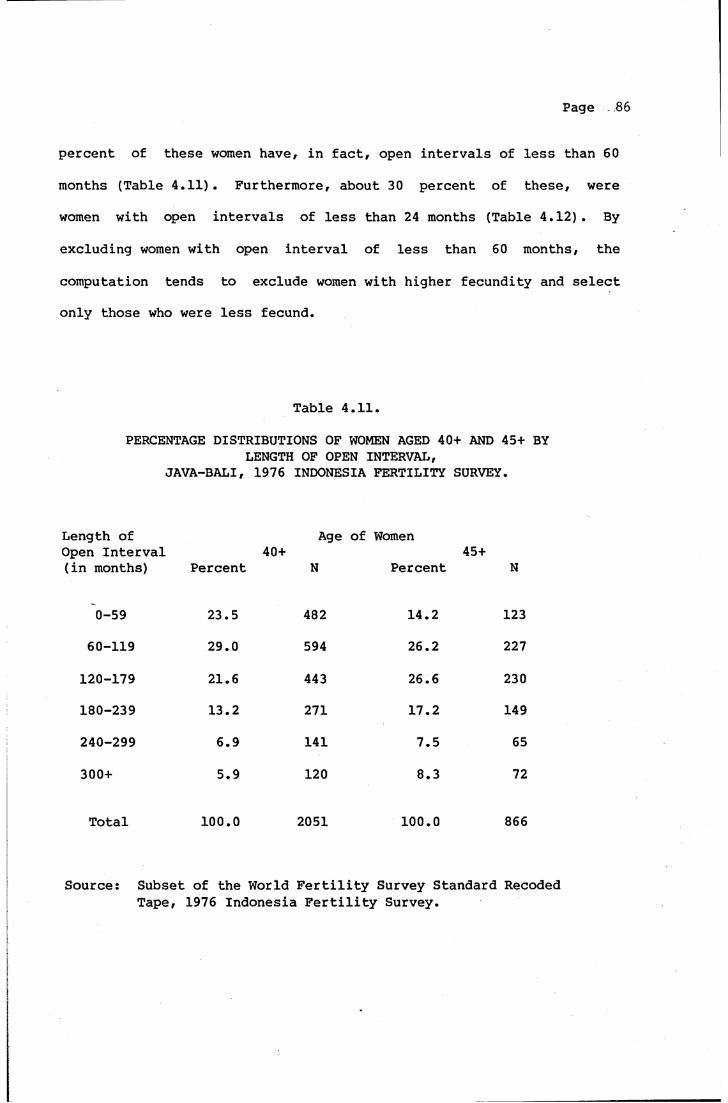
Page 86
percent of these women have, in fact, open intervals of less than 60
months (Table 4.11). Furthermore, about 30 percent of these, were women with open intervals of less than 24 months (Table 4.12). By
excluding women with open interval of less than 60 months, the
computation tends to exclude women with higher fecundity and select only those who were less fecund.
Table 4.11.PERCENTAGE DISTRIBUTIONS OF WOMEN AGED 40+ AND 45+ BY
LENGTH OF OPEN INTERVAL,JAVA-BALI, 1976 INDONESIA FERTILITY SURVEY.
Length of Open Interval (in months) Percent
40+Age of
NWomen
Percent45+
N
0-59 23.5 482 14.2 12360-119 29.0 594 26.2 227
120-179 21.6 443 26.6 230180-239 13.2 271 17.2 149240-299 6.9 141 7.5 65
300+ 5.9 120 8.3 72
Total 100.0 2051 100.0 866
Source: Subset of the World Fertility Survey Standard RecodedTape, 1976 Indonesia Fertility Survey.
Page 87
Table 4.12.
PERCENTAGE DISTRIBUTION OF WOMEN AGED 40+ WHOSE OPEN INTERVAL WAS LESS THAN 60 MONTHS,
JAVA-BALI, 1976 INDONESIA FERTILITY SURVEY.
Length of Open Interval Less than 60 Months
0-11
12-23
24-35
36-47
48-59
Total
Percentage Number
13.2 63
17.6 89
20.5 98
22.2 106
26.4 126
100.0 482
Source: Subset of the World Fertility Survey Standard RecodedTape, 1976 Indonesia Fertility Survey.
In the second method of estimation of age at last birth,
therefore, these women who have open intervals of less than 60 months
will be included. This will be done by selecting women age 40 years
and over, with at least one child, at any length of open interval,
excluding those who have no open interval (pregnant). The results of
this computation are shown in Table 4.10, columns (5), (6) and (7).
These figures show a similar pattern of age at last birth by age at
marriage as compared to the result using an open interval of at least
60 months. The difference in the ages at last birth by marital status
is also very slight. The level of the ages at last birth however,
show a higher level than those found in the earlier computation, the
Page 88
age at last birth ranging from 32 years for women married before age
15 years to 37 years for those married at 25 years or older. The
average age at last birth using the second method of computation is
found to be 34 years old or about 2 years older than using the first
method.
The third method of estimation, as has been stated earlier, will
be for women who did not want any more children at the time of survey
at any length of open interval. The result of this computation will
be called the desired age at last birth, shown in Table 4.10, column
(8). From this Table, it is found that among 2191 ever married women
aged 40 years and over, only 677 of them were selected in the
computation of the desired age at last birth. This small number of
cases is due to the process of selection of respondents that only
those who were married at the time of the survey and stated that
according to their knowledge they were fecund, were asked about
wanting an additional birth or not.
The figures for the desired age at last birth are found to be
higher (by about 2 years) as compared to those based on the second
method. In this case, women who married before the age of 15 years
have an age at last birth of 35.6 years rising to 38 years for women
who married at 25 years or older. The average age at last birth in
this case is 36 years. The differences of the desired age at last
birth among age at marriage groups is found to be slight.
Comparing the result of these three methods of estimation of age
at completion of childbearing, we might suggest that the observed
differences in age at last birth between these methods are due to the
selection bias of each method. The mean age at last birth using an

Page 89
open interval of least 60 months may represent the least fecund women
in the sample so that their age at last birth is the lowest. The
second method includes the least fecund plus the more highly fecund
women so that their age at last birth is somewhat higher, while the
desired age at last birth may represent the most fecund women. When
answering the question of whether they were able to have another birth
or not in the survey, women who said yes (who thought that they were
fecund) were most likely to be those who had just given birth not long
before the survey or those who had large family size. Their age at
last birth therefore, is found to be the highest.
For analysis in this study, the author tends to favour the age at
last birth estimated for women at any length of open interval who were
married at the time of the survey (Table 4.10, column (7)) since it
represents the less and the higher fecund women. The second measure
also includes the largest number of cases (1579 women). However,
since in this study the analysis of the length of the childbearing
span will be examined, the use of the ages of last birth estimated for
women, once married, at any length of open interval (Table 4.10;
column (6)) is considered as more applicable. This is due to the
consideration that in computing the length of the childbearing span,
age at first birth is used. The age at first birth presented in the
earlier chapter has been computed for women married once only to
avoid the effect of

Page 90
Table 4.13.ESTIMATED AGES BY WHICH 25, 50, 70, 75, 80, 90, 95 AND
100 PERCENT OF THE WOMEN AGED 40+ GAVE BIRTH TO THEIR LAST CHILD, BY VARIOUS METHODS OF CALCULATION,
JAVA-BALI, 1976 INDONESIA FERTILITY SURVEY.
Length of Open Interval 60 Months and Over 1) At Any Length 2)
% MothersReachingSpecified All Ever Once
Currently All Ever Once
CurrentiyAge Married Married Married Married Married Married DALB
3)(1) (2) (3) (4) (5) (6) (7) (8)
25 27 28 29 30 31 31 3450 32 33 33 35 35 35 3770 35 35 36 38 38 38 3975 36 36 36 39 39 39 4080 36 36 37 40 40 40 4090 38 38 39 42 42 41 42
95 40 40 41 43 43 43 43
100 44 44 44 49 49 49 49
N 1534 966 1132 2016 1287 1579 668% from total women aged40+ (2191) 70.0 44.1 51.7 92.0 58.7 72.1
Notes: See Notes on Table 4.9. for explanations of oepn intervals ofgreater than or equal to 60 months, at any length and DALB.
marital disruption. In any case , comparison of the ages at last birth estimated for women married once and those who were married atthe time of the survey shows very similar results by age at marriage
Page 91
(Table 4.10, columns (6) and (7)). Comparison of the ages by which
different percentages of women have completed their childbearing adds
further support to this choice (Table 4.13). In columns (6) and (7)
in this Table , it is found that the first quartile, median and third
quartile and even the hundred percent levels show no differences in
the ages reached at the birth of the last child between once married
and currently married women.
The age at last birth (using the selected method above) is close
to findings from the survey by Singarimbun and Manning (1976: 37-39),
for women in Mojolama, who noted that most women have completed their
childbearing by the age of 35 years. The mean age at completion of
childbearing was 34 although 50 percent of women give birth beyond
this age, and 23 percent after they reached age 39. For women in
Java-Bali, the median estimated age at completion of childbearing was
also 35 years, while 75 percent had completed their childbearing at 39
years old (Table 4.13, column (6)).

CHAPTER 5
SUMMARY AND CONCLUSION.
Chapter 4 in this study, has been devoted to the exploration of
the impact of age at marriage on fertility, step by step using data on
subsequent fertility behaviour of women following first marriage. The
number of children ever born has been employed as the measure of
fertility. The fertility of women aged 40 years and over was used to
represent the completed family size and the analysis was restricted to
those who once married so as to avoid the effect of marital
dissruption on fertilty.
The summary findings in chapter 4 is presented in Table 5.1.
These findings can be stated in brief as follows: The first birth
intervals is fairly long for women in Java-Bali aged 40 years and over
at the time of the survey. The longest interval is applied to women
married before age 15 years. The analysis suggest that early
subfecundity, delay of consummation of marriage and foetal wastage are
likely to be the reason for this long first birth interval. The lower
first birth interval for those married after aged 20 years might be
the result of higher fecundity by age of women. The overall interval
is high when compared to data on the condition of natural fertility as
found by Jain (1969) for women in Taiwan in 1962. This may have been
the result of the poor nutrition levels in Java-Bali in the 1940s
during the Japanese occupation and the struggle for Independence. The
figures in column (3), show that women who married young tend to bear

SUM
MAR
Y F
IND
ING
S
OF
THE
CO
MPU
TATI
ON
O
F IN
DIC
ES
O
F TH
E IM
PA
CT
OF
AGE
AT
MAR
RIA
GE
ON
FE
RT
ILIT
Y
OF
WO
MEN
, AG
ED
40+
, O
NCE
MA
RR
IED
, JA
VA
-BA
LI,
19
76
.19
76
IND
ON
ES
IA
FE
RT
ILIT
Y
SUR
VEY
.
Page 93
ö0V Ö
T3 Vi I—I O •H PQXO Vi
0Ö >CÖ W0S
■'3’co
CTi c n T - cm o
L f \ i n LPv LT\ KN
oc—
HOc•HVi Ö 0 0 0 Ph
P CO TJ I—I•HXo
r-ooCM
-P <X3 CQ CD CÖ
-P i-Oc0 c - o o CTi CM CD Oe - p . • . . • • 00
•H cO CM LTC ITC »Dl CD o-P KCCQ CD
H HO <!
X-PV
•HFQ r - o CM c - o
o . • . • . . 00X - p 00 00 00 00 C - CO o-P
0X-P
O X-P - p
t o t o r - CM T - 00 oI—IcO>pCD
-PÖI—I
00o
A- p
•Hm
CD -P HO CQ
< u•HF̂h
X-PVi
•HFQ
00
CDCD
CTi
C"
CM CM CMOK'C
00oCO
CD •—IocO
in cd b
LT\ 0 v—
r—IrQ Tj CO Ö
E-I CO
0I-IrClcOEh
V LfC C— CO 00 00 c~--p 0 . . • . . . r -03 -P CM ■'3- CXI LD* CM 'M- ÖV Ö to CM CM CM T— e•H 1—1 0fL rHOÜ0
HO w ..-P CO r- ,— 0 0CO *H T- •<— CM CM CQ oV 1 1 1 1 0 V0 V lfc + o 0HO 0 T — ire 00 o CM Lf\ o< 53 V T - *«— CM CM CM Ö CO
CM tO *3- (6)
Ta
ble
4
.10
(7)
Ta
bu
late
d
fro
m
the
su
bse
t o
f W
orl
d
Fe
rtil
ity
S
urv
ey
Sta
nd
ard
R
ecod
ed
Tap
e,
197
6,
Ind
on
es
ia
Fe
rtil
ity
S
urv
ey
(8)
Ta
ble
4
.4

Page 94
their first child younger than their counterparts who married later. This situation is evidence of natural fertility. The first birth is not delayed deliberately as a result of fertility planning. Column (4) and (5) of the Table 5.1 show that the interval or the length of
time from marriage to the fourth or from the first to the fourth births is shorter for women who married older. This situation shows
that women who married older tend to have more rapid childbearing than
those who married younger. This evidence is consistent to Henry's hypothesis on the catching up effect of women who married older.
While Henry believed that such situation was produced under controlled
fertility, data from this study, show that at 15-19 years duration of marriage, the fertility is equal for those who marry later or younger. This suggest that the rapid childbearing for women who married older is due to their higher fecundity status in the earlier years of marriage.
Several approaches were attempted in the computation of age at last birth of women, since it is felt that each of the approaches suffers from selection bias (section 4.6). The measure chosen refers to once married women aged 40+ with no restriction on the length of
open interval. If this group of women do not bear additional child
after the survey then the estimated age at last birth and thus the estimated age at completion of childbearing is shown in column (6),
Table 5.1. These figures show that the younger the age at marriage, the earlier the age at completion of childbearing. The result might lead to the conclusion that this is achieved by controlled fertility.
However, this conclusion would conflict with the earlier analysis which shows no evidence of controlled fertility. Furthermore, a conclusion in support of natural fertility among older women in Java,
Page 95
is close to findings of Singarimbun and Manning (1976).
Having estimated age at first birth and the age at last birth,
the average length of childbearingspan can be estimated. In this
study the estimation of the childbearingspan for women is computed
individually and then tabulated by age at marriage. The length of the
childbearingspan for women in Java-Bali is shown in column (7) in
Table 5.1. These figures show that the women who married younger had
the longer childbearingspan. Those who married at the youngest age
have more than twice the childbearingspan of those who married at the
oldest age group. The situation is clearly indicative of the effect
of natural fertility, that those who married early have a longer
exposure to childbearing. Figure 5.1 shows a summary of the
achievement of the first, the fourth and the last birth according to
duration of marriage of women and the age at marriage as well. This
figure shows that although there is a tendency for women married later
have a shorter duration of marriage to reach the fourth birth, women
who married younger have a much longer childbearing period to achieve
their last birth. The women who married later reached the stage of
late subfecundity before they attained further births. As a
consequence, women who married younger have more exposure time to
produce 6.4 children on the average if they married before age 15
years and 5.9 children if they married at 15-17 years old. Women who
married after age 25 have only 3 children on the average (Table 5.1,
column (8)).
It must be concluded, therefore, that the differences of
completed parity by age at marriage found in the section 4.3,are
largely due to differences in the period of exposure to the risk of

Page 96
Figure 5.1.
THE LENGTH OF TIME THE FOURTH AND THE
1976
(IN YEARS) BETWEEN MARRIAGE TO THE FIRST, LAST BIRTH BY AGE AT MARRIAGE, JAVA-BALI, INDONESIA FERTILITY SURVEY.
Marriage toMarriage to
--- Marriage to
o Ö
18-19AGE AT MARRIAGE (in years)
22-2415-17 20-21
Last Birth 4th Birth 1st Birth
childbearing and thus are consistent with a natural fertility
situation.
As the final part of the analysis, Tables 5.2-5.5 can be used to assess whether these conclusions based on the total population also apply to sub-groups of the population. If subgroups show patterns
consistent with natural fertility then this is a further confirmation of the conclusions. Four sub-groups are examined: urban women, rural women, women with less than four years of schooling and women with four or more years of schooling. Table 5.2 and 5.3 show that the pattern by age at marriage of the first birth intervals, age at first birth, intervals to the fourth birth, estimated age at completion of
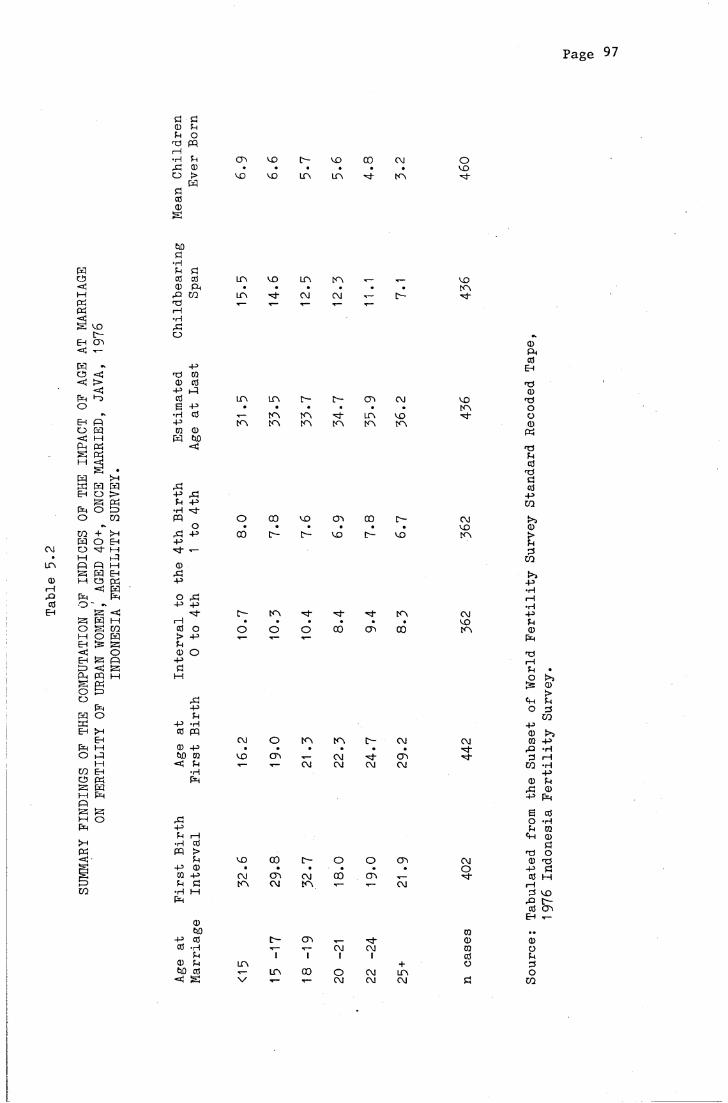
INDONESIA
FERTILITY
SURVEY.
P a g e 9 7
öO)q
TO I--i•H
o000S
0qopqqCD>
cd
VO
VO
VO
tr-
LP
U3
LP
00
-3-PJ
CP
Ovo'Sf
C3 << I—I « P=!SEH<qCD<
voP-CD
gM
gOOWEH
P*Ho
COCDgMPiSI—Ifq
PCO
«PP̂Ho
PHEhI—I P MEhpqPfqPo
HO0•HqcOO
P CO TO I—I •H PO
•PCOco
•p P
P-pq•H
0) o-p0
M
P- Pq
LOLP
VO
"3-LP
PJ
CP
PJ c—VOCP■q-
0)PCÖ
EH
cq p c0 LTv LTV p - O CD PJ VO T3o £ -p • • • • • • CP o
•> •H cO T—■ CP CP LTV VO Th oEh P -P KN CP CP K\ CP CP CDO P CO CD pq-=$ M W noP pq < pq
cOt30cO
-pco
m o 00 VO 00 p - C\J »>3o • . • • • . VO CD
P -p 00 c— P- VO [>- VO CP >-p q■q- ■■— P3
COCDP >3-P -p
•HO P 1—1-P -P •H
P - CP t J- -vj" CP PJ -Pi—1 . • • • • . VO qcO O o o O 00 CT» 00 CP CD> -Pf . ■>— •<— P*H
T3 I—IqOP«Ho
p3Cl)>Phqi
CO-P -H -pcO pq CD >3
C\J o CP CP P- p j P J CO -PCD -P • . . . * . rQ *HHO CO VO CD P J CD qs < J•< q T-- .— P 1 PJ P J P J CO -H•H -P
fq 0 qÄ 0-p fq£ 0
P O *H-p q roq i—i Cp 0
•H cO 0pq > TO oq VO 00 p- o o CD P J 0 TO-P CD • . • . . . o -P 0CO -P C\J CD CM 00 CD T— •q- 0 Mq 0 CP P J CP T-- T— P J r-H
•H 1—1 0 VOfq q p -0 CD
E h t-CDHD CO ..
-P cO P- CD ■q- CD 0CO *H T-- T-- P 1 cvj CO Oq | | 1 i CÖ qcd q LP + o qiHD cO T— LP 00 o P J LP o
<q g \ / •<— T— P J p j P J 0 co

INDO
NESI
A FE
RTIL
ITY
SURV
EY.
Page 98
<MpdPd<cg
EH<
wC5
IpoEho<OhgI—I
VOtp-o p
I—IX
pq>*” D
wH
Ö(DPi
X
•HXO
ÖCdCD
g
£PiopqP<CD>
w
•X
VO
00
X
O
VO
oLTV
■X
X
OP
Cd
O
OP
W)Ö
•HPicO cO O LPv o H* CM XCD (X . • • • • • x
X CO vo H " CM I— vo 00X •*— T-- X— T--1—1•Hxo
CDP iCd
-p EHX 03CD CO X
-p i-q CDCO 00 •*— op CM KV 00 X6 -p • • • • . . LTV O
•H cO CM H " X \ MD VO vo 00 O-p KP K>v KP KN KP KP CD03 CD Pd
W tuo■< X
Picd
XX 3dH X pPi P CO
•H X -pq 00 LPv CM LPv LTV OP 00 £*5o . • . • . . T— CDX -P 00 00 00 CO 00 vo tp- >-p Pi'd- * PS
COCDX {>>-p P
•HO X rH-p p •H
•X VO o- CM H“ in vo Pi—1 . • • • . • 00 PiCO O CM r— T— ^— o OP T— CD> p T— *— T— ,— tr- PhPiCD O X
P pHÖ Pi •1—1 O
^3 CD>
X Cm Pip O 2Pi CO
P -H PcO pq CD !>j
00 o- op 00 OP KP CO PCD P . • • • • . VO X *Ht*0 03 VO cn ,— K\ T— vo pi iH< Pi T— T— CM CM CM KP 00 CO -H
•HP^h
XPPi•H
CDXP
BoPi
Cm
-PPiCD
P=H
CO•H03CD
pq > X oPi KP CM CO LTV KP VO CD X
p CD • • • • * . X P ÖCO P X CO LTV IX CM tT- cd MPi Ö 'd* KP KP KP CM KP c - rH
•H 1—1 pS voFh
CD
x p - cd op
Eh t-
tlO co . .P cd tP~ OP ,— ■d- CD CDcd •H T-- t— CM CM CO O
Pi 1 1 I 1 cd PiCD P i X + o P3W) cd T— X 00 O CM X O
< g \ / 1— T - CM CM CM Ö CO

SUMM
ARY
FIND
INGS
OF
THE
CO
MPUT
ATIO
N OF
IND
ICES
OF
THE
IM
PACT
OF
AGE
AT M
ARRI
AGE
ON FE
RTIL
ITY
OF
WOME
N, WI
TH L
ESS
THAN
3 Y
EARS
OF
SCH
OOLI
NG,
AGED
40+
, ON
CE M
ARRI
ED,
JAVA
-BAL
I, 19
76,
INDO
NESI
A FE
RTIL
ITY
SURV
EY.
Page 99
Td pq•Hxdo0cdCDS
PCD>Ed M3
031X3
031X3
O1X3 1X3
D—CM
00
W)0•Hpcd0x> coTd I—I •H Xd O
-PCOcd-p pq
coEd0tu3<U
Xd-PP
•H I—I E<
0 3
1X3
1X3
■'d'00K3
K3C3J
K33 0
30f-O
0e»o CO
-p 0 C - 0 3 ,— Th 00 •H T-- ■r— Ovl C3J CO
P 1 1 | 1 00 P 1X3 + Üw 0 T— 1X3 00 o CM tX3
< s 3 / 1— T— CM C\J CM 0
(3PhcdEHTdcu
0 CM LT3 C<"3 3 0 K3 00 3 0 TdE -P • • • . . . C - o
•H 0 CM K3 1X3 1X3 30 1X3 o o-P fc-3 K3 K3 K3 K3 K3 0
TdPcdTd
Xd >10-P xd -pP -p CO•HPQ c X— T— T— 03 K3o • • • • • • 00 0xd -p 00 CD CD CD tr- 30 00 >-p pr— 0CO0xd-p -P•Ho xd 1— 1-p -p •HC— c— —̂ C\J 30 -pr—1 • • • • • . p0 o C3J ■*— —̂ CD 03 00 0> -p T— —̂ *— T- 00 EhP0 o TdX 5 r*H0 Pt—1 o k'J0>P0co-P •H -P0 PQ 0 >5
00 o 00 03 00 CO -P0 -P . • . • « • 03 Xd -H
CO 30 cn CM K3 o o 0 rH< p T- T— CM CM CM K3 CO -H
•H -PfLi 0 P
xd 0-P Eh
E 0xd O -H-p P COp 1—1 pH 0•H 0 0PQ > Td O
p CO 1X3 K3 O -̂ CM 0 Td-P 0 • • . . • • 00 -P 0CO -P K3 v£> C'- 1X3 LT3 03 0 1-1p 0 K3 K3 CM to r—1
oop0oCO
3003
SUMMARY
FINDINGS O
F THE
COMPUTATION
OF I
NDICES O
F THE
IMPACT O
F AGE
AT M
ARRIAGE
ON F
ERTILITY O
F WOMEN, WITH
4 YEARS
OF S
CHOOLING O
R MORE,
AGED 4
0+,
ONCE M
ARRIED,
JAVA
-BAL
I, 1976,
INDONESIA
FERTILITY
SURVEY.
Page 100
7 3 PQI—I•HddoPd03CDs
uCD>PO
c-VO VO
CD
LfM
c—LfM
td- LfM
KM
CMCMC\J
tiDsd
•Hu03CDr£> CD 73 I—I
•H
O
dd- pu•H
pq
ä- p■̂3*CDdd
- p
o- p
i—I03>uCD
-PPdM
dd- p3̂-o
- p
Xi- p
o- p
dd- pp-.
•H
dd-pp-i
•H
o
vovo■'3-
CTM
CvJlXV CM
Oom
Otd-
■*3"om
v o
00VO
C—KM
v o
00
KMc-d LTV
OM
00
COc-td-
KMCM
KMCM
-P -H03 pq
O VO td- KM VO CM [CD -P • • . . • . ,_«30 CO (Tv O CM o CM
«d Ph T— CM CM CM KM
CDPdo3
- p EH73 COCD 03 73
-P »-q CD03 o OM OM VO v o 00 736 - p . . . • . . T— o
•H 03 KM KM CM KM VO C\J o-P KM KM r<M KN KM KM CDcq CD Pd
Pd «30< 73qi
03t3PdOi
-pCD
CD>Ph33
CD
-P •H I—I •H -P Ph CD
P>4
Td I—IPho<po- pCDCQ
rC lP3 CD
CDrC-P
SoU
<+h
pq > 73Ph OM 00 LTM T— VO c - LfM CD
-p CD . • . . . . OM -PCQ -P td- 00 ^3- C - 'd ' 00 •<— 03u pd ■Th KM CM T— t— r— i—t
•H t—1 33P̂ i X>
ctiEh
CDtüO CO . .
-P 03 td~ OM •'d- CD CD03 •H T-- .— CM CM CQ O
Ph 1 1 1 1 03 PhCD Ph LfM + O 33
03 T— LfM Q0 o CM LTM O< S V T— 1— CM CM CM Pd CD
1976 I
ndonesia F
ertility S
urvey.

Page 101
childbearing and the length of childbearingspan are almost the same as those for all women in Java-Bali (Table 5.1) . The level of the first birth interval for urban women is slightly lower than that for rural
women but the childbearingspan differs only slightly. An inverse
relation between mean number of children ever born and age at marriage is still found both among urban and rural women. Both of these groups of women who married later tend to reach their fourth birth sooner
than those who married younger.
The two subgroups defined by education also display similar patterns of relation between age at marriage and subsequent fertility behaviour. However, the length of the first birth interval for women with 4 years of schooling or more and who married at ages of 18 and over is somewhat shorter than their counterparts with lower education. This may be an indication of better nutrition levels or more rapid consummation of marriage, therefore, leads to the impression that each subgroups follow the general level and pattern found among all
Java-Bali women aged 40 years and over, which in turn is indicative of natural fertility situation. These findings, therefore, give more confidence to the conclusion that the fertility of Java-Bali women aged 40 years and over in 1976 had been produced in the absence of deliberate fertility control.
REFERENCES
Agarwala, S. N.1967 "Effect of Rise in Female Age at Marriage on Birth Rate in
India," WORLD POPULATION CONFERENCE BELGRADE, 1965, Vol. II, p. 72, New York: United Nations
Al Haddar, Yasmine S.1977 PERKAWINAN DAN PERCERAIAN DI INDONESIA, Survey Fertilitas-
Mortalitas Indonesia, Seri Monografi No. 4, Jakarta: Lembaga Demografi, Fakultas Ekonomi, Universitas Indonesia
Becker, Gary S.1960 "An Economic Analysis of Fertility," in DEMOGRAPHIC AND
ECONOMIC CHANGE IN DEVELOPED COUNTRIES, Diversities Natioal Bureau Conference Series 4, pp. 209-231 New York: Princeton.
Biro Pusat Statistik1980 POLA UMUR PERKAWINAN: ANALISA STATISTIK SOSIAL, Jakarta: Biro
Pusat StatistikBlake, Judith Davis1967 "Parental Control, Delayed Marriage and Population Policy,"
WORLD POPULATION CONFERENCE BELGRADE, 1965, pp. 132-136, New York: United Nations
Bogue, Donald J. and Elizabeth J. Bogue1973 TECHNIQUES OF PREGNANCY HISTORY ANALYSIS: RAPID FEEDBACK FOR
FAMILY PLANNING IMPROVEMENT, Family Planning Research and Evaluation Manual No. 4, Chicago: Community and Family Study Center
Bongaarts, John1979 MALNUTRITION AND FECUNDITY: A SUMMARY OF EVIDENCE, Working
Papers, Center for Policy Studies, New York: The Population Council
Bumpass, Larry L. and Edward K. Mburugu1977 "Age at Marriage and Completed Family Size," SOCIAL BIOLOGY,
Vol. 24, pp. 31-37Bumpass, Larry L., Ronald R. Rindfuss and Richard B. Janosik1978 "Age and Marital Status at First Birth and the Pace of
Subsequent Fertility, DEMOGRAPHY, Vol. 15, No. 1, pp. 75-86Bumpass, Larry L.1979 "Changing Linkage of Nuptiality and Fertility in the United
States," Paper Presented at the IUSSP Seminar on Nuptiality and Fertility, Bruges, 8-11 January 1979,
Busfield, J.1972 "Age at Marriage and Family Size: Social Causation and Social
Selection Hypotheses," JOURNAL OF BIOSOCIAL SCIENCE, Vol. 4, pp. 117-134

Page 103
Central Bureau of Statistics1976 1976 INTERCENSAL POPULATION SURVEY: ORGANIZATION AND METHODS,
Technical Report Series, Monograph No. 1, Jakarta: Biro Pusat Statistik
Central Bureau of Statistics and World Fertility Survey1978 PRINICPAL REPORT, VOLUME I, INDONESIA FERTILTIY SURVEY 1976,
Jakarta: Central Bureau of StatisticsCentral Bureau of Statistics and World Fertility Survey1976 PRINCIPAL REPORT, VOLUME II, INDONESIA FERTILITY SURVEY 1976,
Jakarta: Central Bureau of StatisticsCho, Lee Jay1973 "The Own-Children Approach to Fertility Estimation: An
Elaboration," IUSSP POPULATION CONFERENCE 1973, Vol. 2, LiegeCho Lee Jay, Sam Suharto, Geoffrey McNicoll, and S. G. Made Mamas1976 ESTIMATES OF FERTILITY AND MORTALITY IN INDONESIA BASED ON THE
1971 POPULATION CENSUS, Jakarta: Central Bureau of StatisticsCho Lee Jay, Sam Suharto, Geoffrey McNicoll and S. G. Made Mamas1980 THE POPULATION GROWTH OF INDONESIA: AN ANALYSIS OF FERTILITY
AND MORTALITY BASED ON THE 1971 POPULATION CENSUS, Monograph of the Center for South East Asia Studies, Kyoto University, Honolulu: The University Press of Hawaii
Coale, Ansley J. and C. Y. Tye1961 "The Significance of Age Patterns of Fertility in High
Populations," MILBANK MEMORIAL FUND QUARTERLY, Vol. 39, No. 4 (October), pp. 631-646
Coale, Ansley J.1965 "Factors Associated With the Development of Low Fertility: An
Historical Summary," WORLD POPULATION CONFERENCE BELGRADE, 1965, Vol. II, pp. 205-209, New York: United Nations
Coale, Ansley J.1971 "Age Patterns of Marriage," POPULATION STUDIES, Vol. 25,
pp. 193-214Coale, Ansley J., Noreen Goldman and Lee Jay Cho1979 "Nuptiality and Fertility in the Republic of Korea," Paper
presented at the IUSSP Seminar on Nuptiality and Fertility in Bruges, 8-11 January 1979
Cochrane, Susan Hill1979 FERTILITY AND EDUCATION: WHAT DO WE REALLY KNOW?, World Bank
Staff Occassional Paper, Baltimore: The Johns HopkinsUniversity Press
Das, Nitai Chandra1967 "A Note on the Effect of Postponement of Marriage on
Fertility," WORLD POPULATION CONFERENCE BELGRAGE, 1965,Vol. II, New York: United Nations, Department of Economic and Social Affairs

Page 104
D'Souza, Stan1979 "Nuptiality Patterns and Fertility Implications in South
Asia," Paper presented at the IUSSP Seminar on Nuptiality and Fertility in Bruges, 8-11 January 1979
Davis, Kingsley and Judith Blake1956 "Social Structure and Fertility: An Analytical Framework,"
ECONOMIC DEVELOPMENT AND CULTURAL CHANGE, Vol. 4, No. 3 (April), pp. 211-235
Day, L. H.1965 "Differentials in Age of Women at Completion of Childbearing
in Australia," POPULATION STUDIES, Vol. 18, pp. 251-264Dixon, Ruth B.1977 "The Roles of Rural Women: Female Seclusion, Economic
Production and Reproductive Choice," in Ronald G. Ridker (ed.), POPULATION AND DEVELOPMENT: THE SEARCH FORINTERVENTIONS, Baltimore: Johns Hopkins University Press for Resources for the Future, pp. 290-321
Duza, Badrud M. and C. Stephen Baldwin1977 NUPTIALITY AND POPULATION POLICY, AN INVESTIGATION IN TUNESIA,
SRI LANKA AND MALAYSIA, New York: The Population CouncilEasterlin, Richard A.1969 "Towards a Socio-economic Theory of Fertility: A Survey of
Recent Research on Economic Factors in American Fertility," in S. J. Behrman et. al. (eds.), FERTILITY AND FAMILYPLANNING: A WORLD VIEW, Ann Arbor: University of Michigan Press
Freedman, Ronald1975 THE SOCIOLOGY OF HUMAN FERTILITY: AN ANNOTATED BIBLIOGRAPHY,
New York: Irvington PublishersFreedman, Ronald and John Casterline1979 "Nuptiality and Fertility in Taiwan," Paper Presented at the
IUSSP Seminar on Nuptiality and Fertility in Bruges, 8-11 January 1979
Frisch, Rose E.1979 "Nutrition, Fatness and Fertility: The Effect of Food Intake
on Reproductive Ability," in Henry Mosley (ed.), NUTRITION AND HUMAN REPRODUCTION, pp. 91-122, New York: Plenum Press
Geertz, Hildred1961 THE JAVANESE FAMILY: A STUDY OF KINSHIP AND SOCIALIZATION,
U. S. A.: The Free Press of Glencoe Inc.Germain, Adrienne1975 "The Status and Role of Women as Factors in Fertility
Behavior: A Policy Analysis," STUDIES IN FAMILY PLANNING, Vol. 6, No. 7 (July), pp. 192-200
Page 105
Gille, H. and R. H. Pardoko1966 "A Family Life Study in East Java," in Bernard Berelson (ed.),
FAMILY PLANNING AND POPULATION PROGRAMS, Chicago: Chicago University Press, pp. 503-521
Goode, W. J.1963 WORLD REVOLUTION AND FAMILY PATTERNS, New York: Free Press
Grabill, Wilson H. and Lee Jay Cho1965 "Methodology for Measurement of Current Fertility From
Population Data on Young Children," DEMOGRAPHY, Vol. 2, No. 1Habakkuk, H. J.1965 "English Population in the Eighteenth Century," in D. V. Glass
and D. E. C. Eversley (eds.), POPULATION IN HISTORY, pp. 269-284, London: Edward Arnold
Hajnal, J.1965a "European Marriage Patterns in Perspective," in D. V. Glass
and D. E. C. Eversley (eds.), POPULATION IN HISTORY, p. 101, London: Edward Arnold
Hajnal, John1965b "Age at Marriage and Proportions Marrying," POPULATION
STUDIES, Vol. VII, No. 2, pp. 111-136Hatmadji and Budi Suradji1980 FERTILITY DIFFERENTIAL IN JAVA, Jakarta: Demographic
Institute, University of IndonesiaHawthorn, Geoffrey1970 THE SOCIOLOGY OF FERTILTY: THEMES AND ISSUES IN MODERN
SOCIOLOGY, London: Collier MacMillanHenry, Alice and Phyllis T. Piotrow1979 "Age at Marriage and Fertilty," POPULATION REPORTS, Series M,
No. 4 (November), Vol. VI, No. 6.Henry, Louis1961 "Some Data on Natural Fertility," EUGENICS QUARTERLY, Vol. 8,
pp. 81-91Henry, Louis1976 POPULATION: ANALYSIS AND MODELS, London: Edward ArnoldHermalin, Albert and William M. Mason1981 "A Strategy for Comparative Analysis of WFS Data With
Illustrative Examples," THE UNITED NATIONS PROGRAM FOR COMPARATIVE ANALYSIS OF WORLD FERTILITY SURVEY DATA, New York: UNFPA
Hull, Valerie J.1976 THE POSITIVE RELATION BETWEEN ECONOMIC CLASS AND FAMILY SIZE
IN JAVA, Yogyakarta: Population Institute, Gajah Mada University
Page 106
Hull,T.H;V.J.Hull and Singarimbun1977 "Indonesia's Family Planning Story: Success and Challenge,"
POPULATION BULLETIN, Vol. 32, No. 6 (November), pp. 1-52Hull, Terry and Ida Bagus Mantra1981 "Indonesia's Changing Population," in A. Booth and P. McCawley
(eds.), THE INDONESIAN ECONOMY DURING THE SUHARTO ERA, Kuala Lumpur: Oxford University Press.
Iskandar, Nathanael1970 SOME MONOGRAPHIC STUDIES ON THE POPULATION OF INDONESIA,
Jakarta: Lembaga Demografi, Fakultas Ekonomi, Universitas Indonesia
Jain, Anrudh Kumar1969 "Fecundability and its Relation to Age in a Sample of
Taiwanese Women," POPULATION STUDIES, Vol. 23, pp. 69-85Jain, Anrudh K. and John Bongaarts1980 "Breastfeeding: Patterns, Correlates and Fertility Effects,"
STUDIES IN FAMILY PLANNING, Vol. 12, No. 3 (March)Jain, Arundh K.1981 "Fertility Effect of Female Education," Forthcoming in
DEMOGRAPHY, Vol. 18, No. 4 (November)Jones, Gavin W.1977 "Economic and Social Supports for High Fertility: Conceptual
Framework," in Lado T. Ruzicka (ed.), THE ECONOMIC AND SOCIAL SUPPORTS FOR HIGH FERTILITY, Canberra: Department of Demography, RSSS, pp. 3-48
Karen and Mason1971 SOCIAL AND ECONOMIC CORRELATES OF FAMILY FERTILITY: A SURVEY
OF EVIDENCE, North Carolina: Research Triangle InstituteKastoforth- "Perkawinan dan Perobahan Sosial di Yogyakarta," Findings ofcoming the 1978 Survey on Marriage and Social Change carried out by
the Yogyakarta Population InstituteKnodel, John1978 "Natural Fertiltiy in Pre-Industrial Germany," POPULATION
STUDIES, Vol. 32, No. 3, p. 481-510Leasure, William J.1963 "Malthus, Marriage and Multiplication," MILBANK MEMORIAL FUND
QUARTERLY, Vol. XLI, No. 4 (October), Part 1, pp. 419-435Leridon, Henry1977 HUMAN FERTILITY: THE BASIC COMPONENTS, Chicago: The University
of Chicago PressLiebenstein, Harvey1957 ECONOMIC BACKWARDNESS AND ECONOMIC GROWTH, New York: Wiley

Page 107
Liebenstein, Harvey1974 "An Interpretation of the Economic Theory of Fertility:
Promising Path or Blind Alley?" JOURNAL OF ECONOMIC LITERATURE, Vol. 12, No. 2, pp. 457-479
Lucas, David W.1980 "Fertility," in David Lucas (ed.), BEGINNING POPULATION
STUDIES, pp. 63-92, Canberra: Development Studies Center, Australian National University
MacDonald, A. L., P. M. Simpson and A. M. Whitfield1978 "An Assessemnt of the Reliability of the Indonesian Fertility
Survey Data," WORLD FERTILITY SURVEY SCIENTIFIC REPORT NUMBER 3, (October), London: World Fertility Survey
Marini, Margaret Mooney1981 "Effects of the Timing of Marriage and the First Birth on
Fertility," JOURNAL OF MARRIAGE AND THE FAMILY, (February), pp. 27-46
Martokusumo, Budi Suradji1979 MARRIAGE AND DIVORCE IN INDONESIA: A DEMOGRAPHIC STUDY,
Chicago, unpublished PhD Thesis
Matras, J.1965 "The Social Strategy of Family Formation: Some Variations in
Time and Space," DEMOGRAPHY, Vol. 2, pp. 351-362Mauldin, W. P., Bernard Berelson and Zenas Sykes1978 "Contributions of Fertility Decline in Deveoping Countries,
1965-1975," STUDIES IN FAMILY PLANNING, Vol. 9, No. 5 (May), pp. 89-145,
McDonald, P. F. and Edeng H. Abdurrachman1974 MARRIAGE IN WEST JAVA, Jakarta: Demographic Institute,
University of IndonesiaMcDonald, P. F., M. Yasin and Gavin Jones1976 LEVELS AND TRENDS IN FERTILITY AND CHILDHOOD MORTALITY, 1973
Indonesian Fertilty-Mortality Survey Monograph No. 1, Jakarta: Demographic Institute, University of Indonesia
McDonald, P.F.1978 NUPTIALITY PATTERNS IN INDONESIA, Paper Prepared for the
Indonesia Panel of the Committee on Population and Demography, National Research Council, Washington D. C.
McDonald, P. F.1981 "Social Change and Age at Marriage," Unpublished Seminar
paper, Department of Demography, RSSS, ANU
McDonald, P. F., L. T. Ruzicka and J. Caldwell1980 "Interrelationships Between Marriage and Fertility - The
Evidence of the World Fertility Survey,," Paper Presented at the World Fertility Survey Conference, 7-11 July 1980, London (forthcoming).

Page 108
McGreevey and Birdsall1974 THE POLICY RELEVANCE OF RECENT SOCIAL RESEARCH AND FERTILIY,
Washington D. C.: Interdisciplinary Communications Program, Smithsonian Institute
McNicoll, Geoffrey and Sgde Made Mamas1973 "The Demographic Situation in Indonesia," Paper No. 28 of the
East-West Population Institute, East-West Center, HawaiiMiro, Carmen1980 "The Potential of the World Fertility Survey to Clarify the
Socio-Economic Factors of Fertiliy in Developing Countries," Paper Presented at the World Fertility Survey Conference, 7-11 July 1980, London
Muliakusuma, Sutarsih1976 BERBAGAI ASPEK POLA PERKAWINAN DI INDONESIA DEWASA INI, Survey
Fertilitas-Mortalitas Indonesia 1973, Seri Monograph No. 2, Jakarta: Lembaga Demografi, Fakultas Ekonomi, Universitas Indonesia
Nayar, P. K. B.1974 "The Influence of Education on Fertility," THE JOURNAL OF
FAMILY WELFARE, Vol. 20, No. 3, March 1974, pp. 28-36Notestein, Frank W.1945 "Population, The Long View," in Theodore W. Schulz (ed.), FOOD
FOR THE WORLD, Chicago: The University of Chicago PressPage, H. J.1977 "Patterns Underlying Fertility Schedules: A Decomposition by
Both Age and Marriage Duration" POPULATION STUDIES, Vol. 30, No. 3, pp. 85-106
Rindfuss, Ronald R., Larry Bumpass and Craig St. John1980 "Education and Fertility: Implications for the Roles Women
Occupy," AMERICAN SOCIOLOGICAL REVIEW, Vol. 45, No. 3 (June), pp. 431-447
Ruzicka, L. T.1976 "Age at Marriage and Timing of First Birth," POPULATION
STUDIES, Vol. 30, No. 3, pp. 527-538Ryder, Norman1967 "The Character of Modern Fertility," ANNALS OF THE AMERICAN
ACADEMY OF POLITICAL SCIENCE, Vol. 369 (January), pp. 1-140Schultz, Paul J.1974 FERTILITY DETERMINANTS: A THEORY, EVIDENCE AND AN APPLICATION
TO POLICY EVALUATION, Prepared for the Rockefeller Foundation and the Agency for International Development
Singarimbun, Masri and Chris Manning1976 FERTILITY AND FAMILY PLANNING IN MOJOLAMA, Yogyakarta:
Institute of Population Studies, Gajah Mada University
Page 109
Sinquefield, Jeanne Cairns and Bambang Sungkono1979 "Fertility and Family Planning in Java and Bali,"
INTERNATIONAL FAMILY PLANNING PERSPECTIVES, Vol. 5, No. 2 (June), pp. 43-58
Simon, Julian1974 THE EFFECT OF INCOME ON FERTILITY, Chapel Hills North Carolina
Population CenterSri Poedjiastoeti1979 FACTORS AFFECTING MARITAL STABILITY AND FERTILITY IN
INDONESIA, Unpublished M. A. Thesis, Department of Sociology, The Florida State University
Thornton, A.1977 "Children and Marital Stability," JOURNAL OF MARRIAGE AND THE
FAMILY, Vol. 39, No. 3, pp. 450-531
Trussel, James1979 "Natural Fertility: Measurement and Use in Fertility Models,"
in Leridon and Menken (eds.), NATURAL FERTILITY, Belgium: Ordina Editions, IUSSP
Trussel, James, Jane Menken and Ansley J. Coale1979 "A General Model for Analyzing the Effect of Nuptiality and
Fertility," Paper Presented at the IUSSP Seminar on Nuptiality and Fertiltiy, Bruges, 8-11 January, 1979
Walle,Etienne van de1972 "Marriage and Marital Fertility," in D. V. Glass and Roger
Revelle (eds.), POPULATION AND SOCIAL CHANGE, London: Edward Arnold, pp. 138-151
Walle, Etienne van de and John Knodel1980 "Europe's Fertility Transition: New Evidence and Lessons for
Today's Developing World," POPULATION BULLETIN, Vol. 34, No. 6, pp. 3-43
Widjojo Nitisastro1970 POPULATION TRENDS IN INDONESIA, Ithaca: Cornell University
PressWrigley, E. A.1966 "Family Limitation in Preindustrial England," ECONOMIC HISTORY
REVIEW, Vol. 19, pp. 82-109Yaukey, David1973 MARRIAGE REDUCTION AND FERTLITY, Lexington, Mass.: Lexington
PressYoung, Christabel M.1977 "Spacing of Children and Changing Patterns of Childbearing,"
JOURNAL OF BIOSOCIAL SCIENCE, Vol. 9, pp. 201-226
APPENDIX I
S U P A S
SUPAS is the abbreviation of Survey Penduduk Antar Sensus or the
Intercensal Population Survey. This survey was carried out in 1976 by
the Indonesian Central Bureau of Statistics and was meant to provide
the link of data on population characteristics between the 1971 and
the 1981 Population Censuses. This SUPAS was conducted in three
integrated phases that is, phase I (SUPAS i), phase II (SUPAS II),
phase III (SUPAS III). The SUPAS I aimed at producing summary
statistics at the level of domains. This phase is a large household
listing collecting information on names, sex, age, family relation to
head of household, marital status and own mother status from all
members of households selected in the sample. SUPAS II which was
formed a subsample of the SUPAS I, collected more detailed information
on fertility, mortality and migration, and certain socio-economic
indicators producing estimates at the level of province. The
information was collected both from the household schedules and from
the individuals. SUPAS III was also called the 1976 Indonesia
Fertility Survey, conducted in line with the World Fertility Survey
aand the Indonesian Family Planning Program. The questionnaire was
adapted from the World Fertility Survey core questionnaire with some
modification on the family planning questions. Information was
collected from respondents who were selected as a subsample from the
SUPAS II. Unlike the other two phases, the SUPAS III covered only the
areas of Java and Bali.
Page 111
Multistage sampling was used for the selection of the sample.
For SUPAS I, the domains of study consist of 2 to 7 regencies, which
were considered as having homogeneous characteristics. For ruralJava-Bali, from each domain 10 subdistricts were chosen with
probability proportional to size. The second stage involved inchosing 3 villages from each subdistrict selected in the first stage.Each sample village furthermore, was divided into clusters of fairly
uniform size of around 200 households each. One cluster per village
was selected on the basis of equal probability. Within a sample
cluster, all households were enumerated. The SUPAS II's sample was a
subsample selected from household enumerated in the SUPAS I. This was
done in two stages: a). From the three sample clusters in the
subdistricts, one was selected at random, and b) Within the selected
sample cluster, households were subsampled systematically with
intervals of 2 or 3* The sample for SUPAS III inturn was subsampled from the SUPAS II sample. This phase aimed at providing estimates for
the level of province and also urban-rural divisions and at the
national level (Java-Bali) as well. This complex sample drawing was
obtained by applying sampling fractions to the SUPAS II sample in
accordance with the sample allocation determined before hand. These
sampling fractions were 1/3 in rural areas, 1/2 in Jakarta, and 1/6 in
urban areas. For Java-Bali, the total sample of households drawn in
SUPAS I was 117,000 for rural areas, while in SUPAS II it was 21,668
households. The urban sample for each of the four provinces, that is
Jakarta, West Java, Central Java, and East Java, was fixed at around
9,000 households, while Yogyakarta and Bali, with considerably smaller
urban sectors, each received around 2,000 households. The total urban
sample (for Java-Bali) for the SUPAS III consists of 3,237 households
Page 112
in urban areas and 7,321 in the rural areas. (Condensed from Central
Bureau of Statistics, 1976; Central Bureau Statistics and World
Fertility Survey, 1978, Volume i).
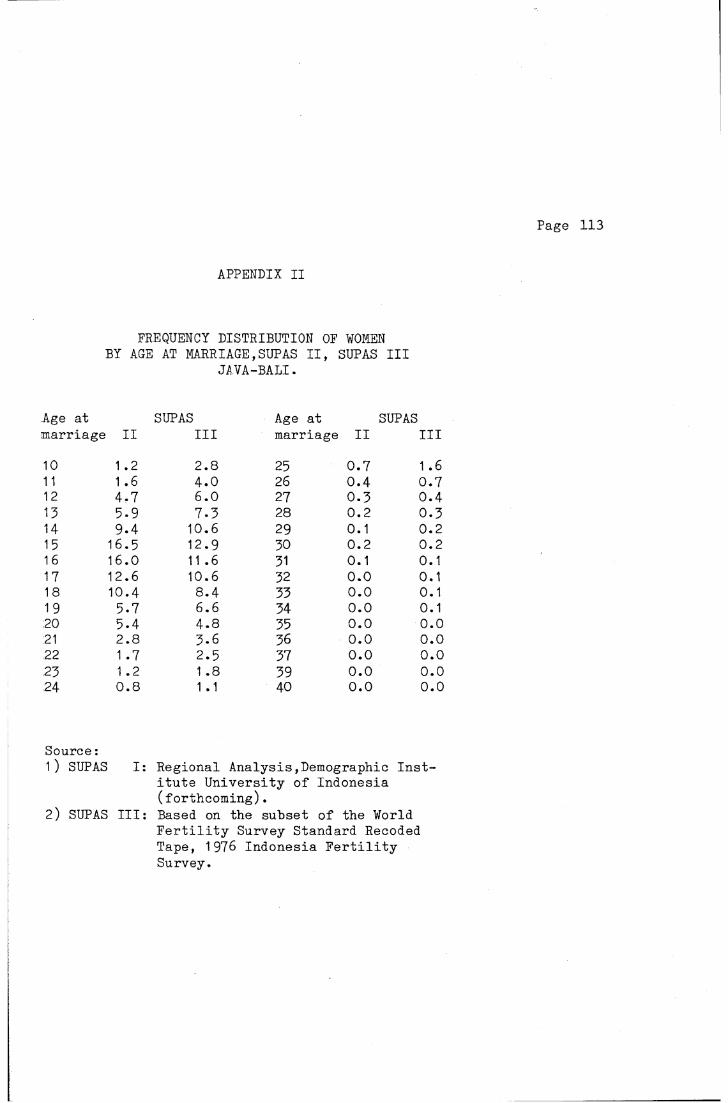
APPENDIX II
FREQUENCY DISTRIBUTION OF WOMENBY AGE AT MARRIAGE ,SUPAS II, SUPAS III
JAVA--BALI.
Age at SUPAS Age at SUPASmarriage II III marriage II III10 1 .2 2.8 25 0.7 1 .611 1 .6 4.0 26 0.4 0.712 4.7 6.0 27 0.3 0.413 5.9 7.3 28 0.2 0.314 9.4 10.6 29 0.1 0.215 16.5 12.9 30 0.2 0.216 16.0 11 .6 31 0.1 0.117 12.6 10.6 32 0.0 0.118 10.4 8.4 33 0.0 0.119 5.7 6.6 34 0.0 0.120 5.4 4.8 35 0.0 0.021 2.8 3.6 36 0.0 0.022 1 .7 2.5 37 0.0 0.023 1 .2 1 .8 39 0.0 0.024 0.8 1 .1 40 0.0 0.0
Source:1) SUPAS I: Regional Analysis,Demographic Inst
itute University of Indonesia (forthcoming).
2) SUPAS III: Based on the subset of the WorldFertility Survey Standard Recoded Tape, 1976 Indonesia Fertility Survey.

APPENDIX III AGEYEARS AGO YEAR
1970
19 50
THE CALENDAR OF LIFE EVENTS CHART
Ll I , . \\9Aj
>5 26 J1 1 * ] 1 i n

APPENDIX IV
TOTAL FERTILITY RATESa) FOR MAJOR AREAS OF INDONESIA BASED ON DATA FROM THE 1971 CENSUS AND 1976 INTERCENSAL
POPULATION SURVEY, STAGE TWO.
Period Percent Change FromRegion 1 968 1973 1975 1968-73 1968-75Indonesia b) 5-5 5.1 4.9 -7.3 -10.9Java - Bali 5.2 4.8 4.6 -7.7 -11 .5
Jakarta 5.1 4.6 4.5 -9.8 -11 .8West Java 5.9 4.8 4.3 -5.1 -13.6Central Java 5.3 4.8 4.3 -9.4 -18.9Yogyakarta 4.7 4.3 4.2 -8.5 -10.6East Java 4.7 4.2 4.0 -10.6 -14.9Bali 5.8 5.3 4.9 -8.6 -15.5
Sumatra 6.4 6.0 5.5 -6.3 -14.1Kalimantan 5.8 5.5 5.5 -5.2 -5.2Sulawesi 5.9 5.8 6.9 -1 .7 + 16.9
Notes:a) Total Fertility Rate is the average number of children
women would bear if they experienced currents ratesof childbearing through their whole reproductive life.
b) Excluding rural and some urban areas of Irian Jaya, East Nusatenggara, and Maluku.
Sources:Copied from Hull and Mantra, 1981, Table 9*

APPENDIX V
PERCENTAGE OF WOMEN MARRIED ONCE, AGED 40+ ACCORDING TO THE LENGTH OF FIRST BIRTH
INTERVAL, JAVA-BALI, 1976 INDONESIA FERTILITY SURVEY.
First Birth interval(in months)
Percentage n
0 - 7 5.2 668 - 1 1 11.9 1511 2 - 2 3 27.8 35324 - 35 21 .1 26836 - 47 11 .8 15048 - 59 7.1 9060 -143 13.0 165144 + 2.1 27
Total 100.0 1270
Notes:1) Women who have negative intervals were excluded
from this table.2) For the computation of first birth intervals
in this study, women who have less than 8 months intervals were excluded to avoid premarital conceptions, and those who have more than 144 months of interval were also excluded to avoid high standard deviation.
Source:Based on the subset of the World Fertility Survey Standard Recoded Tape, 1976 Indonesia Fertility Survey.