Embed Size (px)
Citation preview
ResearchAge differences in fall-related injury hospitalisations andtrauma presentationsajag_413 117..125
Rebecca MitchellNSW Injury Risk Management Research Centre and Department ofAviation, University of New South Wales, Sydney, New SouthWales, Australia
Kate CurtisSt George Public Hospital, Sydney Australia and Faculty of Nursingand Midwifery, University of Sydney, Sydney, New South Wales,Australia
Wendy L WatsonNSW Injury Risk Management Research Centre, University of NewSouth Wales, Sydney, New South Wales, Australia
Thomas NauSt George Clinical School, University of New South Wales, Sydney,New South Wales, Australia
Aim: To examine fall-related hospitalised morbidity in NewSouth Wales (NSW) and to describe the pattern offall-related major trauma presentations at a Level 1 TraumaCentre in NSW for younger and older fallers.Methods: Fall-related injuries were identified in the NSWAdmitted Patients Data Collection during 1 July 1999–30June 2008 and the trauma registry of the NSW St GeorgePublic Hospital during 1 January 2006–6 December 2008.Results: There were 434 138 hospitalisations and 862fall-related trauma presentations. Older fallers had a higherincidence of hospitalisation, being more likely to fall on thesame level during general activities at home, injuring theirhip or thigh. Older fallers were also more likely to have anInjury Severity Score > 9, undergo physiotherapy and stayin hospital for >1 day than younger fallers.Conclusion: Falls, particularly for older individuals, are animportant cause of serious injury, representing aconsiderable burden in terms of hospitalised morbidity.
Key words: fall, hospitalisation, older adults, trauma.
IntroductionFalls are one of the leading causes of mortality and hospital-ised morbidity in Australia [1,2] and internationally [3].Worldwide, around 283 000 individuals were fatally injuredin 2000 as the result of a fall [3]. In Australia, falls accountfor around one-third of injury-related mortality and hospit-alised morbidity. This represents around 2960 deaths (14 per100 000) and 139 112 hospital admissions each year (607.0per 100 000) [1,2].
Reducing the number of fall-related injuries has been a prior-ity area for injury prevention activities in Australia since1993 [4]. More recently, national priorities and preventionstrategies have focused on fall injury prevention in olderadults [5]. While the focus has been on falls in older agegroups, there has been limited information available describ-ing and comparing the pattern of falls and their treatment inyounger age groups. The aims of this paper are to examinethe pattern of fall-related hospitalised morbidity in NewSouth Wales (NSW) and to describe the pattern of fall-relatedmajor trauma presentations at a Level 1 Trauma Centre inNSW for younger (<15 and 15–64) and older fallers (65–79and 80+ years).
MethodA retrospective review of patient characteristics, fall circum-stances and treatment was conducted using the NSW Admit-ted Patients Data Collection (APDC) and the trauma registryof the St George Public Hospital (SGPH).
NSW Admitted Patients Data CollectionThe NSW hospitalisation data that included information oninpatient separations from NSW public and private hospitals,private day procedures and public psychiatric hospitals wereobtained from 1 July 1999 to 30 June 2008. Included aredata on episodes of care in hospital, which end with thedischarge, transfer, or death of the patient, or when theservice category for the admitted patient changes. Informa-tion collected includes patient demographics, source of refer-ral, diagnoses and clinical procedures. The hospitalisationdata were coded using the International Classification ofDisease, 10th Revision, Australian Modified (ICD-10-AM)[6]. The data also includes hospitalisations of NSW residentsthat occur in another state or territory in Australia. At thetime of writing, these data were not available for 2006–2007and 2007–2008, but were estimated to comprise 1155(0.3%) fall injury-related hospitalisations, based on theaverage of the past 4 years.
Fall injury-related hospitalisations of NSW residents in theAPDC were identified using the following criteria:
• The hospitalisation was for a patient who was a residentof NSW.
• The principal diagnosis was coded as ‘injury, poisoningand certain other consequences of external causes’ (i.e.ICD-10-AM chapter 19: range S00-T98).
• An external cause code indicated a fall (i.e. ICD-10-AMchapter 20: range W00-W19).
Correspondence to: Dr Rebecca Mitchell, NSW Injury RiskManagement Research Centre, University of New South Wales.Email: [email protected]
DOI: 10.1111/j.1741-6612.2010.00413.x
117Australasian Journal on Ageing, Vol 29 No 3 September 2010, 117–125© 2010 The AuthorsJournal compilation © 2010 ACOTA

St George Public Hospital Trauma RegistryThe SGPH is a 600-bed acute care tertiary referral facilityand admits more than 50 000 patients annually. Since 1987,the SGPH has served as the major trauma referral hospital forthe south-eastern area of Sydney, Australia, a geographiczone of approximately 1.5 million inhabitants. The SGPHemergency department is the fourth busiest in NSW, averag-ing over 55 000 patient visits per year since 2004. Of these,an average of 230 patients are admitted annually with anInjury Severity Score greater than 15 (ISS > 15). The ISS is aninternationally recognised anatomical scoring system. An ISS< 9 is considered minor to moderate, 9–15 moderate toserious and ISS > 15, severe or critical [7].
Data are collected on all trauma presentations and stored in apurpose-built data registry, maintained since 1991. This
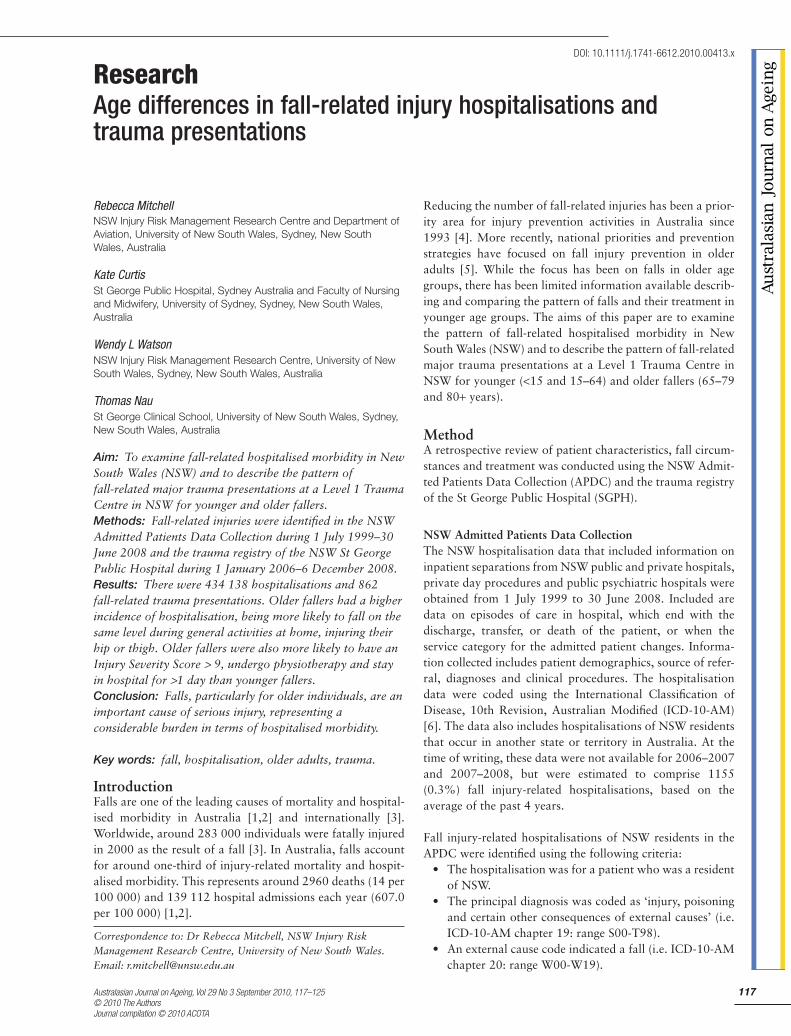
information is obtained from a number of sources, includingambulance-running sheets, patient medical records andpatient interviews. Data are recorded on every trauma admis-sion using established standardised trauma criteria(Figure 1). Data elements collected include: demographicdetails, injury severity, injury description and body region,total hospital and intensive care length of stay.
Fall injury trauma presentations in the SGPH trauma registrywere identified using the following criteria:
• The presentation occurred during 1 January 2006 to 6December 2008.
• The mechanism recorded indicated a fall.
Data management and analysisHospitalisations relating to transfers or statistical dischargeswere excluded from the APDC in order to attempt to
Figure 1: St George Public Hospital trauma activation criteria.
St George Hospital Trauma CommitteeApproved 15 April 2005, reviewed April 2008
TRAUMA TRIAGE ACTIVATION CRITERIA
Emergency department staff specialist present in the ED?
OTHER CIRCUMSTANCES FOR TRAUMA TEAM ACTIVATION (TTA)
1. Motor vehicle collision at speed >55 kph2. Motor bike collision at speed >30 kph3. Pedal cyclist collision at >30 kph4. Adult pedestrian struck by motor vehicle at >30 kph5. Child pedestrian struck by motor vehicle at any speed6. Fall greater than three (3) metres7. Torso crush/pinning/entrapment8. Patient ejection from vehicle
1. RR <10 or >30 per minute2. Cyanosis or oxygen saturation <90%3. Systolic blood pressure <90 mHg (if age >5 years) or no palpable BP in children4. Heart rate <50 or >120 beats per minute5. GCS<14 or fitting6. Pupil(s) dilated or non-reactive
1. Obvious fracture of two or more long bones (humerus/femur/tibia)2. Suspected spinal cord injury (motor weakness/paralysis)3. Crush injury or amputation of a limb proximal to wrist/ankle4. Penetrating injury ot head, neck, torso or groin5. Abdominal distension or rigidity6. Facial and/or airway burns (suspected inhalation injury)7. Burns > 20% in adults8. Burns > 10% in children9. Age >65% with suspected torso or major head injury10. Pregnant patient with suspected head or torso injury
1. If the patient doesn’t meet any criteria for TTA, the assessing person should have a low thresholdfor activating a Trauma Team Standby if they have any concerns re an injured patient. This response is appropriate and encouraged.
2. If the above criteria or history of trauma are not identified on initial presentation, the appropriateTTA should be activated immediately on recognition, regardless of time after presentation.
3. All interhospital trauma transfers should receive a “Trauma Team Required” page
Mechanism of Injury (MOI)
TR
AU
MA
TE
AM
RE
QU
IRE
D E
D (
X P
AT
IEN
TS
)
MO
I C
RIT
ER
IA O
NLY
? =
TT
STA
ND
BY
ED
TT R
EQ
UIR
ED
ED
AN
Y T
IME
IF A
NY
OTH
ER
CR
ITE
RIA
ME
T
YES NO
Vital Signs
Injuries
The Hospital Trauma Team should be activated if a patient fulfils any of the following criteriaon arrival, even if no pre-hospital notification is given. Ring 666 and state Trauma TeamStandby ED or Trauma Team Required ED, incliding the number of patients as below:
M i t c h e l l R , C u r t i s K , W a t s o n W L e t a l .
118 Australasian Journal on Ageing, Vol 29 No 3 September 2010, 117–125© 2010 The Authors
Journal compilation © 2010 ACOTA

eliminate ‘multiple counts’ partly. These exclusions refer totransfers between hospitals or changes in the service category(e.g. a change from acute to rehabilitation) for a patientduring one episode of care in a single facility.
Analysis was performed using SAS [8]. Age- and sex-specificpopulation estimates at 31 December of each of the yearsunder study, which corresponds to the mid-point of eachfinancial year of APDC data, were obtained from the NSWHealth Department. These estimates were extrapolated fromAustralian Bureau of Statistics (ABS) population estimates at30 June [9]. Direct age standardised rates were calculatedusing the estimated Australian residential population at 30June 2001 as the standard population. Ninety-five per centconfidence intervals (95% CI) were calculated assuming aPoisson distribution [10].
Because of over-dispersion, negative binomial regression wasused to examine the trend over time in the incidence offall-related injury hospitalisations in the APDC [11]. Toexamine the association between age group and ISS in theSGPH trauma registry, a c2 test of independence wasused [11].
Results
NSW Admitted Patients Data CollectionThere were 434 138 NSW residents hospitalised as a result ofa fall-related injury during 1999–2000 to 2007–2008, withan annual rate of 694.1 per 100 000 population (Table 1).Just over half of all hospitalised fall-related injuries occurredto females (55.3%). Males aged less than 65 years had ahigher rate of hospitalisation for fall-related injuries thanfemales. However, females aged 65+ years had higher fallinjury hospitalisation rates than males. In particular, femalesaged 80+ years had a rate of hospitalisation one and a halftimes that of males. The injury hospitalisation rate followinga fall was estimated to increase significantly by 1.2% per year(P < 0.0047; 95% CI for the increase 0.4% to 2.1%) from1999–2000 to 2007–2008, with the rate of fall injury hospi-talisation highest for individuals aged 80+ years (Figure 2).
Falls from one level to another was the most common type offall sub-mechanism for children aged <15 years who requiredhospitalisation. For those individuals aged 15+ years, themost common fall sub-mechanism resulting in hospitalisa-tion was falls on the same level (Table 2). The home was themost common specified location where the injury occurred
Table 1: Hospitalised falls by sex, number and rate, NSW Admitted Patients Data collection, 1999–2000 to 2007–2008
Age group Male Female Persons
n Rate† 95% CI‡ n Rate† 95% CI‡ n Rate† 95% CI‡
<15 49 765 809.3 802.2–816.4 29 864 511.6 505.8–517.5 79 631 664.2 659.6–668.915–64 80 957 399.9 397.1–402.6 53 212 260.4 258.2–262.6 134 169 330.7 329.0–332.565–79 29 733 1 079.9 1 067.7–1 092.3 56 356 1 780.7 1 766.0–1 795.5 86 089 1 456.1 1 446.4–1 465.880+ 33 626 4 696.8 4 646.4–4 747.8 100 622 7 422.7 7 376.8–7 468.8 134 249 6 467.6 6 433.0–6 502.3Total§ 194 081 680.2 677.2–683.2 240 054 675.7 673.0–678.5 434 138 694.1 692.0–696.2
†Age-standardised rate per 100 000. ‡95% confidence interval. §Excludes 168 missing ages and three missing sexes from the calculation of age-standardised rates.
Figure 2: Hospital admissions following a fall by age group, NSW Admitted Patients Data collection, 1999–2000 to2007–2008 (age-standardised rate per 100 000; excludes 168 missing ages from the calculation of age-standardisedrates).
0
1000
2000
3000
4000
5000
6000
7000
8000
1999–2000 2000–2001 2001–2002 2002–2003 2003–2004 2004–2005 2005–2006 2006–2007 2007–2008
<15
15–64
65–79
80+
Year
Rate per 100 000 population
A g e d i f f e r e n c e s i n f a l l i n j u r i e s
119Australasian Journal on Ageing, Vol 29 No 3 September 2010, 117–125© 2010 The AuthorsJournal compilation © 2010 ACOTA

for all age groups (Table 2). Schools, other institutions andpublic administrative areas were also common injury loca-tions for children aged <15 years (12.4%) and sports andathletic areas were also common injury locations for indi-viduals aged 15–64 years. However, unspecified placesaccounted for 24.6%, and unknown places for 10.1%, of thelocations where the fall injury occurred.
Sports and leisure activities were the most common knownactivities at the time of the fall for individuals aged <65 years(Table 2). Resting, sleeping, eating or engaging in other vitalactivities was the most common activity being undertaken atthe time of the fall for individuals aged 65+ years. However,unspecified (53.5%), unknown (10.4%) and other specified(9.9%) activities were recorded for almost three-quarters(73.8%) of the activities undertaken at the time of the fall.
The principal body location of the injury varied by age group(Figure 3). Injuries to the elbow and forearm and head inju-ries were common among children, while injuries to the kneeand lower leg were common for individuals aged 15–64 yearsand injuries to the hip and thigh were common for those aged80+ years. The most common 10 principal procedures per-formed following a fall injury hospitalisation differed by agegroup. For children aged <15 years and individuals aged15–64 years closed reductions of fractures of the distal radiuswere the most common principal procedures performed(33.1% and 7.9%, respectively) (Table 3). The allied health
intervention, physiotherapy, was the most common principalprocedure performed for individuals aged 65–79 years(15.5%) and 80+ years (19.5%). However, when combined,principal procedures relating to hip fracture (i.e. 1479, 1489,1486) were the most common procedures performed in thesetwo age groups (accounting for 17.3% and 26.7% of proce-dures, respectively).
Up to a 1-day stay in hospital was the most common lengthof hospitalisation for a fall-related injury for all age groups(Table 4). However, older age groups (i.e. >15 years) weremore likely to spend additional days in hospital.
St George Public Hospital Trauma RegistryIn total, there were 4427 major trauma presentations toSGPH during 2006–2008, of which fall-related presentationsrepresented 19.5% (n = 862). Around two-thirds of thefall-related presentations were of males for each age group,except 80+ years, where males represented just over half ofthose injured (Table 5). For those individuals aged <80 years,the majority of falls were between 1 and 5 m in height.However, for those aged 80+ years, the majority of fallsresulting in admission (56.3%) were from <1 m in height.
For all age groups, the most common location of the fall wasthe home. At the time of the injury, children aged <15 yearswere most commonly being nursed or cared for (56.3%),while older individuals were most commonly either
Table 2: Fall sub-mechanism, location and activity at time of incident for hospitalised falls by age group, number andpercentage, NSW Admitted Patients Data collection, 1999–2000 to 2007–2008
Fall hospitalisations† <15 15–64 65–79 80+
n % n % n % n %
Fall sub-mechanismFalls on the same level 29 711 37.3 64 154 47.8 46 455 54.0 72 535 54.0Falls from one level to another 33 810 42.5 15 797 11.8 7 528 8.7 13 566 10.1Falls on and from ladders or scaffolding 310 0.4 9 239 6.7 2 942 3.4 723 0.5Falls from, out of or through buildings or structures 3 473 4.4 8 118 6.1 800 0.9 264 0.2Falls on and from stairs and steps 2 918 3.7 14 139 10.5 7 836 9.1 6 990 5.2Falls while being carried or supported by other persons 1 351 1.7 145 0.1 20 0.0 37 0.0Falls while diving or jumping into water 388 0.5 1 149 0.9 35 0.0 8 0.0Unspecified falls 7 670 9.6 21 428 16.0 20 473 23.8 40 126 29.9
Location of incidentHome 18 859 23.7 33 194 24.7 39 855 46.3 59 773 44.5School, other institution and public administrative area 9 859 12.4 3 051 2.3 2 686 3.1 6 089 4.5Sports and athletics area 7 587 9.5 13 724 10.2 681 0.8 238 0.2Industrial and construction area 77 0.1 3 312 2.5 156 0.2 91 0.1Street and highway 790 1.0 5 791 4.3 4 814 5.6 4 488 3.3Trade and service area 875 1.1 6 217 4.6 3 602 4.2 3 180 2.4Farm 111 0.1 683 0.5 223 0.3 94 0.1Other specified places 3 642 4.6 7 445 5.6 1 829 2.1 1 087 0.8Unspecified place 28 763 36.1 45 165 33.7 17 083 19.8 15 642 11.7Not known/missing 8 949 11.2 14 313 10.7 9 160 10.6 11 562 8.6
Activity at time of incidentSport or leisure activity 20 392 25.6 24 255 18.1 2 306 2.7 1 309 1.0Working for income 23 0.0 10 546 7.9 490 0.6 78 0.1Other types of work 640 0.8 5 722 4.3 4 968 5.8 5 154 3.8Resting, sleeping, eating or engaging in other vital activities 2 085 2.6 5 295 4.0 9 172 10.7 21 058 15.7Engaged in other specified activities 16 752 21.0 9 863 7.4 6 906 8.0 9 512 7.1During unspecified activities 30 638 38.5 63 800 47.6 52 764 61.3 85 067 63.4Not known/missing 9 101 11.4 14 688 11.0 9 483 11.0 12 071 9.0
†Excludes 168 missing ages.
M i t c h e l l R , C u r t i s K , W a t s o n W L e t a l .
120 Australasian Journal on Ageing, Vol 29 No 3 September 2010, 117–125© 2010 The Authors
Journal compilation © 2010 ACOTA

performing general activities/work or sport or leisure activi-ties. Individuals aged <80 years were most commonly dis-charged home. For those aged 80+ years only two in five weredischarged home, one in five died, 15% were admitteddirectly to a nursing home and another 14% were admittedto a rehabilitation hospital or brain injury unit.
For all age groups, the most common principal body locationof the main injury was the head (Figure 3). Around two-thirds (69.4%) of fall-related trauma cases had an ISS > 15,with just less than half (45.8%) of the trauma cases incurringeither a minor or moderate ISS. Across all ISS categories,
older age groups were more likely to be identified as moreseverely injured than younger age groups, represented by ahigher ISS (c2 = 123.2, d.f. = 12, P < 0.0001) (Table 4).
DiscussionFall-related injuries, even relatively minor injuries, canadversely impact on the lives of individuals [12]. In addi-tion, falls represent a large proportion of the injury burdenon a hospital system [13,14]. This study found that around48 238 hospitalisations each year occurred following a falland that around one-third of these admissions were of indi-viduals aged 15–64 years and another third were aged 80+
Figure 3: Principal body location of injury as a result of hospitalised falls by age group, NSW Admitted Patients Datacollection, 1999–2000 to 2007–2008 (excludes 168 missing ages) and St George Public Hospital, 2006–2008.
0 10 20 30 40 50
Other
Thorax
Ankle and foot
Neck
Abdomen, lowerback, lumberspine, and pelvis
Wrist and hand
Hip and thigh
Knee and lower leg
Shoulder and upper arm
Head
Elbow and forearm
<15
15–64
65–79
80+
Percentage
Principal hospitalised injury
0 10 20 30 40 50 60 70
Percentage
Principal injury presentation
NSW APDC
St George Hospital
Other
Thorax
Neck
Hip and thigh
Elbow and forearm
Wrist and hand
Knee and lower leg
Ankle and foot
Shoulder and upper arm
Abdomen, lowerback, lumberspine, and pelvis
Head
A g e d i f f e r e n c e s i n f a l l i n j u r i e s
121Australasian Journal on Ageing, Vol 29 No 3 September 2010, 117–125© 2010 The AuthorsJournal compilation © 2010 ACOTA

years. Older individuals had higher rates of hospitalisationthan younger age groups. Overall, the hospitalisationtrend in NSW for falls between 1999–2000 and 2007–2008 significantly increased by an average of 1.2%each year.
For fall injuries presenting to a major trauma centre, justover half were of individuals aged 15–64 years. In all agegroups, the majority of these presentations were of males,except those aged 80+ years. Males also had higher hospi-talisation rates in the APDC, until age 65 years. Similarly,other studies have also found that fall-related hospitalisa-tion rates for older women were higher than that for oldermales [2,12]. Some of the disparity between the sexes maybe as a result of differences in pre-fall factors, such as poorphysical activity levels, limited strength and balance abili-ties, bone density or presence of co-morbidities; all relatedto an increased fall risk, or to fall-related factors, such asheight of the fall, which may affect injury severity [14,15].Further investigation of sex differences for fall-related
injury hospital admissions and trauma presentations is rec-ommended to examine factors related to sex determinantsof injury outcome.
Data from the SGPH trauma registry contained informationon the height of the fall, with falls between 1 and 5 mcommon among those aged <79 years and falls <1 m mostcommon for those aged 80+ years. Hospitalisation data fromthe APDC showed that falls on the same level represented thehighest proportion of the type of fall experienced for indi-viduals aged 15+ years. In particular, other studies havefound slips and trips on the same level to be one of the mostcommon types of falls for individuals aged 65+ years [16]. Inthe United States, an investigation of work-related falls iden-tified that many falls occurred on the same level as a result ofcontamination of the floor surface (e.g. wet floors) or aftertripping over objects [17]. Unfortunately, this level of detailregarding the fall event is not currently available in NSWhealth data collections. Narrative text has been exploredwith some success for use in injury surveillance [18,19]. It is
Table 3: Most common 10 principal procedures for hospitalised falls by age group, number and percentage, NSWAdmitted Patients Data collection, 1999–2000 to 2007–2008
ICD-10-AM procedure code Procedure All fall injuriesn
Age group (years)
<15 15–64 65–79 80+
n %† n %† n %† n %†
1427 Closed reduction of fracture of distal radius 33 734 18 875 33.1 7 805 7.9 4 041 6.1 3 004 2.91431 Closed reduction of fracture of shaft of radius
and ulna5 940 5 720 10.0
1952 Computerised tomography of brain 27 185 3 460 6.1 6 963 7.0 5 376 8.1 11 378 10.81413 Closed reduction fracture of distal humerus
with internal fixation2 584 2 450 4.3 3 788 3.8
1413 Closed reduction fracture of distal humerus 2 243 2 090 3.71414 Open reduction of fracture of distal humerus
with internal fixation2 584 1 484 2.6 4 003 4.0
406 Repair of wound of lip 1 741 1 387 2.41427 Closed reduction of fracture of shaft of radius 1 311 1 188 2.11509 Closed reduction of fracture of shaft of tibia 1 979 1 140 2.01916 Allied health intervention, physiotherapy 37 751 948 1.7 6 007 6.1 10 252 15.5 20 540 19.51537 Closed reduction fracture of ankle with
internal fixation of diastasis, fibula ormalleolus
9 812 7 578 7.7
1539 Open reduction fracture of ankle with internalfixation of diastasis, fibula or malleolus
3 886 2 929 3.0 1 504 2.3
1635 Repair of wound of skin and subcutaneoustissue of other site, superficial
7 192 2 073 2.1 2 815 2.7
1402 Closed reduction dislocation of shoulder 3 626 1 979 2.01965 Computerised tomography of limb 3 715 1 727 1.71479 Internal fixation of fracture of trochanteric or
subcapital femur18 860 4 808 7.3 12 574 11.9
1489 Hemiarthroplasty of femur 12 805 3 509 5.3 8 927 8.41486 Open reduction fracture of femur with
internal fixation11 189 3 134 4.7 6 736 6.4
1427 Closed reduction fracture of distal radius withinternal fixation
7 115 1 959 3.0
1429 Open reduction fracture of distal radius withinternal fixation
6 647 1 688 2.5
1916 Allied health intervention, occupationaltherapy
5 316 1 559 2.4 3 030 2.9
1916 Allied health intervention, social work 5 083 2 734 2.62011 Whole body bone study 2 990 1 957 1.9
†Bold shading indicates the highest proportion. Proportion of this procedure conducted for the age group. ICD-10-AM, International Classification of Disease, 10th Revision, Australian Modified.
M i t c h e l l R , C u r t i s K , W a t s o n W L e t a l .
122 Australasian Journal on Ageing, Vol 29 No 3 September 2010, 117–125© 2010 The Authors
Journal compilation © 2010 ACOTA

Table 4: Fall-related injury hospitalisation in the NSW Admitted Patients Data collection and fall-related traumapresenting to St George Public Hospital, number and percentage
<15 15–64 65–79 80+
n % n % n % n %
Fall hospitalisations in NSW APDC†1999–2000 to 2007–2008Up to 1 day 67 265 84.5 77 043 57.4 30 587 35.5 37 105 27.62 days 7 318 9.2 16 815 12.5 6 967 8.1 7 297 5.43–4 days 2 796 3.5 16 975 12.7 10 081 11.7 14 421 10.75–7 days 974 1.2 10 535 7.9 12 248 14.2 21 088 15.78–14 days 588 0.7 7 996 6.0 15 109 17.6 29 204 21.815–21 days 169 0.2 2 291 1.7 5 655 6.7 12 661 9.422–28 days 117 0.2 895 0.7 2 327 2.7 5 725 4.329 days or more 404 0.5 1 619 1.2 3 115 3.7 6 748 5.0
Fall trauma presentations to SGPH2006–2008Up to one day 76 87.4 175 37.3 35 21.3 20 14.12 days 8 9.2 48 10.2 18 11.0 10 7.03–4 days ‡ ‡ 49 10.4 19 11.6 17 12.05–7 days 0 – 70 14.9 24 14.6 20 14.18–14 days 0 – 68 14.5 29 17.7 30 21.115–21 days 0 – 17 3.6 11 6.7 24 16.922–28 days 0 – 8 1.7 10 6.1 12 8.529 days or more ‡ ‡ 29 6.2 18 11 ‡ ‡Missing 0 – 5 1.1 0 – ‡ ‡
†Excludes 168 missing ages. ‡Cell sizes represent fewer than five hospitalisations or data have been removed to prevent identification of cell sizes less than five. APDC, Admitted Patients DataCollection; SGPH, St George Public Hospital.
Table 5: Fall-related trauma presenting to St George Public Hospital, number and percentage, 2006–2008
<15 15–64 65–79 80+
n % n % n % n %
SexMale 54 62.1 360 76.8 115 70.1 74 52.1Female 33 37.9 109 23.2 49 29.9 68 47.9
Fall height<1 metre 14 16.1 66 14.1 53 32.3 80 56.31–5 metres 68 78.2 340 72.5 106 64.6 60 42.3>5 metres † † 63 13.4 5 3.0 † †Unspecified height † † 0 – 0 – † †
Injury Severity ScoreMinor (0–3) 40 46.0 86 18.3 18 11.0 12 8.5Moderate (4–8) 31 35.6 147 31.3 32 19.5 29 20.4Serious (9–15) 10 11.5 120 25.6 41 25.0 32 22.5Severe (16–24) † † 61 13.0 51 31.1 35 24.6Critical (25–75) † † 55 11.7 22 13.4 34 23.9
Activity when injuredSport or leisure activities 22 25.3 183 39.0 66 40.2 46 32.4Working for income 0 – 92 19.6 5 3.0 0 –General activities/work 11 12.6 189 40.3 91 55.5 79 55.6Being nursed or cared for 49 56.3 † † † † 17 12.0Educational activities 5 5.7 † † † † 0 –Other specified activity 0 – † † 0 – 0 –
Location of incidentHome 62 71.3 293 62.5 125 76.2 82 57.7School, other institution and public administrative area 11 12.6 17 3.6 4 2.4 24 16.9Sports and athletics area 9 10.3 8 1.7 1 0.6 † †Industrial and construction area 0 0.0 50 10.7 4 2.4 0 0.0Street and highway † † 28 6.0 8 4.9 14 9.9Trade and service area † † 34 7.2 13 7.9 15 10.6Other and unspecified places † † 39 8.3 9 5.5 † †
Discharge destinationHome or hostel 71 81.6 395 84.2 118 72.0 59 41.5Acute care, district, private or psychiatric hospital 16 18.4 29 6.2 14 8.5 † †Rehabilitation hospital or brain injury unit 0 – 26 5.5 16 9.8 20 14.1Nursing home 0 – † † † † 21 14.8Died 0 – 12 2.6 10 6.1 27 19.0Other and unspecified 0 – † † † † † †
†Cell sizes represent fewer than five hospitalisations or data have been removed to prevent identification of cell sizes less than five.
A g e d i f f e r e n c e s i n f a l l i n j u r i e s
123Australasian Journal on Ageing, Vol 29 No 3 September 2010, 117–125© 2010 The AuthorsJournal compilation © 2010 ACOTA

likely that the addition of a narrative text field to supplementcoded data could be useful to gain additional information onthe causal factors for fall injury. This information could assistin the development and application of appropriate fall injuryprevention strategies.
The home was the most common location for all fall-relatedinjuries. Likewise, the home was found to be a commonlocation of falls in prior research [20,21]. Older adults weremore likely to be performing activities associated with dailyliving at the time of the fall, suggesting that older individualsmay require assistance and/or support with some homeduties and improving balance and physical functioning is alsolikely to have a positive effect on reducing injuries around thehome [20].
Around one-quarter of children aged <15 years were engagedin sport or leisure-related activities at the time of the fall.Falls on the same level due to collision with, or pushing by,another person were the most common type of sport andleisure-related injury in NSW during 2003–2005 [22]. Pre-vention strategies for this age group should target fall injuriesoccurring during sporting activities and any prevention strat-egies adopted should continue to promote participation insport, while encouraging safe play [23].
Injuries to the head were the most common injury for allage groups presenting to the SGPH. This is not surprisingas the SGPH is a Level 1 Trauma Centre and, as such, isdesignated to receive more severe trauma cases. The NSWAmbulance Service pre-hospital management of majortrauma triage tool specifies that patients with a history offocal blunt head trauma or who have fallen >3 m, whohave a Glasgow Coma Score (GCS) of �13, or are on anti-coagulation medication or with pre-existing disease shouldproceed directly to a major trauma centre [24]. In theAPDC, elbow and forearm injuries were the most commoninjury for those aged <15 years, most likely because ofreflexive protective effects to attempt to cushion the fall[25]. Not surprisingly, hip and thigh injuries were commoninjury types for older individuals who were hospitalised.Hip fractures are known to be one of the most commontypes of fall-related injury sustained by older individualsthat results in hospitalisation [26].
As would be expected, the principal procedure performed forhospitalised individuals corresponded to the type of injuryreceived for the different age groups. For example, childrenwere commonly treated for a fracture of the distal radiuswhereas procedures related to hip fracture were mostcommon in those aged 65+ years. For individuals aged 65+years, the single most common treatment involved an alliedhealth intervention, physiotherapy. Further examination ofthis treatment category should be undertaken, as it is unlikelythat an individual’s first admission to hospital would bephysiotherapy, indicating that this may not be an individual’sfirst admission for this injury.
Younger individuals were more likely to be less seriouslyinjured than older individuals and to spend less time inhospital. This is a common finding in fall injury researchstudies that is ascribed to the effects of ageing on the physicalbody, making it less resistant to injury following a fall[20,27]. Younger individuals were more likely to be dis-charged home following a trauma admission than those aged80+ years in the current study suggesting that fall outcomesin this age group are more likely to have more catastrophicconsequences for older people (e.g. death or admission to anursing home).
For the two in five individuals aged 80+ years who weredischarged home following their fall, discharge planningpractices should involve the identification of appropriatepost-discharge assistance [28], as the occurrence of one fallhas been associated with an increased likelihood of havingfurther falls [16]. It is recommended that factors influencingdischarge status be examined in future work using informa-tion from several trauma data collections, where possible.
There are several limitations of the current analyses. In theAPDC, both the location of the incident and the activityperformed at the time of the incident had over one-thirdand over two-thirds, of other specified, unspecified orunknown codes, respectively. These relative large propor-tions of unspecified locations and activities could havechanged the nature of these results. In contrast, there werehardly any unspecified locations or activities in the SGPHtrauma data, where there were dedicated staff with more‘ownership’ of the information recorded in their registry.There is likely to be some double counting of cases betweenthe hospital admission records and the trauma registry asmajor trauma cases presenting to SGPH are likely to beadmitted to hospital and therefore are also likely to appearin the APDC. Lastly, the data validity of either data collec-tion has not been assessed, so results from these analysescannot be guaranteed.
ConclusionThe results of this study support findings elsewhere that fallinjuries are a common cause of hospitalisation in Australia[2] and present a considerable burden in terms of morbiditycosts [29]. Fall injuries can also have an adverse impact onthe individual and their family, the workplace, and on thecommunity. Therefore, the prevention of fall-related injurieshas the potential to result in health benefits for individuals ofall ages and in direct cost savings to both the health-caresystem and the workplace [30].
The usefulness of hospitalisation data for prevention wouldbe enhanced by improved coding of the activity performedand the location of the incident. Also, an assessment of thefeasibility of collecting narrative text in hospitalisation andtrauma registry data may be warranted in an attempt toobtain further information regarding the causal factors forfall injury.
M i t c h e l l R , C u r t i s K , W a t s o n W L e t a l .
124 Australasian Journal on Ageing, Vol 29 No 3 September 2010, 117–125© 2010 The Authors
Journal compilation © 2010 ACOTA

AcknowledgementsR Mitchell was supported by the NSW Injury Risk Manage-ment Research Centre, with core funding provided by theNSW Health Department, the NSW Roads and TrafficAuthority and the Motor Accidents Authority. W Watsonwas supported by the NSW Health Department. The authorswish to thank the Centre for Epidemiology and Research atthe NSW Health Department for providing access to theHealth Outcomes and Information Statistical Toolkit(HOIST) analysed in this study.
Key Points• Falls are an important cause of serious injury in
NSW for all age groups, representing a consider-able burden in terms of hospitalised morbidity.
• Different event circumstances and injury outcomesare associated with fall-related injuries for differ-ent age groups.
• This study has highlighted areas where preventionor mitigation strategies that should be adopted fordifferent age groups and areas where further inves-tigation is required.
References1 Henley G, Kreisfeld R, Harrison J. Injury Deaths,Australia 2003–04. Injury
Research and Statistics Series Number 31. Adelaide: AIHW, 2007.2 Bradley C, Harrison J. Hospital Separations Due to Injury and Poisoning,
Australia 2004–05. Injury research and statistics series no. 47. Adelaide:AIHW, 2008.
3 Peden M, McGee K, Sharma G. The Injury Chart Book: A GraphicalOverview of the Global Burden of Injuries. Geneva: World Health Organi-zation, 2002.
4 Nutbeam D, Wise M, Bauman A, Harris E, Leeder S. Goals and Targets forAustralia's Health in the Year 2000 and Beyond. Canberra: Common-wealth Department of Health, Housing and Community Services, 1993.
5 National Public Health Partnership. National Falls Prevention for OlderPeople Plan: 2004 Onwards. Canberra: National Public Health Partner-ship, 2005.
6 National Centre for Classification in Health. ICD-10-AM, 4th edn. Sydney:Commonwealth Department of Health, 2004.
7 Holbrook T, Hoyt D, Anderson J. The impact of major in-hospital compli-cations on functional outcome and quality of life after trauma. Journal ofTrauma Injury Infection and Critical Care 2001; 50: 91–95.
8 SAS Institute. SAS: Statistical Software, Version 9.1 [Program]. Cary, NC:SAS Institute, 2003.
9 Population Health Division. The Health of the People of NSW. Report of theChief Health Officer. Sydney: NSW Health Department, 2004.
10 Dobson A, Kuulasmaa K, Eberle E, Schere J. Confidence intervals forweighted sums of Poisson parameters. Statistics in Medicine 1991; 10:457–762.
11 Armitage P, Berry G, Matthews J. Statistical Methods in MedicalResearch, 4th edn. Cornwell: Blackwell Science, 2002.
12 Stevens J, Mack K, Paulozzi L, Ballesteros M. Self-reported falls andfall-related injuries among persons aged �65 years – United States,2006. Journal of Safety Research 2008; 39: 345–349.
13 Thomas K, Stevens J, Sarmiento K, Wald M. Fall-related traumatic braininjury deaths and hosptializations among older adults – United States,2005. Journal of Safety Research 2008; 39: 269–272.
14 Stevens JA, Sogolow ED. Gender differences for non-fatal unintentionalfall related injuries among older adults. Injury Prevention 2005; 11:115–119.
15 Tinetti M, Speechley M, Ginter S. Risk factors for falls among elderlypersons living in the community. New England Journal of Medicine 1988;26: 1701–1707.
16 National Ageing Research Institute. An Analysis of Research on Prevent-ing Falls and Falls Injury in Older People: Community, Residential Careand Hospital Settings. Canberra: Australian Government, 2004.
17 Layne LA, Pollack KM. Nonfatal occupational injuries from slips, trips, andfalls among older workers treated in hospital emergency departments,United States 1998. American Journal of Industrial Medicine 2004; 46:32–41.
18 Lincoln AE, Sorock GS, Courtney TK, Wellman HM, Smith GS, AmorosoPJ. Using narrative text and coded data to develop hazard scenarios foroccupational injury interventions. Injury Prevention 2004; 10: 249–254.
19 Williamson A, Feyer A-M, Stout N, Driscoll T, Usher H. Use of narrativeanalysis for comparisons of the causes of fatal accidents in three coun-tries: New Zealand, Australia, and the United States. Injury Prevention2001; 7 (Suppl I): i15–i20.
20 Talbot L, Musiol R, Witham E, Metter E. Falls in young, middle-aged andolder community dwelling adults: Perceived cause, environmental factorsand injury. BMC Public Health 2005; 5: 86.
21 Kool B, Ameratunga S, Robinson E. Hospitalisations and deaths due tounintentional falls at home among working-aged New Zealanders. Injury2007; 38: 570–575.
22 Mitchell R, Boufous S, Finch C. Sport/Leisure Injuries in New South Wales:Trends in Sport/Leisure Injury Hospitalisations (2003–2005) and thePrevalence of Non-Hospitalised Injuries (2005). Sydney: NSW Injury RiskManagement Research Centre, 2008.
23 Dempsey R, Layde P, Laud P, Guse C, Hargarten S. Incidence of sportsand recreation related injuries resulting in hospitalization in Wisconsin in2000. Injury Prevention 2005; 11: 91–96.
24 Ambulance Service of New South Wales. Pre-Hospital Management ofMajor Trauma Triage Tool. Protocol T1. Rozelle: Ambulance Service ofNew South Wales, 2008.
25 Hsiao E, Robinovitch S. Common protective movements govern unex-pected falls from standing height. Journal of Biomechanics 1998; 31:1–9.
26 Boufous S, Finch C, Lord S. The incidence of hip fracture in NSW: Are ourefforts having an effect? Medical Journal of Australia 2004; 180: 623–626.
27 Demetriades D, Murray J, Brown C et al. High-level falls: Type andseverity of injuries and survival outcome according to age. The Journal ofTrauma 2005; 58: 342–345.
28 Lim H, Hoffmann R, Brasel K. Factors influencing discharge location afterhospitalization resulting from a traumatic fall among older persons. TheJournal of Trauma 2007; 63: 902–907.
29 Mathers C, Penm R. Health System Costs of Injury, Poisoning and Mus-culoskeletal Disorders in Australia, 1993–94. Canberra: AIHW, 1999.
30 Risso J, Baker D, Mcavay G, Tinetti M. The cost-effectiveness of amultifactorial targeted prevention program for falls among communityelderly persons. Medical Care 1996; 34: 954–969.
A g e d i f f e r e n c e s i n f a l l i n j u r i e s
125Australasian Journal on Ageing, Vol 29 No 3 September 2010, 117–125© 2010 The AuthorsJournal compilation © 2010 ACOTA