Embed Size (px)
Citation preview
letter
nature genetics • volume 31 • june 2002 205
Age distribution of human gene families showssignificant roles of both large- and small-scaleduplications in vertebrate evolution
Xun Gu1,2, Yufeng Wang1–3 & Jianying Gu1,2
1Department of Zoology and Genetics and 2LHB Center for Bioinformatics and Biological Statistics, Iowa State University, Ames, Iowa 50011, USA.3Department of Bioinformatics, American Type Culture Collection (ATCC), Manassas, Virginia, USA. Correspondence should be addressed to X.G. (e-mail:[email protected]).
The classical (two-round) hypothesis1 of vertebrate genomeduplication proposes two successive whole-genome duplica-tion(s) (polyploidizations) predating the origin of fishes, a viewnow being seriously challenged2–7. As the debate largely con-cerns the relative merits of the ‘big-bang mode’ theory8–13
(large-scale duplication) and the ‘continuous mode’ theory(constant creation by small-scale duplications)2–7,14, we testedwhether a significant proportion of paralogous genes in thecontemporary human genome was indeed generated in theearly stage of vertebrate evolution. After an extensive searchof major databases, we dated 1,739 gene duplication eventsfrom the phylogenetic analysis of 749 vertebrate gene families.We found a pattern characterized by two waves (I, II) and anancient component. Wave I represents a recent gene familyexpansion by tandem or segmental duplications15, whereaswave II, a rapid paralogous gene increase in the early stage ofvertebrate evolution, supports the idea of genome duplica-tion(s) (the big-bang mode). Further analysis indicated thatlarge- and small-scale gene duplications both make a signifi-cant contribution during the early stage of vertebrate evolu-tion to build the current hierarchy of the human proteome.
Ohno’s hypothesis of two-rounds of genome duplication1 inearly vertebrates has recently become widely accepted because itseems to explain why vertebrates have four HOX gene clusterswhereas invertebrates have only one10,16. The impact of this pat-tern of duplication on vertebrate development has been exten-sively discussed10–16. But the first draft of the human genomesequence6,7 contains no conclusive evidence for these hypotheti-cal genome duplications—for example, no pervasive duplicatedchromosome blocks as are seen in yeast or Arabidopsis thaliana3.Although these phenomena can be explained as being the conse-quence of rapid chromosome rearrangements and gene lossesafter genome duplications8, this raises the question of whetherlarge-scale duplication(s) occurred in the early stages of verte-brate evolution2,3,6–7,9.
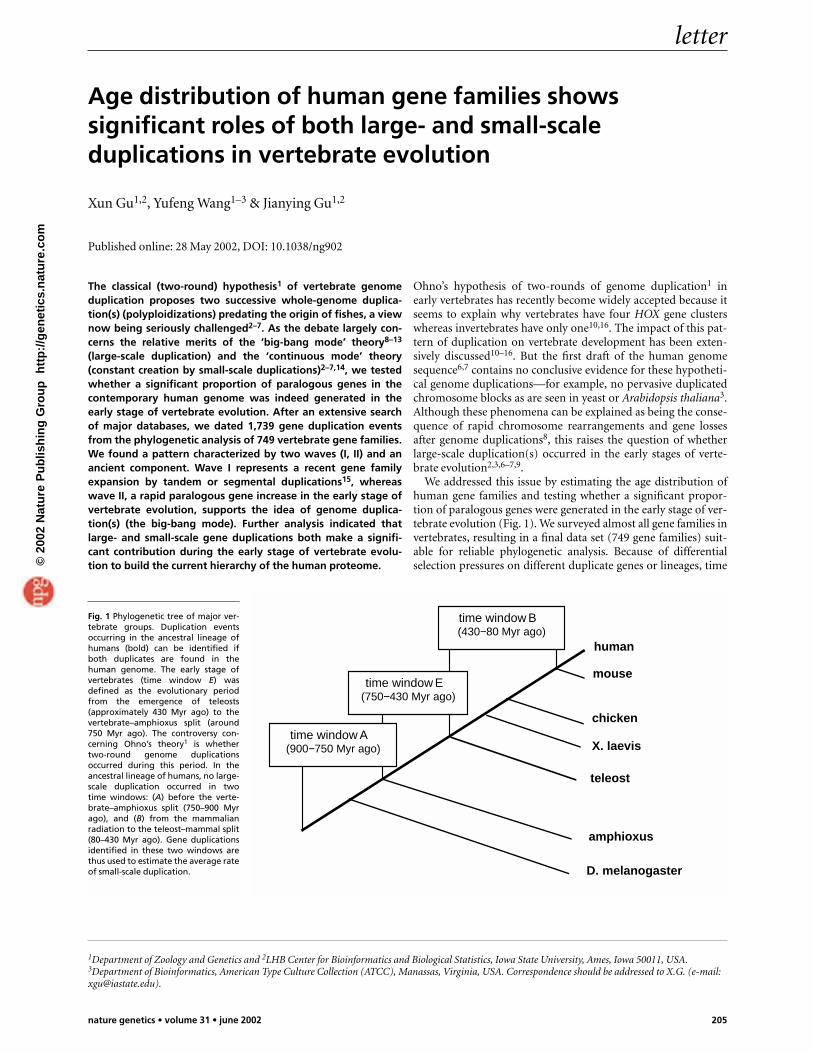
We addressed this issue by estimating the age distribution ofhuman gene families and testing whether a significant propor-tion of paralogous genes were generated in the early stage of ver-tebrate evolution (Fig. 1). We surveyed almost all gene families invertebrates, resulting in a final data set (749 gene families) suit-able for reliable phylogenetic analysis. Because of differentialselection pressures on different duplicate genes or lineages, time
Published online: 28 May 2002, DOI: 10.1038/ng902
X. laevis
human
mouse
chicken
teleost
amphioxus
D. melanogaster
time window A(900−750 Myr ago)
time window E(750−430 Myr ago)
time window B(430−80 Myr ago)
Fig. 1 Phylogenetic tree of major ver-tebrate groups. Duplication eventsoccurring in the ancestral lineage ofhumans (bold) can be identified ifboth duplicates are found in thehuman genome. The early stage ofvertebrates (time window E) wasdefined as the evolutionary periodfrom the emergence of teleosts(approximately 430 Myr ago) to thevertebrate–amphioxus split (around750 Myr ago). The controversy con-cerning Ohno’s theory1 is whethertwo-round genome duplicationsoccurred during this period. In theancestral lineage of humans, no large-scale duplication occurred in two time windows: (A) before the verte-brate–amphioxus split (750–900 Myrago), and (B) from the mammalianradiation to the teleost–mammal split(80–430 Myr ago). Gene duplicationsidentified in these two windows arethus used to estimate the average rateof small-scale duplication.
©20
02 N
atu
re P
ub
lish
ing
Gro
up
h
ttp
://g
enet
ics.
nat
ure
.co
m
letter
206 nature genetics • volume 31 • june 2002
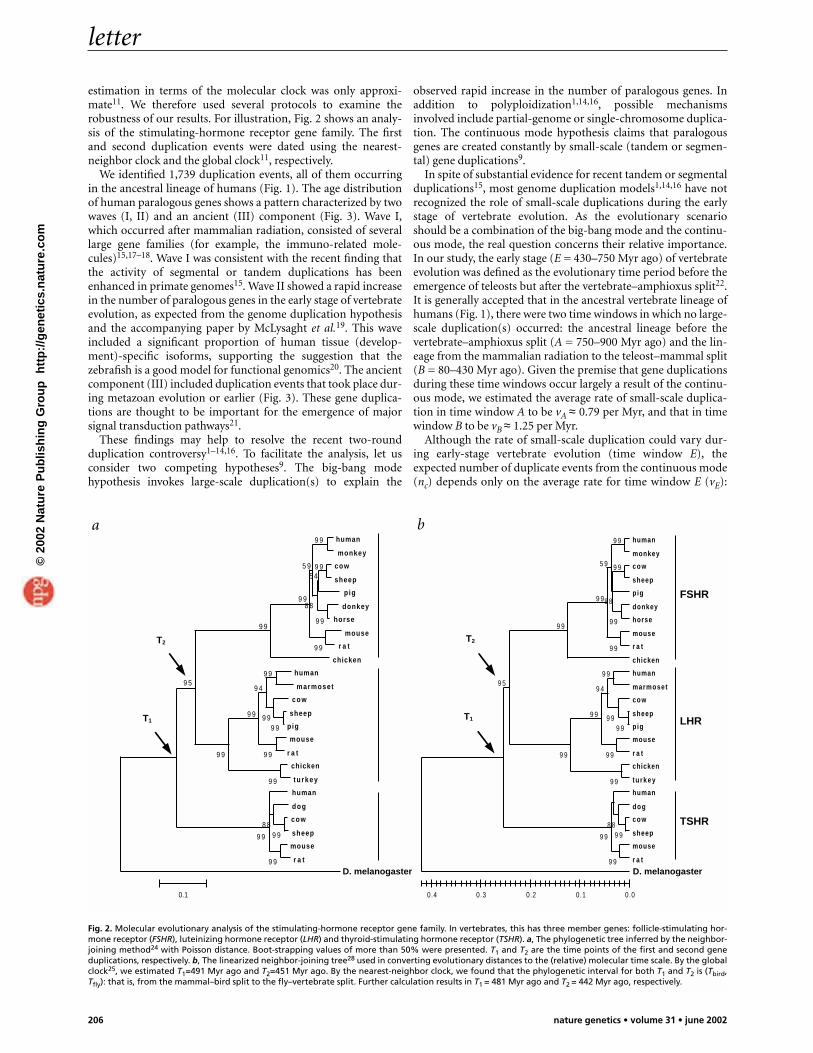
estimation in terms of the molecular clock was only approxi-mate11. We therefore used several protocols to examine therobustness of our results. For illustration, Fig. 2 shows an analy-sis of the stimulating-hormone receptor gene family. The firstand second duplication events were dated using the nearest-neighbor clock and the global clock11, respectively.
We identified 1,739 duplication events, all of them occurringin the ancestral lineage of humans (Fig. 1). The age distributionof human paralogous genes shows a pattern characterized by twowaves (I, II) and an ancient (III) component (Fig. 3). Wave I,which occurred after mammalian radiation, consisted of severallarge gene families (for example, the immuno-related mole-cules)15,17–18. Wave I was consistent with the recent finding thatthe activity of segmental or tandem duplications has beenenhanced in primate genomes15. Wave II showed a rapid increasein the number of paralogous genes in the early stage of vertebrateevolution, as expected from the genome duplication hypothesisand the accompanying paper by McLysaght et al.19. This waveincluded a significant proportion of human tissue (develop-ment)-specific isoforms, supporting the suggestion that thezebrafish is a good model for functional genomics20. The ancientcomponent (III) included duplication events that took place dur-ing metazoan evolution or earlier (Fig. 3). These gene duplica-tions are thought to be important for the emergence of majorsignal transduction pathways21.
These findings may help to resolve the recent two-roundduplication controversy1–14,16. To facilitate the analysis, let usconsider two competing hypotheses9. The big-bang modehypothesis invokes large-scale duplication(s) to explain the
observed rapid increase in the number of paralogous genes. Inaddition to polyploidization1,14,16, possible mechanismsinvolved include partial-genome or single-chromosome duplica-tion. The continuous mode hypothesis claims that paralogousgenes are created constantly by small-scale (tandem or segmen-tal) gene duplications9.
In spite of substantial evidence for recent tandem or segmentalduplications15, most genome duplication models1,14,16 have notrecognized the role of small-scale duplications during the earlystage of vertebrate evolution. As the evolutionary scenarioshould be a combination of the big-bang mode and the continu-ous mode, the real question concerns their relative importance.In our study, the early stage (E = 430–750 Myr ago) of vertebrateevolution was defined as the evolutionary time period before theemergence of teleosts but after the vertebrate–amphioxus split22.It is generally accepted that in the ancestral vertebrate lineage ofhumans (Fig. 1), there were two time windows in which no large-scale duplication(s) occurred: the ancestral lineage before thevertebrate–amphioxus split (A = 750–900 Myr ago) and the lin-eage from the mammalian radiation to the teleost–mammal split(B = 80–430 Myr ago). Given the premise that gene duplicationsduring these time windows occur largely a result of the continu-ous mode, we estimated the average rate of small-scale duplica-tion in time window A to be vA ≈ 0.79 per Myr, and that in timewindow B to be vB ≈ 1.25 per Myr.
Although the rate of small-scale duplication could vary dur-ing early-stage vertebrate evolution (time window E), theexpected number of duplicate events from the continuous mode(nc) depends only on the average rate for time window E (vE):
D. melanogaster D. melanogaster
FSHR
LHR
TSHR
cow
sheep
pig
donkey
horse
human
monkey
mouse
r a t
chicken
chicken
t u r k e y
cow
pig
sheep
marmoset
human
mouse
r a t
cow
sheep
dog
human
mouse
r a t
9 9
9 9
8 8
9 9
9 9
9 9
9 9
9 9
9 9
9 4
9 9
9 9
9 5
9 9
9 9
9 9
9 9
9 9
9 9
5 9
8 8
5 4
0.1
cow
sheep
pig
donkey
horse
human
monkey
mouse
r a t
chicken
chicken
t u r k e y
cow
pig
sheep
marmoset
human
mouse
r a t
cow
sheep
dog
human
mouse
r a t
9 9
9 9
8 8
9 9
9 9
9 9
9 9
9 9
9 9
9 4
9 9
9 9
9 5
9 9
9 9
9 9
9 9
9 9
9 9
5 9
8 8
0.00.10.20.30.4
T1
T2
T1
T2
Fig. 2. Molecular evolutionary analysis of the stimulating-hormone receptor gene family. In vertebrates, this has three member genes: follicle-stimulating hor-mone receptor (FSHR), luteinizing hormone receptor (LHR) and thyroid-stimulating hormone receptor (TSHR). a, The phylogenetic tree inferred by the neighbor-joining method24 with Poisson distance. Boot-strapping values of more than 50% were presented. T1 and T2 are the time points of the first and second geneduplications, respectively. b, The linearized neighbor-joining tree28 used in converting evolutionary distances to the (relative) molecular time scale. By the globalclock25, we estimated T1=491 Myr ago and T2=451 Myr ago. By the nearest-neighbor clock, we found that the phylogenetic interval for both T1 and T2 is (Tbird,Tfly): that is, from the mammal–bird split to the fly–vertebrate split. Further calculation results in T1 = 481 Myr ago and T2 = 442 Myr ago, respectively.
a b
©20
02 N
atu
re P
ub
lish
ing
Gro
up
h
ttp
://g
enet
ics.
nat
ure
.co
m

thus nc = vE × TE, where TE = 750−430 = 320Myr. Because these three time windows (B, Eand A) are adjacent, we assumed that vE wouldnot have differed greatly from the average rateof time window A or B, or vE ≈ 0.79–1.25 perMyr. It follows that, in the early (E) stage of ver-tebrate evolution, the expected number ofduplication events arising from the continuousmode is 254–438, which is 30–52% of the totalnumber (847) of duplication events. Notably,this indicates that during the early stage of ver-tebrate evolution, the big-bang mode and con-tinuous mode both made a significantcontribution to building the hierarchy of verte-brate gene families.
Our study used about one-quarter of humangene families17, which contains the largest num-ber of vertebrate gene families that can be usedfor estimating the molecular time scale of dupli-cation events. Gene families were excluded mostly because theylacked orthologous genes. We extensively examined the robustnessof the estimated age distribution of gene families. The size distrib-ution of gene families (Fig. 4a) was almost identical to that of thehuman genome sequence6. The coefficient of correlation betweentime estimates by the nearest-neighbor clock or global clock was0.93, with the average difference being approximately 5% (Fig. 4b).The cumulative age distributions estimated by these two methodswere similar (Fig. 4c), indicating that the phylogenies were gener-ally consistent with the molecular clock dating. In addition, the useof different calibration systems, including fossil data, evolutionarydistances and speciation events, had almost no effect on the shapeof the age distribution (Fig. 3), although a marginal shift in the
time scale (of 2–5% on average) was observed. For example, arapid increase in the number of duplicate genes was always seen,regardless of whether the vertebrate–Drosophila split was used forcalibration (Fig. 4d).
Although long-term vertebrate evolution may have erasedmany historical details, our study suggests a plausible evolution-ary scenario. Since the origin of chordates, small-scale (tandemand segmental) duplications have provided a continuous flux tocreate new paralogous genes. Before the mammalian radiation,the average rate of small-scale duplications was about three to fiveevents per genome per million years (assuming that a quarter ofhuman gene families are included). More recently (in mammalsor primates), this rate may have increased up to approximately 10
events per genome per million years(calculated from wave I), which is con-sistent with the previous estimate madeusing a different approach23. In the earlystage of vertebrate evolution, large-scaleduplication(s) had a substantial impacton the evolution of tissue specificity.Overall, both mechanisms (continuousand big-bang) have made significantcontributions to the contemporary hier-archy of human gene families.
Fig. 4 Robustness of the age distribution ofhuman paralogous genes. a, Size distribution of707 gene families used in the current study,which is similar to that in ref. 6. b, Linear regres-sion of 1,708 duplication time estimatesbetween the nearest-neighbor clock and theglobal clock. The coefficient of correlation is0.93. c, Cumulative distribution of the age distri-bution estimated by nearest-neighbor clock orglobal clock was very similar. d, Cumulative dis-tributions estimated from a subset (283 genefamilies). The bold curve uses the inferredorthologous gene in fruit fly as a calibration, asthis seems to be more sigmoid-shaped than thecurve seen when sequences from fruit fly areexcluded. Nevertheless, they share a qualita-tively similar pattern.
Fig. 3 Age distribution of human gene families. The molec-ular time scale is measured as Myr ago. Each bin for the his-togram is 50 Myr, except for the most ancient one (>1,000Myr ago). The relative positions of several major speciationevents in the time scale are indicated. 1 Byr, 1 billion years(1,000 Myr).
letter
nature genetics • volume 31 • june 2002 207
0
50
100
150
50 150
250
350
450
550
650
750
850
950
1,050
1,150
>1,200
molecular time scale (Myr ago)
age
dist
ribu
tion
of h
uman
gen
e fa
mili
esfly–vertebrate split
amphioxus–teleost splittetrapod–teleost split
mammal–bird split
mammal radiation
I II
0
20
40
60
80
1.0–1.5
1.5–2.0
2.0–2.5
2.5–3.0
3.0–3.5
>3.5
time (Byr ago)
III
R = 0.93
0
2,000
4,000
6,000
0 2,000 4,000 6,000
nearest neighbor clock (Myr ago)
glob
al c
lock
(Myr
ago
)
0
0.2
0.4
0.6
0.8
1
0 500 1,000 1,500
molecular time scale (Myr ago)
cum
ulat
ive
func
tion
0
100
200
300
400
2 3 4 5 6 7 8 9 10 11+
number of paralogous genes
num
ber
of fa
mili
es
0
0.2
0.4
0.6
0.8
1
0 500 1,000 1,500
molecular time scale (Myr ago)
cum
ulat
ive
func
tion
a b
c d
©20
02 N
atu
re P
ub
lish
ing
Gro
up
h
ttp
://g
enet
ics.
nat
ure
.co
m
letter
208 nature genetics • volume 31 • june 2002
The new model can be simply expressed as mR + C: that is, mround large-scale duplication(s) plus continuous small-scale cre-ations. Any notion implying m = 0 or C = 0 is not sufficient toexplain the data (Fig. 3). The hypothesis of multiple rounds (m = 3or more) seems unnecessary because the inconsistent phylogeneticpattern9 can be easily explained by the steady flux of small-scaleduplications. Although our data showed a significant proportion ofgene families with three or four members generated 430–750 Myrago, we are cautious about whether 2R + C, a natural extension ofthe classical two-round (2R) model, provides a better interpreta-tion than the more parsimonious 1R + C model. We are developinga model-based likelihood ratio test to determine whether m = 1 issufficient (data not shown). To resolve these questions, it will benecessary to sequence the genomes of a wide variety of vertebratesand to identify genome duplication(s) in other vertebrate branches,such as the teleosts or frogs3.
MethodsData collection and mining. We constructed a data-mining pipeline tofind all vertebrate gene families suitable for use in estimating the age distri-bution of duplications. Amino-acid sequences of more than 3,000 verte-brate gene families were obtained from the HOVERGEN databases(http://pbil.univ-lyon1.fr/), each of which have at least two human homol-ogous genes (see Web Table A online for details of the gene families stud-ied). We then excluded redundant sequences by a procedure combiningmultiple alignment24, phylogenetic analysis25 and a literature search.Amino-acid sequences used in Fig. 2 are derived from fam000474 (HOV-ERGENE) for vertebrate genes and from AAB07030 (GenBank) for theD. melanogaster gene. Two X. laevis genes (AJ249845 and AJ249846) werenot included because of their short sequence length, but the resultremained virtually the same if they were used (data not shown).
Next, we excluded a gene family from further analysis if it containedonly mammal sequences and the duplication event(s) was very ancient.This rule is based on previous experience indicating that dating ancientduplication events using only mammals for calibration is highlyunreliable11,26–28. The cut-off point was defined according to the averageratio (z) of paralogous distance to orthologous distance (for example,human/mouse). A gene duplication is excluded if z > 5.5, roughly corre-sponding to the duplication event that occurred before the teleost–tetrapod split. When the cutoff varied between 4 and 7, the difference mar-gin was approximately ±2%. We obtained 979 gene families meeting thesecriteria. We also searched for invertebrate homologues (typicallyDrosophila melanogaster and Caenorhabditis elegans) by BLAST-P analysis.We identified by phylogenetic analysis the potential D. melanogasterorthologs of approximately 41% of gene families assessed. C. eleganshomologs were found in approximately the same amount of assessed genefamilies, but these sequences were not used for estimating the age distribu-tion of gene families because the divergence time between nematode andvertebrate is unclear.
Inference of duplication events. Based on the inferred phylogeny, we iden-tified subfamilies in each gene family, along with the corresponding dupli-cation events (Fig. 2). Vertebrate genes in the same subfamily of the humangene (boot-strapping value >60%) were considered orthologous. To mini-mize the error rate, we excluded gene families when the gene tree of thesubfamily was sharply in conflict with the uncontested vertebrate phyloge-ny. We believe that the effect of orthologous misidentification has beenreduced to a minimum.
In the final data set with 749 gene families, we identified 1,739 duplica-tion events. Among the 2,488 orthologous subfamilies, 100% includedhuman and at least one other mammal (91% rodents) sequences, 35% hadbird sequences, 31% frog, 28% teleost and 41% D. melanogaster.
Estimation of molecule time scale. In the global clock method26, a lin-earized neighbor-joining tree29 is used to convert the (average) Poissondistance of protein sequences to the molecular time scale. We adoptedprimate–rodent (80 Myr ago), mammal–bird (310 Myr ago),mammal–amphibian (350 Myr ago), tetrapod–teleost (430 Myr ago) andvertebrate–Drosophila splits (830 Myr ago)16 for the calibrations.
Applying the nearest-neighbor clock involved two steps. First, we deter-mined the phylogenetic interval of a duplicate event by the closest specia-tion(s). ‘(Teleost–tetrapod, Drosophila–vertebrate)’, for example, meantthat a duplication event occurred before the teleost–tetrapod split but afterthe Drosophila–vertebrate split. This information can be one sided, forexample ‘(teleost-tetrapod, ?)’; where there are insufficient sequence data.The phylogenetic interval is only based on the topology. Thus, as long asthe phylogeny is largely correct, it is robust with respect to non-constantevolutionary rate caused by differential selective constraints in genes andlineages. Second, we estimated the age of the duplication event from the(fossil record) calibrations of the phylogenetic interval, taking an average ifthere were multiple fossil-record data points (Fig. 2).
Statistical error and sampling bias. Gene families selected for our studywere required to meet some criteria for the reliable estimation of duplica-tion time. As described above, the selection procedure was applied careful-ly to minimize any potential sampling bias. We examined gene families thatwere not selected and found no evidence for systematic bias against eitherancient or recent gene duplications. For example, for gene families thatwere excluded in the third round, the ratio of paralogous to orthologous(human/rodent) distances was randomly distributed (data not shown).
Some gene families have dramatically expanded in primates6,7,15,17 bytandem or segmental duplications, which may be subject to gene conver-sion or recombination18. Dating these very recent duplication events,many occurring less than 10 Myr ago, could be problematic, although thiseffect would be considerably reduced for ancient gene duplications.
Consistent with previous results11, the uncertainty of some vertebratefossil records had a marginal effect on the time estimation of duplicateevents. The overall difference between the global and nearest-neighborclocks was small (Fig. 4), indicating that the phylogenies of gene familieswere generally consistent with the estimates of gene age. Using other mea-sures of distance (for example PAM (Accepted Point Mutation) or(gamma) distance)26–28 resulted in age distributions of the same shapewith a small shift (<5%) in time scale.
We did not use synonymous distance (the S-clock), for two reasons.First, the S-clock is highly unreliable for ancient gene duplications becauseof fast saturation when S >1 (refs 23,30). Second, the S-clock23 is usuallyused with the assumption of a constant synonymous rate across genes,neglecting variations as large as tenfold among genes.
After gene (genome) duplication, the preservation of duplicates may begene (locus)–specific as a result of functional specificity. To test whetherthis would affect our results, we classified gene families into transcriptionfactors (15%), signal transduction–related (20%), cell/development-related (35%), basic metabolic (19%) and others (11%), and found no evi-dence for different percentages of functional categories in the threeadjacent time periods. We therefore concluded that this problem may notbe very serious.
Note: Supplementary information is available on the NatureGenetics website.
AcknowledgmentsWe thank W.H. Li and W. Nordstrom for their comments. This study issupported by an NIH grant to X.G. X.G. is the 2001 DuPont Young Professor.
Competing interests statementThe authors declare that they have no competing interests.
Received 10 April; accepted 2 May 2002
1. Ohno, S. Evolution by Gene Duplication (George Allen and Unwin, London,1970).
2. Hughes, A.L. Phylogenies of developmentally important proteins do not supportthe hypothesis of two rounds of genome duplication early in vertebrate history. J.Mol. Evol. 48, 565–576 (1999).
3. Wolfe, K.H. Yesterday’s polyploids and the mystery of diploidization. Nature RevGenet 2, 333–341 (2001).
4. Meyer, A. & Schartl, M. Gene and genome duplications in vertebrates: the one-to-four (-to-eight in fish) rule and the evolution of novel gene functions. Curr. Opin.Cell Biol. 11, 699–704 (1999).
5. Martin, A. Is tetralogy true? Lack of support for the ‘one-to-four rule’. Mol. Biol.Evol. 18, 89–93 (2001).
©20
02 N
atu
re P
ub
lish
ing
Gro
up
h
ttp
://g
enet
ics.
nat
ure
.co
m
letter
nature genetics • volume 31 • june 2002 209
6. Lander, E.S. et al. Initial sequencing and analysis of the human genome. Nature409, 860–921 (2001).
7. Venter, J.C. et al. The sequence of the human genome. Science 291, 1304–1351(2001).
8. Nadeau, J.H. & Sankoff, D. Comparable rates of gene loss and functionaldivergence after genome duplications early in vertebrate evolution. Genetics147, 1259–1266 (1997).
9. Hughes, A.L., da Silva, J. & Friedman, R. Ancient genome duplications did notstructure the human Hox-bearing chromosomes. Genome Res. 11, 771–780 (2001).
10. Schughart, K., Kappen, C. & Ruddle, F.H. Duplication of large genomic regionsduring the evolution of vertebrate homeobox genes. Proc. Natl Acad. Sci. USA 86,7067–7071 (1989).
11. Wang, Y. & Gu, X. Evolutionary patterns of gene families generated in the earlystage of vertebrates. J. Mol. Evol. 51, 88–96 (2000).
12. Lundin, L.G. Evolution of the vertebrate genome as reflected in paralogouschromosomal regions in man and the house mouse. Genomics 16, 1–19 (1993).
13. Lopreato, G.F. et al. Evolution and divergence of sodium channel genes invertebrates. Proc. Natl Acad. Sci. USA 98, 7588–7592 (2001).
14. Spring, J. Vertebrate evolution by interspecific hybridization—are we polyploid?FEBS Lett. 400, 2–8 (1997).
15. Eichler, E.E. Recent duplication, domain accretion and the dynamic mutation ofthe human genome. Trends Genet. 17, 661–669 (2001).
16. Sidow, A. Gen(om)e duplications in the evolution of early vertebrates. Curr. Opin.Genet. Dev. 6, 715–722 (1996).
17. Li, W.H., Gu, Z., Wang, H. & Nekrutenko, A. Evolutionary analyses of the humangenome. Nature 409, 847–849 (2001).
18. Nei, M., Gu, X. & Stinikova, T. Evolution by the birth-and-death process inmultigene families of the vertebrate immune system. Proc. Natl Acad. Sci. USA.94, 7799–7806 (1997).
19. McLysaght, A., Hokamp, K. & Wolfe, K.H. Extensive genomic duplication during
early chordate evolution. Nature Genet. 31, 200–204 (2002); advance onlinepublication, 28 May 2002 (DOI:10.1038/ng884).
20. Fishman, M.C. Genomics. Zebrafish—the canonical vertebrate. Science 294,1290–1291 (2001).
21. Iwabe, N., Kuma, K. & Miyata, T. Evolution of gene families and relationship withorganismal evolution: rapid divergence of tissue-specific genes in the earlyevolution of chordates. Mol. Biol. Evol. 13, 483–493 (1996).
22. Nikoh, N. et al. An estimate of divergence time of Parazoa and Eumetazoa andthat of Cephalochordata and Vertebrata by aldolase and triose phosphateisomerase clocks. J. Mol. Evol. 45, 97–106 (1997).
23. Lynch, M. & Conery, J.S. The evolutionary fate and consequences of duplicategenes. Science 290, 1151–1155 (2000).
24. Thompson, J.D., Higgins, D.G. & Gibson, T.J. CLUSTAL W: improving the sensitivityof progressive multiple sequence alignment through sequence weighting,position-specific gap penalties and weight matrix choice. Nucleic Acids Res. 22,4673–4680 (1994).
25. Saitou, N. & Nei, M. The neighbor-joining method: a new method forreconstructing phylogenetic trees. Mol. Biol. Evol. 4, 406–425 (1987).
26. Gu, X. Early metazoan divergence was about 830 million years ago. J. Mol. Evol.47, 369–371 (1998).
27. Kumar, S. & Hedges, S.B. A molecular timescale for vertebrate evolution. Nature392, 917–920 (1998).
28. Nei, M., Xu, P. & Glazko, G. Estimation of divergence times from multiproteinsequences for a few mammalian species and several distantly related organisms.Proc. Natl Acad. Sci. USA 98, 2497–2502 (2001).
29. Takezaki, N., Rzhetsky, A. & Nei, M. Phylogenetic test of the molecular clock andlinearized trees. Mol. Biol. Evol. 12, 823–833 (1995).
30. Long, M. et al. Gene duplication and evolution [Technical Comments]. Science293, 1551 (2001).
©20
02 N
atu
re P
ub
lish
ing
Gro
up
h
ttp
://g
enet
ics.
nat
ure
.co
m