Embed Size (px)
Citation preview

Age Related Changes in Balance and Gait
by
Shruthi Balasubramanian
A Thesis Presented in Partial Fulfillment
of the Requirements for the Degree
Master of Science
Approved April 2014 by the
Graduate Supervisory Committee:
Narayanan Krishnamurthi, Co-Chair
James Abbas, Co-Chair
Christopher Buneo
ARIZONA STATE UNIVERSITY
May 2014

i
ABSTRACT
Gait and balance disorders are the second leading cause of falls in the elderly.
Investigating the changes in static and dynamic balance due to aging may provide a
better understanding of the effects of aging on postural control system. Static and
dynamic balances were evaluated in a total of 21 young (21-35 years) and 22 elderly
(50-75 years) healthy subjects while they performed three different tasks: quiet
standing, dynamic weight shifts, and over ground walking. During the quiet standing
task, the subjects stood with their eyes open and eyes closed. When performing
dynamic weight shifts task, subjects shifted their Center of Pressure (CoP) from the
center target to outward targets and vice versa while following real-time feedback of
their CoP. For over ground walking tasks, subjects performed Timed Up and Go test,
tandem walking, and regular walking at their self-selected speed. Various
quantitative balance and gait measures were obtained to evaluate the above
respective balance and walking tasks. Total excursion, sway area, and mean
frequency of CoP during quiet standing were found to be the most reliable and
showed significant increase with age and absence of visual input. During dynamic
shifts, elderly subjects exhibited higher initiation time, initiation path length,
movement time, movement path length, and inaccuracy indicating deterioration in
performance. Furthermore, the elderly walked with a shorter stride length, increased
stride variability, with a greater turn and turn-to-sit durations. Significant
correlations were also observed between measures derived from the different
balance and gait tasks. Thus, it can be concluded that aging deteriorates the postural
control system affecting static and dynamic balance and some of the alterations in
CoP and gait measures may be considered as protective mechanisms to prevent loss
of balance.
ii
DEDICATION
I would like to dedicate this thesis to my mother, Latha and father, Balasubramanian
for their unconditional love, support, and encouragement throughout my journey. I
would also like to dedicate it to my sister Cheentu whose endless phone
conversations have always lightened me up. I am grateful to my aunts and uncles in
the US Prema, Venkat, Ramesh, and Shanthi, for providing valuable advice and
making my transition to the US simpler.
I would like to thank my friends from ASU, Janani, Sunanda, Yamuna, Varsha,
Swathi, Meryl, Jeremy, and Cathy who have been my family away from home. I also
wish to thank my close friends outside of ASU, Madhumitha, Swetha, Mithra, Mani,
and Karthik who have always stood by my side and motivated me.

iii
ACKNOWLEDGMENTS
I would like to thank my advisors Dr. James Abbas and Dr. Narayanan Krishnamurthi
for believing in me and providing me the opportunity to work on this research
project. This thesis would not have been possible without their guidance and
support. Their words of advice and encouragement have always been a source of
inspiration to pursue research and achieve more. It has been a wonderful learning
experience. I would also like to thank Dr. Christopher Buneo for being a part of my
thesis committee.
I am also thankful to my friends Cathy and Jeremy for providing valuable
suggestions to improve my research.
I would like to express my gratitude to the Statistical Consulting Center at ASU for
providing valuable inputs and improvements for my research work.
I also thank Ms. Laura Hawes, my graduate advisor for helping me throughout the
defense scheduling process.

iv
TABLE OF CONTENTS
Page
LIST OF TABLES .................................................................................................. vi
LIST OF FIGURES ............................................................................................... vii
LIST OF SYMBOLS / NOMENCLATURE ...................................................................viii
CHAPTER
1 INTRODUCTION ................. ..................................................................... 1
Significance of the study ........................................................................ 1
Postural control system overview ........................................................... 2
Purpose of the study ............................................................................. 4
Thesis outline ....................................................................................... 5
2 EFFECTS OF AGING ON QUIET STANDING ................................................. 6
Background .......................................................................................... 6
Modeling the postural control system during quiet stance ............... 6
Inverted pendulum model ................................................. 6
Internal models of quiet stance ......................................... 8
Center of Pressure analysis ......................................................... 9
Traditional analysis ........................................................ 10
Statistical mechanics ...................................................... 11
Quiet standing balance control in the elderly ............................... 12
Methodology ...................................................................................... 14
Subjects .................................................................................. 14
Experimental protocol ............................................................... 15
Force platform and data collection setup ..................................... 16
Center of Pressure calculation .................................................... 16
Data analysis ........................................................................... 17
v
CHAPTER Page
Sway area ..................................................................... 18
Resultant distance .......................................................... 18
Mean distance ............................................................... 18
RMS distance ................................................................. 18
Total excursion .............................................................. 18
Mean velocity ................................................................ 19
95% confidence area ellipse ............................................ 19
95% confidence area circle ............................................. 19
Mean frequency ............................................................. 19
Statistical Analysis .................................................................... 20
Repeated measures analysis of variance ........................... 20
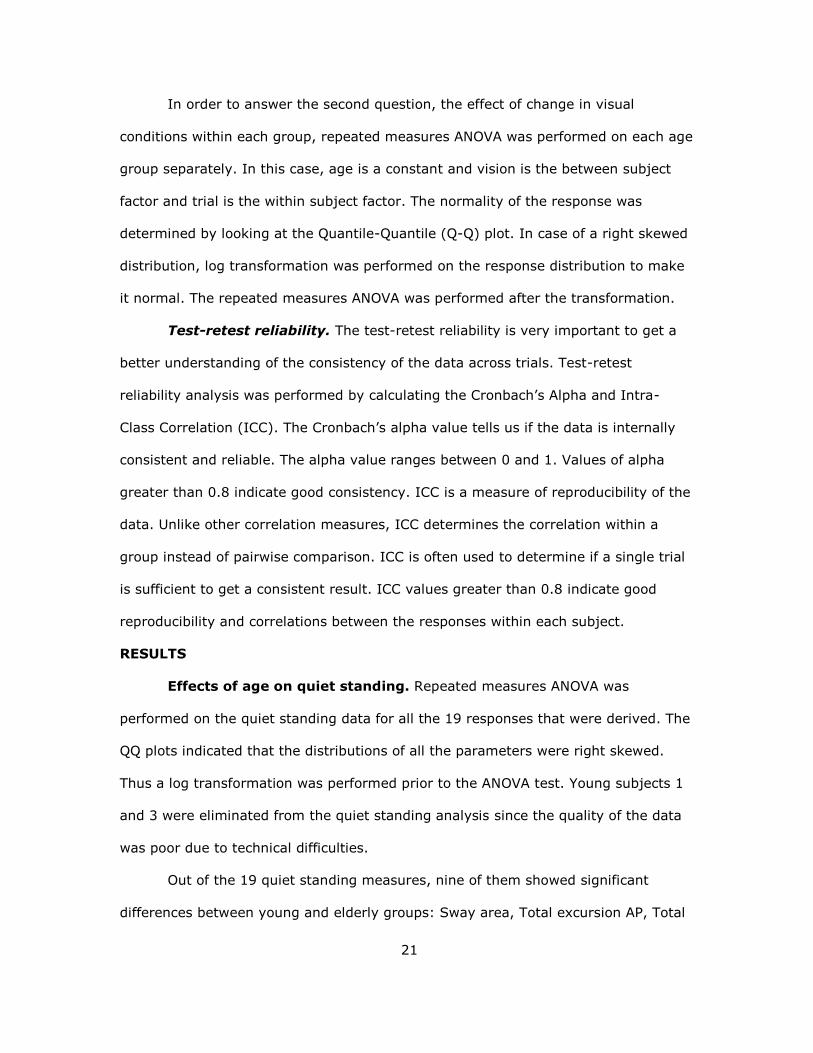
Test-retest reliability ...................................................... 21
Results .............................................................................................. 21
Effect of age on quiet standing ................................................... 21
Effect of visual information on quiet standing .............................. 22
Test-retest reliability ................................................................. 27
Discussion .......................................................................................... 28
3 EFFECTS OF AGING ON POSTURE SHIFTS ............................................... 32
Background ........................................................................................ 32
Methodology ...................................................................................... 34
Subjects .................................................................................. 34
Experimental protocol ............................................................... 34
Data analysis ..................................................................................... 35
Initiation phase ........................................................................ 37
Movement phase ...................................................................... 37
vi
CHAPTER Page
Hold phase .............................................................................. 37
Statistical analysis .............................................................................. 37
Repeated measures analysis of variance ..................................... 37
Test retest reliability ................................................................. 38
Results .............................................................................................. 38
Effects of age ........................................................................... 38
Effects of direction of targets ..................................................... 42
Test retest reliability ................................................................. 45
Discussion .......................................................................................... 46
4 EFFECTS OF AGING ON GAIT ................................................................. 49
Background ........................................................................................ 49
Gait phases ............................................................................. 50
Basic gait parameters ............................................................... 50
Functional assessment of gait .................................................... 51
Physiological effects of aging on gait .......................................... 51
Methodology ...................................................................................... 53
Subjects .................................................................................. 53
Experimental setup ................................................................... 54
Experimental protocol ............................................................... 54
Timed up and go test ..................................................... 54
Tandem walking test ...................................................... 54
Long walking test ........................................................... 56
Data Analysis ........................................................................... 56
Timed up and go measures ............................................. 56
Tandem walking ............................................................ 56
vii
CHAPTER Page
Long walking ................................................................ 56
Statistical analysis .................................................................... 57
Repeated measures analysis of variance ........................... 57
Results .................................................................................... 57
Timed up and go ............................................................ 57
Normal walking ............................................................. 59
Tandem walking ............................................................ 60
Discussion ............................................................................... 60
5 CORRELATION BETWEEN STANDING, POSTURE SHIFT AND GAIT ............... 64
Correlation between quiet standing and posture shift .............................. 64
Results .................................................................................... 64
Correlation between quiet standing and gait parameters ......................... 66
Results .................................................................................... 66
Correlation between posture shift and gait measures .............................. 67
Results .................................................................................... 67
6 CONCLUSIONS ..................................................................................... 69
REFERENCES.. .................................................................................................. 72
APPENDIX
A IRB APPROVAL FORM ............................................................................ 80
B DESCRIPTIVE STATISTICS ..................................................................... 82
viii
LIST OF TABLES
Table Page
2.1. Quiet standing measures that showed significant differences between the
young and elderly ................................................................................ 22
2.2. Quiet standing measures that showed significant difference between eyes
open and eyes closed conditions within young and elderly groups .............. 23
2.3. Test-retest reliability measures cronbach alpha and intraclass correlation
coefficient (ICC) for different quiet standing balance indices during eyes
open and eyes closed consitions in the young ......................................... 27
2.4. Test-retest reliability measures cronbach alpha and intraclass correlation
coefficient (ICC) for different quiet standing balance indices during eyes
open and eyes closed consitions in the young .......................................... 28
3.1. Posture shift parameters that showed signficant differences between young
and elderly groups ............................................................................... 42
3.2. Test-retest reliability measures cronbach alpha and intraclass correlation
coefficient (ICC) for different dynamic shift indices in the young and elderly
groups ................................................................................................. 45
4.1. Summary of all the gait measures considered to be compared across age
groups from instrumented timed up and go, normal walk and tandem walk
tests ................................................................................................... 55
5.1. Correlation strength between quiet standing measures during eyes open
and dynamic shifts measures ................................................................ 65
5.2. Correlation strength between quiet standing measures during eyes open
and gait measures ............................................................................... 66
5.3. Correlation strength between gait and dynamic shifts measures ................ 68
ix
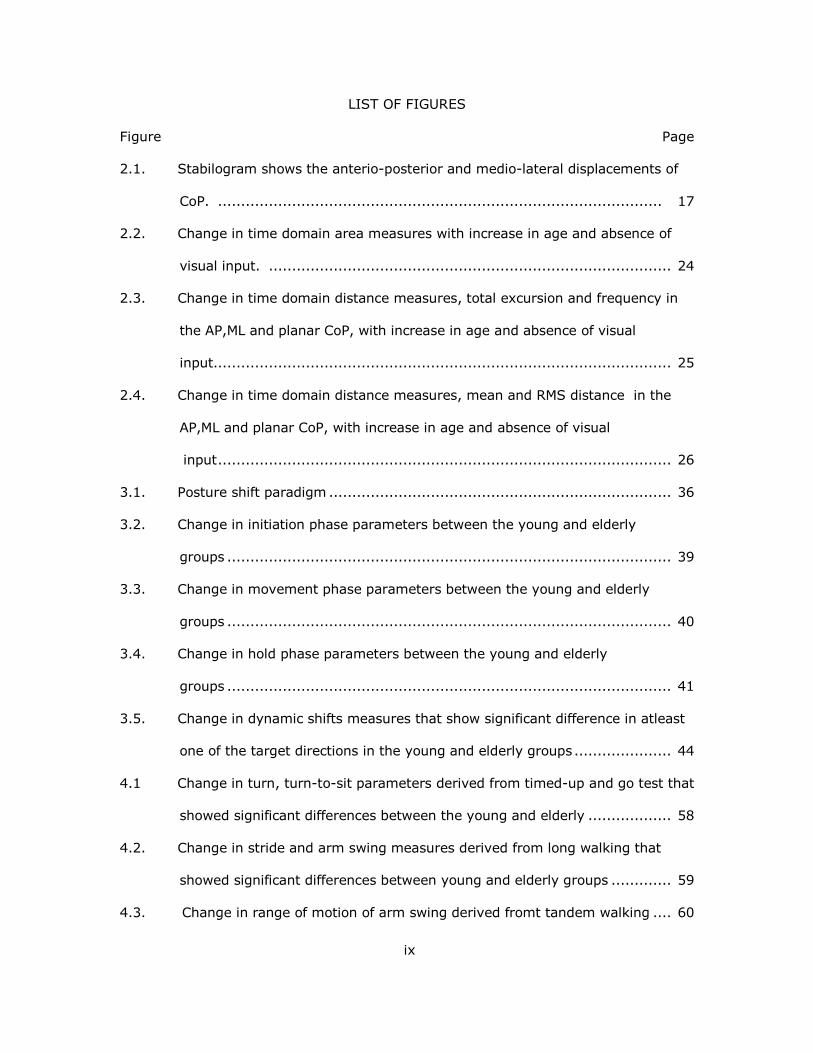
LIST OF FIGURES
Figure Page
2.1. Stabilogram shows the anterio-posterior and medio-lateral displacements of
CoP. ................................................................................................ 17
2.2. Change in time domain area measures with increase in age and absence of
visual input. ....................................................................................... 24
2.3. Change in time domain distance measures, total excursion and frequency in
the AP,ML and planar CoP, with increase in age and absence of visual
input................................................................................................... 25
2.4. Change in time domain distance measures, mean and RMS distance in the
AP,ML and planar CoP, with increase in age and absence of visual
input .................................................................................................. 26
3.1. Posture shift paradigm .......................................................................... 36
3.2. Change in initiation phase parameters between the young and elderly
groups ................................................................................................ 39
3.3. Change in movement phase parameters between the young and elderly
groups ................................................................................................ 40
3.4. Change in hold phase parameters between the young and elderly
groups ................................................................................................ 41
3.5. Change in dynamic shifts measures that show significant difference in atleast
one of the target directions in the young and elderly groups ..................... 44
4.1 Change in turn, turn-to-sit parameters derived from timed-up and go test that
showed significant differences between the young and elderly .................. 58
4.2. Change in stride and arm swing measures derived from long walking that
showed significant differences between young and elderly groups ............. 59
4.3. Change in range of motion of arm swing derived fromt tandem walking .... 60

1
CHAPTER 1
INTRODUCTION
SIGNIFICANCE OF THE STUDY
According to the World Health Organization, 424,000 falls that occurred
globally every year were fatal and more than 37.3 million falls led to injuries that
required medical attention. Reports also suggest that the risk of falling increases
with age and approximately one out of three persons older than 65 fall every year
(Tinetti, Speechley, & Ginter, 1988).
Apart from reducing the comfort and quality of life, falls are also a big burden
in healthcare. Injuries related to falls are one of the leading causes of
hospitalizations among the elderly, leading to higher healthcare costs. The most
common injuries related to falls include hip fractures, traumatic brain injuries and
pneumonia (Hartholt et al., 2010). Even a mild fall can have serious consequences in
the elderly due to their susceptibility to injury and age related physiological changes.
The causes of falls in the elderly are multi-fold and include visual disorders,
lower extremity weakness, gait and balance disorders, confusion, dizziness, syncope
etc. Amongst them, gait and balance disorders are the second major cause of falls,
resulting in threefold increase in fall risk (Jeffrey M.Hausdorff, 2005). Since multiple
causes lead to falling, there cannot be a single measure that is capable of detecting
its risk. Thus studying effects of aging on gait and balance disorders, the most
common cause of falls, is of primary importance.
In order to get a better insight into effect of aging on gait and balance, it is
important to study the response of various physiological systems and mechanisms in
controlling posture (Horak, 2006). A thorough understanding of such mechanisms
and compensatory strategies can further improve the treatment for fall prevention.
2
POSTURAL CONTROL SYSTEM - OVERVIEW
Bipedal locomotion, one of the unique key traits of the human species is made
possible by the highly evolved postural control system. The complex anatomical
structure of humans, including the precise shape and positioning of the vertebral
column enable us to expend relatively low levels of energy in musculoskeletal
activities such as standing and walking (Skoyles, 2006). Posture is defined as the
position of a body segment with respect to gravity. The two main goals of the control
system are to achieve erect standing and locomotion, and to maintain it during
activities of daily living (Skoyles, 2006).
The control of posture is termed as balance. Static balance is achieved when
the projection of the Center of Mass (CoM) lies within the base of support. It exists
only during quiet unperturbed standing. As a consequence of the accurate curves in
the lumbar and thoracic bones, the CoM lies within the base of support formed by
the feet ensuring static balance, during erect stance (Skoyles, 2006). However, any
perturbation or voluntary movement shifts the CoM outside the base of support
(Winter, Patla, Prince, Ishac, & Gielo-Perczak, 1998). More complex mechanisms are
adopted to achieve dynamic balance control. It is observed that the amount of time
required to regain balance through feedback control from the brain is longer than the
actual time for fall after CoM moves out of the base of support. This has led to the
assumption that the postural control system is continually at play, to initiate control
mechanisms well in advance (Morasso, Baratto, Capra, & Spada, 1999).
The postural control system is considered as a conglomeration of numerous
complex sensorimotor processes. The deterioration of any one of the sensory or
motor systems will have drastic effects on balance control. However, studies have
shown the presence of redundancy in the posture control system, such that the loss
3
of one of the sensory systems is compensated by the other systems (Winter, Patla, &
Frank, 1990). The three main sensory processes responsible for balance are:
Visual System: Provides information about the location of surroundings and object
with respect to the body.
Vestibular System: Senses position, linear accelerations, and rotational movements
of the head.
Proprioception: Provides information about self, or the relative position of different
parts of the body.
The sensory information from each of these systems is suitably weighted
based on the environmental and physiological factors; and subsequently integrated
to achieve balance control (Horak, 2006). The brain stem, cerebellum, and the
cerebral cortex are the primary neuroanatomical structures that form the posture
control system. Research on people suffering from balance and gait disorders due to
Parkinson’s disease suggests that the dopaminergic pathway of the basal ganglia
plays an important role in the integration and re-weighting of the sensory processes
(Cham, Perera, Studenski, & Bohnen, 2007). Further, studies on animals and
mammals indicate the importance of the cerebellum in coordination of the limb
movements to achieve balance (Morton & Bastian, 2004).
Epidemiological evidence shows that more than 50% of the falls in the elderly
occur during walking and activities of daily living (Barak, Wagenaar, & Holt, 2006).
Thus, it is important to study the postural control system during standing as well as
walking.
Usually, quantitative assessment of balance during quiet standing is
performed using force platform which measures the forces and moments in three
dimensions. Fall risk assessment in a clinical setting is carried out using the Limits of
Stability (LoS) test and the timed-up and go test (Hirase, Inokuchi, Matsusaka,
4
Nakahara, & Okita, 2014; Lemay et al., 2014; Salarian et al., 2010). Limits of
stability characterizes the maximum distance to which the subject can lean (sway)
without losing balance and the time taken to complete the task. On the other hand,
Timed up and go task involves three phases of movement: sit-to-stand, walking and
stand-to-sit. The total duration for completion of the task is taken as a balance
assessment measure. Even though these tests assess the risk of falling, they provide
limited information and do not quantify the cause or the underlying mechanism that
might be affecting postural control.
PURPOSE OF THIS STUDY
The specific aims of this thesis are three fold.
1. To study the effects of age and visual input on quiet standing.
2. To study the effects of age in performing dynamic postural weight shifts.
3. To investigate the age-related changes in over ground gait patterns.
The purpose of the study is to determine the effects of aging on balance
control. Many studies have looked at quiet standing and gait measures separately, in
the elderly. However, there haven’t been studies that have compared and correlated
the effects of age on static and dynamic balance measures.
Studying the response of the body to absence of visual input during quiet
standing will provide useful information on the type of compensatory mechanisms
used by young and elderly during loss of visual information. Analysis of gait patterns
during normal and tandem walking in the elderly will give insights into the effect of
aging on locomotion and dynamic balance control.
The dynamic shift paradigm (dynamic postural weight shifts) utilized in this
study is used to derive novel measures for improved balance evaluation. The task
consists of a series of weight shifts in different directions and mimics posture shifts
performed during some activities of daily living (ADL) such as reaching for an object
5
on a shelf. This task challenges the balance control system and attempts to extract
measures that will help in improved understanding of the response to such changes
in balance and efficient characterization of the effects of aging on balance control.
Correlations between the responses obtained from quiet standing, weight shifts, and
gait will help in better interpretation of the overall changes in balance control with
age.
In summary, this thesis will contribute additional information on age-related
balance and gait deficits in able-bodied adults, to the already existing literature. This
information will be useful in selecting the measures for fall-risk assessment in the
elderly and in the design of rehabilitation procedures for fall prevention.
THESIS OUTLINE
This thesis is organized based on the different tasks performed by the
subjects. Chapter 2 gives a detailed explanation about effect of age and visual input
on quiet standing. Chapter 3 explains the effect of aging on posture shifts and
Chapter 4 deals with effects of aging on gait. Chapter 5 discusses the correlations
between the quiet standing, gait and posture shift measures, and their significance.
Chapter 6 includes a discussion of the conclusions and potential applications.
6
CHAPTER 2
EFFECTS OF AGING ON QUIET STANDING
BACKGROUND
Quiet standing is a task that requires the person to hold the body upright in the
absence of external perturbations. The position of the whole body Center of Mass
(CoM) is a direct measure of balance. Since, determination of CoM requires
anthropometric information about individual body segments and their positions; it is
most often not used as a measure of balance. Instead, Center of pressure (CoP) is
used as an alternative (Winter et al., 1990). CoP is defined as the position of the net
ground reaction force derived from the two feet. The preference of CoP over CoM is
due to its ease of measurement.
Currently, the standard instrument used for assessing balance is the force platform.
The force plates provide information about the forces and moments exerted by the
body in three dimensions. The position the CoP in the Anterior-Posterior (AP) and the
Medio-Lateral (ML) planes can further be derived by calculating the moment arm.
Modeling the Postural Control System during Quiet stance. Various
models of the postural control system have been proposed which include the
contributions of the Central Nervous System (CNS), sensory, and motor systems.
Inverted Pendulum Model. Since the emergence of CoP as a measure for
balance, scientists have worked extensively in deriving the relationship between CoP
and CoM. The most simple and primitive model was demonstrated by Gage and
Colleagues (1980). The main assumption of this model is that the entire body sways
about the ankle as a single segment, in the AP direction. Thus, the body can be
modeled as an inverted pendulum, with the ankle acting as a pivot. This model helps
in deriving the relationship between whole body CoP and CoM (Gage, Winter, Frank,
& Adkin, 2004).
7
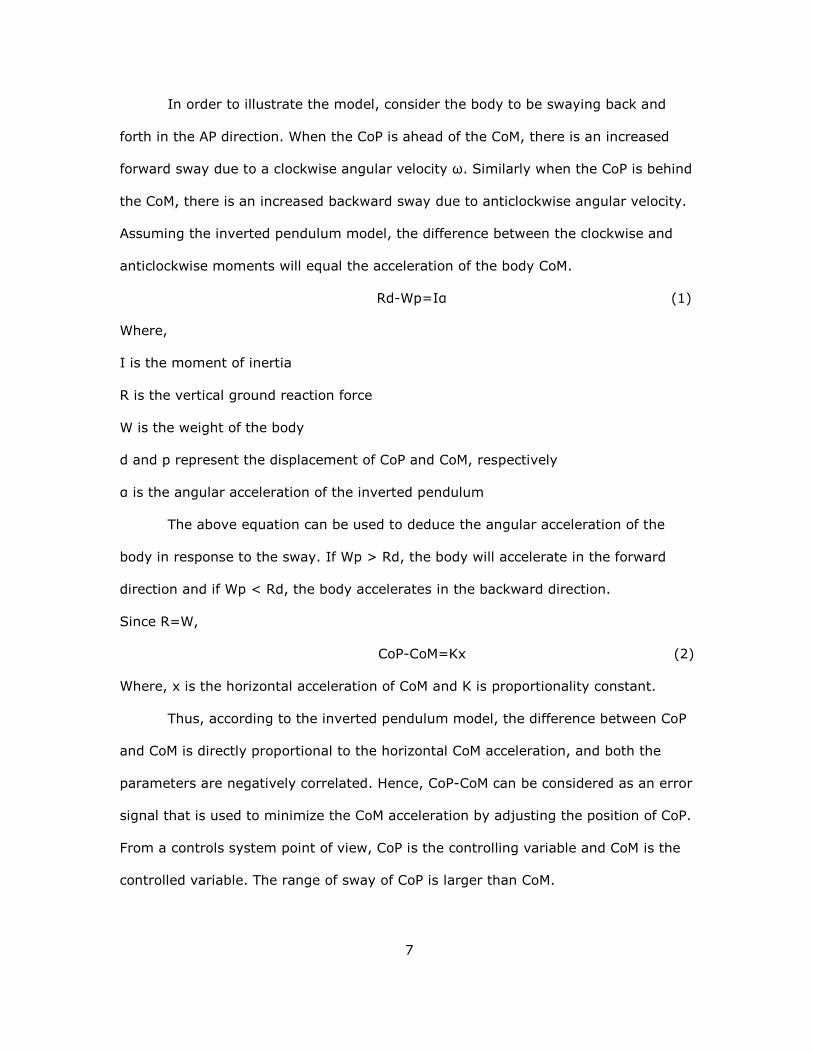
In order to illustrate the model, consider the body to be swaying back and
forth in the AP direction. When the CoP is ahead of the CoM, there is an increased
forward sway due to a clockwise angular velocity ω. Similarly when the CoP is behind
the CoM, there is an increased backward sway due to anticlockwise angular velocity.
Assuming the inverted pendulum model, the difference between the clockwise and
anticlockwise moments will equal the acceleration of the body CoM.
Rd-Wp=Iα (1)
Where,
I is the moment of inertia
R is the vertical ground reaction force
W is the weight of the body
d and p represent the displacement of CoP and CoM, respectively
α is the angular acceleration of the inverted pendulum
The above equation can be used to deduce the angular acceleration of the
body in response to the sway. If Wp > Rd, the body will accelerate in the forward
direction and if Wp < Rd, the body accelerates in the backward direction.
Since R=W,
CoP-CoM=Kx (2)
Where, x is the horizontal acceleration of CoM and K is proportionality constant.
Thus, according to the inverted pendulum model, the difference between CoP
and CoM is directly proportional to the horizontal CoM acceleration, and both the
parameters are negatively correlated. Hence, CoP-CoM can be considered as an error
signal that is used to minimize the CoM acceleration by adjusting the position of CoP.
From a controls system point of view, CoP is the controlling variable and CoM is the
controlled variable. The range of sway of CoP is larger than CoM.
8
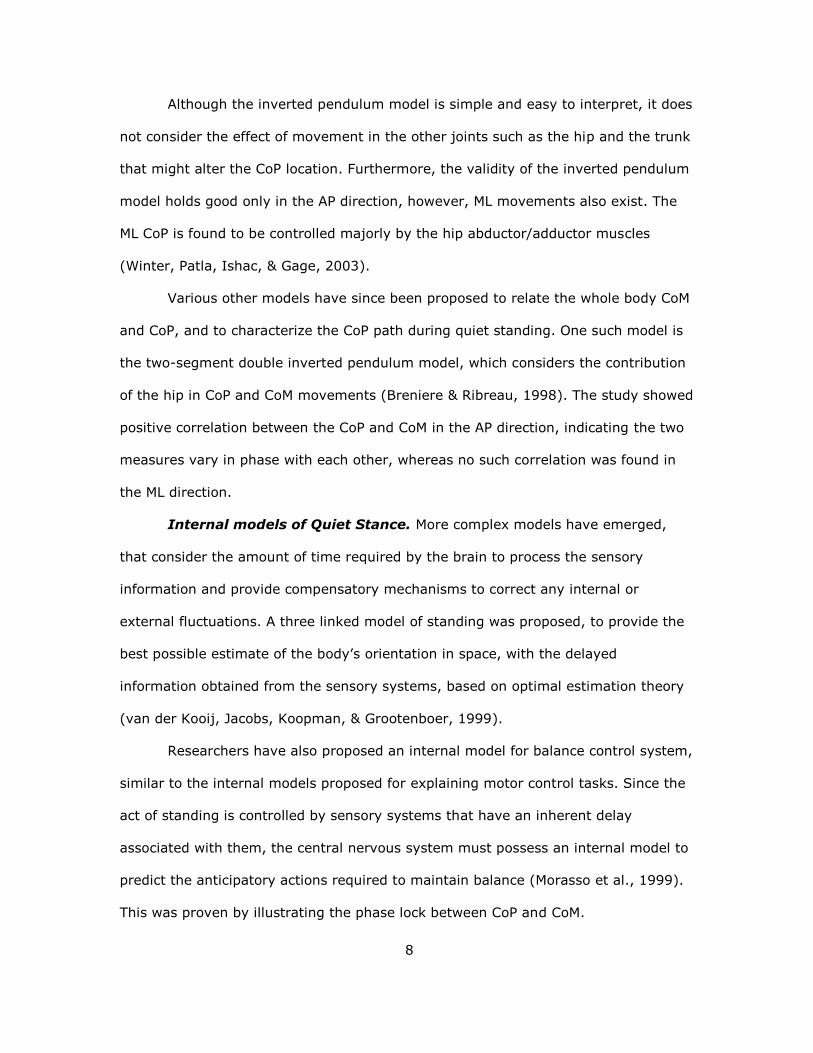
Although the inverted pendulum model is simple and easy to interpret, it does
not consider the effect of movement in the other joints such as the hip and the trunk
that might alter the CoP location. Furthermore, the validity of the inverted pendulum
model holds good only in the AP direction, however, ML movements also exist. The
ML CoP is found to be controlled majorly by the hip abductor/adductor muscles
(Winter, Patla, Ishac, & Gage, 2003).
Various other models have since been proposed to relate the whole body CoM
and CoP, and to characterize the CoP path during quiet standing. One such model is
the two-segment double inverted pendulum model, which considers the contribution
of the hip in CoP and CoM movements (Breniere & Ribreau, 1998). The study showed
positive correlation between the CoP and CoM in the AP direction, indicating the two
measures vary in phase with each other, whereas no such correlation was found in
the ML direction.
Internal models of Quiet Stance. More complex models have emerged,
that consider the amount of time required by the brain to process the sensory
information and provide compensatory mechanisms to correct any internal or
external fluctuations. A three linked model of standing was proposed, to provide the
best possible estimate of the body’s orientation in space, with the delayed
information obtained from the sensory systems, based on optimal estimation theory
(van der Kooij, Jacobs, Koopman, & Grootenboer, 1999).
Researchers have also proposed an internal model for balance control system,
similar to the internal models proposed for explaining motor control tasks. Since the
act of standing is controlled by sensory systems that have an inherent delay
associated with them, the central nervous system must possess an internal model to
predict the anticipatory actions required to maintain balance (Morasso et al., 1999).
This was proven by illustrating the phase lock between CoP and CoM.
9
According to these models, the postural control system acts in two different
modes: Reflex and Anticipatory. The anticipatory mode is functional during
unperturbed quiet standing, where in the control system stabilizes the postural
system well in advance, through anticipation of external or voluntary disturbances.
The reflex mode, also known as the feedback mode, controls balance in response to
perturbations (Deliagina, Orlovsky, Zelenin, & Beloozerova, 2006).
All the aforementioned models indicate the presence of an inbuilt anticipatory
system in play that helps to maintain balance control even in the absence of external
disturbances.
Center of Pressure Analysis. Center of Pressure obtained from the force
platforms is one of the most widely used parameters for studying quiet standing.
The normal posturographic technique involves the subject to stand quietly on the
force platform with their eyes open, maintaining an erect position, for a defined
period of time. The resultant plot obtained depicts the CoP trajectory in the AP and
ML directions. This plot is known as the stabilogram.
The analysis of CoP has been carried out either using the AP and the ML time
series separately, or by combining the AP and ML displacements, to obtain a planar
time series signal of the resultant CoP.
The analysis of CoP time series can be broadly classified into two (Norris,
Marsh, Smith, Kohut, & Miller, 2005):
1. Traditional Analysis
2. Statistical mechanics
Traditional Analysis. Traditional CoP analysis involves deriving measures
from the CoP trajectory such as the total excursion, mean velocity, mean frequency,
etc. For such methods, CoP is assumed to be a stationary time series (Norris et al.,
2005). Several studies used traditional analysis to detect differences in quiet
10
standing between young, elderly, and in neurodegenerative disorders like Parkinson’s
disease (Ickenstein et al., 2012; Prieto, Myklebust, Hoffmann, Lovett, & Myklebust,
1996).
Some of the main parameters extracted from the CoP trajectory are (Ickenstein et
al., 2012):
1. Total Path length: Total length covered by the CoP path in the AP and ML
directions.
2. Sway Area: Total area enclosed by the CoP trajectory per unit time
3. Mean Velocity: Total distance covered by CoP in the AP and ML directions per unit
time
4. Mean distance: Distance vector from the mean CoP position in AP and ML
directions.
Traditional methods of analysis of posturography are the simplest ways to
study balance during quiet stance. These methods have also been used to study the
effects of the three sensory mechanisms separately. For example, the differences in
measures obtained from CoP trajectories during eyes open and eyes closed
conditions provide insight into the effect of visual input on static balance..
Several studies have used traditional methods to study the effects of loss of
sensory feedback. Alahmari et.al. (2014) studied the differences in CoP sway area
and velocity in subjects with vestibular disorders. Moghadam et al. (2011) group
compared CoP sway when the subject stood on a foam pad with eyes open and eyes
closed. Romberg ratio is another important parameter used in traditional analysis to
quantify the effect of visual information. Romberg ratio is defined as the ratio of a
particular measure during eyes closed condition to the measure during eyes open
condition (Fujita et al., 2005).
11
Many research groups questioned the reliability of measures obtained from
CoP trajectory, quoting that such parameters vary across subjects and are also
dependent on the time and frequency of acquisition (Doyle, Hsiao-Wecksler, Ragan,
& Rosengren, 2007; Lacour, Bernard-Demanze, & Dumitrescu, 2008; Panzer,
Bandinelli, & Hallett, 1995). On the other hand, there have been studies validating
the test-retest reliability of parameters such as mean velocity and total path length,
with very high intra class correlations (Scoppa, Capra, Gallamini, & Shiffer, 2013;
Swanenburg, de Bruin, Favero, Uebelhart, & Mulder, 2008).
Statistical Mechanics. Statistical mechanics techniques analyze the fractal
and evolutionary properties of the CoP time series. Such techniques can be used
even if the CoP time series is non-stationary. The main reason to apply statistical
mechanics techniques is the difficulty to interpret the underlying neural mechanisms
from the results of traditional analysis (Slomka, Juras, Sobota, & Bacik, 2013).
One of the more popular methods is the Detrended Fluctuation Analysis
(DFA). DFA attempts to detect any long term correlations in the CoP time series, that
might indicate the presence of a memory component in CoP (Doyle et al., 2007).
Briefly, DFA involves calculation of root mean square fluctuations of integrated and
detrended time series of different time scales. The slope of logarithmic plot of
fluctuations vs. time scale is alpha. The value of alpha indicates whether the
correlations are positive or negative. Generally, DFA analysis of CoP time series
during quiet standing consists of two distinct parts: A persistent high frequency
region in the short-range time scale and an anti-persistent low frequency region in
long-range time scale (Teresa Blázquez, Anguiano, de Saavedra, Lallena, & Carpena,
2009)
The results of DFA have also been supported by random walk analysis,
commonly known as stabilogram diffusion analysis. The CoP trajectory is assumed to
12
mimic Brownian motion. The random walk analysis also showed short term
correlations in the CoP time series. These short term correlations have been
attributed to an open loop control mechanism and the long term anti correlations to
closed loop mechanisms of balance control (Collins & De Luca, 1994).
Quiet Standing Balance Control in the Elderly. Studies have shown that a
decline of the dopaminergic system affects the integration and re-weighting of the
sensory inputs necessary for balance in the basal ganglia. Dopaminergic depletion is
found with aging, although not as severe as in Parkinson’s disease (Cham, Perera,
Studenski, & Bohnen, 2007).
This degeneration of the postural control system with age has inspired
researchers to study quiet standing in elderly. Aging has a profound impact on
balance control, making the elderly more prone to falls. It is characterized by
deterioration of sensory systems, loss of motor units and decreased muscle strength
(Abrahamova & Hlavacka, 2008).
Of the two kinds of strategies (ankle strategy and hip strategy) adopted to
maintain stance when perturbed, the able-bodied elderly are found to use more of
the hip strategy due to inadequate torque production in the ankle muscles. Able-
bodied young adults adopt the ankle strategy which involves the swaying of the body
as a single segment about the ankle. The hip strategy on the other hand involves
movement around the hip. Elderly show higher hip EMG activity and joint
displacements compared to the young (Amiridis, Hatzitaki, & Arabatzi, 2003).
Numerous studies have been carried out in the past, mostly using traditional
methods of analysis of the CoP to compare young and healthy elderly. Apart from
providing insights into aging and falls, these studies are also useful in separating the
effects of aging and neurodegenerative disorders.
13
The results of the traditional methods show that mean displacement and
velocity of CoP are consistent within an age group and different between young and
elderly (Ickenstein et al., 2012; Prieto et al., 1996; Raymakers, Samson, & Verhaar,
2005); While other studies show increased sway frequencies (Vieira Tde, de Oliveira,
& Nadal, 2009). Moghadam et. al. (2011) also found attention to be an important
factor affecting the sway in elderly. This was evident from dual task experiments
during quiet standing.
The effect of different sensory systems has also been studied in the elderly.
The reliance on visual information for balance control tends to increase with age. Hip
proprioception was also reduced in elderly and mid-aged adults, although this did not
impact the CoP sway measures (Wingert, Welder, & Foo, 2014). Greater trunk sway,
especially in the AP direction was found when the subjects stood on foam (Alahmari
et al., 2014). All the above studies support the notion that elderly people rely more
on sensory feedback and there is a loss of effective re-weighting of such inputs
(Eikema, Hatzitaki, Tzovaras, & Papaxanthis, 2012).
The increase in CoP sway under different sensory conditions and during quiet
standing in the elderly is also ascribed to increase in ankle stiffness (Cenciarini,
Loughlin, Sparto, & Redfern, 2010; Lauk et al., 1998; Winter, Patla, Rietdyk, &
Ishac, 2001). Elderly tend to increase co-contraction of the muscles. One study on
CoP sway in the elderly during floor tilts showed increases in ankle stiffness
(Cenciarini, Loughlin, Sparto, & Redfern, 2009). It is hypothesized that unreliable
sensory information is compensated by increases in ankle stiffness. However, there
has been controversy regarding the methodology followed in deriving ankle stiffness
(Loram & Lakie, 2002; Morasso & Sanguineti, 2002).
Stabilogram diffusion analysis revealed that elderly adults used closed loop
control mechanisms, but with a larger delay than the young adults. This is accounted
14
for by increased reflex time, reduced muscular strength, and sensory perception
(Lacour et al., 2008).
Thus, a wide range of literature is available on the effect of aging on balance
control during quiet standing. The traditional measures are validated and reliable.
The statistical mechanics techniques on the other hand provide additional
information on postural control mechanisms.
METHODOLOGY
Subjects. Recruitment for the study was facilitated by displaying flyers in
public bulletins, campus bulletins, and senior centers and was carried out under the
Arizona State University Institutional Review Board (ASU IRB) approved study titled
“Control of Posture and Walking in Able-Bodied Adults”.
Recruitment for the study was based on the following inclusion and exclusion criteria:
Inclusion criteria: Subjects between the ages 18 and 75, who were able to
understand the instructions and willing to sign the informed consent to participate in
the study were included.
Exclusion criteria: Subjects with neurological or orthopedic disorders that
would affect their balance and walking were excluded. Subjects were also excluded if
they had any of the following conditions: Congenital heart disorders, implanted
device such as an orthopedic device or pacemaker, heart attack or stroke, heart
palpitations, psychological disorders, respiratory problems such as asthma, arthritis
or excessive soreness of joints, injuries related to fractures, or joint dislocation or
torn ligaments.
A total of 43 subjects met the criteria and participated in the study. To
investigate the effects of aging, subjects who were less than 30 years old were
assigned to young group and subjects who were older than 50 are assigned to
elderly group. 21 of the subjects (12 female, 9 male) fell in the young category (21-
15
35 years) and had a mean age of 23.0 ± 3.8 years. 22 of the subjects (12 female,
10 male) fell in the elderly category (50-75 years) with a mean age of 62.7 ± 8.5
years at the time of enrollment.
Experiment Protocol. All data were collected in a single session at the
Center for Adaptive Neural Systems, Arizona State University (ASU), Tempe, AZ. The
subjects were initially briefed about the study and the contents of the informed
consent. The subjects then expressed their willingness to participate in the study by
signing the informed consent. The subject’s blood pressure and pulse rate were
tested to confirm there was no risk associated with them participating in the study.
The force platform was warmed up by switching it on 30 minutes prior to data
collection. During the quiet standing task, the subjects were instructed to stand on
the force platform with their arms by their side, and their feet separated by hip-
width. A trace of the subject’s feet was then taken to ensure that the same position
is maintained for all the subsequent trials. The quiet standing task involved two
different conditions: standing with eyes open and standing with eyes closed. During
the eyes open trials, the subject was instructed to stand as still as possible,
concentrating on a point ahead of them. In case of any disturbance such as coughing
or talking, the trial was repeated. During the eyes closed trials, subjects stood as still
as possible, with their eyes closed.
A total of eight trials were recorded: five trials with eyes open followed by
three trials with eyes closed. Each trial was for 60 seconds, with sufficient rest
periods between the trials.
Force Platform and Data Collection Setup. Data was collected with a
sampling frequency of 100 Hz, using a Bertec force plate. The plate had a dimension
of 600 X 400 mm, with a resolution of 0.2 % of full scale. The plate consists of load
transducers that are capable of measuring three components of forces and three
16
components of moments in the orthogonal coordinate system. The 16 bit digital
signal from the force plate was passed through AM6501, an A/D converter which has
built-in amplification. The gain was set to 1. The analog signal from the amplifier was
then fed into LabVIEW 8.0 using BNC 2115 for calculating CoP.
Center of Pressure Calculation. The forces and moments in three
dimensions (Fx, Fy, Fz, Mx, My, Mz) were determined using the calibration matrix
provided with the Force plate using the formula
Fx = C1S1 (3)
Fy = C2S2
Fz = C3S3
Mx = C4S4
My = C5S5
Mz = C6S6
Where C represents the calibration matrix and S the scale factor for unity gain.
The coordinate system for the force plate is defined as: Positive Y axis directing
forward, X-Axis to the left and Z axis downwards according to right hand rule.
CoP represents the X and Y coordinates of the point of application of the net ground
reaction force. Using the relationship between the force and moment arm,
Xp = - - y
(4)
Yp= - y-
(5)
Where Xp and Yp are the ML and AP coordinates of the CoP with respect to the force
plate coordinates, in meters. All the above calculations were performed in LabVIEW
8.0 and the resultant outputs include Fx, Fy, Fz, Mx, My, Mz ; Xp and Yp.
17
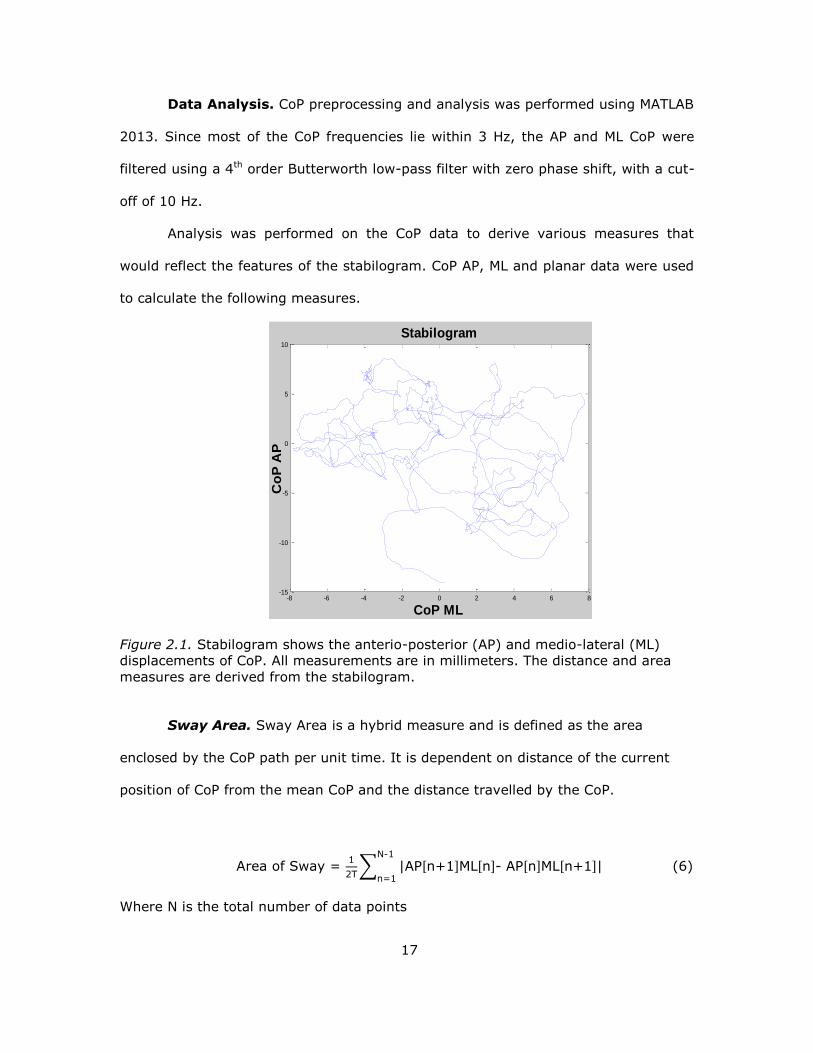
Data Analysis. CoP preprocessing and analysis was performed using MATLAB
2013. Since most of the CoP frequencies lie within 3 Hz, the AP and ML CoP were
filtered using a 4th order Butterworth low-pass filter with zero phase shift, with a cut-
off of 10 Hz.
Analysis was performed on the CoP data to derive various measures that
would reflect the features of the stabilogram. CoP AP, ML and planar data were used
to calculate the following measures.
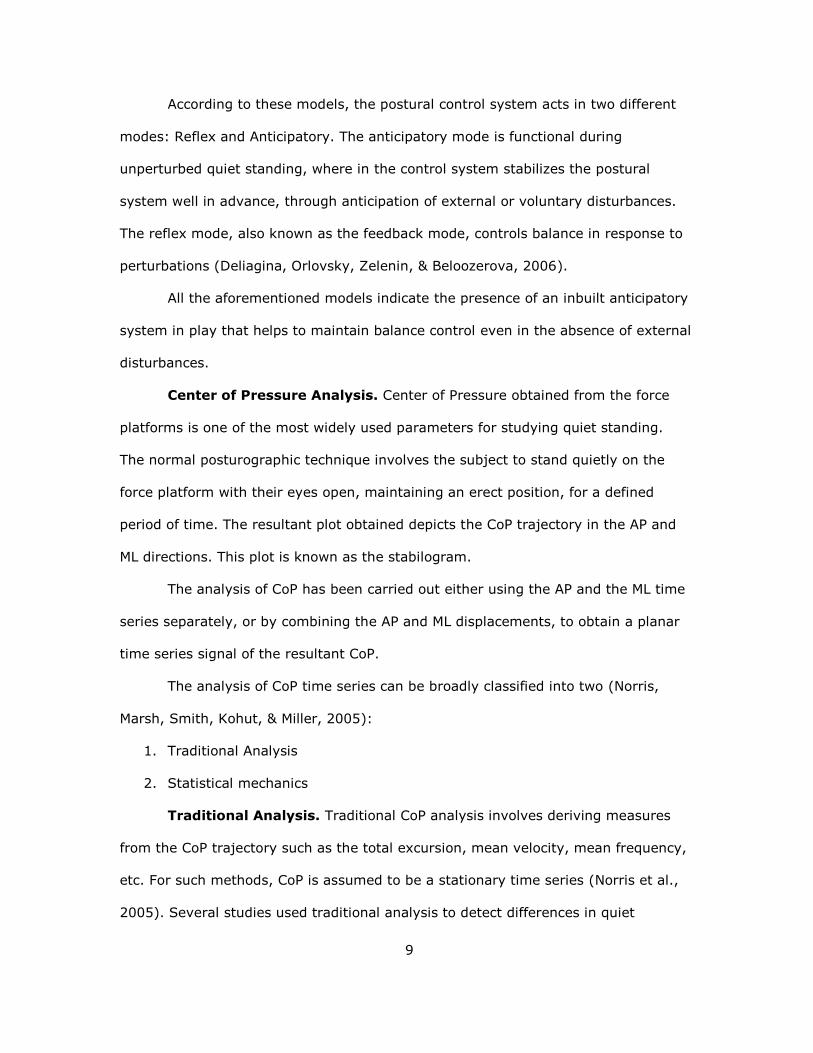
Figure 2.1. Stabilogram shows the anterio-posterior (AP) and medio-lateral (ML)
displacements of CoP. All measurements are in millimeters. The distance and area
measures are derived from the stabilogram.
Sway Area. Sway Area is a hybrid measure and is defined as the area
enclosed by the CoP path per unit time. It is dependent on distance of the current
position of CoP from the mean CoP and the distance travelled by the CoP.
Area of Sway =
T∑ AP[n ] [n]- AP[n] [n ]
-
n= (6)
Where N is the total number of data points
-8 -6 -4 -2 0 2 4 6 8-15
-10
-5
0
5
10
Stabilogram
CoP ML
Co
P A
P
18
T is the time period of analysis (60 sec);
AP[n] =AP (n)-meanAP;
ML[n] =ML (n)-meanML
Resultant Distance (RD). The resultant distance is a time series
representing the distance of the current points of AP and ML from the mean CoP
Position.
RD[n] = [AP[n]2 + ML[n]2]1/2 (7)
Mean Distance. Mean distance is defined as the mean of the RD time series.
In other words, it represents the average distance from the mean CoP
MDIST = 1/N ∑ n n= (8)
Mean distance AP is the average distance of AP from mean CoP.
MDISTAP= 1/N ∑ AP n n= (9)
RMS Distance. RDIST is the root mean square (RMS) distance of the
resultant distance time series.
RDIST= [1/N ∑ n n= 2]1/2 (10)
Similarly RDISTAP is the RMS distance of AP from mean CoP (Standard Deviation)
RDISTAP = [1/N ∑ AP n n=
2]1/2 (11)
Total Excursion. The total length of the CoP path approximated as sum of
distances between consecutive points in the CoP time series
TOTEX = ∑ (AP(n )-AP(n) -
n= ( (n )- (n)
(12)
Similarly the total excursion in the AP direction is the total CoP path covered in the
AP directions as an approximation of sum of distances between consecutive points
TOTEXAP = ∑ AP[n ]-AP[n] -
n= (13)
19
Mean Velocity. The mean velocity of CoP is defined as the total distance
covered, TOTEX over total time.
MVELO = TOTEX/T (14)
Similarly the velocity in the AP is the total path length covered in AP direction over
time
MVELOAP = TOTEX/T (15)
95% Confidence Circle Area. The 95% confidence area is a circle of radius
equivalent to 95% confidence limit of the resultant distance time series, assuming it
is a normal distribution
AREA-CC = π ( IST 0.5SRD)2 (16)
Where, SRD is the standard deviation of the RD time series.
z0.5 is the z statistic of the 95% confidence limit
95% Confidence Ellipse Area. Similar to AREA-CC, AREA-CE is the area of
the bivariate ellipse which encloses 95% of the points of the CoP path. Let a and b
be the major and minor axes of the ellipse.
Assuming the sample size is large,
a= [F0.05[2,n-2](SAP2+SML
2+D)]1/2 (17)
b= [F0.05[2,n-2](SAP2+SML
2-D)]1/2
F is the F statistic of 95% confidence level. For large sample size, F is approximated
to 3. S is the standard deviation of AP and ML time series.
D= [(SAP2+SML
2) – 4(SAP2SML
2 – S2APML]
1/2
And SAPML = / Σ AP n] ML[n]
Finally, AREA-CE = π 0.05 [2, n-2][ SAP2SML
2 – S2APML]
1/2 (18)
Mean Frequency. Mean frequency is defined as the rotational frequency that
the CoP travelled around a circle, with a radius equal to the mean distance
MFREQ = T T
π IST (19)
20
Similarly the mean frequency in AP is calculated as
MFREQAP = T T AP
√ IST AP T (20)
Similar measures were derived for ML direction also.
Statistical Analysis. Statistical analyses were performed in IBM SPSS 22
(SPSS Inc., Chicago,IL) . The test chosen was based on the two main questions to be
answered from the quiet standing measures: to determine the effect of age on quiet
standing and to find the effect of absence of visual input on quiet standing.
Repeated measures Analysis of Variance. A simple independent sample t-
test to find effect of aging and a paired sample t-test to find the effect of visual input
are insufficient. This is because; such tests do not take the inter-trial and inter-
subject variability into account. Thus, a general linear model was created using
repeated measures Analysis of Variance (ANOVA). The advantage of this analysis is
that it also considers the within-subject factor variability when calculating the ANOVA
measure for age.
Each of the measures calculated from the CoP time series were considered as
independent response variables. So, the repeated measures ANOVA was performed
on each response separately. Since it is necessary to have equal number of trials for
the two visual conditions, only three trials of the eyes open and eyes closed
conditions were taken into consideration. The two within-subject factors were trials
(3 levels) and visual conditions (2 levels-eyes open, eyes closed). The between
subject factor was age (2 levels-young, elderly). Thus, this algorithm will take the
effects of trial, visual condition, and the interaction between the two factors into
account, in addition to age. A p-value of less than 0.05 was considered significant.
Although repeated measures ANOVA with age as the between subject factor gives
the effects of visual input, it does not tell us which if either one of the groups showed
significance for vision or both the groups showed significance.
21
In order to answer the second question, the effect of change in visual
conditions within each group, repeated measures ANOVA was performed on each age
group separately. In this case, age is a constant and vision is the between subject
factor and trial is the within subject factor. The normality of the response was
determined by looking at the Quantile-Quantile (Q-Q) plot. In case of a right skewed
distribution, log transformation was performed on the response distribution to make
it normal. The repeated measures ANOVA was performed after the transformation.
Test-retest reliability. The test-retest reliability is very important to get a
better understanding of the consistency of the data across trials. Test-retest
reliability analysis was performed by calculating the Cronbach’s Alpha and Intra-
Class Correlation (ICC . The Cronbach’s alpha value tells us if the data is internally
consistent and reliable. The alpha value ranges between 0 and 1. Values of alpha
greater than 0.8 indicate good consistency. ICC is a measure of reproducibility of the
data. Unlike other correlation measures, ICC determines the correlation within a
group instead of pairwise comparison. ICC is often used to determine if a single trial
is sufficient to get a consistent result. ICC values greater than 0.8 indicate good
reproducibility and correlations between the responses within each subject.
RESULTS
Effects of age on quiet standing. Repeated measures ANOVA was
performed on the quiet standing data for all the 19 responses that were derived. The
QQ plots indicated that the distributions of all the parameters were right skewed.
Thus a log transformation was performed prior to the ANOVA test. Young subjects 1
and 3 were eliminated from the quiet standing analysis since the quality of the data
was poor due to technical difficulties.
Out of the 19 quiet standing measures, nine of them showed significant
differences between young and elderly groups: Sway area, Total excursion AP, Total
22
excursion ML, Mean velocity, Mean velocity AP, Mean velocity ML, Mean frequency,
and Mean frequency ML. Note that mean velocity is derived from total excursion, and
thus both of them gave the same statistical results. Table 2.1 shows the F and p
values for each of the significant parameters. Refer to appendix B for mean and
standard deviation values of all the measures derived from CoP. Sway area and
mean frequency showed significant trial to trial variations within subjects with F
values of 5.552 (p=0.006) and 13.565 (p=0.001) respectively.
Table 2.1
Quiet standing measures that showed significant difference between young and
elderly. F and p values from one way ANOVA are provided. p< 0.05 is considered
significant.
PARAMETER F VALUE p -VALUE
Sway Area 10.329 0.003
Total excursion 17.670 < 0.001
Total excursion ML 6.811 < 0.001
Total excursion AP 20.894 < 0.001
Mean frequency 12.808 0.001
Mean Frequency AP 20.894 < 0.001
Mean Velocity 17.670 < 0.001
Mean Velocity ML 6.811 < 0.001
Mean Velocity AP 20.894 < 0.001
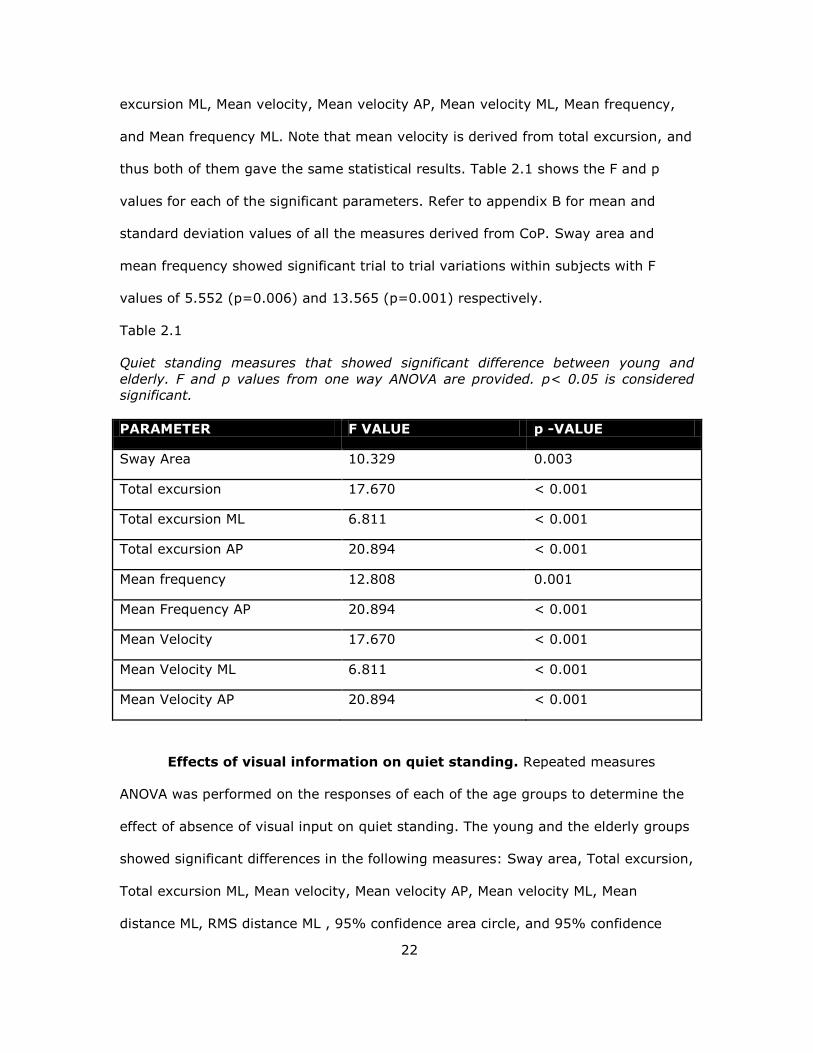
Effects of visual information on quiet standing. Repeated measures
ANOVA was performed on the responses of each of the age groups to determine the
effect of absence of visual input on quiet standing. The young and the elderly groups
showed significant differences in the following measures: Sway area, Total excursion,
Total excursion ML, Mean velocity, Mean velocity AP, Mean velocity ML, Mean
distance ML, RMS distance ML , 95% confidence area circle, and 95% confidence
23
area ellipse. In addition, the elderly showed significant differences in Total excursion
AP. The p-values for each of these measures are provided in table 2.2. It is observed
that absence of visual input tends to affect the time domain CoP measures
specifically in the AP direction. Thus, both the young and elderly increase the
excursion in the AP direction in the absence of visual feedback. In addition, the
elderly also showed increase in total excursion in the ML direction.
Table 2.2
Quiet standing measures that showed significant difference between eyes open and
eyes closed conditions within young and elderly groups. F and p-values from one way
ANOVA are provided. p-value < 0.05 is considered significant. Blank table cells
indicate that the measure was not significant.
PARAMETER F value
young
p-value
young
F value
Elderly
p-value
Elderly
Sway area 7.882 0.008 10.355 0.003
Total excursion 14.418 0.001 11.518 0.002
Total excursion
ML 6.662 0.014
Total excursion
AP
20.087 < 0.001 12.377 0.001
Distance AP 4.633 0.038 7.223 0.010
Area CE 4.538 0.040 5.083 0.031
Area CC 6.205 0.017 7.701 0.008
RMS distance
AP
5.591 0.024 7.284 0.010
The interaction between visual input and age was significant in total excursion
ML. This indicates that young and elderly respond differently in the absence of visual
input. It was observed that the there is a larger increase in the CoP parameters upon
closing the eyes in the elderly when compared to young. This shows that the elderly
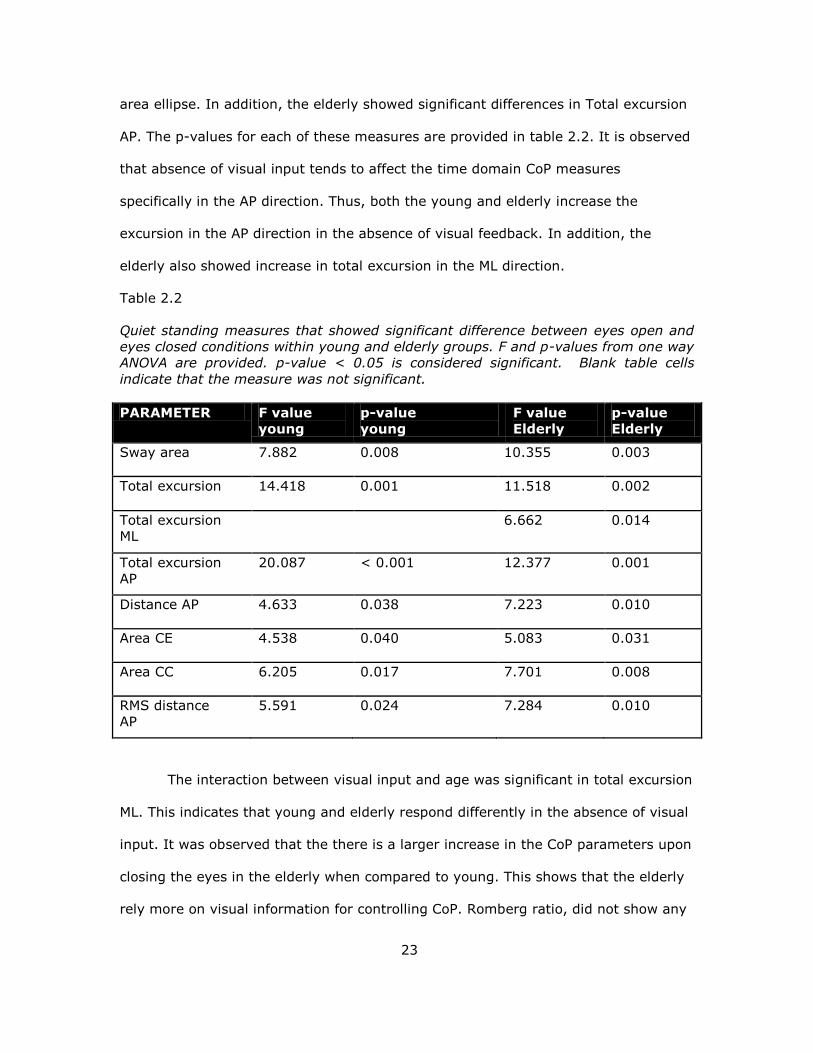
rely more on visual information for controlling CoP. Romberg ratio, did not show any
24
significant differences between young and the elderly. However, the Romberg ratio
was higher in the elderly.
Figure 2.2. Change in time domain area measures with increase in age and absence
of visual input: (a) change in 95% confidence area ellipse, (b) change in 95%
confidence area circle, and (c) change in sway area. Blue color asterisk denotes
significant difference due to visual input and red color asterisk denotes significant
difference due to aging at p < 0.05. The vertical lines denote the 95% confidence
intervals for the mean values.
25
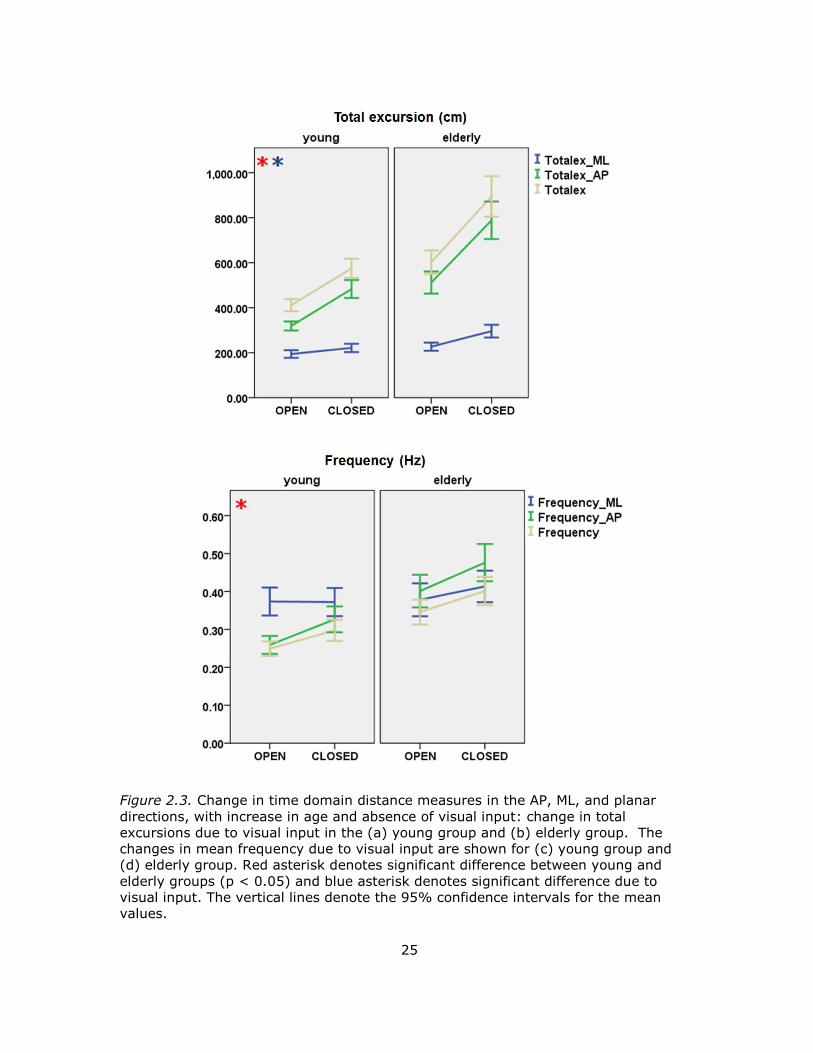
Figure 2.3. Change in time domain distance measures in the AP, ML, and planar
directions, with increase in age and absence of visual input: change in total
excursions due to visual input in the (a) young group and (b) elderly group. The
changes in mean frequency due to visual input are shown for (c) young group and
(d) elderly group. Red asterisk denotes significant difference between young and
elderly groups (p < 0.05) and blue asterisk denotes significant difference due to
visual input. The vertical lines denote the 95% confidence intervals for the mean
values.
26
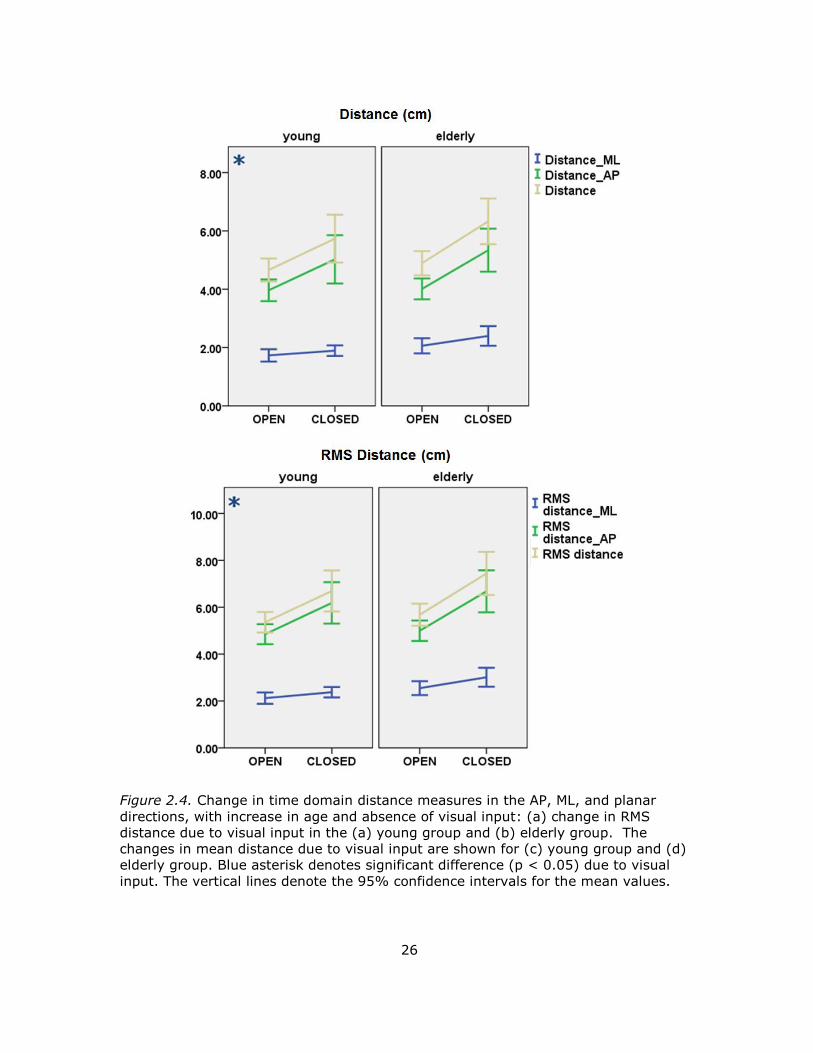
Figure 2.4. Change in time domain distance measures in the AP, ML, and planar
directions, with increase in age and absence of visual input: (a) change in RMS
distance due to visual input in the (a) young group and (b) elderly group. The
changes in mean distance due to visual input are shown for (c) young group and (d)
elderly group. Blue asterisk denotes significant difference (p < 0.05) due to visual
input. The vertical lines denote the 95% confidence intervals for the mean values.
*
a
27
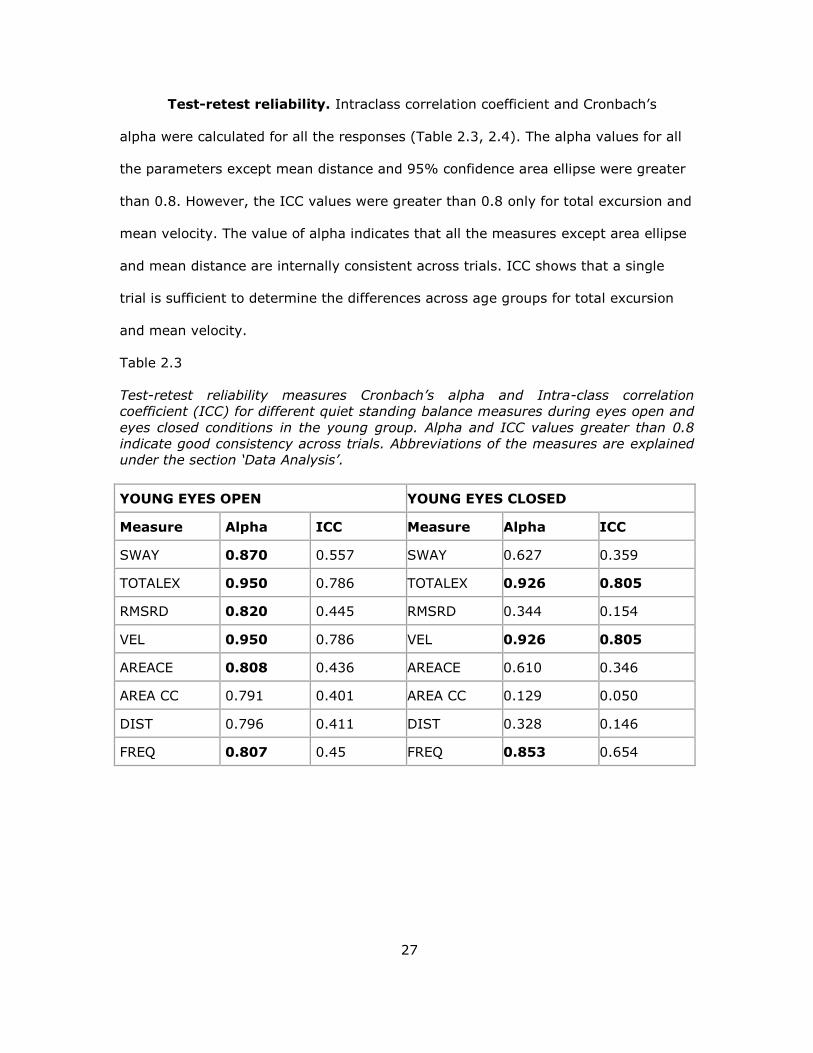
Test-retest reliability. Intraclass correlation coefficient and Cronbach’s
alpha were calculated for all the responses (Table 2.3, 2.4). The alpha values for all
the parameters except mean distance and 95% confidence area ellipse were greater
than 0.8. However, the ICC values were greater than 0.8 only for total excursion and
mean velocity. The value of alpha indicates that all the measures except area ellipse
and mean distance are internally consistent across trials. ICC shows that a single
trial is sufficient to determine the differences across age groups for total excursion
and mean velocity.
Table 2.3
Test-retest reliability measures Cronbach’s alpha and Intra-class correlation
coefficient (ICC) for different quiet standing balance measures during eyes open and
eyes closed conditions in the young group. Alpha and ICC values greater than 0.8
indicate good consistency across trials. Abbreviations of the measures are explained
under the section ‘Data Analysis’.
YOUNG EYES OPEN YOUNG EYES CLOSED
Measure Alpha ICC Measure Alpha ICC
SWAY 0.870 0.557 SWAY 0.627 0.359
TOTALEX 0.950 0.786 TOTALEX 0.926 0.805
RMSRD 0.820 0.445 RMSRD 0.344 0.154
VEL 0.950 0.786 VEL 0.926 0.805
AREACE 0.808 0.436 AREACE 0.610 0.346
AREA CC 0.791 0.401 AREA CC 0.129 0.050
DIST 0.796 0.411 DIST 0.328 0.146
FREQ 0.807 0.45 FREQ 0.853 0.654
28
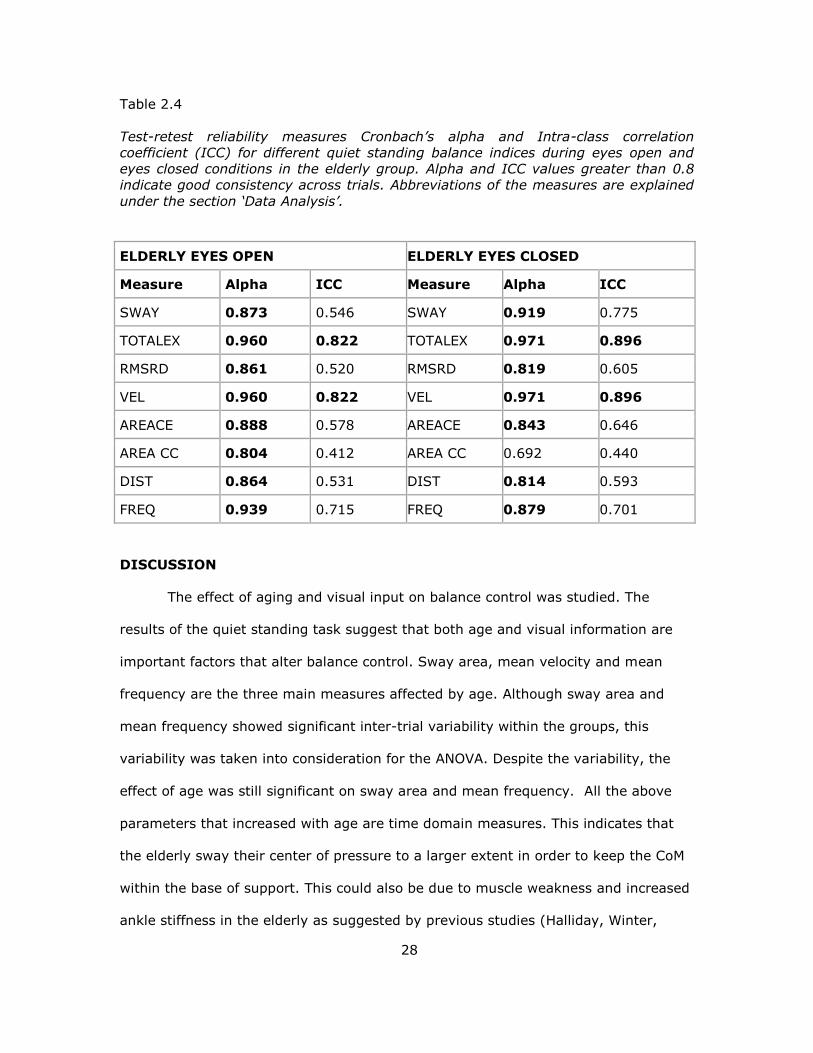
Table 2.4
Test-retest reliability measures Cronbach’s alpha and Intra-class correlation
coefficient (ICC) for different quiet standing balance indices during eyes open and
eyes closed conditions in the elderly group. Alpha and ICC values greater than 0.8
indicate good consistency across trials. Abbreviations of the measures are explained
under the section ‘Data Analysis’.
ELDERLY EYES OPEN ELDERLY EYES CLOSED
Measure Alpha ICC Measure Alpha ICC
SWAY 0.873 0.546 SWAY 0.919 0.775
TOTALEX 0.960 0.822 TOTALEX 0.971 0.896
RMSRD 0.861 0.520 RMSRD 0.819 0.605
VEL 0.960 0.822 VEL 0.971 0.896
AREACE 0.888 0.578 AREACE 0.843 0.646
AREA CC 0.804 0.412 AREA CC 0.692 0.440
DIST 0.864 0.531 DIST 0.814 0.593
FREQ 0.939 0.715 FREQ 0.879 0.701
DISCUSSION
The effect of aging and visual input on balance control was studied. The
results of the quiet standing task suggest that both age and visual information are
important factors that alter balance control. Sway area, mean velocity and mean
frequency are the three main measures affected by age. Although sway area and
mean frequency showed significant inter-trial variability within the groups, this
variability was taken into consideration for the ANOVA. Despite the variability, the
effect of age was still significant on sway area and mean frequency. All the above
parameters that increased with age are time domain measures. This indicates that
the elderly sway their center of pressure to a larger extent in order to keep the CoM
within the base of support. This could also be due to muscle weakness and increased
ankle stiffness in the elderly as suggested by previous studies (Halliday, Winter,
29
Frank, Patla, & Prince, 1998, Cenciarini, Loughlin, Sparto, & Redfern, 2010; Lauk et
al., 1998; Winter, Patla, Rietdyk, & Ishac, 2001)
The quiet standing trials during eyes open and eyes closed conditions were
not randomized and the eyes closed trials always followed the eyes open trials. There
was a possibility that fatigue might have some effect on the measures obtained from
eyes closed trials. Sufficient rest periods were provided between trials of each type
and we believe that this might have minimized the effect of fatigue. Sway, mean
velocity, mean frequency, and mean distance were affected by absence of visual
input, especially in the AP direction, in both the young and elderly groups. In
addition, the Romberg ratio for elderly was higher, implying that elderly rely more on
visual input. One postulation is that the young compensate for the loss of visual
input using the redundancy in the postural control system. However, the elderly
population seems to rely more on visual input. This might also indicate abnormal re-
weighting of the sensory inputs or deterioration in other sensory systems with age.
There have been many studies on quiet standing specifically on the effects of
aging. Prieto et al (1996) performed a similar experiment to determine the effect of
aging and visual input on quiet standing. They derived the CoP parameters from 20
young and 20 elderly subjects during eyes open and eyes closed conditions.
According to their results, significant differences were found between age groups in
mean velocity, mean velocity AP and mean frequency, mean frequency AP. The
present study showed age related differences in Sway area and mean velocity in the
direction in addition to the results obtained by Prieto. As in Prieto’s study, the
differences between eyes open and eyes closed conditions were statistically stronger
in elderly. Also, the Romberg ratio although higher in the elderly, was not
statistically significant. Overall, their study found mean velocity to be the only
measure to show significant differences for changes in visual input and age. The
30
current study found mean velocity and sway area to show differences with visual
input and age. Since the mean velocity is derived from total excursion, both the
measures show similar statistical differences between young and elderly.
Another study by Ickenstein and colleagues (2012) looked at the effects of
aging and Parkinson’s disease on quiet standing. The authors analyzed quiet
standing during eyes open and eyes closed conditions in 10 elderly and 21 young
subjects. Mean radius, sway area, and mean velocity were calculated. The current
study agrees with the results of Ickenstein’s study that the mean speed shows
significant differences across age. However, aging effects were only evident during
eyes closed conditions. It is important to note that only two trials were conducted in
their study. Moreover, the number of subjects in the elderly group was smaller than
the number of subjects in the young group and the subjects stood with their arms
extended outwards, for 30 seconds.
Alahmari et.al (2014) studied 30 young and 30 elderly subjects with different
visual conditions such as eyes open, eyes closed, and variations in visual surround. A
balance rehabilitation Unit (BRU) was used to determine the 95 % confidence area
ellipse and mean velocity from the CoP data. The result of the present study is in
accordance with the results obtained by them. The authors showed significant
differences in sway area and mean velocity across age groups. ICC for area and
velocity was at least 0.76. Our study showed high ICC only for mean velocity and
total excursion.
The study by Abrahamova et. al (2008) showed that CoP amplitude and
velocity were the two most reliable measures to study age related differences. CoP
amplitude is derived from the standard deviation of the CoP. They compared CoP
parameters across three age groups- Junior, middle-aged and senior and performed
31
a regression analysis. They also found noticeable differences in CoP sway, velocity,
and amplitude in people above the age of 60.
Seigle and colleagues (2009) calculated the CoP total excursion and 95%
confidence area ellipse for the young and elderly during eyes open and closed
conditions. 11 young and 12 elderly participants were recruited. The results showed
differences in total excursion and sway area between age groups only in the eyes
closed condition. The difference in result compared to this study may be due to a
smaller number of subjects and a shorter data acquisition time (30 seconds).
There have been many studies that have looked at the test-retest reliability of
the CoP measures (Lafond, Corriveau, Hebert, & Prince, 2004; Lin, Seol, Nussbaum,
& Madigan, 2008; Raymakers et al., 2005). All the studies come to the same
conclusion that mean velocity is the most consistent measure to determine
differences between age groups and for different vision conditions. The results of the
present study was consistent with theirs
Thus to summarize, age has significant effects on balance control during quiet
standing. This is reflected in three important measures derived from CoP, sway area,
mean frequency and total excursion. The young and the elderly rely on visual input
for quiet standing. This was evident from changes in distance and area measures
with change in visual input, especially in the AP direction.
32
CHAPTER 3
EFFECTS OF AGING ON POSTURE SHIFTS
BACKGROUND
Posture weight shifts has not been studied as extensively as quiet standing.
It involves shifting ones weight between the two feet, in order to lean to different
directions without lifting ones foot and losing balance. In clinics, the ability to
perform posture weight shifts is measured in terms of Limits of Stability (LoS) that
quantifies the maximum distance up to which a person can move his/her CoP with a
stable base of support without losing their balance.
During the LoS test, the participant is asked to lean as far as possible from
his/her initial erect position in specific directions based on the visual feedback from
the monitor placed straight ahead. The participants have their hands by the side and
are instructed to use mostly their ankles and not their hips, while leaning. Most
commonly derived measures from LoS test are: maximum distance, movement time
and velocity. Fallers move a shorter distance with much smaller velocity than age
matched non-fallers (Pickerill & Harter, 2011). The LoS measure is validated and is
being used routinely in clinical settings for fall risk assessment.
Postural shifts have been studied in people with stroke. Chern et al. (2010)
measured CoP measures during postural shifts to six different target locations. CoP
excursion, mean velocity and bilateral limb ratios were assessed. The results showed
significant differences between people with stroke and age matched controls in all
measures except CoP velocity. Target preferences were significant in stroke patients
alone. This study showed that larger displacements and slower velocity of CoP in
stroke subjects indicate adoption of a compensatory postural mechanism.
Lemay and colleagues (2014) studied absolute maximum distance and total
CoP path length during posture shifts while standing, in people affected by
33
incomplete traumatic Spinal Cord Injury (SCI). Results showed people with SCI had
significantly greater CoP path length in all target directions. The path length when
progressing towards the center target was higher than when moving away from the
center target in the anterior direction.
A study on voluntary shifts of CoP to different directions at different
frequencies revealed that the voluntary shifts and background CoP sway are
independent processes. The shifts required an internal command to initiate whereas
the CoP sway was inherent and did not require an internal command (Latash,
Ferreira, Wieczorek, & Duarte, 2003).
Another method for assessing dynamic balance is functional reach. Functional
reach is similar to the LoS test, but the subject reaches to an object within their LoS.
Wallmann et al. (2001) compared non-fallers and fallers over the age of 60 for
differences in sway during functional reaching task. The results showed moderate
correlation of functional reach and CoP path length in the AP direction for fallers.
A study on the effects of knee pain on functional reach and gait aimed at
correlating the parameters from gait, quiet standing, and functional reach. No
correlation was found between knee pain, timed up and go test, and functional reach
test. This study did not consider the effects of age or risk of falls, but the only factor
taken into consideration was knee pain (Takahashi et al., 2004).
A postural shift paradigm very similar to what is used in this study was
e tended to studying the effects of deep brain stimulation ( BS on Parkinson’s
disease patients. The study focused on finding out how postural instability improves
with DBS. The postural shift paradigm was performed during four stimulation
conditions, and several parameters such as movement time, velocity, and path
length were calculated during the initiation, movement, and hold phases of target
reach. Results showed a reduction in peak velocity and velocity during the initiation
34
and movement phases during deep brain stimulation-off condition compared to deep
brain stimulation-on condition (Krishnamurthi, Mulligan, Mahant, Samanta, & Abbas,
2012).
After reviewing the existing literature on limits of stability and functional
reach, it is evident that LoS is a standardized test for fall risk assessment; however,
in most of the studies, the only parameters considered are time of reach and
maximum distance. Moreover, the effects and correlation of CoP during quiet stance
and posture shift has only been studied in people with stroke, SCI, or knee pain. The
present study compares more detailed parameters extracted from CoP during
posture shifts and compares them between the young and elderly.
METHODOLOGY
Subjects. The same subjects who were recruited for the quiet standing study
also took part in the dynamic shift task. The recruitment criteria and other subject
recruitment related information is provided in Chapter 2.
Experimental Protocol. Subjects participated in the posture shift task after
completing the quiet standing task, during the same session. The setup requires the
subject to stand on the force platform with their hands by their side and feet
separated by hip-width. Once the subjects stood comfortably, a trace of their feet
was taken to ensure consistent placement of the feet across trials. All subjects wore
comfortable shoes.
Previously developed LabVIEW-based graphical user interface was utilized to
provide real-time visual feedback of the position of the subject’s CoP. At the start of
the trial, the CoP of the subject was taken as the center of the center target (Figure
3.1). The subject viewed his/her CoP on the monitor placed in the front of the
subject at eye level which provided real-time visual feedback. During the course of
the trials, the outward targets were displayed in different positions, each separated

35
by an angle of 45o. To facilitate comparison across subjects, the distance of the
target circle from the center was set to 30% of the distance between the hip and the
ankle, which has been demonstrated to be related to the LoS (Pickerill & Harter,
2011). The radius of the center and target circles was set at 10% of the distance
between the hip and the ankle. The subject was instructed to move their CoP,
displayed in a form of red circular cursor, to the target circle position by leaning
without lifting their feet off the ground. Once his/her CoP entered the target circle,
they were asked to hold their position as close as possible to the center of the target
circle within the target for at least 2 seconds. After that, the current target circle
disappeared and the center target appeared which became the new target. If the
subject was unable to stay within the target for at least 2 seconds, then the new
target appeared automatically in 10 seconds. If the subject stayed inside the target
for at least 2 seconds, the target was considered successfully achieved.
The five different angles at which the targets presented were 0, 45, 90, 135,
and 180 degrees. After reaching towards each target, the subject came back to the
center target position before moving towards the next outward target.
Thus, a total of ten targets were provided during the trial- O-0o, 0o-O, O-45o,
45o-O, O-90o, 90o-O, O-135o, 135o-O, O-180o, 180o-O, where O represents the origin
or center target. During a single trial, 20 targets were presented, i.e. each of the ten
targets were presented twice. A total of five trials were performed, with sufficient
rest periods in-between. The sequence of outward targets was randomly presented
within and across trials to minimize learning effects or anticipation of the target.
Data Analysis. All the measures extracted from the dynamic shift data were
based on the stabilogram obtained for the different trials and were derived using
customized analysis programs developed in MATLAB 2013.
36
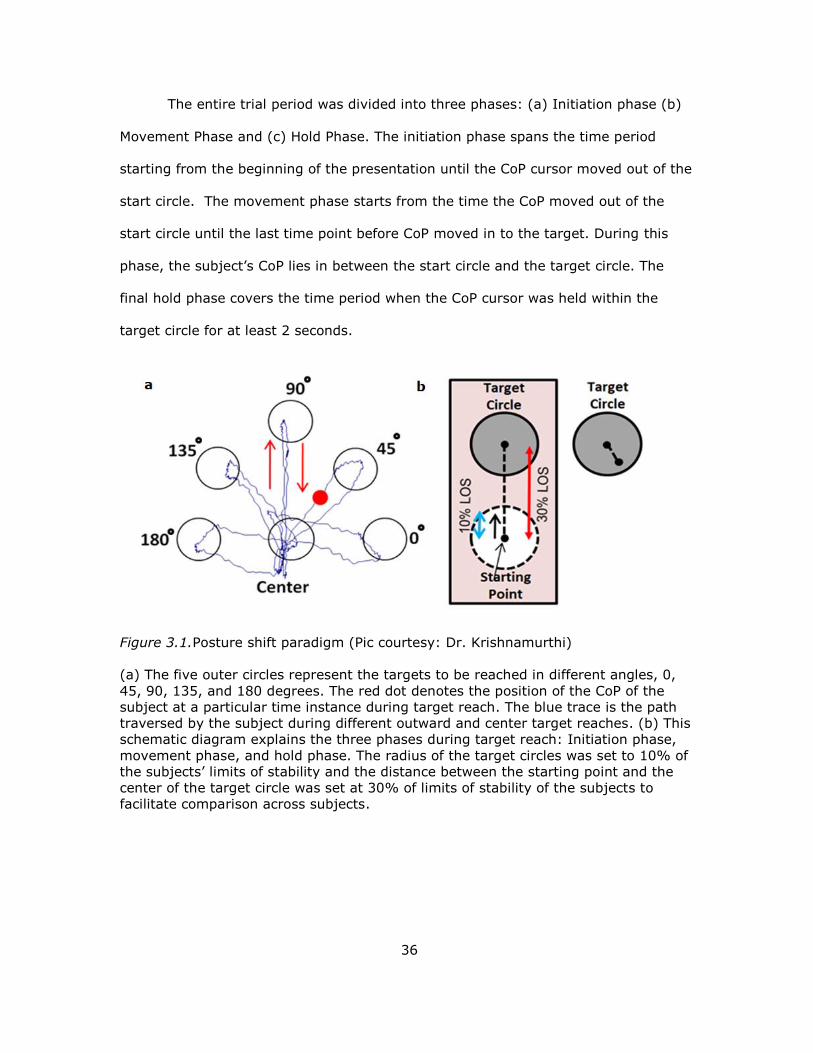
The entire trial period was divided into three phases: (a) Initiation phase (b)
Movement Phase and (c) Hold Phase. The initiation phase spans the time period
starting from the beginning of the presentation until the CoP cursor moved out of the
start circle. The movement phase starts from the time the CoP moved out of the
start circle until the last time point before CoP moved in to the target. During this
phase, the subject’s CoP lies in between the start circle and the target circle. The
final hold phase covers the time period when the CoP cursor was held within the
target circle for at least 2 seconds.
Figure 3.1.Posture shift paradigm (Pic courtesy: Dr. Krishnamurthi)
(a) The five outer circles represent the targets to be reached in different angles, 0,
45, 90, 135, and 180 degrees. The red dot denotes the position of the CoP of the
subject at a particular time instance during target reach. The blue trace is the path
traversed by the subject during different outward and center target reaches. (b) This
schematic diagram explains the three phases during target reach: Initiation phase,
movement phase, and hold phase. The radius of the target circles was set to 10% of
the subjects’ limits of stability and the distance between the starting point and the
center of the target circle was set at 30% of limits of stability of the subjects to
facilitate comparison across subjects.
37
Initiation Phase. (a) Initiation time: Total time spent within the initial start
circle.
(b) Initiation pathlength: Total pathlength covered by the CoP in the AP and ML
directions when inside the initial start circle.
(C) Initiation Velocity: The mean velocity of the CoP inside the start circle.
Movement Phase. (a) Movement time: Time spent in the movement phase
as defined above.
(b) Movement path length: Total path length of the CoP travelled in AP and ML
directions during the movement phase
(c) Movement velocity: Mean velocity of CoP when traversing the movement phase.
Hold Phase. (a) Number of re-entries: The total number of times the subject
reentered the target circle (the first entry into the target was not considered).
(b) Inaccuracy: The mean of the distances between the center of the target circle
and the position of the CoP during the hold phase.
(c) Unsteadiness: The standard deviation of the distances between the target circle
and position of CoP during the hold phase.
(a) Peak Velocity: Maximum velocity of the CoP during the entire presentation of a
target
Statistical Analysis.
Repeated Measures Analysis of Variance. Similar to the statistical
analysis performed for quiet standing, as described in chapter 2, a general linear
model with repeated measures ANOVA was implemented on each of the response
variables separately. The main questions to answer were (a) Does age affects any of
the response variables during the three phases of posture shifts? and (b) Do the
responses vary significantly for different target angles in the young or elderly
groups? Each subject performed shifts to 10 different targets. Each of the targets
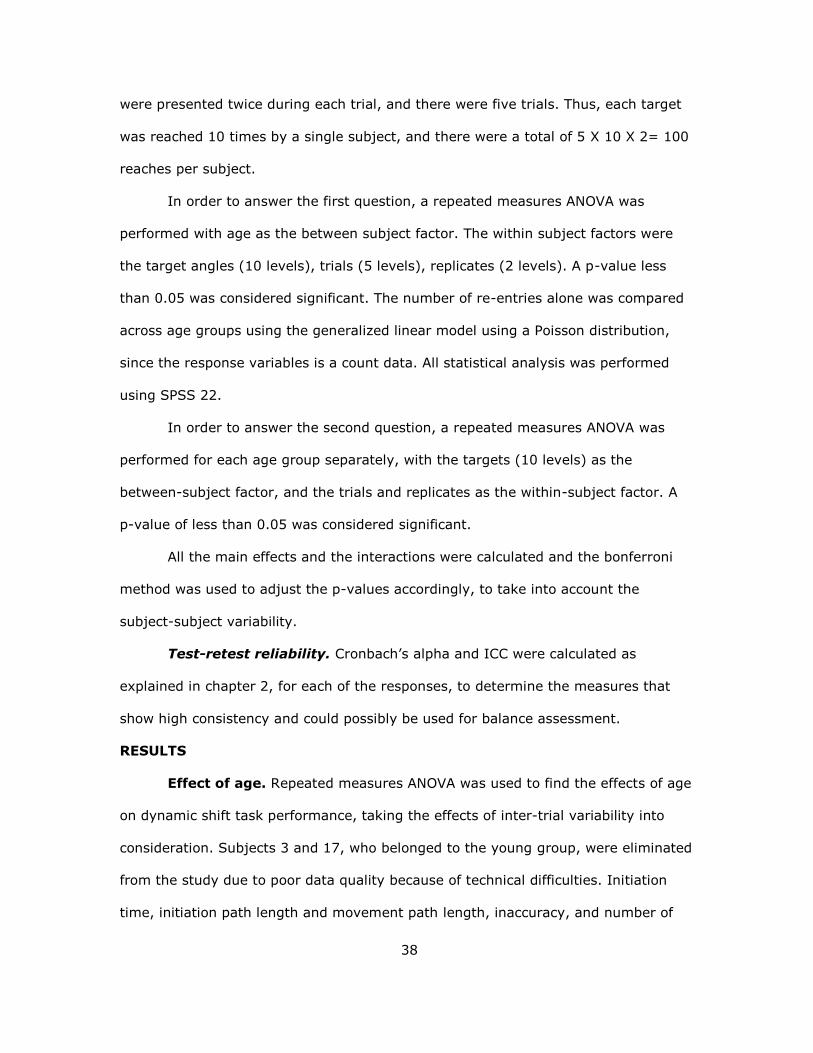
38
were presented twice during each trial, and there were five trials. Thus, each target
was reached 10 times by a single subject, and there were a total of 5 X 10 X 2= 100
reaches per subject.
In order to answer the first question, a repeated measures ANOVA was
performed with age as the between subject factor. The within subject factors were
the target angles (10 levels), trials (5 levels), replicates (2 levels). A p-value less
than 0.05 was considered significant. The number of re-entries alone was compared
across age groups using the generalized linear model using a Poisson distribution,
since the response variables is a count data. All statistical analysis was performed
using SPSS 22.
In order to answer the second question, a repeated measures ANOVA was
performed for each age group separately, with the targets (10 levels) as the
between-subject factor, and the trials and replicates as the within-subject factor. A
p-value of less than 0.05 was considered significant.
All the main effects and the interactions were calculated and the bonferroni
method was used to adjust the p-values accordingly, to take into account the
subject-subject variability.
Test-retest reliability. Cronbach’s alpha and ICC were calculated as
explained in chapter 2, for each of the responses, to determine the measures that
show high consistency and could possibly be used for balance assessment.
RESULTS
Effect of age. Repeated measures ANOVA was used to find the effects of age
on dynamic shift task performance, taking the effects of inter-trial variability into
consideration. Subjects 3 and 17, who belonged to the young group, were eliminated
from the study due to poor data quality because of technical difficulties. Initiation
time, initiation path length and movement path length, inaccuracy, and number of
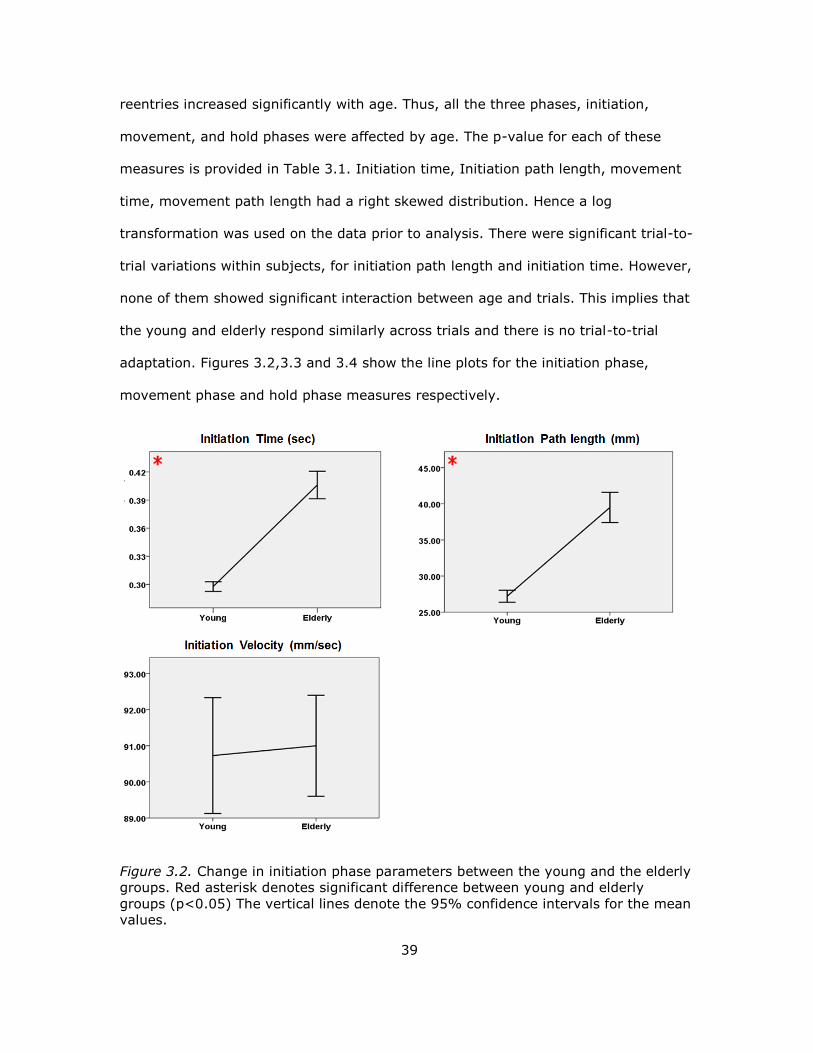
39
reentries increased significantly with age. Thus, all the three phases, initiation,
movement, and hold phases were affected by age. The p-value for each of these
measures is provided in Table 3.1. Initiation time, Initiation path length, movement
time, movement path length had a right skewed distribution. Hence a log
transformation was used on the data prior to analysis. There were significant trial-to-
trial variations within subjects, for initiation path length and initiation time. However,
none of them showed significant interaction between age and trials. This implies that
the young and elderly respond similarly across trials and there is no trial-to-trial
adaptation. Figures 3.2,3.3 and 3.4 show the line plots for the initiation phase,
movement phase and hold phase measures respectively.
Figure 3.2. Change in initiation phase parameters between the young and the elderly
groups. Red asterisk denotes significant difference between young and elderly
groups (p<0.05) The vertical lines denote the 95% confidence intervals for the mean
values.
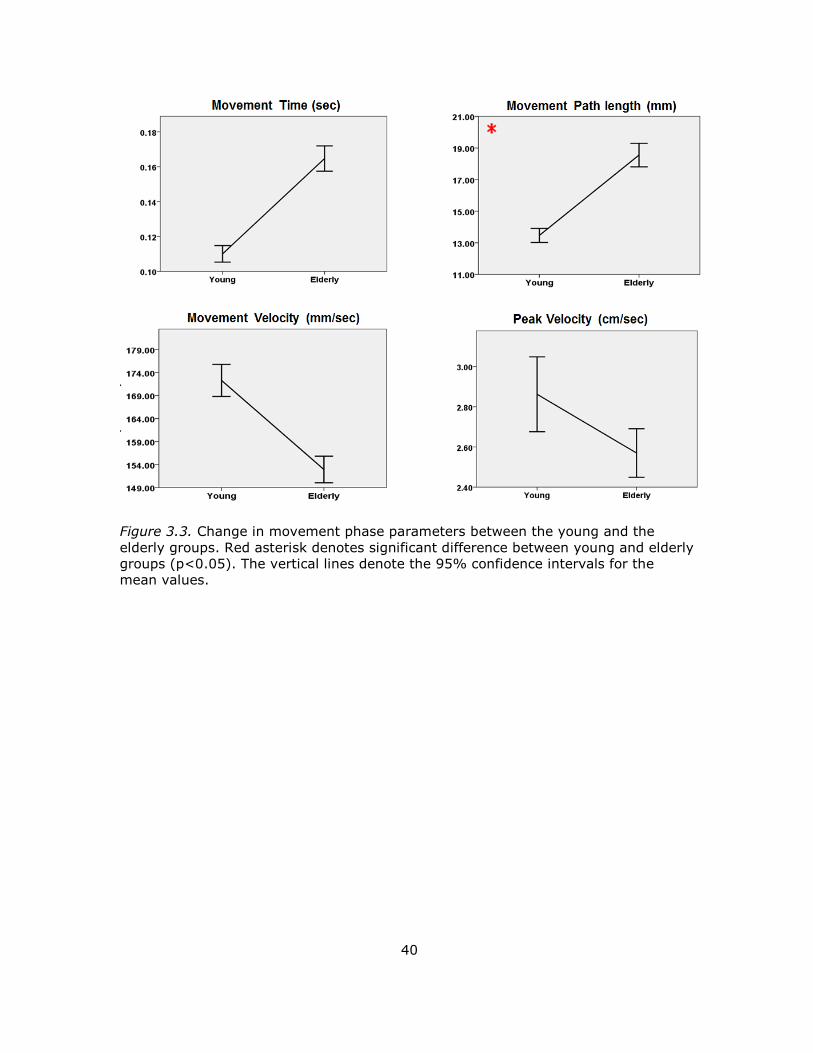
40
Figure 3.3. Change in movement phase parameters between the young and the
elderly groups. Red asterisk denotes significant difference between young and elderly
groups (p<0.05). The vertical lines denote the 95% confidence intervals for the
mean values.
41
Figure 3.4. Change in hold phase parameters, inaccuracy, unsteadiness, and mean
number of re-entries between the young and the elderly groups. Red asterisk
denotes significant difference between young and elderly groups (p<0.05). The
vertical lines denote the 95% confidence intervals for the mean values.
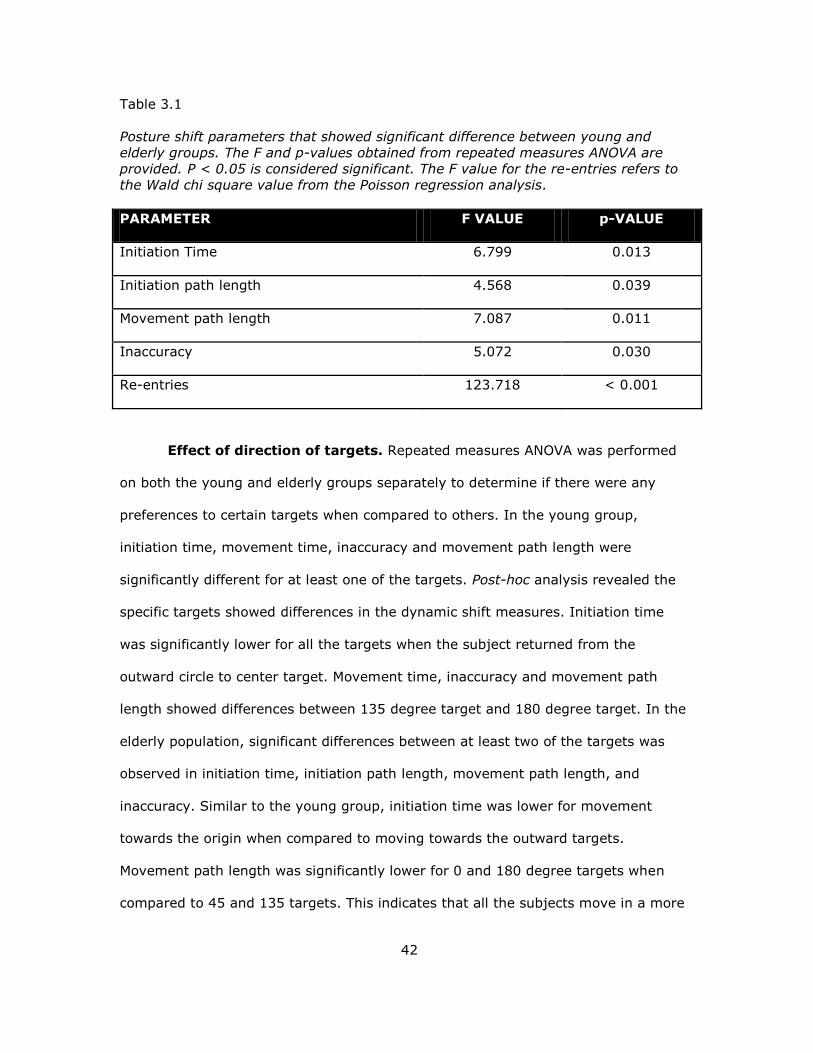
42
Table 3.1
Posture shift parameters that showed significant difference between young and
elderly groups. The F and p-values obtained from repeated measures ANOVA are
provided. P < 0.05 is considered significant. The F value for the re-entries refers to
the Wald chi square value from the Poisson regression analysis.
PARAMETER F VALUE p-VALUE
Initiation Time 6.799 0.013
Initiation path length 4.568 0.039
Movement path length 7.087 0.011
Inaccuracy 5.072 0.030
Re-entries 123.718 < 0.001
Effect of direction of targets. Repeated measures ANOVA was performed
on both the young and elderly groups separately to determine if there were any
preferences to certain targets when compared to others. In the young group,
initiation time, movement time, inaccuracy and movement path length were
significantly different for at least one of the targets. Post-hoc analysis revealed the
specific targets showed differences in the dynamic shift measures. Initiation time
was significantly lower for all the targets when the subject returned from the
outward circle to center target. Movement time, inaccuracy and movement path
length showed differences between 135 degree target and 180 degree target. In the
elderly population, significant differences between at least two of the targets was
observed in initiation time, initiation path length, movement path length, and
inaccuracy. Similar to the young group, initiation time was lower for movement
towards the origin when compared to moving towards the outward targets.
Movement path length was significantly lower for 0 and 180 degree targets when
compared to 45 and 135 targets. This indicates that all the subjects move in a more
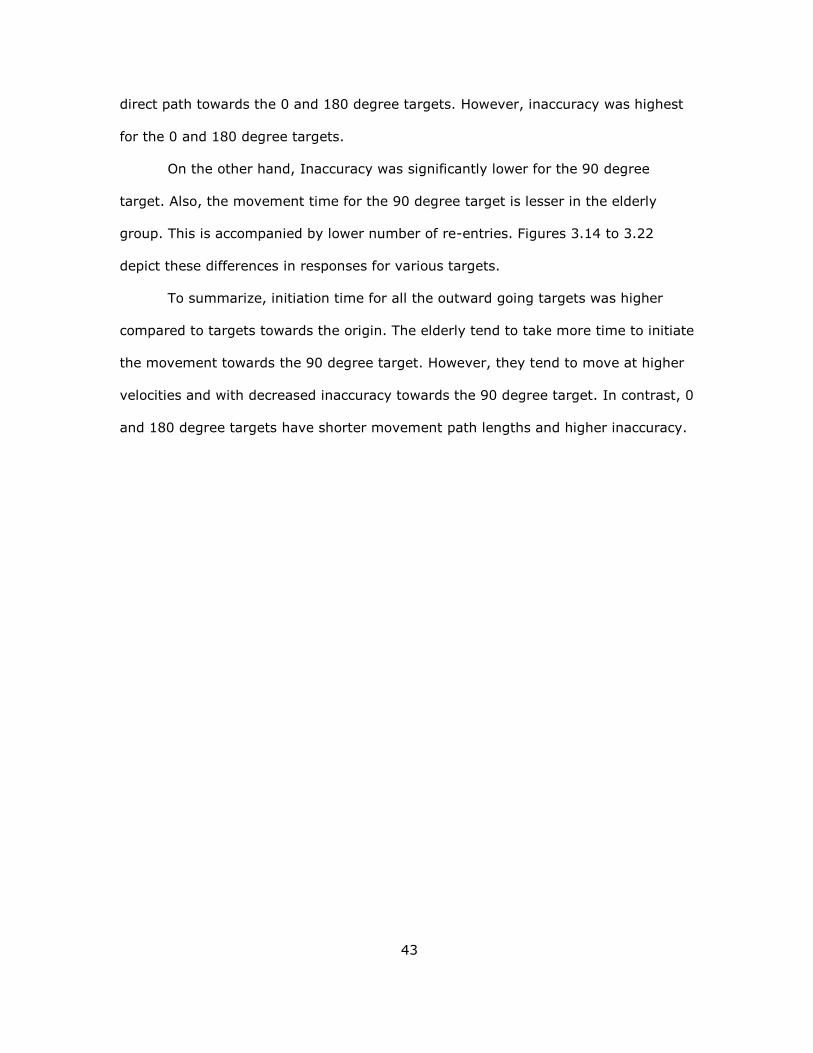
43
direct path towards the 0 and 180 degree targets. However, inaccuracy was highest
for the 0 and 180 degree targets.
On the other hand, Inaccuracy was significantly lower for the 90 degree
target. Also, the movement time for the 90 degree target is lesser in the elderly
group. This is accompanied by lower number of re-entries. Figures 3.14 to 3.22
depict these differences in responses for various targets.
To summarize, initiation time for all the outward going targets was higher
compared to targets towards the origin. The elderly tend to take more time to initiate
the movement towards the 90 degree target. However, they tend to move at higher
velocities and with decreased inaccuracy towards the 90 degree target. In contrast, 0
and 180 degree targets have shorter movement path lengths and higher inaccuracy.
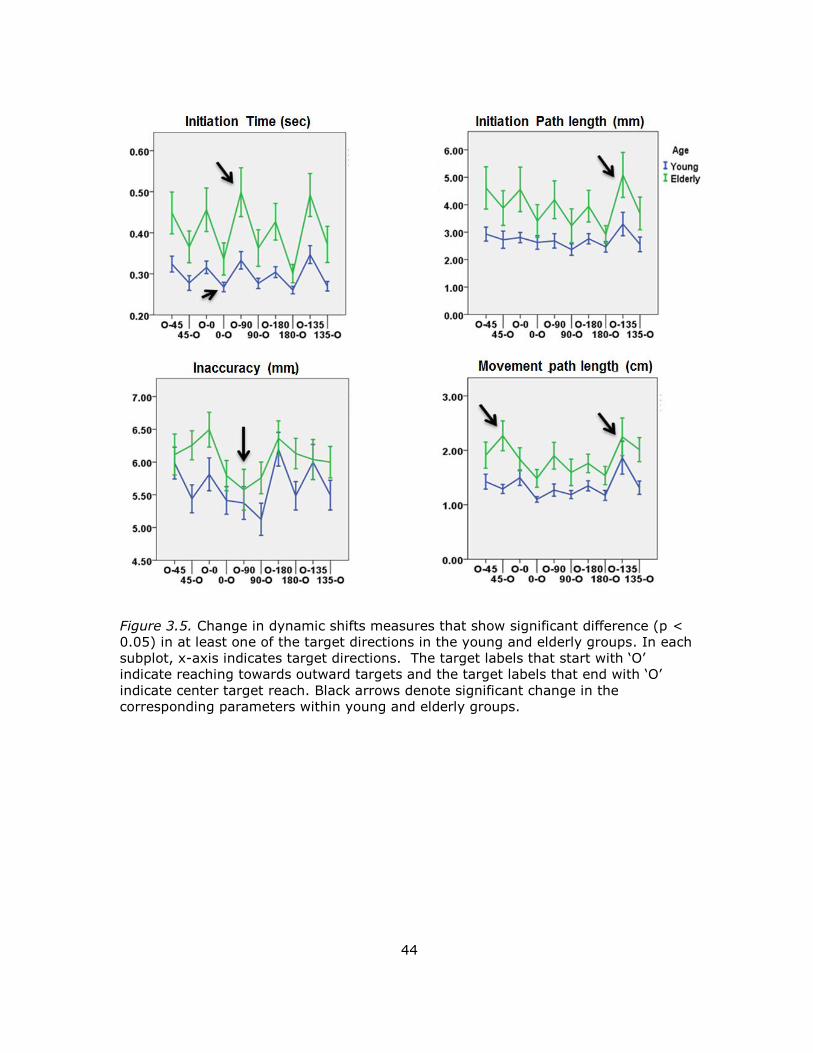
44
Figure 3.5. Change in dynamic shifts measures that show significant difference (p <
0.05) in at least one of the target directions in the young and elderly groups. In each
subplot, x-a is indicates target directions. The target labels that start with ‘ ’
indicate reaching towards outward targets and the target labels that end with ‘ ’
indicate center target reach. Black arrows denote significant change in the
corresponding parameters within young and elderly groups.
45
Test-retest reliability. The Cronbach’s alpha values for all the dynamic shift
measures were greater than 0.8 indicating good consistency across trials. ICC was
greater than 0.8 for all the velocity measures - initiation, movement, and peak
velocity. In addition, the elderly showed ICC greater than 0.8 for initiation time and
path length. This indicates that the parameters were consistent as well as robust and
there was any adaptation across trials.
Table 3.2
Test-retest reliability measures Cronbach’s alpha and Intra-class correlation
coefficient (ICC) for different dynamic shifts measures in the young and elderly
groups. Alpha and ICC values greater than 0.8 mentioned in bold and indicate good
consistency across trials.
YOUNG ELDERLY
MEASURE ALPHA ICC MEASURE ALPHA ICC
Initiation Path
length
0.891 0.602 Initiation Path
length
0.981 0.898
Initiation Time 0.722 0.328 Initiation Time 0.981 0.904
Initiation Velocity 0.962 0.836 Initiation Velocity 0.968 0.838
Movement Path
length
0.763 0.395 Movement Path
length
0.942 0.745
Movement Time 0.923 0.686 Movement Time 0.930 0.704
Movement
Velocity
0.969 0.863 Movement
Velocity
0.957 0.816
Peak Velocity 0.972 0.879 Peak Velocity 0.968 0.851
Reentry 0.949 0.777 Reentry 0.945 0.748
Unsteadiness 0.791 0.437 Unsteadiness 0.898 0.643
Inaccuracy 0.931 0.715 Inaccuracy 0.944 0.768
46
DISCUSSION
A posture shift paradigm was tested to study the effect of age on dynamic
balance. It is important to study the effects of age on dynamic balance since most of
the falls occur during locomotion and activities of daily living such as reaching.
The results demonstrate that age affects initiation time, initiation path length,
movement path length, inaccuracy, and number of reentries. It was observed that
initiation time and initiation path length increase with age. The increase in initiation
time could be due to various reasons such as delayed torque production in the
ankles, muscle weakness, or reduced reaction time once the target is presented.
During the movement phase, the subject voluntarily moves his/her CoP outside the
base of support. The hold phase requires the subject to maintain the CoP in a leaning
position. Increase in inaccuracy with age shows that the elderly find it difficult to
maintain the CoP away from the rest position and as close as possible to the center
of the target circle for a prolonged period of time. An increase in movement path
length and number of reentries in the elderly might indicate the use of hip strategy
during the movement. The control of CoP by the ankle muscles is found to be
insufficient in elderly population.
From the results of the effects of target directions in the young and elderly, it
can be seen that elderly hesitated to shift in the AP direction. They began with a
slower initiation velocity and subsequently increased their movement velocity.
However, inaccuracy was found to be least in the AP direction indicating better
stability in the AP direction. From the results of the quiet standing task, it was
observed that visual input improves the stability in the AP direction rather than ML
direction. This could be the reason for better accuracy in the AP direction. Also,
slower velocity during initiation might have helped to reduce the inaccuracy during
hold phase. On the other hand, inaccuracy increased and movement path length
47
decreased in the ML direction for the elderly indicating poorer performance for
horizontal targets. Initiation velocity for the horizontal targets was also higher than
for the vertical targets. Thus, inaccuracy in the horizontal targets could be due to the
increase in initiation velocity. This implies that elderly find it more difficult to hold
their CoP near the target in the ML direction. Initiation time for outward targets was
higher compared to targets towards the origin. This indicates that subjects were
more comfortable coming back to the center target (equilibrium position) than
moving outside the base of support to reach outward targets. This might also be due
to the subjects’ anticipation to come back to the center target after every target
presentation. The calculation of error or inaccuracy separately for AP and ML
directions may help to better understand and explain the differences in the
performances for different target directions. The direction information will indicate
whether the subject overshot the target or if the subject hesitated to move towards
the target in a particular direction (AP or ML) more than the other.
Many studies have looked at LoS and functional reach, but none of the studies
have derived such detailed measures during the three phases of the target reach
task. Limits of stability and functional reach tests have been studied on people with
stroke, risk of falls and spinal cord injuries. The study on stroke patients showed
increase in CoP excursion and no difference in CoP velocity (Chern et al., 2010).
They also showed a preference towards certain targets depending on the affected
side. Spinal cord injury patients showed increased path length during posture shifts,
especially in the AP direction (Latash, Ferreira, Wieczorek, & Duarte, 2003). This is
the first time posture shifts have been studied thoroughly in healthy elderly. Novel
measures derived in this study are inaccuracy and number of re-entries, which could
potentially be used to also study effects of neurodegenerative disorders and falls.
48
Based on the above observed results, it is clear that aging affects balance
control involved during tasks such as reaching and the proposed dynamic shift
paradigm can be effectively utilized to characterize the effects of aging on balance
control. Further, correlation between measures of dynamic shifts with quiet standing
would be useful in interpreting the alterations in physiological mechanisms
associated with balance control.
49
CHAPTER 4
EFFECTS OF AGING ON GAIT
BACKGROUND
Bipedal locomotion is one of the most complex mechanisms inherited as a
result of evolution. Gait results from a series of intercepted falls from a single limb
stance. Human gait is achieved by successful integration of the visual, vestibular,
and somatosensory information along with motor variables such as muscle strength,
time of activation of the muscles, and joint mobility (Halliday, Winter, Frank, Patla, &
Prince, 1998)
A study proposed by Grillner and Wallen (1985) suggests that there are three
main functions performed by the Central Nervous System (CNS) to deliver normal
gait patterns. Firstly, the rhythmical gait patterns have to be generated for proper
coordination of the different muscle groups. Secondly, the CoM must be controlled
such that it doesn’t make the system unstable. Thirdly, C S must possess adaptive
capabilities to correct gait during perturbations. These functions are found to be
performed by the motor cortex, basal ganglia, and the cerebellum. Basal ganglia is
involved mainly in the initiation and regulation of gait by integrating the information
from the sensory systems. The cerebellum is responsible for gait coordination and
generation of patterns for limb movements. Cerebellar dysfunction is found to cause
difficulty in walking including, variable foot placement, wider base of support, and
abnormal joint coordination (Jeffrey M.Hausdorff, 2005). Loss of function in the basal
ganglia is found to cause difficulty in gait initiation and larger stride to stride
variability (Hausdorff, Cudkowicz, Firtion, Wei, & Goldberger, 1998).
Quiet standing involves maintaining the body’s Co within the base of
support. Walking on the other hand involves stabilizing the body even when the CoM
is outside the base of support (Kirtley, 2006). This type of balance, known as
50
dynamic balance is achieved by a process known as re-stabilization. During this
process, the human body averts a fall after every step, by coordinated positioning of
the stance and swing limb. Thus, walking involves moving the CoM voluntarily
outside the base of support, and further moving the swing limb in such a way as to
re-stabilize the system (Kirtley, 2006). Unlike standing, gait cannot be controlled
majorly by the ankle muscles. It requires the complex coordination of multiple joints
to achieve stability.
Gait Phases. Normal human gait can broadly be divided into two phases:
Stance and Swing phases. Typical gait cycle starts with one heel strike and continues
to the next heel strike by the same foot. Almost 60 % of the gait cycle is the stance
phase, which can be further divided into sub-phases, namely, double support and
single support phases based on the number of limbs on the ground. The single
support phase can further be divided into heel strike, mid-stance, and toe off events.
The double support time acts to stabilize the act of locomotion. Longer double
support times occur during slower movement velocities. The swing phase occupies
40% of the gait cycle and is divided into three sub-phases: initial swing, mid swing,
and terminal swing. Initial swing occurs as soon as the foot is lifted from the ground
and is a period of acceleration of the limb. Mid swing is the period when the stance
and swing limbs align with each other. The terminal swing phase occurs prior to
landing of the foot in the ground and is a phase of deceleration (Kirtley, 2006).
Basic Gait Parameters. Various parameters are extracted from gait patterns
to better understand the differences between normal and pathological gait. A brief
overview of some of the definitions of gait parameters is provided:
Gait cycle: The time period between one heel strike and the subsequent heel strike
by the same foot.
Step Length: Distance between successive heel contacts of the two feet.
51
Stride Length: Distance between heel contacts of the same feet at successive times.
Cadence: Number of steps covered per unit time
Stride velocity: Stride length divided by gait cycle.
Gait cycle time: Time taken to complete one gait cycle, starting from heel strike on
one foot to next subsequent heel strike of the same foot.
Functional assessment of gait: The assessment of gait is important to
detect alterations in dynamic balance due to aging and pathological conditions which
may increase risk of falls (Hausdorff et al., 1998). Different gait assessment
techniques have emerged over the years, from analyzing the center of pressure to
determining joint kinematics and range of motion (Jeffrey M.Hausdorff, 2005). The
most prevalent test undertaken in the clinical setting is the timed-up and go test
(TUG). TUG consists of the subject to raise from a chair, walk 3 m, and return back
to the chair. Most physical therapists carefully observe the subject for any
abnormalities and measure the cadence and gait duration, both of which have been
proven to be valid measures for dynamic balance assessment (Salarian et al., 2010).
Other characteristics of gait that are derived include double support time, stride
length, symmetry and trunk sway (Jeffrey M.Hausdorff, 2005).
Physiological effects of aging on gait: Aging has a profound impact on
gait. It is found that 20% of the elderly adults require assistance during walking and
have difficulty in performing activities of daily living. This has increased the risk of
falls during locomotion, bending over, and turning (Woollacott & Tang, 1997). Some
of the main reasons for gait impairments due to aging include loss of muscle volume,
weakening of muscles, and loss of sensory acuity. Elderly population rely more on
sensory systems such as visual input during walking (Snijders, van de Warrenburg,
Giladi, & Bloem, 2007). This increases the cognitive load and attention required to
52
maintain normal gait. This might be due to the reduction in dopamine producing
neurons by 30-50 % by the age of 65 (Halliday et al., 1998)
The effect of aging can be observed in all stages of the gait cycle. Halliday et.
al (1998) compared gait initiation between young and elderly adults. Results show
that, although there is no significant difference in gait initiation time, the velocity of
the whole body CoM is significantly higher for young than the elderly (Snijders et al.,
2007). This was reflected in the gait patterns as increased stride length of the first
step in young subjects.
Winter and colleagues (1990) compared gait patterns of healthy elderly adults
with young adults. The elderly adults seemed to have larger step widths compared to
young group. This was attributed to reduced moment of CoM in the ML direction to
gain lateral stability. Also, the hip abductors that play a major role in step width
regulation were found to be less effective with age (Woollacott & Tang, 1997). Other
studies have shown significant decrease in stride velocity and stride length in the
elderly, but no variations in gait cycle duration (Kimura, Kobayashi, Nakayama, &
Hanaoka, 2007).
Extensive research has been carried out to study the variability in stride
length and stride time as a consequence of age. Increased stride length variability
(Hausdorff, 2005; Kang & Dingwell, 2008; Woollacott & Tang, 1997) and stride time
variability (Hausdorff, 2005, 2007; Kang & Dingwell, 2008) have been reported in
the elderly population. Most of the studies have related this variability to decrease in
gait speed (Hausdorff et al., 1998). However, others have attributed it to loss of
muscle strength and decreased range of motion (Hausdorff, 2005).
Cao and colleagues (2007) studied the effects of age on gait termination.
They found elderly people took longer time for termination compared to young
adults. This is due to use of two step termination in the elderly as opposed to a one
53
step termination in the young. This is also ascribed to earlier activation of the ankle
muscles in the younger group (Sparrow & Tirosh, 2005).
The measures obtained from timed-up and go tests have been compared
between young, healthy elderly, and elderly fallers. Most of the studies have focused
on the total duration of the task and the sit to walk measures. Kerr and colleagues
(2007) measured the time for sat off, swing off, and stance off during routing TUG
task. They found the sit to walk duration to be significantly longer in elderly fallers,
but not in the two control groups. On the contrary, Buckley and colleagues (2009)
showed significant differences in initiation of gait during sit to walk in healthy elderly
compared to young.
Apart from studying gait during normal walking, studies have looked at
performance of young, elderly, and fallers in a tandem gait task. Difficulty in
performing the tandem gait task was attributed to disturbances in cerebellar
regulation of gait (Lark & Pasupuleti, 2009). One study tested elderly fallers vs. non
fallers in a reduced base of support walking and tandem walking. The results showed
that only some of the subjects in both fallers and non-fallers could not complete the
tandem walk test and fallers took a longer time of completion (Hiura, Nemoto,
Nishisaka, Higashi, & Katoh, 2012; Lark & Pasupuleti, 2009; Louis, Rios, & Rao,
2010; Speers, Ashton-Miller, Schultz, & Alexander, 1998)
METHODOLOGY
Subjects. Subjects who participated in the quiet standing and posture shift
task, also took part in the gait task. Please refer to the methodology provided in
chapter 2 for a detailed description of the recruitment criteria and general
information about the subjects.
54
Experimental Setup. Gait data collection and analysis was performed using
APDM Mobility Lab gait system (APDM Inc, Portland, OR). Mobility Lab is a portable
gait and balance system used to collect, store, and analyze data from inertial
measurement units (IMUs) and calculation of gait related measures. The setup
consists of 6 IMUs, which were attached to the subject non-invasively, over clothing.
The data from the IMUs were wirelessly transmitted to a receiver. The receiver then
synchronized all of the IMU data and fed it into the Mobility Lab software to calculate
measures for different gait tasks. The software consisted of test protocols such as
Instrumented Timed Up and Go (ITUG) and Instrumented long walk (IWalk) for easy
gait data collection and analysis.
Experimental Protocol. The subjects were asked to wear comfortable
shoes. Six inertial sensors were worn using Velcro straps: Two sensors on the
ankles, two sensors on the wrists, one sensor positioned in the lumbar region and
one on the trunk/sternum. They performed three types of over-ground walking
tasks.
ITUG test. During this task, the subject was asked to sit on a chair. Once
the test starts, the subject got up from the chair without using the arm supports,
walked 7 meters, turned and returned to the chair, and sat, again without the
support of the arms of the chair. All the subjects walked in their comfortable pace. A
total of five trials were conducted for each subject.
Tandem walking test. For the tandem walk, the trial started from the
standing position. The subjects were instructed to walk with the heel of one foot
touching the toe of the other, following a straight path as much as possible, for a
distance of 7 meters. Three trials were performed. In case the subject had any
difficulty performing the task or did not volunteer to complete the task, the test was
not conducted.
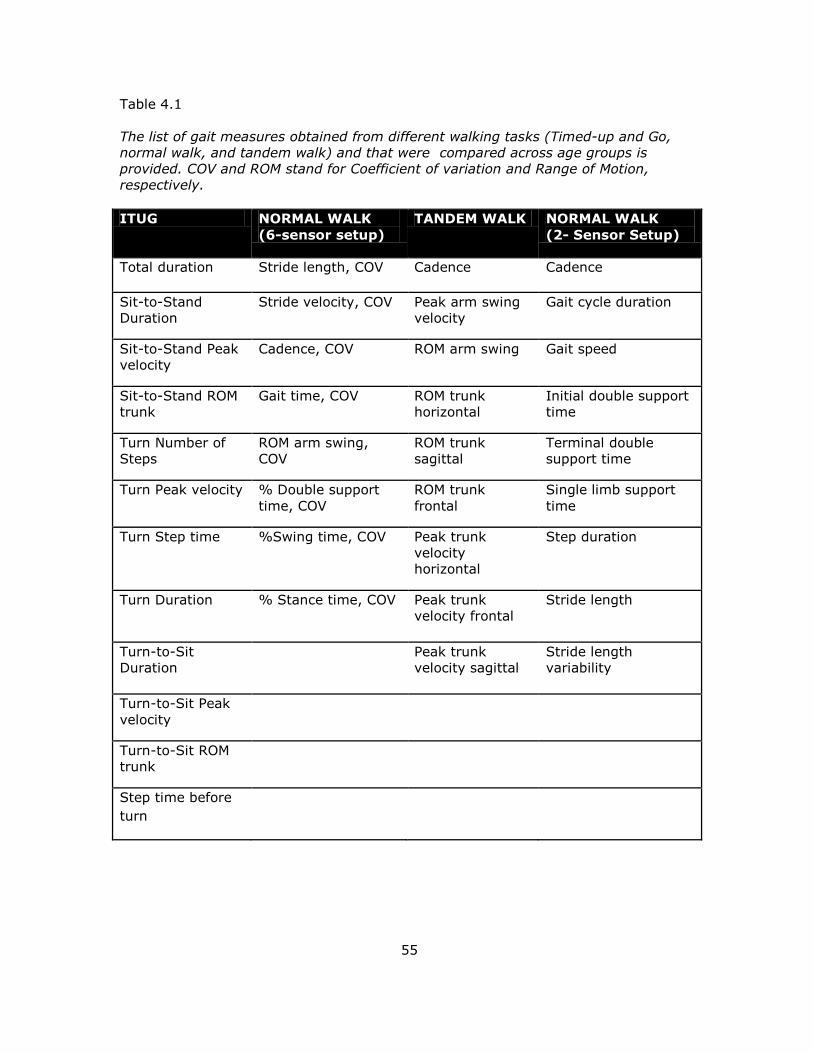
55
Table 4.1
The list of gait measures obtained from different walking tasks (Timed-up and Go,
normal walk, and tandem walk) and that were compared across age groups is
provided. COV and ROM stand for Coefficient of variation and Range of Motion,
respectively.
ITUG NORMAL WALK
(6-sensor setup)
TANDEM WALK NORMAL WALK
(2- Sensor Setup)
Total duration Stride length, COV Cadence Cadence
Sit-to-Stand
Duration
Stride velocity, COV Peak arm swing
velocity
Gait cycle duration
Sit-to-Stand Peak
velocity
Cadence, COV ROM arm swing Gait speed
Sit-to-Stand ROM
trunk
Gait time, COV ROM trunk
horizontal
Initial double support
time
Turn Number of
Steps
ROM arm swing,
COV
ROM trunk
sagittal
Terminal double
support time
Turn Peak velocity % Double support
time, COV
ROM trunk
frontal
Single limb support
time
Turn Step time %Swing time, COV Peak trunk
velocity
horizontal
Step duration
Turn Duration % Stance time, COV Peak trunk
velocity frontal
Stride length
Turn-to-Sit
Duration Peak trunk
velocity sagittal
Stride length
variability
Turn-to-Sit Peak
velocity
Turn-to-Sit ROM
trunk
Step time before
turn
56
Long walking test. During this task, the subjects were asked to walk
normally in their comfortable pace for a distance of about 40 meters. Five trials
were performed. In addition to these trials, in the last 22 subjects tested (6 young,
16 elderly), long walking trials were performed with 2-sensor placement on the top
of each foot for more reliable calculation of stride length as recommended by the
manufacturer of the Mobility Lab gait system, APDM.
Data Analysis. Various measures of gait were obtained from each of the
three tasks of over ground walking. The processing of the data from inertial sensors
and algorithm to calculate the gait measures were carried out using Mobility Lab
software. The following measures were used for comparison between young and
elderly for each of the tasks:
TUG measures. TUG task can be classified into three phases: Sit-to-stand,
walk, and turn-to-sit. Measures of sit-to-stand include (a) sit-to-stand duration, (b)
sit-to-stand peak velocity, and (c) sit-to-stand range of motion (ROM) of the trunk.
The turning parameters obtained from walking phase are (a) Turn duration,
(b) Turn number of steps, (c) Turn peak velocity, (d) Turn step time, and (e) step-
time before turn.
The turn-to-sit parameters are (a) turn-to-sit duration, (b) turn-to-sit peak
velocity, and (c) turn-to-sit range of motion of the trunk.
Tandem walking. The following measures were compared for differences
between young and elderly during tandem walking: (a) Cadence, (b) Peak arm swing
velocity, (c) Coefficient of variation of peak arm swing velocity, (d) ROM of arm
swing, (e) ROM of the trunk in sagittal, frontal, and horizontal planes, and (f) Peak
velocity of the trunk in sagittal, frontal, and horizontal planes.
Long walking: The following measures were derived from the long walking
tasks: (a) stride length, (b) stride length Cofficient of Variation (COV), (c) stride
57
velocity, (d) stride velocity COV, (e) cadence, (f) cadence COV, (g) gait cycle time,
(h) gait cycle time COV, (i) double support percent, (j) swing percent, (k) stance
percent, (l) ROM of arm swing, and (m) ROM of arm swing COV.
Statistical Analysis.
Repeated measures ANOVA. Similar to the statistical analysis performed in
chapters 2 and 3, repeated measures ANOVA was used to investigate the gait
measures affected by age. The between-subject factor was age (2 levels-young,
elderly) and the within-subject factor was trials (5 levels for TUG and walk and 3
levels for tandem walk). The main effects of trials and age and the trials-age
interaction effects were calculated. A p-value less than 0.05 was considered
significant.
RESULTS
Three different tasks were performed by the subjects, TUG, normal walking and
tandem walking. Table 4.2 shows all the measures that showed significant
differences in all three tasks.
Timed-up and go. Repeated measures ANOVA was performed to determine
the effect of age. The Q-Q plots indicated that the distributions of some of the
parameters were right skewed. Thus a log transformation was performed on them
prior to the ANOVA test. The main parameters analyzed from TUG tests are turning
parameters, sit-to-stand, and turn-to-sit parameters. The total duration to perform
TUG increased in the elderly. This was due to increase in the turn duration and turn-
to-sit duration. Turn velocity and turn-to-sit velocity decrease in the elderly. Total
duration also showed increased trial to trial variability, although this effect is taken
into consideration during the statistical analysis. Figure 4.1 shows the changes in
TUG measures that showed significant differences with age.
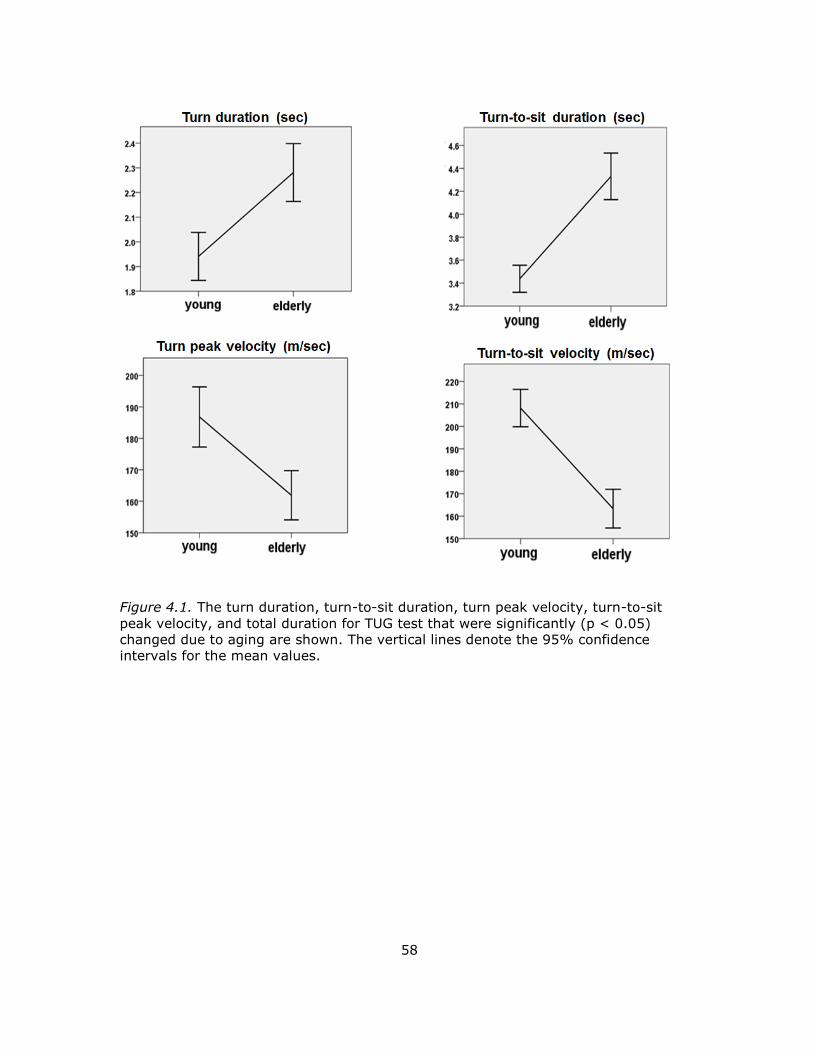
58
Figure 4.1. The turn duration, turn-to-sit duration, turn peak velocity, turn-to-sit
peak velocity, and total duration for TUG test that were significantly (p < 0.05)
changed due to aging are shown. The vertical lines denote the 95% confidence
intervals for the mean values.
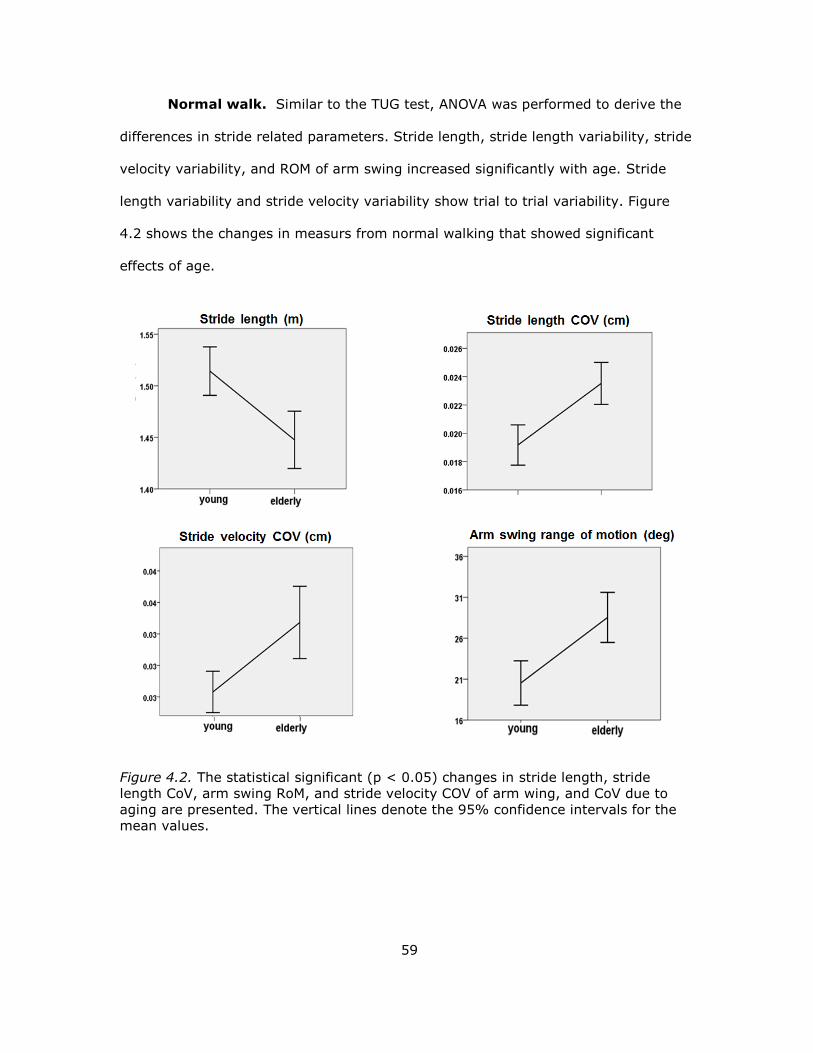
59
Normal walk. Similar to the TUG test, ANOVA was performed to derive the
differences in stride related parameters. Stride length, stride length variability, stride
velocity variability, and ROM of arm swing increased significantly with age. Stride
length variability and stride velocity variability show trial to trial variability. Figure
4.2 shows the changes in measurs from normal walking that showed significant
effects of age.
Figure 4.2. The statistical significant (p < 0.05) changes in stride length, stride
length CoV, arm swing RoM, and stride velocity COV of arm wing, and CoV due to
aging are presented. The vertical lines denote the 95% confidence intervals for the
mean values.
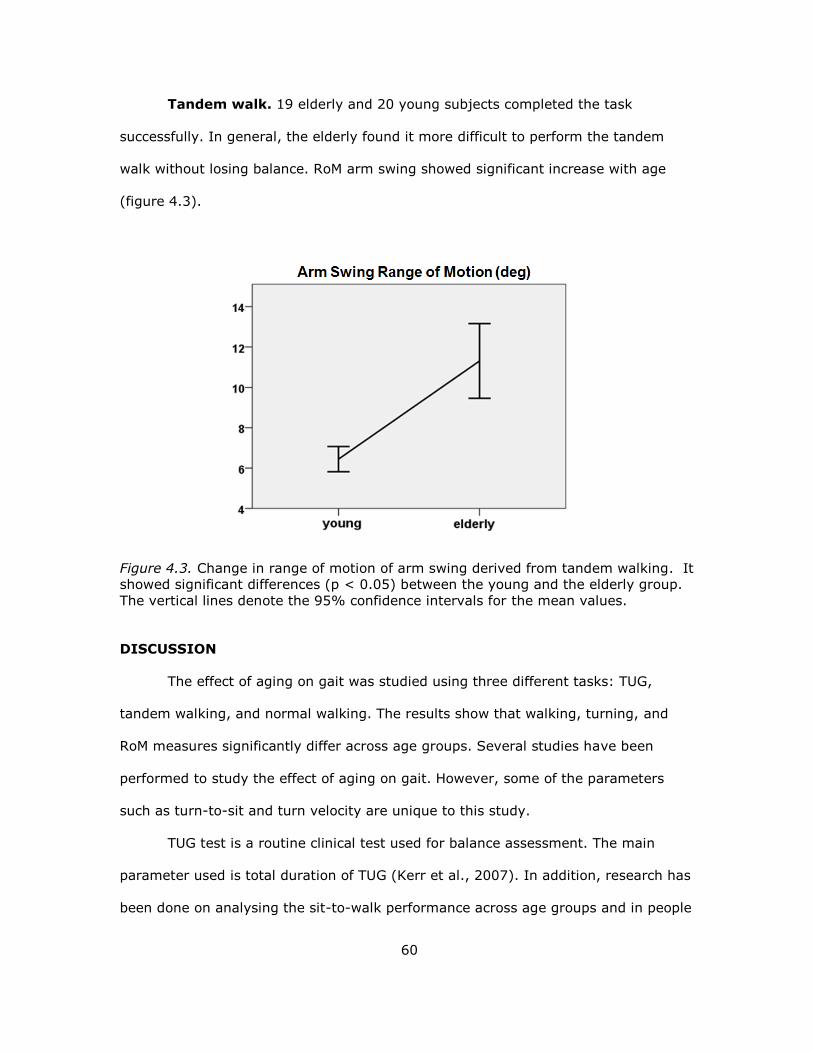
60
Tandem walk. 19 elderly and 20 young subjects completed the task
successfully. In general, the elderly found it more difficult to perform the tandem
walk without losing balance. RoM arm swing showed significant increase with age
(figure 4.3).
Figure 4.3. Change in range of motion of arm swing derived from tandem walking. It
showed significant differences (p < 0.05) between the young and the elderly group.
The vertical lines denote the 95% confidence intervals for the mean values.
DISCUSSION
The effect of aging on gait was studied using three different tasks: TUG,
tandem walking, and normal walking. The results show that walking, turning, and
RoM measures significantly differ across age groups. Several studies have been
performed to study the effect of aging on gait. However, some of the parameters
such as turn-to-sit and turn velocity are unique to this study.
TUG test is a routine clinical test used for balance assessment. The main
parameter used is total duration of TUG (Kerr et al., 2007). In addition, research has
been done on analysing the sit-to-walk performance across age groups and in people
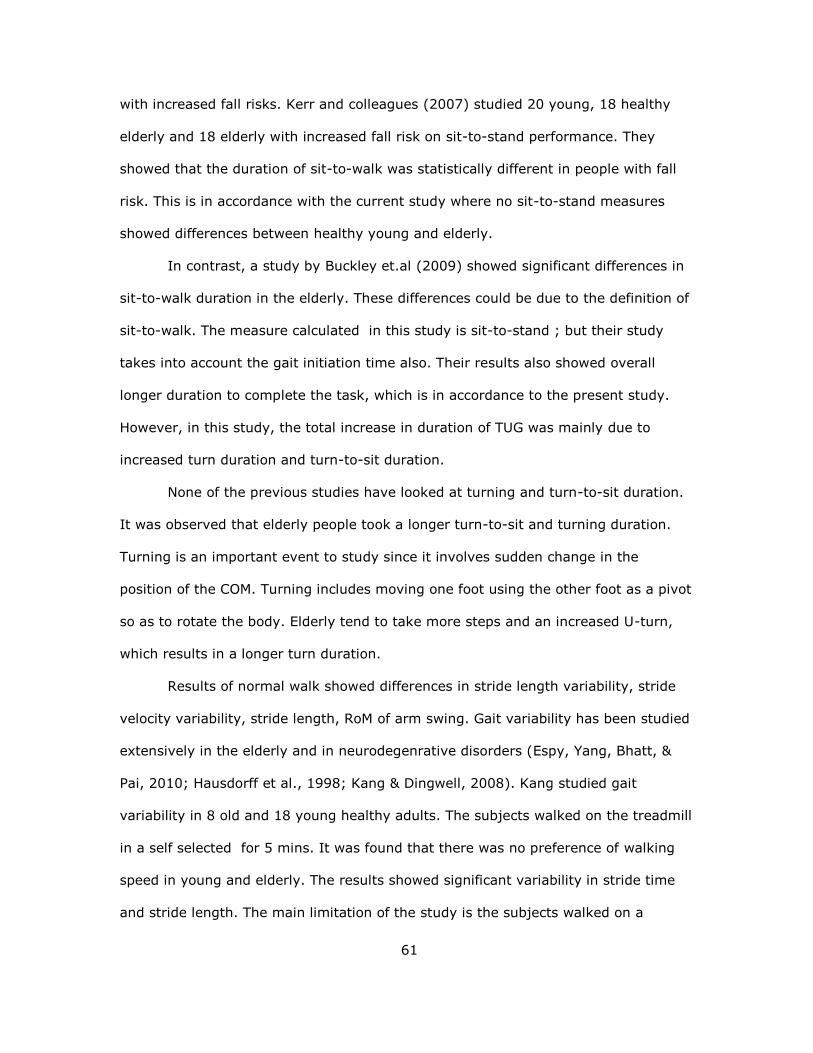
61
with increased fall risks. Kerr and colleagues (2007) studied 20 young, 18 healthy
elderly and 18 elderly with increased fall risk on sit-to-stand performance. They
showed that the duration of sit-to-walk was statistically different in people with fall
risk. This is in accordance with the current study where no sit-to-stand measures
showed differences between healthy young and elderly.
In contrast, a study by Buckley et.al (2009) showed significant differences in
sit-to-walk duration in the elderly. These differences could be due to the definition of
sit-to-walk. The measure calculated in this study is sit-to-stand ; but their study
takes into account the gait initiation time also. Their results also showed overall
longer duration to complete the task, which is in accordance to the present study.
However, in this study, the total increase in duration of TUG was mainly due to
increased turn duration and turn-to-sit duration.
None of the previous studies have looked at turning and turn-to-sit duration.
It was observed that elderly people took a longer turn-to-sit and turning duration.
Turning is an important event to study since it involves sudden change in the
position of the COM. Turning includes moving one foot using the other foot as a pivot
so as to rotate the body. Elderly tend to take more steps and an increased U-turn,
which results in a longer turn duration.
Results of normal walk showed differences in stride length variability, stride
velocity variability, stride length, RoM of arm swing. Gait variability has been studied
extensively in the elderly and in neurodegenrative disorders (Espy, Yang, Bhatt, &
Pai, 2010; Hausdorff et al., 1998; Kang & Dingwell, 2008). Kang studied gait
variability in 8 old and 18 young healthy adults. The subjects walked on the treadmill
in a self selected for 5 mins. It was found that there was no preference of walking
speed in young and elderly. The results showed significant variability in stride time
and stride length. The main limitation of the study is the subjects walked on a
62
treadmill in a constant speed that must’ve influenced the variability in stride time
and stride length. Also, Stride velocity variability couldn’t be determined. On the
other hand, Our study involved over-ground walking and showed significant stride
velocity and stride length variability but not stride time variability. The variability in
time increased in elderly but did not show statistical significance.
Shorter step length and larger gait velocity is associated with prevention of
falls (Espy et al., 2010). Kimura et al studied 20 young and 52 elderly participants
for differences in stride length and velocity. He found reduced stride lengths and
speed in elderly compared to young, and no difference in gait cycle duration. This
agrees with the results of the present study. Although not signficant, both studies
show increased double support and stance phase duration in the elderly. None of the
previous gait studied looked at range of motion of the arm swing in aging. Brujin et
al. studied the use of arm swing in gait. They found that arm swing reduces the
angular momentum and energy expenditure during walking. Although arm swings do
not improve stability, they help to recover from a perturbation. Significant increase
in RoM of arm swing was observed in the elderly indicating prevention mechanism
for falls during locomotion. Arm swings are also seen to reduce the lateral movement
of the CoM and lower the momentum required to counteract the swinging legs.
(Arellano & Kram, 2011). Thus, reduced stride lengths and increased RoM arm swing
are indicators of compensatory mechanisms used by the elderly, to prevent loss of
balance during locomotion.
Tandem walking has not been studied as much as normal walking to
determine age related differences. Verlinden and collagues (2013) assessed the risk
of falls in the elderly by looking at tandem gait, turning, and normal walking. 1,500
adults over the age of 50 were recruited to perform tandem and normal walking. The
results showed that measures associated with tandem walking such as number of
63
steps and duration were different across age groups and is a marker for risk of
falling. Speers et al (1998) studied tandem standing and walking to find age related
differences. The success rate of completion of tandem walk was higher in the young
group. Range of motion of the arm during tandem walking has never been studied
before. It was observed that elderly extended their arms outward to stabilize
themselves during tandem walk. ROM was significantly increased in elderly during
tandem walking indicating that they use more of their arms to recover from
perturbations by reducing the angular momentum. It was also observed that step
width and arm swings play important roles in lateral stabilization of the CoM, apart
from reducing the energy cost. Since tandem walking reduces the step width,
increased RoM of the arm could have been used to compensate for it and to improve
the lateral stabilization of CoM (Arellano & Kram, 2011).
64
CHAPTER 5
CORRELATION BETWEEN STANDING, POSTURE SHIFT AND GAIT
The various measures obtained from quiet standing, posture shifts, and gait were
analyzed to see if they were correlated, which may help to better interpret overall
differences in postural control observed across age groups. This may also help to
understand how the novel measures derived from dynamic shifts are related to
widely used tests for balance assessment.
CORRELATION BETWEEN QUIET STANDING AND POSTURE SHIFT
Each of the parameters derived from quiet standing in the eyes open condition were
compared with every other measures obtained from posture shift. The pearson’s
correlation coefficient was determined for the young and the elderly group
separately. A p-value less than 0.05 was considered to be significant.
Results. Some of the parameters of quiet standing in the eyes open condition
and dynamic shifts showed significant correlations in both the young and elderly
groups. The strength of the correlation was determined according to the classification
given by Dancey and Reidy (2004). Pearson correlation coefficient between 0.6-0.7
was considered moderate correlation and 0.7-0.9 was considered strong correlation.
Table 5.1 shows the correlations in the young and elderly along with the correlation
strength.
In the young group, movement pathlength during dynamic shifts was
moderately correlated with sway area, total excursion and total excursion AP during
quiet standing. This indicates that higher total excursion observed during quiet
standing reflects as increase in movement length during posture shifts. The subjects
swayed more before achieving the target. The total excursion in ML direction was
moderately correlated with unsteadiness.
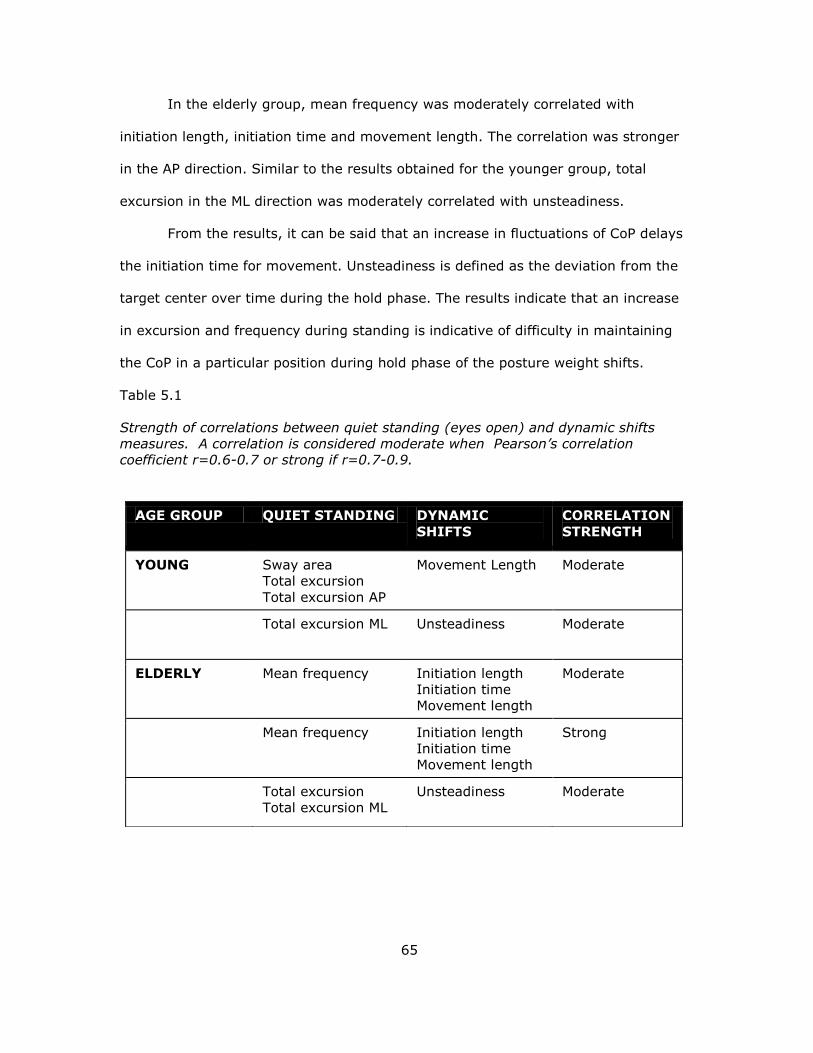
65
In the elderly group, mean frequency was moderately correlated with
initiation length, initiation time and movement length. The correlation was stronger
in the AP direction. Similar to the results obtained for the younger group, total
excursion in the ML direction was moderately correlated with unsteadiness.
From the results, it can be said that an increase in fluctuations of CoP delays
the initiation time for movement. Unsteadiness is defined as the deviation from the
target center over time during the hold phase. The results indicate that an increase
in excursion and frequency during standing is indicative of difficulty in maintaining
the CoP in a particular position during hold phase of the posture weight shifts.
Table 5.1
Strength of correlations between quiet standing (eyes open) and dynamic shifts
measures. A correlation is considered moderate when Pearson’s correlation
coefficient r=0.6-0.7 or strong if r=0.7-0.9.
AGE GROUP QUIET STANDING DYNAMIC
SHIFTS
CORRELATION
STRENGTH
YOUNG Sway area
Total excursion
Total excursion AP
Movement Length Moderate
Total excursion ML Unsteadiness Moderate
ELDERLY Mean frequency Initiation length
Initiation time
Movement length
Moderate
Mean frequency Initiation length
Initiation time
Movement length
Strong
Total excursion
Total excursion ML
Unsteadiness Moderate
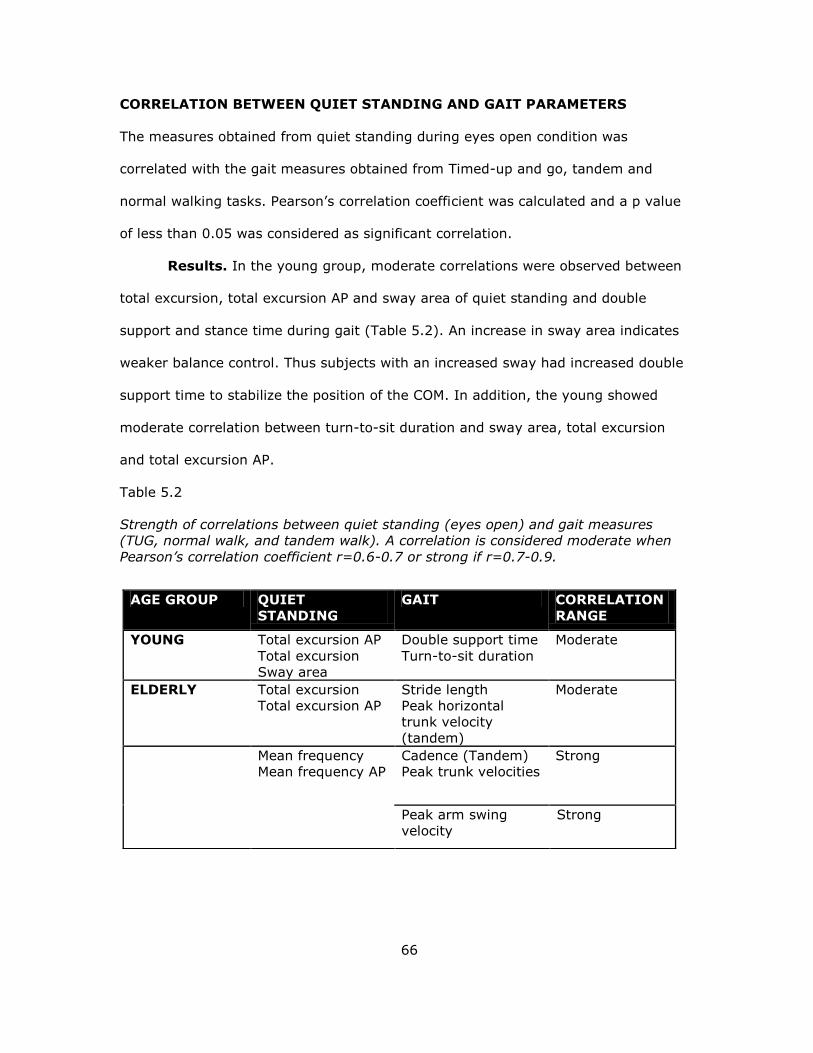
66
CORRELATION BETWEEN QUIET STANDING AND GAIT PARAMETERS
The measures obtained from quiet standing during eyes open condition was
correlated with the gait measures obtained from Timed-up and go, tandem and
normal walking tasks. Pearson’s correlation coefficient was calculated and a p value
of less than 0.05 was considered as significant correlation.
Results. In the young group, moderate correlations were observed between
total excursion, total excursion AP and sway area of quiet standing and double
support and stance time during gait (Table 5.2). An increase in sway area indicates
weaker balance control. Thus subjects with an increased sway had increased double
support time to stabilize the position of the COM. In addition, the young showed
moderate correlation between turn-to-sit duration and sway area, total excursion
and total excursion AP.
Table 5.2
Strength of correlations between quiet standing (eyes open) and gait measures
(TUG, normal walk, and tandem walk). A correlation is considered moderate when
Pearson’s correlation coefficient r=0.6-0.7 or strong if r=0.7-0.9.
AGE GROUP QUIET
STANDING
GAIT CORRELATION
RANGE
YOUNG Total excursion AP
Total excursion
Sway area
Double support time
Turn-to-sit duration
Moderate
ELDERLY Total excursion
Total excursion AP
Stride length
Peak horizontal
trunk velocity
(tandem)
Moderate
Mean frequency
Mean frequency AP
Cadence (Tandem)
Peak trunk velocities
Strong
Peak arm swing
velocity
Strong
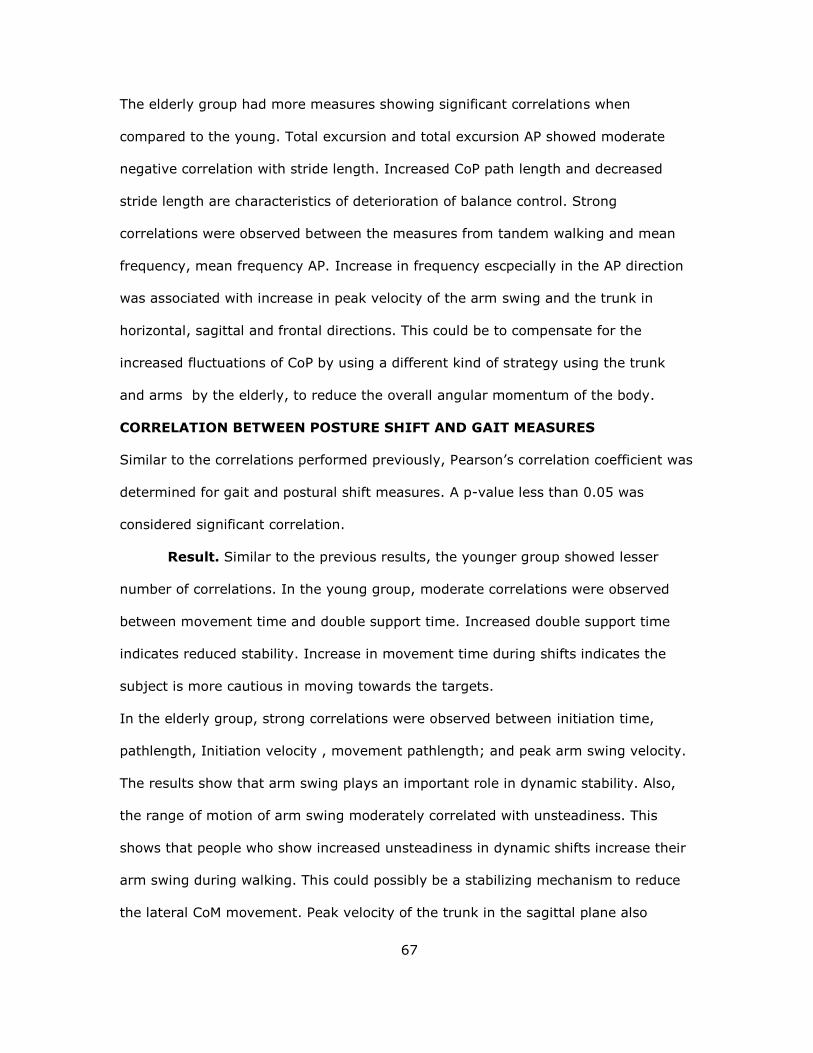
67
The elderly group had more measures showing significant correlations when
compared to the young. Total excursion and total excursion AP showed moderate
negative correlation with stride length. Increased CoP path length and decreased
stride length are characteristics of deterioration of balance control. Strong
correlations were observed between the measures from tandem walking and mean
frequency, mean frequency AP. Increase in frequency escpecially in the AP direction
was associated with increase in peak velocity of the arm swing and the trunk in
horizontal, sagittal and frontal directions. This could be to compensate for the
increased fluctuations of CoP by using a different kind of strategy using the trunk
and arms by the elderly, to reduce the overall angular momentum of the body.
CORRELATION BETWEEN POSTURE SHIFT AND GAIT MEASURES
Similar to the correlations performed previously, Pearson’s correlation coefficient was
determined for gait and postural shift measures. A p-value less than 0.05 was
considered significant correlation.
Result. Similar to the previous results, the younger group showed lesser
number of correlations. In the young group, moderate correlations were observed
between movement time and double support time. Increased double support time
indicates reduced stability. Increase in movement time during shifts indicates the
subject is more cautious in moving towards the targets.
In the elderly group, strong correlations were observed between initiation time,
pathlength, Initiation velocity , movement pathlength; and peak arm swing velocity.
The results show that arm swing plays an important role in dynamic stability. Also,
the range of motion of arm swing moderately correlated with unsteadiness. This
shows that people who show increased unsteadiness in dynamic shifts increase their
arm swing during walking. This could possibly be a stabilizing mechanism to reduce
the lateral CoM movement. Peak velocity of the trunk in the sagittal plane also
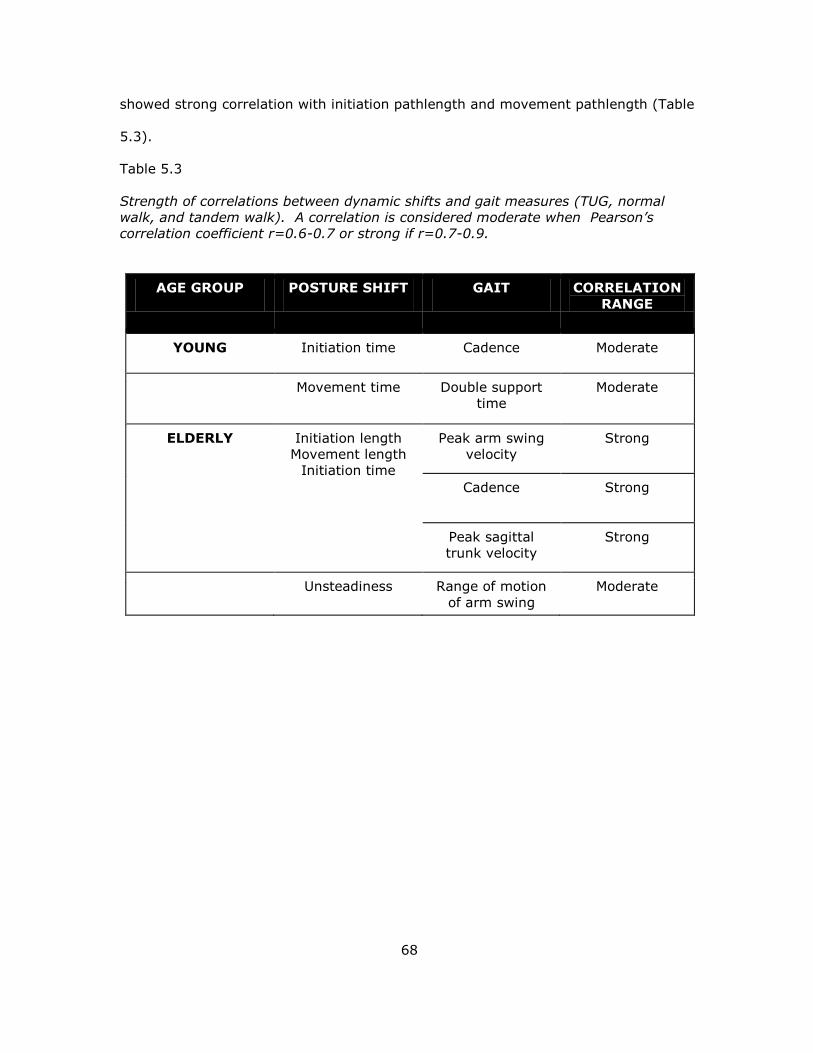
68
showed strong correlation with initiation pathlength and movement pathlength (Table
5.3).
Table 5.3
Strength of correlations between dynamic shifts and gait measures (TUG, normal
walk, and tandem walk). A correlation is considered moderate when Pearson’s
correlation coefficient r=0.6-0.7 or strong if r=0.7-0.9.
AGE GROUP POSTURE SHIFT GAIT CORRELATION
RANGE
YOUNG Initiation time Cadence Moderate
Movement time Double support
time
Moderate
ELDERLY Initiation length
Movement length
Initiation time
Peak arm swing
velocity
Strong
Cadence Strong
Peak sagittal
trunk velocity
Strong
Unsteadiness Range of motion
of arm swing
Moderate
69
CHAPTER 6
CONCLUSIONS
The main aim of this thesis was to determine the effects of aging on balance
control during standing and walking. Three different experimental protocols were
designed to investigate different aspects of balance control to efficiently characterize
changes in balance control due to aging. Furthermore, correlations between various
balance measures obtained during different static and dynamic balance tasks were
studied.
The first experiment based on quiet standing was used to determine the
effects of age and visual input on balance control. The results of the task provided
useful insights on the static balance control system and its deterioration with age.
Mean velocity and total excursion were found to be the most reliable measures to
assess balance during standing. Other important measures include sway area and
mean frequency. One important conclusion from the study was that the control of
balance in the AP direction heavily relies on visual information. Also, the eldery
population tend to rely more on visual input for better balance control.
The second experiment required the subjects to reach for targets in different
directions that required them to voluntarily shift their CoP outside the base of
support. The results showed increased initiation time and pathlength, movement
length, inaccuracy, and number of reentries in elderly participants. This increase
could be associated with increased use of hip strategy when compared to the ankle
strategy in the elderly group.
The third experiment tested balance control during walking. Three tasks:
TUG, normal, and tandem walking were performed. Age affected turn duration, turn
velocity, turn-to-sit duration and velocity during TUG. Shorter stride length and
increased variabilties in stride length and stride velocity with increased age were
70
observed during normal walking. Most elderly found the tandem walking difficult to
perform. However, among the ones who completed the task, the ROM arm were
significantly higher compared to the young adults. In the elderly group, ROM arm
swing was higher during normal walking too. It can be concluded that arm swing and
turn duration can be utilized to assess balance control, apart from stride related
parameters.
Some interesting correlations were observed between the measures from all
three different experimental tasks. The correlation between the measures were
higher in elderly compared to that of the young group. The dynamic shift measures
initiation pathlength and time, movement pathlength, and unsteadiness showed good
correlations with mean velocity and sway area in the young; and mean frequency
and mean frequency AP in the elderly. Very high correlations were observed in the
elderly, between dynamic shift and gait measures, specifically for tandem walking.
RoM of arm swing and peak arm swing velocity were positively correlated with
initiation and movement parameters. This may imply that dynamic posture shifts
paradigm has a potential use in assessing balance control.
However, very high confidence intervals were observed for the elderly
compared to the young in all the measures tested. This may suggest that balance
control in elderly is more affected in a manner that alters both static and dynamic
balance.
Overall, this study emphasized on gait and balance measures that are often
ignored, such as turning and arm swing measures. This study also found new
measures, inaccuracy and number of re-entries, that were significantly different
between the young and eldlerly. The results obtained from this study can further be
used to compare people with increased fall risks with healthy elderly and young
adults. Also, the experimental protocols and various measures used in the study may
71
be helpful for better characterization of balance control in neurodegenerative
diseases such as Parkinson’s and Hungtington’s disease.
72
REFERENCES
Abrahamova, D., & Hlavacka, F. (2008). Age-related changes of human balance
during quiet stance. Physiol Res, 57(6), 957-964.
Alahmari, K. A., Marchetti, G. F., Sparto, P. J., Furman, J. M., & Whitney, S. L.
(2014). Estimating postural control with the balance rehabilitation unit:
measurement consistency, accuracy, validity, and comparison with dynamic
posturography. Arch Phys Med Rehabil, 95(1), 65-73. doi:
10.1016/j.apmr.2013.09.011
Amiridis, I. G., Hatzitaki, V., & Arabatzi, F. (2003). Age-induced modifications of
static postural control in humans. Neurosci Lett, 350(3), 137-140. doi:
10.1016/s0304-3940(03)00878-4
Arellano, C. J., & Kram, R. (2011). The effects of step width and arm swing on
energetic cost and lateral balance during running. J Biomech, 44(7), 1291-
1295. doi: 10.1016/j.jbiomech.2011.01.002
Barak, Y., Wagenaar, R. C., & Holt, K. G. (2006). Gait characteristics of elderly
people with a history of falls: a dynamic approach. Phys Ther, 86(11), 1501-
1510. doi: 10.2522/ptj.20050387
Breniere, Y., & Ribreau, C. (1998). A double-inverted pendulum model for studying
the adaptability of postural control to frequency during human stepping in
place. Biol Cybern, 79(4), 337-345.
Buckley, T., Pitsikoulis, C., Barthelemy, E., & Hass, C. J. (2009). Age impairs sit-to-
walk motor performance. J Biomech, 42(14), 2318-2322. doi:
10.1016/j.jbiomech.2009.06.023
Cao, Z. B., Maeda, A., Shima, N., Kurata, H., & Nishizono, H. (2007). The effect of a
12-week combined exercise intervention program on physical performance
and gait kinematics in community-dwelling elderly women. J Physiol
Anthropol, 26(3), 325-332.
Cenciarini, M., Loughlin, P. J., Sparto, P. J., & Redfern, M. S. (2009). Medial-lateral
postural control in older adults exhibits increased stiffness and damping. Conf
Proc IEEE Eng Med Biol Soc, 2009, 7006-7009. doi:
10.1109/IEMBS.2009.5333838
73
Cenciarini, M., Loughlin, P. J., Sparto, P. J., & Redfern, M. S. (2010). Stiffness and
damping in postural control increase with age. IEEE Trans Biomed Eng, 57(2),
267-275. doi: 10.1109/TBME.2009.2031874
Cham, R., Perera, S., Studenski, S. A., & Bohnen, N. I. (2007). Striatal dopamine
denervation and sensory integration for balance in middle-aged and older
adults. Gait Posture, 26(4), 516-525. doi: 10.1016/j.gaitpost.2006.11.204
Chern, J. S., Lo, C. Y., Wu, C. Y., Chen, C. L., Yang, S., & Tang, F. T. (2010).
Dynamic postural control during trunk bending and reaching in healthy adults
and stroke patients. Am J Phys Med Rehabil, 89(3), 186-197. doi:
10.1097/PHM.0b013e3181c56287
Collins, J., & De Luca, C. (1994). Random Walking during Quiet Standing. Physical
Review Letters, 73(5), 764-767. doi: 10.1103/PhysRevLett.73.764
Dancey, C. P., & Reidy, J. (2004). Statistics without maths for psychology : using
SPSS for Windows (3rd ed.). New York: Prentice Hall.
Deliagina, T. G., Orlovsky, G. N., Zelenin, P. V., & Beloozerova, I. N. (2006). Neural
bases of postural control. Physiology (Bethesda), 21, 216-225. doi:
10.1152/physiol.00001.2006
Doyle, R. J., Hsiao-Wecksler, E. T., Ragan, B. G., & Rosengren, K. S. (2007).
Generalizability of center of pressure measures of quiet standing. Gait
Posture, 25(2), 166-171. doi: 10.1016/j.gaitpost.2006.03.004
Eikema, D. J., Hatzitaki, V., Tzovaras, D., & Papaxanthis, C. (2012). Age-dependent
modulation of sensory reweighting for controlling posture in a dynamic virtual
environment. Age (Dordr), 34(6), 1381-1392. doi: 10.1007/s11357-011-
9310-9
Espy, D. D., Yang, F., Bhatt, T., & Pai, Y. C. (2010). Independent influence of gait
speed and step length on stability and fall risk. Gait Posture, 32(3), 378-382.
doi: 10.1016/j.gaitpost.2010.06.013
Fujita, T., Nakamura, S., Ohue, M., Fujii, Y., Miyauchi, A., Takagi, Y., & Tsugeno, H.
(2005). Effect of age on body sway assessed by computerized posturography.
J Bone Miner Metab, 23(2), 152-156. doi: 10.1007/s00774-004-0554-7
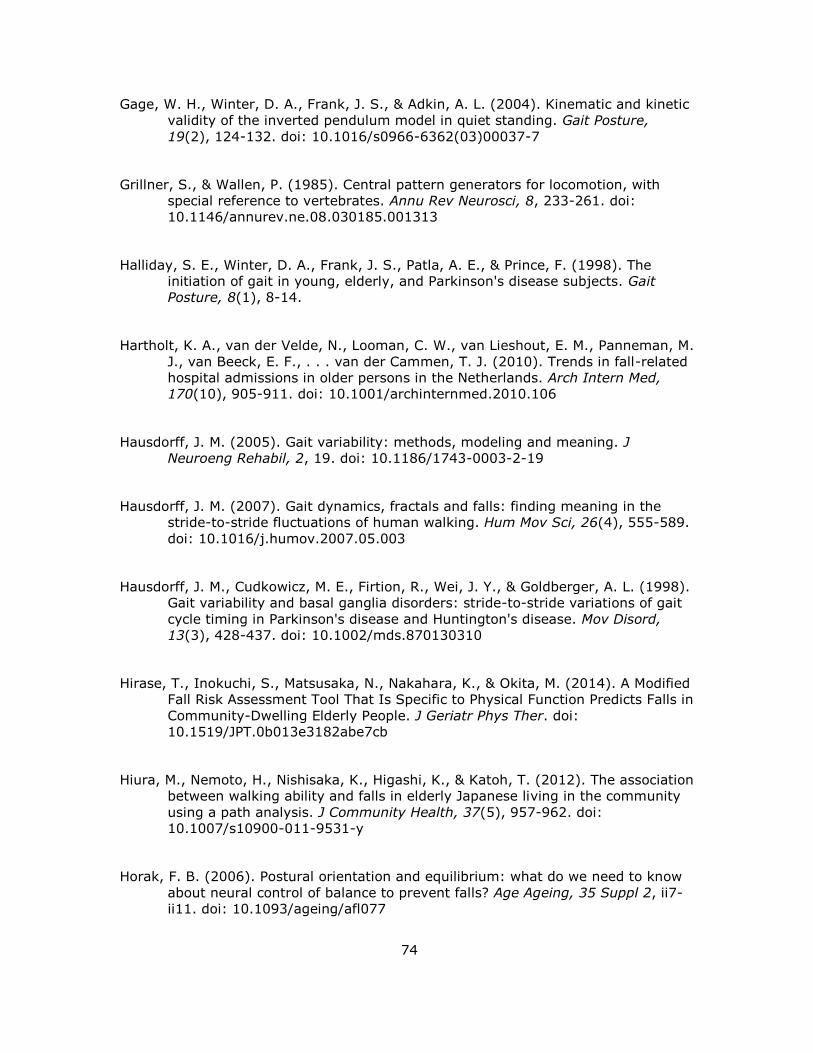
74
Gage, W. H., Winter, D. A., Frank, J. S., & Adkin, A. L. (2004). Kinematic and kinetic
validity of the inverted pendulum model in quiet standing. Gait Posture,
19(2), 124-132. doi: 10.1016/s0966-6362(03)00037-7
Grillner, S., & Wallen, P. (1985). Central pattern generators for locomotion, with
special reference to vertebrates. Annu Rev Neurosci, 8, 233-261. doi:
10.1146/annurev.ne.08.030185.001313
Halliday, S. E., Winter, D. A., Frank, J. S., Patla, A. E., & Prince, F. (1998). The
initiation of gait in young, elderly, and Parkinson's disease subjects. Gait
Posture, 8(1), 8-14.
Hartholt, K. A., van der Velde, N., Looman, C. W., van Lieshout, E. M., Panneman, M.
J., van Beeck, E. F., . . . van der Cammen, T. J. (2010). Trends in fall-related
hospital admissions in older persons in the Netherlands. Arch Intern Med,
170(10), 905-911. doi: 10.1001/archinternmed.2010.106
Hausdorff, J. M. (2005). Gait variability: methods, modeling and meaning. J
Neuroeng Rehabil, 2, 19. doi: 10.1186/1743-0003-2-19
Hausdorff, J. M. (2007). Gait dynamics, fractals and falls: finding meaning in the
stride-to-stride fluctuations of human walking. Hum Mov Sci, 26(4), 555-589.
doi: 10.1016/j.humov.2007.05.003
Hausdorff, J. M., Cudkowicz, M. E., Firtion, R., Wei, J. Y., & Goldberger, A. L. (1998).
Gait variability and basal ganglia disorders: stride-to-stride variations of gait
cycle timing in Parkinson's disease and Huntington's disease. Mov Disord,
13(3), 428-437. doi: 10.1002/mds.870130310
Hirase, T., Inokuchi, S., Matsusaka, N., Nakahara, K., & Okita, M. (2014). A Modified
Fall Risk Assessment Tool That Is Specific to Physical Function Predicts Falls in
Community-Dwelling Elderly People. J Geriatr Phys Ther. doi:
10.1519/JPT.0b013e3182abe7cb
Hiura, M., Nemoto, H., Nishisaka, K., Higashi, K., & Katoh, T. (2012). The association
between walking ability and falls in elderly Japanese living in the community
using a path analysis. J Community Health, 37(5), 957-962. doi:
10.1007/s10900-011-9531-y
Horak, F. B. (2006). Postural orientation and equilibrium: what do we need to know
about neural control of balance to prevent falls? Age Ageing, 35 Suppl 2, ii7-
ii11. doi: 10.1093/ageing/afl077
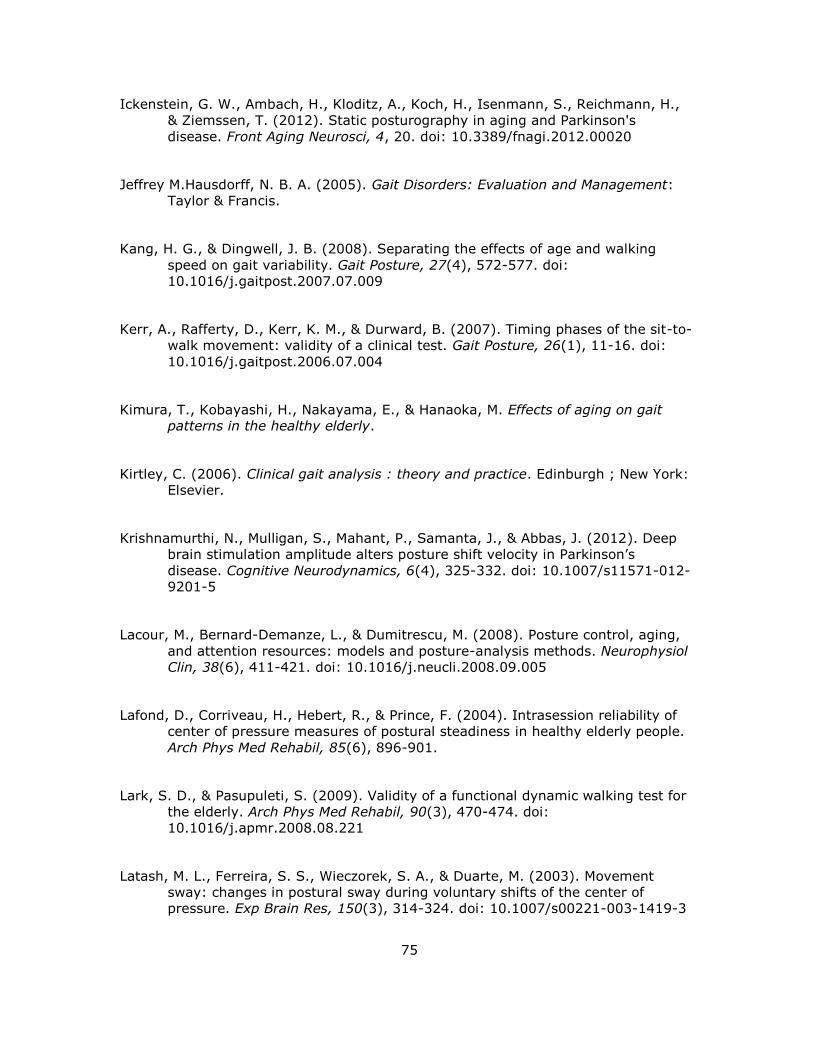
75
Ickenstein, G. W., Ambach, H., Kloditz, A., Koch, H., Isenmann, S., Reichmann, H.,
& Ziemssen, T. (2012). Static posturography in aging and Parkinson's
disease. Front Aging Neurosci, 4, 20. doi: 10.3389/fnagi.2012.00020
Jeffrey M.Hausdorff, N. B. A. (2005). Gait Disorders: Evaluation and Management:
Taylor & Francis.
Kang, H. G., & Dingwell, J. B. (2008). Separating the effects of age and walking
speed on gait variability. Gait Posture, 27(4), 572-577. doi:
10.1016/j.gaitpost.2007.07.009
Kerr, A., Rafferty, D., Kerr, K. M., & Durward, B. (2007). Timing phases of the sit-to-
walk movement: validity of a clinical test. Gait Posture, 26(1), 11-16. doi:
10.1016/j.gaitpost.2006.07.004
Kimura, T., Kobayashi, H., Nakayama, E., & Hanaoka, M. Effects of aging on gait
patterns in the healthy elderly.
Kirtley, C. (2006). Clinical gait analysis : theory and practice. Edinburgh ; New York:
Elsevier.
Krishnamurthi, N., Mulligan, S., Mahant, P., Samanta, J., & Abbas, J. (2012). Deep
brain stimulation amplitude alters posture shift velocity in Parkinson’s
disease. Cognitive Neurodynamics, 6(4), 325-332. doi: 10.1007/s11571-012-
9201-5
Lacour, M., Bernard-Demanze, L., & Dumitrescu, M. (2008). Posture control, aging,
and attention resources: models and posture-analysis methods. Neurophysiol
Clin, 38(6), 411-421. doi: 10.1016/j.neucli.2008.09.005
Lafond, D., Corriveau, H., Hebert, R., & Prince, F. (2004). Intrasession reliability of
center of pressure measures of postural steadiness in healthy elderly people.
Arch Phys Med Rehabil, 85(6), 896-901.
Lark, S. D., & Pasupuleti, S. (2009). Validity of a functional dynamic walking test for
the elderly. Arch Phys Med Rehabil, 90(3), 470-474. doi:
10.1016/j.apmr.2008.08.221
Latash, M. L., Ferreira, S. S., Wieczorek, S. A., & Duarte, M. (2003). Movement
sway: changes in postural sway during voluntary shifts of the center of
pressure. Exp Brain Res, 150(3), 314-324. doi: 10.1007/s00221-003-1419-3
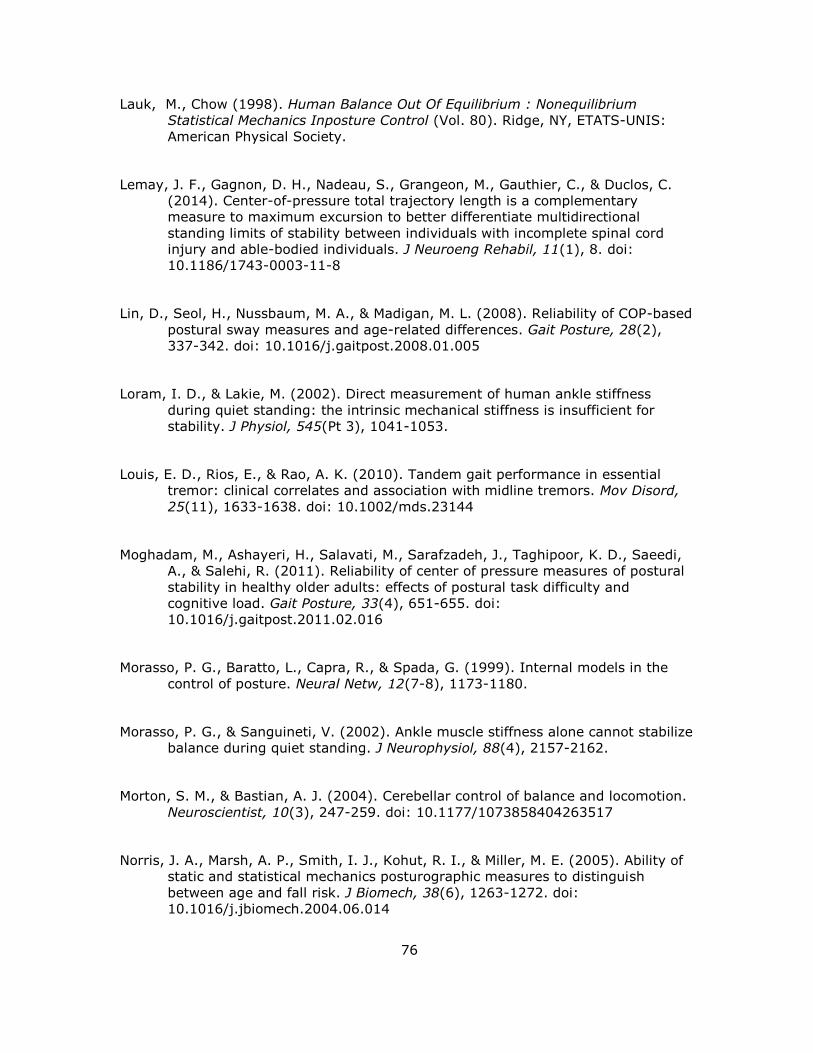
76
Lauk, M., Chow (1998). Human Balance Out Of Equilibrium : Nonequilibrium
Statistical Mechanics Inposture Control (Vol. 80). Ridge, NY, ETATS-UNIS:
American Physical Society.
Lemay, J. F., Gagnon, D. H., Nadeau, S., Grangeon, M., Gauthier, C., & Duclos, C.
(2014). Center-of-pressure total trajectory length is a complementary
measure to maximum excursion to better differentiate multidirectional
standing limits of stability between individuals with incomplete spinal cord
injury and able-bodied individuals. J Neuroeng Rehabil, 11(1), 8. doi:
10.1186/1743-0003-11-8
Lin, D., Seol, H., Nussbaum, M. A., & Madigan, M. L. (2008). Reliability of COP-based
postural sway measures and age-related differences. Gait Posture, 28(2),
337-342. doi: 10.1016/j.gaitpost.2008.01.005
Loram, I. D., & Lakie, M. (2002). Direct measurement of human ankle stiffness
during quiet standing: the intrinsic mechanical stiffness is insufficient for
stability. J Physiol, 545(Pt 3), 1041-1053.
Louis, E. D., Rios, E., & Rao, A. K. (2010). Tandem gait performance in essential
tremor: clinical correlates and association with midline tremors. Mov Disord,
25(11), 1633-1638. doi: 10.1002/mds.23144
Moghadam, M., Ashayeri, H., Salavati, M., Sarafzadeh, J., Taghipoor, K. D., Saeedi,
A., & Salehi, R. (2011). Reliability of center of pressure measures of postural
stability in healthy older adults: effects of postural task difficulty and
cognitive load. Gait Posture, 33(4), 651-655. doi:
10.1016/j.gaitpost.2011.02.016
Morasso, P. G., Baratto, L., Capra, R., & Spada, G. (1999). Internal models in the
control of posture. Neural Netw, 12(7-8), 1173-1180.
Morasso, P. G., & Sanguineti, V. (2002). Ankle muscle stiffness alone cannot stabilize
balance during quiet standing. J Neurophysiol, 88(4), 2157-2162.
Morton, S. M., & Bastian, A. J. (2004). Cerebellar control of balance and locomotion.
Neuroscientist, 10(3), 247-259. doi: 10.1177/1073858404263517
Norris, J. A., Marsh, A. P., Smith, I. J., Kohut, R. I., & Miller, M. E. (2005). Ability of
static and statistical mechanics posturographic measures to distinguish
between age and fall risk. J Biomech, 38(6), 1263-1272. doi:
10.1016/j.jbiomech.2004.06.014
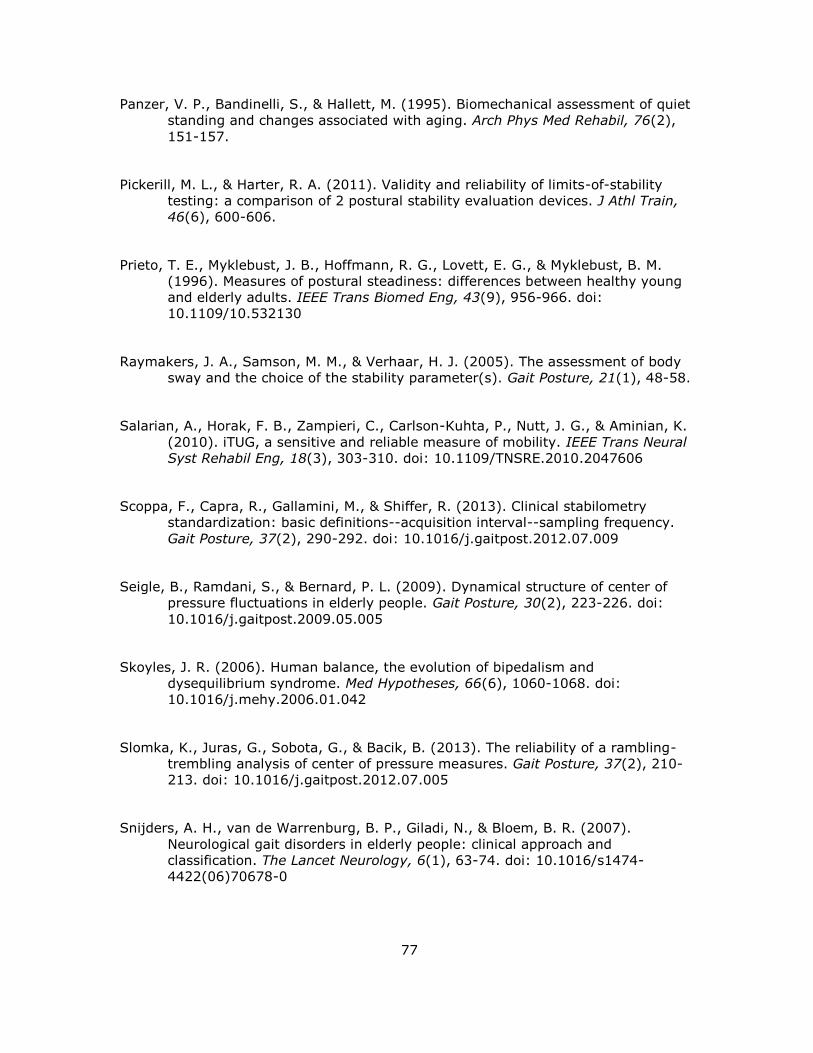
77
Panzer, V. P., Bandinelli, S., & Hallett, M. (1995). Biomechanical assessment of quiet
standing and changes associated with aging. Arch Phys Med Rehabil, 76(2),
151-157.
Pickerill, M. L., & Harter, R. A. (2011). Validity and reliability of limits-of-stability
testing: a comparison of 2 postural stability evaluation devices. J Athl Train,
46(6), 600-606.
Prieto, T. E., Myklebust, J. B., Hoffmann, R. G., Lovett, E. G., & Myklebust, B. M.
(1996). Measures of postural steadiness: differences between healthy young
and elderly adults. IEEE Trans Biomed Eng, 43(9), 956-966. doi:
10.1109/10.532130
Raymakers, J. A., Samson, M. M., & Verhaar, H. J. (2005). The assessment of body
sway and the choice of the stability parameter(s). Gait Posture, 21(1), 48-58.
Salarian, A., Horak, F. B., Zampieri, C., Carlson-Kuhta, P., Nutt, J. G., & Aminian, K.
(2010). iTUG, a sensitive and reliable measure of mobility. IEEE Trans Neural
Syst Rehabil Eng, 18(3), 303-310. doi: 10.1109/TNSRE.2010.2047606
Scoppa, F., Capra, R., Gallamini, M., & Shiffer, R. (2013). Clinical stabilometry
standardization: basic definitions--acquisition interval--sampling frequency.
Gait Posture, 37(2), 290-292. doi: 10.1016/j.gaitpost.2012.07.009
Seigle, B., Ramdani, S., & Bernard, P. L. (2009). Dynamical structure of center of
pressure fluctuations in elderly people. Gait Posture, 30(2), 223-226. doi:
10.1016/j.gaitpost.2009.05.005
Skoyles, J. R. (2006). Human balance, the evolution of bipedalism and
dysequilibrium syndrome. Med Hypotheses, 66(6), 1060-1068. doi:
10.1016/j.mehy.2006.01.042
Slomka, K., Juras, G., Sobota, G., & Bacik, B. (2013). The reliability of a rambling-
trembling analysis of center of pressure measures. Gait Posture, 37(2), 210-
213. doi: 10.1016/j.gaitpost.2012.07.005
Snijders, A. H., van de Warrenburg, B. P., Giladi, N., & Bloem, B. R. (2007).
Neurological gait disorders in elderly people: clinical approach and
classification. The Lancet Neurology, 6(1), 63-74. doi: 10.1016/s1474-
4422(06)70678-0
78
Sparrow, W. A., & Tirosh, O. (2005). Gait termination: a review of experimental
methods and the effects of ageing and gait pathologies. Gait Posture, 22(4),
362-371. doi: 10.1016/j.gaitpost.2004.11.005
Speers, R. A., Ashton-Miller, J. A., Schultz, A. B., & Alexander, N. B. (1998). Age
differences in abilities to perform tandem stand and walk tasks of graded
difficulty. Gait Posture, 7(3), 207-213.
Swanenburg, J., de Bruin, E. D., Favero, K., Uebelhart, D., & Mulder, T. (2008). The
reliability of postural balance measures in single and dual tasking in elderly
fallers and non-fallers. BMC Musculoskelet Disord, 9, 162. doi: 10.1186/1471-
2474-9-162
Takahashi, T., Ishida, K., Hirose, D., Nagano, Y., Okumiya, K., Nishinaga, M., . . .
Yamamoto, H. (2004). Vertical ground reaction force shape is associated with
gait parameters, timed up and go, and functional reach in elderly females. J
Rehabil Med, 36(1), 42-45.
Teresa Blázquez, M., Anguiano, M., de Saavedra, F. A., Lallena, A. M., & Carpena, P.
(2009). Study of the human postural control system during quiet standing
using detrended fluctuation analysis. Physica A: Statistical Mechanics and its
Applications, 388(9), 1857-1866. doi:
http://dx.doi.org/10.1016/j.physa.2009.01.001
Tinetti, M. E., Speechley, M., & Ginter, S. F. (1988). Risk factors for falls among
elderly persons living in the community. N Engl J Med, 319(26), 1701-1707.
van der Kooij, H., Jacobs, R., Koopman, B., & Grootenboer, H. (1999). A
multisensory integration model of human stance control. Biol Cybern, 80(5),
299-308.
Verlinden, V. J., van der Geest, J. N., Hoogendam, Y. Y., Hofman, A., Breteler, M. M.,
& Ikram, M. A. (2013). Gait patterns in a community-dwelling population
aged 50 years and older. Gait Posture, 37(4), 500-505. doi:
10.1016/j.gaitpost.2012.09.005
Vieira Tde, M., de Oliveira, L. F., & Nadal, J. (2009). An overview of age-related
changes in postural control during quiet standing tasks using classical and
modern stabilometric descriptors. J Electromyogr Kinesiol, 19(6), e513-519.
doi: 10.1016/j.jelekin.2008.10.007
79
Wallmann, H. W. (2001). Comparison of elderly nonfallers and fallers on
performance measures of functional reach, sensory organization, and limits of
stability. J Gerontol A Biol Sci Med Sci, 56(9), M580-583.
Wingert, J. R., Welder, C., & Foo, P. (2014). Age-related hip proprioception declines:
effects on postural sway and dynamic balance. Arch Phys Med Rehabil, 95(2),
253-261. doi: 10.1016/j.apmr.2013.08.012
Winter, D. A., Patla, A. E., & Frank, J. S. (1990). Assessment of balance control in
humans. Med Prog Technol, 16(1-2), 31-51.
Winter, D. A., Patla, A. E., Ishac, M., & Gage, W. H. (2003). Motor mechanisms of
balance during quiet standing. J Electromyogr Kinesiol, 13(1), 49-56.
Winter, D. A., Patla, A. E., Prince, F., Ishac, M., & Gielo-Perczak, K. (1998). Stiffness
control of balance in quiet standing. J Neurophysiol, 80(3), 1211-1221.
Winter, D. A., Patla, A. E., Rietdyk, S., & Ishac, M. G. (2001). Ankle muscle stiffness
in the control of balance during quiet standing. J Neurophysiol, 85(6), 2630-
2633.
Woollacott, M. H., & Tang, P. F. (1997). Balance control during walking in the older
adult: research and its implications. Phys Ther, 77(6), 646-660.

80
APPENDIX A
IRB APPROVAL LETTER
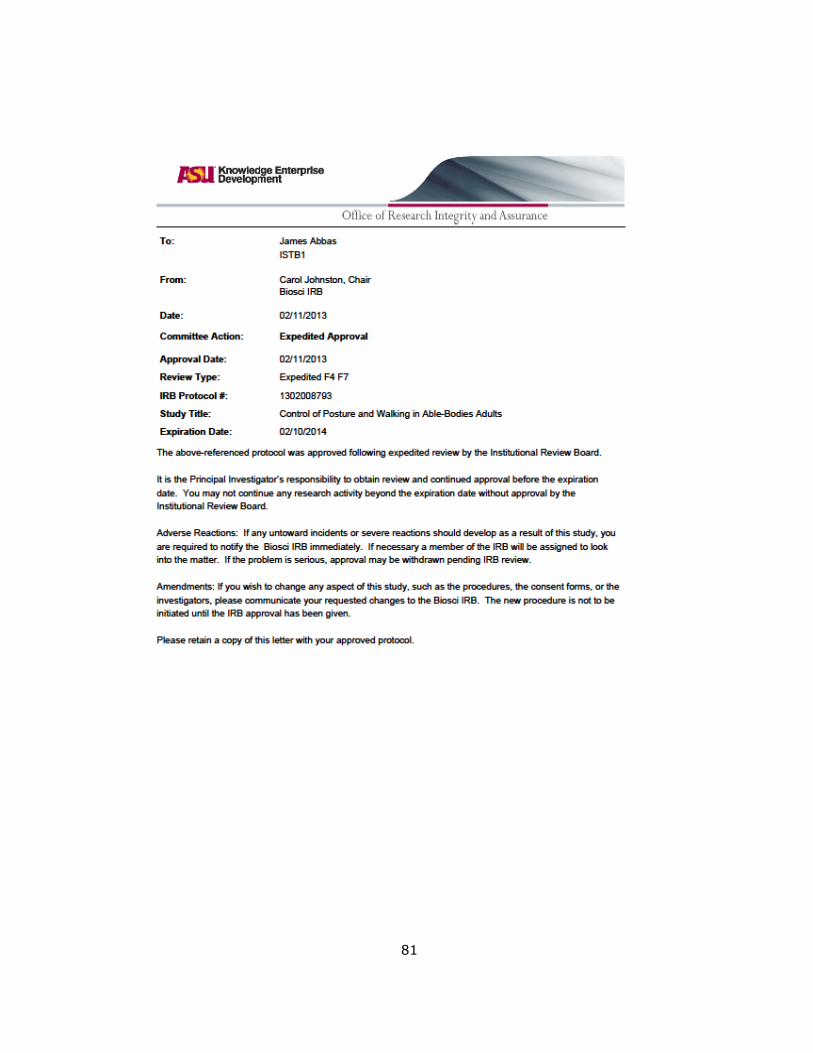
81

82
APPENDIX B
DESCRIPTIVE STATISTICS
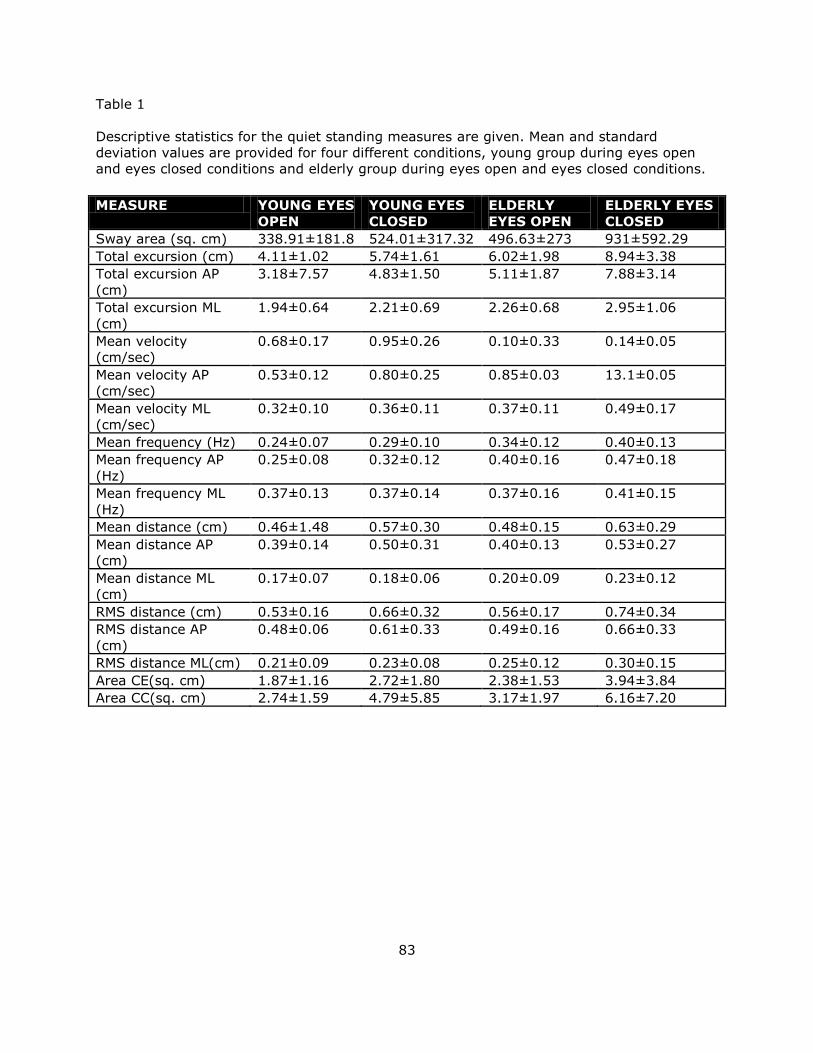
83
Table 1
Descriptive statistics for the quiet standing measures are given. Mean and standard
deviation values are provided for four different conditions, young group during eyes open
and eyes closed conditions and elderly group during eyes open and eyes closed conditions.
MEASURE YOUNG EYES
OPEN
YOUNG EYES
CLOSED
ELDERLY
EYES OPEN
ELDERLY EYES
CLOSED
Sway area (sq. cm) 338.91±181.8 524.01±317.32 496.63±273 931±592.29
Total excursion (cm) 4.11±1.02 5.74±1.61 6.02±1.98 8.94±3.38
Total excursion AP
(cm)
3.18±7.57 4.83±1.50 5.11±1.87 7.88±3.14
Total excursion ML
(cm)
1.94±0.64 2.21±0.69 2.26±0.68 2.95±1.06
Mean velocity
(cm/sec)
0.68±0.17 0.95±0.26 0.10±0.33 0.14±0.05
Mean velocity AP
(cm/sec)
0.53±0.12 0.80±0.25 0.85±0.03 13.1±0.05
Mean velocity ML
(cm/sec)
0.32±0.10 0.36±0.11 0.37±0.11 0.49±0.17
Mean frequency (Hz) 0.24±0.07 0.29±0.10 0.34±0.12 0.40±0.13
Mean frequency AP
(Hz)
0.25±0.08 0.32±0.12 0.40±0.16 0.47±0.18
Mean frequency ML
(Hz)
0.37±0.13 0.37±0.14 0.37±0.16 0.41±0.15
Mean distance (cm) 0.46±1.48 0.57±0.30 0.48±0.15 0.63±0.29
Mean distance AP
(cm)
0.39±0.14 0.50±0.31 0.40±0.13 0.53±0.27
Mean distance ML
(cm)
0.17±0.07 0.18±0.06 0.20±0.09 0.23±0.12
RMS distance (cm) 0.53±0.16 0.66±0.32 0.56±0.17 0.74±0.34
RMS distance AP
(cm)
0.48±0.06 0.61±0.33 0.49±0.16 0.66±0.33
RMS distance ML(cm) 0.21±0.09 0.23±0.08 0.25±0.12 0.30±0.15
Area CE(sq. cm) 1.87±1.16 2.72±1.80 2.38±1.53 3.94±3.84
Area CC(sq. cm) 2.74±1.59 4.79±5.85 3.17±1.97 6.16±7.20
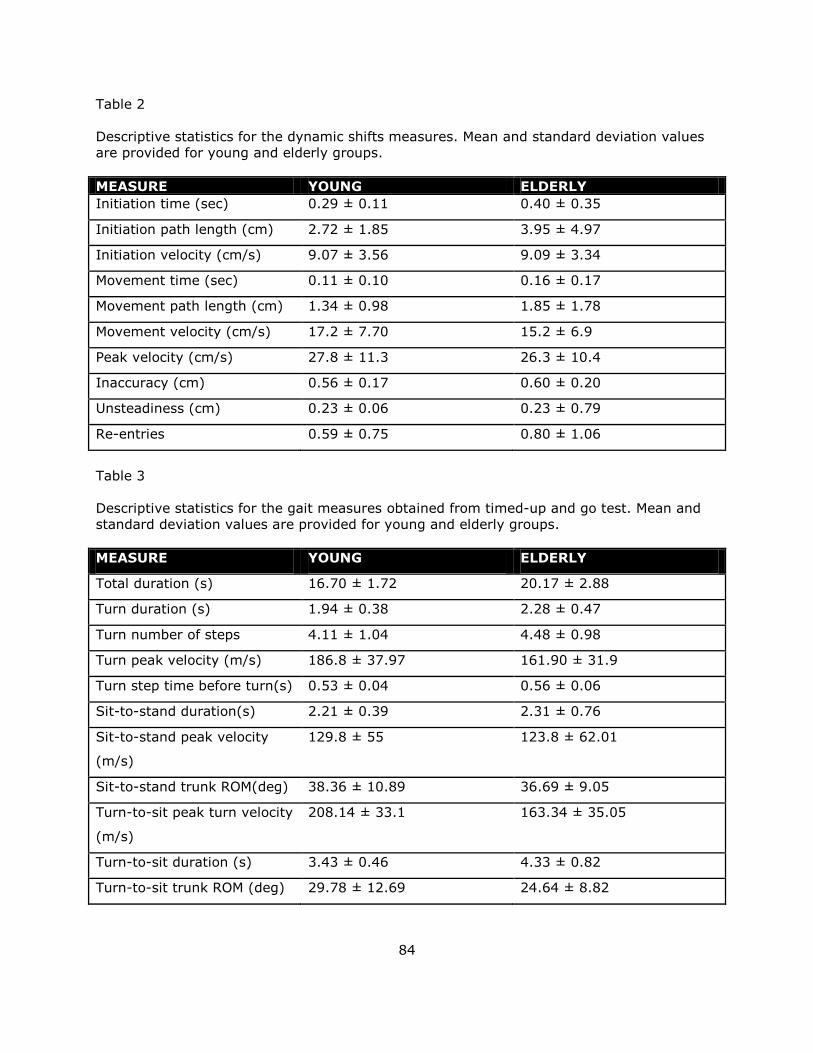
84
Table 2
Descriptive statistics for the dynamic shifts measures. Mean and standard deviation values
are provided for young and elderly groups.
MEASURE YOUNG ELDERLY
Initiation time (sec) 0.29 ± 0.11 0.40 ± 0.35
Initiation path length (cm) 2.72 ± 1.85 3.95 ± 4.97
Initiation velocity (cm/s) 9.07 ± 3.56 9.09 ± 3.34
Movement time (sec) 0.11 ± 0.10 0.16 ± 0.17
Movement path length (cm) 1.34 ± 0.98 1.85 ± 1.78
Movement velocity (cm/s) 17.2 ± 7.70 15.2 ± 6.9
Peak velocity (cm/s) 27.8 ± 11.3 26.3 ± 10.4
Inaccuracy (cm) 0.56 ± 0.17 0.60 ± 0.20
Unsteadiness (cm) 0.23 ± 0.06 0.23 ± 0.79
Re-entries 0.59 ± 0.75 0.80 ± 1.06
Table 3
Descriptive statistics for the gait measures obtained from timed-up and go test. Mean and
standard deviation values are provided for young and elderly groups.
MEASURE YOUNG ELDERLY
Total duration (s) 16.70 ± 1.72 20.17 ± 2.88
Turn duration (s) 1.94 ± 0.38 2.28 ± 0.47
Turn number of steps 4.11 ± 1.04 4.48 ± 0.98
Turn peak velocity (m/s) 186.8 ± 37.97 161.90 ± 31.9
Turn step time before turn(s) 0.53 ± 0.04 0.56 ± 0.06
Sit-to-stand duration(s) 2.21 ± 0.39 2.31 ± 0.76
Sit-to-stand peak velocity
(m/s)
129.8 ± 55 123.8 ± 62.01
Sit-to-stand trunk ROM(deg) 38.36 ± 10.89 36.69 ± 9.05
Turn-to-sit peak turn velocity
(m/s)
208.14 ± 33.1 163.34 ± 35.05
Turn-to-sit duration (s) 3.43 ± 0.46 4.33 ± 0.82
Turn-to-sit trunk ROM (deg) 29.78 ± 12.69 24.64 ± 8.82
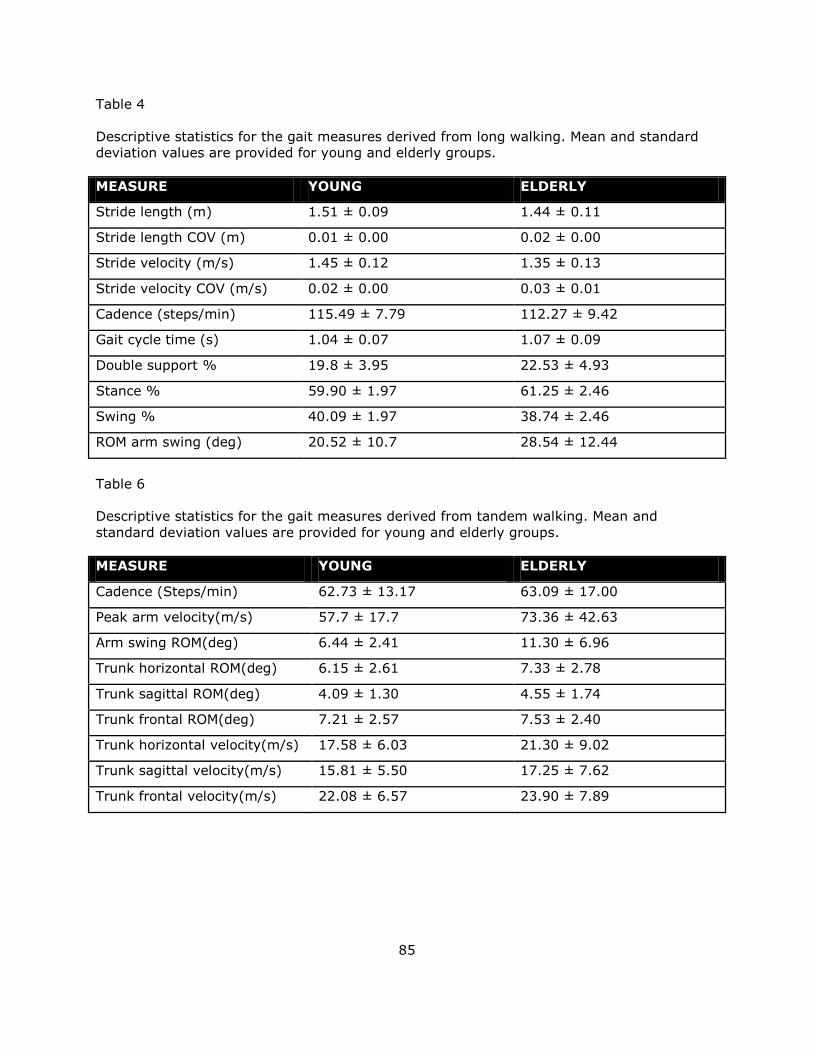
85
Table 4
Descriptive statistics for the gait measures derived from long walking. Mean and standard
deviation values are provided for young and elderly groups.
MEASURE YOUNG ELDERLY
Stride length (m) 1.51 ± 0.09 1.44 ± 0.11
Stride length COV (m) 0.01 ± 0.00 0.02 ± 0.00
Stride velocity (m/s) 1.45 ± 0.12 1.35 ± 0.13
Stride velocity COV (m/s) 0.02 ± 0.00 0.03 ± 0.01
Cadence (steps/min) 115.49 ± 7.79 112.27 ± 9.42
Gait cycle time (s) 1.04 ± 0.07 1.07 ± 0.09
Double support % 19.8 ± 3.95 22.53 ± 4.93
Stance % 59.90 ± 1.97 61.25 ± 2.46
Swing % 40.09 ± 1.97 38.74 ± 2.46
ROM arm swing (deg) 20.52 ± 10.7 28.54 ± 12.44
Table 6
Descriptive statistics for the gait measures derived from tandem walking. Mean and
standard deviation values are provided for young and elderly groups.
MEASURE YOUNG ELDERLY
Cadence (Steps/min) 62.73 ± 13.17 63.09 ± 17.00
Peak arm velocity(m/s) 57.7 ± 17.7 73.36 ± 42.63
Arm swing ROM(deg) 6.44 ± 2.41 11.30 ± 6.96
Trunk horizontal ROM(deg) 6.15 ± 2.61 7.33 ± 2.78
Trunk sagittal ROM(deg) 4.09 ± 1.30 4.55 ± 1.74
Trunk frontal ROM(deg) 7.21 ± 2.57 7.53 ± 2.40
Trunk horizontal velocity(m/s) 17.58 ± 6.03 21.30 ± 9.02
Trunk sagittal velocity(m/s) 15.81 ± 5.50 17.25 ± 7.62
Trunk frontal velocity(m/s) 22.08 ± 6.57 23.90 ± 7.89

86
Figure 1. Box plots1 showing the distribution of quiet standing measures with change in age
and visual inputs. Blue boxes indicate eyes open condition and green boxes indicate eyes
closed condition.
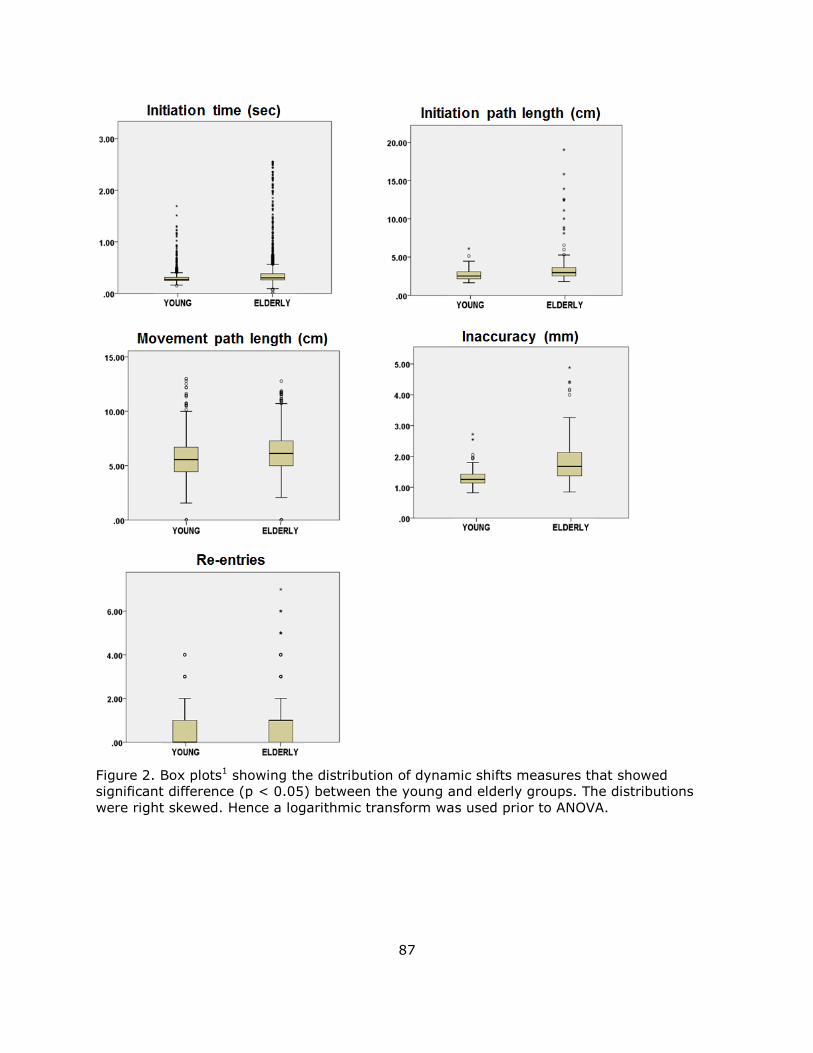
87
Figure 2. Box plots1 showing the distribution of dynamic shifts measures that showed
significant difference (p < 0.05) between the young and elderly groups. The distributions
were right skewed. Hence a logarithmic transform was used prior to ANOVA.
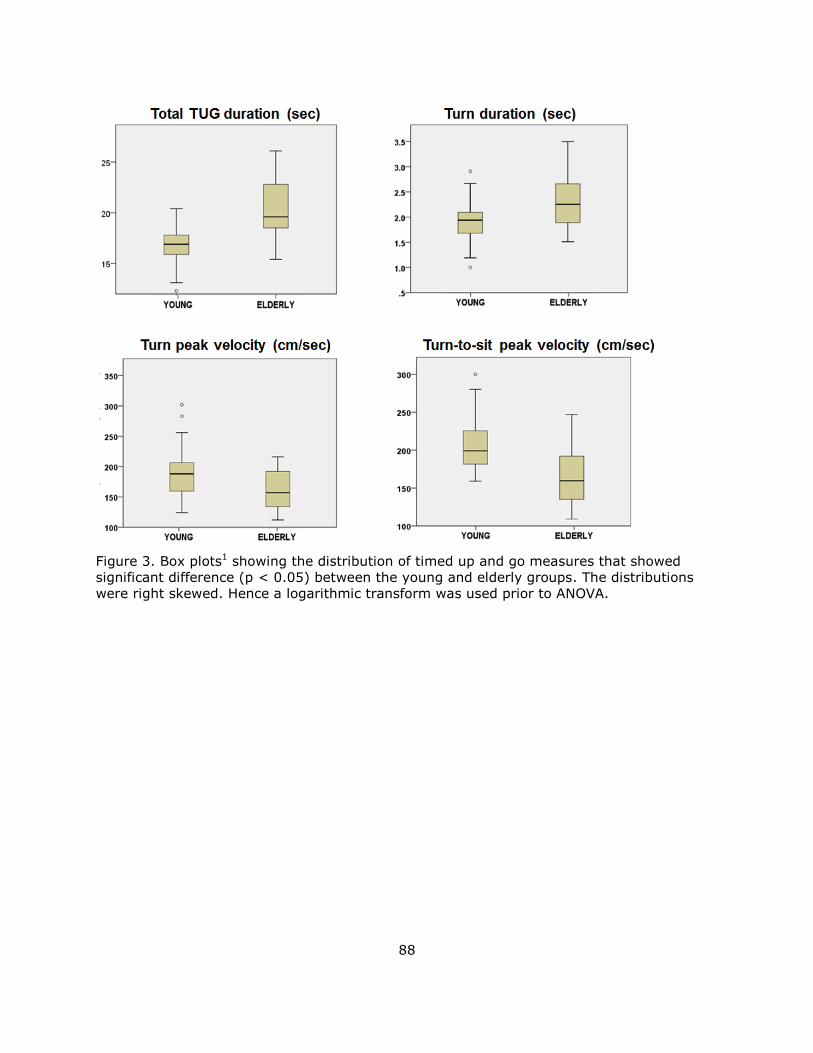
88
Figure 3. Box plots1 showing the distribution of timed up and go measures that showed
significant difference (p < 0.05) between the young and elderly groups. The distributions
were right skewed. Hence a logarithmic transform was used prior to ANOVA.
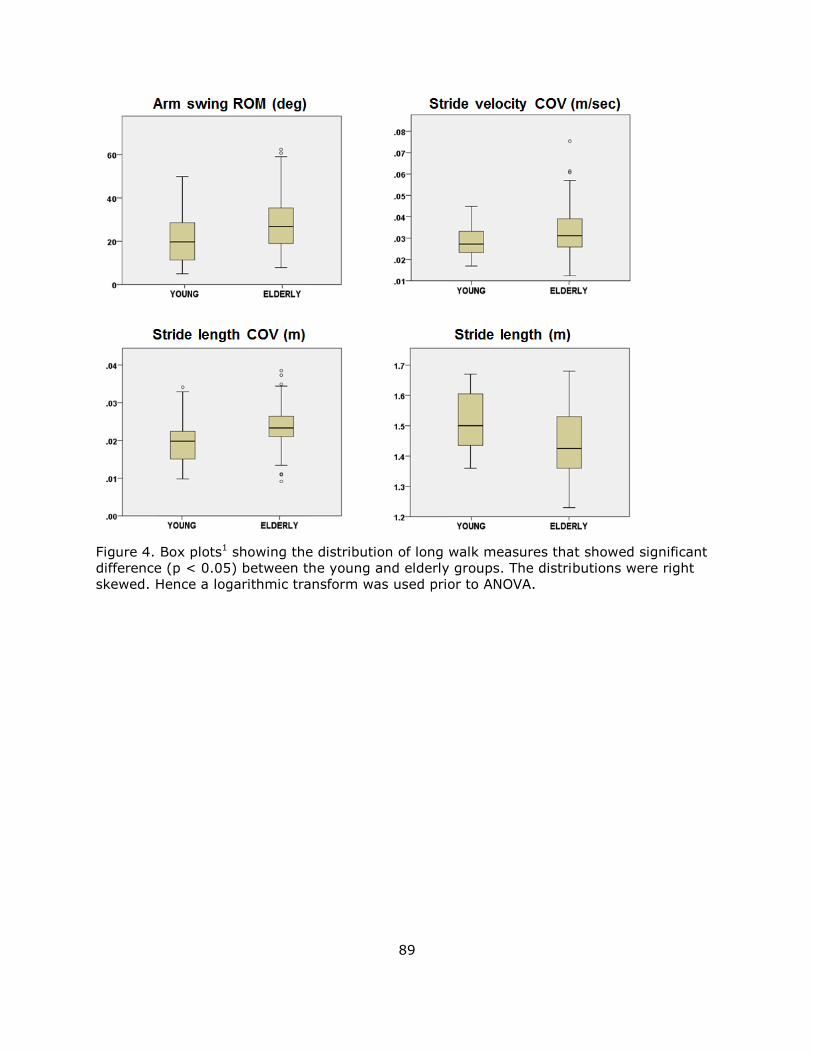
89
Figure 4. Box plots1 showing the distribution of long walk measures that showed significant
difference (p < 0.05) between the young and elderly groups. The distributions were right
skewed. Hence a logarithmic transform was used prior to ANOVA.
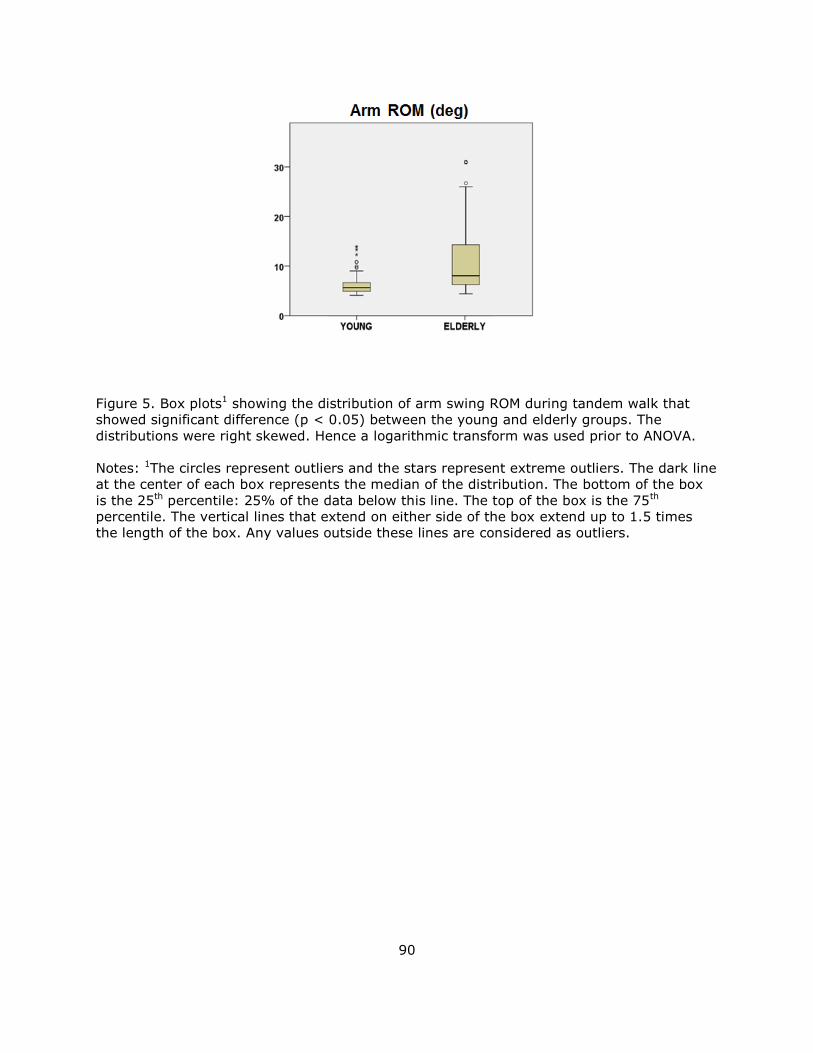
90
Figure 5. Box plots1 showing the distribution of arm swing ROM during tandem walk that
showed significant difference (p < 0.05) between the young and elderly groups. The
distributions were right skewed. Hence a logarithmic transform was used prior to ANOVA.
Notes: 1The circles represent outliers and the stars represent extreme outliers. The dark line
at the center of each box represents the median of the distribution. The bottom of the box
is the 25th percentile: 25% of the data below this line. The top of the box is the 75th
percentile. The vertical lines that extend on either side of the box extend up to 1.5 times
the length of the box. Any values outside these lines are considered as outliers.