Embed Size (px)
Citation preview
Age-Size E®ects in Firm Growth and Productive
E±ciency: The Case of Manufacturing Establishments
in Ethiopia
Taye Mengistae
August 1998
Abstract
Several studies in developed economies have reported that the rate ofgrowth of small ¯rms decreases with ¯rm age as well as size. This resultis consistent with Jovanovic's (1982) version of the passive learning modelof competitive selection and is con¯rmed by data on a random sample ofmanufacturing ¯rms in Ethiopia. This paper uses the Ethiopian data to testthree other implications of the Jovanovic model. These link age-size e®ects in¯rm growth to an underlying distribution of of ¯rms by technical e±ciency,but have not been investigated empirically before. I ¯nd, ¯rst, that the samee®ects as detected in the Ethiopian data are matched by time-invariant inter-¯rm di®erences in technical e±ciency. Secondly, the data exhibit age-sizee®ects in technical e±ciency as well, whereby bigger ¯rms are more e±cientgiven age and older ¯rms are more e±cient given size. Thirdly, ¯rm age and¯rm size mainly proxy for owner human capital variables in as far as theyexplain e±ciency scores. In other words, it is not the case that some ¯rmsare more e±cient than others because they are bigger or older but the otherway round: some ¯rms are bigger or longer lived than others because theyhave proved to be more e±cient. Advantageous location is a major source oftechnical e±ciency but is signi¯canlty less important than entrepreneurialhuman capital. Among the human capital variables considered, the levelformal schooling completed has by far the strongest in°uence on e±ciencyscores. The owner's access to business networks and his or her ethnicityalso have signi¯cant e®ects. On the other hand, there is no evidence thate±ciency depends on any one of pre-ownership employment experience inthe current industry, occupational following of parents or prior vocationaltraining.
Key words: Productive E±ciency, Firm Growth, Size Distribution of Firms,Entrepreneurship, Market Selection, Ethiopia.
JEL Classi¯cation: D24, D92, L11, M13.
1. INTRODUCTION
Data on a random sample of manufacturing ¯rms in Ethiopia con¯rm ¯ndingsof earlier studies in developed economies that the rate of growth of small ¯rmsdecreases with initial ¯rm size and initial ¯rm age. The result is consistent withJovanovic's (1982) version of the passive learning model of the dynamics of owner-managed ¯rms, and has often been interpreted as evidence in its favour againstalternative models of selection and growth.1 However, the possibility remainsthat the same age-size e®ects signal forces other than passive learning.2 If age-size e®ects detected in the growth of group of ¯rms are indeed outcomes of passivelearning in exit or expansion decisions, then the underlying production data mustexhibit permanent and systematic inter-¯rm di®erences in technical e±ciency: thecurrent e±ciency of a ¯rm must be predicted by e±ciency in the past while in-creasing in the current size and age of the ¯rm. Moreover, we should be ableto trace age-size e®ects in e±ciency to the latter's dependence on entrepreneur-ial human capital (Lucas, 1978)3 or locational advantage (Jovanovic, 1982) asarguably the most enduring of a ¯rm's characteristics.
This paper reports results of a further analysis of the Ethiopian data in what,I believe, is the ¯rst attempt to test these further implications of the passivelearning model. It accordingly deals with three questions. First, are there time-invariant inter-¯rm e±ciency di®erences in the sample to match the observedage-size e®ect in growth? Secondly, is there a matching age-size e®ect in ¯rmlevel technical e±ciency? Thirdly, do human capital and location variables su±-ciently explain age-size e®ects in e±ciency? The case for passive learning as animportant feature of the life cycle of owner managed ¯rms is stronger if each ofthese questions is answered in the a±rmative.
1The result with respect to the Ethiopian data is reported in full in a separate paper (Mengis-tae, 1997). Earlier reports of the same result for ¯rm growth in developed countries includeEvans (1987), Dunne , Roberts and Samuelson (1989), Variam and Kraybill (1992) and Dunneand Hughes (1994).
2Other formulations of the passive learning model are Lucas (1978) and Lippman and Rumelt(1982) the relation of which to the Jovanovic model and other models of competitive selectionis discussed in Mengistae (1997).
3The idea that entrepreneurial human capital or `management ability' is a major determinantof inter-¯rm di®erences in technical e±ciency is , of course, a very old one (e.g., Marchak andAndrew, 1944) and was the theme of contributions of Mundlak (1961) and Hoch (1962) to theproblem of estimation of industry level production functions. The passive learning model bringsout the dynamic implication of the same di®erences to ¯rm growth and longevity.
2
The seminal contribution of Farrel (1957) has led to a well developed method-ological and empirical literature on the measurement of e±ciency.4 However, noprevious study has examined the relationship between measured e±ciency dif-ferences and growth performance in the sample of ¯rms investigated.5 On theother hand, none of the studies that have reported age-size e®ects in ¯rm growthwhile testing selection models has attempted to link the e®ects to the underly-ing distribution of e±ciency levels although the essence of every selection modelis a distinctive hypothesis regarding such a link. Finally, it is a feature of theexisting literature on ¯rm level e±ciency that variables are often chosen on anad-hoc basis as possible determinants of e±ciency scores. Existing models of se-lection are examples of a theoretical perspective that bounds or order the list ofpotential sources of e±ciency among a ¯rm's characteristics. In particular, thepassive learning model establishes a hierarchy between ¯rm size and ¯rm age onthe one hand and entrepreneurial human capital and location on the other in thedetermination of ¯rm level e±ciency scores: to the extent that age-size e®ects ine±ciency signal passive learning they merely proxy for human capital or locationvariables.
The rest of the paper is organised as follows. Section II sets out the economet-ric framework by recasting the relevant propositions of the Jovanovic model interms of variance component formulations of the ¯rm level production function.Section III gives an overview of the theoretical and empirical literature on the de-terminants of inter-¯rm di®erences in technical e±ciency. The data are describedin Section IV. Section V reports the results a summary of which concludes thepaper in Section VI.
4Major contributions since Farrel are Aigner and Chu (1968), Aigner, Lovell and Schmidt(1977), Meeusen and van den Broeck (1977), Pitt and Lee (1981) and Battese and Coeli (1988).Bauer (1991) and Green (1993) provide the latest reviews of the literature on the subject. Seealso Fersund et al (1980) and Schmidt (1986) for earlier reviews.
5Liu (1993) is the ¯rst empirical study so far that I know of to have analysed inter-¯rmdi®erences in e±ciency in the context of models of selection . The main ¯nding of the studyis that the time path of the mean level of technical e±ciency is higher for incumbents than forfresh entrants which, in turn, is greater than the average e±ciency of failing ¯rms. This result isconsistent with passive learning model. However, the study does not directly examine the linkbetween e±ciency and growth performance among surviving ¯rms, which is the focus of thispaper.
3
2. MEASURING INTER-FIRM DIFFERENCES IN TECHNI-CAL EFFICIENCY.
In Jovanovic's formulation of the passive learning model age-size e®ects in ¯rmgrowth and survival arise from permanent but competitive inter-¯rm cost dif-ferences. Each incumbent and potential entrant, i, of an industry faces a costfunction that is identical to the industry average or frontier up to multiplicationby a strictly positive transformation, » (:), of a random error composed of twoadditive components µi and !it. The second of these components, !it, registers apurely temporary ¯rm speci¯c cost shock and is assumed to be distributed i.i.dnormal with mean zero and variance ¾2!. The component,µi, is a ¯xed measureof the cost disadvantage of the ¯rm such that the larger is its value the higheris the cost of production of a given output relative to the cost that is averageor minimum to the industry. However, its true value is unknown to the ¯rm,which only knows that the same value is a random draw from the distributionN(¹µ; ¾
2µ) common to all potential entrants. Draws from the distribution are in-
dependent across ¯rms and each ¯rm knows the distribution as well as the exactform of » (:). Because µi is unknown, production decisions are based on whatthe ¯rm estimates it to be given past realisations of » (µi + !it). Production thuscoincides with a process of Bayesian updating of estimates in the course of whichthe ¯rm gradually discovers the true extent of its competitive advantage. Underthe regularity conditions of the model, the precision of estimates increases withthe duration of the ¯rm's stay in the current industry. Firms for which the truevalue of µi is too high experience a series of bad cost shocks, update their costestimates upwards accordingly, and are eventually forced to exit. Firms for whichµi is relatively low experience a better series of shocks, stay put and grow. For¯rms that do survive the selection process, the rate of growth decreases in ¯rmsize and ¯rm age.
Let cit be the total cost of production of output q by ¯rm i during period t.Let c (:) be a strictly convex cost function with that is average or frontier to theindustry. The ¯rm level cost function assumed in the Jovanovic model is
cit = c(q)» (µi + !it) (1)
By the principle of duality µi is a monotonic and strictly decreasing transformationof a ¯rm speci¯c productivity parameter ui while !it is a similar transformationof a purely temporary and ¯rm speci¯c random productivity shock ºit. I willassume that the production function underlying equation (1) can be written as
4
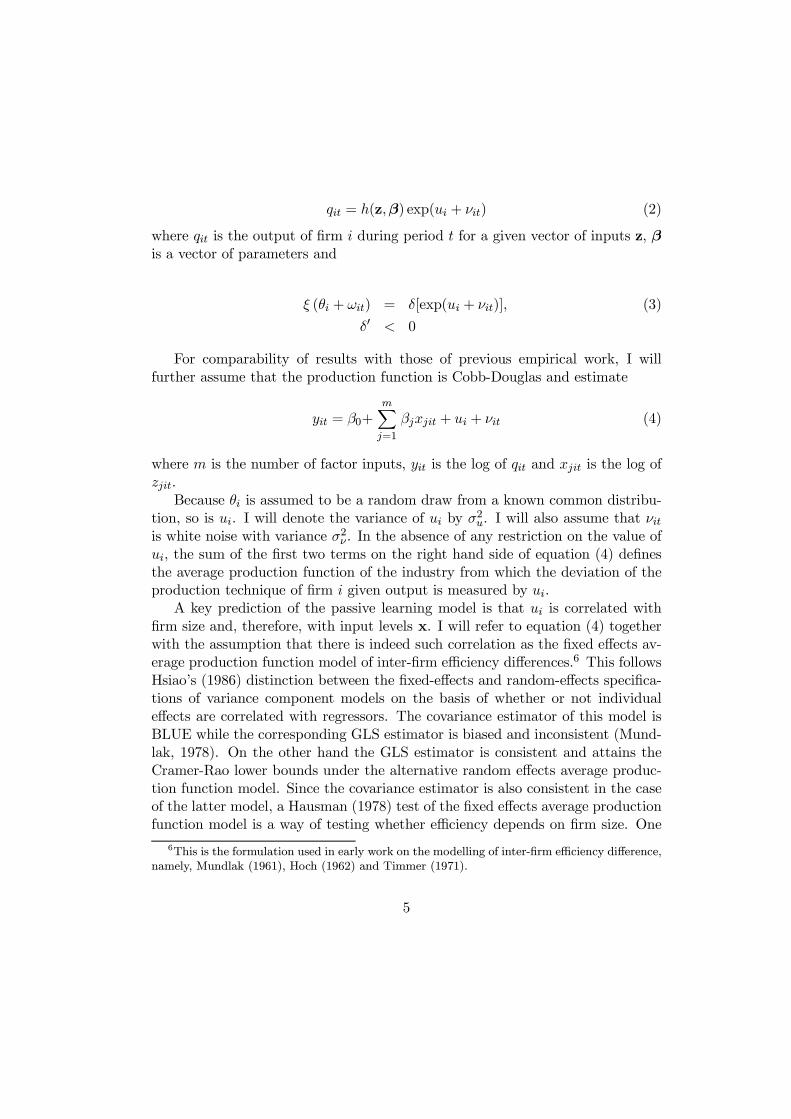
qit = h(z;¯) exp(ui + ºit) (2)
where qit is the output of ¯rm i during period t for a given vector of inputs z, ¯is a vector of parameters and
» (µi + !it) = ±[exp(ui + ºit)]; (3)
±0 < 0
For comparability of results with those of previous empirical work, I willfurther assume that the production function is Cobb-Douglas and estimate
yit = ¯0+mX
j=1
¯jxjit + ui + ºit (4)
where m is the number of factor inputs, yit is the log of qit and xjit is the log ofzjit.
Because µi is assumed to be a random draw from a known common distribu-tion, so is ui. I will denote the variance of ui by ¾2u. I will also assume that ºitis white noise with variance ¾2º . In the absence of any restriction on the value ofui, the sum of the ¯rst two terms on the right hand side of equation (4) de¯nesthe average production function of the industry from which the deviation of theproduction technique of ¯rm i given output is measured by ui.
A key prediction of the passive learning model is that ui is correlated with¯rm size and, therefore, with input levels x. I will refer to equation (4) togetherwith the assumption that there is indeed such correlation as the ¯xed e®ects av-erage production function model of inter-¯rm e±ciency di®erences.6 This followsHsiao's (1986) distinction between the ¯xed-e®ects and random-e®ects speci¯ca-tions of variance component models on the basis of whether or not individuale®ects are correlated with regressors. The covariance estimator of this model isBLUE while the corresponding GLS estimator is biased and inconsistent (Mund-lak, 1978). On the other hand the GLS estimator is consistent and attains theCramer-Rao lower bounds under the alternative random e®ects average produc-tion function model. Since the covariance estimator is also consistent in the caseof the latter model, a Hausman (1978) test of the ¯xed e®ects average productionfunction model is a way of testing whether e±ciency depends on ¯rm size. One
6This is the formulation used in early work on the modelling of inter-¯rm e±ciency di®erence,namely, Mundlak (1961), Hoch (1962) and Timmer (1971).
5
way of testing for the permanence of inter-¯rm e±ciency di®erence is to con-duct the Breuch-Pagan (1980) Lagrange Multiplier test of the OLS formulationof equation (4) against the random e®ects average production function model.Alternatively, we may carry out a likelihood ratio test of the OLS model againstthe ¯xed e®ects model. This follows from the fact that estimators of the parame-ters of equation (4) are BLUE only if the restriction of no ¯rm e®ects is valid inboth the ¯xed e®ects and random e®ects formulations of the average productionfunction. The restriction amounts to that ui = 0 in the ¯xed e®ects model andto that ¾2u = 0 in the random e®ects model. In both cases it means E("it"is) = 0for all t 6= s, where "it = ui + ºit.This in turn implies that E("2it) = ¾2º .
Together with the assumption that ui is uncorrelated with input levels therestriction ui · 0 makes equation (5) a random-e®ects production frontier model.In this case the equation becomes the stochastic frontier introduced into the liter-ature by Aigner et al (1977) and Meeusen and van den Broeck (1977). With addi-tional distributional assumptions about ui the random-e®ects production frontiercan be estimated by maximum likelihood, which is more e±cient than FeasibleGLS, since the latter cannot use the restriction that ui is nonpositive.7 The as-sumption most commonly used is one of ui is half-normal, ui is truncated normal,or ui is negative exponential. For computational convenience, I shall assume inthe rest of the paper that ui is exponential with parameter ¸.
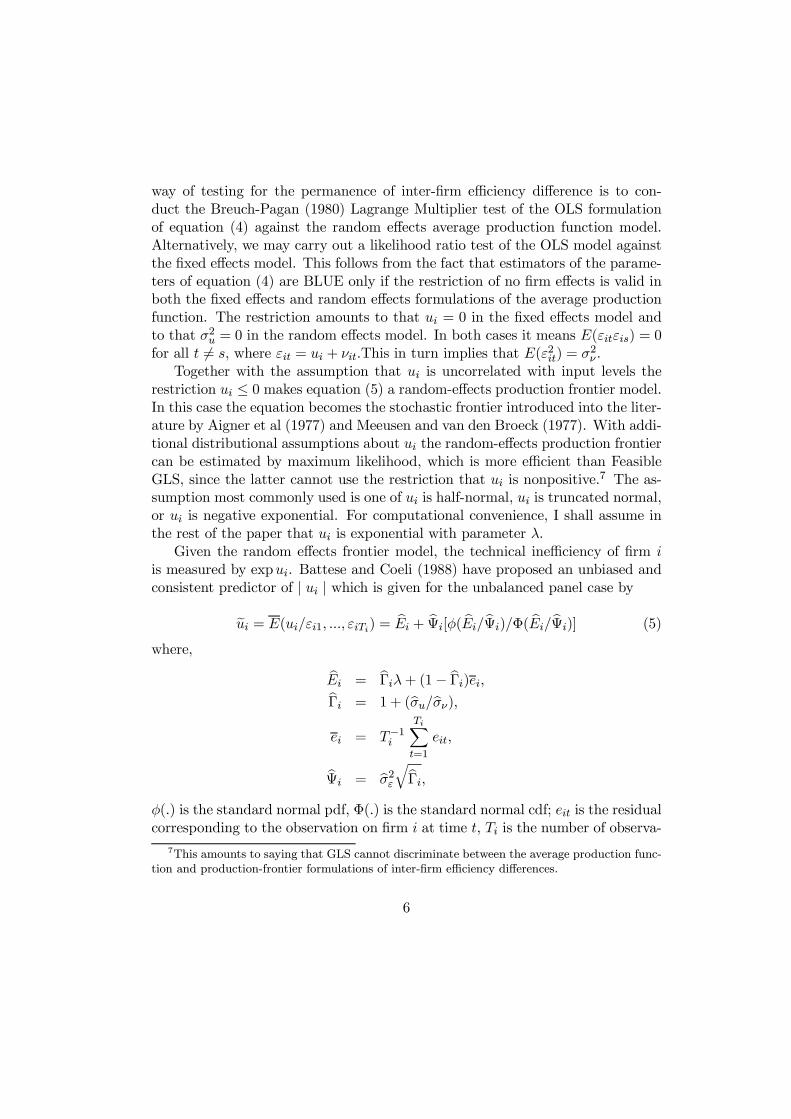
Given the random e®ects frontier model, the technical ine±ciency of ¯rm iis measured by expui. Battese and Coeli (1988) have proposed an unbiased andconsistent predictor of j ui j which is given for the unbalanced panel case by
eui = E(ui="i1; :::; "iTi) = bEi + bªi[Á( bEi=bªi)=©( bEi=bªi)] (5)
where,
bEi = b¡i¸ + (1 ¡ b¡i)ei;b¡i = 1 + (b¾u=b¾º);
ei = T¡1i
TiX
t=1
eit;
bªi = b¾2"q
b¡i;
Á(:) is the standard normal pdf, ©(:) is the standard normal cdf; eit is the residualcorresponding to the observation on ¯rm i at time t, Ti is the number of observa-
7This amounts to saying that GLS cannot discriminate between the average production func-tion and production-frontier formulations of inter-¯rm e±ciency di®erences.
6
tions on ¯rm i; and the hat symbol over ¸, ¾u, ¾À, and ¾" indicates the maximumlikelihood estimate of the corresponding parameter. The measure of ine±ciencyin the ¯xed e®ects average production function model is
b®i = max(bui) ¡ bui (6)
where bui are estimated ¯rm ¯xed e®ects.The likelihood ratio test of the random e®ects frontier model against the
alternative that "it = ui+ºit is distributed iid normal with mean zero and variance¾2º is a test for the existence of permanent inter-¯rm di®erences in technicale±ciency. The LM test of the random e®ects average production function modelagainst the OLS alternative performs the same function. The F-test of the randome®ects frontier model against the ¯xed e®ects model tests the null that ui isindependent of ¯rm size.
In the remaining sections of the paper I will refer to equation (4) under theGauss-Markov assumptions as `Model I', to the random-e®ects frontier productionmodel as `Model IIA', to the random-e®ects average production function modelas `Model IIB' and to the ¯xed e®ects model as `Model III'. I will estimate ModelI by ordinary least squares on pooled cross-section and time series data for eachof seven industries. The data are an unbalanced panel of annual observationsover a three-year period which are describes in Section IV. Models IIA and IIBwill be estimated by maximum likelihood and Feasible GLS respectively for eachindustry.8
3. IDENTIFYING FIRM SPECIFIC SOURCES OF TECHNI-CAL EFFICIENCY.
There are three alternative approaches to the analysis of inter-¯rm e±ciencydi®erences. The oldest of these was ¯rst used by Timmer (1971), who regressedestimated Farrel measures of technical e±ciency on ¯rm characteristics of interestby ordinary least squares. As pointed out by Kumbhakar et al. (1991) this maynot be appropriate since the dependent variable is bounded between zero and one.A better method is to apply limited dependent variable techniques of estimation
8The extension of balanced panel techniques of estimation of the random e®ects model to thecase of unbalanced panels is discussed in Hsiao (1986) and Baltagi (1995). Pitt and Lee (1981)derive the likelihood function of Model IIA for the balanced panel case with normal-half-normalerror terms while Seale(1990) obtains the likelihood function of the same model for unbalancedpanel data. See Green (1991) for the likelihhod function of the unbalanced panel case with thenorma-exponential error terms assumed here.
7
as is done, for example, in Martin and Page(1983), Kalirajan(1990) and Reif-schneider and Stevenson (1991). Alternatively, we can replace the Farell measureas the dependent variable by a score of e±ciency that is a positive, monotonictransformation of the former but is unrestricted in range (Lovell, 1993). Theproblem with this approach is that, if input levels are correlated with technicale±ciency contrary to what Models IIA assumes, they will also be correlated withthe very ¯rm characteristics that are expected to explain the variation in e±-ciency. Parameter estimators of the production frontier will therefore be biased.Since the bias might carry over to predictions of e±ciency, the technique shouldbe used only if the Hauseman test decisively rejects the ¯xed e®ects model.
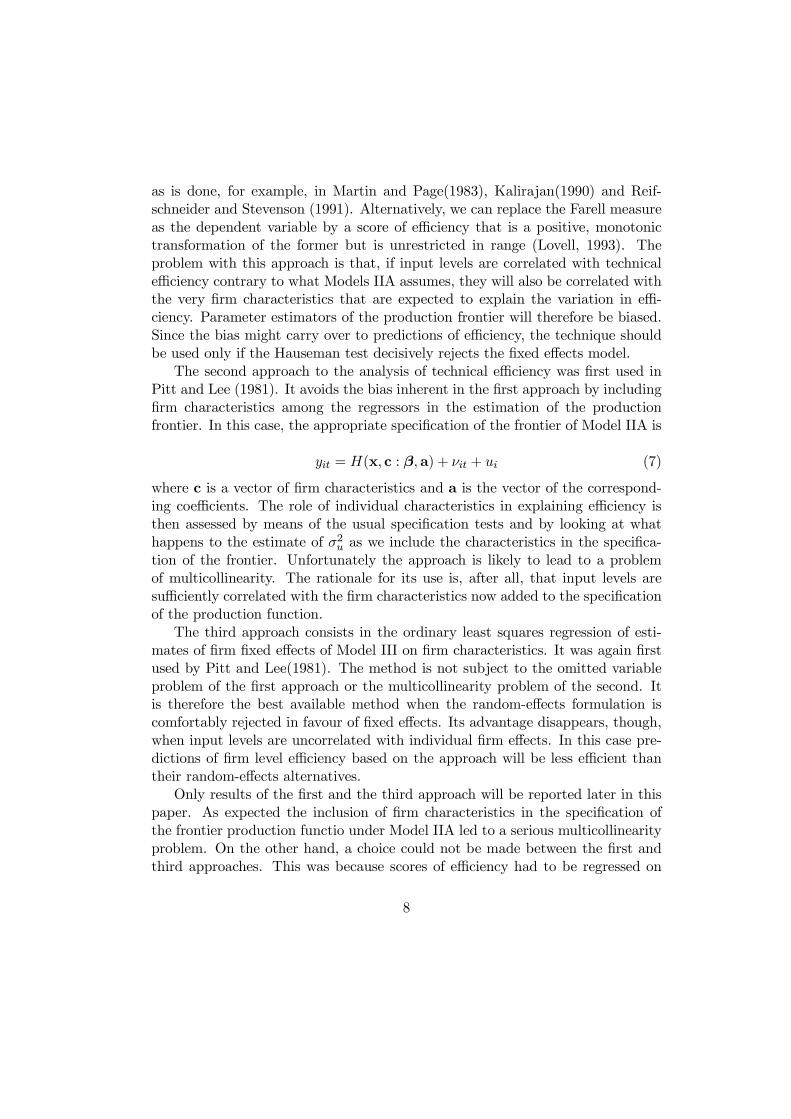
The second approach to the analysis of technical e±ciency was ¯rst used inPitt and Lee (1981). It avoids the bias inherent in the ¯rst approach by including¯rm characteristics among the regressors in the estimation of the productionfrontier. In this case, the appropriate speci¯cation of the frontier of Model IIA is
yit = H(x; c : ¯;a) + ºit + ui (7)
where c is a vector of ¯rm characteristics and a is the vector of the correspond-ing coe±cients. The role of individual characteristics in explaining e±ciency isthen assessed by means of the usual speci¯cation tests and by looking at whathappens to the estimate of ¾2u as we include the characteristics in the speci¯ca-tion of the frontier. Unfortunately the approach is likely to lead to a problemof multicollinearity. The rationale for its use is, after all, that input levels aresu±ciently correlated with the ¯rm characteristics now added to the speci¯cationof the production function.
The third approach consists in the ordinary least squares regression of esti-mates of ¯rm ¯xed e®ects of Model III on ¯rm characteristics. It was again ¯rstused by Pitt and Lee(1981). The method is not subject to the omitted variableproblem of the ¯rst approach or the multicollinearity problem of the second. Itis therefore the best available method when the random-e®ects formulation iscomfortably rejected in favour of ¯xed e®ects. Its advantage disappears, though,when input levels are uncorrelated with individual ¯rm e®ects. In this case pre-dictions of ¯rm level e±ciency based on the approach will be less e±cient thantheir random-e®ects alternatives.
Only results of the ¯rst and the third approach will be reported later in thispaper. As expected the inclusion of ¯rm characteristics in the speci¯cation ofthe frontier production functio under Model IIA led to a serious multicollinearityproblem. On the other hand, a choice could not be made between the ¯rst andthird approaches. This was because scores of e±ciency had to be regressed on
8
¯rm characteristics over the full sample of ¯rms while production functions wereestimated for subsamples of individual industries. As will be reported later, therandom-e®ects model was rejected in favour of the ¯xed e®ects model for someindustries but not for others. The use of only one of the two in the regression ofe±ciency scores pooled across industries could not therefore have been justi¯ed.
The score of relative technical e±ciency used in applying the ¯rst approach isdenoted by DPANU and is de¯ned as the deviation of the Battese-Coeli predic-tor, eui, from the industry sample mean. The transformation is strictly increasingin the Battese-Coeli predictor but is unbounded in range. It also has the addedrole of ¯ltering out the bias possibley arising from systematic inter-industry dif-ferences in sampling error.9 Since the bias is also potentially present in the useof the third approach, a similar transformation of estimated ¯rm ¯xed e®ects,denoted by SCOREF, is used as a dependent variable instead of individual ¯rme®ects. The variable SCOREF is de¯ned as the deviation of ¯rm ¯xed e®ectsfrom the industry sample mean of the e®ects expressed in units of the industrystandard deviation. The Battese-Coeli predictor, eui, will be denoted by PANUas a dependent variable. Firm-¯xed e®ects will be denoted by FIXED.
The choice of regressors is based on two of the implications of the passivelearning model. The ¯rst of these is that there are age-size e®ects in e±ciency.The second is that ¯rm age and ¯rm size proxy for entrepreneurial human capitaland locational advantage in as far as they explain e±ciency scores. Greatere±ciency leads to higher ¯rm size or longevity and not the other way round. If the¯rst proposition is correct then owner human capital and location variables shouldentirely explain observed inter-¯rm e±ciency di®erences with due allowance forsampling error. If the second proposition is correct, the regression of e±ciencyscores on ¯rm age and ¯rm size only should have at least as much explanatorypower as the alternative regression of the same scores on human capital andlocation variables, since entrepreneurial human capital and location advantagecan only be observed imperfectly. The coe±cients of age-size variables would notalso be as highly signi¯cant in an equation in which human capital and locationvariables are included. A result to the contrary means one or both of two things.One is that we fail to fully observe owner human capital or location advantage.The second is that not all the observed age or size e®ects in e±ciency can beattributed to passive learning. In particular a size e®ect that survives the fullcontrol for variation in entrepreneurial human capital and location advantagewould suggest alternative sources such as economies of scale and competitive
9The addition of industry dummies in the e±ciency score regressions no doubt helps tominimise the bias. However, there is no guarantee that it will eliminate it entirely.
9
di®usion.10 Likewise, age e®ects that would fail to disappear when we fully controlfor human capital and location may signal other sources such as the in°uenceof ¯rm age on replacement costs of capital and, hence, on e®ective choice oftechnique.11
Inter-¯rm e±ciency di®erences are competitive in the passive learning model.However, this is an assumption that is unlikely to hold in my data. Firms in thesample are distributed across industries that may di®er signi¯cantly in terms ofthe `competitive pressure' faced by the individual ¯rm. That the mean ¯rm levelof e±ciency of an industry depends on this particular factor is indeed the themeof much of the empirical literature on e±ciency analysis that seeks to assess theimpact of trade or regulatory policy on the performance of particular industries. Itherefore include industry dummies as the third set of regressors in the e±ciencyscore equations. As already pointed out the coe±cients of this set of variablesmay well be biased due to systematic inter-industry di®erences in sampling errorif the dependent variable is either FIXED or PANU. However the bias should notbe present when the dependent variables are replaced by SCOREF or DPANU.
I have grouped measures of owner human capital into three sets of variables:namely, measures of schooling, indicators of informally acquired skills and indica-tors of access to business networks. The variables in the ¯rst set have been usedin numerous studies of the determinants of ¯rm level technical e±ciency such asKalirajan (1990) which found that years of formal schooling was a signi¯cantlypositive in°uence on e±ciency among commercial rice farms in the Philippines.If the implication of passive learning to the relationship between e±ciency and¯rm longevity holds, this result is also con¯rmed by Bates(1990), who found theprobability of survival to increase in years of owner schooling for a sample of U.S.small businesses. To my knowledge the prior employment experience of the ¯rmowner in the current industry is the only variables in the second set to have beenused in a previous study of e±ciency.12 However, Bates (1990), Lentz and La-band(1990) and Holz-Eakin et al. (1994) examined the role of some of the other
10The distinction between passive learning, competitive di®usion and scale economies assources of size e®ects in ¯rm growth and e±ciency is discussed in Mengistae (1997).11Pitt and Lee (1981) advance this factor as a possible explanation to their ¯nding that younger
¯rms were more e±cient in the sample of Indonesian weaving ¯rms they studied. Their argumentis broadly consistent with Lambson's (1991) thesis that age e®ects in ¯rm level e±ciency andgrowth performance can arise under competitive conditions even in the absence of passive oractive learning if ¯rms di®er in sunk costs and have to make production and exit-entry decisionsunder market uncertainty.12The age of the owner and the number of years of the owner's prior experience in the industry
of the current business are two of the variables that Martin and Page (1983) used in explainingtechnical e±ciency in two Ghanian industries.
10
variables in the determination of size or longevity among small businesses in theUS. In the Letnz and Laband study, family background measured as whether theowner was a `second generation' business owner was found to be more importantthan formal schooling as a determinant of business success as measured by ¯rmsize. On the average second generation business owners ran bigger ¯rms than ¯rstgeneration owners when years of schooling, business assets at start up and thelength of pre-ownership experience in the current industry were all controlled for.In contrast, the in°uence of years of schooling was not statistically signi¯cant,which the authors interpreted to imply that the skills that second generationowners acquired by virtue of being brought up in the environment of a familybusiness was a better asset to a business career than formal education.13 This¯nding contradicts that of Bates, who found family -background variables to havehad little or no in°uence on ¯rm size. Holtz-Eakin et al., report that the samevariables also failed to explain variation in the probability of business survival.14
There are three variables in the third set one of which is the ethnicity of theowner and the others indicate his or her access to business networks as sources ofinformation or other forms of business support. To my knowledge, none of thesevariables has been used in a previous study of ¯rm level e±ciency. However, Fairlyand Meyer (1994) found that owner ethnicity was a signi¯cant determinant of thesize of immigrant owned ¯rms in the US, when owner age, years of educationand years of immigration were controlled for. Their interpretation of the result isthat it may suggest that business information and mutual support networks tendto form along ethnic lines and that some ethnic groups are better than others interms of `ability to transfer information to and from co-ethnics'15 Alternatively,the result may signal ethnic externality in the formation of business skills (Bor-jas, 1992). This is in the sense that the skill of a family generation may dependnot only on parental investment in the formal or informal training of childrenbut also on `the average quality of the ethnic environment' in which the sameinvestment is made, i.e., on what Borjas calls `ethnic capital'. If there is indeedsuch an externality, then the same amount of investment in the `education' ofchildren results in di®erent levels of skill formation across ethnic groups. More-over, if the externality is strong enough ethnic di®erences in skills and patterns ofcomparative advantages in trades or occupations will persist across generations.16
13See also Laband and Lentz (1983) for details of the underlying argument.14Holz-Eakin et al. found the age of the owner to be a signi¯cant determinant of ¯rm survival.15Their interpretation draws on some of the sociology literature on the determinants of entre-
preneurial success such as Zimmer and Aldrich (1987) and Aldrich and Waldinger (1990).16Borjas' argument is based on a narrowed down version of Coleman's (1988) concept of \social
capital\ and is very much in the spirit of the endogenous - growth literature (e.g. Romer,1986;
11
4. DATA.
4.1. Source.
The data are drawn from the results of the 1993 wave of the Addis Ababa Indus-trial Enterprises Survey for the design and implementation of which the authorwas responsible.17The survey covered a random selection of 220 ¯rms in severalmanufacturing industries in the Addis Ababa region of Ethiopia. The sampleconsisted of 190 private ¯rms and 30 public enterprises. The survey instrumentwas a questionnaire in 10 modules of which 9 were administered to ¯rm owners orgeneral managers in a face- to- face interview by a member of the research team.The data used in this particular study were generated by questions selected fromfour of the nine modules, namely, those dealing with (a ) production, cost andemployment ¯gures, (b) current capital stock and recent ¯xed investment, (c)history of establishment of the ¯rm and the employment history and family back-ground of the owner and (d) owner participation in business networks and socialorganisations.
Data used in the estimation of industry level average or frontier productionfunctions were generated by questions in the ¯rst two of the four modules. Dataon owner human capital and location variables used in e±ciency score regressionswere generated by the last two modules. The latter include the age of the ¯rm,indicators of the location of the ¯rm relative to suppliers, clients and competitors;the age, sex, marital status and ethnicity of the owner; the highest level of formaleducation attained by the owner; the major occupation of the parents of theowner; the pre- ownership employment status of the owner; the length of pre-ownership experience of the owner in the current industry of the ¯rm; the owner'sparticipation in apprenticeship and formal vocational training programmes priorto the establishment of the ¯rm; the owner's participation in informal creditor social organisations; and the owner's rating of relatives, friends, and otherbusiness people as alternative sources of business information.
4.2. Age-Size E®ects in Firm Growth.
A related paper of mine (Mengistae, 1997) shows that the rate of ¯rm growthin my sample decreases in initial ¯rm age and size. A summary of this result is
and Lucas ,1988) .17The round is the ¯rst in a survey series designed to generate panel data sets on various
aspects of enterprise development in manufacturing industries in Ethiopia and is a join projectof the Department of Economics of the Addis Ababa University , the Centre for the Study ofAfrican Economies of the University of Oxford and the Free University of Amsterdam.
12
presented in Table 1 for the full sample of ¯rms over the period 1989-93, whichis also the period of the production data analysed in this paper. In each rowof the table is my estimate of Gibrat's equation of ¯rm size for the indicatedtime interval. In each case the dependent variable is the log of end-of-periodemployment size of the ¯rm, CSIZE. The regressors are the log of beginning-of-period employment size, SIZE; the log of beginning-of-period age of the ¯rm,AGE; and an ownership dummy variable, PUBLIC, which assumes a value ofunity for public enterprises. A coe±cient of less than one for SIZE implies thatthe rate of ¯rm growth decreases in size. An inverse relationship between growthand age is indicated by a negative coe±cient for AGE. Public enterprises areincluded in the estimation of the growth equations as well as the estimation of theaverage or frontier production functions reported below. However, the e±ciencyscore regressions to be reported later refer only to privately owned ¯rms.
4.3. Production Variables.
The estimated production functions reported in the following section are basedon a panel of annual data on the volume of production, number of employeesand capital stock for the years 1989, 1991 and1993. Output is de¯ned as annualvalued added expressed at 1993 prices based on the Addis Ababa retail priceindex18. Value added in turn is de¯ned as annual production less the cost ofraw materials and utilities. Labour services is measured by annual man-hours.Annual energy consumption is used as a proxy for annual capital services. Bothinput variables are the same as those used in Pitt and Lee (1981) whose ¯ndings Iwill be comparing with mine in some of the discussion in Section V. An alternativemeasurement for capital services, ¯rst proposed by Hoch (1962) and more recentlyused in a frontier production function analysis of e±ciency by Seale(1990), isdepreciation plus annual interest charges on capital stock at the going bank longterm lending rate, which I also tried to use. However the coe±cient of capitalgenerally turned out to be negative.19
Each of the production functions speci¯ed in Section II is estimated separatelyfor six four- digit industries and a seventh category of ¯rms in a miscellany ofindustries of which the most important are the weaving, chemicals, rubber andpaper industries. The six four digit industries are: food (SIC 1541), wood work(SIC 3610), garments (SIC 1810 ), knitting (SIC 1730), leather products (SIC1920 ), and metal work (SIC 2811). Not all ¯rms in the sample were in operation
18There are no o±cial producer prices for non-agricultural output in Ethiopia at the moment.19It is interesting that the same outcome was reported by Hoch.
13
in 1989 approximately a ¯fth of them having been set up in 1990 or later. Thisand the omission of ¯rms with missing values for one of the three variables of theproduction function resulted in 515 observations on 198 ¯rms out of what couldhave been a total of 660 observations. Table 2 provides descriptive statistics of theproduction variables used by industry. The variables are : LABOUR , de¯nedas the log of total annual man-hours; CAPITAL, de¯ned as the log of annualconsumption of energy at1993 prices; and OUTPUT, de¯ned as the log of annualvalue added at 1993 prices.
4.4. Data on Firm Characteristics.
Descriptive statistics of regressors of the e±ciency score equations are given inTable 3. The variable LNSIZE represents ¯rm size and is de¯ned as the log ofthe average employment size of the ¯rm in 1989, 1991 and 1993. LNAGE is thelog of the age of the ¯rm in 1993. AGESQ is the square of LNAGE. The loca-tion variables in the table are: SURROUND, which is a dummy variable equalto 1 if the main business premise of the ¯rm is in the middle of those of the¯rm's competitors; OWPREM, which is a dummy variable equal to 1if the ¯rmowns its business premises; and GOVRENT, which is a dummy variable equalto1 if the ¯rm's premises are rented from the central government. Non-residentialurban land and property in Ethiopia is mostly government owned following thenationalisation law of 1975. Fifty one per cent of private ¯rms in the sample owntheir business premises. Some of these are ¯rms which operated on own propertyprior to the nationalisation and were allowed to keep ownership of the premisesby the new law. Others are establishments set up after the nationalisation onconverted residential property, usually having failed to secure sites in the nowgovernment owned industrial areas. There are two forms of access to such areasat the moment. One is renting buildings owned by the central government. Thesecond is tenancy to local or municipal authorities. The ¯rst is the case with25 per cent of ¯rms in the sample. Another 24 per cent operate on premisesrented from the local authority. Buildings rented from the central governmentare larger, better designed, better provided for in infrastructure, and of closerproximity to business centres compared to those under municipality ownership,which in turn are better suited for business than privately owned premises.. Theallocation of tenure to government or municipal property is purely one of admin-istrative rationing at rents that are generally believed to be far below currentopportunity cost. My hypothesis is therefore that tenants of the central govern-ment ( GOVRENT) generally have an advantage in location over those operating
14

on own property (OWPREM) or on municipal property. If it indeed exists, suchan advantage should be revealed through higher technical e±ciency. The variableSURROUND is an alternative measure of locational advantage. Its use is justi-¯ed by the fact that business premises in Addis Ababa are heavily concentratedin particular parts of the region each of which has come to be regarded as `thehome' of a particular industry and is presumably the preferred location of poten-tial entrants to the industry. Proximity to a larger number of competitors is onepossible indicator of access to such established sites.
4.5. Owner Human Capital Variables.
The de¯nition of the human capital variables included is as follows :LNEXPER=log of the number of years of experience the owner had in the
present industry prior to setting up or acquiring the ¯rm ;APPRENT=a dummy variable equal to 1 if the owner had ever been an
apprentice;PRIMARY=a dummy variable equal to 1 if the owner had completed primary
school as his or her highest level of formal education ;SECOND= a dummy variable equal to 1 if the owner had completed secondary
school as his or her highest level formal education ;COLLEGE=a dummy variable equal to 1 if the owner had completed a regular
course in an institution of higher education ;VOCATION= a dummy variable equal to 1 if the owner had completed a
regular vocational course in an institution of formal education ;OWNBUS= a dummy variable equal to 1 if the career of at least one of the
parents of the owner was running a non-farm business ;PUBEMP= a dummy variable equal to 1 if the career of at least one of the
parents of the owner was as a public sector employee ;PRIEMP= a dummy variable equal to 1 if the career of at least one of the
parents of the owner was as an employee of private non-farm ¯rm;The variables PRIMARY, SECOND, COLLEGE and VOCATION are ex-
pected to capture the in°uence of formal education of the owner on e±ciencyscores. The Ethiopian education system consists of six years of primary schoolfollowed by six years of secondary school at the end of which successful candidatesmay proceed to programmes of tertiary education lasting 2 years or more in uni-versities, polytechnics or junior colleges . Formal vocational training programmeslast between two and four years and are o®ered by comprehensive high schoolsor specialised technical colleges .Twelve per cent of owners of ¯rms in the sample
15
had not completed primary school when they started their businesses, 27 per centhad completed primary school but had not proceeded to secondary classes or haddropped out before sitting for the school leaving certi¯cate examination , 45 percent had completed secondary school and 16 per cent had completed a course oftertiary education. Just over 20 per cent had full-time vocational training.
More than 50 per cent of owners in the sample started their career as youngapprentices , mostly in the ¯eld of the present ¯rm . The variable APPRENTshould capture the in°uence of business skills that they might have picked up inthe course of this experience. The variable LNEXPER is intended to representskills that may have been acquired in the entire pre-ownership employment ex-perience of the owner in the present industry as an employee, a self-employee ,an apprentice or as an occasional helping hand in a family enterprise. Approxi-mately 70 per cent of owners in the sample had some kind of experience in theindustry prior to starting or acquiring the current ¯rm , the most important formof experience being wage-employment in another ¯rm ( 34 per cent ) followed byself-employment (21 per cent ) and `working and learning the trade at home' (19per cent ).
In one sense, the variables OWNBUS, PUBEMP and PRIEMP also belong tothe category of experience variables. However, unlike LNEXPER or APPRENTthey are not limited to experience in the ¯eld of the current ¯rm and should pickup the impact of parental occupation on the formation of business related skills.Only about 5 per cent of owners of ¯rms in the sample had a parent who owned amanufacturing establishment. However, 35 per cent of them had a parent who rana trade or service business. The parents of another 39 per cent were traditionalsmall farmers. About a ¯fth of owners had a parent who worked as an employeeof a private ¯rm or in the public sector.
The regressors relating to the ethnicity of owner and his or her access tobusiness or social networks are the following :
FELLOW= a dummy variable equal to 1 if the owner of the ¯rm rankedrelatives or friends as the most important sources of information to his or herbusiness ;
AMHARIC= a dummy variable equal to 1 if the owner of the ¯rm belongs tothe Amaharic ethnic group ;
GURAGE= a dummy variable equal to 1 if the owner of the ¯rm belongs tothe Gurage ethnic group ;
In order to asses the access of ¯rms to business networks, ¯rm owners wereasked in the survey to identify what they regarded as the most important sourceof information to their business from a list of possibilities that I have grouped into
16
the variable FELLOW and `other business' The latter groups the responses `otherbusiness men as clients', `other businessmen as suppliers', and `other business menin the same industry' which together account for 56 per cent of the responsesagainst 26 per cent responses under FELLOW. My hypothesis is that those whouse relatives or friends as their most important source of business information haveno or restricted access to business networks and are, therefore , at a disadvantagewhich should translate to lower scores of e±ciency of their ¯rms than those whosemost important sources of information are `other business men'.
In the light of the discussion in Section III, the two ethnicity variables,AMHARIC and GURAGE may perform one or both of two functions. On theone hand, they can indicate externality in the formation of entrepreneurial skillsof ¯rm owners in the sense of Borjas (1992).On the other, they may be measuringthe owners' access to business networks in as far as these are formed along ethniclines. Either way, the hypothesis is that the ethnicity of the owner is a signi¯cantin°uence on the e±ciency score of the ¯rm. Forty per cent of ¯rm owners inthe sample belong the Amharic ethnic group against 32.6 per cent who belongto the Gurage ethnic group. The popular wisdom in Ethiopia at present is thatthe Gurage have exceptional business acumen and a greater tendency to formmutual business support schemes along kinship lines. A Gurage is therefore gen-erally perceived to have a greater chance of succeeding in a business venture thana member of any other ethnic group in Ethiopia. If this is indeed the case thee±ciency scores of ¯rms under Gurage ownership should be higher other thingsbeing equal.
The last set of regressors in the e±ciency score regressions consists of industrydummies which I de¯ne as follows :
FOOD= a dummy variable equal to 1 for ¯rms producing food products (i.e.,SIC 1541);
WOODWOR= a dummy variable equal to 1 for ¯rms producing furniture(i.e., SIC 3610);
GARMENT= a dummy variable equal to 1 for ¯rms producing wearing ap-parel excluding knitwear (SIC 1810);
KNITTING= a dummy variable equal to 1 for ¯rms producing knitwear (SIC1730);
LEATHER= a dummy variable equal to 1 for ¯rms producing leather products(SIC 1920);and
METALWOR= a dummy variable equal to 1 for ¯rms producing structuralmetal products (SIC 2811) .
17
5. RESULTS.
5.1. Testing for Inter-Firm Di®erences in Technical E±ciency.
The pooled-data least squares estimation results of Model I are reported by in-dustry in Table 4 . They are the basis for testing the hypothesis that there aretime invariant in inter-¯rm di®erences in technical e±ciency to match the age-sizee®ects in growth detected in the data. The goodness of ¯t of the model is com-parable in every case to those reported in many other least square estimates ofthe Cobb-Douglas function on manufacturing micro data of developing countriesincluding those of Haddad (1993), Liu (1993), Page(1980), Pitt and Lee (1981),Seale(1990) and Tybout and Corbo (1991). A common result of these studies isthat the elasticity of output with respect to labour input is several times largerthan output elasticity with respect to capital, which is also the case reportedhere.
Table 5 reports results of the ML estimation of Model IIA. Results of theFeasible GLS estimation of Model IIB are reported in Table 6. Estimation resultsof Model III are given in Table 7. The null that there are no inherent inter-¯rmdi®erences in technical e±ciency is rejected in favour of each of the three models.Beginning with tests based on Model IIA, the likelihood ratio test rejects ModelI , or the restriction that ¾2u = 0, at the 5 per cent level for all industries exceptone. Indeed , the estimate of ¾2u exceeds that of ¾2À in two of the industries andis only slightly the smaller variance component in the rest. The same restrictionis rejected even more decisively in relation to Model IIB by the Breuch-PaganLM test for which the test statistic is signi¯cant at almost any level in all theindustries. The estimate of ¾2u is also greater than that of ¾2À in ¯ve of theindustries and is far from being `swamped' by the purely temporary componentin the other two. A similar result is obtained with respect to Model III wherethe null of no ¯rm ¯xed e®ects is rejected by the likelihood ratio test at the 1 percent level or less for every industry.
5.2. Age-Size E®ects In Firm Level E±ciency.
As already pointed out, the Hauseman test of Model IIB against Model III ine®ect tests for a size e®ect in technical e±ciency when size is measured by thescale of input usage. The test rejects the random e®ects formulation only forthree of the seven industries. However, age-size e®ects in e±ciency are evidentin Table 8, regardless of whether e±ciency scores are based on the ¯xed e®ectsmodel or on the random e®ects formulation. The scores of e±ciency used in the
18
regressions of the ¯rst two columns of Table 8 are based on estimates of Model III.Those used in the regressions reported in the last two columns ot the same tableare based on estimates of Model IIA. In all columns of the table ¯rm e±ciencyincreases in size. Older ¯rms are also more e±cient until some age threshold isreached beyond which e±ciency seems to decrease with age. Both outcomes areconsistent with the predictions of the passive learning model . The result thatbigger ¯rms are more e±cient is also consistent with the ¯ndings of Pitt andLee (1981) in their study of Indonesian weaving ¯rms. The result that e±ciencyincreases with ¯rm age below some threshold age is consistent with the ¯ndingsof Martin and Page (1983) for a sample of ¯rms in the Ghanian wood industryand with those of Haddad(1993) for a sample Manufacturing ¯rms in Morocco.However, it contradicts the result of Pitt and Lee who detected a negative agee®ect in e±ciency. One possible explantation of the Pitt and Lee result is thattheir sample is truncated in age above the threshold level detected here. It is,of course, also possible that their suggested explanation that the e®ect is due tosunk costs impeding choice of technique by older ¯rms is correct at least for theirsample.
5.3. Firm Characteristics and E±ciency.
That the age-size regressors in the e±ciency score equations of Table 8 do indeedmainly proxy for entrepreneurial human capital and locational advantage is sug-gested by Tables 9 and 10. This result comes out more forcefully in the randome®ects model than in the ¯xed e®ects formulation. Table 9 reports results of theregression of scores of e±ciency on ¯rm characteristics including ¯rm age and ¯rmsize. The age-size variables are excluded from the regressions of Table 10. TheF-test fails to reject the exclusion at the 5 per cent level in all cases. Moreover,contrary to what we see in Table 8, neither age nor size is any longer signi¯cantin the regressions based on the random e®ects regression of Table 9. The in°u-ence of age on ¯xed e®ect e±ciency scores reported in Table 8 also disappearsin Table 9 as we add human capital and location variables. However, the e®ectof size on ¯xed e®ect e±ciency scores persists between the two tables which maybe an indication that some of the size e®ect registered in the ¯rst two columnsof Table 8 may be a result of sources other than di®erences in entrepreneurialhuman capital or location.
Turning to the e®ect of individual location variables, we see from both Tables9 and 10 that `advantageous location' is a stronger in°uence on ¯xed e®ect e±-ciency scores than it is in the random e®ects model. This is particularly the case
19
in the regressions in which the score is SCOREF. In this case all the three locationvariables are statistically signi¯cant, have the expected sign and are of the sameorder of magnitude as those of LNAGE in the corresponding regression in Table8. Changing the dependent variable to FIXED does not alter the result muchexcept that the standard errors of the coe±cient of SURROUND become con-siderably larger. The regression results based on ranodm e®ect e±ciency scoresare consistent with those of the ¯xed-e®ect model in terms of the signs of esti-mated coe±cients (columns 3 and 4). However, only one of the location variables,namely, GOVRENT, is signi¯cant in this case.
The ¯xed-e®ects and random- e®ects speci¯cations are in almost full agree-ment when it comes to the role of owner human capital variables. First, in bothcases levels of formal education exert a far stronger in°uence on e±ciency thanany of location or other human capital variables. The coe±cient of each of thevariables, PRIMARY, SECOND and COLLEGE is positive, signi¯cant at theone per cent level and greater in magnitude than that of any of the other humancapital or location variables. Secondly, skills that ¯rm owners may have acquiredinformally prior to setting up their businesses as indicated by APPRENT orLNEXPER does not seem to in°uence technical e±ciency in either case. Thesame applies to technical skills acquired through formal training as indicated byVOCATION. If anything the negative signs of the coe±cients of the three vari-ables suggest that ¯rms whose owners have had longer pre-ownership experienceand vocational training are less e±cient. A possible explanation for this is thatowners that have had the longest pre ownership career in an industry as traineesor employees tend to set up a business of their own in the same industry or tendto stay put less because they are convinced of their competitive advantage overnew comers than because their relative e±ciency would be even lower elsewhere.20
Probably for the same reason, I ¯nd that ¯rms of `second generation' businessmenare less e±cient than those of `¯rst generation' ¯rm owners. The coe±cient ofthe variable OWNBUS is negative and signi¯cant in the regression of ¯rm ¯xede®ects in Table 9, while the variable PUBEMP is positive and signi¯cant in theregressions of PANU and DPANU. The result is consistent with those of Bates(1990) and Holtz-Eakin et al.(1993) but contrary to what Lentz and Laband(1990) reported.
The coe±cient of FELLOW is signi¯cant and has the expected sign in all theequations of Tables 9 and 10. The result suggests that technical e±ciency is higherthe greater is the access of the owner to business networks extending beyond
20We not that our result that LNEXPER is not a signi¯cant in°uence on technical e±ciencycontrasts with the ¯ndings of Martin and Page(1983)for a sample of industrial ¯rms in Ghana.
20
relatives or friends. I also ¯nd that the ethnicity of the owner is correlated with a¯rm's e±ciency. As I noted earlier, this may be due to ethnicity determining thequality or extent or scope of the business networks the owner is able to access.Alternatively it may re°ect the e®ect of ethnicity as a source of externalities inthe formation of the owner's skills. Of the two ethnicity variables considered,AMHARIC is negative and signi¯cant in all the four equations suggesting that¯rms run by Amaharic business men are doing generally worse than other ¯rms.However, the other variable, GURAGE, is negative and not signi¯cant, whichdoes not popular view of the Gurage as the most likely to `succeed in business'among all the ethnic groups in Ethiopia at least in relation to manufacturingbusinesses.
I ¯nally note that the evidence for an industry e®ect in ¯rm level e±ciency israther mixed. The relevant results in this connection are those of the regressionof SCOREF or DPANU on ¯rm characteristics since coe±cients of estimates ofindustry dummies in the other regressions are clearly biased for industry e®ectsdue to systematic inter-industry di®erences in sampling error. Using the SCOREFor DPANU, we see that there are signi¯cant industry e®ects in e±ciency accordingto the ¯xed e®ects model but practically none according to the random e®ectsformulation.
6. SUMMARY AND CONCLUSION.
Using data on a sample of manufacturing ¯rms in Ethiopia, this paper reportsfurther evidence in favour of Jovanovic's version of the passive learning modelof competitive selection. Several studies of ¯rm growth in developed economieshave found that the probability of survival of ¯rms increases in ¯rm size andage while the growth rate of a ¯rm conditional on survival decreases in bothvariables.. This result is consistent with the Jovanovic model and, as reported ina companion paper, is also supported by the data analysed in this paper. Themain contribution of the paper is the testing of three other implications of thepassive learning model for the ¯rst time. The ¯rst is that age-size e®ects ingrowth or survival imply permanent inter-¯rm di®erences in technical e±ciency.The second is that there are age-size e®ects in ¯rm level e±ciency whereby older¯rms are more e±cient given size, and bigger ¯rms are more e±cient given age.The third is that the direction of causation is not from ¯rm age or size to e±ciency,but the other way round. Age-size e®ects in ¯rm level e±ciency should, at least inpart, be traced to the in°uence on e±ciency of more enduring ¯rm characteristicssuch as entrepreneurial human capital and location.
21
I have argued that the passive learning model implies a ¯xed e®ects distrib-ution of techniques relative to a frontier or an average production function. Thenull that there are no ¯rm e®ects in the deviation of techniques from the aver-age production function or e±ciency frontier is rejected in favour of ¯xed as wellas random e®ect deviations. The random e®ects model of inter-¯rm e±ciencydi®erences is rejected in favour of the ¯xed e®ects model only in three out ofseven industries for which e±ciency frontiers have been estimated . However, aregression of scores of e±ciency obtained from either model on ¯rm size and ¯rmage over the full sample of ¯rms shows scores increase in size as well as age untilsome age threshold is reached beyond which they continue to increase with sizebut decrease with age.
The result that scores of e±ciency increase in size con¯rms an earlier ¯ndingof Pitt and Lee (1981) for a sample of Indonesian weaving ¯rms and Martin andPage(1983) for a sample of Ghanian ¯rms. My ¯nding of a positive age e®ecton e±ciency con¯rms another result of Martin and Page which has also beenreported by Haddad (1993) for a sample of Moroccoan manufacturing ¯rms.21
However, there is a major point of departure between the three studies and mine.This is my ¯nding that ¯rm age and ¯rm size mainly proxy for the in°uence ofentrepreneurial human capital and location variables in the regression of technicale±ciency on ¯rm characteristics. I ¯nd that the addition of owner human capitalor ¯rm location variables to ¯rm size and age or vice versa in e±ciency scoreregression does not signi¯cantly add to the explanatory power of the model. Onthe other hand a regression of scores of e±ciency on ¯rm size and ¯rm age only hasa highly signi¯cant explanatory power which is comparable to that of a separateregression of scores on human capital and location variables only.
I have also reported that location is a signi¯cant determinant of ¯rm levele±ciency. However, it is far less important than owner human capital variables.In assessing the relative importance of the latter I have considered a wider rangeof possible indicators of entrepreneurial human capital than any used in previousstudies of ¯rm level e±ciency. Some of these represent variables which have neverbeen used as e±ciency regressors before but are so important that their omissionmay signi¯cantly bias estimated e®ects of the more conventional determinants ofowner managed ¯rms. The new variables include family background indicatorsof the owner, the ethnicity of the owner and his or her membership to business
21It should be noted , though , that Haddad's study does not directly control for size e®ectsin relating e±ciency scores to ¯rm age. His results are therefore comparable to the other twoand ours only in as far as the other explanatory variables he included are su±ciently correlatedwith ¯rm size but not age.
22
networks. I ¯nd that the last two sets of variables are signi¯cant sources of inter-¯rm e±ciency di®erences in the Ethiopia's manufacturing industries, althoughyears of formal schooling of the owner is a far stronger in°uence. On the otherhand, there is no evidence that e±ciency is a®ected by the age of the owner,the length of his or her prior experience in the current industry, the vocationaltraining of the owner or his or her occupational following of parents .
References
[1] Aigner, D. and S.Chu (1968) `On Estimating the Industry Production Func-tion', American Economic Review, Vol. 58 , pp. 826-835.
[2] Aigner, D., C.A.K. Lovell and P.Schmidt ( 1977) `Formulation and Estima-tion of Stochastic Frontier Production Function Models', Journal of Econo-metrics , Vol. 6, pp. 21-37.
[3] Aldrich , H. and R. Waldinger (1990) ` Ethnicity and Entrepreneurship',Annual Review of Sociology, Vol. 16, pp. 111-135.
[4] Baltagi, B. (1995) The Econometic Analysis of Panel Data, Chichester: JohnWiley & Sons.
[5] Bates , T. (1990) `Entrepreneur Human Capital Inputs and Small BusinessLongevity', Review of Economics and Statistics, Vol. 72, No. 4, pp. 551-559.
[6] Battese, G. and T. Coelli (1988) `Prediction of Firm- Level Technical E±-ciencies With a Generalised Frontier Production Function and Panel Data',Journal of Econometrics ,Vol. 38, pp. 387-399.
[7] Bauer , P. (1990) `Recent Developments in the Econometric Estimation ofFrontiers', Journal of Econometrics ,Vol. 46 , pp. 39-56.
[8] Borjas , G. (1992) `Ethnic Capital and Intergenerational Mobility', QuarterlyJournal of Economics,Vol. 107, pp. 123-150.
[9] Coleman , J. (1988) ` Social Capital in the Creation of Human Capital',American Journal of Sociology , Vol. 94, S95-120.
[10] Dunne, T., M. Roberts and L. Samuelson (1989) `The Growth and Failure ofUS Manufacturing Plants', Quarterly Journal of Economics ,Vol. 104 , pp.671-689.
23
[11] Dunne , P. and A. Hughes (1994) `Age, Size, Growth and Survival : UKCompanies in the 1980's', Journal of Industrial Economics, June, pp. 115-140.
[12] Evans , D.( 1987) `Tests of Alternative Theories of Firm Growth', Journalof Political Economy, Vol. 95, pp. 657-674.
[13] Fairlie , R. and B.Meyer (1994) `The Ethnic and Racial Character of Self-Employment', NBER Working Paper No. 4791, July.
[14] Farrel , M. (1957) ` The Measurement of Productive E±ciency ', Journal ofthe Royal Statistical Society, A, Vol. 120 , pp. 253-81.
[15] Forsund , F., C.A.K. Lovell, and P.Schmidt (1980) `A Survey of FrontierProduction Functions and of their Relationship to E±ciency measurement',Journal of Econometrics, Vol. 13, pp. 5-25.
[16] Haddad , M. (1993) `How Trade Liberalisation A®ected Productivity in Mo-rocco' , World Bank Policy Research Working Papers , WPS 1096 , February.
[17] Kumbhakar , S., S. Ghosh and J. McGuckin (1991) `A Generalised Produc-tion Frontier Approach for Estimating Determinants of Ine±ciency in U. S.Dairy Farms', Journal of Business and Economic Statistics ,Vol. 9, No. 3,pp. 279-286.
[18] Hausman , J. (1978) `Speci¯cation Tests in Econometrics', Econometrica,Vol. 46 , pp. 1251- 1272.
[19] Hoch , I. (1962) `Estimation of Production Function Parameters CombiningTime Series and Cross Section Data', Econometrica , Vol. 30, pp. 556-578.
[20] Holtz-Eakin , D., D. Joulfaian and H. Rosen (1994) `Sticking it Out : Entre-preneurial Survival and Liquidity Constraints', Journal of Political Economy,Vol. 102, pp. 53-75.
[21] Hsiao, C. (1986) Analysis of Panel Data , Cambridge: Cambridge UniversityPress.
[22] Jovanovic, B. and G. MacDonald (1994) `Competitive Di®usion', Journal ofPolitical Economy, Vol. 102, pp. 24-52.
24
[23] Jovanovic, B. (1982) `Selection and the Evolution of Industry', Econometrica,Vol. 50, pp. 649-670.
[24] Kalirajan , K. (1990) `On Measuring Economic E±ciency', Journal of Ap-plied Econometrics, Vol. 5, pp. 75-85.
[25] Laband, D. and B. Lentz, (1983) `Like Father, Like Son : Toward an Eco-nomic Theory of Occupational Following', Southern Economic Journal, Vol.50, pp. 474-493.
[26] Lambson,V. (1991) `Industry Evolution with Sunk Costs and Uncertain Mar-ket Demand', International Journal of Industrial Organisation, Vol. 9, pp.171-196.
[27] Lentz B. and D. Laband (1990) `Entrepreneurial Success and OccupationalInheritance Among Proprietors', Canadian Journal of Economics, Vol. 23,No. 3, pp. 563-578.
[28] Lippman, S. and R. Rumelt (1982) `Uncertain Imitability : Analysis of Inter-¯rm Di®erences in E±ciency Under Competition', Bell Journal of Economics, 13 , 418- 438.
[29] Liu, L. (1993) `Entry, Exit, Learning, and Productivity Change: EvidenceFrom Chile', Journal of Development Economics, Vol. 42, pp. 217-242.
[30] Lucas, R. E. (1978) `On the Size Distribution of Business Firms', Bell Journalof Economics, Vol. 9, pp. 508-523.
[31] Marschak, J. and W. Andrews (1944) `Random Simultaneous Equations andthe Theory of Production', Econometrica, Vol. 12
[32] Martin, J. and M. Page (1983), `The Impact of Subsidies on X-e±ciency inLDC Industry: Theory and Empirical Test', The Review of Economics andStatistics, pp. 608- 617.
[33] Meeusen, W. and van den Broeck, J. ,1977 ,`E±ciency Estimation fromCobb-Douglas Production Functions with Composed Error', InternationalEconomic Review, 18 ,435- 444.
[34] Mengistae,T. (1997) `Selection and Industry E®ects in the Growth of Firms inEthiopia', memieo.. , Centre for the Study of African Economies, Universityof Oxford.
25
[35] Mundlak ,Y. (1961) `Empirical Production Functions Free From Manage-ment Bias', Journal of Farm Economics, Vol. 43, pp. 44-66.
[36] Mundlak, Y (1978) `On the Pooling of Time Series and Cross Section Data,'Econometrica,Vol. 46, pp.69-85.
[37] Page, J. (1980) `Technical E±ciency and Economic Performance: Some Ev-idence From Ghana', Oxford Economic Papers, Vol. 32, pp. 319-339.
[38] Pitt , M. and Lee, L., 1981,`The Measurement and Sources of TechnicalIne±ciency in the Indonesian Weaving Industry', Journal of DevelopmentEconomics, Vol. 9, pp. 43-64.
[39] Reifschneider, D. and R. Stevenson (1991) `Systematic Departures From TheFrontier: A Framework for the Analysis of Firm Level Ine±ciency', Interna-tional Economic Review, Vol. 32, No. 3, pp. 715-723.
[40] Schmidt, P. (1986) `Frontier Production Functions', Econometric Reviews,No. 4, pp. 289-328.
[41] Seale, J. (1990) `Estimating Stochastic Frontier Systems with UnbalancedPanel Data: The Case of Floor Tile Manufactures in Egypt', Journal ofApplied Econometrics, Vol. 5, pp. 59-74.
[42] Timmer, C. (1971) ` Using a Probabilistic Frontier Production Function toMeasure Technical E±ciency', Journal of Political Economy, Vol. 79, pp.776-794.
[43] Tybout, J., J. de Melo and V. Corbo (1991) ` The E®ects of Trade Reformson Scale and Technical E±ciency: New Evidence From Chile', Journal ofInternational Economics, Vol. 31, pp. 231-250.
[44] Variam, J. and D. Kraybil (1992) `Empirical Evidence on the Determinantsof Firm Growth', Economics Letters, Vol. 38, pp. 31-36.
[45] Zellner, A. J. Kmenta and J. Dreze (1966) `Speci¯cation and Estimation ofCobb- Douglas Production Function Models', Econemetrica, Vol. 34 , pp.784-795.
[46] Zimmer , A. and H. Aldrich (1987) ` Resource Mobilisation through Eth-nic Networks : Kinship and Friendship Ties of Shopkeepers in England',Sociological Perspectives, Vol. 30 , pp. 422-445.
26
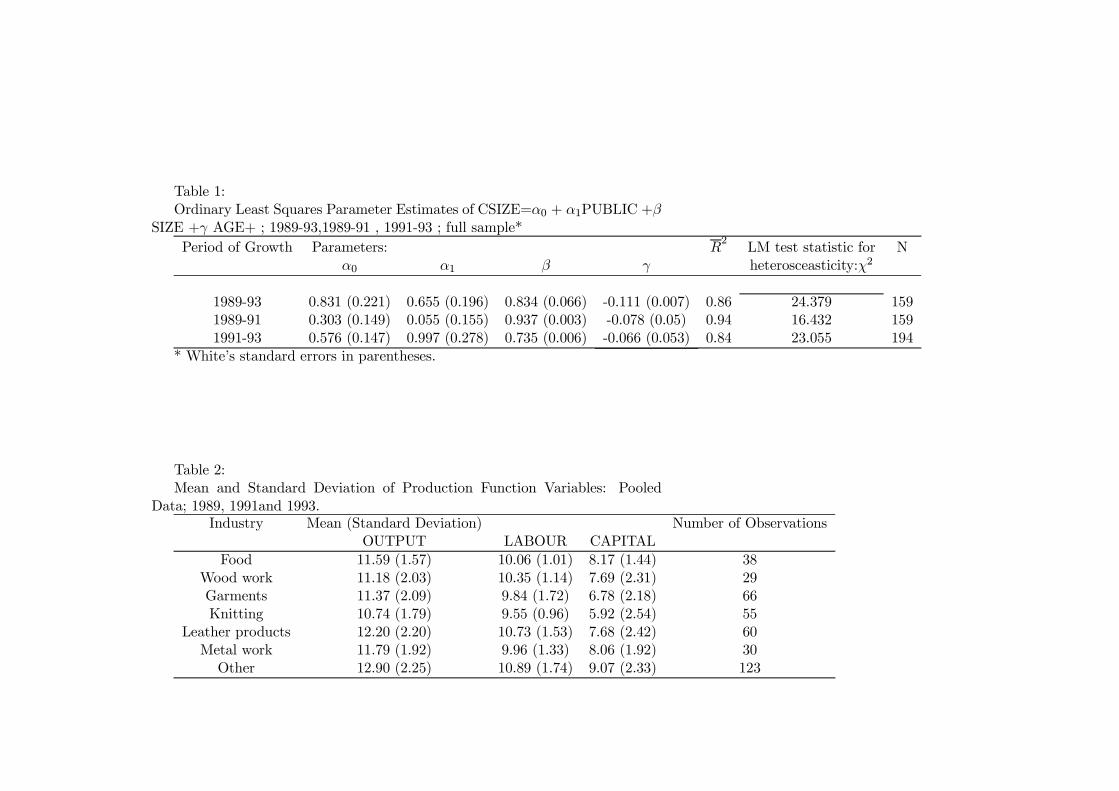
Table 1:Ordinary Least Squares Parameter Estimates of CSIZE=®0 + ®1PUBLIC +¯
SIZE +° AGE+ ; 1989-93,1989-91 , 1991-93 ; full sample*
Period of Growth Parameters: R2
LM test statistic for N®0 ®1 ¯ ° heterosceasticity:Â2
1989-93 0.831 (0.221) 0.655 (0.196) 0.834 (0.066) -0.111 (0.007) 0.86 24.379 1591989-91 0.303 (0.149) 0.055 (0.155) 0.937 (0.003) -0.078 (0.05) 0.94 16.432 1591991-93 0.576 (0.147) 0.997 (0.278) 0.735 (0.006) -0.066 (0.053) 0.84 23.055 194
* White's standard errors in parentheses.
Table 2:Mean and Standard Deviation of Production Function Variables: Pooled
Data; 1989, 1991and 1993.Industry Mean (Standard Deviation) Number of Observations
OUTPUT LABOUR CAPITAL
Food 11.59 (1.57) 10.06 (1.01) 8.17 (1.44) 38Wood work 11.18 (2.03) 10.35 (1.14) 7.69 (2.31) 29Garments 11.37 (2.09) 9.84 (1.72) 6.78 (2.18) 66Knitting 10.74 (1.79) 9.55 (0.96) 5.92 (2.54) 55
Leather products 12.20 (2.20) 10.73 (1.53) 7.68 (2.42) 60Metal work 11.79 (1.92) 9.96 (1.33) 8.06 (1.92) 30
Other 12.90 (2.25) 10.89 (1.74) 9.07 (2.33) 123
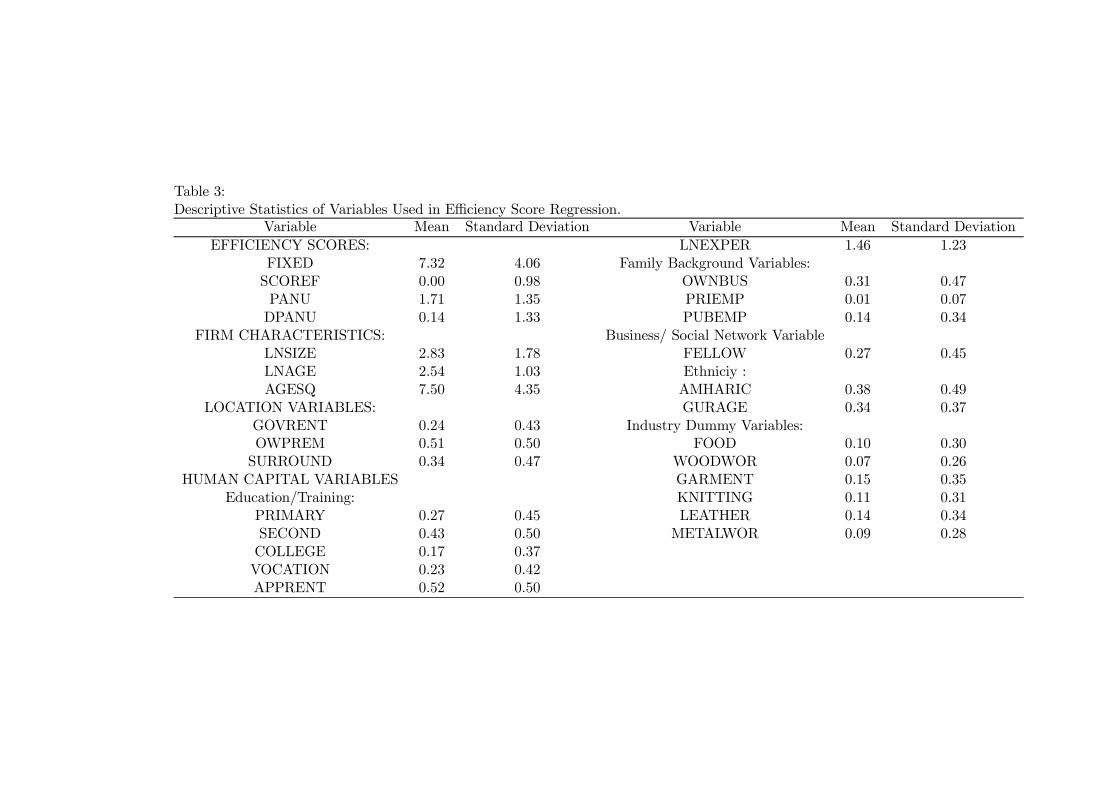
Table 3:Descriptive Statistics of Variables Used in E±ciency Score Regression.
Variable Mean Standard Deviation Variable Mean Standard Deviation
EFFICIENCY SCORES: LNEXPER 1.46 1.23FIXED 7.32 4.06 Family Background Variables:
SCOREF 0.00 0.98 OWNBUS 0.31 0.47PANU 1.71 1.35 PRIEMP 0.01 0.07
DPANU 0.14 1.33 PUBEMP 0.14 0.34FIRM CHARACTERISTICS: Business/ Social Network Variable
LNSIZE 2.83 1.78 FELLOW 0.27 0.45LNAGE 2.54 1.03 Ethniciy :AGESQ 7.50 4.35 AMHARIC 0.38 0.49
LOCATION VARIABLES: GURAGE 0.34 0.37GOVRENT 0.24 0.43 Industry Dummy Variables:OWPREM 0.51 0.50 FOOD 0.10 0.30
SURROUND 0.34 0.47 WOODWOR 0.07 0.26HUMAN CAPITAL VARIABLES GARMENT 0.15 0.35
Education/Training: KNITTING 0.11 0.31PRIMARY 0.27 0.45 LEATHER 0.14 0.34SECOND 0.43 0.50 METALWOR 0.09 0.28COLLEGE 0.17 0.37VOCATION 0.23 0.42APPRENT 0.52 0.50
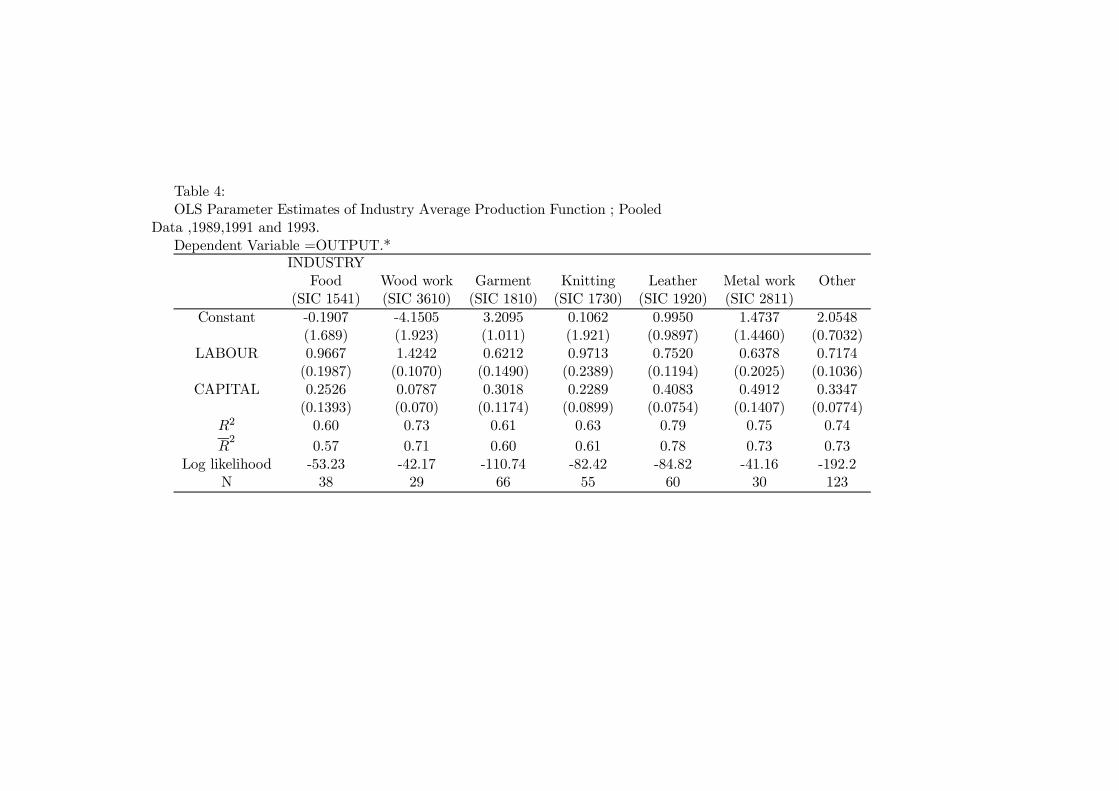
Table 4:OLS Parameter Estimates of Industry Average Production Function ; Pooled
Data ,1989,1991 and 1993.Dependent Variable =OUTPUT.*
INDUSTRYFood Wood work Garment Knitting Leather Metal work Other
(SIC 1541) (SIC 3610) (SIC 1810) (SIC 1730) (SIC 1920) (SIC 2811)
Constant -0.1907 -4.1505 3.2095 0.1062 0.9950 1.4737 2.0548(1.689) (1.923) (1.011) (1.921) (0.9897) (1.4460) (0.7032)
LABOUR 0.9667 1.4242 0.6212 0.9713 0.7520 0.6378 0.7174(0.1987) (0.1070) (0.1490) (0.2389) (0.1194) (0.2025) (0.1036)
CAPITAL 0.2526 0.0787 0.3018 0.2289 0.4083 0.4912 0.3347(0.1393) (0.070) (0.1174) (0.0899) (0.0754) (0.1407) (0.0774)
R2 0.60 0.73 0.61 0.63 0.79 0.75 0.74
R2
0.57 0.71 0.60 0.61 0.78 0.73 0.73Log likelihood -53.23 -42.17 -110.74 -82.42 -84.82 -41.16 -192.2
N 38 29 66 55 60 30 123
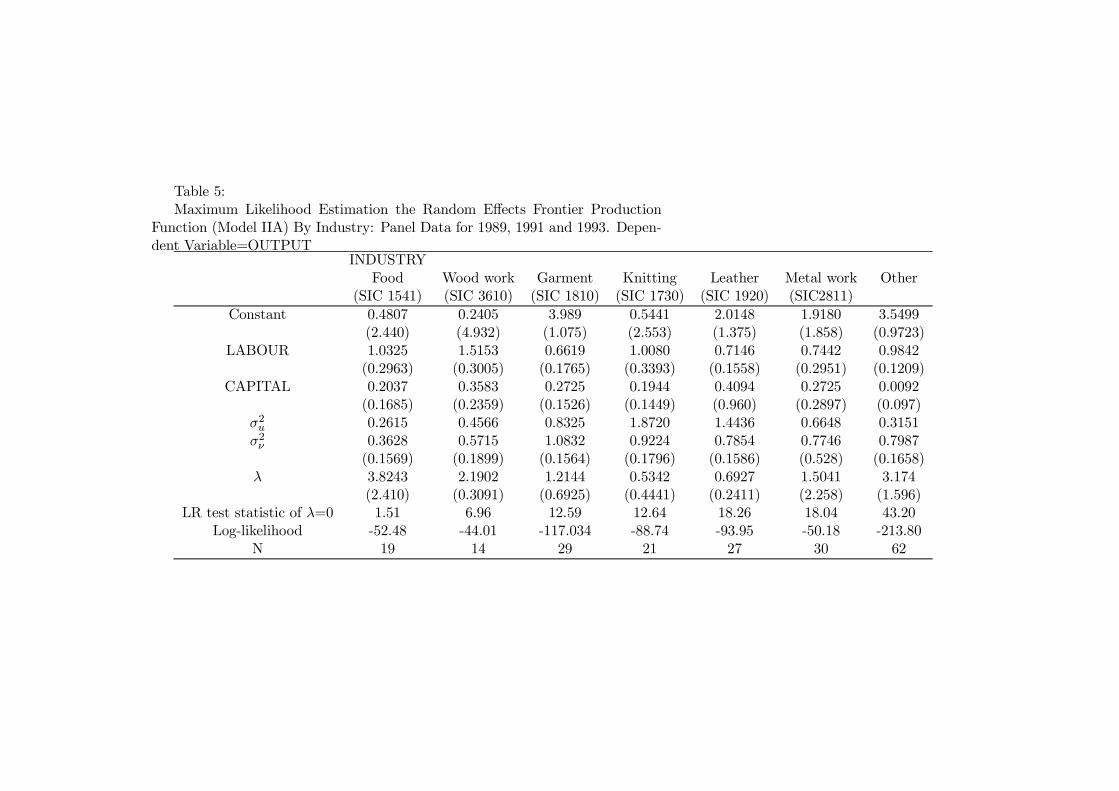
Table 5:Maximum Likelihood Estimation the Random E®ects Frontier Production
Function (Model IIA) By Industry: Panel Data for 1989, 1991 and 1993. Depen-dent Variable=OUTPUT
INDUSTRYFood Wood work Garment Knitting Leather Metal work Other
(SIC 1541) (SIC 3610) (SIC 1810) (SIC 1730) (SIC 1920) (SIC2811)
Constant 0.4807 0.2405 3.989 0.5441 2.0148 1.9180 3.5499(2.440) (4.932) (1.075) (2.553) (1.375) (1.858) (0.9723)
LABOUR 1.0325 1.5153 0.6619 1.0080 0.7146 0.7442 0.9842(0.2963) (0.3005) (0.1765) (0.3393) (0.1558) (0.2951) (0.1209)
CAPITAL 0.2037 0.3583 0.2725 0.1944 0.4094 0.2725 0.0092(0.1685) (0.2359) (0.1526) (0.1449) (0.960) (0.2897) (0.097)
¾2u 0.2615 0.4566 0.8325 1.8720 1.4436 0.6648 0.3151¾2º 0.3628 0.5715 1.0832 0.9224 0.7854 0.7746 0.7987
(0.1569) (0.1899) (0.1564) (0.1796) (0.1586) (0.528) (0.1658)¸ 3.8243 2.1902 1.2144 0.5342 0.6927 1.5041 3.174
(2.410) (0.3091) (0.6925) (0.4441) (0.2411) (2.258) (1.596)LR test statistic of ¸=0 1.51 6.96 12.59 12.64 18.26 18.04 43.20
Log-likelihood -52.48 -44.01 -117.034 -88.74 -93.95 -50.18 -213.80N 19 14 29 21 27 30 62
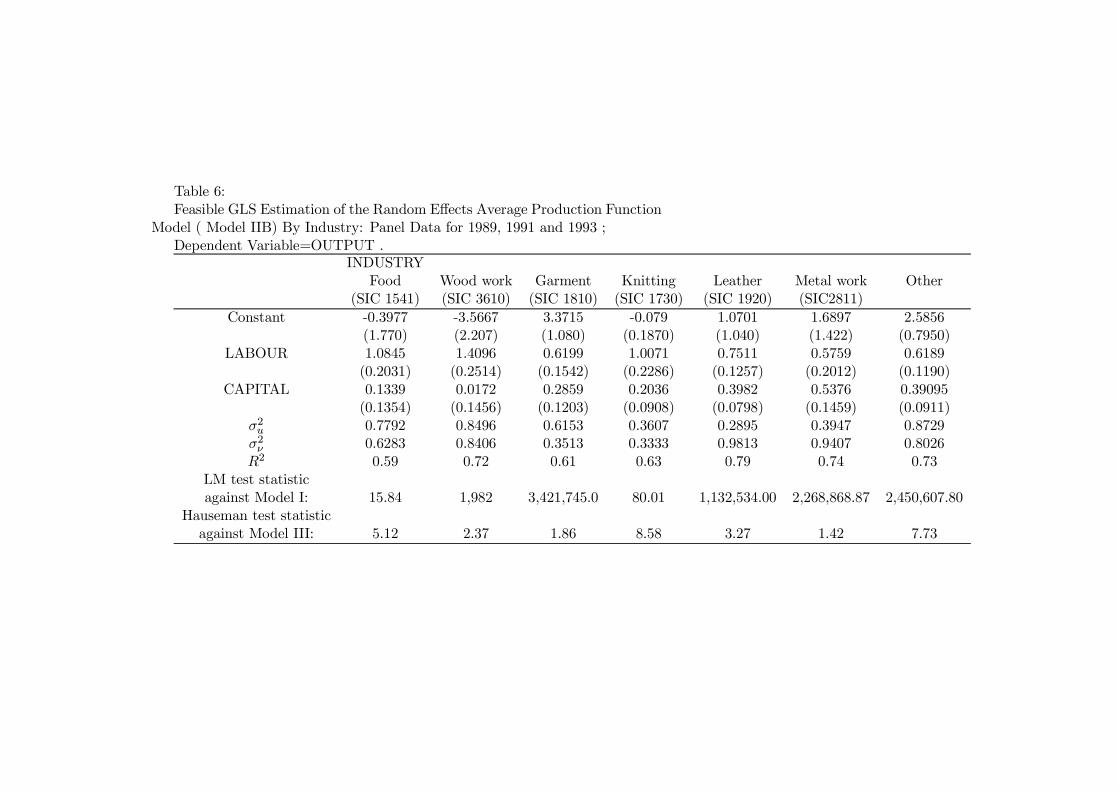
Table 6:Feasible GLS Estimation of the Random E®ects Average Production Function
Model ( Model IIB) By Industry: Panel Data for 1989, 1991 and 1993 ;Dependent Variable=OUTPUT .
INDUSTRYFood Wood work Garment Knitting Leather Metal work Other
(SIC 1541) (SIC 3610) (SIC 1810) (SIC 1730) (SIC 1920) (SIC2811)
Constant -0.3977 -3.5667 3.3715 -0.079 1.0701 1.6897 2.5856(1.770) (2.207) (1.080) (0.1870) (1.040) (1.422) (0.7950)
LABOUR 1.0845 1.4096 0.6199 1.0071 0.7511 0.5759 0.6189(0.2031) (0.2514) (0.1542) (0.2286) (0.1257) (0.2012) (0.1190)
CAPITAL 0.1339 0.0172 0.2859 0.2036 0.3982 0.5376 0.39095(0.1354) (0.1456) (0.1203) (0.0908) (0.0798) (0.1459) (0.0911)
¾2u 0.7792 0.8496 0.6153 0.3607 0.2895 0.3947 0.8729¾2º 0.6283 0.8406 0.3513 0.3333 0.9813 0.9407 0.8026R2 0.59 0.72 0.61 0.63 0.79 0.74 0.73
LM test statisticagainst Model I: 15.84 1,982 3,421,745.0 80.01 1,132,534.00 2,268,868.87 2,450,607.80
Hauseman test statisticagainst Model III: 5.12 2.37 1.86 8.58 3.27 1.42 7.73
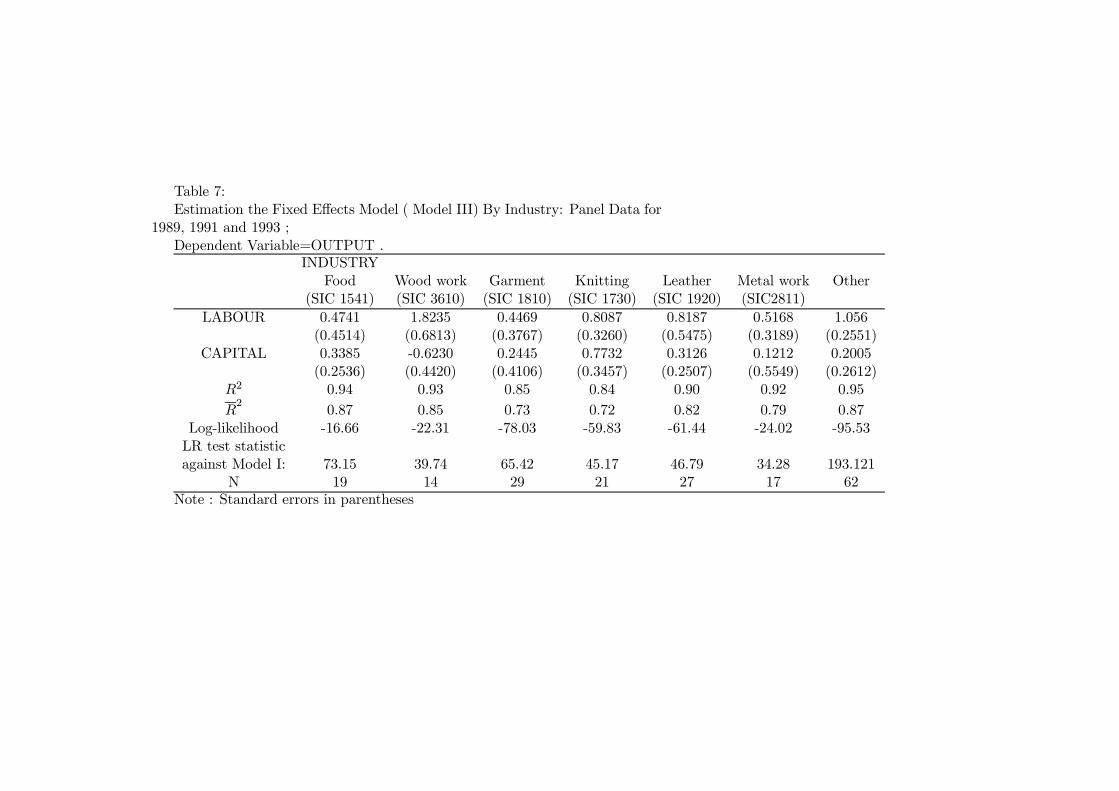
Table 7:Estimation the Fixed E®ects Model ( Model III) By Industry: Panel Data for
1989, 1991 and 1993 ;Dependent Variable=OUTPUT .
INDUSTRYFood Wood work Garment Knitting Leather Metal work Other
(SIC 1541) (SIC 3610) (SIC 1810) (SIC 1730) (SIC 1920) (SIC2811)
LABOUR 0.4741 1.8235 0.4469 0.8087 0.8187 0.5168 1.056(0.4514) (0.6813) (0.3767) (0.3260) (0.5475) (0.3189) (0.2551)
CAPITAL 0.3385 -0.6230 0.2445 0.7732 0.3126 0.1212 0.2005(0.2536) (0.4420) (0.4106) (0.3457) (0.2507) (0.5549) (0.2612)
R2 0.94 0.93 0.85 0.84 0.90 0.92 0.95
R2
0.87 0.85 0.73 0.72 0.82 0.79 0.87Log-likelihood -16.66 -22.31 -78.03 -59.83 -61.44 -24.02 -95.53
LR test statisticagainst Model I: 73.15 39.74 65.42 45.17 46.79 34.28 193.121
N 19 14 29 21 27 17 62Note : Standard errors in parentheses
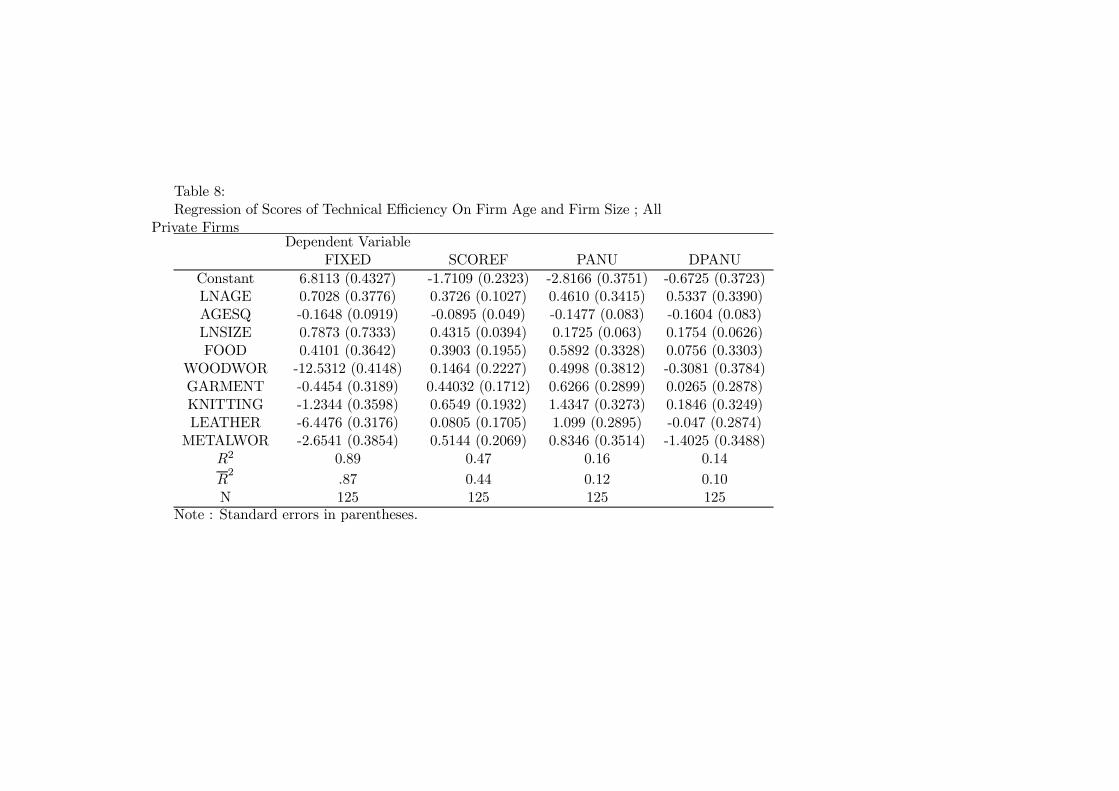
Table 8:Regression of Scores of Technical E±ciency On Firm Age and Firm Size ; All
Private FirmsDependent Variable
FIXED SCOREF PANU DPANU
Constant 6.8113 (0.4327) -1.7109 (0.2323) -2.8166 (0.3751) -0.6725 (0.3723)LNAGE 0.7028 (0.3776) 0.3726 (0.1027) 0.4610 (0.3415) 0.5337 (0.3390)AGESQ -0.1648 (0.0919) -0.0895 (0.049) -0.1477 (0.083) -0.1604 (0.083)LNSIZE 0.7873 (0.7333) 0.4315 (0.0394) 0.1725 (0.063) 0.1754 (0.0626)FOOD 0.4101 (0.3642) 0.3903 (0.1955) 0.5892 (0.3328) 0.0756 (0.3303)
WOODWOR -12.5312 (0.4148) 0.1464 (0.2227) 0.4998 (0.3812) -0.3081 (0.3784)GARMENT -0.4454 (0.3189) 0.44032 (0.1712) 0.6266 (0.2899) 0.0265 (0.2878)KNITTING -1.2344 (0.3598) 0.6549 (0.1932) 1.4347 (0.3273) 0.1846 (0.3249)LEATHER -6.4476 (0.3176) 0.0805 (0.1705) 1.099 (0.2895) -0.047 (0.2874)
METALWOR -2.6541 (0.3854) 0.5144 (0.2069) 0.8346 (0.3514) -1.4025 (0.3488)R2 0.89 0.47 0.16 0.14
R2
.87 0.44 0.12 0.10N 125 125 125 125
Note : Standard errors in parentheses.
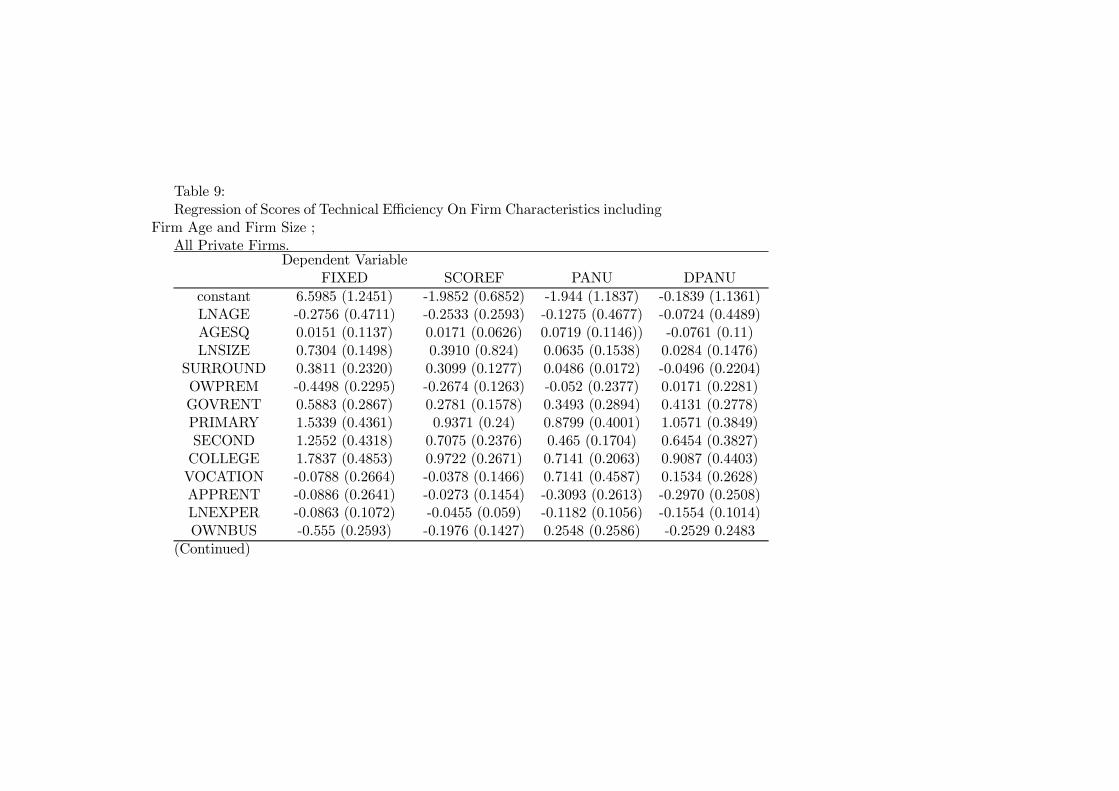
Table 9:Regression of Scores of Technical E±ciency On Firm Characteristics including
Firm Age and Firm Size ;All Private Firms.
Dependent VariableFIXED SCOREF PANU DPANU
constant 6.5985 (1.2451) -1.9852 (0.6852) -1.944 (1.1837) -0.1839 (1.1361)LNAGE -0.2756 (0.4711) -0.2533 (0.2593) -0.1275 (0.4677) -0.0724 (0.4489)AGESQ 0.0151 (0.1137) 0.0171 (0.0626) 0.0719 (0.1146)) -0.0761 (0.11)LNSIZE 0.7304 (0.1498) 0.3910 (0.824) 0.0635 (0.1538) 0.0284 (0.1476)
SURROUND 0.3811 (0.2320) 0.3099 (0.1277) 0.0486 (0.0172) -0.0496 (0.2204)OWPREM -0.4498 (0.2295) -0.2674 (0.1263) -0.052 (0.2377) 0.0171 (0.2281)GOVRENT 0.5883 (0.2867) 0.2781 (0.1578) 0.3493 (0.2894) 0.4131 (0.2778)PRIMARY 1.5339 (0.4361) 0.9371 (0.24) 0.8799 (0.4001) 1.0571 (0.3849)SECOND 1.2552 (0.4318) 0.7075 (0.2376) 0.465 (0.1704) 0.6454 (0.3827)COLLEGE 1.7837 (0.4853) 0.9722 (0.2671) 0.7141 (0.2063) 0.9087 (0.4403)VOCATION -0.0788 (0.2664) -0.0378 (0.1466) 0.7141 (0.4587) 0.1534 (0.2628)APPRENT -0.0886 (0.2641) -0.0273 (0.1454) -0.3093 (0.2613) -0.2970 (0.2508)LNEXPER -0.0863 (0.1072) -0.0455 (0.059) -0.1182 (0.1056) -0.1554 (0.1014)OWNBUS -0.555 (0.2593) -0.1976 (0.1427) 0.2548 (0.2586) -0.2529 0.2483
(Continued)
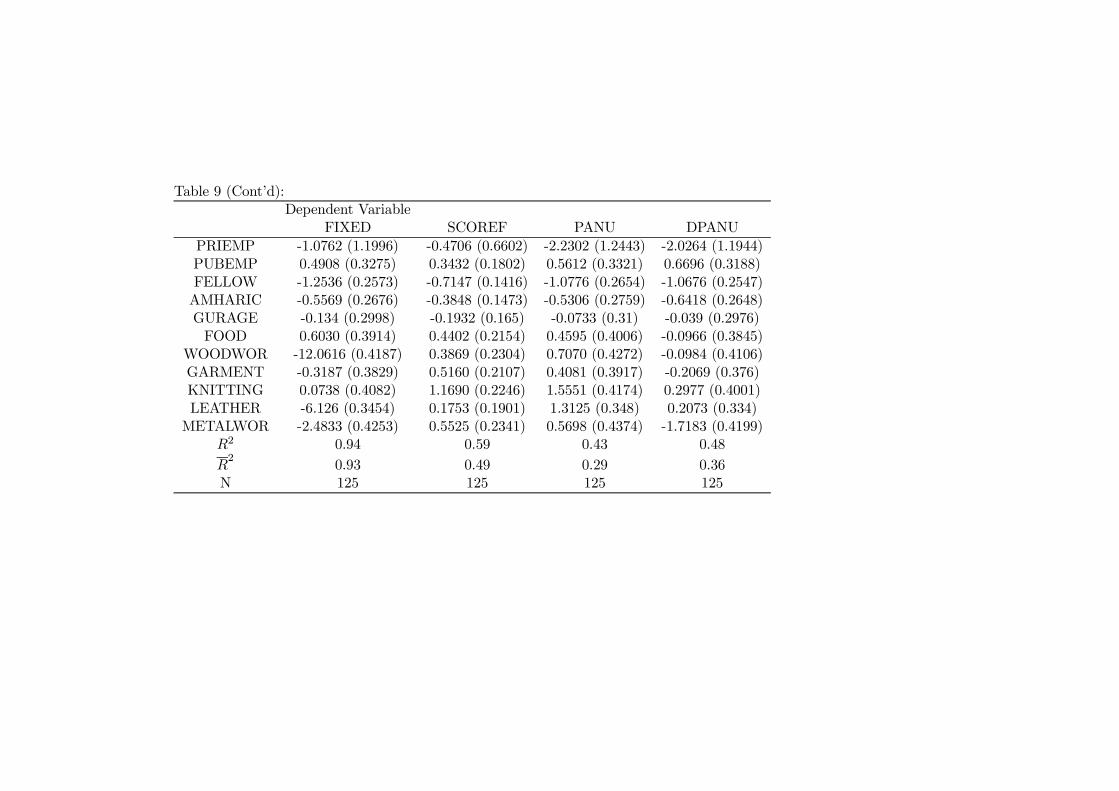
Table 9 (Cont'd):Dependent Variable
FIXED SCOREF PANU DPANU
PRIEMP -1.0762 (1.1996) -0.4706 (0.6602) -2.2302 (1.2443) -2.0264 (1.1944)PUBEMP 0.4908 (0.3275) 0.3432 (0.1802) 0.5612 (0.3321) 0.6696 (0.3188)FELLOW -1.2536 (0.2573) -0.7147 (0.1416) -1.0776 (0.2654) -1.0676 (0.2547)AMHARIC -0.5569 (0.2676) -0.3848 (0.1473) -0.5306 (0.2759) -0.6418 (0.2648)GURAGE -0.134 (0.2998) -0.1932 (0.165) -0.0733 (0.31) -0.039 (0.2976)
FOOD 0.6030 (0.3914) 0.4402 (0.2154) 0.4595 (0.4006) -0.0966 (0.3845)WOODWOR -12.0616 (0.4187) 0.3869 (0.2304) 0.7070 (0.4272) -0.0984 (0.4106)GARMENT -0.3187 (0.3829) 0.5160 (0.2107) 0.4081 (0.3917) -0.2069 (0.376)KNITTING 0.0738 (0.4082) 1.1690 (0.2246) 1.5551 (0.4174) 0.2977 (0.4001)LEATHER -6.126 (0.3454) 0.1753 (0.1901) 1.3125 (0.348) 0.2073 (0.334)
METALWOR -2.4833 (0.4253) 0.5525 (0.2341) 0.5698 (0.4374) -1.7183 (0.4199)R2 0.94 0.59 0.43 0.48
R2
0.93 0.49 0.29 0.36N 125 125 125 125
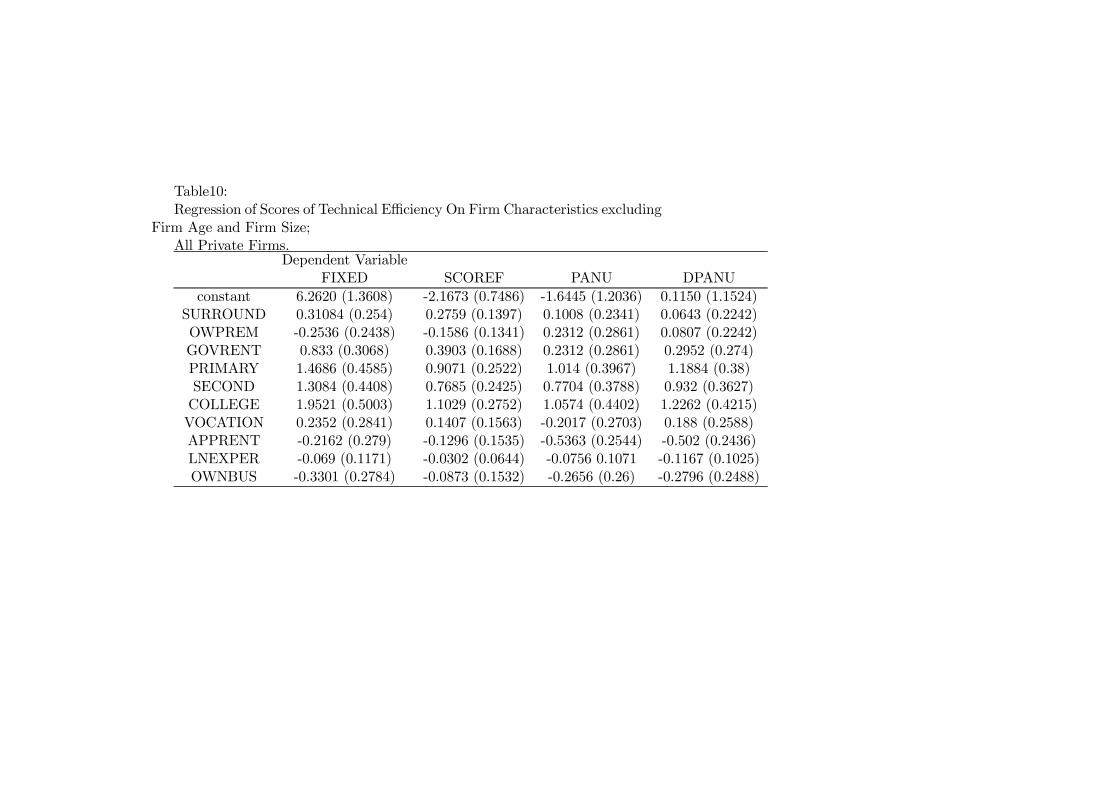
Table10:Regression of Scores of Technical E±ciency On Firm Characteristics excluding
Firm Age and Firm Size;All Private Firms.
Dependent VariableFIXED SCOREF PANU DPANU
constant 6.2620 (1.3608) -2.1673 (0.7486) -1.6445 (1.2036) 0.1150 (1.1524)SURROUND 0.31084 (0.254) 0.2759 (0.1397) 0.1008 (0.2341) 0.0643 (0.2242)OWPREM -0.2536 (0.2438) -0.1586 (0.1341) 0.2312 (0.2861) 0.0807 (0.2242)GOVRENT 0.833 (0.3068) 0.3903 (0.1688) 0.2312 (0.2861) 0.2952 (0.274)PRIMARY 1.4686 (0.4585) 0.9071 (0.2522) 1.014 (0.3967) 1.1884 (0.38)SECOND 1.3084 (0.4408) 0.7685 (0.2425) 0.7704 (0.3788) 0.932 (0.3627)COLLEGE 1.9521 (0.5003) 1.1029 (0.2752) 1.0574 (0.4402) 1.2262 (0.4215)VOCATION 0.2352 (0.2841) 0.1407 (0.1563) -0.2017 (0.2703) 0.188 (0.2588)APPRENT -0.2162 (0.279) -0.1296 (0.1535) -0.5363 (0.2544) -0.502 (0.2436)LNEXPER -0.069 (0.1171) -0.0302 (0.0644) -0.0756 0.1071 -0.1167 (0.1025)OWNBUS -0.3301 (0.2784) -0.0873 (0.1532) -0.2656 (0.26) -0.2796 (0.2488)

Table10 (Cont'd):Dependent Variable
FIXED SCOREF PANU DPANU
PRIEMP -1.4462 (1.3018) -0.628 (0.7161) -1.8037 (1.2547) -1.6012 (1.2013)PUBEMP 0.5682 (0.3435) 0.3375 (0.1889) 0.3078 (0.3258) 0.4328 (0.312)FELLOW -1.2526 (0.2794) -0.6951 (0.1537) -0.9537 (0.268) -0.9509 (0.2566)AMHARIC -0.6754 (0.2933) -0.4516 (0.1613) -0.5461 (0.2813) -0.6501 (0.2693)GURAGE 0.0465 (0.3273) -0.1005 (0.1801) -0.1052 (0.3149) -0.0762 (0.3015)
FOOD 0.5858 (0.4301) 0.4272 (0.2366) 0.4327 (0.4093) -0.1174 (0.3919)WOODWOR -11.971 (0.4394) 0.4255 (0.2417) 0.7686 (0.4177) -0.0344 (0.3999)GARMENT -0.5576 (0.4143) 0.3773 (0.2279) 0.3631 (0.3929) -0.233 (0.3762)KNITTING 0.1091 (0.4488) 1.1797 (0.2469) 1.4652 (0.4262) 0.2128 (0.4081)LEATHER -5.6017 (0.3542) 0.4652 (0.1949) 1.4154 (0.3326) 0.2855 (0.3184)
METALWOR -2.6005 (0.4634) 0.5048 (0.255) 0.6718 (0.4442) -1.6146 (0.4253)R2 0.93 0.49 0.38 0.44
R2
0.91 0.38 0.25 0.32N 125 125 125 125