Embed Size (px)
Citation preview

Cancer survival analysis using population-based data
Granada, 27-28 March 2017
Age-standardisedNetSurvival&
CohortandPeriodNetSurvivalEstimates

Cancer survival analysis using population-based data
Granada, 27-28 March 2017
PARTONEASNS
1. Age-standardisedNetSurvival.
2. CohortandPeriodEstimationofAge-standardisedNetSurvival.
3. Practicalimplementation.
Outline
1. Net Survival deals with Competing Risk.2. Different estimators, but
3. Pohar Perme estimator deals with censoring (IPCW): because the
probability of death is increased for the majority of cancer sites
during the first years of follow-up.
4. OK, great. But …
5. The excess risk of death from cancer is itself often dependent from
the structure of AGE of the Background POPULATION.
Introduction

Why Age-Standardised Net Survival?
So, the Comparison of all-ages survival between two or more
populations (regions or countries), or when analysing survival trends over
time can be misleading if the age structure of the cancer patient
populations is very different.
Imaging a Net Survival comparison between JAPAN and GUATEMALA
We need to control for the different STRUCTURE OF AGE when comparing
Net Survival between populations
What can we do about it?
1. Compare age-specific survival (not convenient if there are too many
strata)
2. Direct age-standardisation is one such approach (a classic in 101-Epi)

Direct age-standardisation
Produces an overall summary measure for each
population whilst removing the effect of differences
in age structure of cancer patients that may compromise the
comparison of un-standardised survival

1. Requires estimation of Net Survival for each age group
2. Requires at least one patient at risk within each age group for
each time interval of follow-up, unless all patients died before the
end of the study
3. May not be feasible when data are sparse
Constraints of the direct age standardisation method
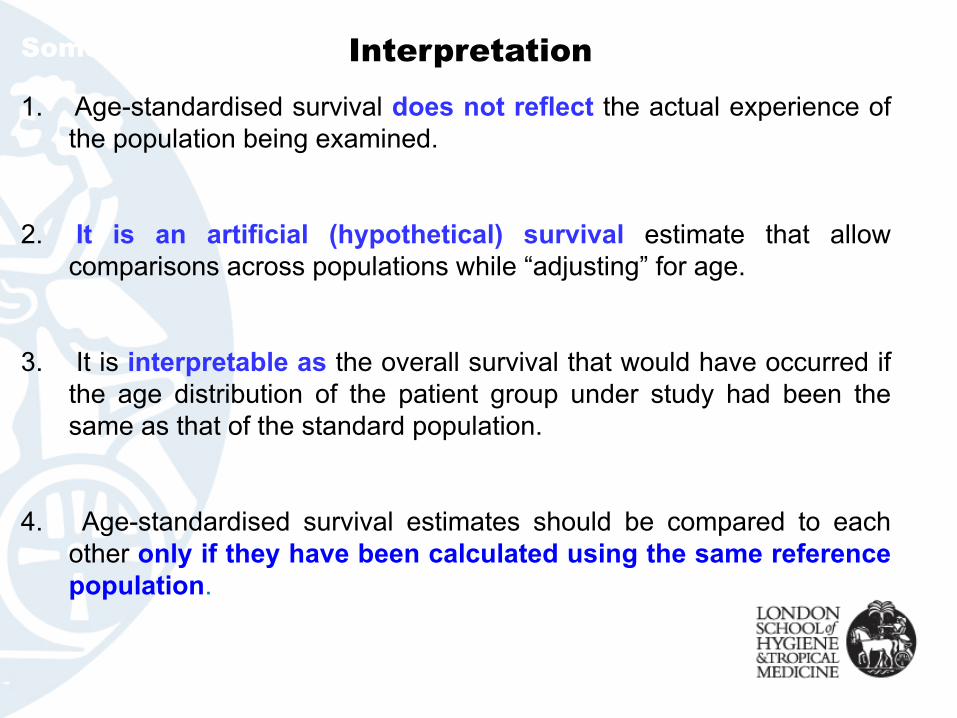
1. Age-standardised survival does not reflect the actual experience ofthe population being examined.
2. It is an artificial (hypothetical) survival estimate that allowcomparisons across populations while “adjusting” for age.
3. It is interpretable as the overall survival that would have occurred ifthe age distribution of the patient group under study had been thesame as that of the standard population.
4. Age-standardised survival estimates should be compared to eachother only if they have been calculated using the same referencepopulation.
Some thoughts... Interpretation

3 standards for 3 types of cancer derived from the EUROCARE-2 dataset
§ Type 1: increasing with age (91% of cases)
§ Type 2: constant with age (7% of cases)
§ Type 3: mainly young adults (<2%)
– Minimise difference between raw and standardised– Smallest number of standards– Not arbitrary (specific to one study)– Males and females combined
Corazziarietal.,2004
3. International cancer survival standard (ICSS)Recommended standard population
Examples of (external) standard cancer patientpopulations

2: CONSTANT by AGE
3: YOUNG ADULTS
1: ELDERLY
FromCorazziari etal.,2004
Type 3: mainly young adults (<2%)
Type 1: increasing with age (91% of cases) Type 2: constant with age (7% of cases)

1. Estimate age-specific Net Survival for each age-group
2. Combine these estimates in a weighted average
Age-standardised Net survival (AS)
whereSi = Net survival estimate for age group iwi = proportion of patients in age group i in the standard population
Calculation: age-standardised survival
å=
=
=+++=n
1iii.
nn2211
wS
.wS....wS.wS
Sumweights:w1+w2+...wn=1

where,
SE(Si)= standard error for the survival estimate in age group i
wi = proportion of patients in age group i in the standard population
( ) ( )å=
×=n
iii SSEwASSE
1
22
Calculation: standard error for age-standardised survival

Standardised Survival Estimates at 5 yearsAge Group 1971-75 1976-80 1981-85 1986-90
15-4445-5455-6465-7475+
Standardised Survival Estimates at 5 yearsAge Group 1971-75 1976-80 1981-85 1986-90
15-44 5.945-54 8.155-64 11.865-74 14.975+ 9.4
Unstandardised Survival Estimates at 5 years:1971-75 1976-80 1981-85 1986-90
All ages 67.3 63.1 60.7 58.6
Example: Age-standardised cancer survival (salivary gland cancer)
Using other standards
Age Group weight proportion weight proportion15-44 515 0.15 18.7 0.1945-54 452 0.13 19.1 0.1955-64 674 0.19 23.1 0.2365-74 905 0.26 18.9 0.1975+ 992 0.28 20.2 0.20All ages 3539 1 100 1.0
EUROCARE World Standard
5.9 = 84.7*0.078.1 = 67.3*0.1211.8 = 51.2*0.2314.9 = 51.4*0.299.4 = 32.3*0.29
Age Specific Survival Estimates at 5 years:Age Group 1971-75 1976-80 1981-85 1986-9015-44 91.3 86.8 84.4 84.745-54 72.1 76.8 65.1 67.355-64 61.9 55.6 57.9 51.265-74 45.8 53.4 48.7 51.475+ 29.2 33.9 37.7 32.3
Age standardised 51.0 53.4 52.1 50.1
51.0=6.4+8.6+14.2+13.3+8.5
Standardised Survival Estimates at 5 yearsAge Group 1971-75 1976-80 1981-85 1986-90
15-44 6.4 6.1 5.9 5.945-54 8.6 9.2 7.8 8.155-64 14.2 12.8 13.3 11.865-74 13.3 15.5 14.1 14.975+ 8.5 9.8 10.9 9.4
ICSS Population Standard Age Group weight proportion15-44 7 0.0745-54 12 0.1255-64 23 0.2365-74 29 0.2975+ 29 0.29All ages 100 1.00

Lower Limit
Upper limit
Based on a logarithmic transformation of the survival functionand the DELTA METHOD
Remember: H(t) = -ln(S(t)) ==> exp(-H(t)) = S(t)
]/)(*96.1exp[/ ASASSEAS=
]/)(*96.1exp[* ASASSEAS=
Calculation: 95% confidence interval for age standardised survival

It’s your time
ASNS/Age_tandardisation_FOR_DEMO.xlsx
https://github.com/migariane/EASP_NET_SURV
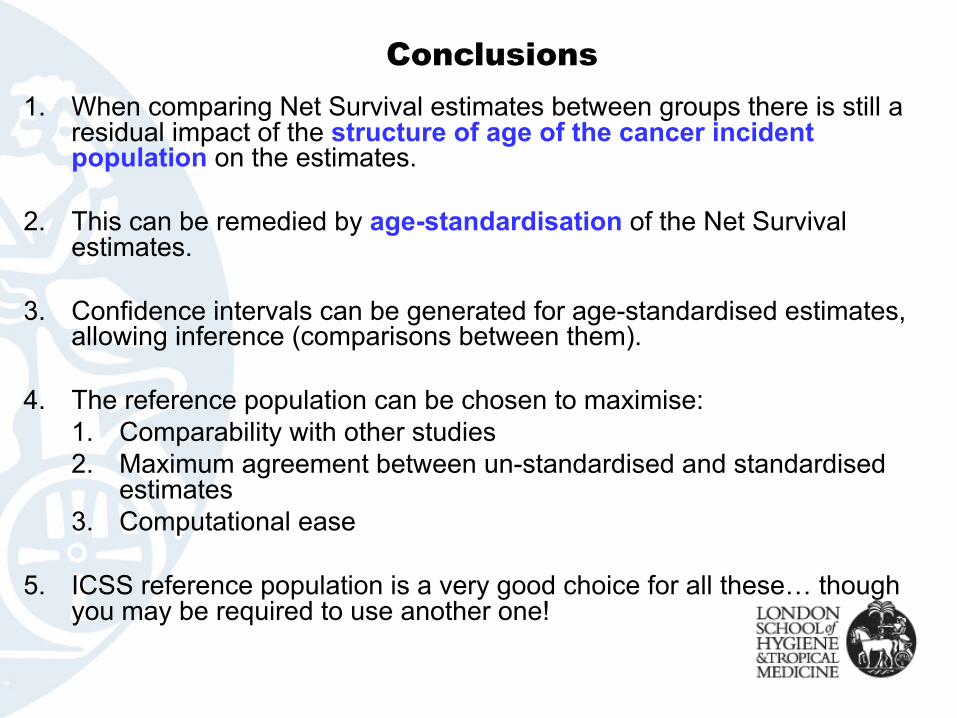
1. When comparing Net Survival estimates between groups there is still a residual impact of the structure of age of the cancer incident population on the estimates.
2. This can be remedied by age-standardisation of the Net Survival estimates.
3. Confidence intervals can be generated for age-standardised estimates, allowing inference (comparisons between them).
4. The reference population can be chosen to maximise:1. Comparability with other studies2. Maximum agreement between un-standardised and standardised
estimates3. Computational ease
5. ICSS reference population is a very good choice for all these… though you may be required to use another one!
Conclusions

§ Corazziari I, Quinn M, Capocaccia R. Standard cancer patient population for age standardising survival ratios. Eur J Cancer 2004;40:2307-2316.
§ Capocaccia R, Gatta G, Roazzi P, Carrani E, Santaquilani M, De Angelis R, Tavilla R, EUROCARE Working Group. The EUROCARE-3 database: methodology of data collection, standardisation, quality control and statistical analysis. Ann Oncol 2003; 14: v14-v27.
§ Sankaranarayanan, R.; Black, R. J. & Parkin, D. M. Cancer survival in developing countries (IARC Scientific Publications No. 145); 1998.
§ Ito Y, Ohno Y, Rachet B, Coleman MP, Tsukuma H, Oshima A. Cancer survival trends in Osaka, Japan: the influence of age and stage at diagnosis. Jpn J ClinOncol 2007; 37: 452-458.
§ Quaresma, M, Coleman M, Rachet B. 40-year trends in an index of survival for all cancers combined and survival adjusted for age and sex for each cancer in England and Wales, 1971-2011: a population-based study. The Lancet 2015; 385: 1206-1218.
References

Cancer survival analysis using population-based data
Granada, 27-28 March 2017
PARTTWOStudyDesigns

Learning objectives
• To estimatenetsurvivalusingcohort andperiod approaches,andtocomparetheresults.

Stata: stsetSettingthestructureofyoursurvivaldata
stset(endoffollow-up:date),fail(dead==1)origin(timedate)enter(timedate)exit(timedate)scale(value)
Scale:scale(30)=monthlydata;scale(365.25)=yearlydata
t=!"#$&'(")"*()-./0$()
;bydefault:t=!"#$&'(")"*(1)-./0$(2)
enter:Whenthesubjectenterthestudy(date)
origin:Whenthesubjectbecomesatriskandneededifyouhaveonlycalendardatesinyourdataset
exit:Whenthesubjectleavesthestudy(date)
_t0and_t:Recordthetimespan,inanalysistimet._t0=startand_t=end
_d:Recordtheoutcomeattheendofthespan.
_st: Recordwhethertheobservationisgoingtobeusedinthecurrentanalysis

Chapters4,5,6

Breast_stns.dta

. stset finmdy, fail(dead==1) origin(time diagmdy) enter(time diagmdy)
failure event: dead == 1obs. time interval: (origin, finmdy]enter on or after: time diagmdyexit on or before: failure
t for analysis: (time-origin)origin: time diagmdy
------------------------------------------------------------------------------355801 total observations
0 exclusions------------------------------------------------------------------------------
355801 observations remaining, representing212121 failures in single-record/single-failure data
920269050 total analysis time at risk and under observationat risk from t = 0
earliest observed entry t = 0last observed exit t = 12052
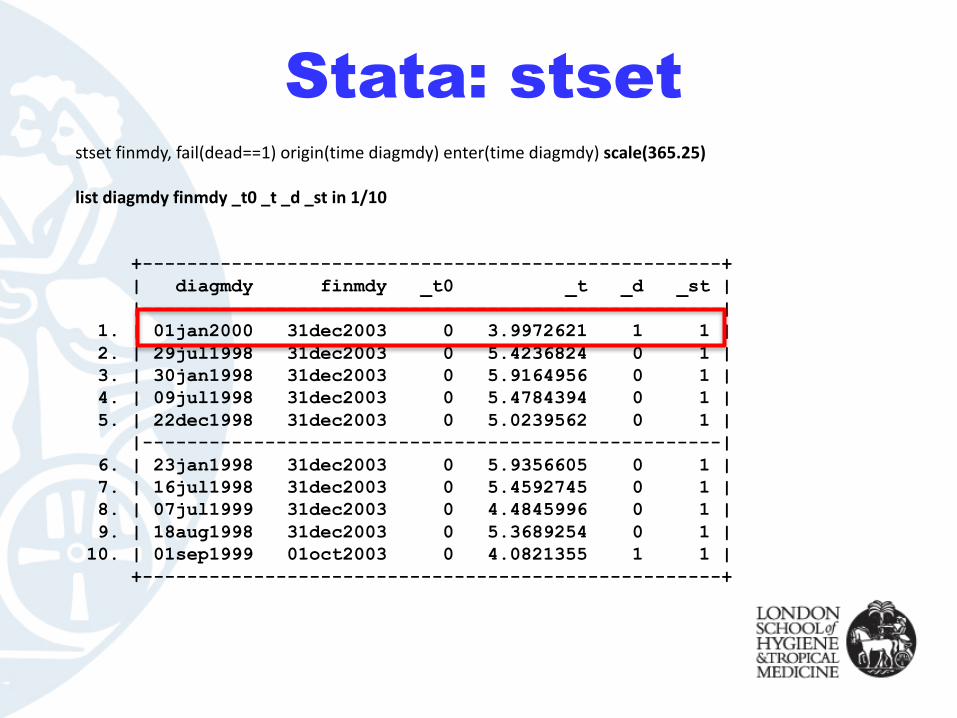
Stata: stsetstset finmdy,fail(dead==1)origin(timediagmdy)enter(timediagmdy) scale(365.25)
listdiagmdy finmdy _t0_t_d_st in1/10
+----------------------------------------------------+| diagmdy finmdy _t0 _t _d _st ||----------------------------------------------------|
1. | 01jan2000 31dec2003 0 3.9972621 1 1 |2. | 29jul1998 31dec2003 0 5.4236824 0 1 |3. | 30jan1998 31dec2003 0 5.9164956 0 1 |4. | 09jul1998 31dec2003 0 5.4784394 0 1 |5. | 22dec1998 31dec2003 0 5.0239562 0 1 |
|----------------------------------------------------|6. | 23jan1998 31dec2003 0 5.9356605 0 1 |7. | 16jul1998 31dec2003 0 5.4592745 0 1 |8. | 07jul1999 31dec2003 0 4.4845996 0 1 |9. | 18aug1998 31dec2003 0 5.3689254 0 1 |10. | 01sep1999 01oct2003 0 4.0821355 1 1 |
+----------------------------------------------------+

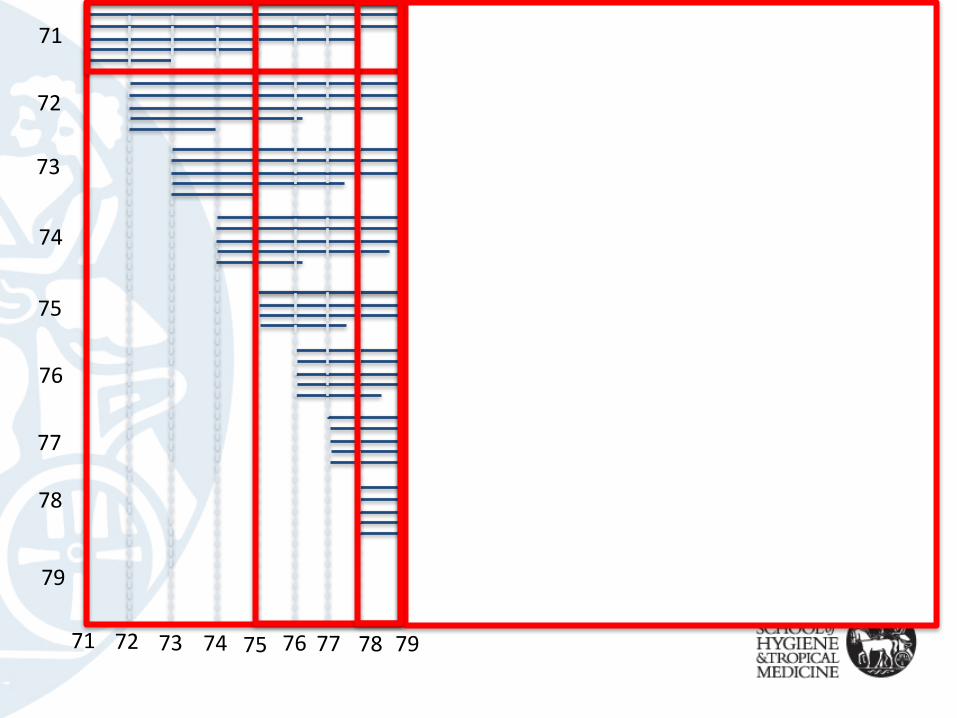
Net Survival EstimatesHypotheticalScenario:
9Cohortsfrom1971to19795incidentcasesperyearRecursivesurvivalpattern:
1individualsurvives15years1individualsurvives10years1individualsurvives7years1individualsurvives4years1individualsurvives2years
SeveraloptionstoestimateNetSurvivalansweringdifferentquestions:
1. Thecompletedata(consideringthelastupdatedate)2. Fromoneparticularcohort3. Fromoneorseveralaggregatedcalendarperiods
71 73 74 7572 76 77 78 79
71
72
73
74
75
79
76
77
78

71 73 74 7572 76 77 78 79
71
72
73
74
75
79
76
77
78
BrennerH,Gefeller O,Hakulinen T.Periodanalysisforup-to-datecancersurvivaldata.Theory,empiricalevaluation,computationalrealisationandapplications.Eur JCancer2004;40:326-335.

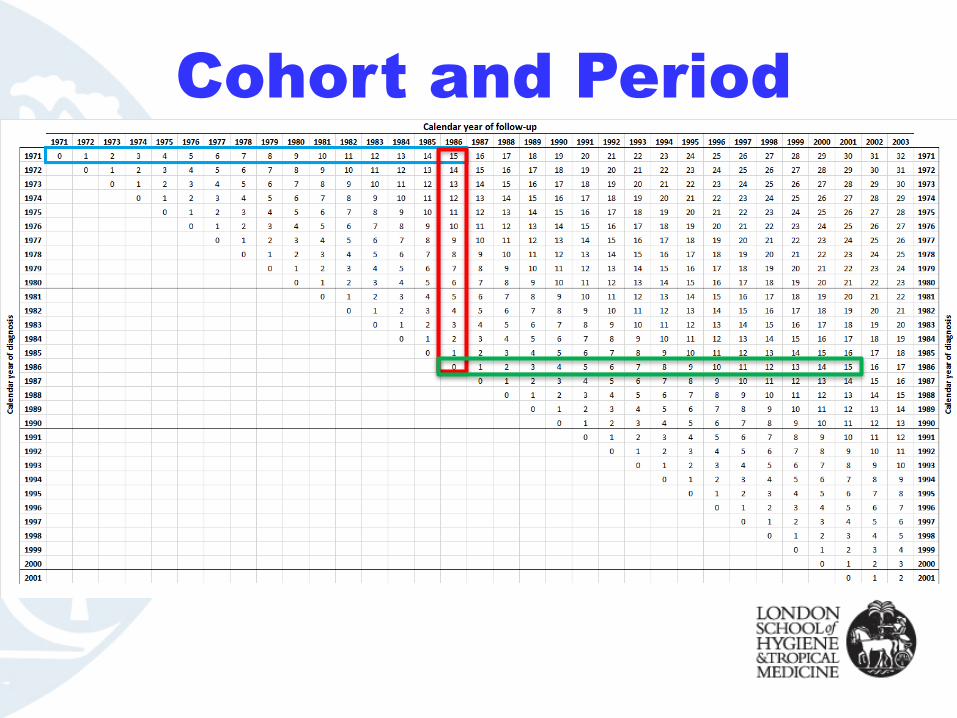
Cohort and Period

Cohort approach, 1971*cohortapproach1971
stset finmdy,fail(dead==1)origin(timediagmdy)enter(timediagmdy)
listdiagmdyfinmdy_t0_t_d_stin1/10
stns listusinglifetable_stns.dta ifyear(diagmdy)==1971,///age(agediagindays=_age)period(diagmdy=yearindays)///strata(sexdep)rate(rate_day)///at(.5151015,scalefactor(365.25)unit(year)) ///saving(cohort_1971,replace)
type of estimate: kaplan-meierfailure _d: dead == 1
analysis time _t: (finmdy-origin)origin: time diagmdy
enter on or after: time diagmdy
Time Event Beg. Net Net Surv.(year) Time Total Fail Lost Function [95% Conf. Int.]
---------------------------------------------------------------------------------------.5 182 6061 838 0 0.8722 0.8634 0.8810 1 365 5223 480 1 0.8013 0.7906 0.8120 5 1826 4742 2056 7 0.4992 0.4844 0.5139
10 3646 2679 1024 1 0.3485 0.3306 0.3664 15 5467 1654 474 3 0.3126 0.2907 0.3345
---------------------------------------------------------------------------------------

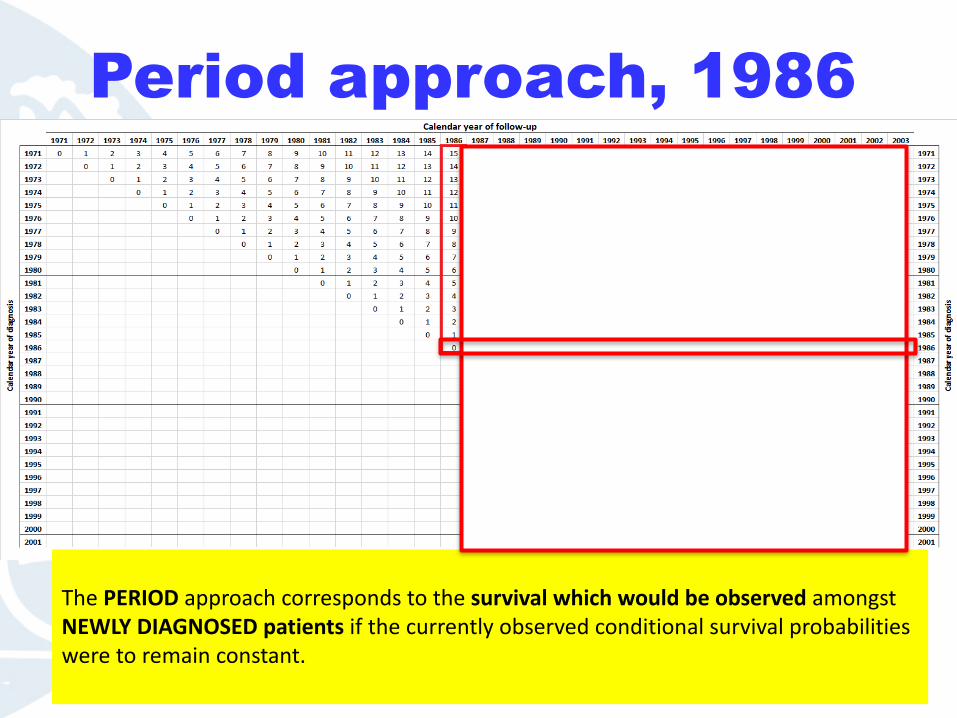
Period approach, 1986
JUSTIFICATION:
NeedofUPDATEDSURVIVALestimatesthataccountforrecentimprovementsintreatment
• AllobservationsincludedintheanalysisareLEFTTRUNCATEDandRIGHTCENSOREDat1986• Thenfromthesurvivorsofthecohortof1971wewillhave15yearsoffollow-up(5480days)• STNSaccountfortheinformativecensoring
(cancerdeathsthatoccursduringthefirstyearsfollowingdiagnosis)
Period approach, 1986
ThePERIODapproachcorrespondstothesurvivalwhichwouldbeobserved amongstNEWLYDIAGNOSEDpatientsifthecurrentlyobservedconditionalsurvivalprobabilitiesweretoremainconstant.

Period approach, 1986
JUSTIFICATION:
NeedofupdateSURVIVALestimatesthataccountforrecentimprovementsintreatment
• AllobservationsincludedintheanalysisareLEFTTRUNCATEDandRIGHTCENSOREDat1986
• Begintime(origin):dateofdiagnosis:STNSaccountfortheinformativecensoring(cancerdeathsthatoccursduringthefirstyearsfollowingdiagnosis)
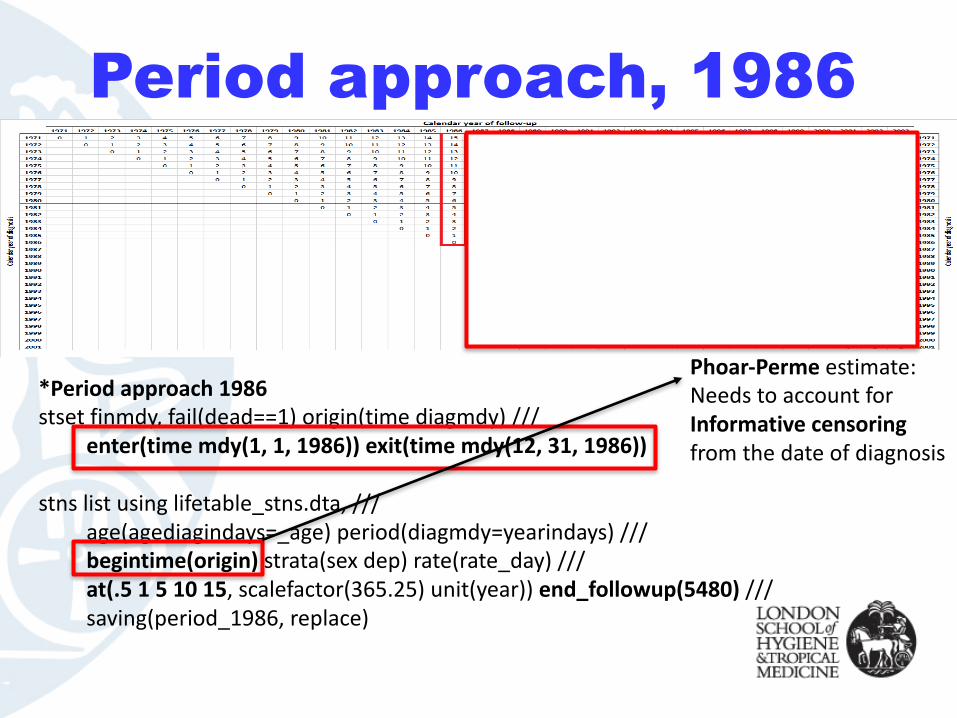
Period approach, 1986
*Periodapproach1986stset finmdy,fail(dead==1)origin(timediagmdy)///
enter(timemdy(1,1,1986))exit(timemdy(12,31,1986))
stns listusinglifetable_stns.dta,///age(agediagindays=_age)period(diagmdy=yearindays)///begintime(origin) strata(sexdep)rate(rate_day)///at(.5151015,scalefactor(365.25)unit(year))end_followup(5480) ///saving(period_1986,replace)
Phoar-Perme estimate:NeedstoaccountforInformativecensoringfromthedateofdiagnosis

Cohort, 1971Thesurvivalofwomendiagnosedin1971,ascomputedwiththecohortapproach,was:one-yearsurvival: 0.80 (95%CI0.79-0.81)five-yearsurvival: 0.50 (95%CI0.48-0.51)ten-yearsurvival: 0.35 (95%CI0.33-0.37)fifteen-yearsurvival: 0.31 (95%CI0.31-0.33)
In1986,thepredictedsurvivalforwomenwithbreastcancer,obtainedthroughperiodanalysis:one-yearsurvival: 0.88 (95%CI0.87-0.88)five-yearsurvival: 0.63 (95%CI0.62-0.64)ten-yearsurvival: 0.48 (95%CI0.46-0.50)fifteen-yearsurvival: 0.41 (95%CI0.39-0.44)
Period, 1986
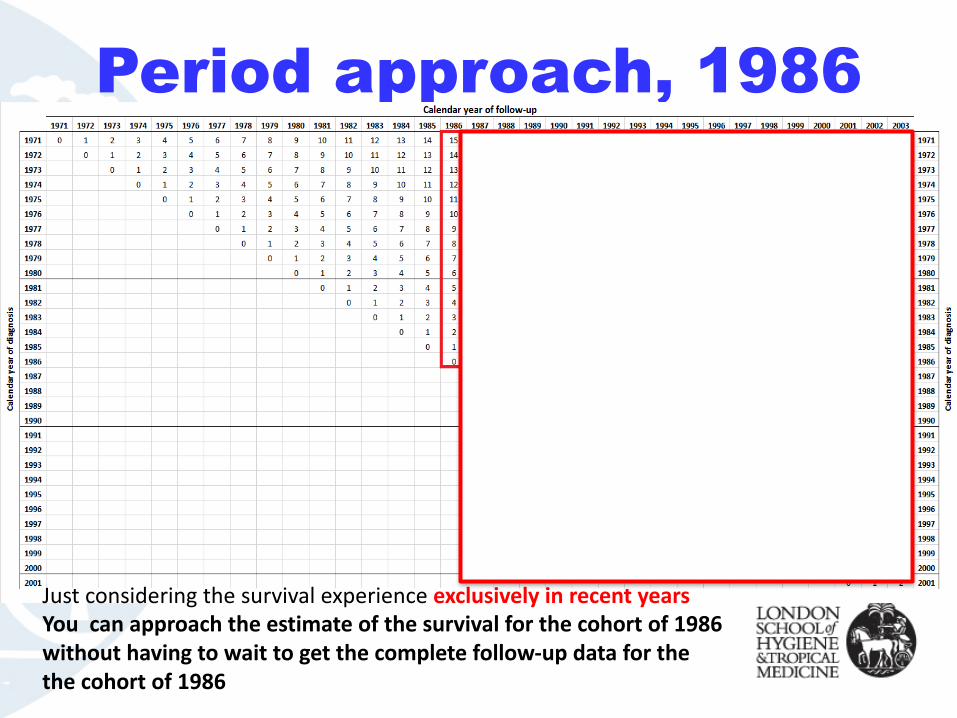
Period approach, 1986
JustconsideringthesurvivalexperienceexclusivelyinrecentyearsYoucanapproachtheestimateofthesurvivalforthecohortof1986withouthavingtowaittogetthecompletefollow-updataforthethecohortof1986

Cohort and Period
HOW
HOW?Let’sproveit.ImaginewecanTravelintheFUTURE
Cohort and Period

Cohort approach, 1986*cohortapproach1986
stset finmdy,fail(dead==1)origin(timediagmdy)enter(timediagmdy)scale(365.25)
stns listusinglifetable_stns.dta ifyear(diagmdy)==1986,///age(agediagindays=_age)period(diagmdy=yearindays)///strata(sexdep)rate(rate_day)///at(.5151015,scalefactor(365.25)unit(year)) ///saving(cohort_1986,replace)
type of estimate: kaplan-meier
failure _d: dead == 1analysis time _t: (finmdy-origin)
origin: time diagmdyenter on or after: time diagmdy
Time Event Beg. Net Net Surv.(year) Time Total Fail Lost Function [95% Conf. Int.]
---------------------------------------------------------------------------------------.5 182 10801 973 0 0.9214 0.9159 0.9269 1 365 9828 568 0 0.8791 0.8722 0.8859 5 1826 9260 3166 4 0.6425 0.6312 0.6538
10 3649 6090 1801 3 0.5166 0.5011 0.5321 15 5475 4286 1005 7 0.4978 0.4753 0.5202
---------------------------------------------------------------------------------------

Your TURN (interpret it)Thesurvivalofwomendiagnosedin1971,ascomputedwiththecohortapproach,was:one-yearsurvival: 0.80 (95%CI0.79-0.81)five-yearsurvival: 0.50 (95%CI0.48-0.51)ten-yearsurvival: 0.35 (95%CI0.33-0.37)fifteen-yearsurvival: 0.31 (95%CI0.31-0.33)
In1986,thepredictedsurvivalforwomenwithbreastcancer,obtainedthroughperiodanalysis:one-yearsurvival: 0.88 (95%CI0.87-0.88)five-yearsurvival: 0.63 (95%CI0.62-0.64)ten-yearsurvival: 0.48 (95%CI0.46-0.50)fifteen-yearsurvival: 0.41 (95%CI0.39-0.44)
Theactualsurvivalofwomendiagnosedin1986,asobservedinduecourse,andbythecohortapproach:one-yearsurvival: 0.88 (95%CI0.87-0.89)five-yearsurvival: 0.64 (95%CI0.63-0.65)ten-yearsurvival: 0.52 (95%CI0.50-0.53)fifteen-yearsurvival: 0.50 (95%CI0.48-0.52)

Compare approaches
0
.2
.4
.6
.8
1
Net s
urviv
al
0 5 10 15Years since diagnosis
Cohort 1971 Period 1986 Cohort 1986
A Comparing COHORTS 1971 vs. 1986:The cohort-based survival 1971 lower than the cohort estimates 1986
Survival was improving over time.
B 1986 PERIOD-BASED estimates vs. COHORT 1986:Period-based 1986 LOWER THAN cohort 1986

Period approach 1986
Biased:wedonothaveINCIDENTcasesfortheYEAR1986
Cohort85
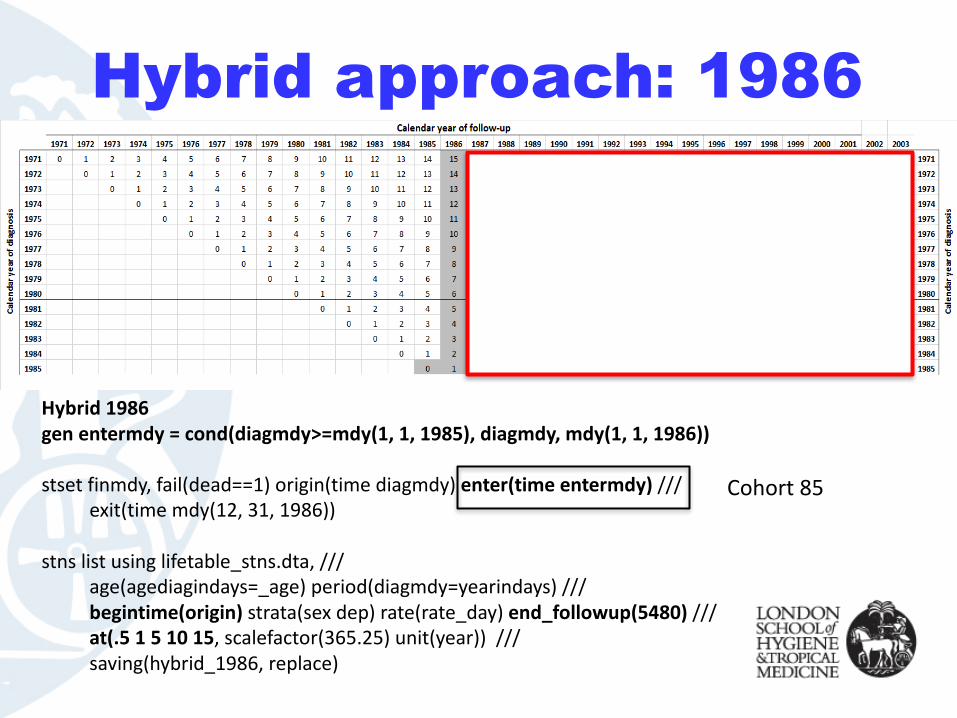
Hybrid approach: 1986
Hybrid1986genentermdy =cond(diagmdy>=mdy(1,1,1985),diagmdy,mdy(1,1,1986))
stset finmdy,fail(dead==1)origin(timediagmdy)enter(timeentermdy)///exit(timemdy(12,31,1986))
stns listusinglifetable_stns.dta,///age(agediagindays=_age)period(diagmdy=yearindays)///begintime(origin)strata(sexdep)rate(rate_day)end_followup(5480) ///at(.5151015,scalefactor(365.25)unit(year))///saving(hybrid_1986,replace)
Cohort85
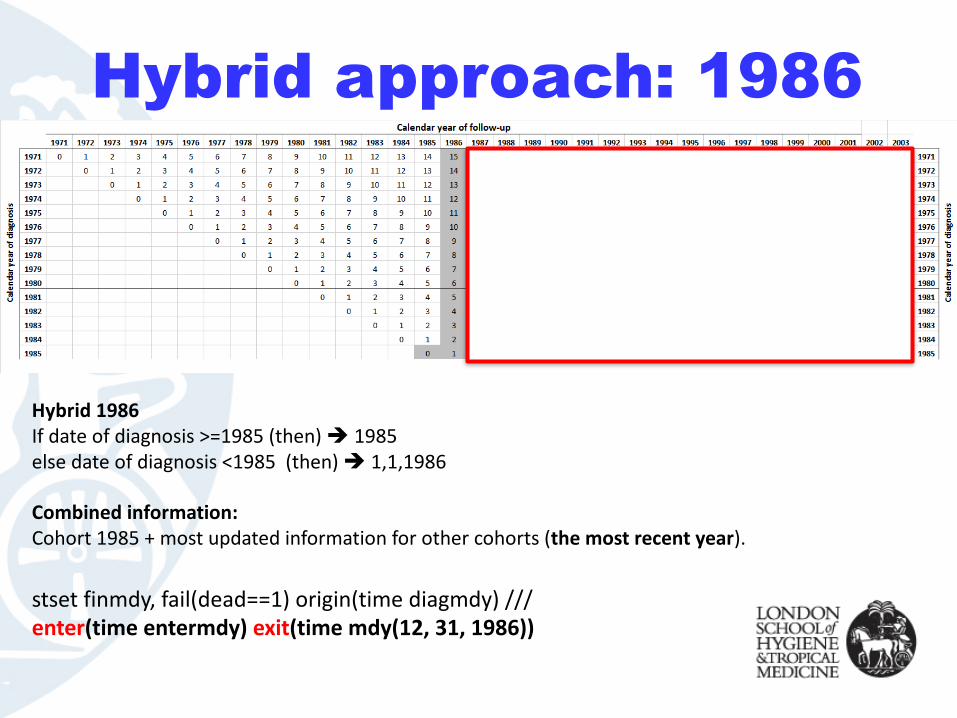
Hybrid approach: 1986
Hybrid1986Ifdateofdiagnosis>=1985(then)è 1985elsedateofdiagnosis<1985(then)è 1,1,1986
Combinedinformation:Cohort1985+mostupdatedinformationforothercohorts(themostrecentyear).
stset finmdy,fail(dead==1)origin(timediagmdy)///enter(timeentermdy)exit(timemdy(12,31,1986))

Hybrid approach: 1986The ‘biased’ period estimates using the modified dataset were:
§ one-year survival: 0.84 (95% CI 0.80-0.87)§ five-year survival: 0.60 (95% CI 0.57-0.63)§ ten-year survival: 0.46 (95% CI 0.43-0.48)§ fifteen-year survival: 0.39 (95% CI 0.36-0.42)
The estimates obtained with hybrid analysis were:
§ one-year survival: 0.88 (95% CI 0.88-0.89)§ five-year survival: 0.63 (95% CI 0.62-0.64)§ ten-year survival: 0.48 (95% CI 0.47-0.50)§ fifteen-year survival: 0.41 (95% CI 0.39-0.44)

References and further reading
BrennerH,Gefeller O.Analternativeapproachtomonitoringcancerpatientsurvival.Cancer1996;78:2004-2010.
BrennerH,Gefeller O,Hakulinen T.Periodanalysisforup-to-datecancersurvivaldata.Theory,empiricalevaluation,computationalrealisationandapplications.Eur JCancer2004;40:326-335.
BrennerH,Hakulinen T.Advanceddetectionoftimetrendsinlong-termcancerpatientsurvival:experiencefrom50yearsofcancerregistrationinFinland.AmJEpidemiol 2002,156(6):566-577.
BrennerH,Hakulinen T.Very-long-termsurvivalratesofpatientswithcancer.JClin Oncol 2002;20(21):4405-4409.
BrennerH,Rachet B.Hybridanalysisforup-to-datelong-termsurvivalratesincancerregistrieswithdelayedrecordingofincidentcases.Eur JCancer2004;40:2494-2501.
WoodsLM,Rachet B,CooperN,ColemanMP.Predictedtrendsinlong-termbreastcancersurvivalforwomendiagnosedinEnglandandWalesduringtheperiod1971-2001andfollowedupto2003.BrJCancer2007;96:1135-1138.
WaltersS,Benitez-Majano S,MullerP,ColemanMP,Allemani C,ButlerJ,PeakeM,Guren MG,Glimelius B,Bergström S,Påhlman L.IsEnglandclosingtheinternationalgapincancersurvival?. BrJCancer2015; 113(5):848-860.
HendersonR,JonesM,StareJ.Accuracyofpointpredictionsinsurvivalanalysis.StatMed2001;20:3083-3096.