Embed Size (px)
Citation preview
Agency Conflicts, Asset Substitution, and Securitization
Yingjin Hila Gan (Lehman Brothers)
Christopher Mayer (Columbia Business School & NBER)
December 16, 2006
Motivation
As of end of 2006, the ABS (asset backed securities) market totaled $7.6 trillion*
About ½ of mortgages, ⅓ of trade receivables, and ¼ of consumer credit are securitized *
Little research on how securitization structures perform
Securitizations face some of the same organizational conflicts as corporations do
* ABS and mortgage pools, Federal Reserve Flow of Funds, Tables L1, L4, L125, L126
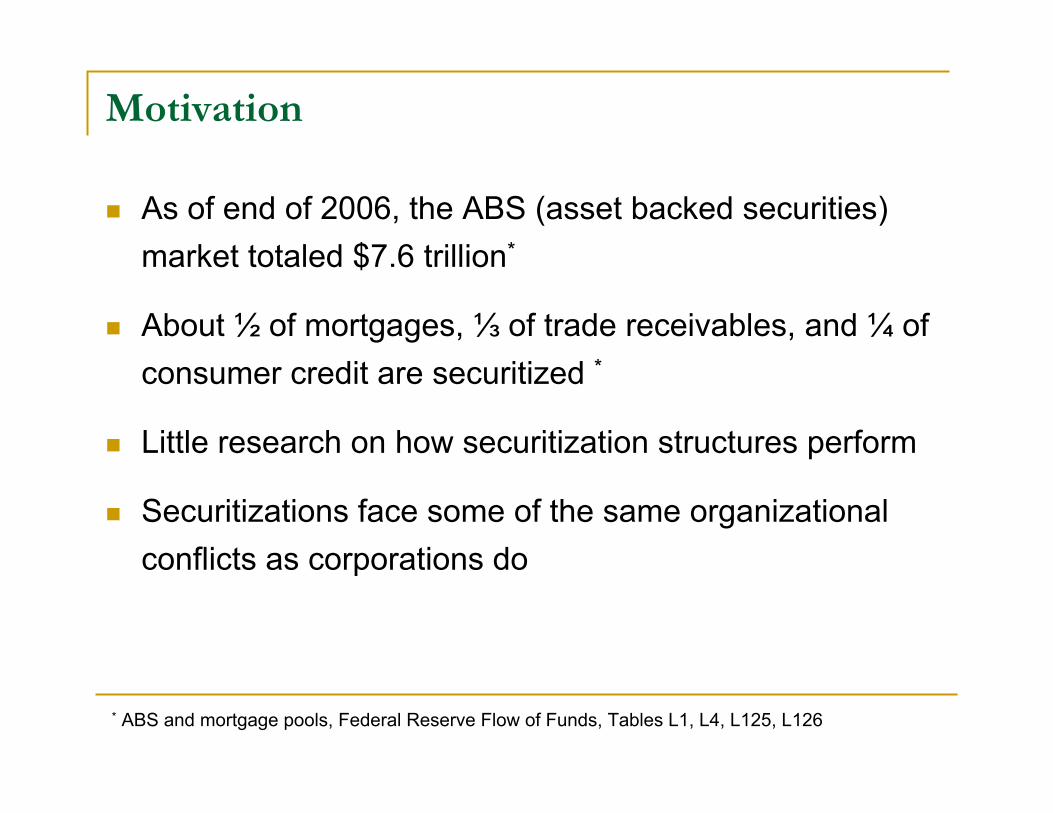
Private ABS outstanding, by type of collateralasset class # of deals amt oustanding(mm$)Home Equity 2,596 1,113,871.66Residential MBS 2,731 902,821.62Commercial MBS 1,036 568,665.34Automobile Loans 706 561,191.50Credit Cards 889 518,119.15Student Loans 84 109,969.67Equipment Lease 261 96,710.38Manufactured Housing 272 95,556.87Dealer Floorplans 98 92,958.97CDOs 248 70,403.39Automobile Lease 46 48,292.97Other Consumer Loan 116 26,631.28Recreational Vehicles 36 11,526.64Truck Loan 19 10,546.88Franchise Loans 45 9,397.57Motorcycle Loan 27 7,285.76Small Business Loan 28 3,967.44Marine/Boat Loan 11 2,855.25Time Share Loan 10 2,066.79Trade Receivables 11 1,968.05Insurance Premium Loan 3 1,146.30Other 9 250Total 9,282 4,256,203.48
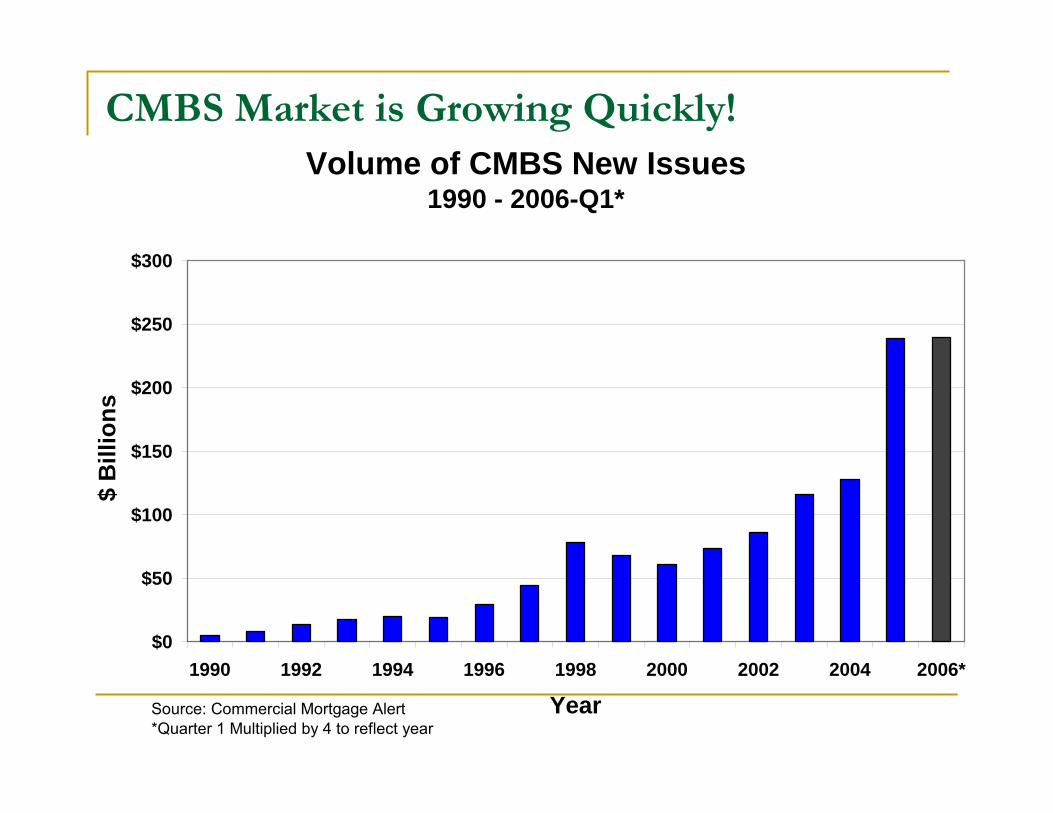
CMBS Market is Growing Quickly! Volume of CMBS New Issues
1990 - 2006-Q1*
$0
$50
$100
$150
$200
$250
$300
1990 1992 1994 1996 1998 2000 2002 2004 2006*
Year
$ B
illio
ns
Source: Commercial Mortgage Alert*Quarter 1 Multiplied by 4 to reflect year
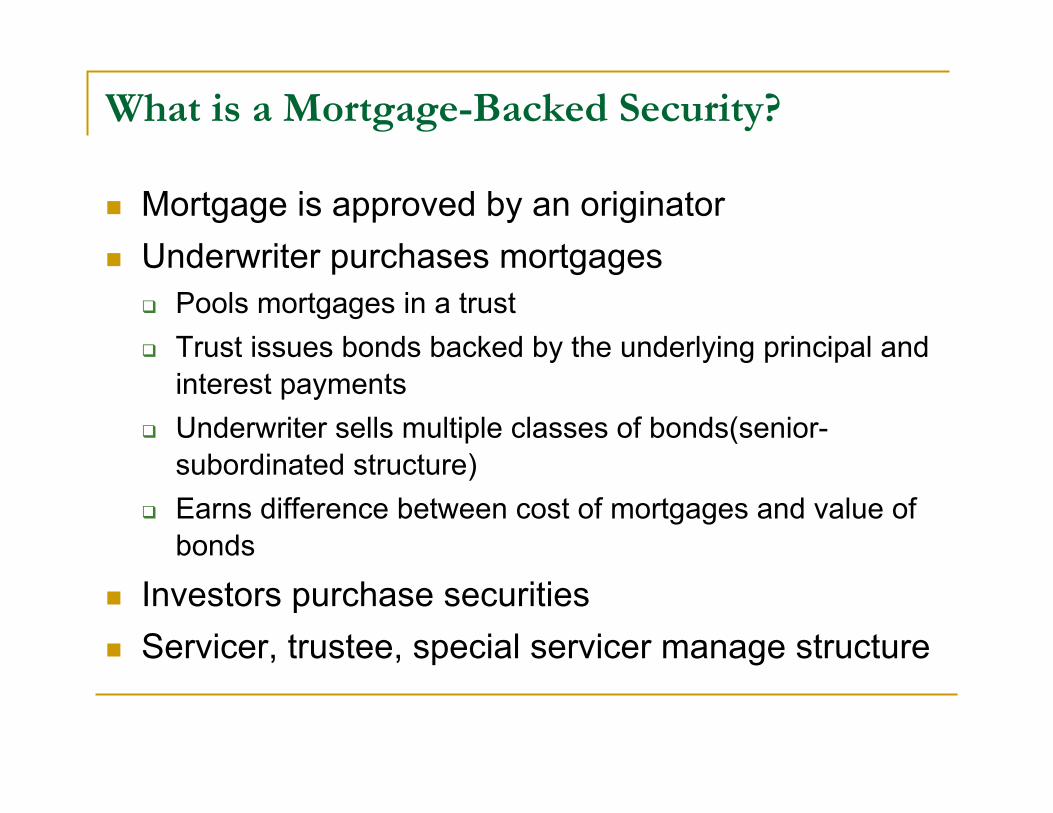
What is a Mortgage-Backed Security?
Mortgage is approved by an originatorUnderwriter purchases mortgages
Pools mortgages in a trustTrust issues bonds backed by the underlying principal and interest paymentsUnderwriter sells multiple classes of bonds(senior-subordinated structure)Earns difference between cost of mortgages and value of bonds
Investors purchase securitiesServicer, trustee, special servicer manage structure

Borrowers (Mortgagors)
Originators (Sellers)
Depositor (SPV)
Trust (Mortgage
Pool)
Underwriter (Investment Bank)
Investors Divided into
Tranches
Rating Agency
Custodian
Trustee
M aster Service
Special Servicer
Primary Servicer
LoanProceeds
Loans
LoansOfferingProceeds
LoansCertificates
Delivery of LoanDocuments
Confirmation of Document Delivery
Offering Proceeds
Certificates
CertificatesOfferingProceeds
Often purchasers of first class bonds/Controlling Class representative
Pooling and Servicing Agreement
Property Inspection
Monthly P & I
Monthly P & I
Property Inspection
Monthly P & I
Payment on Certificates
Typical CMBS Structure
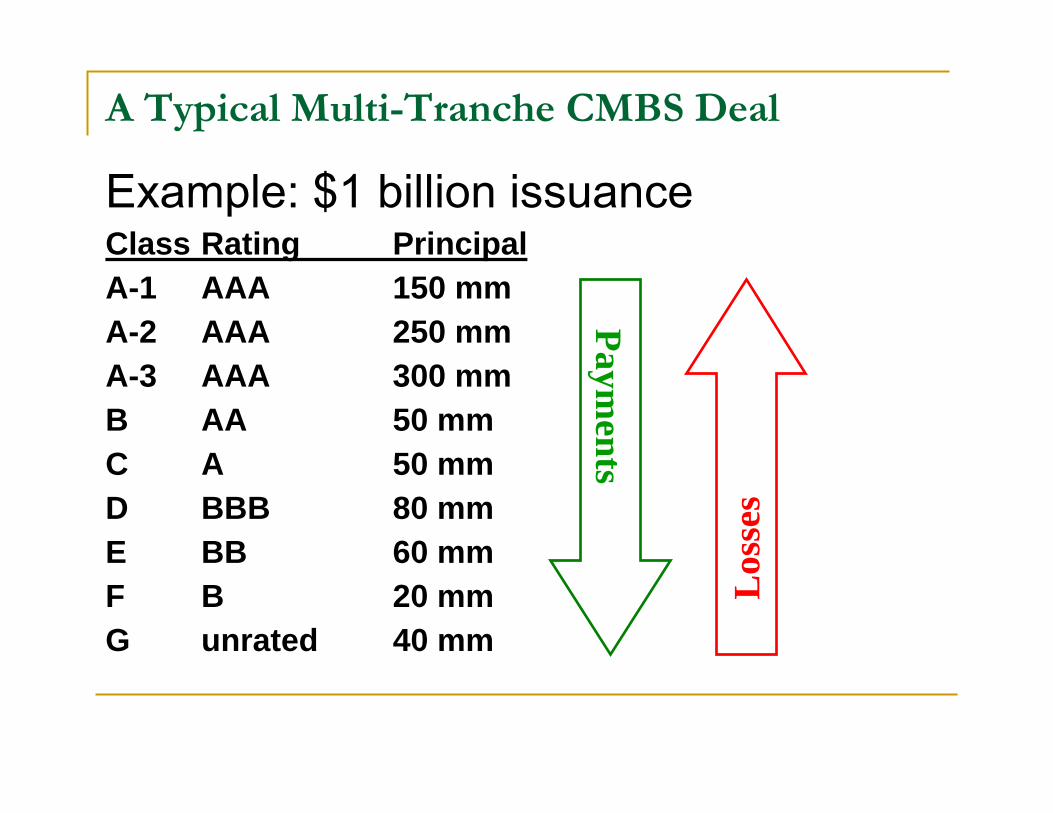
A Typical Multi-Tranche CMBS Deal
Los
ses
Payments
Example: $1 billion issuanceClass Rating PrincipalA-1 AAA 150 mmA-2 AAA 250 mmA-3 AAA 300 mmB AA 50 mmC A 50 mmD BBB 80 mmE BB 60 mmF B 20 mmG unrated 40 mm
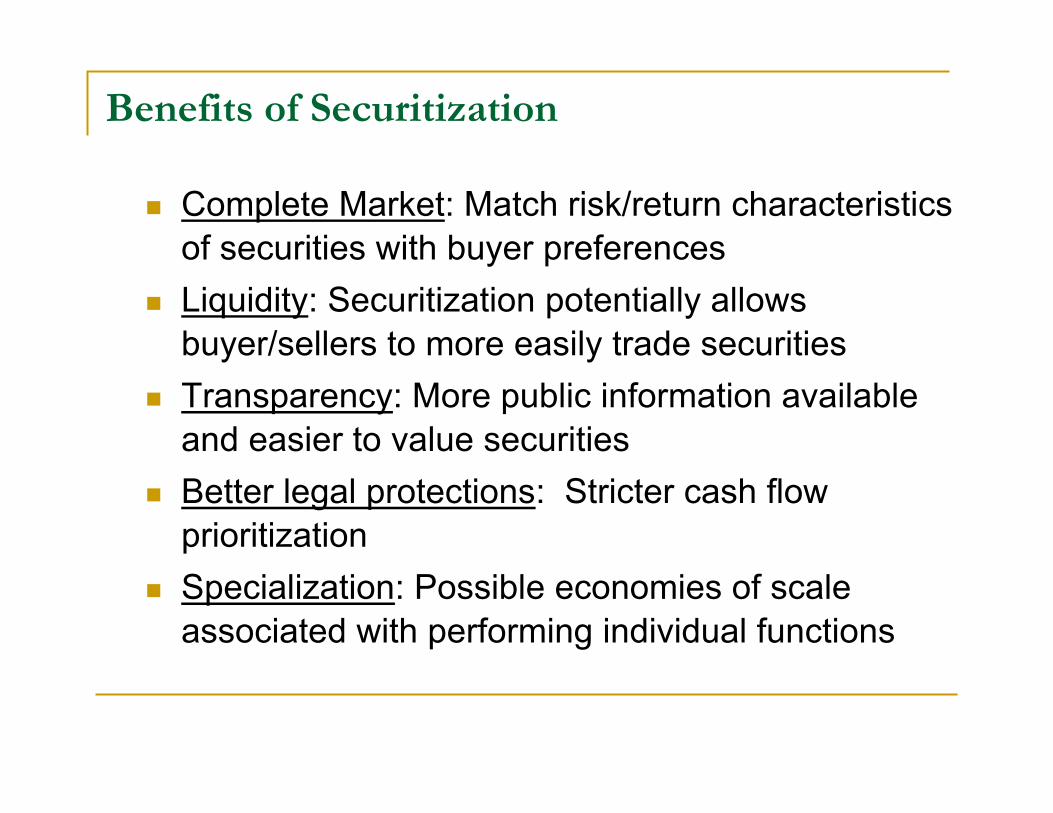
Benefits of Securitization
Complete Market: Match risk/return characteristics of securities with buyer preferencesLiquidity: Securitization potentially allows buyer/sellers to more easily trade securitiesTransparency: More public information available and easier to value securitiesBetter legal protections: Stricter cash flow prioritizationSpecialization: Possible economies of scale associated with performing individual functions
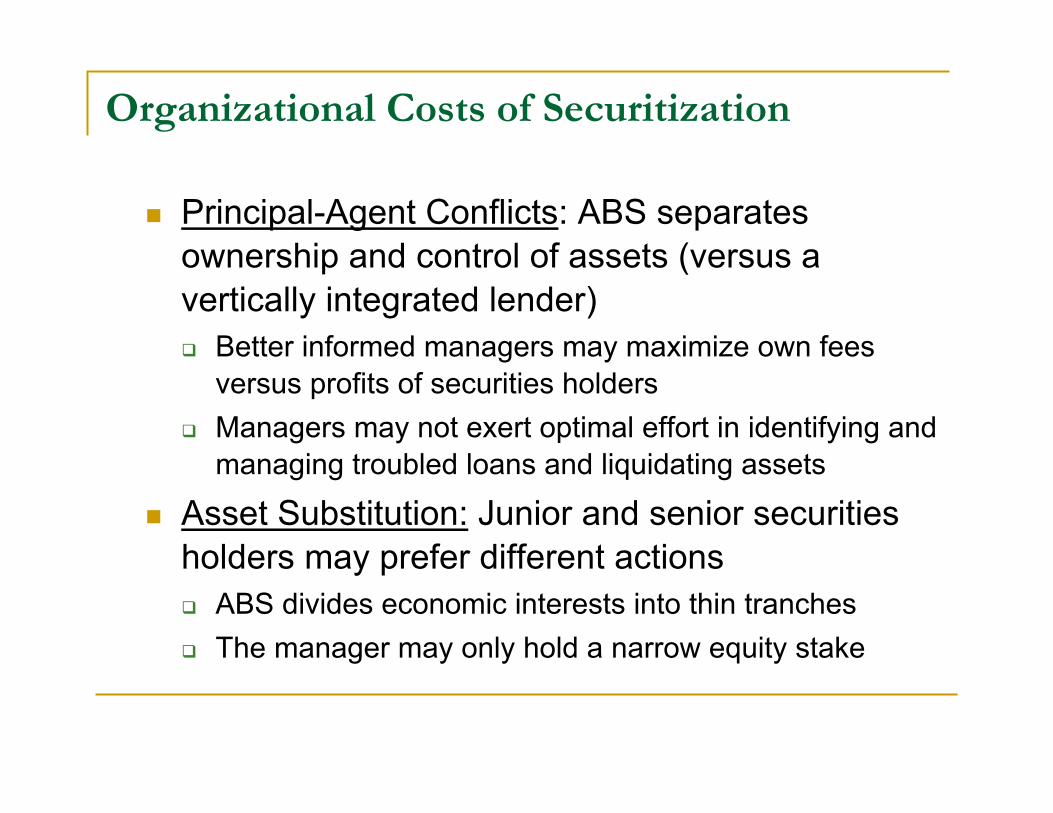
Organizational Costs of Securitization
Principal-Agent Conflicts: ABS separates ownership and control of assets (versus a vertically integrated lender)
Better informed managers may maximize own fees versus profits of securities holdersManagers may not exert optimal effort in identifying and managing troubled loans and liquidating assets
Asset Substitution: Junior and senior securities holders may prefer different actions
ABS divides economic interests into thin tranchesThe manager may only hold a narrow equity stake
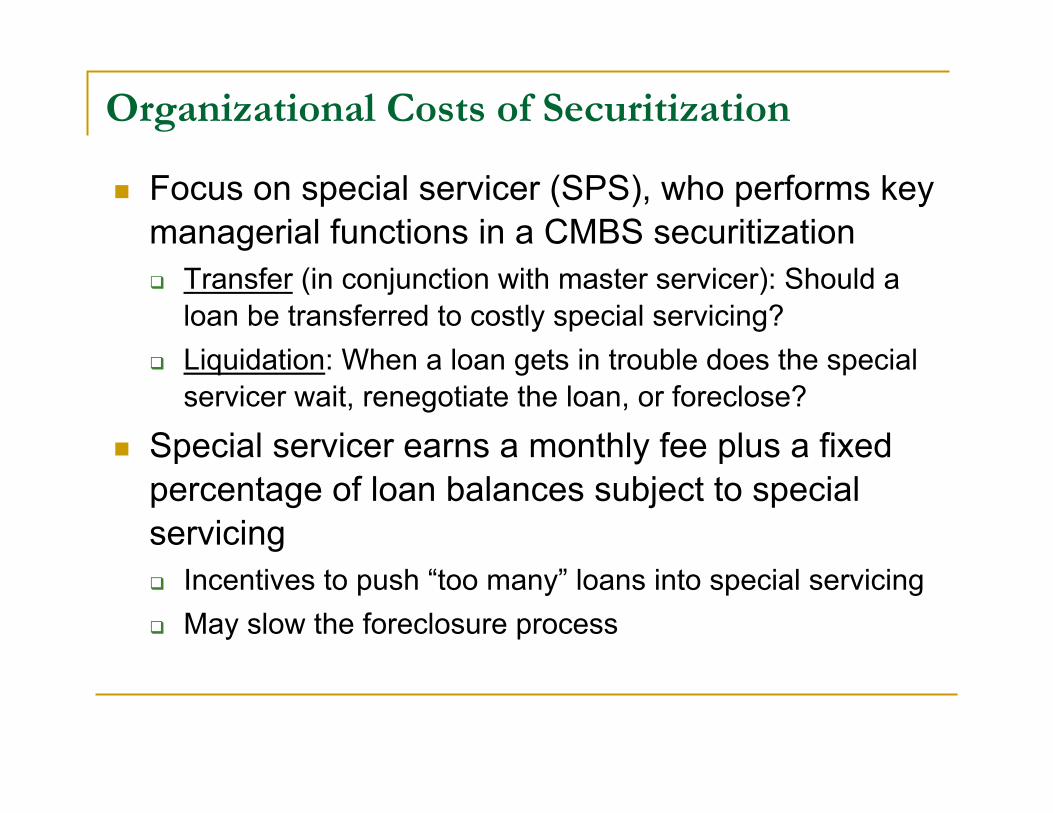
Organizational Costs of Securitization
Focus on special servicer (SPS), who performs key managerial functions in a CMBS securitization
Transfer (in conjunction with master servicer): Should a loan be transferred to costly special servicing?Liquidation: When a loan gets in trouble does the special servicer wait, renegotiate the loan, or foreclose?
Special servicer earns a monthly fee plus a fixed percentage of loan balances subject to special servicing
Incentives to push “too many” loans into special servicingMay slow the foreclosure process
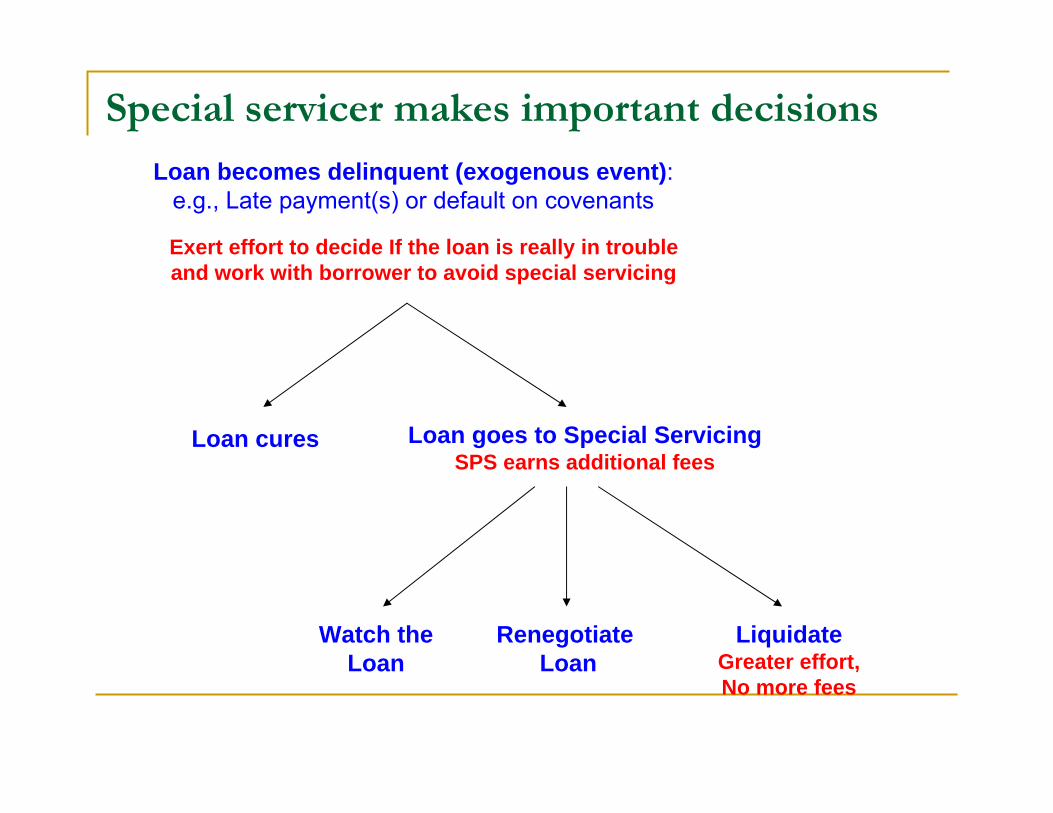
Loan becomes delinquent (exogenous event):e.g., Late payment(s) or default on covenants
Loan cures Loan goes to Special ServicingSPS earns additional fees
Renegotiate Loan
LiquidateGreater effort,No more fees
Special servicer makes important decisions
Watch theLoan
Exert effort to decide If the loan is really in troubleand work with borrower to avoid special servicing
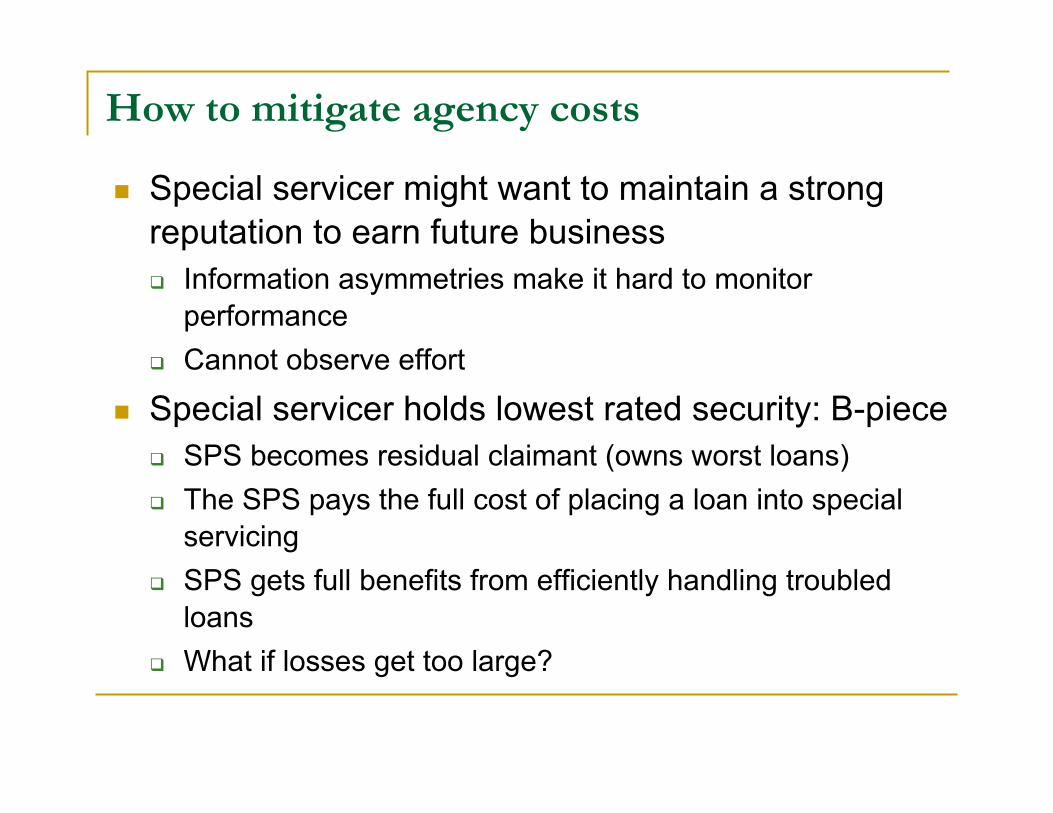
How to mitigate agency costs
Special servicer might want to maintain a strong reputation to earn future business
Information asymmetries make it hard to monitor performanceCannot observe effort
Special servicer holds lowest rated security: B-pieceSPS becomes residual claimant (owns worst loans)The SPS pays the full cost of placing a loan into special servicingSPS gets full benefits from efficiently handling troubled loansWhat if losses get too large?
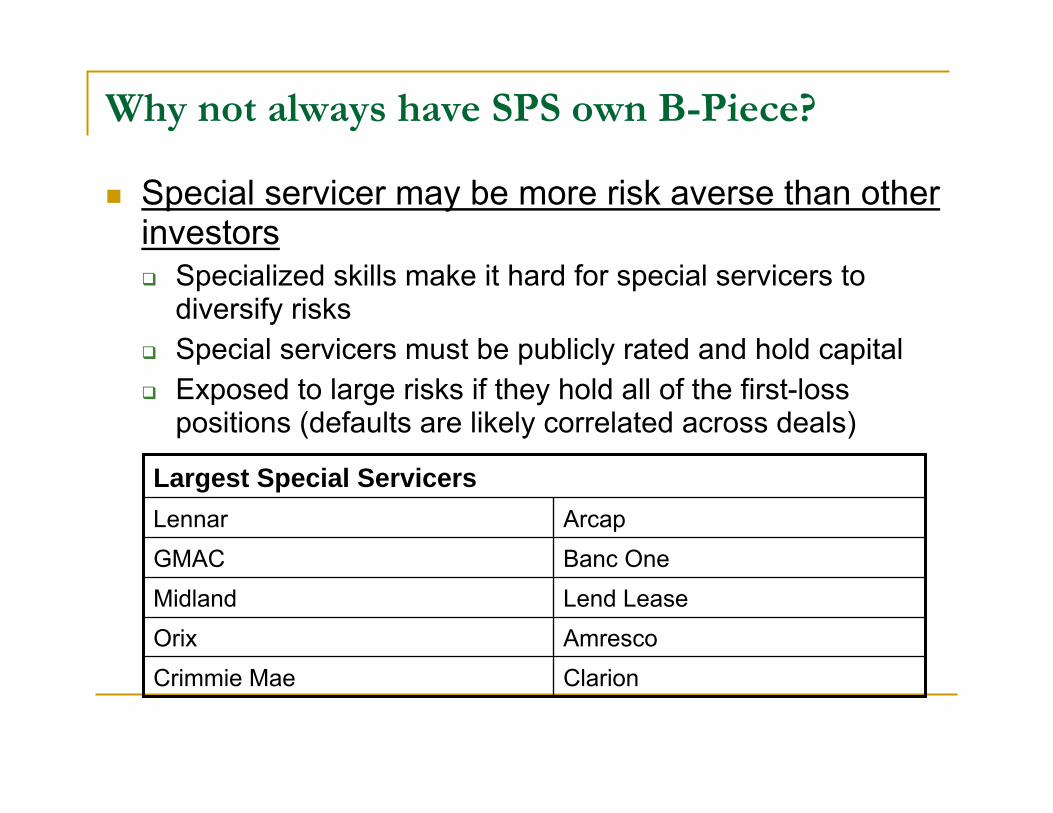
Why not always have SPS own B-Piece?
Special servicer may be more risk averse than other investors
Specialized skills make it hard for special servicers to diversify risksSpecial servicers must be publicly rated and hold capitalExposed to large risks if they hold all of the first-loss positions (defaults are likely correlated across deals)
Largest Special Servicers
ClarionCrimmie MaeAmrescoOrixLend LeaseMidlandBanc OneGMACArcapLennar
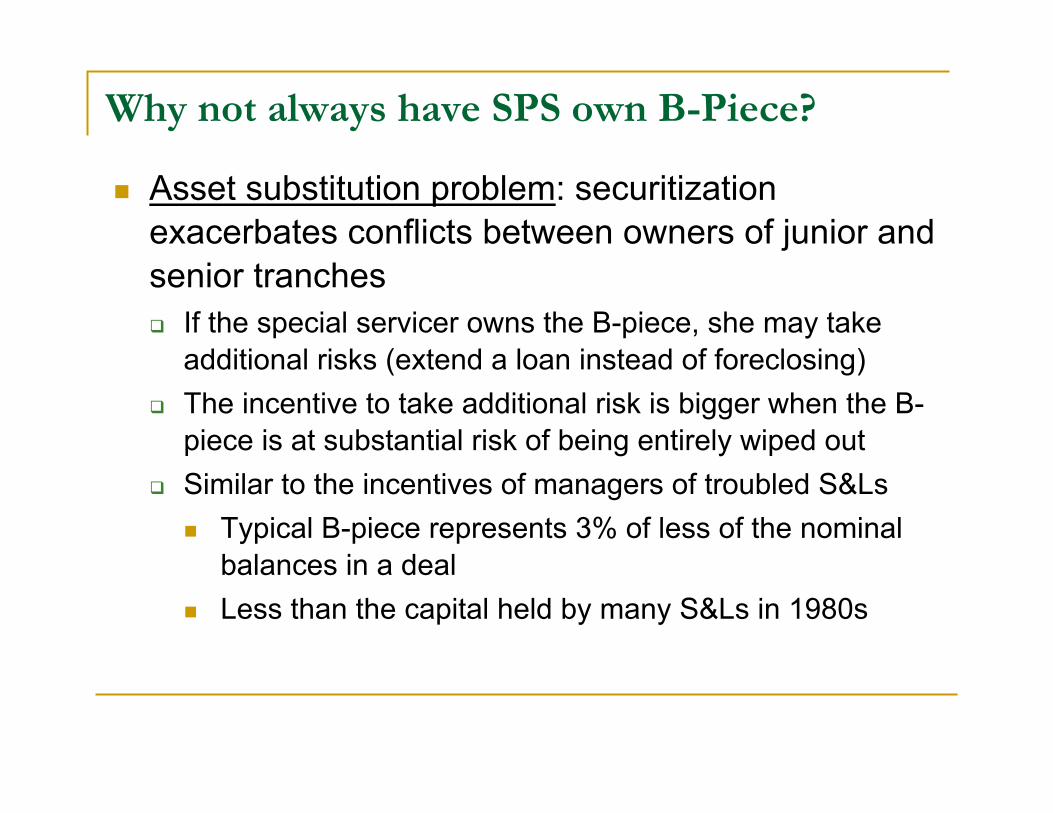
Why not always have SPS own B-Piece?
Asset substitution problem: securitization exacerbates conflicts between owners of junior and senior tranches
If the special servicer owns the B-piece, she may take additional risks (extend a loan instead of foreclosing) The incentive to take additional risk is bigger when the B-piece is at substantial risk of being entirely wiped outSimilar to the incentives of managers of troubled S&Ls
Typical B-piece represents 3% of less of the nominal balances in a dealLess than the capital held by many S&Ls in 1980s
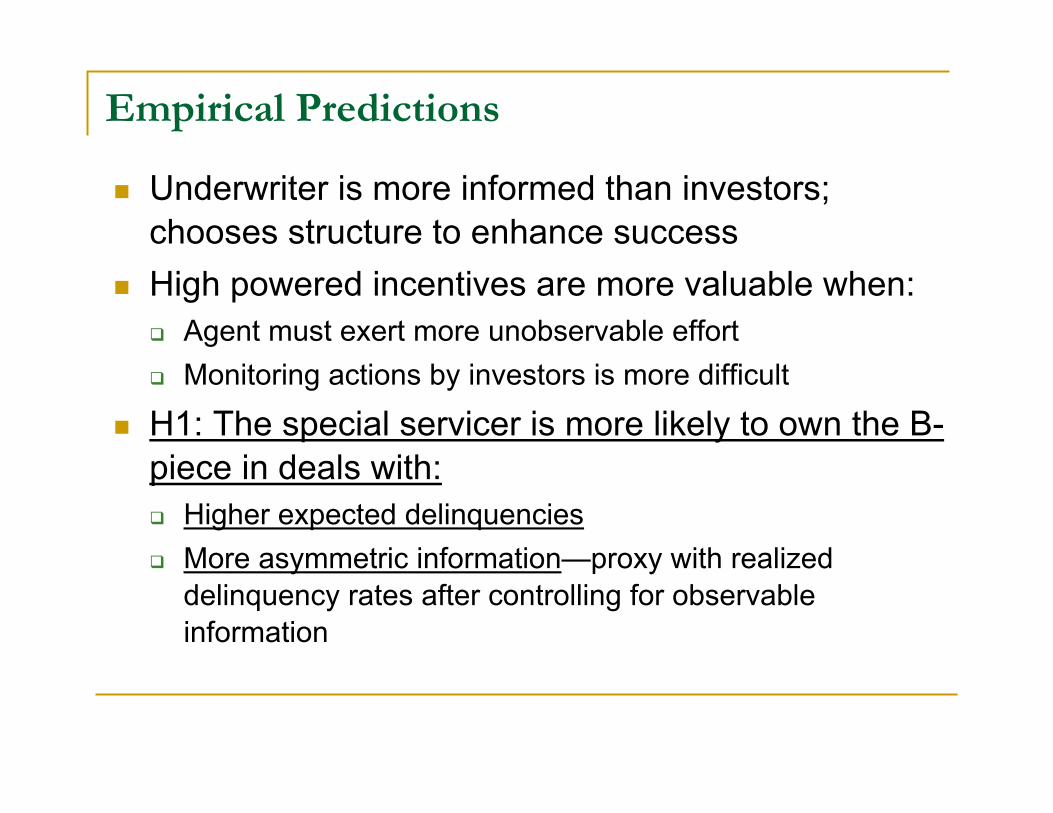
Empirical Predictions
Underwriter is more informed than investors; chooses structure to enhance successHigh powered incentives are more valuable when:
Agent must exert more unobservable effortMonitoring actions by investors is more difficult
H1: The special servicer is more likely to own the B-piece in deals with:
Higher expected delinquenciesMore asymmetric information—proxy with realized delinquency rates after controlling for observable information
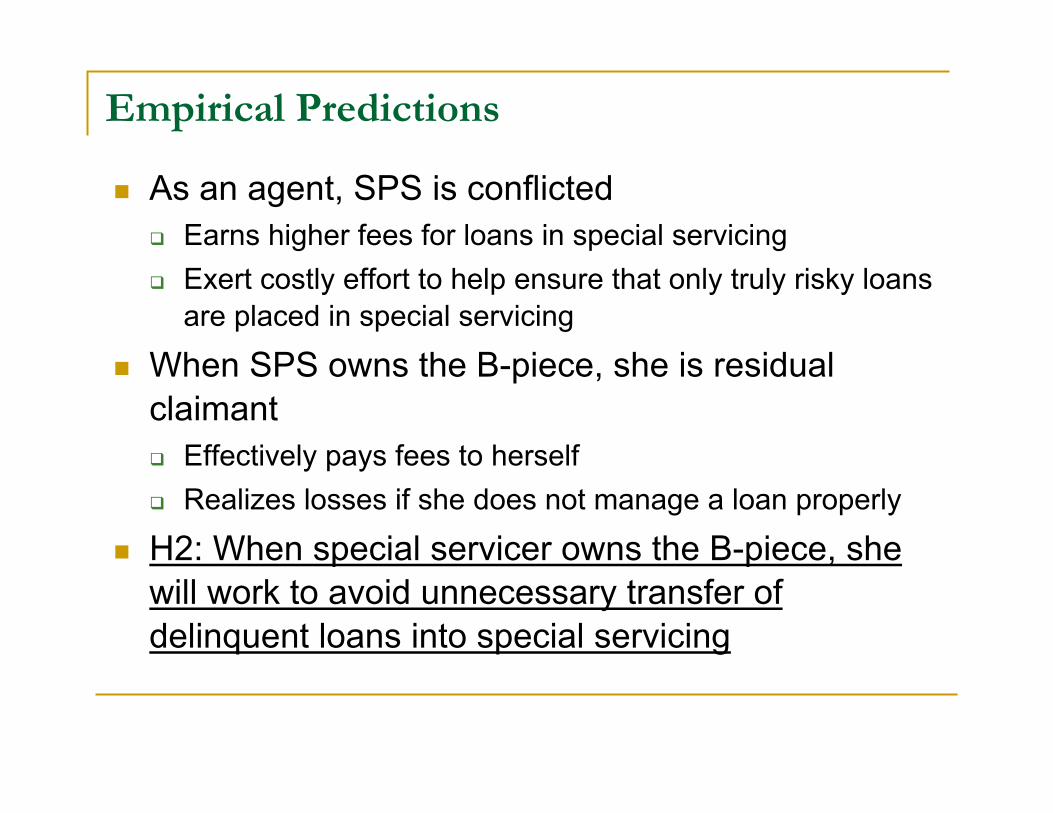
Empirical Predictions
As an agent, SPS is conflictedEarns higher fees for loans in special servicingExert costly effort to help ensure that only truly risky loans are placed in special servicing
When SPS owns the B-piece, she is residual claimant
Effectively pays fees to herselfRealizes losses if she does not manage a loan properly
H2: When special servicer owns the B-piece, she will work to avoid unnecessary transfer of delinquent loans into special servicing
Empirical Predictions
Once a loan is in special servicing, SPS must decide when to liquidate
Liquidation locks-in some losses Delaying liquidation allows SPS to earn more fees, but with greater risk for investors
Owners of highly leveraged assets cut back on maintenanceOwners take greater risks with property
Ultimate action of the SPS depends on the extent of potential losses in a deal
Empirical Predictions
H3A: When potential losses are small, the SPS who owns the B-piece will liquidate loans more quickly
SPS must exert costly effort to decide when to liquidate Greater fees are effectively paid by SPSSPS realizes any losses
H3B: When potential losses are large, the SPS who owns the B-piece will liquidate loans more quickly
Classic asset substitution problem
Empirical Predictions
H4: Bond prices (yields) should reflect the benefits of incentive alignment
Yields should be lower on deals in which the SPS owns the B-pieceYields effects should be most pronounced for the lowest rated tranches which suffer the greatest losses if the SPS does not perform efficiently
Rating agencies do not consider whether the SPS owns the B-piece in determining ratings
Ratings are determined prior to the marketing of the bondsUnderwriter cannot guarantee that the SPS will not sell the B-piece
Potential empirical problems
Do not observe losses, only actions of the agentsUnobserved quality of deals: If the SPS is well-informed, she might only purchase the B-piece in deals with unobserved high quality loans
We will show that delinquencies and liquidations are higher in deals in which the SPS owns the B-pieceBond yields reflect market’s perception of value
We condition on bond ratings to control for expected losses (quality)Investors should price impact of incentive alignment
Data
TreppAnnual performance data from 1998-2003
Deal and loan level information
Commercial Mortgage AlertName of B-piece buyer
Initial pricing data and yields for some bonds
Restrict sample to non-agency deals in which we know the name of the SPS and B-piece buyer
357 (out of 839 deals in Trepp)
46,000 loans
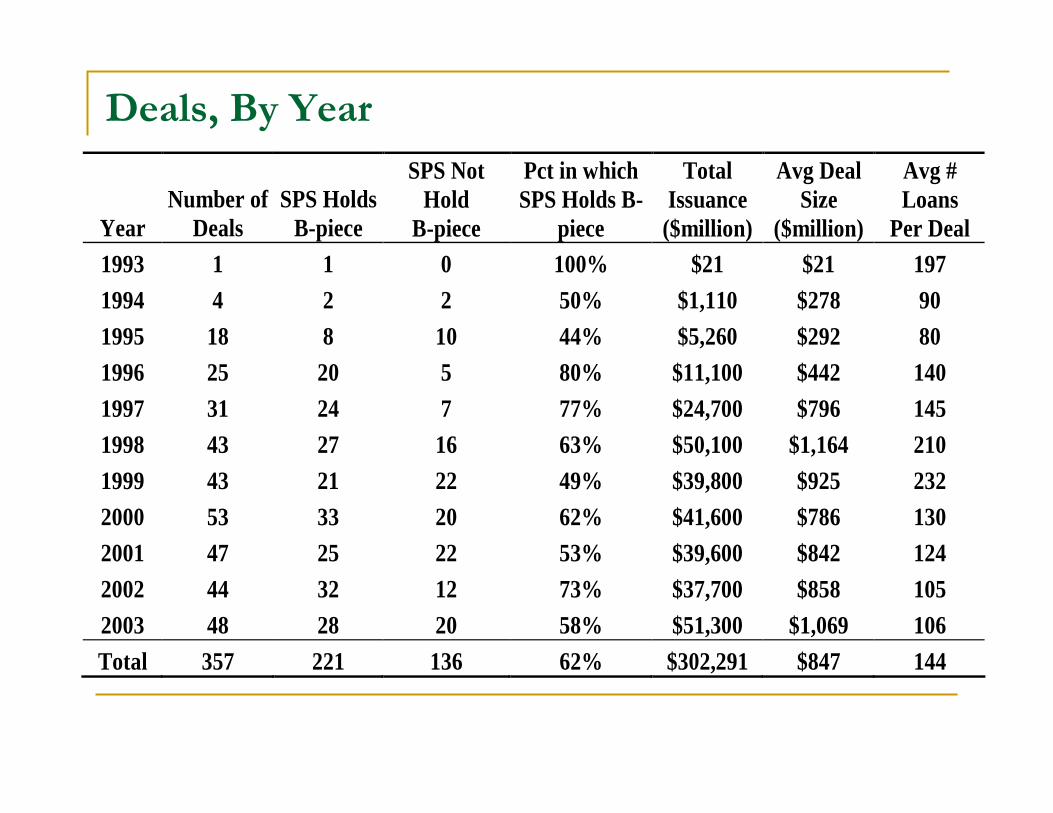
Deals, By Year
Year Number of
Deals SPS Holds
B-piece
SPS Not Hold
B-piece
Pct in which SPS Holds B-
piece
Total Issuance
($million)
Avg Deal Size
($million)
Avg # Loans
Per Deal 1993 1 1 0 100% $21 $21 197 1994 4 2 2 50% $1,110 $278 90 1995 18 8 10 44% $5,260 $292 80 1996 25 20 5 80% $11,100 $442 140 1997 31 24 7 77% $24,700 $796 145 1998 43 27 16 63% $50,100 $1,164 210 1999 43 21 22 49% $39,800 $925 232 2000 53 33 20 62% $41,600 $786 130 2001 47 25 22 53% $39,600 $842 124 2002 44 32 12 73% $37,700 $858 105 2003 48 28 20 58% $51,300 $1,069 106 Total 357 221 136 62% $302,291 $847 144
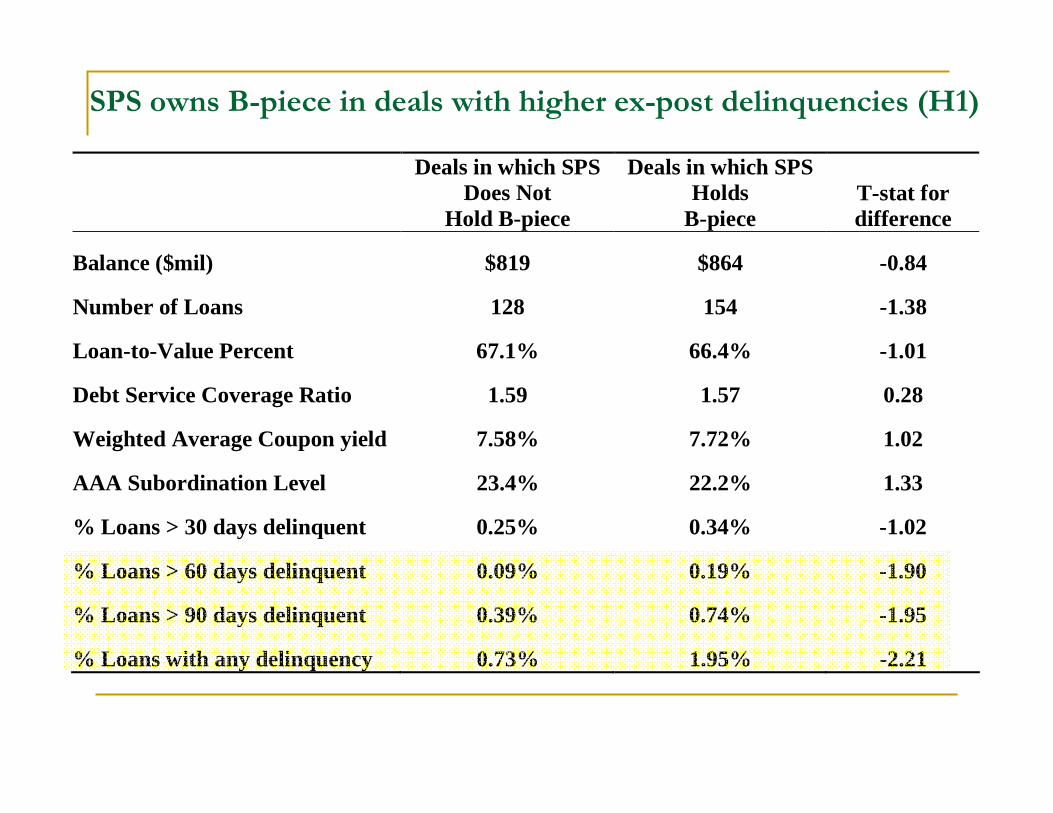
SPS owns B-piece in deals with higher ex-post delinquencies (H1)
Deals in which SPS Does Not
Hold B-piece
Deals in which SPS Holds
B-piece T-stat for difference
Balance ($mil) $819 $864 -0.84
Number of Loans 128 154 -1.38
Loan-to-Value Percent 67.1% 66.4% -1.01
Debt Service Coverage Ratio 1.59 1.57 0.28
Weighted Average Coupon yield 7.58% 7.72% 1.02
AAA Subordination Level 23.4% 22.2% 1.33
% Loans > 30 days delinquent 0.25% 0.34% -1.02
% Loans > 60 days delinquent 0.09% 0.19% -1.90
% Loans > 90 days delinquent 0.39% 0.74% -1.95
% Loans with any delinquency 0.73% 1.95% -2.21
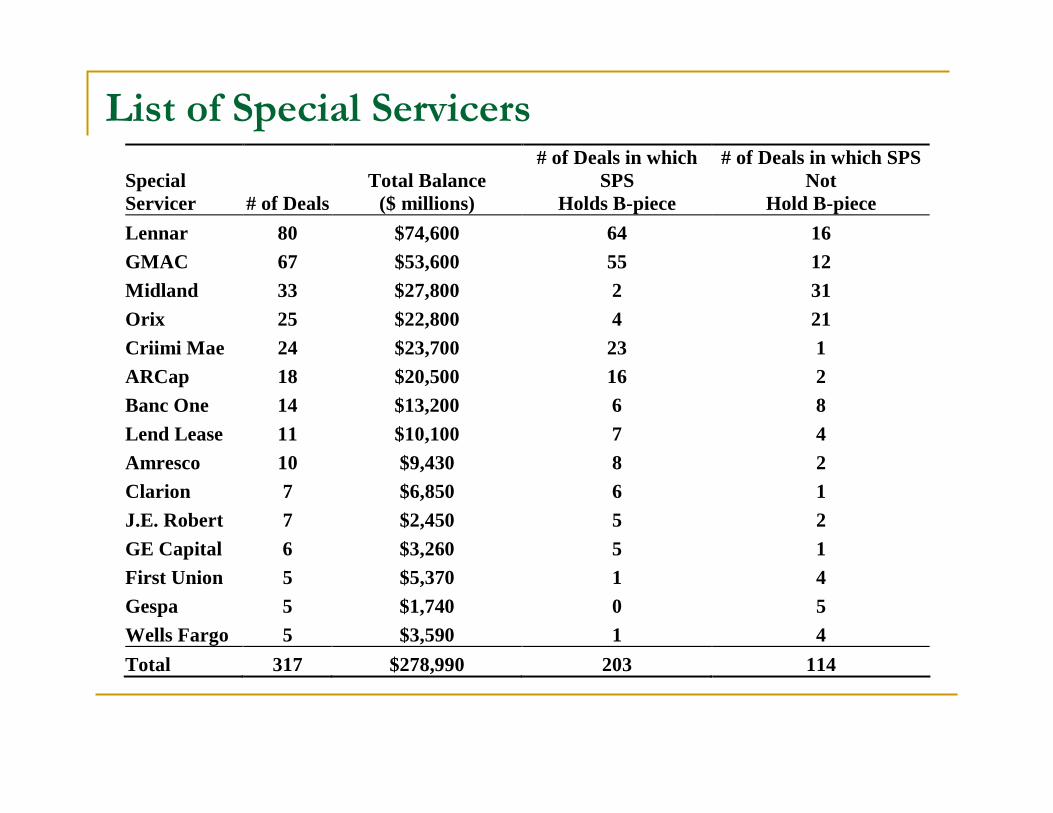
List of Special Servicers
Special Servicer # of Deals
Total Balance ($ millions)
# of Deals in which SPS
Holds B-piece
# of Deals in which SPS Not
Hold B-piece Lennar 80 $74,600 64 16 GMAC 67 $53,600 55 12 Midland 33 $27,800 2 31 Orix 25 $22,800 4 21 Criimi Mae 24 $23,700 23 1 ARCap 18 $20,500 16 2 Banc One 14 $13,200 6 8 Lend Lease 11 $10,100 7 4 Amresco 10 $9,430 8 2 Clarion 7 $6,850 6 1 J.E. Robert 7 $2,450 5 2 GE Capital 6 $3,260 5 1 First Union 5 $5,370 1 4 Gespa 5 $1,740 0 5 Wells Fargo 5 $3,590 1 4 Total 317 $278,990 203 114
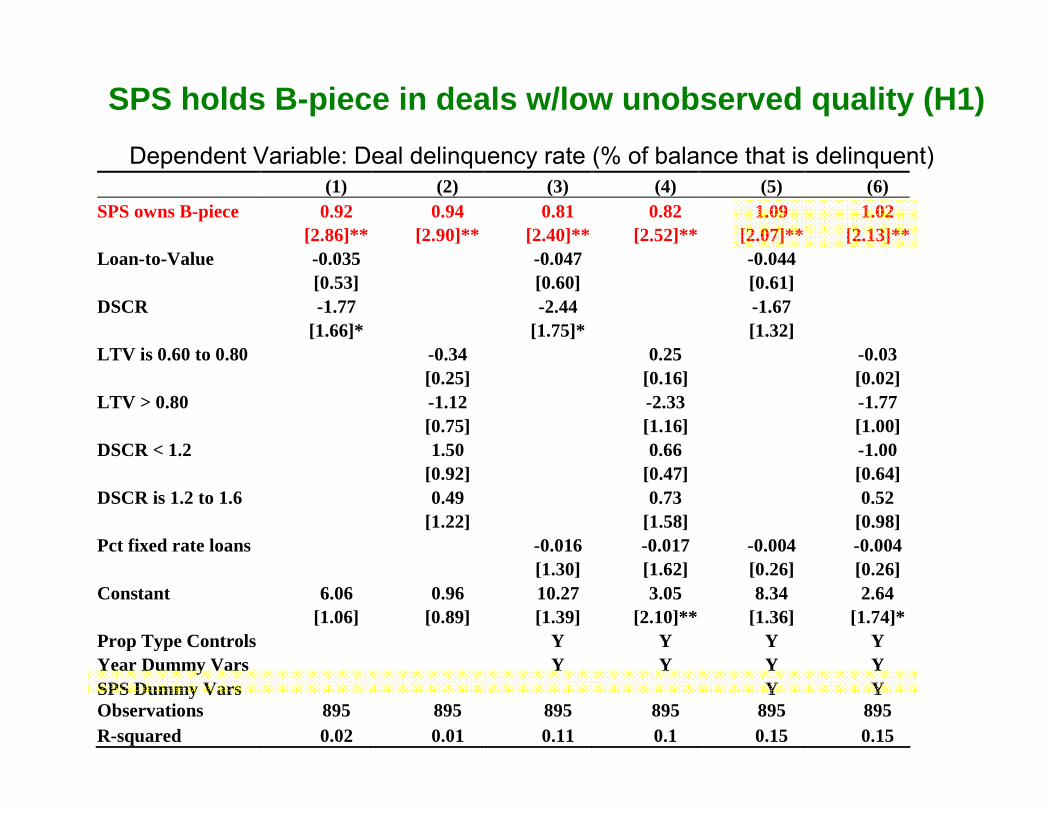
SPS holds B-piece in deals w/low unobserved quality (H1)Dependent Variable: Deal delinquency rate (% of balance that is delinquent) (1) (2) (3) (4) (5) (6)
SPS owns B-piece 0.92 0.94 0.81 0.82 1.09 1.02 [2.86]** [2.90]** [2.40]** [2.52]** [2.07]** [2.13]**
Loan-to-Value -0.035 -0.047 -0.044 [0.53] [0.60] [0.61]
DSCR -1.77 -2.44 -1.67 [1.66]* [1.75]* [1.32]
LTV is 0.60 to 0.80 -0.34 0.25 -0.03 [0.25] [0.16] [0.02]
LTV > 0.80 -1.12 -2.33 -1.77 [0.75] [1.16] [1.00]
DSCR < 1.2 1.50 0.66 -1.00 [0.92] [0.47] [0.64]
DSCR is 1.2 to 1.6 0.49 0.73 0.52 [1.22] [1.58] [0.98]
Pct fixed rate loans -0.016 -0.017 -0.004 -0.004 [1.30] [1.62] [0.26] [0.26]
Constant 6.06 0.96 10.27 3.05 8.34 2.64 [1.06] [0.89] [1.39] [2.10]** [1.36] [1.74]*
Prop Type Controls Y Y Y Y Year Dummy Vars Y Y Y Y SPS Dummy Vars Y Y Observations 895 895 895 895 895 895 R-squared 0.02 0.01 0.11 0.1 0.15 0.15
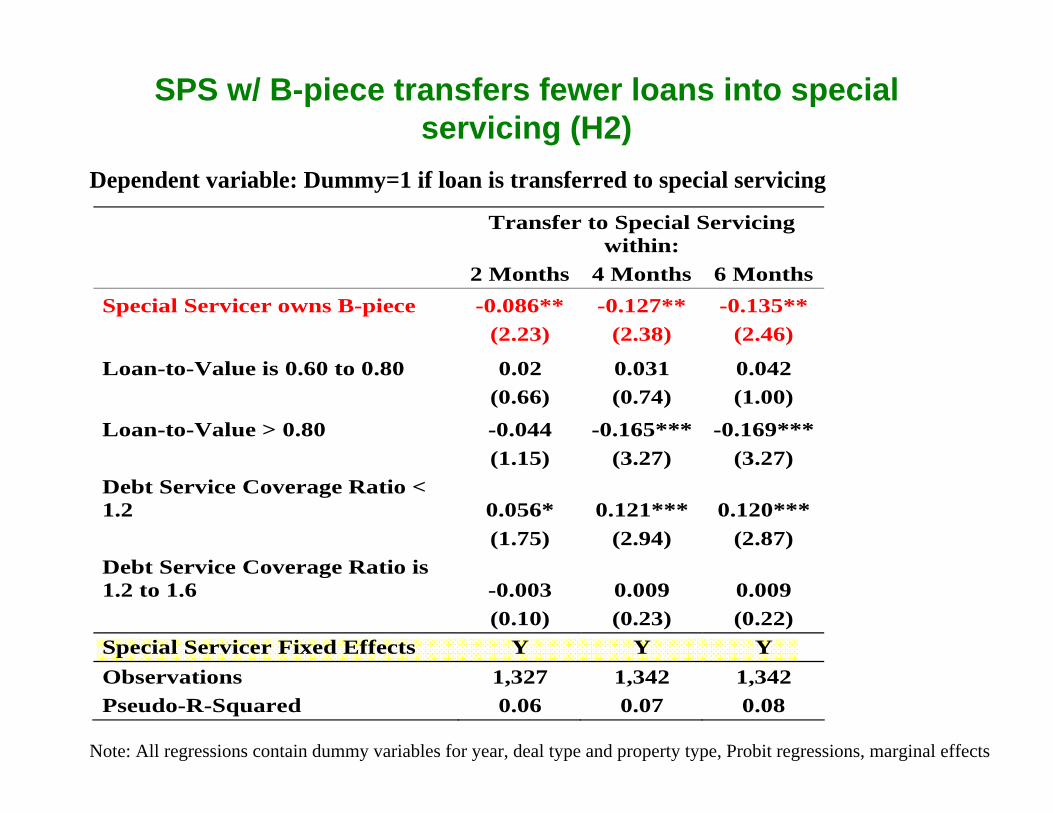
SPS w/ B-piece transfers fewer loans into special servicing (H2)
Dependent variable: Dummy=1 if loan is transferred to special servicing
Note: All regressions contain dummy variables for year, deal type and property type, Probit regressions, marginal effects
Transfer to Special Servicing
within: 2 Months 4 Months 6 Months
Special Servicer owns B-piece -0.086** -0.127** -0.135** (2.23) (2.38) (2.46)
Loan-to-Value is 0.60 to 0.80 0.02 0.031 0.042 (0.66) (0.74) (1.00) Loan-to-Value > 0.80 -0.044 -0.165*** -0.169*** (1.15) (3.27) (3.27) Debt Service Coverage Ratio < 1.2 0.056* 0.121*** 0.120*** (1.75) (2.94) (2.87) Debt Service Coverage Ratio is 1.2 to 1.6 -0.003 0.009 0.009 (0.10) (0.23) (0.22) Special Servicer Fixed Effects Y Y Y Observations 1,327 1,342 1,342 Pseudo-R-Squared 0.06 0.07 0.08
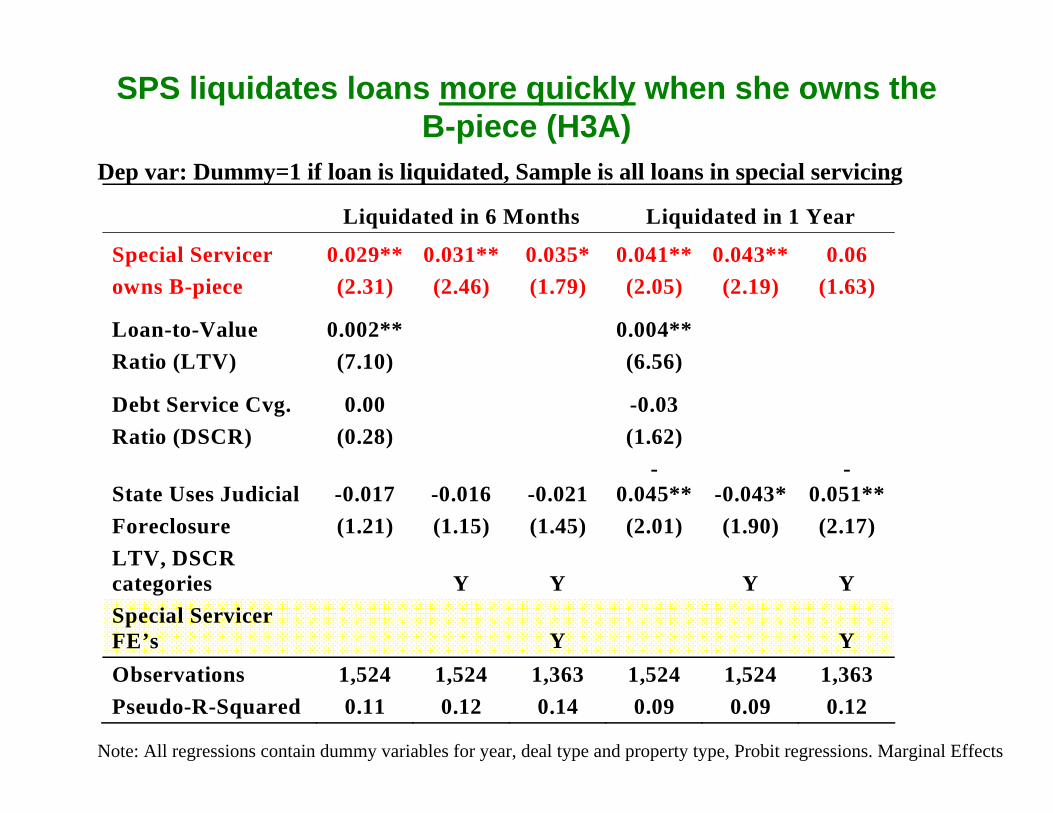
SPS liquidates loans more quickly when she owns the B-piece (H3A)
Note: All regressions contain dummy variables for year, deal type and property type, Probit regressions. Marginal Effects
Dep var: Dummy=1 if loan is liquidated, Sample is all loans in special servicing
Liquidated in 6 Months Liquidated in 1 Year
Special Servicer 0.029** 0.031** 0.035* 0.041** 0.043** 0.06 owns B-piece (2.31) (2.46) (1.79) (2.05) (2.19) (1.63)
Loan-to-Value 0.002** 0.004** Ratio (LTV) (7.10) (6.56)
Debt Service Cvg. 0.00 -0.03 Ratio (DSCR) (0.28) (1.62)
State Uses Judicial -0.017 -0.016 -0.021 -
0.045** -0.043* -
0.051**Foreclosure (1.21) (1.15) (1.45) (2.01) (1.90) (2.17) LTV, DSCR categories Y Y Y Y Special Servicer FE’s Y Y Observations 1,524 1,524 1,363 1,524 1,524 1,363 Pseudo-R-Squared 0.11 0.12 0.14 0.09 0.09 0.12
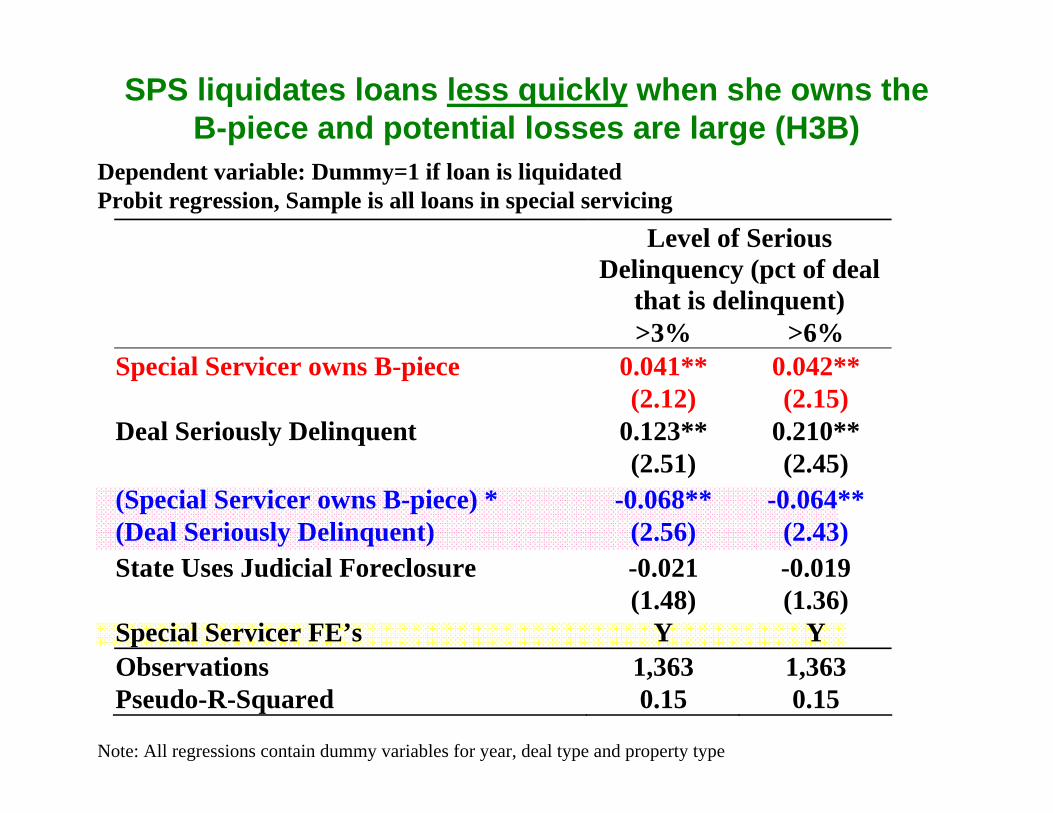
SPS liquidates loans less quickly when she owns the B-piece and potential losses are large (H3B)
Note: All regressions contain dummy variables for year, deal type and property type
Dependent variable: Dummy=1 if loan is liquidatedProbit regression, Sample is all loans in special servicing
Level of Serious Delinquency (pct of deal
that is delinquent) >3% >6%
Special Servicer owns B-piece 0.041** 0.042** (2.12) (2.15) Deal Seriously Delinquent 0.123** 0.210** (2.51) (2.45) (Special Servicer owns B-piece) * -0.068** -0.064** (Deal Seriously Delinquent) (2.56) (2.43) State Uses Judicial Foreclosure -0.021 -0.019 (1.48) (1.36) Special Servicer FE’s Y Y Observations 1,363 1,363 Pseudo-R-Squared 0.15 0.15
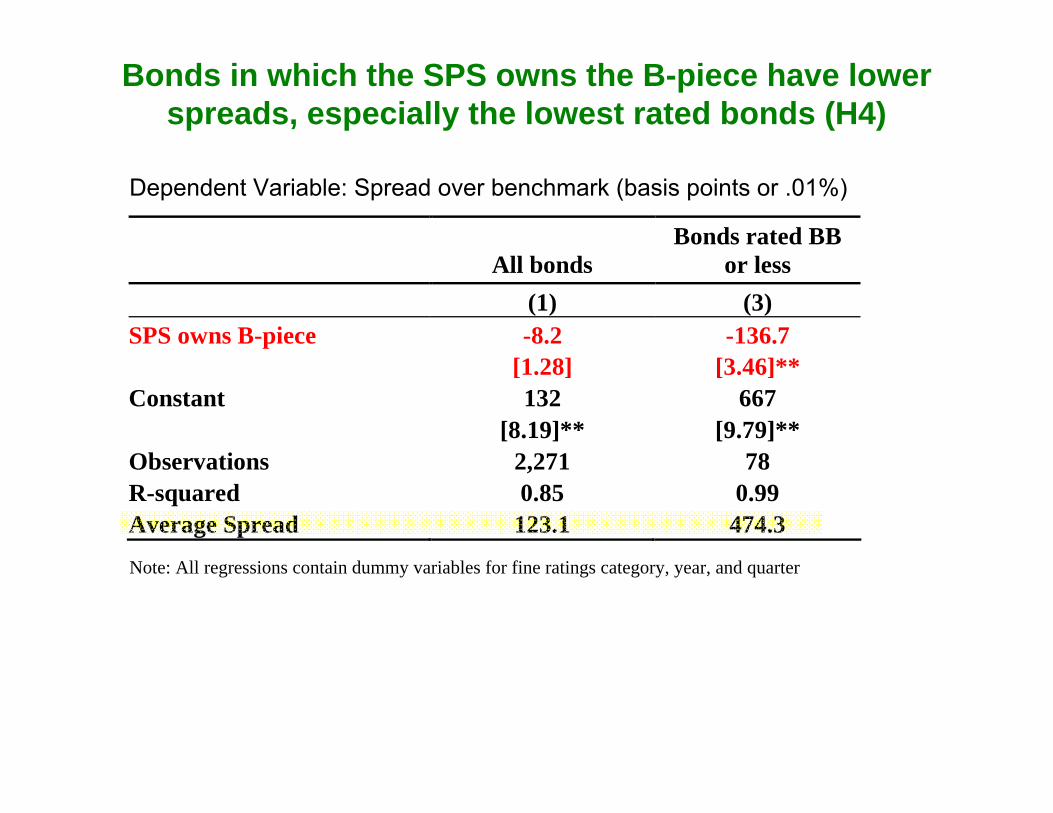
Bonds in which the SPS owns the B-piece have lower spreads, especially the lowest rated bonds (H4)
Dependent Variable: Spread over benchmark (basis points or .01%)
All bonds Bonds rated BB
or less (1) (3)
SPS owns B-piece -8.2 -136.7 [1.28] [3.46]** Constant 132 667 [8.19]** [9.79]** Observations 2,271 78 R-squared 0.85 0.99 Average Spread 123.1 474.3
Note: All regressions contain dummy variables for fine ratings category, year, and quarter
Conclusions
Evidence suggests that agency conflicts are important in CMBS securitizations
SPS more likely to own B-piece in deals with higher delinquency rates and greater asymmetric information (H1)
When special servicers hold the B-piece, agency conflicts are reduced
Fewer delinquent loans are transferred into special servicing (H2)
Once in special servicing, loans are liquidated more quickly when losses are small (H3A)
Conclusions
Asset substitution is still a problem when potential losses are large—SPS liquidates loans more slowly when she owns the B-piece (H3B)
Market values structure of SPS holding B-piece (H4)Bond spreads are lower when SPS owns B-piece
Spread effect is most pronounced in lowest rated bonds
So why does the SPS only own the B-piece in 62% of deals?
Theory suggests that most informed party and the party who makes decisions (SPS in both cases) would have the highest WTP for the B-piece
Asset substitution cannot explain this puzzleUnderwriter wants to protect investors in senior classes
Yet bond yields are lower in deals when SPS owns B-piece, despite higher delinquencies & liquidations
Must be risk aversion in special servicersSPS must maintain credit ratings and cannot diversify
Evidence: SPS holds B-piece less when issuance is highest
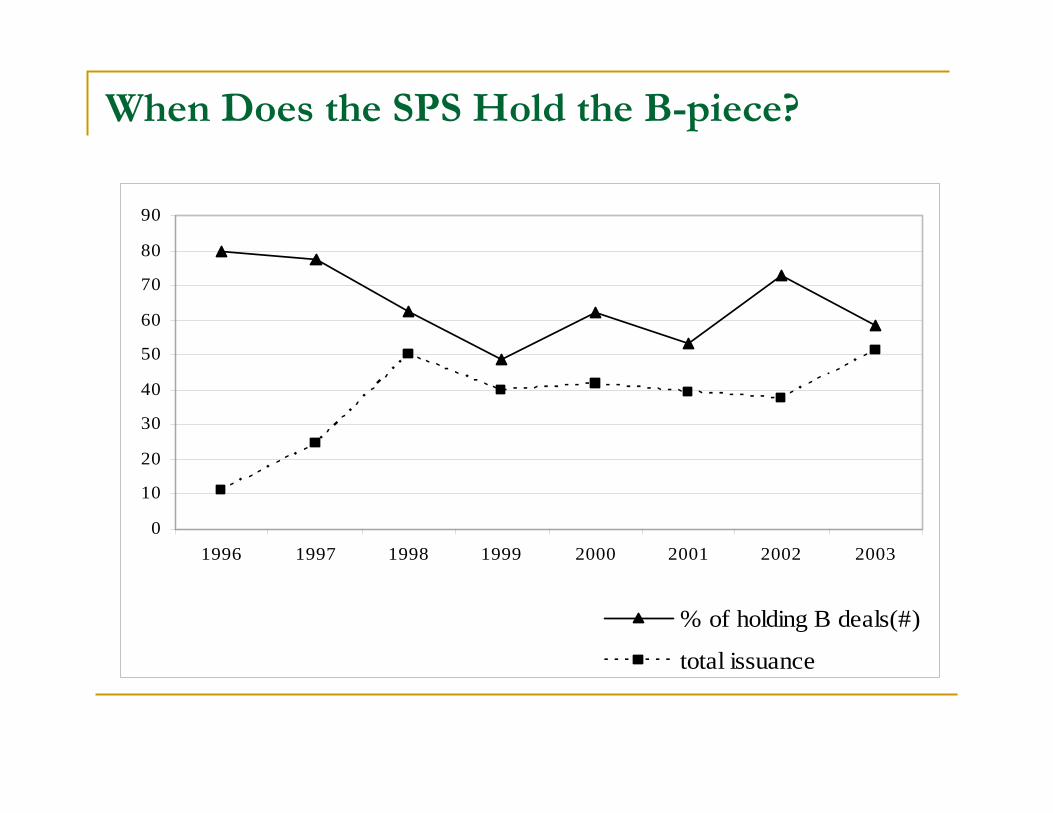
When Does the SPS Hold the B-piece?
0
10
20
30
40
50
60
70
80
90
1996 1997 1998 1999 2000 2001 2002 2003
% of holding B deals(#)
total issuance
Policy Implications and Future Research
Securitization enhances conflicts between junior/senior credit holders with many tranches
If delinquencies rise significantly, SPS ownership of B-piece could lead to serious inefficiencies
Regulation matters: Risk-based capital requirements have helped drive securitization
Institutions often hold less capital for rated bonds than whole loans (is the risk really lower?)
Banks participate much less than insurance companies
Will liquidity and transparency continue in a downturn?
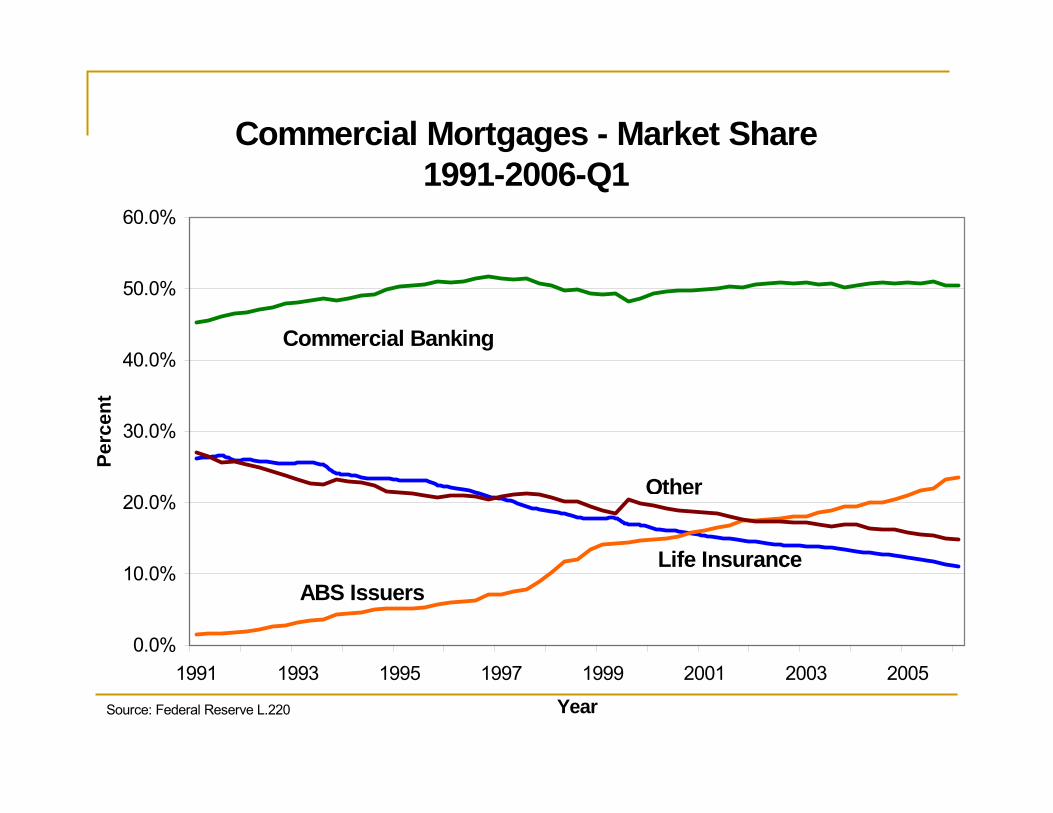
Commercial Mortgages - Market Share1991-2006-Q1
0.0%
10.0%
20.0%
30.0%
40.0%
50.0%
60.0%
1991 1993 1995 1997 1999 2001 2003 2005
Year
Perc
ent
ABS Issuers
Other
Life Insurance
Commercial Banking
Source: Federal Reserve L.220
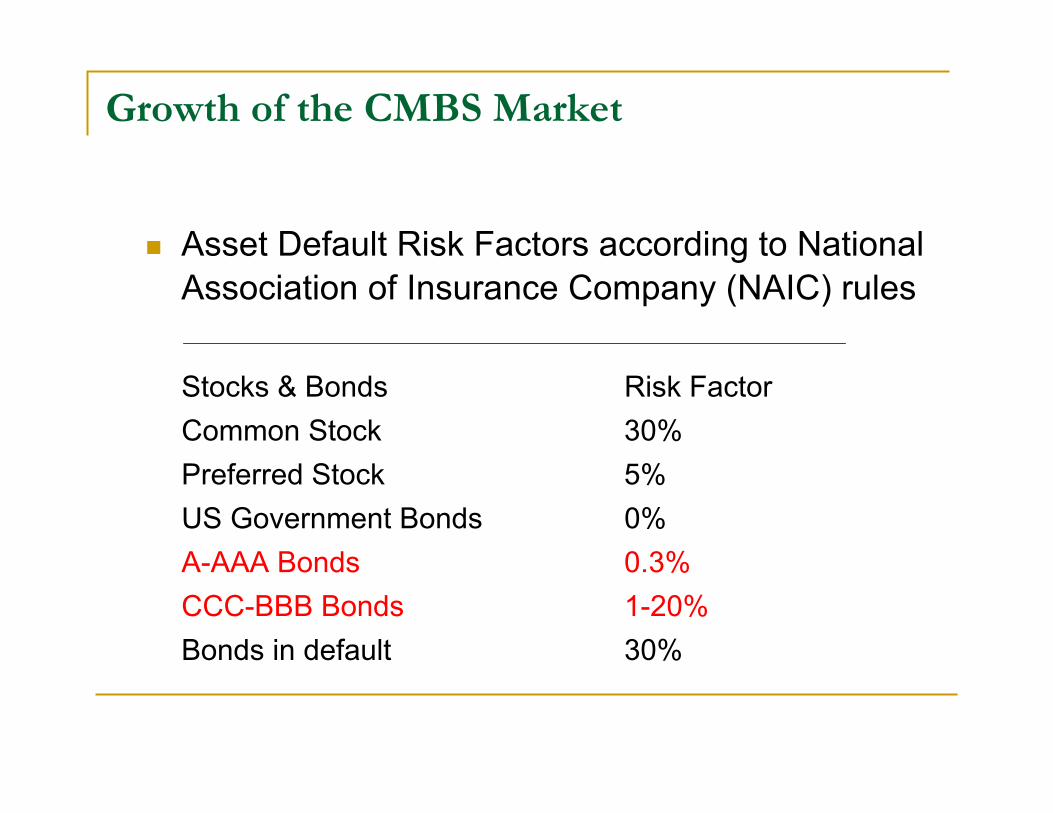
Growth of the CMBS Market
Asset Default Risk Factors according to National Association of Insurance Company (NAIC) rules
Stocks & Bonds Risk FactorCommon Stock 30%Preferred Stock 5%US Government Bonds 0%A-AAA Bonds 0.3%CCC-BBB Bonds 1-20%Bonds in default 30%
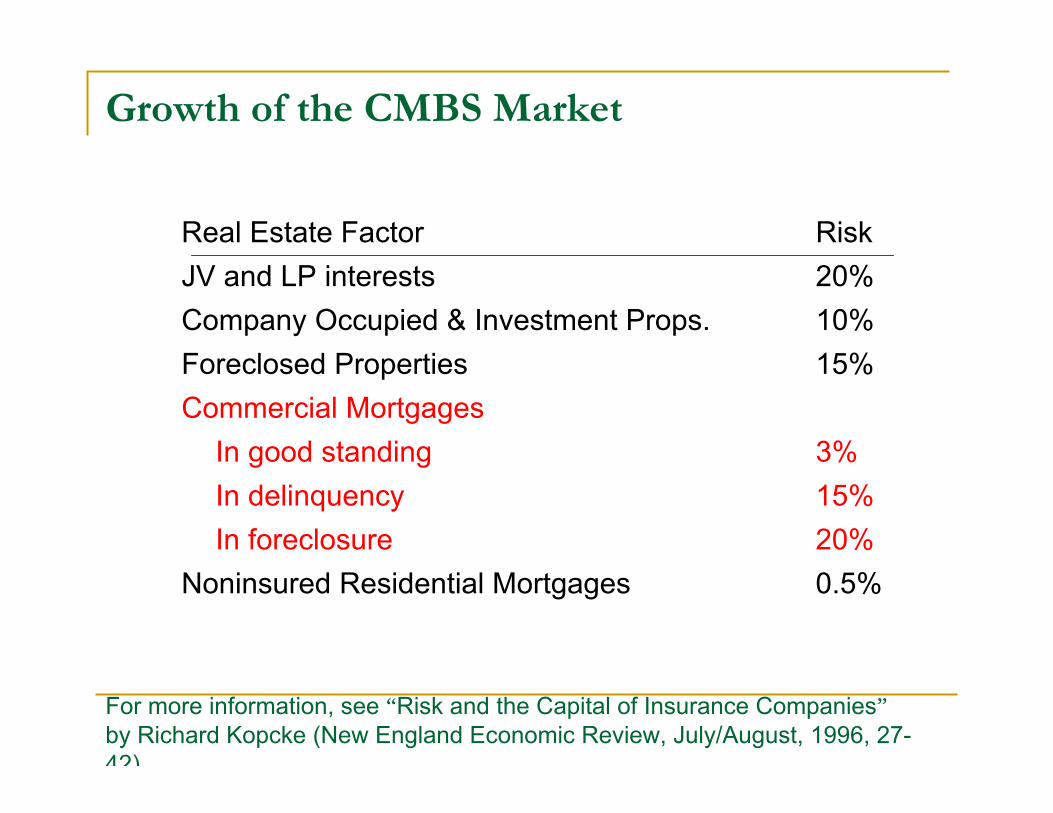
Growth of the CMBS Market
Real Estate Factor Risk JV and LP interests 20%Company Occupied & Investment Props. 10%Foreclosed Properties 15%Commercial Mortgages
In good standing 3%In delinquency 15%In foreclosure 20%
Noninsured Residential Mortgages 0.5%
For more information, see “Risk and the Capital of Insurance Companies”by Richard Kopcke (New England Economic Review, July/August, 1996, 27-42)