Embed Size (px)
Citation preview

Measuring the Agency Costs of Dispersed Ownership:
The Case of Repurchase Initiations
Ruth Gesser*
Rony Halman
Oded Sarig
First draft: February 2005
Current version: Jun 2005
* Gesser is from University of Haifa, Halman is from Tel-Aviv University, and Sarig is from IDC and the
Wharton School. We would like to thank Aharon Ofer, Orly Sade, and seminar participants at University of
Haifa for helpful comments and suggestions.

2
Measuring the Agency Costs of Dispersed Ownership:
The Case of Repurchase Initiations
Abstract
Empirical investigations of the agency costs of dispersed ownership yield mixed results.
A possible explanation for the lack of conclusive evidence is inaccurate measurement of
the extent of the problem. We suggest that the extent of the problem be measured as
theory suggests: by the wealth managers commit to their firms. We examine the relative
performance of the different measures of the agency problem of dispersed ownership in
the context of changes in payout policy affected by repurchase initiations. We find that
the suggested measure – managerial equity wealth – performs better than the other
measures: the proposed measure of the problem explains better than any other measure
the market reaction to repurchase initiations. Our results are robust to several
modifications of the main test.

3
Introduction
Agency problems of dispersed ownership affect multiple corporate decisions: payout
policy, capital structure policy, investment policy etc. Accordingly, there is a vast body
of research that attempts to measure the impact of this problem on payout policies (e.g.,
Lang and Litzenberger 1989), asset diversification (e.g., Denis, Denis, and Sarin 1997),
capital structure (e.g., Berger, Ofek, and Yermack 1997), cash holdings (e.g., Lie 2000)
and more. Yet, the evidence regarding the impact of managerial agency problems on
firm value is mixed. For example, while Lang and Litzenberger (1989) document
significant positive relation between the extent of managerial over-investment and market
reaction to changes in payout policy, Yoon and Starks (1995) do not find the same
relation. Similarly, while Morck, Shliefer, and Vishny (1988) document a U-shaped
relation between managerial fractional ownership of their firm and firm value,
McConnell and Servaes (1990) document an inverted U-shaped relation.
One possible explanation for the lack of empirical support for the theory of agency costs
of dispersed ownership is inaccurate measurement of the extent of this agency problem.
Specifically, theory suggests that managers do not pursue the best interests of
shareholders because managers do not bear the full costs or obtain the full benefits of
their decisions. In the theoretical analysis (e.g., Ross 1973, Jensen and Meckling 1976),
the impact of managerial decisions on their wealth is proportional to the total wealth they
commit to the firm. This wealth impact is offset by costs of under-diversification, effort,
benefits of control etc. In other words, in the theoretical analysis of agency problems of
dispersed ownership, managers who maximize their utility trade off the total impact of
their actions on their wealth with the benefits they derive. Yet, in empirical tests of this
theory, managerial susceptibility to the wealth effects of their actions is not measured by
the total value of their holdings in the firm. Rather, managerial susceptibility is measured
by their proportional holdings in the firm, independent of how much wealth such
holdings represent. In this study, we rectify the measurement problem of prior studies
and measure the agency problem of dispersed ownership as theory suggests – by the total
wealth that managers commit to their firms.

4
Some studies of the impact of the agency problem of dispersed ownership use indirect
measures of the problem, which focus on the consequences of the problem, primarily
Tobin’s Q and various measures of outside shareholder monitoring activity. The use of
indirect measures of the agency problem of dispersed ownership, however, is also
problematic. Consider for example, the use of Tobin’s Q – the ratio of the market value
of a firm to the replacement value of its assets. First, Q, which measures over
investment, is relevant only to the extent that the agency problem of dispersed ownership
manifests itself by over investment. Thus, Q is not suitable to measure agency problems
in firm decisions that are unrelated to over investment – payout policies, capital structure
decisions, etc. Second, the replacement value of firm assets, which is not directly
observable, is approximated by the book value of the firm. The difference between book
values and replacement values, for example due to accounting use of historical costs,
introduces noise. As well, the use of historical accounting data may introduce biases that
are related to firm age if agency costs are higher in mature, large firms than in young,
small firms. Third, the theoretical Q of interest is the marginal Q, while empirically the
observed Q is the average one. The use of the average Q also introduces noise as well as
potential biases, since Q measures additional factors, such as lack of competition in
product markets and availability of investment opportunities, which may be related to
firm decisions. Indeed, empirical studies of the relation between Q and managerial
holdings (e.g., Morck, Shleifer, and Vishny 1988, McConnell and Servaes 1990) show
that Q is not monotonic and noisily related to managerial stock ownership.
Given that prior measures of the agency problem of dispersed ownership are inconsistent
with theory or are noisy and biased, we suggest that the extent of the problem should be
measured as theory suggests. Specifically, managerial exposure to their decisions should
be measured by the wealth they commit to their firm – the dollar value of managerial
holdings in their firm.
Applying the proposed measure, however, is potentially difficult. The reason is that
some managerial holdings are in the form of executive stock options. To incorporate
stock options into this measure, one needs to know the value of the options as well as
their hedge ratios, so that managerial dollar exposure can be calculated. Unfortunately,
such data are not readily available. Nonetheless, using this measure without complete

5
option information may still be superior to the use of fractional holdings for two reasons.
First, the value of stock options, especially when they are out of the money and
multiplied by their hedge ratio, is typically much smaller than the value of the share
holdings (see, for example, Fenn and Liang 2001). This is also true in our sample: for
220 firms in our sample (25.7%) that have option award values in COMPUSTAT
ExuComp dataset, we estimate the fraction of managerial wealth invested in their firm
through options to be about 4% of total wealth committed to the firm by managers. Note
that this number should be multiplied by the options’ hedge ratio to obtain the true wealth
exposure represented by the options. Thus, the fraction of managerial wealth exposed to
firm decisions through options is lower than the estimated 4%. Second, the use of the
fractional holding as a measure of the agency problem suffers from the same data
difficulty. This is because one needs the options’ unknown hedge ratio to properly
compute managerial fractional holdings – percentage stock holdings plus the percentage
option holdings times the options’ hedge ratio.
The results reported in Kole (1995) suggest that the proposed measure of the agency
problem of dispersed ownership is potentially superior to other measures of the problem.
Kole (1995) examines the empirical evidence on the relation between managerial
holdings and Q and suggests that differences across studies in the empirical estimates of
this relation are related to the average firm sizes of the different samples. Firm size is
related to measurement of agency problems of dispersed ownership since it links
managerial fractional ownership to managerial total wealth committed. We interpret
these results to mean that empirical work should follow theory and use managerial total
committed wealth to measure managerial exposure to the wealth impact of their
decisions. As discussed below, we provide empirical illustration to the superiority of this
measure in the case of share repurchases.
Empirical studies of the agency problem of dispersed ownership examine its impact on
payout policy, firm diversification, capital structure, and more. We use the context of
payout policy to examine the relative merits of different measures of the agency problem.
Paying cash to shareholders, through either dividends or repurchases, alleviates the
agency problem by constraining managerial ability to fund activities that are not in the
best interests of shareholders (e.g., Easterbrook 1984, Jensen 1986). This is particularly
6
noticeable in cases of large, lump sum distributions, which is the reason we focus on
share repurchases. Moreover, our focus on payout policy is especially favorable to
finding that Tobin’s Q performs well in measuring managerial exposure to agency
problems. This is because paying out cash inhibits managerial ability to over invest.
Hence, Tobin’s Q, which is an indirect measure of over investment, is better suited to
measure this particular manifestation of the agency problem than other manifestations.
Therefore, by focusing on payout policy we are able to compare of previously used
measures to the suggested measure – managerial equity wealth.
In sum, we compare the measures of the severity of the agency problem of dispersed
ownership that are used in prior studies – managerial fractional share holding and Tobin’s
Q – to the measure that is consistent with theory – managerial equity wealth. As theory
suggests, we expect the agency problem to intensify when managerial equity wealth
decreases and that an increase in shareholder payout reduces the problem. Hence, like
prior empirical studies of payout policies, we expect the price impact of an announcement
of repurchase initiation by firms with small managerial equity wealth to be higher than
that of firms with large managerial equity wealth.
As theory suggest, we find significant negative relation between management equity
wealth and the abnormal return around repurchase initiation announcements in the period
1987-2001. Thus, the smaller is the agency problem of dispersed ownership, the smaller
is market reaction to reductions in firm free cash flows. When we use the measures that
prior research uses – the fractional holdings of management and Tobin’s Q, we do not
find similar significant relations. Furthermore, when we include all three measures of the
extent of managerial agency problems in a single regression, managerial equity wealth is
the only measure that is significantly related to market reactions. We interpret these
results as an indication that managerial equity wealth, which is the measure consistent
with theory, is the appropriate measure of the extent of agency problems of dispersed
ownership. We also find that market reaction to repurchase initiation is smaller for firms
with high media coverage than for firms with low media coverage and that repurchases
done after a large rise in stock prices elicit relatively small market reactions. We
interpret these results to suggest that share repurchases contribute more to the alleviation
of the agency problem of dispersed ownership in firms with relatively high information

7
asymmetry. Lastly, we find that market reaction to repurchase announcements declines
with the dividend yield of the firm, which suggests that share repurchases are relatively
less important when dividends are used to alleviate the problems of free cash flows. Our
results are robust to several modification of the measures used in this study.
The remainder of the paper is organized as follows. In Section I, we present the
methodology. In section II, we describe our data and the empirical results are presented
in Section III. In section IV, we report the results of robustness checks and Section V
concludes.
I. Methodology
As explained above, we examine market reaction to announcements of changes in payout
policies, in particular - unanticipated announcements of share repurchases. As prior
research shows (e.g., Aharony and Swary 1980, Healy and Palepu 1988, Ikenberry,
Lakonishok, and Vermaelen 1995), there is a positive market reaction to announcements
of payout increases or initiations and negative reaction to announcements of payout
decreases or curtailment. The positive market reaction to increased payout can be
attributes to inside information conveyed by such actions or to changes in leverage and
their tax effects, factors for which we control in our tests. Our focus, however, is on the
documented relation between market reaction to changes in payout policy and the
severity of the agency problem of dispersed ownership (e.g., Lang and Litzenberger
1989, Yoon and Stark 1995).
We focus on a particular form of changes in payout - unanticipated share repurchases,
which have become a prominent form of shareholder payout in recent years (e.g. Fama
and French 2001 and Grullon and Michaely 2002). Based on prior research, we expect
that the price impact of an announcement of unanticipated repurchase initiation by firms
with small managerial equity wealth will be higher than that of firms with large
managerial equity wealth. The intuition is that managers are less subject to agency
problems of dispersed ownership when they hold large equity stakes in their firms than
when their equity stake is small.

8
We consider an announcement of a share repurchase to be unanticipated if it is done by a
firm that had no share repurchases in the four years preceding the announcement. We
measure the reaction to announcements of unanticipated share repurchases by the
abnormal return (“AR”) on the three trading days surrounding the announcement: the day
preceding the announcement, the day the announcement was reported, and the following
day. We measure AR as the difference between the stock returns around the
announcement and the concurrent return of the S&P 500 index.
We compare three measures of the severity of the agency problem of dispersed
ownership. The first two measures are those used by prior research: managerial
fractional holdings in the equity of their firm (“%OWN”) and Tobin’s Q (“Q”). The third
measure is the one suggested by theory, but not used heretofore – managerial equity
wealth (“MEW”). %OWN is measured by the number of shares held by management as a
percentage of total shares outstanding at the end of the preceding fiscal year, as reported
in the last proxy statement preceding the repurchase announcement.1 Q is measured by
the market value of equity plus book value of debt divided by the book value of equity
and debt as of the yearend preceding the repurchase announcement. MEW is measured
by the dollar value of shares held by management – %OWN times the market value of the
equity at the end of the month preceding the repurchase announcement.
In our analysis, we control for additional potential determinants of the market reaction to
unanticipated announcements of share repurchases. Specifically, we control for
monitoring by outside shareholders, information asymmetry and market timing, tax
effects, and pre-announcement payout policy.
Large shareholder monitoring is measured by the percentage of the firm’s equity that is
held by block-holders (“BLOCK”). We expect firms with higher percentage of block
holdings to suffer less from agency problems of dispersed ownership (e.g., Shleifer and
Vishny 1986).
We measure the extent of information asymmetry by media coverage and by managerial
incentive to time the market and expect smaller market reaction to repurchase
1 We examine two definitions of “management” that are reported in proxies: “All directors and executive officers” and “CEO”. Since there is little difference in the results, we report the results for “All officers and directors” in the body of the paper and defer the results for the CEO only to the diagnostic checks.

9
announcements when information is less asymmetric than when asymmetry is large.
Media coverage (COVER) is measured by the number of news items in the Dow Jones
Newswire in the year preceding the announcement and is a measure of public interest in
the firm and, hence, an inverse measure of information asymmetry. Because the number
of media items rises significantly over time, media coverage is included in our analysis as
a dummy variable - “ICOVER”. ICOVER takes the value of “1” if the number of media items
is above the median number of reports per firm in the announcement year and “0”
otherwise. Managerial incentive to time the market in repurchase announcements is
measured by the above-market return on the stock in the twelve-month period preceding
the announcement (“TIMING”).
The impact of the differential taxation of dividends and share repurchases is measured by
the ratio of the maximal capital gains tax to the marginal ordinary income tax (“TAX”).
We expect share repurchase announcement made when the tax advantage of share
repurchases over dividends is high to entail a more positive market reaction than share
repurchases done when the tax advantage is low (e.g., Elton and Gruber 1970).
The pre-announcement payout policy of an announcing firm is measured by a dummy
variable (“IDIV”) that takes the value of “1” when the firm paid cash dividends in the year
preceding the announcement and “0” otherwise. Since paying dividends is an alternative
means of alleviating the agency problem of dispersed ownership, we expect smaller
market reactions to repurchase announcements in firms that pay dividends regularly than
in firms that do not.
We compare the three measures of the extent of agency problems of dispersed ownership
- %OWN, Q, and MEW - using cross-sectional regressions of market reaction to
announcements of repurchases on these measures and the control variables. We examine
each measure of the extent of agency problems, both separately and jointly, using the
following regression model equation:
iiDIViiiCOVERiii ITAXTIMINGIBLOCKsMeasureAR εβββββββ +++++++= ,654,3210 )(
where Measure(s)i is either one of the measures of the extent of the agency problems of
dispersed ownership - %OWN, Q, and MEW - or all three measures together.

10
Besides the main analysis, we conduct a number of robustness checks. Among these
tests, we examine our definition of “management”. In our main analysis, we consider all
directors and executive officers as the “management” of the firm and compute MEW and
%OWN for the group as a whole. We check the validity of this definition of management
by re-estimating the regressions with “management” restricted to the CEO (“CEO”). We
also examine several modifications to the control variables, add controls for firm leverage
(“LEVERAGE”), firms size (“SIZE”), and the fraction of the outstanding shares to be
repurchased (“%REP”), and examine variation on the form in which the measures of the
agency problem enter the estimated equation.
II. DATA
Our sample consists of firms that initiated share repurchases in the period of 1985-2001.
We identify potential share repurchases as an increase in the number of treasury stocks
reported in the COMPUSTAT files (data item 87). Note that our selection criterion
excludes repurchases in which the repurchased shares are delivered to managers who
exercise their options as the number of shares outstanding does not change in such cases.
This exclusion is motivated by the confusion of two effects in these cases - a reduction in
cash and an increase in managerial shareholdings, which makes it difficult to interpret
market reactions.
We define a repurchase as an initial repurchase when it is the first repurchase after four
consecutive years with no repurchases. In these cases, we consider the announcement of
the repurchase to be unanticipated. All other repurchases are dropped from our sample.
We further exclude all financial firms (four digit SIC code 6xxx) from our sample.
For each remaining initial repurchase, we search the Dow Jones Newswire (1982 through
1996) and Bloomberg (1997 through 2001) for the initial announcement of the
repurchase, going back up to two years from the repurchase year. We exclude from the
sample all repurchases that are driven by non-cash-management reasons. These include
repurchases of odd-lot holdings and repurchases that are part of a legal process, such as
reorganization, court settlement of claims, fulfillment of contract provisions, etc. We
also exclude repurchases of shares between a parent company and a subsidiary,

11
repurchases of preferred shares, and repurchases from a single identifiable person, all of
which we consider to be driven by non-cash-management reasons. Lastly, we exclude
from our sample all repurchases contaminated by other events. These include
repurchases announced in the month following September 11, 2001 and announcements
of repurchases that are done jointly with earning announcements.2
Our sample of unanticipated, initial announcements of share repurchases consists of 890
announcements in the period 1985-2001. In Table 1, we report the distribution of our
sample of initial repurchase announcements over the sample period. Similar to Fama and
French (2001), Sarig (2004), and others, Table 1 shows that the number of initial
repurchases materially increases since the mid 90’s. Note that this increase in repurchase
initiations follows an increase in stock prices and just precedes the stock price declines of
2000 and 2001. This “reverse timing” sheds doubt on the ability of managers to time the
market in their repurchases and on the market-timing motive for initiating share
repurchases. It suggests that other motives, such as controlling the agency costs of
dispersed ownership, are more important in managerial repurchase decisions.
We collect management holdings of stock in their firms from the last proxy statements
filed before each announcement of an initial share repurchase. These proxy statements
are obtained from the Thomson Financial database (1985-1994) and the Edgar database
(1995-2001). All market values are taken from the CRSP files and all financial
statements data are taken from the COMPUSTAT files.
In table 2, we provide descriptive statistics as well as correlations of the variables we use.
The average abnormal return (AR) to the announcement is 3.14%, which is consistent
with prior findings (e.g., Ikenbery, Lakonishok, and Vermaelen 1995). The average
managerial equity holding (MEW) is about $74 million (median $22 million). This is in
line with Denis, Denis, and Sarin (1997), who document average managerial holdings of
$66 million, and Holderness, Kroszner, and Sheehan (1999), who document an average
value of $73 million. Importantly, these numbers suggest that managerial equity holdings
are a significant component of their wealth and not a small fraction of a diversified
2 Not reported in the paper, we examine the price impact of these repurchase announcements and find significantly different results for them than for the remaining sample.

12
portfolio. Hence, managerial decisions materially affect their personal wealth and,
consequently, their actions, which is the effect we try to capture with MEW as a measure
of the agency problems of dispersed ownership.
The averages of the other variables used in our study are also consistent with those
reported by prior studies. For example, the average percentage holding of management
(%OWN) is 22.4%, which is consistent with Holderness, Kroszner, and Sheehan (1999)
who document average fractional holdings of 21.1%. The average Q is 1.5, which is
consistent with Cho (1998), who documents an average Q of 1.23 for Fortune 500
manufacturing firms in 1991. The average fraction of outstanding shares that is
repurchased (%REP) is about 7%, similar to Ikenbery, Lakonishok, and Vermaelen
(1995) who document an average fractional repurchase of 6.6%.
The average number of news items regarding our sample firms is about 58 per year
(median 20). While we do not break this number to annual averages, we observe that
there is a substantial increase in this number during our sample period. Therefore, to
avoid a bias and to make sure that this variable does not capture time trends, we replace
this variable by a normalized variable – ICOVER. ICOVER is a dummy variable that takes the
value of “1” when the number of news items is above the median number of news items
across all firms in a given year and “0” otherwise.
The average ratio of capital gains tax to ordinary income tax – TAX – is about 58%
(median 50%). The ratio varies quite a bit over time: TAX varies from 40% (i.e., capital
gains tax is only 40% of dividend tax) to 100% (i.e., equal taxation of capital gains and
dividends). Figure 1 shows the annual variation in the relative taxation of capital gains
and dividends.
The correlation matrix does not indicate that any of the variables are too highly correlated
with each other to cause a problem of multi-colinearity. Note that there is a positive
correlation between prior measures of the agency problem of dispersed ownership –
%OWN and Q – and the measure suggested by theory and tested here – MEW. This
correlation, even though it is statistically significant, is far from being close to unity – to
perfect correlation. Thus, firm size does not appear to be homogenously distributed
across the sample. This is in line with Kole’s (1995) findings that some of the

13
differences between studies of the relation of Q and managerial fractional ownership of
firm stock are due to size differences between samples. This also suggests that
measuring the extent of agency problem of dispersed ownership by managerial equity
holdings – MEW – may help uncover the importance of these problems.
III. Empirical Results
In this section, we present the results of our analysis, mainly regarding the relation
between market reactions to announcements of repurchase initiation - AR - and measures
of the extent of agency costs of dispersed ownership. Before getting into these
regressions, however, we report the relations between the measures themselves.
Some of the empirical evidence regarding the impact of managerial share holdings on
firm value concerns the question of whether the relation between value and holdings is
linear, humped, or U shaped. To date, the evidence is based on examining the relation
between fractional stock ownership – %OWN – and Q and yields mixed conclusions. For
example, Morck, Schleifer, and Vishny, show that Q is related to %OWN in a U-shaped
manner while McConnell and Servaes (1990) document a humped relation. We use the
fact that we collect data both about fractional ownership – %OWN – as well as the value
of managerial stock ownership – MEW – to examine their relative ability to explain the
cross sectional distribution of Q and the shape of the relation between Q and managerial
stock ownership.
The correlation coefficients reported in Table 2 suggest that, in our sample, managerial
stock ownership is significantly, positively correlated to Q only when measured by the
value of managerial holdings – MEW. As reported in Table 3, this is also true in the
regression estimates that include quadratic terms. Specifically, Q is insignificantly
related to the fractional ownership of managers in the stock of their firms but is
significantly positively correlated to the value of these holdings. Moreover, the relation
between Q and the value of managerial equity stake appears to be linear and not
quadratic. This is different from prior findings of either a U-shaped or a hump-shaped
relation between Q and managerial fractional equity stake.

14
A possible explanation for the difference between our results and prior results is related
to Kole’s (1995) finding that prior evidence regarding this relation depends on firm size.
To wit, assuming that firm value linearly depends on the value of managerial stock
ownership, a non-linear relation may appear to exist whenever firm size and managerial
fractional stock ownership are correlated in the sample. For example, if managers of
large firms hold smaller equity fractions than managers of small firms, a hump-shaped
relation between Q and fractional managerial stock ownership will emerge since low
percentage, but high value, holdings will be associated with high Q’s.
Next, we examine the relation between market reactions to unanticipated share
repurchase announcements and the three measures of the extent of the agency costs of
dispersed ownership – MEW, %OWN, and Q. In estimating this relation, we control for
block holdings (BLOCK), media coverage of the announcing firm (ICOVER), managerial
incentives to time the market (TIMING), relative taxation of share repurchase and
dividends (TAX), and the use of alternative means to alleviate the agency problem –
payment of dividends (IDIV). The estimated equation is:
iiDIViiiCOVERiii ITAXTIMINGIBLOCKsMeasureAR εβββββββ +++++++= ,654,3210 )(
where Measure(s)i is either one of the measures of the extent of the agency costs of
dispersed ownership – MEW, %OWN, and Q - or all three measures together. Table 4
presents the regression results: Model I with MEW, Model II with %OWN, Model III with
Q, and Model IV with all three measures.
The estimated coefficients of the control variables do not provide support for all of the
postulated reasons for initiating share repurchases. Specifically, BLOCK is
insignificantly related to market reaction to share repurchase announcements in all
models. The insignificant coefficient of BLOCK, which is even in the opposite direction
than expected, suggests that monitoring by large share holders does not reduce the value
of share repurchases as a means to alleviate agency problems of dispersed ownership.
TAX is weakly related to market reactions to share repurchase announcements in two
models and unrelated in two models. Thus, it appears that there is no significantly more
favorable market reaction to repurchase announcements when the relative tax penalty of
dividends is high than when it is low.

15
On the other hand, some postulated determinants of market reaction to repurchase
announcements are significantly present in the data. First, when information asymmetry
is low, as proxied by media coverage of the firm – ICOVER, investor reaction to the
announcements are less positive than when asymmetry is high. Second, the significant
coefficient of TIMING suggests that investors react more favorably to repurchase
announcements that follow declines in stock prices than following rises. This
presumably reflects investor perception that such repurchases reflect insider views that
the shares are undervalued. Lastly, there is a lower market reaction to repurchase
announcements by dividend paying firms than to announcements by non-payers. This is
presumably because dividend payment alleviates the same problem that share repurchases
alleviate.
The main aspect of interest in the regression results of Models I through IV is the
comparison between the three measures of the agency problem of diverse ownership.
The results show the superiority of the measure that is based on the wealth committed by
managers to their firm – MEW – over the measures used by prior research – %OWN and
Q. Specifically, in the separate estimates of Models I through III, MEW is most
significantly correlated to market reactions to repurchase announcements, as seen both in
the t-statistics of the respective coefficients or the R2 of the regressions. Moreover, the
coefficient of %OWN is in the opposite direction to the one predicted by theory, albeit in
an insignificant way. In Model IV, where the three measures are jointly included in the
estimated equation, we find that only the coefficient of MEW is significantly different
from zero and in the predicted direction. The measures used by prior studies lose their
ability to explain market reactions to share repurchase announcements when MEW is
included in the regression. Thus, our results suggest that the extent of the agency
problem of diverse ownership is best measured by the theoretically founded
characteristic: the wealth managers commit to their firm – MEW.
Since some of the empirical evidence regarding the agency costs of diverse ownership
suggests that these relations are not linear, we re-estimate the regression models I, II and
IV with quadratic terms both for %OWN and MEW. The results are given in table 5. We
find these results as supportive of our main hypothesis – that accounting for the total
wealth committed by managers to their firms, through MEW, significantly measures the

16
extent of agency problems of diverse ownership, as theory suggests, and that the
relationship is linear.
IV. Robustness
In this section, we examine the robustness of our results to several modifications of the
main test equation and the definitions of the variables.
In the main empirical examination, we consider all directors and executive officers to be
part of “management” and measure accordingly the wealth they commit to their firms –
MEW – and their fractional holdings – %OWN. This definition implicitly assumes that
all directors and executive officers are involved in the management of their firms. The
data allow us to conduct a robustness test in which we restrict the definition of
“management” to the CEO alone. This modification allows us to examine the possibility
that some of the directors are not involved in actual decision making, which means that
they are not subject to agency problems. Accordingly, we define the fractional holdings
of the CEO as %CEO and the value of the holdings as CEO and re-estimate Models I, II,
and IV with the respective replacements.
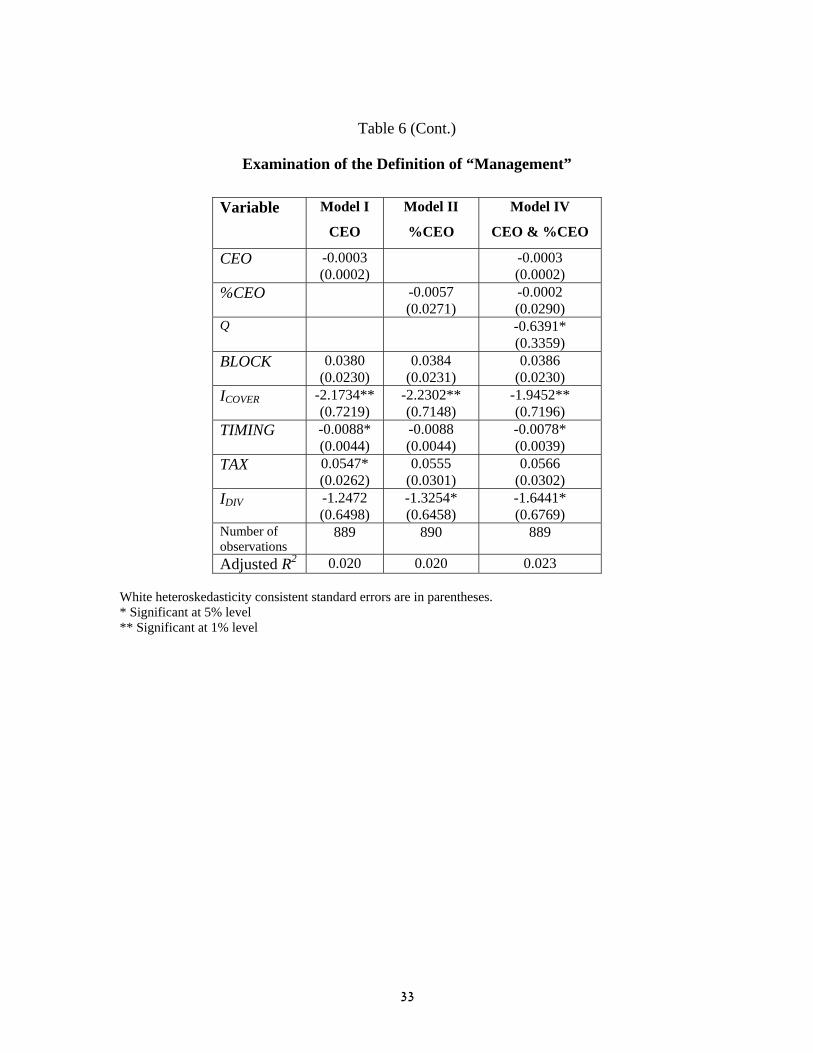
Table 6 presents the estimated coefficients of the redefined Models I, II, and IV. The
coefficients of the control variables are little changed in their point estimates from the
original estimates, albeit the significance of these coefficients does change. More
importantly, when the measurement of managerial equity holdings is restricted to the
CEO alone, its correlation with the market reaction to unexpected repurchase
announcements diminishes and loses its significance in all models. We interpret these
results as suggesting that all members of a firm’s management team – CEO, CFO, etc. –
should be considered when measuring the extent of the agency problem of dispersed
ownership.
Next, we examine the measurement of Q. Similar to prior research, in the main analysis,
we measure Tobin’s Q in a continuous fashion – Q. Theoretical analysis of the agency
problem suggests that an agency problem exists when Q is less than one. Thus, it is
possible that the appropriate way to measure the existence of an agency problem of

17
dispersed ownership is by a dummy variable – IQ<1 – that takes the value of “1” when Q
is less than 1.0 and “0” otherwise. On the other hand, since the book value of assets is a
noisy measure of the replacement cost of the asset, it is possible that a continuous
measure of Q, which is the predominant way of measuring Tobin’s Q in prior research,
indeed better measures the existence of an agency problem. To examine this question,
we re-estimate Models III and IV using IQ<1 instead of Q in the test equation.
Table 7 reports the estimated coefficients for Models III and IV with Q replaced by IQ<1.
Comparing the results in Table 4 to those in Table 7, we see that the coefficients of the
control variables are little changed in their point estimates, albeit the significance of these
coefficients does change. More importantly, we see that IQ<1 is more significantly
correlated with market reaction to announcements of share repurchases than Q. We
interpret this result as indicating that, when measuring the agency problem of dispersed
ownership by its consequence – over-investment, it is the existence of over investment
(indicated by a Q that is less than one) that matters; not the intensity of the over
investment.
Next, we continue to check the robustness of our results by examining different
specifications for the control variables (reported in Table 8) and by including additional
controls (reported in Table 9). Since our main result is that MEW better explains investor
reaction to unanticipated share repurchases, we conduct our robustness checks by
modifying our main test equation – Model IV of Table 4. We carry the same robustness
tests using the regressions with the individual measures – Models I, II, and III, but report
only the results of the overall model since we obtain similar results.
First, we address the measure of information asymmetry. In our main analysis, we use
the variable ICOVER to indicate whether news coverage of a firm is above the median of
media coverage in the same year. In the robustness check, we replace this indicator
variable with the actual number of news items regarding each firm in the year preceding
its repurchase announcement (“NEWS”). The estimated coefficients are reported in the
first column of Table 8. While the coefficients of the other variables are little changed,
we find that NEWS is more significantly correlated with AR than ICOVER. Nonetheless,
since NEWS may capture more than media coverage (e.g., time trends and size

18
differences), we prefer to use ICOVER to measure information asymmetries in an unbiased
manner in pooled time-series and cross-sectional data.
We next address the incentive of management to time the market. In our main analysis,
we find a negative and significant relation between the abnormal return of the firm share
in the year preceding the repurchase initiation announcement – TIMING – and AR. This
relation contradicts explanations of these unanticipated share repurchases as a managerial
attempt to time the market. To verify this result, we replace TIMING with the return of
the S&P500 index in the same period (“S&P”). The difference between these two
measures of market timing is that TIMING measures the performance of the specific firm
while S&P measures the performance of the whole market. Thus, S&P is a weaker
measure of managerial attempt to time the market. We find no significant relation
between S&P and AR, which also implies that repurchases are not motivated by attempts
to time the market as a whole.
Next we examine whether it is the existence of a dividend payout policy that matter or the
extent of dividends paid. In our main analysis, we account for the existence of a dividend
payout policy through a dummy variable – IDIV – that takes the value of “1” when the
firm paid cash dividends in the year preceding the announcement and “0” otherwise. As
a robustness check we replace this variable with the dividend yield (“DIVY”) or the
dividend cash amount (“DIVC”) in the previous year to the announcement. In both cases,
while MEW retain its significance, the coefficient of the dividend measure is
insignificant.
In table 9, we report the impact of including additional control variables, beyond those
we use in our main test equation. Specifically, we include two measures of the
repurchase size: the fraction of the shares repurchased (“%REP”) and as well as an
indicator of whether the repurchased amount is declared in the announcement
(“AMOUNT”). AMOUNT is a dummy variable that takes the value of “1” if the
repurchase announcement indicates the planed size of the repurchase and “0” otherwise.
We find that the inclusion of these additional controls little affects our main results.
Lastly, since leverage may be used as a means to alleviate agency problems of dispersed
ownership, we add a measure of the leverage of the firm (“LEVERAGE”), which is

19
defined as the proportion of total debt to total assets. We find that adding LEVERAGE to
the regression little affects our conclusions and that the coefficient of LEVERAGE itself
is insignificant.
V. Conclusions
Prior empirical studies measure the extent of the agency problem of dispersed ownership
using both direct and indirect measures. The commonly used direct measure of this
agency problem is the fractional holding of management in the equity of their firms. The
commonly used indirect measure of the agency problem is Tobin’s Q. The resulting
empirical evidence regarding the importance of the agency problem of dispersed
ownership is inconclusive.
We argue that theory suggests a more accurate measure of this agency problem.
Specifically, in the theoretical analysis of agency costs of dispersed ownership, utility
maximizing managers trade off the impact of their actions on the wealth they commit to
their firm with the additional effects that their actions impose upon them. Yet, in the
empirical tests of this theory, managerial susceptibility to the wealth effects of their
actions is not measured by the value of their holdings in their firms; rather, it is measured
by the fractional holdings. Thus, we suggest that the agency problem of dispersed
ownership be measured according to theory - by managerial equity wealth.
We empirically illustrate the superiority of this measure in the case of stock repurchase
initiations. Since repurchase initiations reduce the agency problems of dispersed
ownership, we expect that the price effect of announcements of repurchase initiations of
firms with low managerial equity wealth will be stronger than that of firms with high
managerial equity wealth.
We find significant negative relation between managerial equity wealth and the abnormal
return around repurchase initiation announcements in the period 1985-2001. We find
weaker, less significant, results for the measures used by prior research - the fractional
holdings of management and Tobin’s Q. These results are robust to several modifications
of the test equations and to inclusion of several control variables.

20
Reference
Aharony, J. and Swary, I., 1980, “Quarterly Dividend and Earnings Announcements and
Stockholders’ Return: An Empirical Analysis”, Journal of Finance, 35, 1-12.
Baker, G.P, Hall, B.J., 2002, “CEO Incentives and Firm Size”, Harvard Working Paper.
Berger, P.G., Ofek. E., and Yermack, D.L., 1997, “Managerial Entrenchment and Capital
Structure Decisions”, Journal of Finance, 52, 1411-1438.
Cho, M.H., 1998, “Ownership Structure, Investment, and the Corporate Value: An
Empirical Analysis”, Journal of Financial Economics, 47, 103-121.
Denis, D.J., Denis, D.K., and Sarin, A., 1997, “Agency Problems, Equity Ownership, and
Corporate Diversification”, Journal of Finance, 52, 135-160.
Elton, Edwin J. and Martin J. Gruber, 1970, “Marginal Stockholder Tax Rates And The
Clientele Effect,” Review of Economics and Statistics, 52, 68-74.
Fama, F.F., French, K.R., 2001, “Disappearing Dividends: Changing Firm Characteristics
or Lower Propensity to Pay?”, Journal of Financial Economics, 60, 3-43.
Fenn, G. W., and Liang, N., 2001, “???”, Journal of Financial Economics, 60, 45-72.
Grinstein, Y., and Michaely, R., 2002, “Institutional Holdings and Payout Policy”,
Working Paper.
Grullon, G., and Michaely, R., 2002, “Dividends, Share Repurchase and the Substitution
Hypothesis”, Journal of Finance, 57, 1649-1684.

21
Healy, P., and Palepu, K., 1988, “Earning Information Conveyed by Dividend
Initiations”, Journal of Financial Economics, 21, 149-175.
Hermalin, B.E., and Weisbach, M.S., 1991, “The Effects of Board Composition and
Direct Incentives on Firm Performance”, Financial management, 20, 101-112.
Holderness, C,G., Kroszner, R.S., and Sheehan, D.P., 1999, “Were the Good Old Days
That Good? Changes in Managerial Ownership since the Great Depression”,
Journal of Finance, 54, 435-469.
Hoshi, T., Kashyap, A., and Scharfstein, D., 1991, “Corporate Structures, Liquidity, and
Investments: Evidence from Japanese Industrial Groups”, Quarterly Journal of
Economics, 106, 33-60.
Ikenberry, D., Lakonishok, J., and Vermaelen, T., 1995, “Market Underreaction to Open
Market Repurchases,” Journal of Financial Economics, 39, 181-208.
Jensen, M.C., and Meckling, W.H., 1976, “Theory of the Firm: Managerial
Behavior, Agency Costs, and Ownership Structure,” Journal of Financial
Economics, 3, 305-360.
Kaplan, S.N., and Zingales, L., 1995 "Do financing constraints explain why
investment is correlated with cash flow?," NBER working paper series no.
5267.
Kole, S.R., 1995, “Measuring Managerial Equity Ownership: A Comparison of
Sources of Ownership Data”, Journal of Corporate Finance, 1, 413-435.
22
Lang, L., and Litzenberger, R., 1989, “Dividend Announcements: Cash-Flow
Signaling vs. Free Cash Flow Hypothesis?,” Journal of Financial
Economics, 24, 181-191.
La Porta, R., Lopez-de-Silanes, F., Shleifer, A., and Vishny, R.W., 2000,
“Agency Problems and Dividend Policies around the World”, Journal of
Finance, 55, 1-33.
Lie, E., 2000, “Excess Funds and Agency Problems: An Empirical Study of
Incremental Cash Disbursements,” Review of Financial Studies, 13, 219-
248.
McConnell, J.J., and Servaes, H., 1990, “Additional Evidence on Equity
Ownership and Corporate Value”, Journal of Financial Economics, 27,
595-612.
Michaely, R., Thaler, R.H., and Womack K.L., 1995, “Price Reaction to Dividend
Initiations and Omissions: Overreaction or Drift?,” Journal of Finance,
50, 573-608.
Morck, R., Schleifer, A., and Vishny, R.W., 1988, “Management Ownership and Market
Valuation: An Empirical Analysis,” Journal of Financial Economics, 20, 293-
315.
Oswald, D., and Young, S., 2004, “Open Market Share Reacquisitions, Surplus Cash, and
Agency Problems”, Working Paper.
Ross, S.A., 1973, “The Economic Theory of Agency: The Principal’s Problem”,
The American Economic Review, 63, 134-139.

23
Sarig, O., 2004, “A Time-Series Analysis of Corporate Payout Policies”, Review
of Finance, 9, 1-22.
Yoon P.S., and Starks, L.T., 1995, “Signaling, Investment Opportunities, and
Dividend Announcements,” Review of Financial Studies, 8, 995-1018.

24
Table 1
Sample Distribution of Firms that Initiated Repurchase
in the Period 1985-2001
The sample consists of all announcements of initial share repurchase in the period of 1985-2001. We define a repurchase as an initial repurchase if it is the first repurchase after four consecutive years with no repurchases. We exclude all financial firms (four-digit SIC code 6xxx) and all repurchases that are driven by non-cash-management reasons. These include repurchases of odd-lot holdings and repurchases that are part of a legal process. We also exclude repurchases of shares between parent companies and subsidiaries, repurchases of preferred shares, repurchases from a single identifiable person, and all repurchases announced in the month following September 11, 2001. Lastly, we exclude repurchase announcement that are done jointly with earning announcements
Year Number 1985 1 1986 2 1987 8 1988 7 1989 8 1990 9 1991 2 1992 17 1993 33 1994 65 1995 73 1996 64 1997 101 1998 202 1999 141 2000 82 2001 75 Total 890

25
Table 2
Descriptive Statistics
The sample consists of 890 announcements of initial share repurchase in the period of 1985-2001. We define a repurchase as an initial repurchase if it is the first repurchase after four consecutive years with no repurchases. We exclude all financial firms (four-digit SIC code 6xxx) and all repurchases of odd-lot holdings and repurchases that are part of a legal process. We also exclude repurchases of shares between parent companies and subsidiaries, repurchases of preferred shares, repurchases from a single identifiable person, and all repurchases announced in the month following September 11, 2001. Lastly, we exclude repurchase announcement that are done jointly with earning announcements
AR is the stock return less the return on the S&P 500 on the three days surrounding each announcement. %OWN is managerial fractional holdings in the equity of their firm as reported in the last proxy files before each announcement. Q is Tobin’s Q measured by the market value of equity plus book value of debt divided by the book value of equity and debt. MEW is managerial equity wealth measured by %OWN times the price of each stock at the end of the month preceding each announcement (in million dollars). BLOCK is the percentage of equity that is held by BLOCK-holders. COVER is the number of news items in the Dow Jones Newswire in the year preceding the announcement. TIMING is the abnormal return on the stock in the twelve-month period preceding each announcement. TAX is the ratio of the maximal capital gains tax to the marginal ordinary income tax in the announcement year. LEVERAGE is the ratio of long term debt to total assets. %REP is the fraction of the shares repurchased. SIZE is the market value of the equity of the firm (in million dollars)
Mean Median Standard
Deviation Min Max
AR 3.1497 2.3597 10.535 -52.105 53.997 %OWN 22.403 15.800 20.145 0.0000 92.000 Q 1.4997 1.1566 1.2601 0.0441 10.728 MEW 73.901 22.330 202.36 0.0000 3782.4 BLOCK 19.620 15.750 18.944 0.0000 92.900 COVER 56.808 20.000 302.29 0.0000 6280.0 TIMING -13.900 -21.668 78.003 -97.975 1774.6 TAX 58.182 50.500 12.393 40.000 100.00 LEVERAGE 18.989 14.865 18.840 0.0000 106.44 %REP 7.2031 5.5187 6.0040 0.2085 58.763 SIZE 911.69 175.04 3280.1 0.7349 67939

26
Correlation Matrix
AR %OWN Q MEW BLOCK COVER TIMING TAX LEVER- AGE
%REP
%OWN 0.058 Q -0.077 0.011 MEW -0.134 0.131 0.243 BLOCK 0.064 0.025 0.020 -0.012 COVER -0.002 -0.088 0.012 0.128 -0.008 TIMING -0.073 -0.029 0.110 -0.004 -0.068 0.008 TAX 0.024 -0.070 -0.015 -0.026 -0.210 -0.052 0.080 LEVERAGE 0.021 0.005 -0.211 0.037 -0.040 -0.010 -0.040 -0.005 %REP 0.110 -0.022 -0.120 -0.063 0.018 0.006 -0.064 -0.098 0.148SIZE -0.062 -0.197 0.142 0.387 -0.078 0.274 -0.002 0.091 0.044 -0.062

27
Table 3
The Relation between Tobin’s Q and Managerial Stock Ownership
The table reports the relation between Tobin’s Q, the dependent variable, and managerial stock ownership. The estimated regression is:
iiii MMQ ελβα +⋅+⋅+= 2
where M is one of two measures of managerial stock ownership - either %OWN or MEW.
The sample consists of 890 announcements of initial share repurchase in the period of 1985-2001. We define a repurchase as an initial repurchase if it is the first repurchase after four consecutive years with no repurchases. We exclude all financial firms (four-digit SIC code 6xxx) and all repurchases of odd-lot holdings and repurchases that are part of a legal process. We also exclude repurchases of shares between parent companies and subsidiaries, repurchases of preferred shares, repurchases from a single identifiable person, and all repurchases announced in the month following September 11, 2001. Lastly, we exclude repurchase announcement that are done jointly with earning announcements.
%OWN is managerial fractional holdings in the equity of their firm as reported in the last proxy files before each announcement. MEW is managerial equity wealth measured by %OWN times the price of each stock at the end of the month preceding each announcement (in million dollars).
Explanatory
variable α β λ Adjusted
R2
%OWN 1.390**
(0.081)
1.263
(0.681)
-1.907
(1.037)
0.002
MEW 1.369**
(0.046)
1.875**
(0.578)
-0.162
(0.213)
0.058
White heteroskedasticity consistent standard errors are in parentheses. * Significant at 5% level ** Significant at 1% level

28
Table 4
Market Reaction to Share Repurchases and Agency Problems
The table presents cross-sectional regressions of the abnormal return around 890 repurchase initiation announcements. The sample consists of all announcements of initial share repurchase in the period of 1985-2001. We define a repurchase as an initial repurchase if it is the first repurchase after four consecutive years with no repurchases. We exclude all financial firms (four-digit SIC code 6xxx) and all repurchases of odd-lot holdings and repurchases that are part of a legal process. We also exclude repurchases of shares between parent companies and subsidiaries, repurchases of preferred shares, repurchases from a single identifiable person, and all repurchases announced in the month following September 11, 2001. Lastly, we exclude repurchase announcement that are done jointly with earning announcements.
The dependent variable is AR, the stock return on the three days surrounding each announcement less the concurrent return on the S&P 500. %OWN is managerial fractional holdings in the equity of their firm as reported in the last proxy files before each announcement. Q is Tobin’s Q, which is measured by the market value of equity plus book value of debt divided by the book value of equity and debt. MEW is managerial equity wealth measured by %OWN times the price of each stock at the end of the month preceding each announcement (in million dollars). BLOCK is the percentage of equity that is held by block-holders. ICOVER is a dummy variable that takes the value “1” when the firm has media coverage above the median coverage in the year of each announcement and “0” otherwise. TIMING is the abnormal return on the stock in the twelve-month period preceding each announcement. TAX is the ratio of the maximal capital gains tax to the marginal ordinary income tax in the announcement year.
The estimated equation is: iiDIViiiCOVERiii ITAXTIMINGIBLOCKsMeasureAR εβββββββ +++++++= ,654,3210 )(
where Measure(s)i is either one of the measures of the extent of the agency costs of dispersed ownership – %OWN, Q, and MEW – or all three measures together.

29
Table 4 (Cont.)
Market Reaction to Share Repurchases and Agency Problems
Variable Expected Sign
Model I Model II Model III Model IV
MEW - -0.0061** (0.0009)
-0.0059** (0.0010)
%OWN - 0.0094 (0.0182)
0.0202 (0.0184)
Q - -0.6360* (0.3355)
-0.3995 (0.3233)
BLOCK - 0.0375 (0.0227)
0.0389 (0.0228)
0.0397 (0.0228)
0.0377 (0.0226)
ICOVER - -1.8532* (0.7207)
-2.1510** (0.7317)
-2.0055** (0.7119)
-1.5569* (0.7409)
TIMING + -0.0090* (0.0045)
-0.0088* (0.0044)
-0.0078* (0.0039)
-0.0083* (0.0041)
TAX - 0.0486 (0.0259)
0.0520* (0.0259)
0.0536* (0.0261)
0.0499 (0.0260)
IDIV - -1.3592* (0.6416)
-1.2285 (0.6537)
-1.7328* (0.6723)
-1.3845* (0.6787)
Adjusted R2 0.034 0.020 0.025 0.035 White heteroskedasticity consistent standard errors are in parentheses. * Significant at 5% level ** Significant at 1% level
30
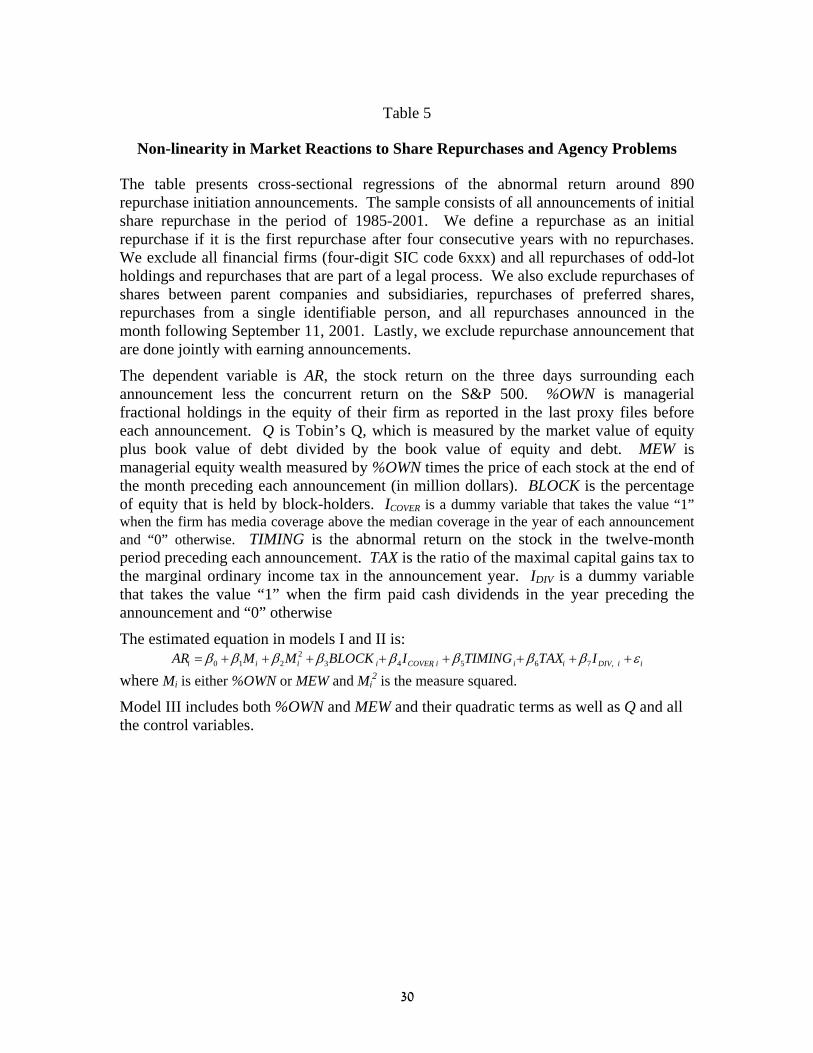
Table 5
Non-linearity in Market Reactions to Share Repurchases and Agency Problems
The table presents cross-sectional regressions of the abnormal return around 890 repurchase initiation announcements. The sample consists of all announcements of initial share repurchase in the period of 1985-2001. We define a repurchase as an initial repurchase if it is the first repurchase after four consecutive years with no repurchases. We exclude all financial firms (four-digit SIC code 6xxx) and all repurchases of odd-lot holdings and repurchases that are part of a legal process. We also exclude repurchases of shares between parent companies and subsidiaries, repurchases of preferred shares, repurchases from a single identifiable person, and all repurchases announced in the month following September 11, 2001. Lastly, we exclude repurchase announcement that are done jointly with earning announcements.
The dependent variable is AR, the stock return on the three days surrounding each announcement less the concurrent return on the S&P 500. %OWN is managerial fractional holdings in the equity of their firm as reported in the last proxy files before each announcement. Q is Tobin’s Q, which is measured by the market value of equity plus book value of debt divided by the book value of equity and debt. MEW is managerial equity wealth measured by %OWN times the price of each stock at the end of the month preceding each announcement (in million dollars). BLOCK is the percentage of equity that is held by block-holders. ICOVER is a dummy variable that takes the value “1” when the firm has media coverage above the median coverage in the year of each announcement and “0” otherwise. TIMING is the abnormal return on the stock in the twelve-month period preceding each announcement. TAX is the ratio of the maximal capital gains tax to the marginal ordinary income tax in the announcement year. IDIV is a dummy variable that takes the value “1” when the firm paid cash dividends in the year preceding the announcement and “0” otherwise
The estimated equation in models I and II is: iiDIViiiCOVERiiii ITAXTIMINGIBLOCKMMAR εββββββββ ++++++++= ,765,43
2210
where Mi is either %OWN or MEW and Mi2 is the measure squared.
Model III includes both %OWN and MEW and their quadratic terms as well as Q and all the control variables.

31
Table 5 (Cont.)
Non-linearity in Market Reactions to Share Repurchases and Agency Problems
Variable Expected Sign
Model I Squared
Model II Squared
Model IV Squared
MEW - -0.0071** (0.0023)
-0.0077** (0.0025)
MEW 2 0.0000 (0.0000)
0.0000 (0.0000)
%OWN - 0.0904 (0.0572)
0.1151* (0.0577)
%OWN 2 -0.0012 (0.0009)
-0.0014 (0.0009)
Q - -0.4049 (0.3219)
BLOCK - 0.0371 (0.0228)
0.0385 (0.0227)
0.0366 (0.0226)
ICOVER - -1.8273* (0.7260)
-2.0980** (0.7350)
-1.4198 (0.7558)
TIMING + -0.0090* (0.0044)
-0.0089* (0.0044)
-0.0084* (0.0040)
TAX - 0.0484 (0.0259)
0.0523* (0.0257)
0.0499 (0.0259)
IDIV - -1.3486* (0.6428)
-1.0541 (0.6399)
-1.1431 (0.6704)
Adjusted R2 0.033 0.021 0.036 White heteroskedasticity consistent standard errors are in parentheses. * Significant at 5% level ** Significant at 1% level

32
Table 6
Examination of the Definition of “Management”
The table presents cross-sectional regressions of abnormal returns around repurchase initiation announcements. The sample consists of all announcements of initial share repurchase in the period of 1985-2001. We define a repurchase as an initial repurchase if it is the first repurchase after four consecutive years with no repurchases. We exclude all financial firms (four-digit SIC code 6xxx) and all repurchases of odd-lot holdings and repurchases that are part of a legal process. We also exclude repurchases of shares between parent companies and subsidiaries, repurchases of preferred shares, repurchases from a single identifiable person, and all repurchases announced in the month following September 11, 2001. Lastly, we exclude repurchase announcement that are done jointly with earning announcements.
The dependent variable is AR, the stock return on the three days surrounding each announcement less the concurrent return on the S&P 500. CEO is the CEO equity wealth. %CEO is the fractional holdings of the CEO. BLOCK is the percentage of equity that is held by block-holders. ICOVER is a dummy variable that takes the value “1” when the firm has media coverage above the median coverage in the year of each announcement and “0” otherwise. TIMING is the abnormal return on the stock in the twelve-month period preceding each announcement. TAX is the ratio of the maximal capital gains tax to the marginal ordinary income tax in the announcement year. IDIV is a dummy variable that takes the value “1” when the firm paid cash dividends in the year preceding the announcement and “0” otherwise.
The estimated equation is: iiDIViiiCOVERiii ITAXTIMINGIBLOCKsMeasureAR εβββββββ +++++++= ,654,3210 )(
where Measure(s)i is either one of the measures of the extent of the agency costs of dispersed ownership: CEO or %CEO.
33
Table 6 (Cont.)
Examination of the Definition of “Management”
Variable Model I
CEO
Model II
%CEO
Model IV
CEO & %CEO
CEO -0.0003 (0.0002)
-0.0003 (0.0002)
%CEO -0.0057 (0.0271)
-0.0002 (0.0290)
Q
-0.6391* (0.3359)
BLOCK 0.0380 (0.0230)
0.0384 (0.0231)
0.0386 (0.0230)
ICOVER -2.1734** (0.7219)
-2.2302** (0.7148)
-1.9452** (0.7196)
TIMING -0.0088* (0.0044)
-0.0088 (0.0044)
-0.0078* (0.0039)
TAX 0.0547* (0.0262)
0.0555 (0.0301)
0.0566 (0.0302)
IDIV -1.2472 (0.6498)
-1.3254* (0.6458)
-1.6441* (0.6769)
Number of observations
889 890 889
Adjusted R2 0.020 0.020 0.023 White heteroskedasticity consistent standard errors are in parentheses. * Significant at 5% level ** Significant at 1% level

34
Table 7
Examination of the Measurement of Q
The table presents cross-sectional regressions of the abnormal return around repurchase initiation announcements. The sample consists of all announcements of initial share repurchase in the period of 1985-2001. We define a repurchase as an initial repurchase if it is the first repurchase after four consecutive years with no repurchases. We exclude all financial firms (four-digit SIC code 6xxx) and all repurchases of odd-lot holdings and repurchases that are part of a legal process. We also exclude repurchases of shares between parent companies and subsidiaries, repurchases of preferred shares, repurchases from a single identifiable person, and all repurchases announced in the month following September 11, 2001. Lastly, we exclude repurchase announcement that are done jointly with earning announcements. The dependent variable is AR, the stock return on the three days surrounding each announcement less the concurrent return on the S&P 500. IQ<1 is a dummy variable that takes the value of “1” when Q is less than 1.0 and “0” otherwise. %OWN is managerial fractional holdings in the equity of their firm as reported in the last proxy files before each announcement. MEW is managerial equity wealth measured by %OWN times the number of shares outstanding times the price of each stock at the end of the month preceding each announcement (in million dollars). BLOCK is the percentage of equity that is held by block-holders. ICOVER is a dummy variable that takes the value “1” when the firm has media coverage above the median coverage in the year of each announcement and “0” otherwise. TIMING is the abnormal return on the stock in the twelve-month period preceding each announcement. TAX is the ratio of the maximal capital gains tax to the marginal ordinary income tax in the announcement year. IDIV is a dummy variable that takes the value “1” when the firm paid cash dividends in the year preceding the announcement and “0” otherwise. The estimated equation is
iiDIViiiCOVERiii ITAXTIMINGIBLOCKsMeasureAR εβββββββ +++++++= ,654,3210 )(
where, Measure(s) is IQ<1 in model III and all three measure of the agency costs of dispersed ownership – %OWN, IQ<1, and MEW – together in model IV.

35
Table 7 (Cont.)
Examination of the Measurement of Q
Variable Model III
IQ<1
Model IV
IQ<1
MEW -0.0060** (0.0009)
%OWN 0.0204 (0.0183)
IQ<1 1.8217* (0.7322)
1.4828* (0.7362)
BLOCK 0.0372 (0.0226)
0.0358 (0.0225)
ICOVER -1.9903** (0.7176)
-1.4938* (0.7436)
TIMING -0.0079 (0.0042)
-0.0082 (0.0042)
TAX 0.0537* (0.0258)
0.0502 (0.0259)
IDIV -1.7554** (0.6711)
-1.4753* (0.6670)
Adjusted R2 0.027 0.037 White heteroskedasticity consistent standard errors are in parentheses. * Significant at 5% level ** Significant at 1% level

36
Table 8
Modified Control Variables
The table presents cross-sectional regressions of the abnormal return around repurchase initiation announcements. The sample consists of all announcements of initial share repurchase in the period of 1985-2001. We define a repurchase as an initial repurchase if it is the first repurchase after four consecutive years with no repurchases. We exclude all financial firms (four digit SIC code 6xxx) and all repurchases of odd-lot holdings and repurchases that are part of a legal process. We also exclude repurchases of shares between parent companies and subsidiaries, repurchases of preferred shares, repurchases from a single identifiable person, and all repurchases announced in the month following September 11, 2001. Lastly, we exclude repurchase announcement that are done jointly with earning announcements. The dependent variable is AR, the stock return on the three days surrounding each announcement less the concurrent return on the S&P 500. %OWN is managerial fractional holdings in the equity of their firm as reported in the last proxy files before each announcement. Q is Tobin’s Q, which is measured by the market value of equity plus book value of debt divided by the book value of equity and debt. MEW is managerial equity wealth measured by %OWN times the number of shares outstanding times the price of each stock at the end of the month preceding each announcement (in million dollars). BLOCK is the percentage of equity that is held by block-holders. ICOVER is a dummy variable that takes the value “1” when the firm has media coverage above the median coverage in the year of each announcement and “0” otherwise. TIMING is the abnormal return on the stock in the twelve-month period preceding each announcement. TAX is the ratio of the maximal capital gains tax to the marginal ordinary income tax in the announcement year. IDIV is a dummy variable that takes the value “1” when the firm paid cash dividends in the year preceding the announcement and “0” otherwise. NEWS is the actual number of news items. S&P is the return of the S&P500 index in the year preceding the repurchase initiation announcement. DIVY is the dividend yield. DIVC is the dividend cash amount. The estimated equation is:
iiji
jiiii ControlQOWNMEWAR εβββββ +++++= ∑ ,3210 %
Where Control j, i are the control variables specified above.

37
Table 8 (Cont.)
Modified Control Variables
Modified Control
News coverage
Market timing
Dividend payment
Dividend payment
MEW -0.0067** (0.0010)
-0.0058** (0.0009)
-0.0061** (0.0010)
-0.0066** (0.0010)
%OWN
0.0309 (0.0180)
0.0204 (0.0184)
0.0280 (0.0180)
0.0288 (0.0186)
Q
-0.4503 (0.3214)
-0.4612 (0.3271)
-0.2893 (0.3103)
-0.3159 (0.3207)
BLOCK 0.0367 (0.0228)
0.0399 (0.0226)
0.0381 (0.0228)
0.0398 (0.0231)
ICOVER -1.6265* (0.7400)
-1.7152* (0.7352)
-1.9630* (0.7631)
TIMING -0.0088* (0.0041)
-0.0084 (0.0043)
-0.0082 (0.0042)
TAX 0.0511 (0.0262)
0.0470 (0.0268)
0.0398 (0.0254)
0.0425 (0.0263)
IDIV -1.5773* (0.6736)
-1.4026* (0.6867)
NEWS 0.0008** (0.0002)
S&P 0.0034 (0.0269)
DIVY 0.0005 (0.0005)
DIVC 0.0001 (0.0010)
Number of observations
890 890 890 856
Adjusted R2 0.031 0.031 0.032 0.036 White heteroskedasticity consistent standard errors are in parentheses. * Significant at 5% level ** Significant at 1% level

38
Table 9
Additional Control Variables
The table presents cross-sectional regressions of the abnormal return around repurchase initiation announcements. The sample consists of all announcements of initial share repurchase in the period of 1985-2001. We define a repurchase as an initial repurchase if it is the first repurchase after four consecutive years with no repurchases. We exclude all financial firms (four digit SIC code 6xxx) and all repurchases of odd-lot holdings and repurchases that are part of a legal process. We also exclude repurchases of shares between parent companies and subsidiaries, repurchases of preferred shares, repurchases from a single identifiable person, and all repurchases announced in the month following September 11, 2001. Lastly, we exclude repurchase announcement that are done jointly with earning announcements. The dependent variable is AR, the stock return on the three days surrounding each announcement less the concurrent return on the S&P 500. %OWN is managerial fractional holdings in the equity of their firm as reported in the last proxy files before each announcement. Q is Tobin’s Q, which is measured by the market value of equity plus book value of debt divided by the book value of equity and debt. MEW is managerial equity wealth measured by %OWN times the number of shares outstanding times the price of each stock at the end of the month preceding each announcement (in million dollars). BLOCK is the percentage of equity that is held by block-holders. ICOVER is a dummy variable that takes the value “1” when the firm has media coverage above the median coverage in the year of each announcement and “0” otherwise. TIMING is the abnormal return on the stock in the twelve-month period preceding each announcement. TAX is the ratio of the maximal capital gains tax to the marginal ordinary income tax in the announcement year. IDIV is a dummy variable that takes the value “1” when the firm paid cash dividends in the year preceding the announcement and “0” otherwise. %REP is the percentage of equity that is declared to be repurchased at the repurchase announcement. AMOUNT is a dummy variable that takes the value “1” when the percentage of equity to be repurchase is declared at the repurchase announcement and “0” otherwise. LEVERAGE is the proportion of the total debt to total assets. The estimated equation is:
iiji
jiiii ControlQOWNMEWAR εβββββ +++++= ∑ ,3210 %
Where Control j, i are the control variables specified above.

39
Table 9 (Cont.)
Additional Control Variables
Variable Adding %REP
Adding AMOUNT
Adding LEVERAGE
MEW -0.0050** (0.0015)
-0.0058** (0.0009)
-0.0060** (0.0010)
%OWN
0.0104 (0.0214)
0.0198 (0.0184)
0.0195 (0.0183)
Q
-0.5480 (0.3563)
-0.4031 (0.3279)
-0.3466 (0.3281)
BLOCK 0.0397 (0.0259)
0.0389 (0.0227)
0.0384 (0.0227)
ICOVER -1.9266* (0.8563)
-1.6511* (0.7439)
-1.5929* (0.7481)
TIMING -0.0069 (0.0036)
-0.0081* (0.0040)
-0.0082* (0.0041)
TAX 0.0704* (0.0283)
0.0447 (0.0262)
0.0508 (0.0261)
IDIV -1.8661* (0.7366)
-1.3797* (0.6754)
-1.4595* (0.6830)
%REP 0.1936* (0.0959)
AMOUNT 1.4962 (0.8177)
LEVERAGE 0.0166 (0.0227)
Number of observations
749 890 890
Adjusted R2 0.043 0.037 0.035 White heteroskedasticity consistent standard errors are in parentheses. * Significant at 5% level ** Significant at 1% level

40
Figure 1
Relative Tax Rates
The graph presents the relative tax rates on capital gains and on ordinary income in the
period 1985-2001. The relative tax rate is computed as follow:
Tax Rate IncomeOrdinary Tax Rate Gains Capital
=TAX
The tax rates are for the highest income bracket.
Relative Tax
0%
20%
40%
60%
80%
100%
120%
1984 1986 1988 1990 1992 1994 1996 1998 2000 2002