Embed Size (px)
Citation preview
Agenda: more bad particles
• Secondary aerosols– Biogenic example – alpha pinene– Anthropogenic example – SOx and NOx
• Particle control technologies– Brief overview of the rules– Overview of the technologies– What to use for what type of particles
• Basic design strategies• Cyclones
ATTACK OF THE KILLER TREES
-pinene and contributions to ambient secondary organic aerosol
in Maryland
Sheryl Ehrman, Rich Calabrese, Yu Jin Choi, Anu Nadarajan (M.S., January 2002)

ATTACK OF THE KILLER TREES
-pinene and contributions to ambient secondary organic aerosol
in Maryland
Motivation
• Presence of high concentrations of ambient aerosols has many adverse effects: – Haze, building and plant damage, illness, death
• Implementation of effective controls requires knowledge of what to control
• Biogenic emissions (that we can’t control – unless we chop down all plants) have long been known to be precursors to organic aerosol
• Because aerosols are not directly emitted, new acronym - secondary organic aerosol = SOA
Objective
• Preliminary study of formation of SOA from biogenic emissions
• Estimate contribution of an important compound, -pinene, to SOA formation
• Explore relationships between variables such as emission rate, temperature, time, on SOA formation from -pinene
• Explore sensitivity of SOA formation from -pinene to changes in model parameters.
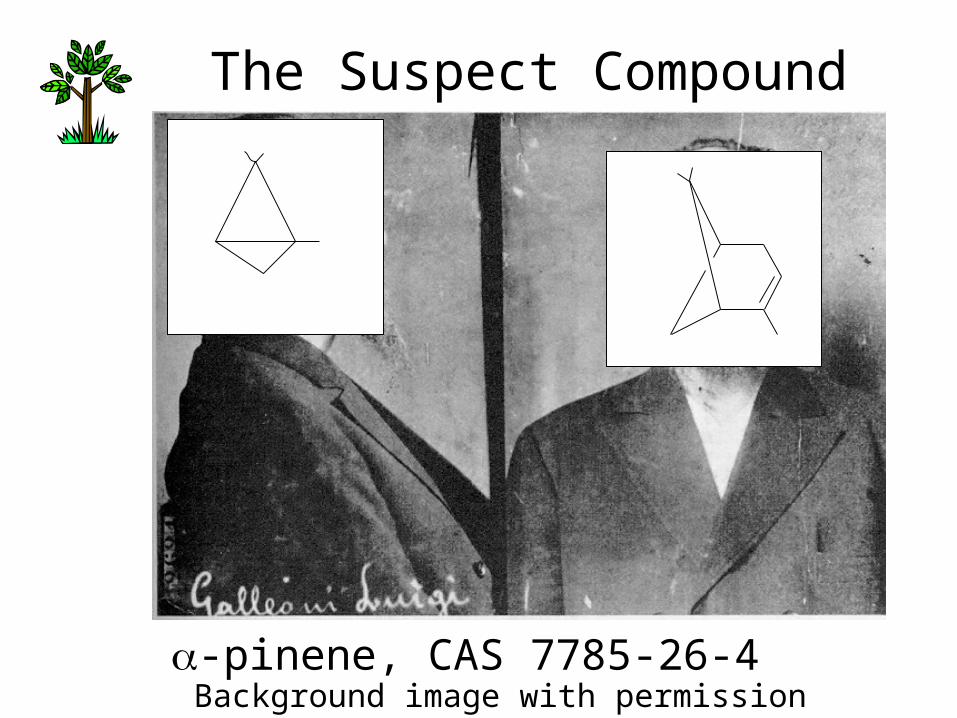
-pinene, CAS 7785-26-4 Background image with permission
The Suspect Compound
Plan of Attack – long term
• Develop comprehensive model of SOA formation from biogenic and anthropogenic compounds
• Evaluate/improve model via comparisons with experiments in smog chambers
• Evaluate model/improve model with field data
• Use results to develop effective controls to reduce SOA concentrations
What we need
• Emissions information for all compounds of interest
• Detailed chemical mechanism for SOA formation, including gas-to-particle conversion and partitioning between gas/particle phases for semivolatiles
• Information about loss rates• Meteorology/transport
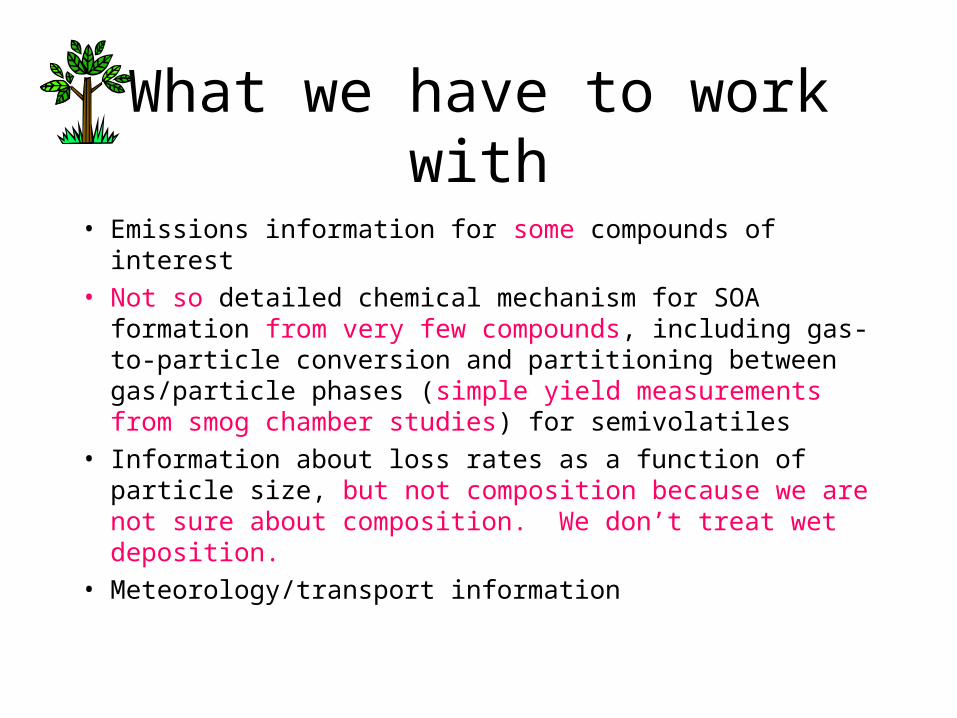
What we have to work with
• Emissions information for some compounds of interest
• Not so detailed chemical mechanism for SOA formation from very few compounds, including gas-to-particle conversion and partitioning between gas/particle phases (simple yield measurements from smog chamber studies) for semivolatiles
• Information about loss rates as a function of particle size, but not composition because we are not sure about composition. We don’t treat wet deposition.
• Meteorology/transport information
What we did with it
• “Knowledge adds, wisdom lets slide”- Paul Westerberg
• We kept it simple and started with a box model– Simple chemistry, simple treatment of gas-to-particle
conversion, simple loss
• Previous studies – steady state, yet haze episodes fortunately do not reach steady state!
• We learned some interesting things from our dynamic study
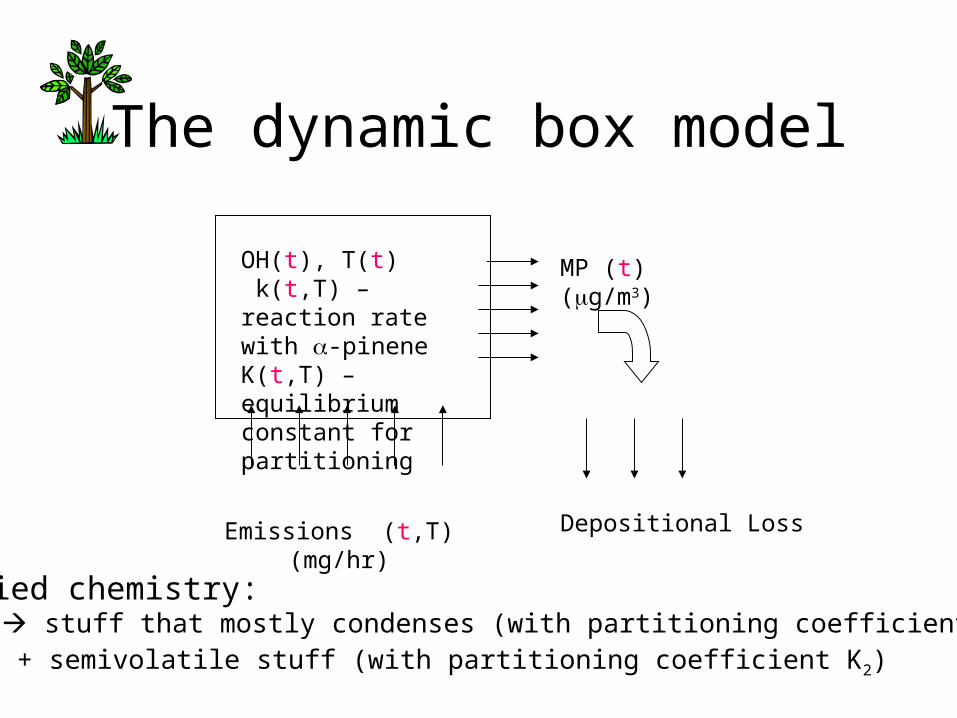
The dynamic box model
Emissions (t,T) (mg/hr) Depositional Loss
MP (t) (g/m3)OH(t), T(t) k(t,T) – reaction rate with -pinene K(t,T) – equilibrium constant for partitioning
Simplified chemistry: -pinene stuff that mostly condenses (with partitioning coefficient K1) + semivolatile stuff (with partitioning coefficient K2)

More details about the box
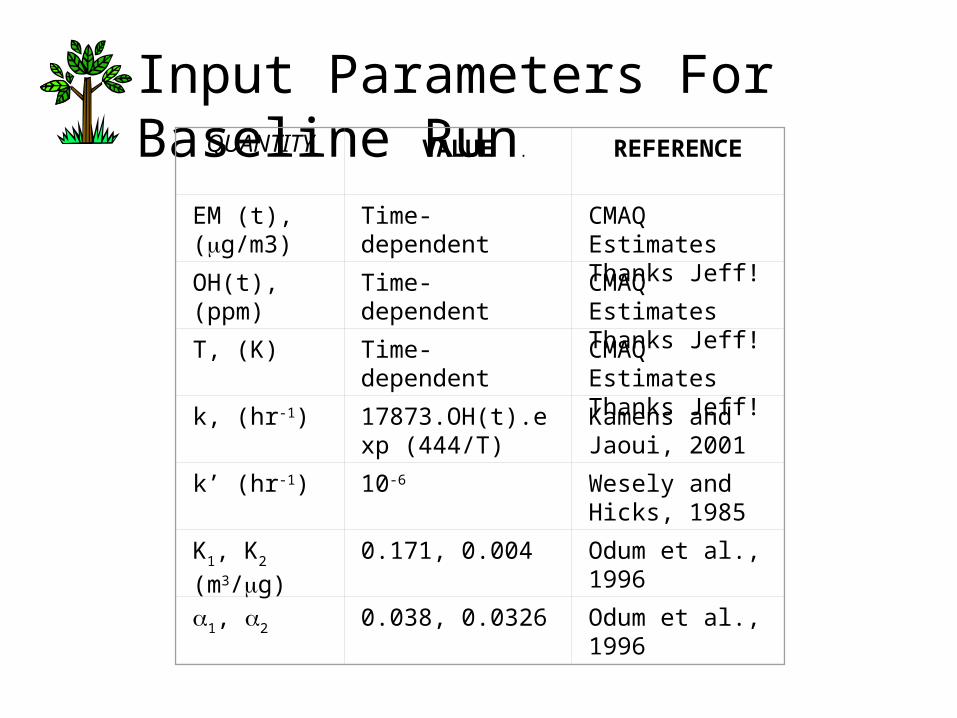
Input Parameters For Baseline Run .
QUANTITY VALUE REFERENCE
EM (t), (g/m3)
Time-dependent CMAQ EstimatesThanks Jeff!
OH(t), (ppm) Time-dependent CMAQ EstimatesThanks Jeff!
T, (K) Time-dependent CMAQ EstimatesThanks Jeff!
k, (hr-1) 17873.OH(t).exp (444/T)
Kamens and Jaoui, 2001
k’ (hr-1) 10-6 Wesely and Hicks, 1985
K1, K2
(m3/g)
0.171, 0.004 Odum et al., 1996
1, 2 0.038, 0.0326 Odum et al., 1996
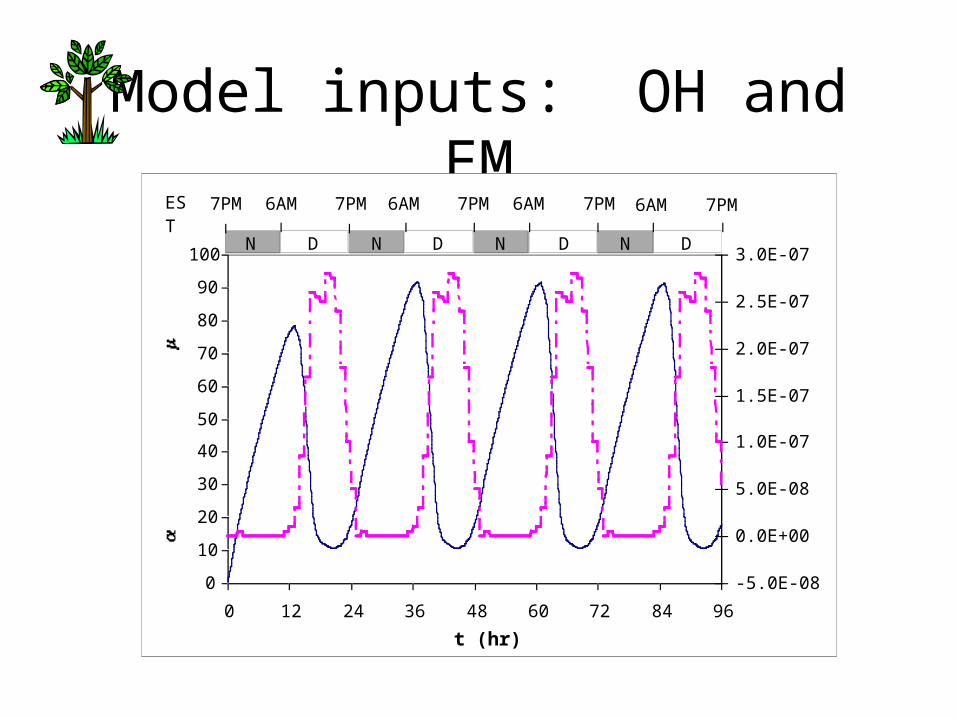
Model inputs: OH and EM
0
10
20
30
40
50
60
70
80
90
100
0 12 24 36 48 60 72 84 96
t (hr)
-pinene concentration (
g/m
3 )
-5.0E-08
0.0E+00
5.0E-08
1.0E-07
1.5E-07
2.0E-07
2.5E-07
3.0E-07
OH Concentration (ppm)
D DDDN NNN
6AM 6AM6AM6AM7PM 7PM7PM 7PM 7PMEST
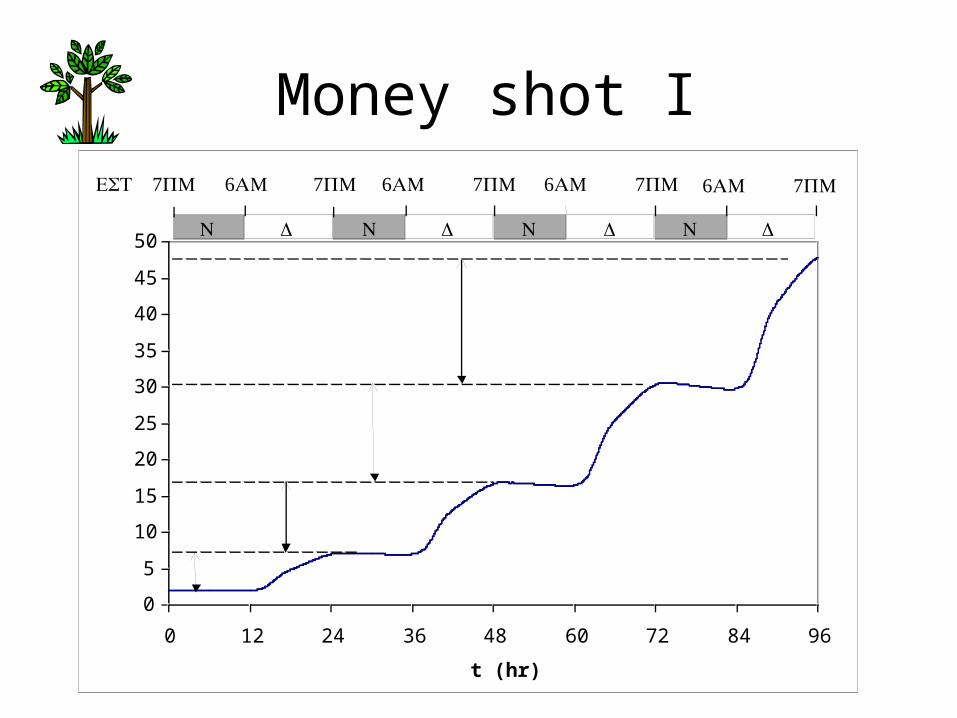
Money shot I
0
5
10
15
20
25
30
35
40
45
50
0 12 24 36 48 60 72 84 96
t (hr)
SOA concentration (
/g m
3 )
D DDDN NNN
6AM 6AM6AM6AM7PM 7PM7PM 7PM 7PMEST
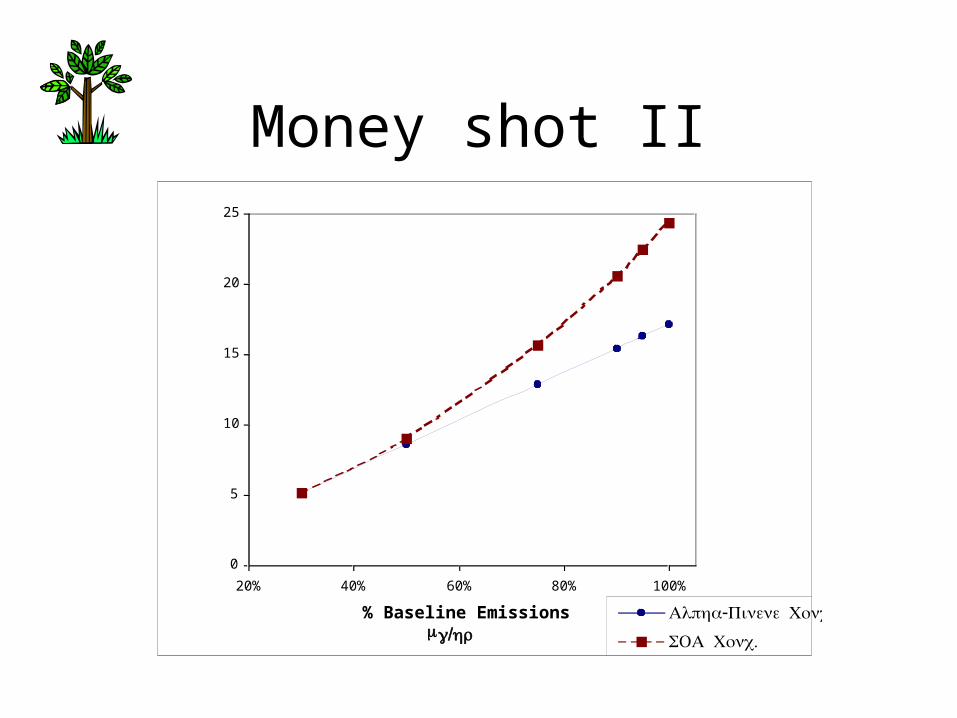
Money shot II
0
5
10
15
20
25
20% 40% 60% 80% 100%
% Baseline Emissions /g hr
(Concentration
/g m
3 )
- .Alpha Pinene Conc
.SOA Conc
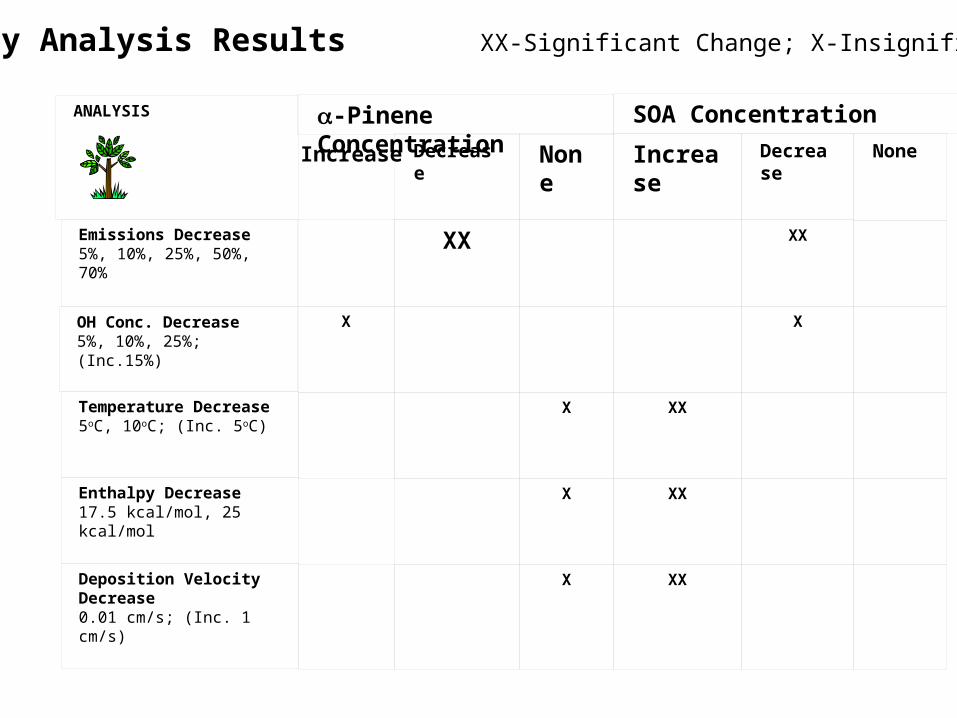
ANALYSIS -Pinene Concentration SOA Concentration
Decrease None Increase
XX
X
X XX
X XX
Emissions Decrease5%, 10%, 25%, 50%, 70%
OH Conc. Decrease5%, 10%, 25%; (Inc.15%)
Temperature Decrease5oC, 10oC; (Inc. 5oC)
Enthalpy Decrease17.5 kcal/mol, 25 kcal/mol
Deposition Velocity Decrease0.01 cm/s; (Inc. 1 cm/s)
X XX
Decrease
XX
X
None
Sensitivity Analysis Results XX-Significant Change; X-Insignificant Change.
Increase
Conclusions from our study
• SOA from -pinene appears to form quickly• Snowball sort of effect (non linear with time)• Also, non linear with emissions!• When temperature decreases, haze from -pinene
increases– Bit counterintuitive, but chem rxn rate to form SOA
decreasing doesn’t beat more semivolatiles condensing
• Need for high time resolution measurements of SOA and of -pinene is clear (ongoing with new students and with collaborations elsewhere)
What we can’t conclude from our study
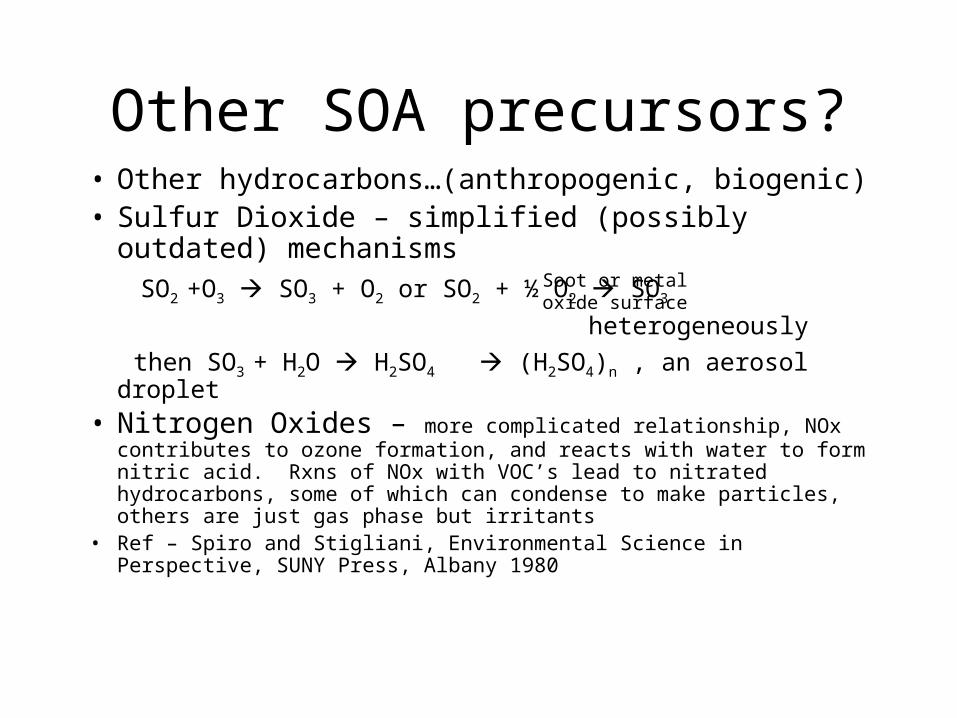
Other SOA precursors?• Other hydrocarbons…(anthropogenic, biogenic)• Sulfur Dioxide – simplified (possibly outdated)
mechanisms SO2 +O3 SO3 + O2 or SO2 + ½ O2 SO3
heterogeneously
then SO3 + H2O H2SO4 (H2SO4)n , an aerosol droplet
• Nitrogen Oxides – more complicated relationship, NOx contributes to ozone formation, and reacts with water to form nitric acid. Rxns of NOx with VOC’s lead to nitrated hydrocarbons, some of which can condense to make particles, others are just gas phase but irritants
• Ref – Spiro and Stigliani, Environmental Science in Perspective, SUNY Press, Albany 1980
Soot or metal oxide surface
Brief history of air regulation• Pre 1955 – no regulation (!) just keep neighbors happy• 1955 – Air Pollution Control Act
– Various fed agencies were authorized to investigate cause/effect relationships
– States and local governments are responsible for maintaining and improving air quality within their own jurisdiction (this is important, still holds) Transport is a big issue for states; they sue each other!
• 1963 – Clean Air Act, more research at fed. Level, more funds to state and local govt’s to improve air pollution control
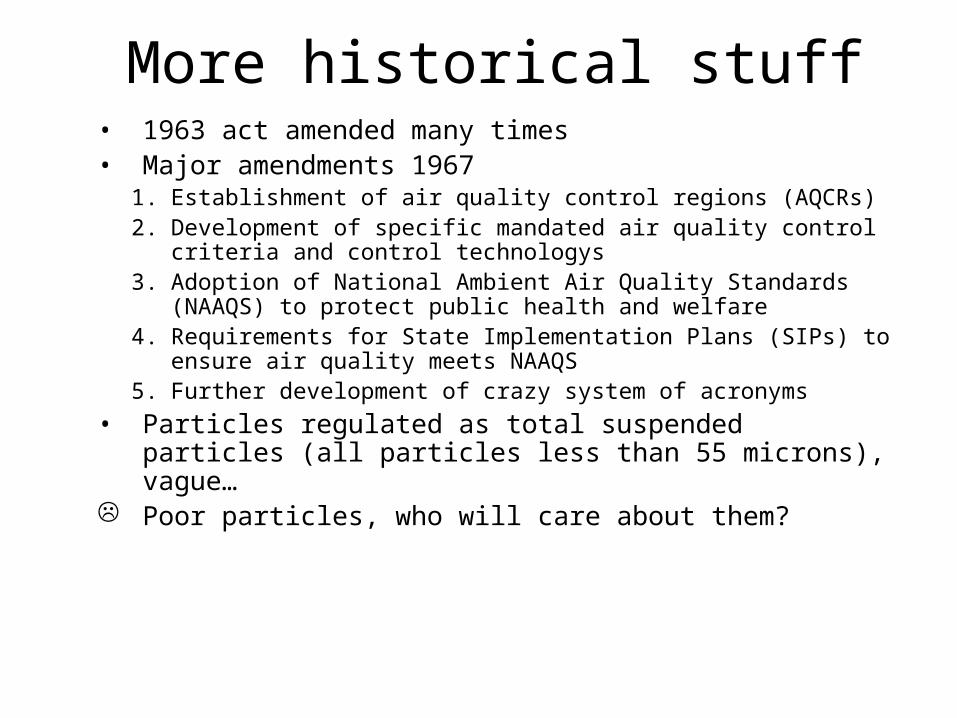
More historical stuff• 1963 act amended many times• Major amendments 1967
1. Establishment of air quality control regions (AQCRs)2. Development of specific mandated air quality control criteria and
control technologys3. Adoption of National Ambient Air Quality Standards (NAAQS) to
protect public health and welfare4. Requirements for State Implementation Plans (SIPs) to ensure air
quality meets NAAQS5. Further development of crazy system of acronyms
• Particles regulated as total suspended particles (all particles less than 55 microns), vague…
Poor particles, who will care about them?
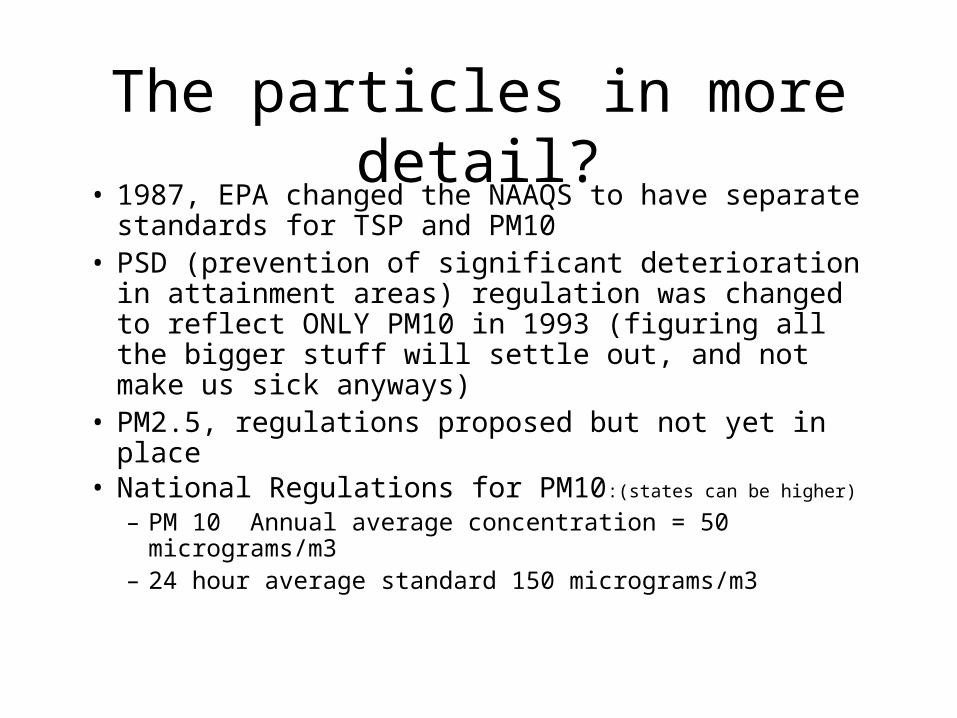
The particles in more detail?• 1987, EPA changed the NAAQS to have separate
standards for TSP and PM10• PSD (prevention of significant deterioration in
attainment areas) regulation was changed to reflect ONLY PM10 in 1993 (figuring all the bigger stuff will settle out, and not make us sick anyways)
• PM2.5, regulations proposed but not yet in place• National Regulations for PM10:(states can be higher)
– PM 10 Annual average concentration = 50 micrograms/m3– 24 hour average standard 150 micrograms/m3
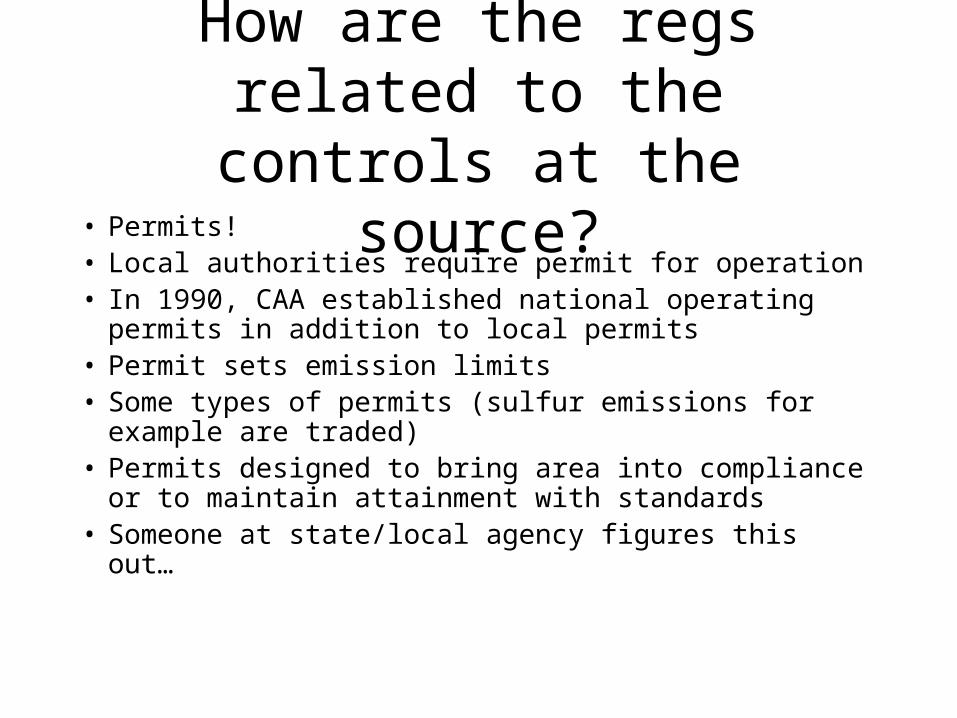
How are the regs related to the controls at the source?
• Permits!• Local authorities require permit for operation• In 1990, CAA established national operating permits
in addition to local permits• Permit sets emission limits• Some types of permits (sulfur emissions for example
are traded)• Permits designed to bring area into compliance or to
maintain attainment with standards• Someone at state/local agency figures this out…
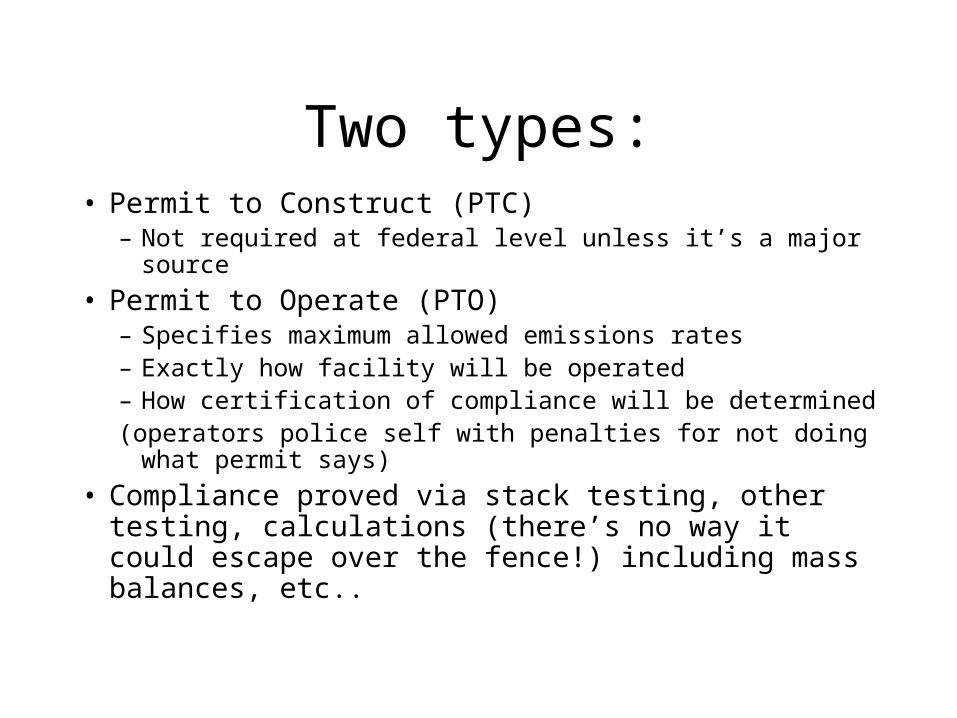
Two types:• Permit to Construct (PTC)
– Not required at federal level unless it’s a major source
• Permit to Operate (PTO)– Specifies maximum allowed emissions rates– Exactly how facility will be operated– How certification of compliance will be determined (operators police self with penalties for not doing what permit
says)
• Compliance proved via stack testing, other testing, calculations (there’s no way it could escape over the fence!) including mass balances, etc..
Particle control technologies
• No one magic bullet, often combo of separators is needed
• Brainstorm on what phenomena can be used to eliminate particles at the source – Big particles (resuspension dust, greater than 20 microns)– Smaller particles (1 to 10 microns)– NanoparticlesNote: Exam next week will cover all we have discussed up to
this slide, focus on fundamental phenomena and problem analysis as well as some quantitative problem solving
Control design approach from intro to ChE perspective
Basic technologies to remove particles• Electrostatic precipitators – Zap it!
• Filters – Suck it!
• Scrubbers – Wash it!
• Cyclones – Fling it!
• Tradeoffs? Costs, lifetimes, maintenance, efficiency, appearance (just kidding)
ESPs
• Applies electrical force to get particles out of gas stream
• ESPs can handle large volumetric flow rates– Low pressure drops
– High efficiencies
• Downsides?– Not cheap
– Inflexible to changes in the process (designed for certain efficiency on certain sized particles)
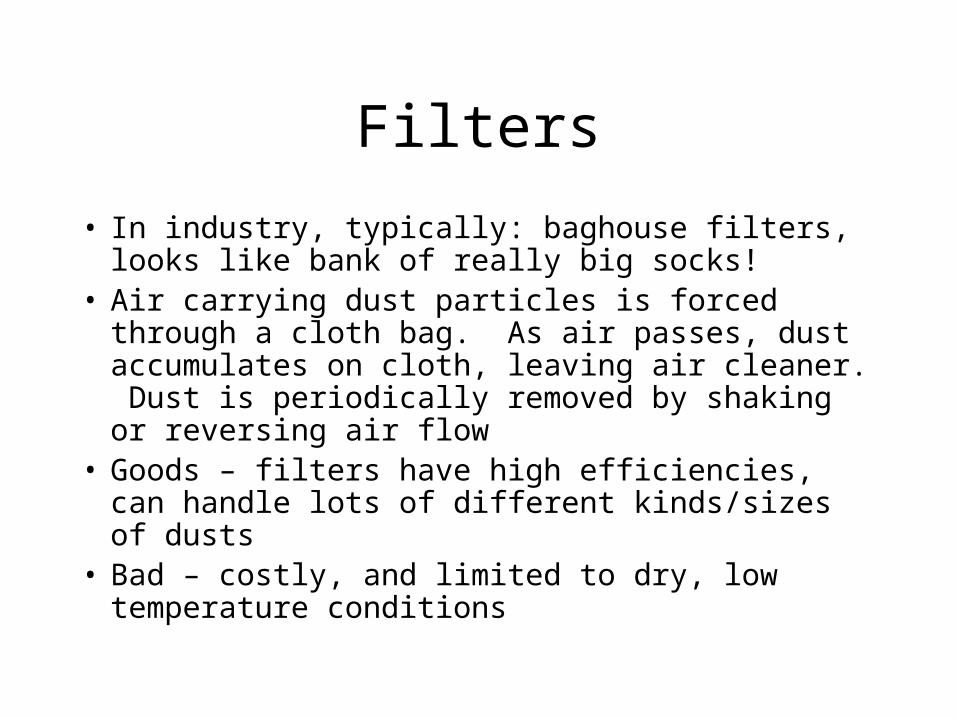
Filters
• In industry, typically: baghouse filters, looks like bank of really big socks!
• Air carrying dust particles is forced through a cloth bag. As air passes, dust accumulates on cloth, leaving air cleaner. Dust is periodically removed by shaking or reversing air flow
• Goods – filters have high efficiencies, can handle lots of different kinds/sizes of dusts
• Bad – costly, and limited to dry, low temperature conditions
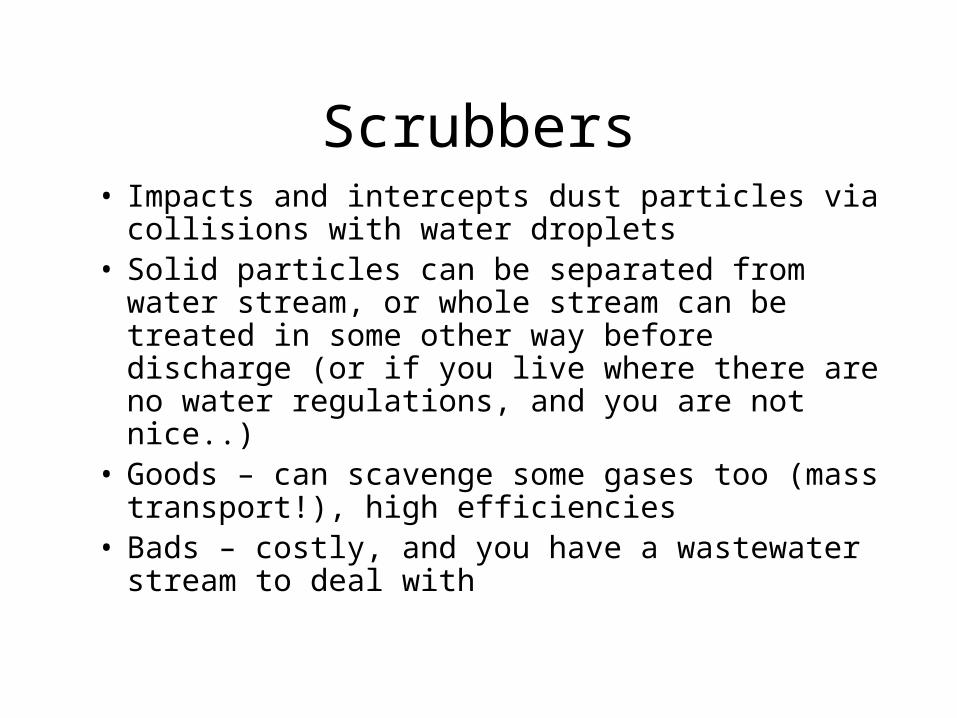
Scrubbers• Impacts and intercepts dust particles via collisions
with water droplets• Solid particles can be separated from water stream,
or whole stream can be treated in some other way before discharge (or if you live where there are no water regulations, and you are not nice..)
• Goods – can scavenge some gases too (mass transport!), high efficiencies
• Bads – costly, and you have a wastewater stream to deal with
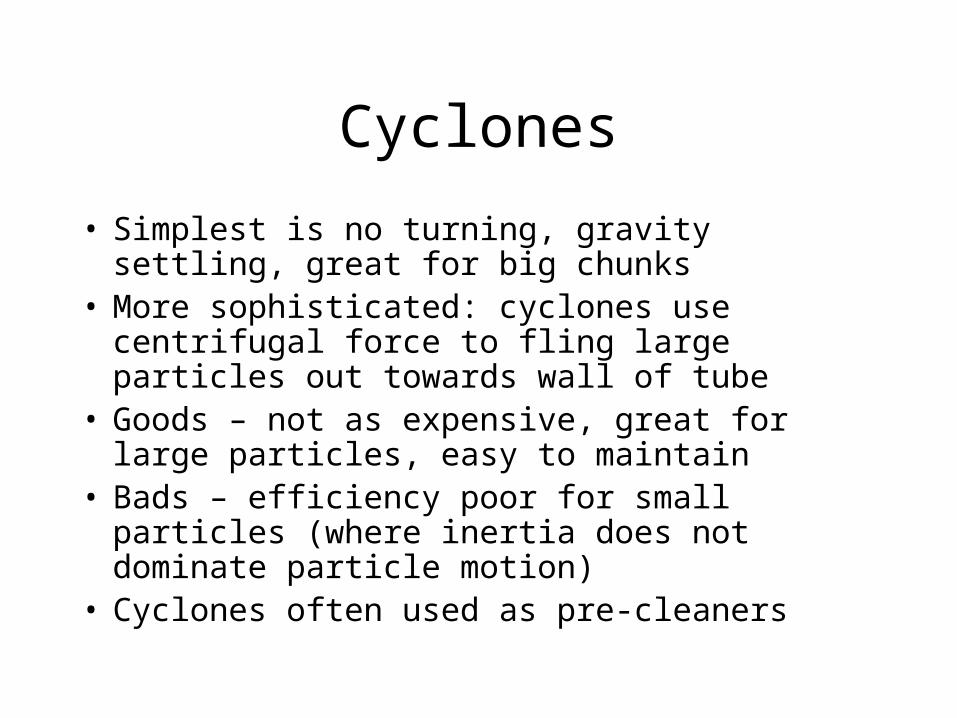
Cyclones
• Simplest is no turning, gravity settling, great for big chunks
• More sophisticated: cyclones use centrifugal force to fling large particles out towards wall of tube
• Goods – not as expensive, great for large particles, easy to maintain
• Bads – efficiency poor for small particles (where inertia does not dominate particle motion)
• Cyclones often used as pre-cleaners
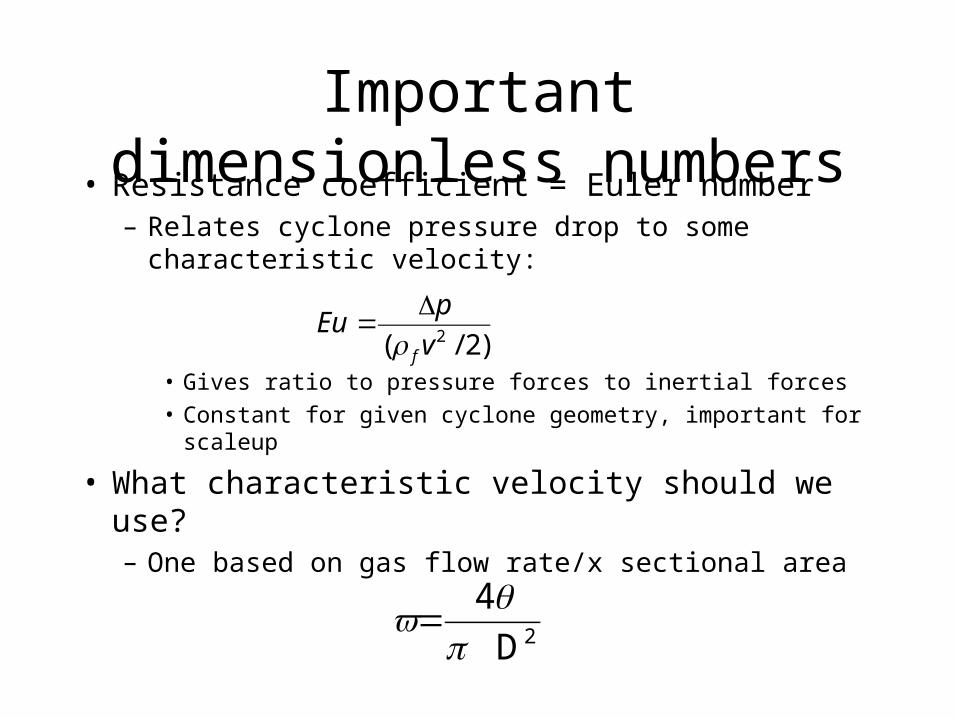
Important dimensionless numbers• Resistance coefficient = Euler number
– Relates cyclone pressure drop to some characteristic velocity:
• Gives ratio to pressure forces to inertial forces
• Constant for given cyclone geometry, important for scaleup
• What characteristic velocity should we use?– One based on gas flow rate/x sectional area
)2/( 2v
pEu
fρΔ
=
2D
4
πq
v=
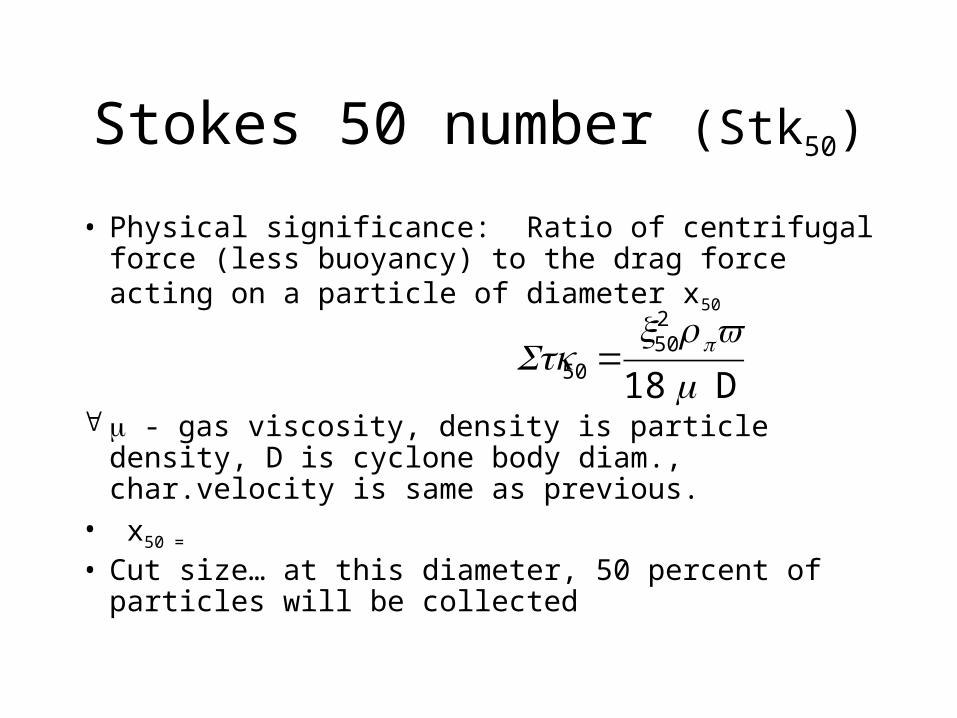
Stokes 50 number (Stk50)
• Physical significance: Ratio of centrifugal force (less buoyancy) to the drag force acting on a particle of diameter x50
- gas viscosity, density is particle density, D is cyclone body diam., char.velocity is same as previous.
• x50 =
• Cut size… at this diameter, 50 percent of particles will be collected
D 18
250
50 ρ vx
Stk p=
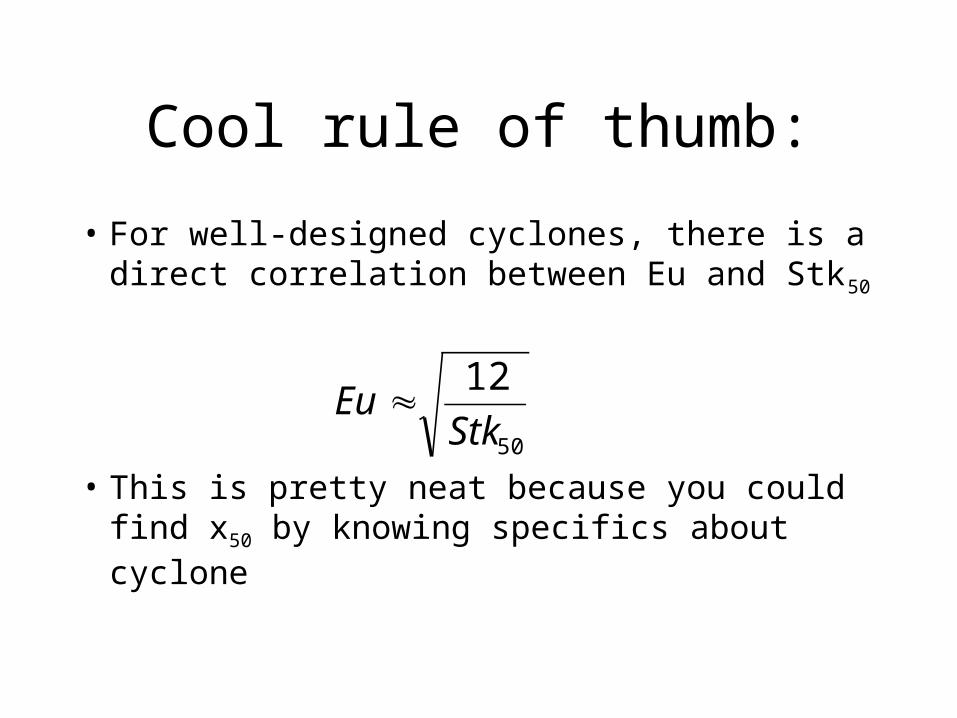
Cool rule of thumb:
• For well-designed cyclones, there is a direct correlation between Eu and Stk50
• This is pretty neat because you could find x50 by knowing specifics about cyclone
50
12
StkEu ≈

Design stuff

Other factors• Dust loading – if there is a high concentration of
particles in gas, this leads to higher separation efficiencies because of particle enlargement via agglomeration. Humidity increases magnitude of this effect.
• Abrasion – critical zones for abrasion = just beyond inlet opening, and in the conical part near dust discharge
• Blockage – usually caused by overloading of solids outlet orifice, caused by mechanical defects, changes in chemical or physical properties of solids (sudden dose of humidity)
More factors• Attrition – break up of solids could occur as particles are smacked
against the wall; large particles affected more than smaller ones. Big concern in fluidized beds where cyclones are used to sort out the particles that escaped, to return them to the bed.
(draw this)
• What would happen to size distribution of fluidized bed particles over long times in this case?