Embed Size (px)
Citation preview
Vol.:(0123456789)1 3
Model. Earth Syst. Environ. (2017) 3:7 DOI 10.1007/s40808-017-0271-6
ORIGINAL ARTICLE
Agent-based modelling for urban sprawl in the region of Waterloo, Ontario, Canada
Abdulahad Malik1 · Rifaat Abdalla2
Received: 19 December 2016 / Accepted: 3 January 2017 © Springer International Publishing Switzerland 2017
1996) and by Stanislaw Ulam who is credited for his work related to Monte Carlo Simulation. Simply stated CA is a cell-based model represented by variables (Torrens and Benson 2004) or states (Janssen 2005). In the simplest case, cells can have suitable and not suitable attributes with suitability cells represented as 1 and not suitable cells as 0. The cells can also have transition rules, which determine the state of the cells for the next time step. The transition rule can also depend on the situation of the neighborhood cells. In an urban context, the cells can represent a geo-graphical location or a map with simple land use restric-tions. For example, no growth or development can occur on environmentally sensitive areas.
Agents, on the other hand, are independent decision-making entities; they can represent people or artificial societies. They are governed by rules, rules that define the relationship between the agent and its environment (LUCC Report 2001). According to Wooldridge (2002), intelligent agents are also goal-oriented, i.e. they satisfy or maximize their utility, they are reactive, meaning they respond to changes in their surrounding and finally they are capable of interacting with other agents. In the model presented later in the paper, the agents which are students are governed by simple rules to locate suitable sites to settle down.
ABM has its foundations in computer science and 1969 through a paper by Thomas Schelling its apparent applica-tion in social sciences was emerged (Epstein 1996). Also in 1975 another interesting study by Kolesar and Walker who built a model to show how much time it takes for the police to reach the emergency paved the way for ABM to emerge as a useful tool in social sciences (Gilbert 1999). Since then there has been an enormous growth in the study and its application to understanding the real world problems. Some of its application includes pedestrian modeling (Cas-tle 2007; Torrens and Benson 2004), policy analysis and
Abstract Agent-based modelling (ABM) is a form of simulation that is phenomenal in understanding and explor-ing various types of spatial and non-spatial problems. The goal of this research is to study agent-based modeling in an urban context. ArcGIS was used to develop cost raster. In the second part, NetLogo was used to create agents for the purpose of stochastic simulation of urban sprawl in Water-loo Region. The cost rasters were generated using the Cost Distance Tool in ArcGIS with two inputs: source raster and time raster. The simulating model in NetLogo was created using three raster layers: proximity to University of Water-loo campus, proximity to grocery stores and proximity to the LRT stops. The use of ABM has helped in understand-ing the urban dynamics and to model the settlement pattern of students in Waterloo region.
Keywords Agent based modelling · Urban sprawl · Raster automata · Urban sprawl
Introduction
Most ABMs consists of two major elements: Cellular automata (CA) and Agents. John von Neumann initially introduced CA with his self-reproducing automata (Epstein
* Rifaat Abdalla [email protected]
Abdulahad Malik [email protected]
1 Department of Geomatics, Waterloo University, Waterloo, Canada
2 Department of Hydrographic Surveying, King Abdulaziz University, Jeddah 21589, Saudi Arabia
Model. Earth Syst. Environ. (2017) 3:7
1 3
7 Page 2 of 9
planning (Balmann et al. 2002), land-use and settlement patterns (Parker and Meretsky 2004), natural resource man-agement, agriculture, economics, archaeology and urban studies. In the following paper, the primary emphasis will be towards the application of ABM in urban studies.
The primary objective of the following paper is as follows:
• Describe urban sprawl/growth• Use of ABM to study urban dynamics• Compare the models• Present a decision-making model for City of Waterloo
Urban sprawl
Since understanding urban growth is a prerequisite for modeling and forecasting future trends of urban land use change, a brief understanding of how and why urban growth occurs is important. There are many different theo-ries related to urban growth and its impact on the surround-ing areas. It would be safe to assume that urban growth and land-use change are directly intertwined and are connected in a linear fashion because any increase in the urban bound-ary or region means consumption of agricultural or envi-ronmentally sensitive land, thus change in land use.
The urban growth and land use change has been stud-ied extensively over the past century, and numerous theo-ries have been presented to explain the causes and effects of urban growth.
The pioneers
The well-known scholars in the study of land-use change include George Perkins Marsh and J. H von Thunen. George Perkins in his book Man and Nature discussed the magnitude of impacts of human actions on the natural environment extensively. His research was mainly descrip-tive in nature and attempted to provide explanations about the environmental transformations and man’s position in respect to the environment (Briassoulis 2000). Although he analyzed the land change issue without any quantita-tive analysis, his work, however, can be regarded critical as the subject of land use and human activity was the central theme of his work; the work which later would influence many researchers and scholars. It is also a fact that in his time the powerful computers and analysis tools that we have today were not available.
J. H von Then, on the other hand, viewed land as an eco-nomic resource whose primary attribute worth considering was productivity and landscape within which agricultural activity was taking place. The main attributes of his theory state that the city is located centrally within an “isolated
state” which has no external influences. The isolated state is surrounded by an empty wilderness or forests, the soil quality and climate are consistent, and farmers act to maxi-mize profits (Briassoulis 2000). According to his theory if the price for a crop changes, this will improve the abil-ity of farmers to bid for a particular location, thus mak-ing possible for a change in location. His work was later used by many researchers of which Alonso’s (1964) urban land market is one of the most popular. In short, there is no doubt that von Thunen’s theory is the predecessor of both location theory and analysis of urban and regional spatial structure (Briassoulis 2000).
The modernists
In his book “Cities and Complexities”, Michael Batty dis-regards the central business district (CBD) theory and explains that the modern cities no longer hold the tradi-tional image of a city. According to him, the cities are much more sophisticated, and that core of the modern cities is less connected to the metropolis than it was assumed in the traditional models. He further explains that the traditional center has all but disappeared regarding economic function. He gives the example of Detroit, Buffalo and New York to show how its CBDs have been abandoned to “become a fossilized exhibit of early-twentieth-century architecture” (Batty 2005); he calls these “edge cities”, the term first used by the Joel Garreaue. Michael Batty further purposes the need for new urban spatial theories that can make sense of the current reality. He sums up the urban sprawl or land-use change by describing five drivers. According to him, the drivers of change include randomness, historical acci-dent, physical determinism, natural advantage, and com-parative advantage.
Cheng and Masser (2005), on the other hand, argues that urbanization is a direct consequence of the self-evolu-tion of a city or a society and is a result of development in transportation, communication and production technolo-gies, the realization of diversification and organization facts. According to this author, the urban areas are dynamic because the physical growth of the central city rapidly spreads to the large areas. It closes the gap between the life standards of the people living in the towns and those living around it and finally the effect on the countryside because of strengthening the mutual connection with the develop-ment of transportation-communication facilities.
All the above factors can be seen as major contributors to urban sprawl; the drivers of change described by Michael Batty are very detailed analysis, he used a logical approach to not only describe the urban growth using the natural and physical factors but has also used the historical context to make a solid explanation. Cheng and Masser (2005) on the other hand highlights absorbing elements; he attributes
Model. Earth Syst. Environ. (2017) 3:7
1 3
Page 3 of 9 7
the urban growth to the development of transportation and communication. It is a fact that a city with good infrastruc-ture and development will attract businesses, can create new jobs which will bring more people into the city.
Surprisingly, however, the issue of overcrowding was devoid from all the major urban studies even though it can be regarded as one of the intrinsic factors influencing urban sprawl. Overcrowding can impact the housing and land prices and can also be a push factor for new development; as a result, the new development will take place adjacent to the urban fringe while converting the rural land into urban or suburban areas.
Use of ABM in urban studies
The concepts highlighted above are merely theories which provide the explanation about the urban growth and land use change. However, to better understand the urban sprawl concepts, growing number of scientists have turned to Agent-Based Modelling as it can formalize simple to complex representations of the behavior and cognitive processes of actors who make land and resource use deci-sions within the system (Bonabeau 2002). ABM are not only excellent tool in understanding the complex world, but they are also very helpful to develop hypotheses that can be tested empirically (Brown and Duh 2004) and to make predictions for any growth scenarios. While there are hun-dreds of models related to land use land change, there are handsomely enough models that are directly concerned with the dynamics of the city in particular and urbanization in general. A brief summary of several of these efforts is discussed below.
ABM has introduced various models to analyze numer-ous urban-related problems and scenarios. It has proposed an approach to micro-simulate urban scenarios, combined with the environment, transport and other economics models to build complex urban systems such as RePAST, UrbanSim, TransSim, SLEUTH, and LUCITA.
RePAST (Jackson et al. 2008) presents an excellent example of some of the work that is presently being explored in urban studies. Jackson et al. (2008) have simulated the residential dynamics in an area of Boston. The model uses basic statistics data with simple deci-sion-making rules to explain the choices of individuals drawn to urban amenities. The individuals were divided into four different classes: professional, college students, not- professional and elderly. They use simple rules such as the location of settlement has to be unoccupied; loca-tion is closer to the college campus (for students), or commercial district (for professional agents), location’s affordability and this place has at least one neighbor of the same class. They tested 14 different scenarios and the
outcome for eight of the scenarios was unexpected. Over-all, however, it presented an unusual pattern of move-ment among the various classes. The approach used in this model is similar to a study done by Myers and Gea-rin (2001) which shows that wealthier populations tend to settle in the densely populated area. In the Jackson et al. (2008) study, the professional class which was the most prosperous among the four classes preferred to live in downtown and areas with proximity to commercial and entertainment district. The results are further simi-lar to yet another study done by Florida (2002) and Clark (2004) that shows the preference of young professionals for diversity and proximity to amenities.
Joshi and Guhathakurta (2006) have used UrbanSim to analyze the impact of the proposed Phoenix Light Rail Transit system on future land use and household charac-teristics adjacent to station areas. The model was purely built in UrbanSim environment, and UrbanSim database was used to generate the processes. UrbanSim is, however, is not a single model but consists of a family of standards. There are seven different models in UrbanSim: economic transition, demographic transition, employment and house-hold transition, employment and family mobility, employ-ment and household location choice, household mobility model and real estate development model. The approach used by the researchers in this study was very broad as they utilized not only tools in UrbanSim but have also used GIS extensively. The major step in simulating the process was building the database which included 15 steps, few of the steps included: defining project boundary, generating grids, assigning unique ID’s to grids, GIS overlays, mapping employment grids and running consistency checker. The major finding of this study was the increase in households without Light Rail in Zone 1 (Downtown and business district) and Zone 2 (low-density corridor adjacent to the airport). However, with Light Rail the significant findings were in Zone 3 (University area) where the populations decreased. The researchers in the study were surprised to see the decline in the student population in Zone 3 with Light Rail. However, such a decrease is logical as students would move away from the campus if an efficient trans-portation system is available. Since the primary factor that determines the student settlement is Time, therefore, if the students can live for example 10 Km away from the cam-pus and can still reach the campus in less than 15 min, they should have no problem moving away from the campus.
The study also reports the settlement based on income and race adjacent to the light rail stations. With light rail zone, 1 reported the highest income while zone 2 reported lowest household income. However, with the light rail, the zone 2 remains the most moderate, income in zone 1 declines while zone 3 saw a slight increase in the house-hold income and is on the top with regarding income.
Model. Earth Syst. Environ. (2017) 3:7
1 3
7 Page 4 of 9
The urbanism model described above was processed in a very systematic manner. The model was very complex as it included more than one model. However, the approach noticed in this study was not seen in other studies. Another important aspect of the following study was its approach to validate its model which had satisfying results. The valida-tion process can be as an intrinsic matter as it provides the reason to accept or refute the results of the model. Valida-tion can also be critical if the model is to predict any future trends. Without validation, the researchers may never know about the accuracy of their model and its predictions.
Another study that is also related to the dynamic of urban population is by Benenson (1998) who reported an ABM of the population dynamics in a city, in which inhab-itants could change their residential behavior depending on the properties of their neighborhood, neighbors, and the whole town. The model is similar to the simple transi-tion rules of cellular automata where the cells change their states based on the state of their neighboring cells. In Ben-son’s model, the agents were characterized by their eco-nomic status and cultural identity. The model was however based on an artificial city which was used to test some of the urban theories such as social segregation. The model is similar to Crooks (2006) that also examines urban theories such as segregation theory and location theory. The model was written in Java and uses basic operating classes from RePAST library. This model which was also conceptual was based on vector GIS data instead of raster employed by Benson.
In the following section models related to urban dynamic were briefly highlighted. The rest of the paper is structured as follows: City of Waterloo Model, Methodology, Results and Discussion.
Region of waterloo model
The goal of this work is to use the agent-based modeling to study the residential movement behavior of students in the City of Waterloo. In the modeling portion of the research, the focus was served to understand how the agent level preferences change by just altering few rules. The imme-diate goal was to understand how residential agents make a decision on where to live and which dimensions of that
decision-making process influence settlement patterns. If we have a better understanding of this process, then we can design policy instruments to control the patterns of urban development to improve environmental performance.
The project encompasses a model that is based on cost rasters built in ArcGIS; the rasters were used to construct the environment in Netlogo. The agents, on the other hand, represent the students. They are based on simple rules of aspiration; the expectation level is directly dependent on the proximity of the areas of interest, discussed later in the paper.
Methodology
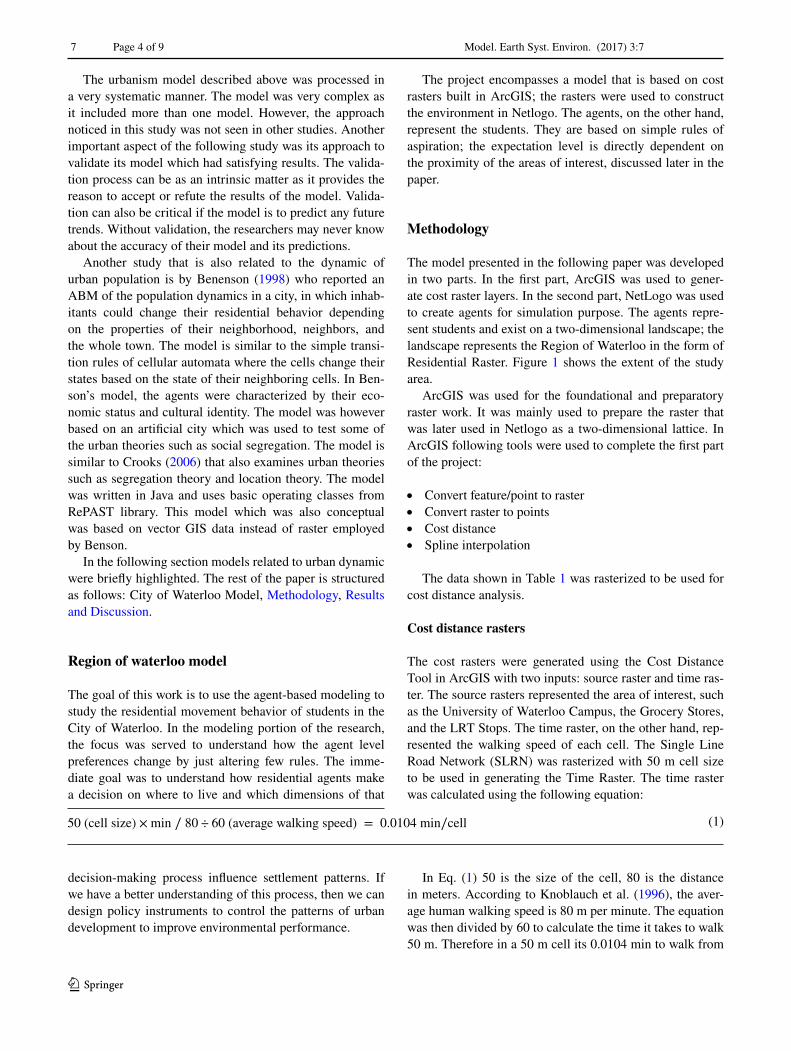
The model presented in the following paper was developed in two parts. In the first part, ArcGIS was used to gener-ate cost raster layers. In the second part, NetLogo was used to create agents for simulation purpose. The agents repre-sent students and exist on a two-dimensional landscape; the landscape represents the Region of Waterloo in the form of Residential Raster. Figure 1 shows the extent of the study area.
ArcGIS was used for the foundational and preparatory raster work. It was mainly used to prepare the raster that was later used in Netlogo as a two-dimensional lattice. In ArcGIS following tools were used to complete the first part of the project:
• Convert feature/point to raster• Convert raster to points• Cost distance• Spline interpolation
The data shown in Table 1 was rasterized to be used for cost distance analysis.
Cost distance rasters
The cost rasters were generated using the Cost Distance Tool in ArcGIS with two inputs: source raster and time ras-ter. The source rasters represented the area of interest, such as the University of Waterloo Campus, the Grocery Stores, and the LRT Stops. The time raster, on the other hand, rep-resented the walking speed of each cell. The Single Line Road Network (SLRN) was rasterized with 50 m cell size to be used in generating the Time Raster. The time raster was calculated using the following equation:
In Eq. (1) 50 is the size of the cell, 80 is the distance in meters. According to Knoblauch et al. (1996), the aver-age human walking speed is 80 m per minute. The equation was then divided by 60 to calculate the time it takes to walk 50 m. Therefore in a 50 m cell its 0.0104 min to walk from
(1)50 (cell size) ×min ∕ 80 ÷ 60 (average walking speed) = 0.0104 min∕cell
Model. Earth Syst. Environ. (2017) 3:7
1 3
Page 5 of 9 7
one end to other. 0.0104 was multiplied with the SLRN ras-ter to assign a value to all the cells. Thus when used as an input in the cost distance tool, it generated a grid to show the time it takes to walk from anywhere in the raster to the source.
Interpolation
Since the road network was used as time raster, the result-ing rasters were also in the form of the road network with NODATA values where there were no roads. This approach, however, could have been challenging in the Netlogo environment. Therefore, for simplicity, the rasters were interpolated to assign values to the empty cells.
NetLogo
After interpolating the rasters, they were exported to Netlogo to be used as rules by the agents. The model in
Netlogo was composed of three primary parts, the envi-ronment, the agents, and the agent interaction with the environment.
Environment
The environment is represented in the form of two-dimen-sional Residential Raster. The residential Raster consists of two values: 0 and 1. The agents recognize 0 being not a suitable place to move while 1 being a suitable area to settle. The environment also consists of 3 additional raster layers: UW Campus, Grocery Stores and LRT Stops, these rasters work in the background to evaluate the suitable location for settlement. The solution also depends on the parameters defined by the user.
The agents
The basic agent types are students; the agents are settled only once their suitable site is evaluated and they are sat-isfied. The suitability is generated using the time it takes to walk to (1) the University of Waterloo Campus, (2) gro-cery stores, (3) LRT stops. The user can define how much flexibility the agents are assigned. For example, in the time parameter, the user have the choice to tell the agents to look for suitable sites that are within 10, 20 or 30 min from the campus, stores or LRT stops. The agents settle down only when they are satisfied. The number of agents entering the simulation is controlled by the user; the numbers can be increased and decreased using the slider.
Fig. 1 Study area
Table 1 Data used in the simulation process
Data Type Source
Waterloo political bound-ary
Vector shapefile Teranet
Single line road network Vector line City of WaterlooResidential zones Vector shapefiles City of WaterlooGrocery stores Vector points City of WaterlooLight rail transit stops Vector digitized points N/A
Model. Earth Syst. Environ. (2017) 3:7
1 3
7 Page 6 of 9
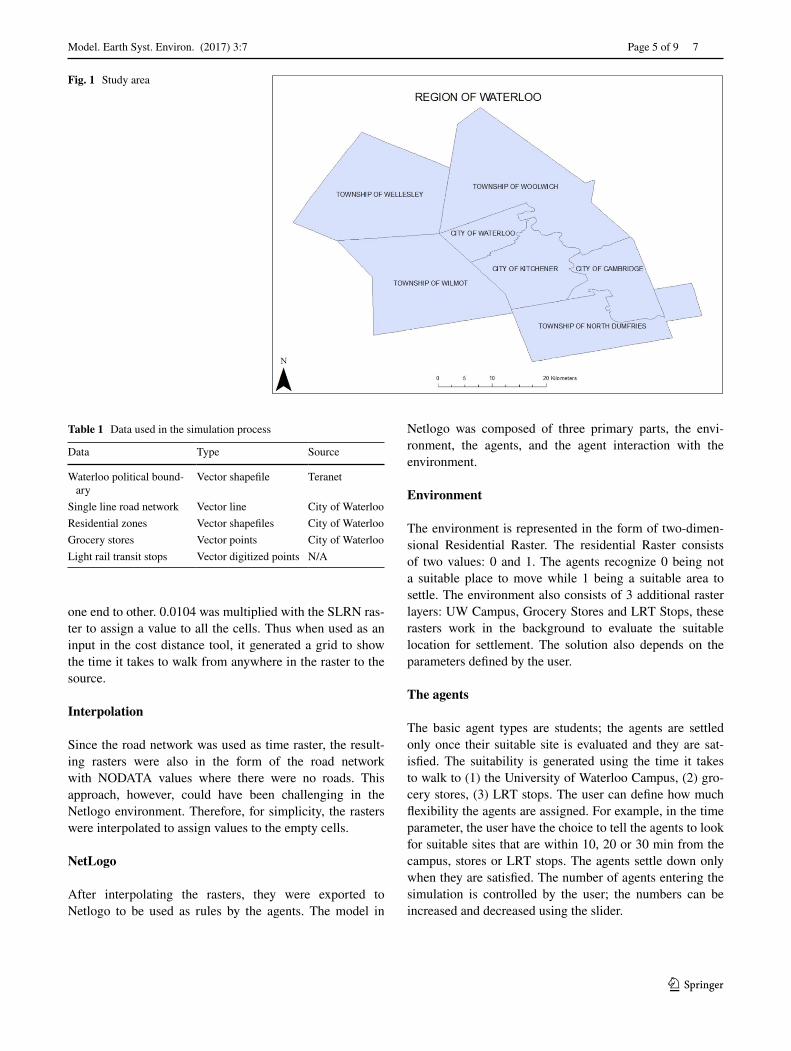
Fig. 2 a Time raster, b cost raster, c Netlogo environment
Fig. 3 Satisfying settlement pattern for all agents
Model. Earth Syst. Environ. (2017) 3:7
1 3
Page 7 of 9 7
Results and discussion
The iterations in the simulation were hypothetical, and the user had complete control over the input of simulation and the results to some extent. The simulating model in Netlogo was created using three rasters: proximity to University of Waterloo campus, proximity to grocery stores and proxim-ity to the LRT stops. Figure 2 is showing the time raster, and Fig. 2b is showing the cost raster. The simulation envi-ronment is shown in Fig. 2c.
The models run based on the parameters assigned to the agents by the user. Figure 3 shows the result of the param-eter in which only the distance from UW campus was con-sidered, the rest of the rasters were ignored. The agents
were asked to settle in areas that are less than 15 min walk-ing from the campus. Therefore, all 20 agents have easily found a place to settle down. The command center shows all the values to be true, meaning all the agents have found the place for settlement.
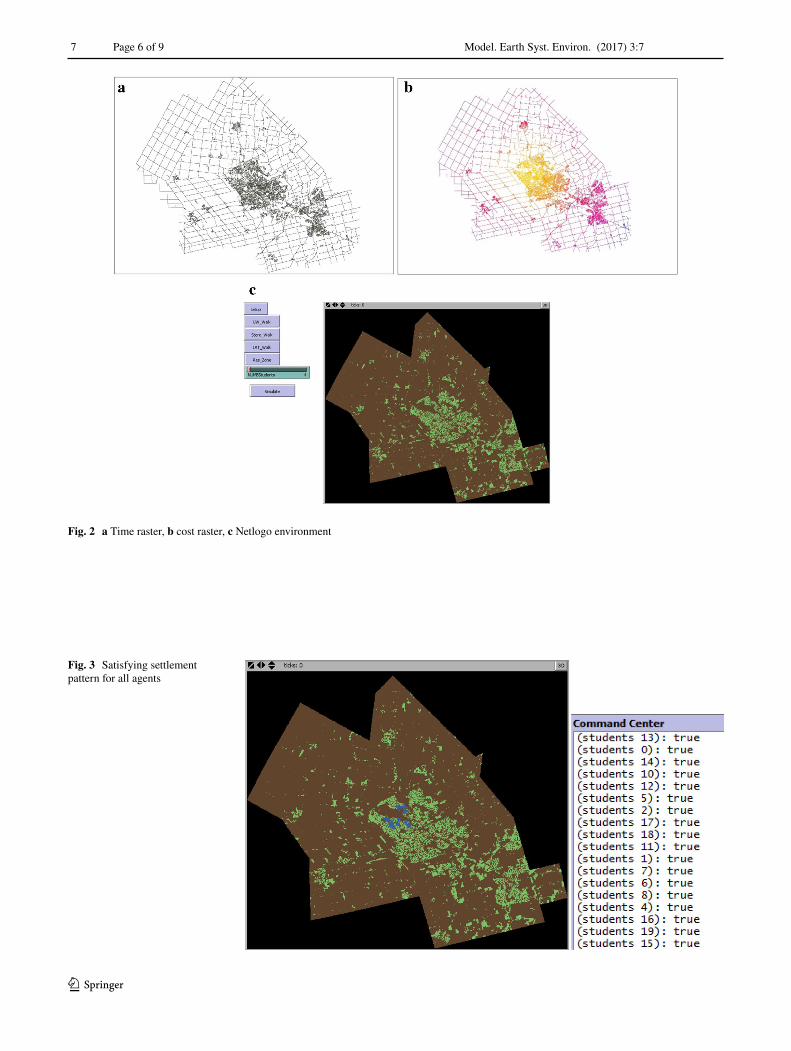
However, in other instances, the results can be unsatisfy-ing for some agents as they cannot settle and die out after a certain number of iterations. Figure 4 shows the instance where some of the agents could not find the suitable loca-tion and die out at the end of the simulation. In this instance the agents were asked to settle in location that is less than 20 min walk from campus and less than 20 min walk from the grocery stores. The agents, therefore, settled in areas where the conditions were met. In the command center, it
Fig. 4 Not all satisfying agents
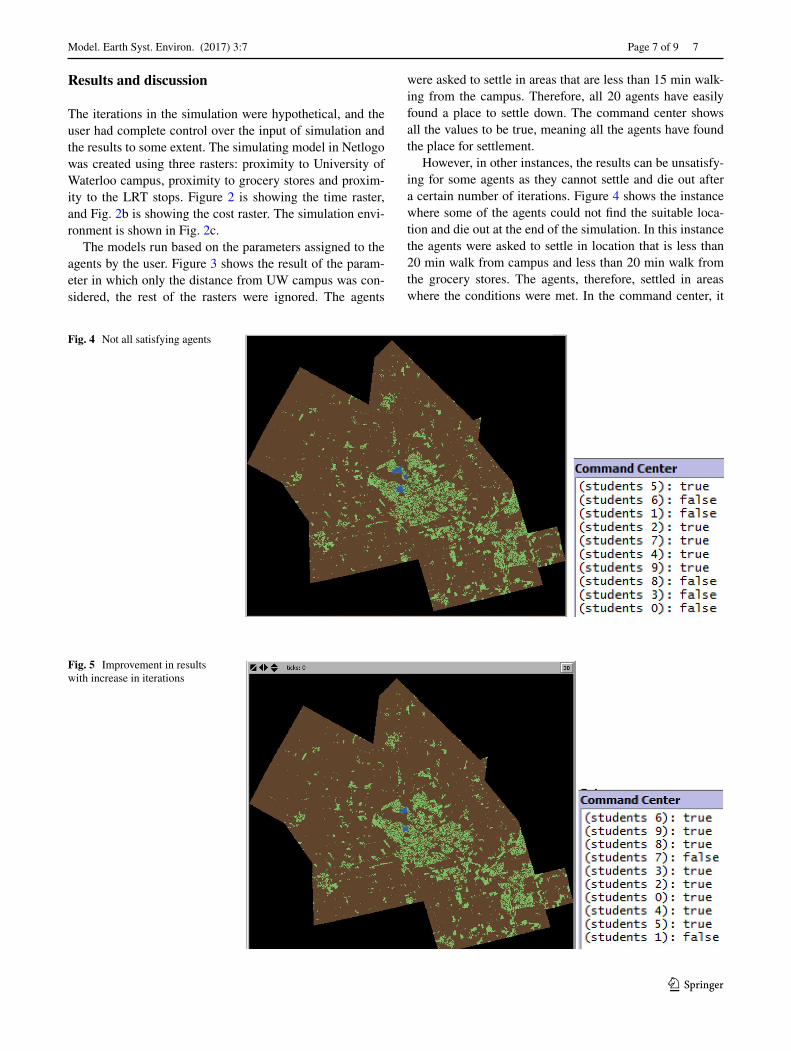
Fig. 5 Improvement in results with increase in iterations
Model. Earth Syst. Environ. (2017) 3:7
1 3
7 Page 8 of 9
is evident that some of the agents could not find the desir-able site.
Interestingly, however, if the number of iterations is increased, the results change dramatically. In the above example 1000 iteration was applied, and as a result, five agents could not settle down. However, in Fig. 5 the itera-tion was increased to 5000 while keeping the rest of the parameters same, only two agents were unsatisfied.
From the above observation, it is clear that the settle-ment pattern improves dramatically with the increase in the iterations. However, the increase in the iteration might not be realistic as in the real world students have patience level, they search for living place a certain number of times after which they make a decision, decision to keep look-ing or compromise their rules and settle in a less suitable area. If the model were to replicate the real world scenario, it would make sense to allocate fixed number of iterations to each agent based on the number of times the students search for a place to live.
Although the model presented above is very simple in nature it, however, shows excellent results and paves the way for future studies. The results of the settlement are also very accurate when measured in GIS. However, it is impor-tant to note that for students the main factor is time and not distance, time it takes for them to reach university, time it takes to reach grocery stores and so on. Therefore, since time is the major factor that plays a major role in decision making, it would be better to analyze the problem in con-text to the transportation. How long does it take to reach the bus stops or to arrive at the LRT stops can be important considerations. Furthermore, the model can be enhanced and can include an attribute that measures the time it takes from any bus stops to the point of interest. In the above model, for the sake of simplicity the bus routes or bus stops
were not used, only the stops for the proposed LRT were used.
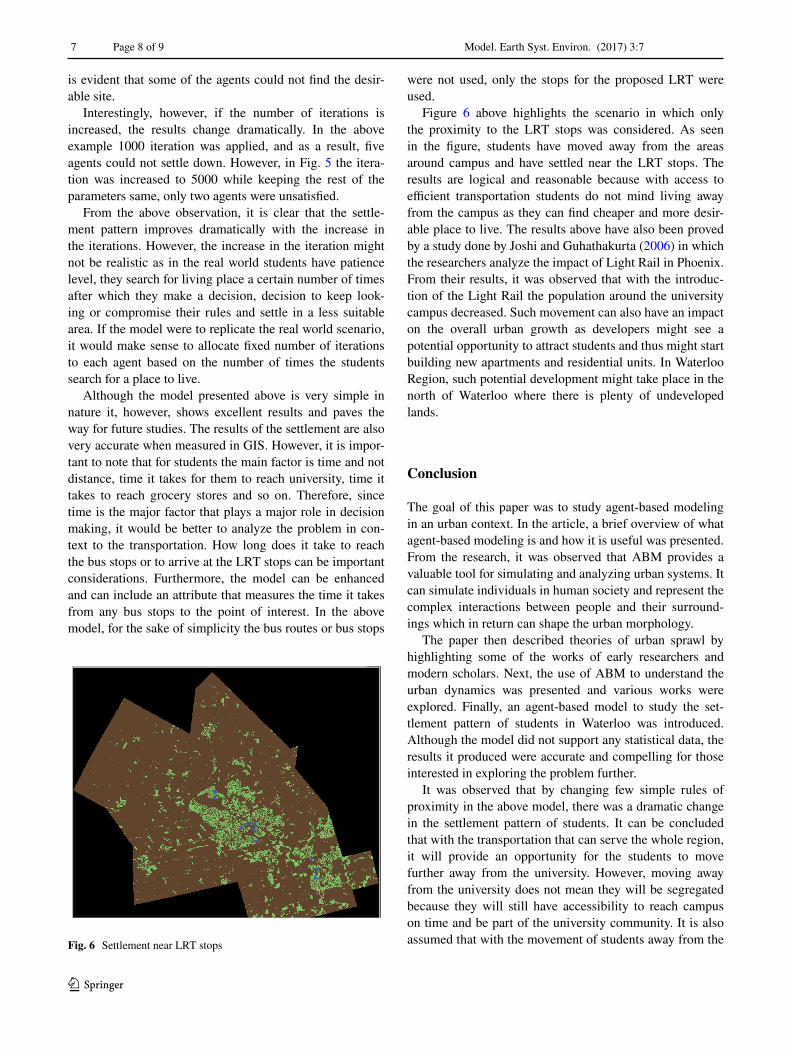
Figure 6 above highlights the scenario in which only the proximity to the LRT stops was considered. As seen in the figure, students have moved away from the areas around campus and have settled near the LRT stops. The results are logical and reasonable because with access to efficient transportation students do not mind living away from the campus as they can find cheaper and more desir-able place to live. The results above have also been proved by a study done by Joshi and Guhathakurta (2006) in which the researchers analyze the impact of Light Rail in Phoenix. From their results, it was observed that with the introduc-tion of the Light Rail the population around the university campus decreased. Such movement can also have an impact on the overall urban growth as developers might see a potential opportunity to attract students and thus might start building new apartments and residential units. In Waterloo Region, such potential development might take place in the north of Waterloo where there is plenty of undeveloped lands.
Conclusion
The goal of this paper was to study agent-based modeling in an urban context. In the article, a brief overview of what agent-based modeling is and how it is useful was presented. From the research, it was observed that ABM provides a valuable tool for simulating and analyzing urban systems. It can simulate individuals in human society and represent the complex interactions between people and their surround-ings which in return can shape the urban morphology.
The paper then described theories of urban sprawl by highlighting some of the works of early researchers and modern scholars. Next, the use of ABM to understand the urban dynamics was presented and various works were explored. Finally, an agent-based model to study the set-tlement pattern of students in Waterloo was introduced. Although the model did not support any statistical data, the results it produced were accurate and compelling for those interested in exploring the problem further.
It was observed that by changing few simple rules of proximity in the above model, there was a dramatic change in the settlement pattern of students. It can be concluded that with the transportation that can serve the whole region, it will provide an opportunity for the students to move further away from the university. However, moving away from the university does not mean they will be segregated because they will still have accessibility to reach campus on time and be part of the university community. It is also assumed that with the movement of students away from the Fig. 6 Settlement near LRT stops
Model. Earth Syst. Environ. (2017) 3:7
1 3
Page 9 of 9 7
campus new developments will take place to accommodate living needs of students.
References
Alonso W (1964) Location and land use: towards a general theory of land rent. Harvard University Press, Cambridge
Balmann A, Happe K, Kellermann K, Kleingarn A (2002) Adjustment costs of agri-environment policy switchings: an agent-based analysis of the German region Hohenlohe. In: Janssen M (ed) Complexity and ecosystem management: the theory and practice of multi-agent systems. Edward Elgar, Cheltenham, pp 127–157
Batty M (2005) Cities and complexity. The MIT, CambridgeBenenson I (1998) Multi-agent simulations of residential dynamics in
the city. Comput Environ Urban Syst 22(1):25–42Bonabeau E (2002) Agent-based modeling: Methods and techniques
for simulating human systems. Proc Natl Acad Sci 99(suppl 3):7280–7287
Briassoulis H (2000) Brief historical overview of studies of land use change. Retrieved 08 20, 2010, from analysis of land use change: theoretical and modeling approaches. http://www.rri.wvu.edu/WebBook/Briassoulis/Chapter2%28Histoverview%29.htm
Brown DG, Duh J-D (2004) Spatial simulation for translating from land use to land cover. Int J Geogr Inf Sci 18(1):35–60
Castle CJE (2007) Guidelines to Assess Pedestrian Evacuation Soft-ware Applications, Centre for Advanced Spatial Analysis (Uni-versity College London): working paper 115, London. http://www.casa.ucl.ac.uk/working_papers/paper115.pdf
Cheng J, Masser I (2005) Understanding urban growth system: theo-ries and methods. ITC, Hengelosestraat
Clark TN (2004) The city as an entertainment machine. Elsevier, Oxford
Crooks A (2006) Exploring cities using agent-based models and GIS. UCL Working Paper Series
Epstein JM (1996) Growing artificial societies. The Bookings Institu-tions, Washington DC
Florida RL (2002) The rise of the creative class. Basic Books, New York
Gilbert N (1999) Simulation for the social scientist. Open University Press, Philadephia
Jackson J, Forest B, Sengupta R (2008) Agent Based Simulation of Urban Residential Dynamics and Land Rent Change in a Gentri-fying Area of Boston. Trans GIS 12(4):475–491
Janssen MA (2005) Agent-based modeling. In: Proops J, Safonov P (eds) Modeling in Ecological Economics. Edward Elgar Publis-ing, Cheltenham, UK, pp 155–172
Joshi H, Guhathakurta S (2006) The simulating impact of light rail on urban growth in Phoenix: an application of urbanism mod-eling environment. In: Proceedings of the 2006 International Conference on Digital Government Research. ACM, San Diego, pp 135–141
Knoblauch RL, Pietrucha M, Nitzburg M (1996) Field studies of pedestrian walking speed and start-up time. Transp Res Rec J Transp Res Board 1538:27–38
Myers D, Gearin E (2001) Current Preferences and future demand for denser residential environments. Hous Policy Debate 12(4):633–659
Parker DC, Berger T (2001). Agent-based models of land-use and land-cover change. LUCC Focus, Indiana
Parker DC, Meretsky V (2004) Measuring pattern outcomes in an agent-based model of edge-effect externalities using spatial met-rics. Agric Ecosyst Environ 101:233–250
Torrens PM, Benson I (2004) Geosimulation: modelling urban envi-ronments. Wiley, London
Wooldridge M (2002) An introduction to multiagent systems. Wiley, New York