Embed Size (px)
Citation preview
Schäffler et al. BMC Ecology (2015) 15:7 DOI 10.1186/s12898-015-0040-1
RESEARCH ARTICLE Open Access
Agent-mediated spatial storage effect inheterogeneous habitat stabilizes competitivemouse lemur coexistence in Menabe Central,Western MadagascarLivia Schäffler1,2*, Joachim Saborowski3 and Peter M Kappeler1
Abstract
Background: Spatio-temporal distribution patterns of species in response to natural and anthropogenic driversprovide insight into the ecological processes that determine community composition. We investigated determinants ofecological structure in a species assemblage of 4 closely related primate species of the family Cheirogaleidae(Microcebus berthae, Microcebus murinus, Cheirogaleus medius, Mirza coquereli) in western Madagascar by extensive linetransect surveys across spatial and temporal heterogeneities with the specific goal of elucidating the mechanismsstabilizing competitive coexistence of the two mouse lemur species (Microcebus spp.).
Results: Interspecific competition between the mouse lemurs was indicated by negative spatial associations indegraded habitat and by habitat partitioning along anthropogenic disturbance gradients during dry seasons withresource scarcity. In non-degraded habitat, intraguild predator M. coquereli, but not C. medius, was negatively associatedwith M. murinus on the population level, whereas its regional distribution overlapped spatially with that of M. berthae.The species’ interspecific distribution pattern across spatial and temporal heterogeneities corresponded to predictions foragent-mediated coexistence and thus confirmed M. coquereli’s stabilizing impact on the coexistence of mouse lemurs.
Conclusions: Interspecific interactions contribute to ecological structure in this cheirogaleid assemblage anddeterminants vary across spatio-temporal heterogeneities. Coexistence of Microcebus spp. is stabilized by anagent-mediated spatial storage effect: M. coquereli creates refuges from competition for M. berthae in intacthabitat, whereas anthropogenic environments provide M. murinus with an escape from resource competition andintraguild predation. Species persistence in the assemblage therefore depends on the conservation of habitatcontent and context that stabilizing mechanisms rely on. Our large-scale population level approach did not allowfor considering all potential functional and stochastic drivers of ecological structure, a key limitation that accountsfor the large proportion of unexplained variance in our models.
Keywords: Ecological structure, Species assemblage, Interspecific interactions, Competition, Intraguild predation,Agent-mediated coexistence, Spatial storage effect, Lemurs
* Correspondence: [email protected] Ecology & Sociobiology Unit, German Primate Center, Göttingen,Germany2Present address: Museum für Naturkunde, Berlin, GermanyFull list of author information is available at the end of the article
© 2015 Schäffler et al.; licensee BioMed Central. This is an Open Access article distributed under the terms of the CreativeCommons Attribution License (http://creativecommons.org/licenses/by/4.0), which permits unrestricted use, distribution, andreproduction in any medium, provided the original work is properly credited. The Creative Commons Public DomainDedication waiver (http://creativecommons.org/publicdomain/zero/1.0/) applies to the data made available in this article,unless otherwise stated.

Schäffler et al. BMC Ecology (2015) 15:7 Page 2 of 15
BackgroundUnderstanding the composition of communities, as wellas the distribution and relative abundance of their con-stituent species, i.e. “ecological structure”, has long repre-sented a fundamental question in ecology [1]. Biologicalinteractions have been identified as a major structuringforce in taxonomic assemblages: Direct, competitive inter-actions between species are of particular significance forecological structure and often result in checkerboard-likedistribution patterns, particularly between closely relatedspecies [2]. Interspecific predation is a second directmechanism known to structure ecological communities,which may have even greater effects on the size and distri-bution of prey populations [3-6]. Intraguild predation(IGP) describes combined effects of competition and pre-dation [7]. Intraguild predators share resources and sym-metrically or asymmetrically prey upon each another, withconsequences for the distribution and abundance of bothspecies. Coexistence under IGP can be stabilized if theprey represents a superior resource competitor or if thepredator gains considerably from prey consumption [8,9].One member of a species assemblage may also influ-
ence pairwise direct interactions between other coex-isting species as a “third agent” via competition,predation, or IGP, however. Indirect effects of preda-tion can lead to apparent competition: (intraguild) pre-dation influences the intensity of competition betweencoexisting prey species, thereby creating spatial pat-terns similar to those of competitive exclusion [10-12].Interactions with a third agent may also result in sta-bilizing coexistence of prey, if species outcompete eachother in different tasks: prey superior in resource com-petition will occur at highest densities in most pro-ductive habitats, whereas the species superior inpredator avoidance will be found at highest densities inpredator-free space [13,14].Finally, ecological structure also depends on vegeta-
tion and species composition of the habitat as well ason the size and distribution of patches that are import-ant for the resident species. Diversity depends on habi-tat productivity as well as on floristic and structuraldiversity [15]. Habitat heterogeneity may facilitate coex-istence on a regional scale in both, competitive andpredator–prey systems [16] if competitive rankings arereversed in patches of different quality, and reciprocalexclusion provides interacting species with refuges fromcompetition or predation (“spatial storage effect”[13,14]). Finally, temporal heterogeneity can promotecoexistence of species that share niches by temporal re-source partitioning [17]. Because ecological structure ishard to predict, even for very similar communities [18],determinants of ecological structure need to be specif-ically examined for a given community or taxonomicassemblage.
Lemur assemblages in MadagascarLemurs, the strepsirrhine primates endemic to Madagascar,have been subject to numerous studies of their biogeog-raphy and community ecology [19-23] because they arecharacterized by high α‐diversity and species assemblagescomprise many closely related species. Many lemur com-munities are phylogenetically clustered and predominatelystructured by environmental conditions [24-26], includingQuaternary climatic shifts [23,27,28]. More recently, dra-matic rates of habitat destruction and degradation have af-fected the composition of local lemur communities as well[29]. Susceptibility of lemurs to extinction from fragmentsincreased with body mass and degree of frugivory [30],whereas resilience was promoted primarily by behavioralplasticity [31].
A cheirogaleid assemblage in Menabe CentralAn assemblage of 5 relatively well studied members of thefamily Cheirogaleidae in the dry deciduous forests of Cen-tral Western Madagascar [32] qualifies as a model systemto investigate determinants of ecological structure againstthe backdrop of anthropogenic disturbances producingstrong spatial and temporal heterogeneities. These lemursare all nocturnal, arboreal, relatively small (< 1 kg) and,with one exception (see below), omnivorous.Madame Berthe’s mouse lemur (Microcebus berthae) is
the smallest known species of all primates (mean adultmass 31 g [33]). Its range is confined to Menabe Central[34], where it is only found in habitat patches >30,000 ha [35]. It coexists with the larger gray mouselemur (M. murinus: average adult mass 60 g [36,37],which has a much wider geographic distribution [38].This species has been observed in all forest types acrosssouthern and western Madagascar, including small frag-ments and the vicinity of villages [35]. The fat-taileddwarf lemur (Cheirogaleus medius) is a larger (meanadult mass: 120 g [39]) dietary generalist that undergoesmonths of hibernation during the dry cool season [40].Its geographical range is similar to that of M. murinus.Coquerel’s dwarf lemur (Mirza coquereli) is a 250 gomnivore found in the forests of central westernMadagascar [41,42] that preys upon several species ofvertebrates, including other cheirogaleids [43]. Finally, itis unlikely that interactions with the 200 g pale fork-marked lemur (Phaner pallescens) are shaping ecologicalstructure of this community, as this species is ecologic-ally differentiated from its family members due to feed-ing specialization on gum exudates and verticallyseparated by its habitat use [41,44,45].Previous studies revealed various interactions among
the other four sympatric cheirogaleids. Here, we reporton the spatial distribution of coexisting cheirogaleidsacross M. berthae’s biogeographic range. We focus onexplaining the distribution and abundance of M. berthae

Schäffler et al. BMC Ecology (2015) 15:7 Page 3 of 15
because it was only discovered after the pioneering studiesby Charles-Dominique et al. [32] and because it is one ofthe more endangered primates [46]. In addition to inter-specific interactions with coexisting cheirogaleids as deter-minants of ecological structure in this species assemblage,we also consider variation in habitat degradation.The two Microcebus species belong to different sub-
clades [38], indicating allopatric speciation and secondarycoexistence after periods of independent history. Consid-ering the differences between the mouse lemurs’ biogeo-graphic ranges as well as population densities, Microcebusspp. do not comply with ecological similarity sensu Brown[47]. Moreover, the interspecific body size ratio of Micro-cebus spp. slightly exceeds the Hutchinsonian ratio for“limiting similarity” and therefore does not clearly opposeecological differentiation [48,49]. Community-wide iso-tope analysis revealed extensive niche overlap in fruit andanimal matter (δ15N) between M. berthae, C. medius, andM. coquereli, and in basal resources (δ13C) between thetwo mouse lemurs and M. coquereli [50]. Both Microcebusspp. are omnivorous and experience similar seasonal fluc-tuations in food supply [37]. Microcebus berthae reliesmainly on insect material and its narrow feeding niche isembraced by the wider diet of M. murinus, which includeshigher amounts of fruit and gum and is subject to greaterseasonal variation [51]. The small-scale distribution ofMicrocebus individuals in Kirindy Forest did neither differin relation to the distribution of homopteran larvae col-onies (a key resource during the lean season), nor to pre-ferred sleeping sites [52]. Finally, C. medius was found topartially displace M. murinus on a local scale, whereaspositive spatial associations with M. berthae indicated re-laxed competition [37].Microcebus spp. are subject to similar top‐down control
and face intense predation pressure from several classes ofpredators, including raptors, snakes, and carnivores[53-55]. Moreover, there is evidence for opportunistic pre-dation by M. coquereli on M. murinus [43,54,56], but noton M. berthae. These intraguild predatory interactionswith third agents have not yet been examined as a poten-tial mechanism stabilizing interspecific coexistence ofMicrocebus spp., however.Based on population assessments across the complete
range of M. berthae, our study addressed two mainquestions. First, does the distribution of mouse lemursindicate competitive interactions? In case of competitiveexclusion, we expect negative complementary distribu-tions of the two mouse lemur populations. Second, is co-existence of Microcebus spp. stabilized by “third agents”?In this case, we predicted negative complementary distri-butions of M. coquereli and/ or C. medius with competi-tively superior M. murinus and spatial overlap withinferior M. berthae. In these analyses, we consider bothspatial and temporal heterogeneities to account for
dependence of competitive and intraguild predatory in-teractions on resource supply.
MethodsStudy siteThe region of Menabe Central comprises the largestremnant of Malagasy dry deciduous forest [57]. The cli-mate in this area between the Tsirihibina and Moron-dava rivers is characterized by a 4 month hot rainyseason (annual mean rainfall 800 mm) and 8 monthswithout precipitation and cool nights (as low as 3°C[58]). Forest cover in this area is being reduced at annualrates of up to 2.5% [59] by slash-and-burn agricultureand logging which have transformed pristine habitat intosecondary forest formations, scrub, and savanna [58].Roads cut into the forest for oil explorations and timberharvesting facilitate public access and anthropogenic ac-tivities such as subsistence hunting and the collection offorest products [57,60]. These activities have resulted inthree major forest patches of heterogeneous quality con-nected by degraded forest habitat (Figure 1). Ambadiraand Kirindy Forests are connected by a corridor of 5 to7 km width, and have been increasingly segregated fromthe Réserve Spéciale Andranomena. Although never ef-fectively protected, Ambadira Forest was only moder-ately accessed and considerable areas of near primaryforest persist [57]. Within Kirindy Forest, illegal activitieshave been limited by the presence of a forestry conces-sion and a research station [58]. In contrast, RS Andra-nomena is only legally protected and particularly proneto anthropogenic disturbances due to close proximity ofseveral villages.
Lemur surveysWe surveyed cheirogaleid species across Menabe Centralby repeated transect walks during 4 dry and 2 rainy sea-sons between 2003 and 2007. To this end, we established35 1-km line transects, which were evenly distributed tothe extent feasible in dense dry deciduous forest; forestareas without abandoned logging trails or oil explorationtracks were often not accessible (Figure 1). In total, wesurveyed 34 (Ambadira n = 5, corridor n = 6, Kirindy n =19, RS Andranomena n = 4) transects during dry season,and 25 (Ambadira n = 4, corridor n = 6, Kirindy n = 11,RS Andranomena n = 4) during rainy season surveys.During each survey, cheirogaleid populations were ap-
praised on 13–23 transects by line transect walks [61].Cheirogaleus medius was not included in dry season sur-veys because it spends most of this time in hibernation[40]. The great majority of transects was surveyed twiceper survey and several times over subsequent surveys,amounting to a total of 150 1-km samples. In order tocontrol for circadian variation in lemur activity, transectwalks were conducted between 6:00 p.m. and 8:30 p.m.

Figure 1 The study area in central western Madagascar, depicting forest heterogeneity and distribution of line transects acrossMenabe Central (only two of four line transects shown for RS Andranomena); map based on Landsat 7 ETM 2003, geographiccoordinates WGS84, UTM Zone 38.
Schäffler et al. BMC Ecology (2015) 15:7 Page 4 of 15
on days without rain. Two observers trained torecognize cheirogaleids in their natural habitat at nightwalked with headlights along line transects at a stan-dardized pace of about 1 km/h. Using torches and bin-oculars, they identified visually detected individuals tospecies level independently and approached individualsin great distance from the transect line for identification.In a number of cases where animals could not be identi-fied with confidence sights were recorded as ‘non identi-fied’ and excluded from subsequent analyses [61].
Ethical noteAll research reported in this manuscript is in compliancewith animal care regulations and applicable national laws
of Germany and Madagascar. All research protocolswere approved by the appropriate Animal Use and Carecommittees of Germany (Bundesamt für Naturschutz,BfN) and Madagascar (Ministère de l’Environment etdes Eaux et Forêts, MINEEF).
Habitat classificationTo take differential habitat suitability and disturbancelevels into account, we assessed the degradation of theforest surrounding each transect based on stand andunderstory density, canopy height and cover [61]. Inaddition, we exemplarily sampled forest structure along7 transects during the dry season 2007 (3 in non-degraded and 4 in degraded habitat) and along 6

Schäffler et al. BMC Ecology (2015) 15:7 Page 5 of 15
transects during the late rainy season 2008 (4 in non-degraded and 2 in degraded habitat, incl. 1 resample): 21sampling plots were established every 50 m along 1-kmline transects, located alternately on the left and rightside 25 m away from the transect. Spatial forest struc-ture was assessed by point-quarter sampling [62]: Ineach of four quarters per sample point, the distancefrom the sampling point to the center of the nearest ma-ture tree (DBH ≥ 10 cm) and of the nearest tree olderthan 10 years (5 cm ≤DBH < 10 cm) was measured, add-ing up to 84 (21 plots × 4) trees per size class and tran-sect. For each size class, we compared mean distance ofthe nearest tree of each class from the center point as ameasure of forest density on non-degraded and degradedhabitat transects (Mann–Whitney U-test). During thedry season 2007, we additionally recorded regeneratingvegetation by counting all trees of 1 cm ≤DBH < 5 cmwithin an area of 4 m × 4 m around each sample pointand tested tree numbers for differences between non-degraded and degraded habitat. In both assessments, weestimated understory density at every sampling point bysystematically positioning a white cloth at breast heightin the four compass directions at a distance of 4 metersfrom the appraiser who estimated visibility in four cat-egories (0-25%, 25-50%, 50-75%, 75-100%). Due to sub-stantial variation in foliage between dry and rainyseason, we tested understory density in 2007 and 2008separately for differences between non-degraded and de-graded habitat (Mann–Whitney U-test). Around everysampling point, we visually estimated canopy height in2007 and tested it for differences between degraded andnon-degraded habitat (Mann–Whitney U-test). Canopycover was estimated by recording whether the open skywas visible through a vertically held pipe at 25 m intervalsalong transects and respectively 25 m off the trail [35]. Assubstantial seasonal differences in visibility between sea-sons prohibited pooling of data, we tested canopy coversampled in 2007 and 2008 separately for differences be-tween non-degraded and degraded habitat. Finally, wetested variables that significantly differed between de-graded and non-degraded habitat for correlations withother forest variables (Spearman rank correlation).
Data analysesAnalyses were based on encounter rates rather than ondensity estimates as they are less fraught with assump-tions. Density estimates based on line transect surveydata rely on accurate assessment of detected individuals’perpendicular distance from the transect line and is in-fluenced by the selected detection function.
Pooling of survey data by seasonIn order to justify pooling of encounter rates per tran-sect over surveys for statistical analyses, we tested
specific encounter rates of replicate surveys for differences(F-tests in RBD with transects as blocks). Moreover, cheir-ogaleid populations show a pronounced postnuptial in-crease after the midpoint of the rainy season that mightprohibit pooling of early and late rainy season data. Inorder to detect systematic differences between pre-birthand post-birth rainy season, we compared encounter ratesfor 16 transects sampled during the early and late rainyseason (Wilcoxon signed-rank test).Cheirogaleids’ encounter rates did neither differ sig-
nificantly between repeated transect walks within singlesurveys in any of the study regions, nor between repli-cate surveys within the same season, and they were notinfluenced by demographic effects [61]. We therefore av-eraged encounter rates over repeated transect walks andover subsequent surveys. Seasonal differences in detec-tion probabilities as well as in activity patterns (e.g. sea-sonal torpor in M. murinus) were reflected in theencounter rates of M. coquereli and in hibernating C.medius [61]. In order to allow for documenting cheiro-galeids’ responses to temporal variations in food supply,we analyzed dry and rainy season data separately.
Interspecific distribution of Microcebus spp. acrossheterogeneous habitatsTo assess the importance of interspecific competition be-tween mouse lemurs as a function of spatial and temporalheterogeneities, we examined their distribution for poten-tial spatial exclusion from degraded and non-degradedhabitat transects in dry and rainy seasons, respectively.For this purpose, we tested mouse lemur encounter ratesby season for differences between degraded and non-degraded habitat in which the congener was either presentor absent (Mann–Whitney U-test), or occurred in differ-ent abundance classes (Kruskal-Wallis ANOVA). Low en-counter rates for M. berthae only afforded opportunity touse presence/absence as an explanatory factor, whereasencounter rates of abundant M. murinus allowed forcategorization into four abundance classes (M. murinus:absence, ≥ 1 and < 5 ind./km, ≥ 5 and < 10 ind./km, ≥ 10ind./km).
Determinants of regional mouse lemur distributionWe fitted log-linear models to the encounter rates of ei-ther Microcebus spp. in SPSS [63], which allow for ap-praising the relative strength of structuring factors, aswell as for detecting interactions between interspecificeffects and environmental variables.The number of transects was too low to allow for testing
all potentially influential variables and factors simultan-eously. Therefore, explanatory variables were systematic-ally added based on the results of exploratory analyses[61]. We started adding the forest regions, proxies for an-thropogenic disturbances (i.e. habitat degradation and

Schäffler et al. BMC Ecology (2015) 15:7 Page 6 of 15
distance to the nearest village), and encounter rates ofrelevant coexisting cheirogaleids before proceeding to ana-lyzing factor interactions. For each mouse lemur species,we fitted negative binomial distributions of detectionevents combined with a natural log-link function to loga-rithmic encounter rates (overdispersion indicated thatPoisson models were prone to Type I errors). Encounterrates were corrected by an offset term for varying surveyeffort (i.e. total transect length). Model fit was assessedbased on Akaike’s Information Criterion (lowest AIC/AICc), and the amount of total variation in encounterrates explained by best-fitting models was quantified bythe coefficient of determination (pseudo-R2).
ResultsHabitat classificationWe consider our ground-based classification of the for-est into non-degraded and degraded habitat reliable, asit was broadly congruent with a forest classificationbased on a Landsat ETM 7 picture (Figure 1). Non-degraded and degraded habitat did not differ in treedensity of any size class (DBH ≥ 10 cm: MWU7,5 = 8.0, p= 0.123; 5 cm ≤DBH < 10 cm: MWU7,5 = 11.0, p = 0.291),nor did we detect differences in counts of regeneratingtrees (1 cm ≤DBH < 5 cm: MWU3,4 = 4.0, p = 0.480) orunderstory density (dry season: MWU3,4 = 2.0, p = 0.150/rainy season: MWU4,2 = 2.0, p = 0.355). Canopy heightwas higher in non-degraded habitat in the available dryseason sample (MWU3,4 = 0.0, p = 0.034). Differences incanopy cover only became apparent during the dry sea-son, when it was more closed in non-degraded as in de-graded habitat (MWU3,4 = 0.0, p = 0.034), whereas rainyseason forest cover did not differ between non-degradedand degraded habitat (MWU4,2 = 0.0, p = 0.060). However,canopy cover was negatively related to the mean distanceof trees from the center point in both size categories (treesolder than 10 years with 5 cm ≤DBH< 10 cm as well asmature trees with DBH ≥ 10 cm: Spearman r = −0.637, n =12, p = 0.026). Moreover, mean distances from PCQM cen-ter points in trees of the two size classes were positivelycorrelated (Spearman r = 0.846, n = 12, p = 0.001). Thus,there are indications that closed canopy cover in non-degraded habitat is associated with higher tree density.
Interspecific distribution of Microcebus spp. acrossheterogeneous habitatsComplying with habitat partitioning along anthropo-genic disturbance gradients, mouse lemurs divergentlytracked seasonal changes in carrying capacity in non-degraded and degraded habitat. During the dry season,M. berthae was present on 62.5% of non-degraded habi-tat transects, and on 38.8% of degraded habitat transects.During the rainy season, we encountered M. berthae on72.7% of transects surveyed in non-degraded habitat, but
only on 21.4% of those in degraded habitat (for detailssee [34]). Thus, the population of M. berthae spread outto degraded habitat during the dry season, while it con-centrated in non-degraded habitat during the rainy sea-son. In contrast, M. murinus was encountered on 87.5%of transects surveyed in non-degraded habitat and on72.2% in degraded habitat during the dry season. Duringthe rainy season, M. murinus was present on 45.5% oftransects in non-degraded habitat and on 42.9% in de-graded habitat (for details see [61]). The species there-fore spread out by local dispersal during the dry seasonacross habitats, whereas its population was concentratedon fewer transects during the rainy season in both, in-tact and degraded habitat.Microcebus berthae encounter rates differed between
transects classified by M. murinus’ encounter rates onlyduring the dry season in degraded habitat (Kruskal-WallisH3,18 = 9.419, p = 0.024). In the dry season, we did notencounter any M. berthae individuals in degraded habitatwhen M. murinus was absent or occurred in mediumabundance. Microcebus berthae’s encounter rates werehighest on transects with low encounter rates of thecongener, but the species also occurred on some transectwith high M. murinus encounter rates (Figure 2a, b). Nosignificant differences in encounter rates appeared innon-degraded habitat during the dry season (H2,16 = 2.946,p = 0.229) or, regardless of habitat type, during the rainyseason (non-degraded: H3,11 = 4.139, p = 0.247; degraded:H2,14 = 0.697, p = 0.706). However, Figure 2b indicates thatduring the rainy season, M. berthae only occurred ontransects on which M. murinus was absent or present inlow abundance.We did not find differences in M. murinus’ encounter
rates between transects with M. berthae either presentor absent, regardless of season or habitat degradation(dry season, non-degraded: MWU6,10 = 21.0, p = 0.327;dry season, degraded: MWU11,7 = 25.5, p = 0.238; rainyseason, non-degraded: MWU4,7 = 11.0, p = 0.567; rainyseason, degraded: MWU11,3 = 11.5, p = 0.456).
Determinants of regional mouse lemur distribution acrossspatial and temporal heterogeneitiesMicrocebus berthaeThe distribution of M. berthae in either season was influ-enced by habitat degradation. During the dry season, wefound a positive association with M. coquereli in non-degraded habitat, but not in degraded habitat. Moreover,dry season encounter rates of M. berthae significantly rosewith increasing distance to the nearest village (Table 1).The log-linear model with the best fit to dry season en-counter rates of M. berthae explained 10.74% of total vari-ance (Figure 3).During the rainy season, we encountered more M.
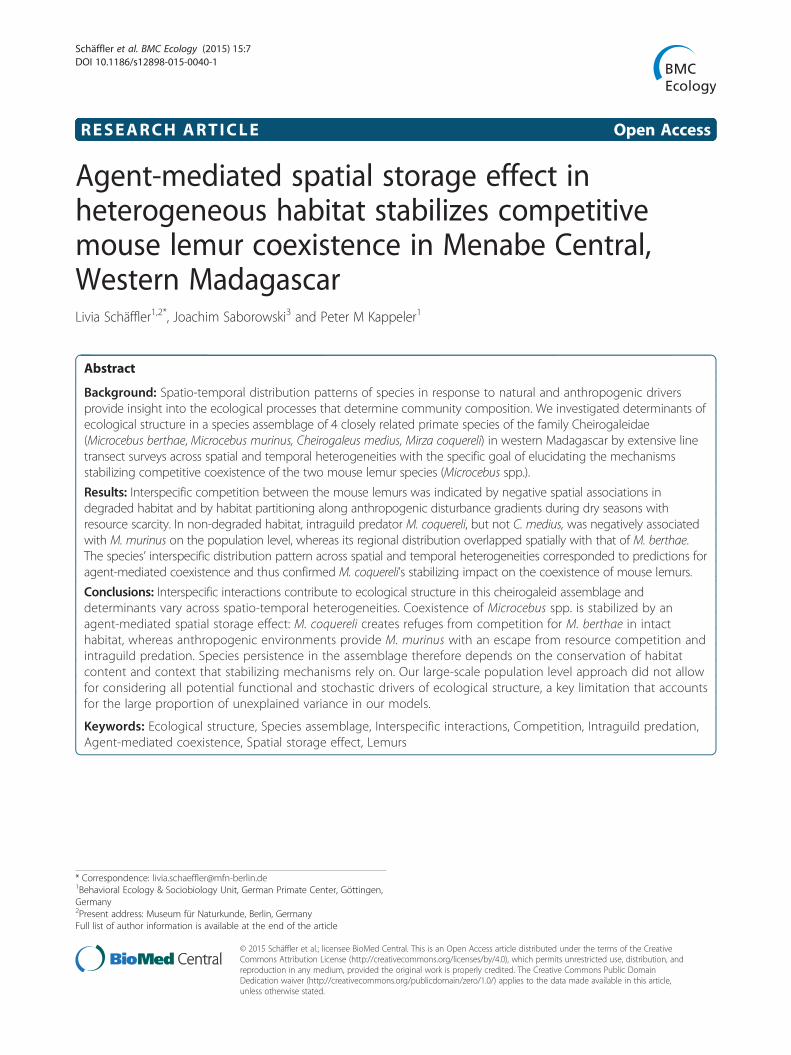
berthae in non-degraded than in degraded habitat. The

Figure 2 Encounter rates of M. berthae in [a] dry and [b] rainy season on transects with varying M. murinus encounter rates; blackfilled points and dashed line: non-degraded habitat, green circles and continuous line: degraded habitat; abundance classes: absent,low (< 5 ind./km), medium (5 ≤ ind./km < 10) and high (≥ 10 ind./km).
Schäffler et al. BMC Ecology (2015) 15:7 Page 7 of 15
positive association of M. berthae with M. coquereli wasindependent of habitat degradation, but non-significant,and the population distribution was not related to thedistance from villages (Table 2). The best fitting log-linear model accounted for 13.05% of total variance inrainy season encounter rates (Figure 4).
Microcebus murinusDuring the dry season, M. murinus’ distribution variedregionally, with significantly lower encounter rates inAmbadira compared to other forests. Moreover, M.murinus was negatively associated with M. coquereli innon-degraded habitat, and encounter rates decreasednon-significantly with increasing distance from a village(Table 3). In order to enhance comprehensibility, modelpredictions and observations are only shown forKirindy Forest in Figure 5. The dry season model ex-plained 10.25% of total variance in M. murinus’ en-counter rates.Rainy season data yielded a negative interspecific as-
sociation with M. coquereli in non-degraded habitat(Figure 6). Regional variation in the distribution of M.murinus across forest regions was non-significant, and
Table 1 Dry season modelling results for M. berthae
n (transects) Survey effort [km]
34 96
Dry season model coefficients
Constant term
Factor interactions ER_Mc.ds in non-degraded habitat
ER_Mc.ds in degraded habitat
Distance to nearest village(*), Significance level 0.1 > p ≥ 0.05; *, significance level 0.05 > p ≥ 0.01; **, significa
vicinity to villages did not have any effect. Rainy seasonpredictions were based on coefficients given in Table 4and the model term accounted for 9.11% of totalvariance.
DiscussionThe mouse lemurs’ regional distribution across spatio-temporal heterogeneities was negatively complemen-tary and indicated habitat partitioning when resourceswere scarce and where coexistence stabilizing mecha-nisms were lacking. Interspecific distribution of themouse lemur species in relation to M. coquereli com-plied with predictions derived from the hypothesis of athird agent’s coexistence stabilizing impact: In eitherseason, log-linear models suggested that M. coquereliregulates M. murinus’ abundance predominately innon-degraded habitat, which M. berthae essentially re-lies on [34], whereas M. berthae’s regional distributionlargely matched that of M. coquereli. In contrast, wefound no consequences of interspecific interactionswith C. medius for the spatial population structure ofmouse lemurs.
n (obs) AIC AICc pseudo-R2
69 116.070 117.45 10.74%
B df p
−2.075
1.148 1 0.019*
−0.09 1 0.845
0.211 1 0.016*
nce level p < 0.01.

Figure 3 Observed dry season encounter rates of M. berthae (points) and predictions by log-linear model (curved surfaces) in [a]non‐degraded (n = 16, model equation: ER_Mb.ds = exp(−2.075 + 1.148*ER_Mc.ds + 0.211*dist.village)) and [b] degraded habitat (n = 18,model equation: ER_Mb.ds = exp(−2.075-0.09*ER_Mc.ds + 0.211*dist.village)) across Menabe Central; deviance of observed encounterrates from model predictions are represented by dashed lines.
Schäffler et al. BMC Ecology (2015) 15:7 Page 8 of 15
Direct interspecific interactions: interspecific competitionin Microcebus spp.Local movements of mammalian dietary specialists to trackresources in seasonally dry tropical forests are widespread[64], and there is evidence that community dynamicschange in response to localized resource heterogeneity[65]. Thus, a spatial storage effect in a permanent spatio-temporally heterogeneous environment represents a plaus-ible mechanism facilitating coexistence in Microcebus spp.:the two mouse lemurs are relieved from intense interspe-cific competition in heterogeneous habitat types at differ-ent times of the year, and competitive exclusion isprevented by retreat into the respective refuges.During the dry season, M. berthae’s expansion to de-
graded habitat may be a consequence of resource track-ing along forest edges, where homopteran larvaeaggregate [66]. Yet, the species evaded anthropogenic
Table 2 Rainy season modelling results for M. berthae
n (transects) Survey effort [km] n (obs) AIC AICc pseudo-R2
25 56 40 73.826 74.969 13.05%
Rainy season model coefficients B df p
Constant term −2.289
Non-degraded habitat 2.007 1 0.005**
Degraded habitat 0
ER_Mc.rs 0.681 1 0.094(*)
(*), Significance level 0.1 > p ≥ 0.05; *, significance level 0.05 > p ≥ 0.01; **,significance level p < 0.01.
environments at this time of the year, when increasedforest accessibility may favor human frequentation [57].Concentration in non-degraded habitat during the rainyseason complies with most pronounced productivityincreases in intact forest. During the dry season, thepopulation of M. murinus was more dispersed thanduring the rainy season, and positive spatial associationwith villages was only vaguely indicated. Anthropogenicenvironments may provide M. murinus with exclusiveresources and relax interspecific competition with M.berthae in degraded habitat at a greater distance fromvillages. Alternatively, M. murinus might be excludedfrom forest edges at a greater distance from villages byinterspecific interactions and be crowded into anthropo-genic environments that are not suitable for sympatricspecies. Behavioral observations of interspecific interac-tions at feeding sites suggested feeding priority ofM. murinus [52], making spatial exclusion by direct in-teractions with M. berthae therefore unlikely. Absencefrom some degraded habitat transects during the dryseason is in line with the finding that suitability of de-graded habitat is limited even for disturbance-tolerantM. murinus: the capacity to enter daily torpor is con-strained by fewer resting holes and higher ambient tem-peratures in secondary habitat, and individuals havelower body mass and higher mortality risk than inprimary forest [67]. Occurrence of M. murinus in highabundances on some non-degraded habitat transectsthat was limited to the rainy season is likely a result ofcapacity tracking [68].
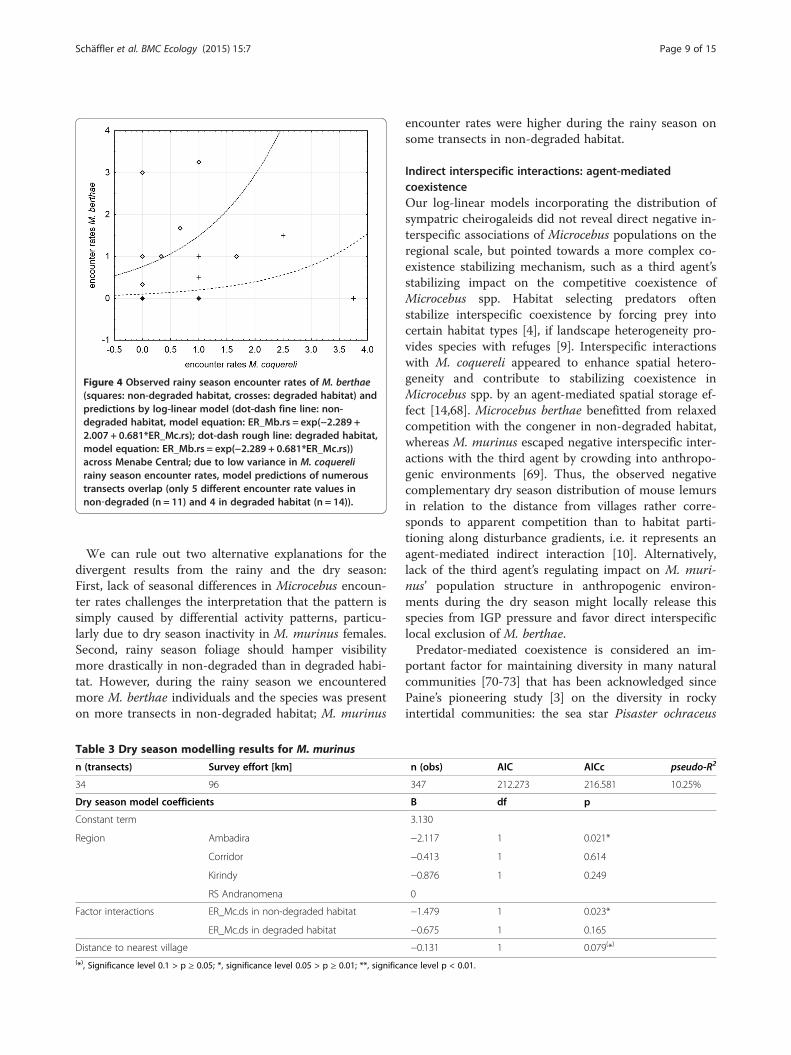
Figure 4 Observed rainy season encounter rates of M. berthae(squares: non-degraded habitat, crosses: degraded habitat) andpredictions by log-linear model (dot-dash fine line: non-degraded habitat, model equation: ER_Mb.rs = exp(−2.289 +2.007 + 0.681*ER_Mc.rs); dot-dash rough line: degraded habitat,model equation: ER_Mb.rs = exp(−2.289 + 0.681*ER_Mc.rs))across Menabe Central; due to low variance in M. coquerelirainy season encounter rates, model predictions of numeroustransects overlap (only 5 different encounter rate values innon‐degraded (n = 11) and 4 in degraded habitat (n = 14)).
Schäffler et al. BMC Ecology (2015) 15:7 Page 9 of 15
We can rule out two alternative explanations for thedivergent results from the rainy and the dry season:First, lack of seasonal differences in Microcebus encoun-ter rates challenges the interpretation that the pattern issimply caused by differential activity patterns, particu-larly due to dry season inactivity in M. murinus females.Second, rainy season foliage should hamper visibilitymore drastically in non-degraded than in degraded habi-tat. However, during the rainy season we encounteredmore M. berthae individuals and the species was presenton more transects in non-degraded habitat; M. murinus
Table 3 Dry season modelling results for M. murinus
n (transects) Survey effort [km]
34 96
Dry season model coefficients
Constant term
Region Ambadira
Corridor
Kirindy
RS Andranomena
Factor interactions ER_Mc.ds in non-degraded habitat
ER_Mc.ds in degraded habitat
Distance to nearest village(*), Significance level 0.1 > p ≥ 0.05; *, significance level 0.05 > p ≥ 0.01; **, significa
encounter rates were higher during the rainy season onsome transects in non-degraded habitat.
Indirect interspecific interactions: agent-mediatedcoexistenceOur log-linear models incorporating the distribution ofsympatric cheirogaleids did not reveal direct negative in-terspecific associations of Microcebus populations on theregional scale, but pointed towards a more complex co-existence stabilizing mechanism, such as a third agent’sstabilizing impact on the competitive coexistence ofMicrocebus spp. Habitat selecting predators oftenstabilize interspecific coexistence by forcing prey intocertain habitat types [4], if landscape heterogeneity pro-vides species with refuges [9]. Interspecific interactionswith M. coquereli appeared to enhance spatial hetero-geneity and contribute to stabilizing coexistence inMicrocebus spp. by an agent-mediated spatial storage ef-fect [14,68]. Microcebus berthae benefitted from relaxedcompetition with the congener in non-degraded habitat,whereas M. murinus escaped negative interspecific inter-actions with the third agent by crowding into anthropo-genic environments [69]. Thus, the observed negativecomplementary dry season distribution of mouse lemursin relation to the distance from villages rather corre-sponds to apparent competition than to habitat parti-tioning along disturbance gradients, i.e. it represents anagent-mediated indirect interaction [10]. Alternatively,lack of the third agent’s regulating impact on M. muri-nus’ population structure in anthropogenic environ-ments during the dry season might locally release thisspecies from IGP pressure and favor direct interspecificlocal exclusion of M. berthae.Predator-mediated coexistence is considered an im-
portant factor for maintaining diversity in many naturalcommunities [70-73] that has been acknowledged sincePaine’s pioneering study [3] on the diversity in rockyintertidal communities: the sea star Pisaster ochraceus
n (obs) AIC AICc pseudo-R2
347 212.273 216.581 10.25%
B df p
3.130
−2.117 1 0.021*
−0.413 1 0.614
−0.876 1 0.249
0
−1.479 1 0.023*
−0.675 1 0.165
−0.131 1 0.079(*)
nce level p < 0.01.

Figure 5 Observed dry season encounter rates of M. murinus (points) and predictions by log-linear model (curved surfaces) in [a]non‐degraded (n = 12, model equation: ER_Mm.ds = exp(3.130-0.876-1.479*ER_Mc.ds-0.131*dist.village) and [b] degraded habitat(n = 7, model equation: ER_Mm.ds = exp(3.130-0.876-0.675*ER_Mc.ds-0.131*dist.village) within Kirindy Forest; deviance of observedencounter rates from model predictions are represented by dashed lines.
Schäffler et al. BMC Ecology (2015) 15:7 Page 10 of 15
preys upon two competing sessile mussel species (Myti-lus californianus and M. trossulus) and prevents exclu-sion of the inferior competitor by preferential predationon the stronger competitor (but see also [74]). Competi-tors that share a common predator have been found tobe distributed along various environmental stress gradi-ents in many natural systems (e.g. freshwater communi-ties in temporary ponds [75]).The pattern observed in this cheirogaleid assemblage
complies with predictions of species interaction modelsinvolving two species that share resources and a com-mon predator and outcompete each other in the differ-ent tasks [76,77]: Predators facilitate interspecificcoexistence of prey predominately at intermediate levelsof productivity with intermediate predation risk, as ob-served for the mouse lemurs during the dry season innon-degraded habitat and during the rainy season in de-graded habitat. By contrast, the superior competitordominates at low resource supply (and low predationrisk), a prediction that was met during the dry season bythe negative spatial association of the mouse lemurs indegraded habitat and by the largely exclusive occupancyof anthropogenic environments by M. murinus. At highproductivity levels and high predation risk, the predator-resistant inferior competitor dominates, correspondingto the aggregation of M. berthae in non-degraded habitatduring the rainy season, where it spatially overlappedwith the population of M. coquereli. Opportunistic pre-dation on M. murinus in non-degraded habitat during
the dry season therefore represents a plausible determin-ant of ecological structure. During the rainy season, M.coquereli’s regulative impact on M. murinus populationmay alternatively be attributed to intensified feedingcompetition among capacity-tracking cheirogaleids inproductive habitat. This would comply with extensiveniche overlap in basal resources between the mouse le-murs and M. coquereli [50]. However, competition alonecannot explain the observed interspecific distributionpattern, as M. berthae is not competitively excluded byM. coquereli although the two species are isotopically in-distinguishable in fruit and animal matter as well as inbasal resources. We therefore conclude that M. coquerelican be attributed the role of a “keystone (intraguild)predator” that controls the abundance of a primary con-sumer by preferential predation and/ or resource compe-tition, which in turn is capable of excluding otherspecies from the community (for the key-stone speciesconcept see [78]).Proposed mechanisms of predator-mediated coexistence
include predator preference switching to the most com-mon prey, predators preferring the dominant competitor,and predators altering the resources used by competingprey, thereby affecting competition between them [79].Predator‐mediated coexistence of Microcebus spp. was ex-cluded earlier due to assumed similarity and the same sea-sonal variations in predation risk [37], but in particular asM. berthae’s mortality rates exceeded that of superior com-petitor M. murinus [52]. However, given the great variety

Figure 6 Observed rainy season encounter rates of M. murinus(squares: Ambadira Forest, crosses: corridor, circles: KirindyForest) and predictions by log-linear model (dot-dash roughline: Ambadira Forest, dot-dash fine line: corridor, continuousline: Kirindy Forest) in non‐degraded habitat (n = 11) acrossMenabe Central; due to low variance in M. coquereli rainy seasonencounter rates, model predictions of numerous transectsoverlap (only 5 different encounter rate values in non‐degradedhabitat); RS Andranomena not represented as it entirely consistsof degraded habitat; model equations for non-degraded habitat inAmbarida Forest: ER_Mm.rs = exp(1.878-2.128-1.841*ER_Mc.rs), inthe corridor: ER_Mm.rs = exp(1.878-0.320-1.841*ER_Mc.rs), inKirindy Forest: ER_Mm.rs = exp(1.878-0.077-1.841*ER_Mc.rs).
Schäffler et al. BMC Ecology (2015) 15:7 Page 11 of 15
of potential anti‐predator strategies and the high selectionpressure, mouse lemurs may likely have evolved divergentbehavioral responses and therefore be differentially af-fected by specific (intraguild) predators [80]. Moreover,predators usually favor one particular species among a setof potential prey, either via specific preference or densitydependence [10,13], and reduce the relative abundance ofthe preferred prey [81]. Even if predation risk is sharedamong prey, negative effects of predation on a species can
Table 4 Rainy season modelling results for M. murinus
n (transects) Survey effort [km]
25 56
Rainy season model coefficients
Constant term
Region Ambadira
Corridor
Kirindy
RS Andranomena
Factor interactions ER_Mc.rs in non-degraded habitat
ER_Mc.rs in degraded habitat(*), Significance level 0.1 > p ≥ 0.05; *, significance level 0.05 > p ≥ 0.01; **, significa
be coupled with an indirect positive effect of a competitorbeing consumed [82,83].Mouse lemur coexistence can be stabilized via oppor-
tunistic predation by M. coquereli irrespective of the ques-tion whether the prey species is selected by specificpreference or in a density‐dependent manner: Predationhas the potential to stabilize coexistence among prey spe-cies if it is directed preferentially towards the most fre-quent by preventing competitive exclusion [70,84]. In caseof density‐dependent predation, M. coquereli would alsocapture disproportionally more M. murinus individuals,which are easier to locate as they occur in higher densities[61] and are clumped in space [51,85]. Differential preda-tion or competitive pressure exerted by M. coquereli onthe two mouse lemur species is still to be shown by behav-ioral studies. However, IGP does not only operate viapredatory interactions, but also via interspecific competi-tion, and effects of an intraguild predator on the ecologicalstructure in assemblages of closely related species aretherefore rather likely.We did not find indications for C. medius acting as a third
agent on a regional scale to shape the spatial populationstructure of Microcebus populations. Lack of positive spatialassociation between M. berthae and C. medius on the popu-lation level may be due to differential microhabitat prefer-ences [37]. Interspecific spatial exclusion of M. murinusdespite overlapping ecological requirements might be pre-vented by this mouse lemur’s acceptance of habitats unsuit-able to C. medius, which therefore represent competitor-freerainy season refuges. Our data do not allow for drawingconclusions on the situation during the dry season, but hi-bernating C. medius presumably reduce the number ofsleeping holes available forM. murinus to some extent.
Community composition and system stability in view ofhabitat changeThe ecological structure in the cheirogaleid assemblagearises from two general niche-based processes that deter-mine the structure of many communities: convergence of
n (obs) AIC AICc pseudo-R2
229 162.932 167.599 9.11%
B df p
1.878
−2.128 1 0.096(*)
−0.320 1 0.644
−0.077 1 0.902
0
−1.841 1 0.004**
0.021 1 0.964
nce level p < 0.01.

Schäffler et al. BMC Ecology (2015) 15:7 Page 12 of 15
coexisting species due to environmental filtering (trait‐based assembly rules [86]) and divergence resulting frominterspecific interactions (niche-based assembly rules[77]). The closely related species comprising the cheiroga-leid assemblage are more similar than expected from ran-dom assortment, most likely in consequence ofoverlapping ecological requirements as in many naturalcommunities (mammals [87], isopods [88], dyscids [89]).On the other hand, we observed consequences of inter-specific interactions on the spatial population structure ofthe mouse lemurs, which have been identified as a majorstructuring force in many taxonomic assemblages (trees[90], desert rodents [91-93], pond snails [94], tadpoles[95]).Our results emphasize the importance of habitat quality
and heterogeneity for system stability. Low productivitypromotes competitive exclusion and hampers the coexist-ence of ecologically similar species [91]. In line with theor-etical knowledge [76,77], α‐diversity in lemurs is highest atmedium disturbance levels [96] and drops with increasingagricultural intensity [97]. Accordingly, this cheirogaleidassemblage was deprived of one or more species whereanthropogenic pressure is particularly intense. For ex-ample, the species particularly susceptible to anthropo-genic disturbances were common in Ambadira, butlargely absent from RS Andranomena. As in many naturalsystems [12,75,98-103], such habitat heterogeneity pro-vides cheirogaleid species with refuges from detrimentalinterspecific interactions and allows for coexistence on aregional scale. White‐footed mice in a fragmented land-scape, for example, were released from interspecific com-petition with larger granivores in smaller patches, whereasthey were excluded from larger patches [104].Changes in habitat content and context affect different
species in different ways and alter the structure of com-munities [31,105,106]. Habitat reduction alters the levelof interspecific competition and predation pressure[107-111], and anthropogenic habitat fragmentation af-fects specialist species more severely than generalists[112]. Within isolated subpopulations, competitive pres-sure can increase to a level that causes local interspecificexclusion [113] and the effects that predators exert onprey populations may aggravate. If fragmentation ham-pers recolonization of suitable patches, local extinctioncan be irreversible [30]. Occurrence of North Americangray squirrels in an agriculturally fragmented landscapewas positively related to the size of remaining fragments,whereas sympatric red squirrels could only persist inpatches providing particular resources and were ex-cluded from patches occupied by gray squirrels due toincreased competition [114]; fragmentation additionallyprevented (re-)colonization of isolated patches and con-sequently affected community structure in some squirrelspecies [115].
Populations do not necessarily respond linearly tohabitat loss and fragmentation, but can decline abruptlyover a narrow range of habitat impairment when extinc-tion thresholds are exceeded [116]. Given the complexityof ecological communities, any species’ removal oraddition will have indirect effects on multiple levels [83].Loss of a single species, even if originally rare, may trig-ger an extinction cascade that potentially extends to alarge number of species and therefore may have dra-matic consequences for community stability [117]. Ex-tinction of predators intensifies the impact of habitatloss on regional abundance of prey species, which areconsequently threatened with local extinction [118].Particularly incidental prey for generalist predatorswere found more imperiled than the predators by habi-tat degradation and to face the greatest risk of extinc-tion [119]. Consequences of keystone predator lossesare exemplified by the destruction of macrophyte asso-ciations due to increased herbivory by sea urchins afterremoval of sea otters [120], or by the displacement ofSan Joaquin kit foxes following population increases incoyotes after local extinction of North Americanwolves [121].Given that interspecific interactions in heterogeneous
habitat shape the ecological structure of our cheirogaleidassemblage, system stability essentially depends on thepreservation of habitat content and context. In view ofthe ongoing population decline in third agent M. coquereliacross the species’ entire range (more than 50% over aperiod of 10 years), the species was recently rated as endan-gered [122]. On a regional scale, extensive population fluc-tuations in M. coquereli [123] are compensated byimmigration from adjacent populations [124], but con-tinuing fragmentation may put M. coquereli at risk of ex-tinction from patches that are too remote to allow forrecolonization. As predator removal will have the stron-gest effect on species in trophic levels beneath it when theprey are most extensively engaged in competition [125],loss of M. coquereli would likely corrupt ecological struc-ture in the cheirogaleid assemblage and ultimately driveM. berthae to extinction. Thus, conservation of remaininghigh quality habitats as well as retaining their connectivitywill be crucial to prevent biodiversity loss in MenabeCentral.
ConclusionsOur results hint at the complexity of factors determiningecological structure in this small primate assemblage, in-cluding the mechanism stabilizing mouse lemur coexist-ence, which depend on both spatial and temporal habitatheterogeneity. On a methodological note, the spatialscale of this study justifies the phenomenological meas-ure of abundance, even if it may not be the most appro-priate way to characterize how species respond to

Schäffler et al. BMC Ecology (2015) 15:7 Page 13 of 15
habitat heterogeneity: treating populations as entitiesdoes neither account for the major components of popu-lation change [126], nor for divergent reactions of indi-viduals and age‐specific behaviors [127], which canfundamentally change interspecific interactions and thelikelihood for spatial exclusion [9]. Finally, the bestmodels left a large proportion of the total variation inmeasures of abundance unexplained. A key limitation ofthe species-oriented approach is that not all importantvariables can be included in analyses of ecological struc-ture [126]. In order to extend our approach from the as-semblage to the community level, additional variablesshould be incorporated in multivariate analyses, such asfloristic diversity [96] or the distribution of key resources[52]. Finally, neutral assembly processes (ecological driftand dispersal limitation) need to be considered in order toassess the relative contribution of stochastic and determin-istic drivers to ecological community structure [24,128].
AbbreviationsIGP, Intraguild predation; RS, Réserve Spéciale; δ13C, Isotopic signature:delta-C-13 is a measure of the ratio of stable isotopes 13C:12C [‰];δ15N, Isotopic signature: delta-N-15 is a measure of the ratio of 15N:14N [‰];SPSS, Software package for statistical analysis; DBH, Diameter at breastheight; RBD, Randomized Block Design; AIC, Akaike’s Information Criterion;AICc, AIC with a correction for finite sample sizes; pseudo-R2, Coefficient ofdetermination; B, Log-linear model coefficient; df, Degrees of freedom;ind., Individuals; ER, Encounter rate [ind./km]; Mb, Microcebus berthae;Mm, Microcebus murinus; Mc, Mirza coquereli; ds, Dry season; rs, Rainy season;dist.village, Distance to the nearest village; dist.village, Distance to thenearest village; (*), significance level 0.1 > p ≥ 0.05; *, significance level 0.05 >p ≥ 0.01; **, significance level p < 0.01; DPZ, German Primate Center GmbH;PCI, Primate Conservation, Inc.; CI, Conservation International; DWTC, DurrellWildlife Conservation Trust; CAFF/CORE, committee approving research inMadagascar, consisting of representatives of Madagascar National Parks, theMinistry of the Environment, Forests and Tourism (MEFT), and theMinistry of Higher Education; ANGAP, Malagasy National Association forthe Management of Protected Areas.
Competing interestsThe authors declare that they have no competing interests.
Authors’ contributionsLS designed the study, raised funds for field work, collected and analyzeddata, and drafted the manuscript. PMK supervised the study, provided theresearch facility, supported funding, and was involved in drafting themanuscript. JS contributed to statistical analyses and interpretation of data.PMK and JS critically revised the final manuscript, gave final approval of theversion to be published, and agreed to be accountable for all aspects of thework. All authors read and approved the final manuscript.
AcknowledgementsThis study was completed with financial support from the German Primate Center(DPZ), Primate Conservation (PCI), Margot Marsh Biodiversity Foundation fundadministered by Conservation International (CI), Durrell Wildlife Conservation Trust(DWTC) and with authorization by the CAFF/CORE committee and the NationalAssociation for the Management of Protected Areas (ANGAP). We thank NielsenRabarijaona, Rémy Ampataka, Raza Rakotonirina, Jean-Pierre Tolonjanahary andTiana Andrianjanahary for their expert assistance and outstanding commitment tothe surveys and Léonard Razafimanantsoa and Rodin Rasoloarison for logisticsupport during fieldwork.
Author details1Behavioral Ecology & Sociobiology Unit, German Primate Center, Göttingen,Germany. 2Present address: Museum für Naturkunde, Berlin, Germany.3Department Ecoinformatics, Biometrics and Forest Growth, and Department
Ecosystem Modelling, Büsgen-Institute, Georg-August University ofGöttingen, Göttingen, Germany.
Received: 10 October 2014 Accepted: 18 February 2015
References1. Stokstad E. On the origin of ecological structure. Science. 2009;326:33–6.2. Diamond JM. Assembly of species communities. In: Cody ML, Diamond JM,
editors. Ecology and Evolution of Communities. Cambridge: HarvardUniversity Press; 1975. p. 342–444.
3. Paine RT. Food web complexity and species diversity. Am Nat.1966;100:65–75.
4. Holt RD. Spatial heterogeneity, indirect interactions, and the coexistence ofprey species. Am Nat. 1984;124:377–406.
5. Sih A, Crowley P, McPeek M, Petranka J, Strohmeier K. Predation,competition, and prey communities: a review of field experiments. Ann RevEcol Syst. 1985;16:269–311.
6. Hart D. Predation on primates: A biogeographical analysis. In: Gursky SL,Nekaris KAI, editors. Primate Anti-predator Strategies. New York: SpringerScience+Business Media; 2007. p. 27–59.
7. Polis GA, Myers CA, Holt RD. The ecology and evolution of intraguildpredation. Ann Rev Ecol Syst. 1989;20:297–330.
8. Polis GA, Holt RD. Intraguild predation: the dynamics of complex trophicinteractions. Trends Ecol Evol. 1992;7:151–5.
9. Holt RD, Polis GA. A theoretical framework for intraguild predation. Am Nat.1997;149:745–64.
10. Holt RD, Lawton JH. The ecological consequences of shared naturalenemies. Ann Rev Ecol Syst. 1994;25:495–520.
11. Bonsall MB, Hassell MP. Apparent competition structures ecologicalassemblages. Nature. 1997;388:371–3.
12. Bonsall MB, Holt RD. The effects of enrichment on the dynamics ofapparent competitive interactions in stage-structured systems. Am Nat.2003;162:780–95.
13. Chesson P. Mechanisms and maintenance of species diversity. Annu RevEcol Syst. 2000;31:343–66.
14. Chesson P. General theory of competitive coexistence in spatially-varyingenvironments. Theor Popul Biol. 2000;58:211–37.
15. Pardini R, Marques De Souza S, Braga-Neta R, Metzger JP. The role of foreststructure, fragment size and corridors in maintaining small mammalabundance and diversity in an Atlantic forest landscape. Biol Conserv.2005;124:253–66.
16. Kareiva P. Population dynamics in a spatially complex environment: theoryand data. Philos Trans R Soc Lond B. 1990;330:175–90.
17. Chesson P, Huntly N. The roles of harsh and fluctuating conditions in thedynamics of ecological communities. Am Nat. 1997;150:519–53.
18. Fariña JM, Silliman BR, Bertness MD. Can conservation biologists rely onestablished community structure rules to manage novel systems? … Not insalt marshes. Ecol Appl. 2009;19:413–22.
19. Martin RD. Adaptive radiation and behaviour of the Malagasy lemurs. PhilosTrans R Soc Lond B. 1972;264:295–352.
20. Ganzhorn JU. Food partitioning among Malagasy primates. Oecologia.1988;75:436–50.
21. Ganzhorn JU. Niche separation of seven lemur species in the easternrainforest of Madagascar. Oecologia. 1989;79:279–86.
22. Ganzhorn JU. Test of Fox's assembly rule for functional groups in lemurcommunities in Madagascar. J Zool. 1997;241:533–42.
23. Wilmé L, Goodman SM, Ganzhorn JU. Biogeographic evolution ofMadagascar's microendemic biota. Science. 2006;312:1063–5.
24. Beaudrot LH, Marshall AJ. Primate communities are structured more bydispersal limitation than by niches. J Anim Ecol. 2010;80:332–41.
25. Kamilar JM, Beaudrot L, Reed KE. The influences of species richness andclimate on the phylogenetic structure of African haplorrhine andstrepsirrhine primate communities. Int J Primatol. 2014. doi10.1007/s10764-10014-19784-10762.
26. Bannar-Martin KH. Primate and nonprimate mammal community assembly:The influence of biogeographic barriers and spatial scale. Int J Primatol.2014. doi10.1007/s10764-10014-19792-10762.
27. Vences M, Wollenberg KC, Vieites DR, Lees DC. Madagascar as a modelregion of species diversification. Trends Ecol Evol. 2009;24:456–65.

Schäffler et al. BMC Ecology (2015) 15:7 Page 14 of 15
28. Markolf M, Kappeler PM. Phylogeographic analysis of the true lemurs (genusEulemur) underlines the role of river catchments for the evolution ofmicro-endemism in Madagascar. Front Zool. 2013;10:70.
29. Schwitzer C, Mittermeier RA, Johnson SE, Donati G, Irwin M, Peacock H,et al. Averting lemur extinctions amid Madagascar's political crisis. Science.2014;343:842–3.
30. Irwin MT, Raharison J-L, Wright PC. Spatial and temporal variability inpredation on rainforest primates: do forest fragmentation and predation actsynergistically? Anim Conserv. 2009;12:220–30.
31. Irwin MT, Wright PC, Birkinshaw C, Fisher BL, Gardner CJ, Glos J, et al.Patterns of species change in anthropogenically disturbed forests ofMadagascar. Biol Conserv. 2010;143:2351–62.
32. Charles-Dominique P, Cooper HM, Hladik A, Hladik CM, Pages E, Pariente GF,et al. Nocturnal Malagasy primates: Ecology, physiology and behavior. NewYork: Academic Press; 1980.
33. Rasoloarison RM, Goodman SM, Ganzhorn AW. Taxonomic revision ofmouse lemurs (Microcebus) in the western portions of Madagascar. Int JPrimatol. 2000;21:963–1019.
34. Schäffler L, Kappeler PM. Distribution and abundance of the world’s smallestprimate, Microcebus berthae, in Central Western Madagascar. Int J Primatol.2014;35:557–72.
35. Ganzhorn JU, Goodman SM, Dehgan A. Effects of forest fragmentation onsmall mammals and lemurs. In: Goodman SM, Benstead JP, editors. TheNatural History of Madagascar. Chicago: University Chicago Press; 2003.p. 1228–34.
36. Schmid J, Kappeler PM. Sympatric mouse lemurs (Microcebus spp.) inWestern Madagascar. Folia Primatol. 1994;63:162–70.
37. Schwab D, Ganzhorn JU. Distribution, population structure and habitat useof Microcebus berthae compared to those of other sympatric Cheirogaleids.Int J Primatol. 2004;25:307–30.
38. Weisrock DW, Rasoloarison RM, Fiorentino I, Ralison JM, Goodman SM,Kappeler PM, et al. Delimiting species without nuclear monophyly inMadagascar’s mouse lemurs. PLoS One. 2010;5:e9883.
39. Fietz J. Primates: Cheirogaleus, Dwarf Lemurs or Fat-tailed Lemurs.In: Goodman SM, Benstead JP, editors. Natural History of Madagascar, vol.1307–1309. Chicago: University Chicago Press; 2003.
40. Dausmann KH, Glos J, Ganzhorn JU, Heldmaier G. Hibernation in a tropicalprimate. Nature. 2004;429:825–6.
41. Hladik CM, Charles-Dominique P, Petter JJ. Feeding strategies of fivenocturnal prosimians in the dry deciduous forest of the west coast ofMadagascar. In: Charles-Dominique P, Cooper HM, Hladik A, HladikCM, Pages E, Pariente GF, Petter-Rousseaux A, Petter JJ, Schilling A,editors. Nocturnal Malagasy Primates. New York: Academic Press;1980. p. 41–73.
42. Kappeler PM. Mirza coquereli, Coquerel's dwarf lemur. In: Goodman SM,Benstead JP, editors. The Natural History of Madagascar. Chicago: UniversityChicago Press; 2003. p. 1316–8.
43. Schliehe-Diecks S, Markolf M, Huchard E. When big lemurs swallow up smallones: Coquerel’s dwarf lemur as a predator of grey mouse lemurs andendemic rodents. Lemur News. 2010;15:13–4.
44. Charles-Dominique P, Petter JJ. Ecology and social life of Phaner furcifer.In: Charles-Dominique P, Cooper HM, Hladik A, Hladik CM, Pages E, ParienteGF, Petter-Rousseaux A, Petter JJ, Schilling A, editors. Nocturnal MalagasyPrimates. New York: Academic Press; 1980. p. 75–96.
45. Schülke O. Phaner furcifer, Fork-marked Lemur, Vakihandry, Tanta. In:Goodman SM, Benstead JP, editors. The Natural History of Madagascar.Chicago: University Chicago Press; 2003. p. 1318–20.
46. Schwitzer C, Mittermeier RA, Rylands AB, Taylor LA, Chiozza F, WilliamsonEA, et al. Primates in peril: The world’s 25 most endangered primates 2012–2014. Arlington, VA: IUCN SSC Primate Specialist Group (PSG), InternationalPrimatological Society (IPS), Conservation International (CI), and BristolZoological Society; 2014.
47. Brown JH. On the relationship between abundance and distribution ofspecies. Am Nat. 1984;124:255–79.
48. Hutchinson GE. Homage to Santa Rosalia, or why are there so many kindsof animals? Am Nat. 1959;93:145–59.
49. MacArthur RH, Levins R. The limiting similarity, convergence and divergenceof coexisting species. Am Nat. 1967;101:377–85.
50. Dammhahn M, Kappeler PM. Stable isotope analyses reveal dense trophicspecies packing and clear niche differentiation in a Malagasy primatecommunity. Am J Phys Anthropol. 2014;153:249–59.
51. Dammhahn M, Kappeler PM. Scramble or contest competition over food insolitarily foraging mouse lemurs (Microcebus spp): New insights from stableisotopes. Am J Phys Anthropol. 2010;141:181–9.
52. Dammhahn M, Kappeler PM. Small-scale coexistence of two mouse lemurspecies (Microcebus berthae and M murinus) within a homogeneouscompetitive environment. Oecologia. 2008;157:473–83.
53. Goodman SM, O'Connor S, Langrand O. A review of predation on lemurs:implications for the evolution of social behavior in small, nocturnalprimates. In: Kappeler P-M, Ganzhorn JU, editors. Lemur Social Systems andTheir Ecological Basis. New York & London: Plenum Press; 1993. p. 51–66.
54. Goodman SM. Predation on lemurs. In: Goodman SM, Benstead JP, editors.The Natural History of Madagascar. Chicago: University of Chicago Press;2003. p. 1221–8.
55. Scheumann M, Rabesandratana A, Zimmermann E. Predation,communication, and cognition in lemurs. In: Gursky SL, Nekaris KAI, editors.Primate Anti-predator Strategies. New York: Springer Science+BusinessMedia; 2007. p. 100–26.
56. Fichtel C. Costs of alarm calling: lemur alarm calls attract fossas. LemurNews. 2009;14:53–5.
57. Smith AP, Horning N, Moore D. Regional biodiversity planning and lemurconservation with GIS in Western Madagascar. Conserv Biol. 1997;11:498–512.
58. Sorg JP, Ganzhorn JU, Kappeler PM. Forestry and research in the KirindyForest/ Centre de Formation Professionnelle Forestière. In: Goodman SM,Benstead JP, editors. The Natural History of Madagascar. Chicago: UniversityChicago Press; 2003. p. 1512–9.
59. Zinner D, Wygoda C, Razafimanantsoa L, Rasoloarison RM, AndrianandrasanaH, Ganzhorn JU, et al. Analysis of deforestation patterns in the centralMenabe, Madagascar, between 1973 and 2010. Regional Environ Change.2013. doi:10.1007/s10113-10013-10475-x.
60. Réau B. Burning for zebu: the complexity of deforestation issues in WesternMadagascar. Norwegian J Geogr. 2002;56:219–29.
61. Schäffler L. Determinants of population structure in the world's smallestprimate, Microcebus berthae, across its global range in Menabe Central,Western Madagascar. PhD thesis. Georg-August-Universität, GöttingenCentre for Biodiversity and Ecology (GCBE) and German Primate Center(DPZ), Behavioral Ecology & Sociobiology Unit; 2012.
62. Brower JE, Zar JH, Von Ende CN. Field and laboratory methods for generalecology. Dubuque, Iowa: WCB/ McGraw-Hill; 1990.
63. Nie NH, Hull CH, Jenkins JG, Steinbrenner K, Bent DH. SPSS. Statisticalpackage for the social sciences. 2nd edition. New York: McGraw-Hill; 1975.
64. Stoner KE, Timm RM. Seasonally dry tropical forest mammals: Adaptationsand seasonal patterns. In: Dirzo R, Young HS, Mooney HA, Ceballos G,editors. Seasonally Dry Tropical Forests: Conservation and Ecology.Washington, D.C: Island Press; 2011.
65. Godbold JA, Bulling MT, Solan M. Habitat structure mediates biodiversityeffects on ecosystem properties. Proc R Soc Biol Sci Ser B. 2011;278:2510–8.
66. Corbin GD, Schmid J. Insect secretions determine habitat use patterns by afemale lesser mouse lemur (Microcebus murinus). Am J Primatol.1995;37:317–24.
67. Ganzhorn JU, Schmid J. Different population dynamics of Microcebusmurinus in primary and secondary deciduous dry forests of Madagascar. IntJ Primatol. 1998;19:785–96.
68. Snyder RE, Chesson P. Local dispersal can facilitate coexistence in thepresence of permanent spatial heterogeneity. Ecol Lett. 2003;6:301–9.
69. Schäffler L, Kappeler PM. Distribution and abundance of three cheirogaleidspecies in Menabe Central, Western Madagascar. Lemur News. 2014;18:38–43.
70. Caswell H. Predator-mediated coexistence: A nonequilibrium model. AmNat. 1978;112:127–54.
71. Crowley PH. Predator-mediated coexistence: an equlibrium interpretation.J Theor Biol. 1979;80:129–44.
72. Chase JM, Abrams PA, Grover JP, Diehl S, Chesson P, Holt RD, et al. Theinteraction between predation and competition: a review and synthesis.Ecol Lett. 2002;5:302–15.
73. Noonburg EG, Abrams PA. Transient dynamics limit the effectiveness ofkeystone predation in bringing about coexistence. Am Nat. 2005;165:322–35.
74. Menge BA, Berlow EL, Blanchette CA, Navarrete SA, Yamada SB. Thekeystone species concept: variation in interaction strength in a rockyintertidal habitat. Ecol Monogr. 1994;64:249–86.
75. Wellborn GA. Trade-off between competitive ability and antipredatoradaptation in a freshwater amphipod species complex. Ecology.2002;83:129–36.
Schäffler et al. BMC Ecology (2015) 15:7 Page 15 of 15
76. Leibold MA. A graphical model of keystone predators in food webs: trophicregulation of abundance, incidence, and diversity patterns in communities.Am Nat. 1996;147:784–812.
77. Chase JM, Leibold MA. Species sorting in communities. In: Ecological niches.Linking classical and contemporary approaches. Chicago and London:University of Chicago Press; 2003. p. 106–22.
78. Mills LS, Soulé ME, Doak DF. The keystone-species concept in ecology andconservation. Bio Sci. 1993;43:219–24.
79. Roy S, Alam S, Chattopadhyay J. Role of nutrient bound of prey on thedynamics of predator-mediated competitive-coexistence. Bio Syst.2005;82:143–53.
80. Rahlfs M, Fichtel C. Anti-predator behaviour in a nocturnal primate, the greymouse lemur (Microcebus murinus). Ethology. 2010;116:429–39.
81. Sundell J, Eccard JA, Ylönen H. Predation rate, prey preference and predatorswitching: experiments on voles and weasels. Oikos. 2003;101:615–23.
82. Wilbur HM, Fauth IE. Experimental aquatic food webs: interactions betweentwo predators and two prey. Am Nat. 1990;135:176–204.
83. Strauss SY. Indirect effects in community ecology: their definition, study andimportance. Trends Ecol Evol. 1991;6:206–10.
84. Glasser JW. The role of predation in shaping and maintaining the structureof communities. Am Nat. 1979;113:631–41.
85. Dammhahn M, Kappeler PM. Females go where the food is: does the socio-ecological model explain variation in social organisation of solitary foragers?Behav Ecol Sociobiol. 2009;63:393–52.
86. Fukami T, Bezemer TM, Mortimer SR, van der Putten WH. Speciesdivergence and trait convergence in experimental plant communityassembly. Ecol Lett. 2005;8:1283–90.
87. Letcher AJ, Purvis A, Nee S, Harvey PH. Patterns of overlap in thegeographic ranges of palearctic and British mammals. J Anim Ecol.1994;63:871–9.
88. Sfenthourakis S, Tzanatos E, Giokas S. Species co-occurrence: the case ofcongeneric species and a causal approach to patterns of species association.Glob Ecol Biogeogr. 2005;15:39–49.
89. Vamosi JC, Vamosi SM. Body size, rarity, and phylogenetic communitystructure: insights from diving beetle assemblages of Alberta. Divers Distrib.2006;13:1–10.
90. Kraft NJB, Valencia R, Ackerly DD. Functional traits and niche-based treecommunity assembly in an Amazionan forest. Science. 2008;322:580–2.
91. Brown JH. Species diversity of seed-eating desert rodents in sand dunehabitats. Ecology. 1973;54:775–87.
92. Brown JH, Lieberman GA. Resource utilization and coexistence of seed-eating desert rodents in sand dune habitats. Ecology. 1973;54:788–97.
93. Bowers MA, Brown JH. Body size and coexistence in desert rodents: chanceor community structure? Ecology. 1982;63:391–400.
94. Brown KM. Resource overlap and competition in pond snails: anexperimental analysis. Ecology. 1982;63:412–22.
95. Wilbur HM. Competition between tadpoles of Hyla femoralis and Hylagratiosa in laboratory experiments. Ecology. 1982;63:278–82.
96. Ganzhorn JU. Lemurs as indicators for assessing biodiversity in forestecosystems of Madagascar: Why it does not work. Tasks Vegetation Sci.1999;34:163–74.
97. Lehman SM, Rajaonson A, Day S. Edge effects and their influence on lemurdensity and distribution in southeast Madagascar. Am J Phys Anthropol.2006;129:232–41.
98. Paine RT. Intertidal community structure. Oecologia. 1974;15:93–120.99. Amarasekare P, Nisbet RM. Spatial heterogeneity, source-sink dynamics, and
the local coexistence of competing species. Am Nat. 2001;158:572–84.100. Amarasekare P. Competitive coexistence in spatially structured
environments: a synthesis. Ecol Lett. 2003;6:1109–22.101. Ylönen H, Pech R, Davis S. Heterogeneous landscapes and the role of
refuge on the population dynamics of a specialist predator and its prey.Evol Ecol. 2003;17:349–69.
102. Schreiber SJ, Kelton M. Sink habitats can alter ecological outcomes forcompeting species. J Anim Ecol. 2005;74:995–1004.
103. López-Gómez J, Molina-Meyer M. The competitive exclusion principle versusbiodiversity through competitive segregation and further adaptation tospatial heterogeneities. Theor Popul Biol. 2006;69:94–109.
104. Nupp TE, Swihart RK. Assessing competition between forest rodents in afragmented landscape of midwestern USA. Mamm Biol. 2001;66:345–56.
105. Petren K, Case TJ. Habitat structure determines competition intensity andinvasion success in gecko lizards. Proc Natl Acad Sci U S A. 1998;95:11739–44.
106. Fischer J, Lindenmayer DB. Landscape modification and habitatfragmentation: a synthesis. Glob Ecol Biogeogr. 2007;16:265–80.
107. Hanski I, Ranta E. Coexistence in a patchy environment: three species ofDaphnia in rock pools. J Anim Ecol. 1983;52:263–79.
108. Kozakiewicz M. Habitat selection and ecological barriers - the effects onsmall mammal populations and communities. Acta Theriol. 1993;38:1–30.
109. Creel S, Creel NM. Limitation of African wild dogs by competition withlarger carnivores. Conserv Biol. 1996;10:526–38.
110. Creel S. Four factors modifying the effect of competition in carnivorepopulation dynamics as illustrated by African wild dogs. Conserv Biol.2001;15:271–4.
111. Antón M, Galobart A, Turner A. Co-existence of similar-toothed cats, lionsand hominins in the European pleistocene. Implications of the post-cranialanatomy of Homotherium latidens (Owen) for comparative palaeoecology.Quaternary Sci Rev. 2005;24:1287–301.
112. Swihart RK, Gehring TM, Kolozvary MB, Nupp TE. Responses of 'resistant'vertebrates to habitat loss and fragmentation: the importance of nichebreadth and range boundaries. Divers Distrib. 2003;9:1–18.
113. Danielson BJ. Habitat selection, interspecific interactions and landscapecomposition. Evol Ecol. 1992;6:399–411.
114. Swihart RK, Goheen JR, Schnelker SA, Rizkalla CE. Testing the generality ofpatch and landscape-level predictors of tree squirrel occurrence at aregional scale. J Mammal. 2007;88:564–73.
115. Swihart RK, Nupp TE. Modeling population responses of North Americantree squirrels to agriculturally induced fragmentation of forests. In: Steel MA,Merritt JF, Zegers DA, editors. Ecology and Evolutionary Biology of TreeSquirrels. Volume 6. Special Publication edition. Martinsville, VA: VirginiaMuseum of Natural History; 1998. p. 1–19.
116. With KA, King AW. Extinction thresholds for species in fractal landscapes.Conserv Biol. 1999;13:314–26.
117. Allesina S, Levine JM. A competitive network theory of species diversity.Proc Natl Acad Sci U S A. 2011;108:5638–42.
118. Estes JA, Terborgh J, Brashares JS, Power ME, Berger J, Bond WJ, et al.Trophic downgrading of planet earth. Science. 2011;333:301–6.
119. Swihart RK, Feng Z, Slade NA, Mason DM, Gehring TM. Effects of habitatdestruction and resource supplementation in a predator–preymetapopulation model. J Theor Biol. 2001;210:287–303.
120. Estes JA, Palmisano JF. Sea otter: Their role in structuring nearshorecommunities. Science. 1974;185:1058–60.
121. Linnell JDC, Strand O. Interference interactions, co-existence and conservationof mammalian carnivores. Divers Distrib. 2000;6:169–76.
122. Andriaholinirina N, Baden A, Blanco M, Chikhi L, Cooke A, Davies N, et al.IUCN red list of threatened species. Version. 2014;2:2014.
123. Kappeler PM, Wimmer B, Zinner D, Tautz D. The hidden matrilineal structureof a solitary lemur: implications for primate social evolution. Proc R Soc BiolSci Ser B. 2002;269:1755–63.
124. Markolf M, Roos C, Kappeler PM. Genetic and demographic consequencesof a rapid reduction in population size in a solitary lemur (Mirza coquereli).Open Conserv Biol J. 2008;2:21–9.
125. Pimm SL. Food web design and the effect of species deletion. Oikos.1980;35:139–49.
126. Schweiger EW, Diffendorfer JE, Pierotti R, Holt RD. The relative importanceof small-scale and landscape-level heterogeneity in structuring smallmammal distributions. In: Barret GW, Peles JD, editors. Landscape Ecology ofSmall Mammals. New York: Springer; 1999. p. 175–207.
127. Wolff JO. Behavioral model systems. In: Barret GW, Peles JD, editors.Landscape Ecology of Small Mammals. New York: Springer; 1999. p. 11–29.
128. Chase JM. Spatial scale resolves the niche versus neutral theory debate.J Vegetation Sci. 2014;25:319–22.