Embed Size (px)
Citation preview

ARL-TR-8044 ● JUNE 2017
US Army Research Laboratory
Agent Reasoning Transparency: The Influence of Information Level on Automation-Induced Complacency by Julia L Wright, Jessie YC Chen, Michael J Barnes, and Peter A Hancock Approved for public release; distribution is unlimited.

NOTICES
Disclaimers
The findings in this report are not to be construed as an official Department of the Army position unless so designated by other authorized documents. Citation of manufacturer’s or trade names does not constitute an official endorsement or approval of the use thereof. Destroy this report when it is no longer needed. Do not return it to the originator.

ARL-TR-8044 ● JUNE 2017
US Army Research Laboratory
Agent Reasoning Transparency: The Influence of Information Level on Automation-Induced Complacency by Julia L Wright, Jessie YC Chen, Michael J Barnes, and Peter A Hancock Human Research and Engineering Directorate, ARL Approved for public release; distribution is unlimited.

ii
REPORT DOCUMENTATION PAGE Form Approved OMB No. 0704-0188
Public reporting burden for this collection of information is estimated to average 1 hour per response, including the time for reviewing instructions, searching existing data sources, gathering and maintaining the data needed, and completing and reviewing the collection information. Send comments regarding this burden estimate or any other aspect of this collection of information, including suggestions for reducing the burden, to Department of Defense, Washington Headquarters Services, Directorate for Information Operations and Reports (0704-0188), 1215 Jefferson Davis Highway, Suite 1204, Arlington, VA 22202-4302. Respondents should be aware that notwithstanding any other provision of law, no person shall be subject to any penalty for failing to comply with a collection of information if it does not display a currently valid OMB control number. PLEASE DO NOT RETURN YOUR FORM TO THE ABOVE ADDRESS.
1. REPORT DATE (DD-MM-YYYY)
June 2017 2. REPORT TYPE
Technical Report 3. DATES COVERED (From - To)
October 2014–September 2016 4. TITLE AND SUBTITLE
Agent Reasoning Transparency: The Influence of Information Level on Automation-Induced Complacency
5a. CONTRACT NUMBER
5b. GRANT NUMBER
5c. PROGRAM ELEMENT NUMBER
6. AUTHOR(S)
Julia L Wright, Jessie YC Chen, Michael J Barnes, and Peter A Hancock 5d. PROJECT NUMBER
5e. TASK NUMBER
5f. WORK UNIT NUMBER
7. PERFORMING ORGANIZATION NAME(S) AND ADDRESS(ES)
US Army Research Laboratory Human Research & Engineering Directorate ATTN: RDRL-HRF-D Aberdeen Proving Ground, MD 21005-5425
8. PERFORMING ORGANIZATION REPORT NUMBER
ARL-TR-8044
9. SPONSORING/MONITORING AGENCY NAME(S) AND ADDRESS(ES)
10. SPONSOR/MONITOR'S ACRONYM(S)
11. SPONSOR/MONITOR'S REPORT NUMBER(S)
12. DISTRIBUTION/AVAILABILITY STATEMENT
Approved for public release; distribution is unlimited. 13. SUPPLEMENTARY NOTES University of Central Florida–Institute for Simulation and Training, 3100 Technology Pkwy, Orlando, FL 32826 14. ABSTRACT
To understand how the information available to an operator and the transparency of an intelligent agent’s reasoning interact to affect complacent behavior, 2 between-subjects experiments were conducted. Participants supervised a 3-vehicle convoy as it traversed a simulated environment and rerouted the convoy when needed with the assistance of an intelligent agent. In Experiment 1 (low information), participants received information about their current route only; in Experiment 2 (high information), they received information about both their current route and the suggested alternate route. In Experiment 1, access to agent reasoning was found to be an effective deterrent to complacent behavior. However, the addition of information that created ambiguity for the operator encouraged complacency, resulting in reduced performance and poorer trust calibration. In Experiment 2, access to agent reasoning was found to have little effect on complacent behavior, and there were notable differences due to individual differences. These findings suggest that when the operator has more information regarding their task environment, individual difference factors may influence performance outcomes more than access to agent reasoning. These findings indicate some negative outcomes resulting from the incongruous transparency of agent reasoning may be mitigated by increasing the information available to the operator. 15. SUBJECT TERMS
human–agent teaming, agent transparency, intelligent agents, complacent behavior, decision-making
16. SECURITY CLASSIFICATION OF: 17. LIMITATION OF ABSTRACT
UU
18. NUMBER OF PAGES
214
19a. NAME OF RESPONSIBLE PERSON
Julia L Wright a. REPORT
Unclassified b. ABSTRACT
Unclassified
c. THIS PAGE
Unclassified
19b. TELEPHONE NUMBER (Include area code)
407-208-3348 Standard Form 298 (Rev. 8/98)
Prescribed by ANSI Std. Z39.18

Approved for public release; distribution is unlimited. iii
Contents
Contents iii
List of Figures vii
List of Tables x
Acknowledgments xiii
Executive Summary xv
1. Introduction 1
2. Human–Agent Teaming 2
2.1 Issues with Automated Systems 3
2.1.1 Automation-Induced Complacency 4
2.1.2 Situation Awareness 4
2.2 Autonomy 5
2.3 RoboLeader, an Intelligent Agent 6
2.4 Agent Transparency and SA-based Agent Transparency (SAT) Model 6
2.5 Current Study 8
2.5.1 Individual Differences 9
2.5.2 Eye-Tracking Measures 10
3. Experiment 1 11
3.1 Overview 11
3.2 Stated Hypotheses 12
3.2.1 Complacent Behavior, Primary Task Performance, and Trust in the Agent 12
3.2.2 Workload 12
3.2.3 Situation Awareness 13
3.2.4 Target-Detection Task Performance 13
3.2.5 Individual Differences 14
Approved for public release; distribution is unlimited. iv
3.3 Method 14
3.3.1 Participants 14
3.3.2 Apparatus 15
3.3.3 Surveys and Tests 16
3.3.4 Experimental Design and Performance Measures 19
3.3.5 Procedure 21
3.4 Results 23
3.4.1 Complacent behavior, Primary Task Performance, and Trust in the Agent 24
3.4.2 Workload 35
3.4.3 SA 38
3.4.4 Target-Detection Task Performance 41
3.4.5 Individual Differences Evaluations 43
3.5 Discussion 49
3.6 Conclusion 53
4. Experiment 2 54
4.1 Overview 54
4.2 Stated Hypothesis 55
4.2.1 Complacent Behavior, Primary Task Performance, Trust in the Agent 55
4.2.2 Workload 55
4.2.3 SA 56
4.2.4 Target-Detection Task Performance 56
4.2.5 Individual Differences 56
4.3 Method 57
4.3.1 Participants 57
4.3.2 Apparatus 57
4.3.3 Surveys and Tests 58
4.3.4 Experimental Design and Performance Measures 59
4.3.5 Procedure 59
4.4 Results 59
4.4.1 Complacent Behavior, Primary Task Performance, Trust in the Agent 59
4.4.2 Workload Evaluation 68
4.4.3 SA Evaluation 72

Approved for public release; distribution is unlimited. v
4.4.4 Task-Detection Task Performance 74
4.4.5 ID Evaluations 75
4.5 Discussion 84
4.6 Conclusion 89
5. Comparison of EXP1 and EXP2 89
5.1 Objective 89
5.2 Stated Hypotheses 90
5.2.1 Complacent Behavior, Primary Task Performance, Trust in the Agent 90
5.2.2 Workload 91
5.2.3 SA 91
5.2.4 Target-Detection Task Performance 91
5.3 Results 91
5.3.1 Complacent Behavior, Primary Task Performance, Trust in the Agent 91
5.3.2 Workload Evaluation 107
5.3.3 SA Evaluation 109
5.3.4 Target-Detection Task Performance 112
5.4 Discussion 115
5.5 Conclusion 119
6. References 120
Appendix A. Demographics Questionnaire 127
Appendix B. Attentional Control Survey 129
Appendix C. Cube Comparisons Test 131
Appendix D. Spatial Orientation Test 135
Appendix E. National Aeronautics and Space Administration-Task Load Index (NASA-TLX) 137
Appendix F. Complacency Potential Rating Scale 141

Approved for public release; distribution is unlimited. vi
Appendix G. Reading Span Task (RSPAN) 143
Appendix H. Usability Survey 149
Appendix I. Informed Consent 153
Appendix J. Training Materials 159
Appendix K. RoboLeader Messages 185
Appendix L. Situation Awareness (SA) Questions 187
List of Symbols, Abbreviations, and Acronyms 193
Distribution List 195
Approved for public release; distribution is unlimited. vii
List of Figures
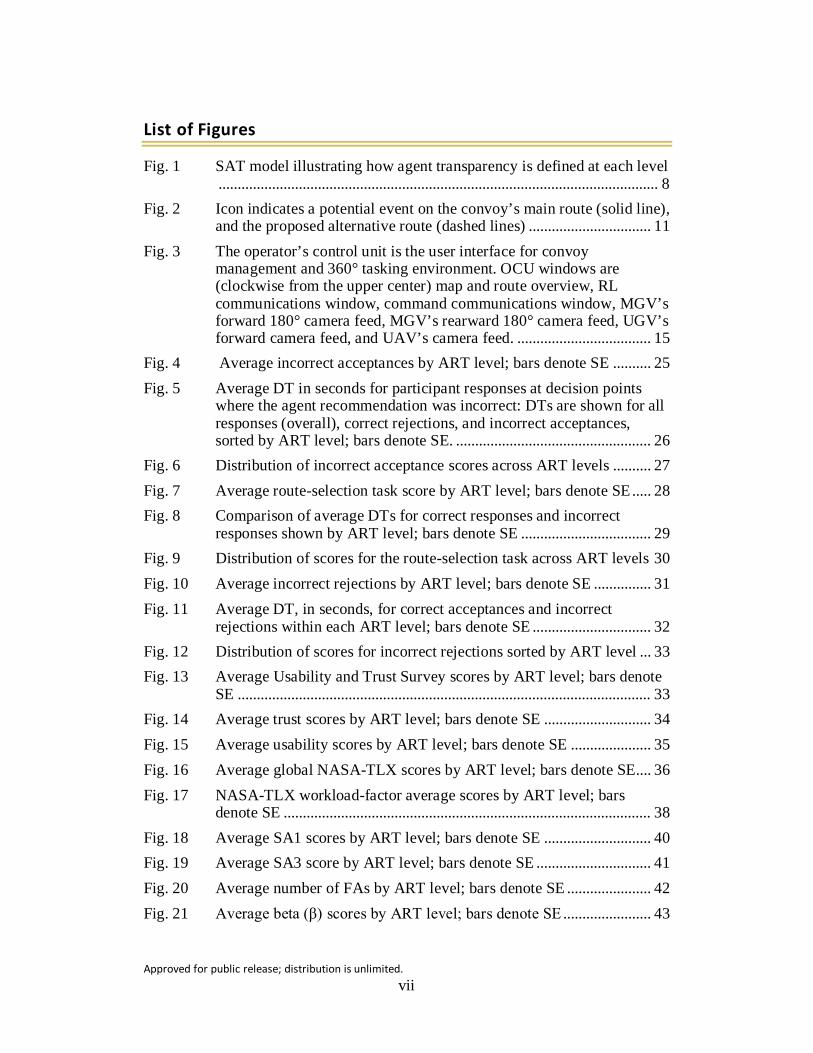
Fig. 1 SAT model illustrating how agent transparency is defined at each level ................................................................................................................... 8
Fig. 2 Icon indicates a potential event on the convoy’s main route (solid line), and the proposed alternative route (dashed lines) ................................ 11
Fig. 3 The operator’s control unit is the user interface for convoy management and 360° tasking environment. OCU windows are (clockwise from the upper center) map and route overview, RL communications window, command communications window, MGV’s forward 180° camera feed, MGV’s rearward 180° camera feed, UGV’s forward camera feed, and UAV’s camera feed. ................................... 15
Fig. 4 Average incorrect acceptances by ART level; bars denote SE .......... 25
Fig. 5 Average DT in seconds for participant responses at decision points where the agent recommendation was incorrect: DTs are shown for all responses (overall), correct rejections, and incorrect acceptances, sorted by ART level; bars denote SE. ................................................... 26
Fig. 6 Distribution of incorrect acceptance scores across ART levels .......... 27
Fig. 7 Average route-selection task score by ART level; bars denote SE ..... 28
Fig. 8 Comparison of average DTs for correct responses and incorrect responses shown by ART level; bars denote SE .................................. 29
Fig. 9 Distribution of scores for the route-selection task across ART levels 30
Fig. 10 Average incorrect rejections by ART level; bars denote SE ............... 31
Fig. 11 Average DT, in seconds, for correct acceptances and incorrect rejections within each ART level; bars denote SE ............................... 32
Fig. 12 Distribution of scores for incorrect rejections sorted by ART level ... 33
Fig. 13 Average Usability and Trust Survey scores by ART level; bars denote SE ............................................................................................................ 33
Fig. 14 Average trust scores by ART level; bars denote SE ............................ 34
Fig. 15 Average usability scores by ART level; bars denote SE ..................... 35
Fig. 16 Average global NASA-TLX scores by ART level; bars denote SE.... 36
Fig. 17 NASA-TLX workload-factor average scores by ART level; bars denote SE ................................................................................................ 38
Fig. 18 Average SA1 scores by ART level; bars denote SE ............................ 40
Fig. 19 Average SA3 score by ART level; bars denote SE .............................. 41
Fig. 20 Average number of FAs by ART level; bars denote SE ...................... 42
Fig. 21 Average beta (β) scores by ART level; bars denote SE ....................... 43

Approved for public release; distribution is unlimited. viii
Fig. 22 Average route-selection scores by high/low SV group membership, sorted by ART level; bars denote SE .................................................... 46
Fig. 23 Average SA1 scores by SV high/low group membership, sorted by ART level; bars denote SE ..................................................................... 47
Fig. 24 Average SA3 scores by SV high/low membership sorted by ART level; bars denote SE .............................................................................. 48
Fig. 25 Icons indicating a potential event on the convoy’s main route (solid line) and potential events on the proposed alternative route (dashed lines) ........................................................................................................ 54
Fig. 26 Average number of incorrect acceptances by ART level; bars denote SE ............................................................................................................ 60
Fig. 27 Distribution of number of incorrect acceptances across ART level .... 61
Fig. 28 Average DT in seconds for participant responses at decision points where the agent recommendation was incorrect: DTs are shown for all responses (overall), correct rejections, and incorrect acceptances sorted by ART level; bars denote SE. .............................................................. 62
Fig. 29 Distribution of scores for the route-selection task across ART levels 64
Fig. 30 Comparison of average DTs for correct responses and incorrect responses shown by ART level; bars denote SE .................................. 65
Fig. 31 Distribution of scores for incorrect rejections sorted by ART level ... 66
Fig. 32 Average DTs in seconds at the locations where the agent recommendation was correct, sorted by correct/incorrect selections for each ART level; bars denote SE ............................................................ 67
Fig. 33 Average DT in seconds for correct acceptances and incorrect rejections within each ART level; bars denote SE ............................... 68
Fig. 34 Average global NASA-TLX scores by ART level; bars denote SE.... 69
Fig. 35 Average participant PDia by ART level; bars denote SE .................... 70
Fig. 36 Average NASA-TLX workload factor scores by ART level; bars denote SE ................................................................................................ 72
Fig. 37 Average number of targets detected by ART level; bars denote SE ... 75
Fig. 38 Average number of correct rejects by high/low CPRS-score group sorted by ART level; bars denote SE .................................................... 77
Fig. 39 Average level 1 situation awareness (SA1) scores by high/low CPRS group sorted by ART level; bars denote SE ......................................... 78
Fig. 40 Average route-selection scores by high/low SOT group membership across ART level; bars denote SE ......................................................... 80
Fig. 41 Average route-selection scores by high/low PAC group membership across ART level; bars denote SE ......................................................... 81
Fig. 42 Average SA2 scores by SOT high/low group membership sorted by ART level; bars denote SE ..................................................................... 82

Approved for public release; distribution is unlimited. ix
Fig. 43 Average SA2 scores by WMC high/low group membership sorted by ART level; bars denote SE ..................................................................... 84
Fig. 44 Average incorrect acceptances by experiment for each ART level; bars denote SE ................................................................................................ 93
Fig. 45 Between-experiment comparisons of the number of participants who had no incorrect acceptances in each ART level .................................. 94
Fig. 46 Average DT in seconds for participant responses at decision points where the agent recommendation was incorrect sorted by experiment for each ART level; bars denote SE ...................................................... 95
Fig. 47 Differences in mean DTs (EXP2–EXP1) for average DTs (in seconds) for correct rejections and incorrect acceptances, sorted by ART level; asterisk (*) denotes significant difference between experiments ........ 96
Fig. 48 Average route-selection task score by experiment for each ART level; bars denote SE ........................................................................................ 98
Fig. 49 Average route-selection task score by experiment for each ART level; bars denote SE ........................................................................................ 99
Fig. 50 Differences in mean DTs (EXP2–EXP1) for average DTs (in seconds) for correct and incorrect responses sorted by ART level; asterisk denotes significant difference between experiments .......................... 100
Fig. 51 Average number of incorrect rejections of agent recommendations by experiment for each ART level; bars denote SE ................................ 101
Fig. 52 Average DTs (in seconds) for operator responses at decision locations where the agent recommendation was correct sorted by experiment for each ART level; bars denote SE .......................................................... 102
Fig. 53 Differences in mean DTs (EXP2–EXP1) for average DTs (in seconds) for correct acceptances and incorrect rejections sorted by ART level; asterisk denotes significant difference between experiments ............ 104
Fig. 54 Average Usability and Trust Survey score by experiment for each ART level; bars denote SE ................................................................... 105
Fig. 55 Average usability-survey scores by experiment for each ART level; bars denote SE ...................................................................................... 106
Fig. 56 Average trust-survey scores by experiment for each ART level; bars denote SE .............................................................................................. 107
Fig. 57 Average global NASA-TLX score by experiment for each ART level; bars denote SE ...................................................................................... 108
Fig. 58 Average SA2 scores by experiment for each (ART) level; bars denote SE .......................................................................................................... 111
Fig. 59 Average SA3 score by experiment for each ART level; bars denote SE ............................................................................................................... 112
Fig. 60 Average reported FAs by experiment for each ART level; bars denote SE .......................................................................................................... 113

Approved for public release; distribution is unlimited. x
Fig. 61 Average Beta scores by experiment for each ART level; bars denote SE .......................................................................................................... 115
Fig. K-1 RoboLeader message for agent reasoning transparency (ART) Level 1 ............................................................................................................... 186
Fig. K-2 Typical RoboLeader message, ART Level 2 ...................................... 186
Fig. K-3 Typical RoboLeader message, ART Level 3 ...................................... 186
List of Tables
Table 1 Descriptive statistics for incorrect acceptances and decision times, sorted by ART level (with SE = standard error and CI = confidence interval) ................................................................................................... 24
Table 2 Descriptive statistics for route-selection scores and DTs, sorted by ART level ................................................................................................ 27
Table 3 Descriptive statistics for incorrect rejections and Usability and Trust Survey results sorted by ART level ....................................................... 30
Table 4 Descriptive statistics for eye-tracking measures by ART condition ... 36
Table 5 Evaluation of NASA-TLX workload factors across ART levels; MD = mental demand, PhyD = physical demand, TD = temporal demand, Perf = performance, Frust = frustration level. ...................................... 37
Table 6 Descriptive statistics for SA scores by ART level ............................... 39
Table 7 Descriptive statistics for target detection task measures by ART level; dʹ = sensitivity, β = selection bias.......................................................... 41
Table 8 Descriptive statistics for CPRS scores by ART level .......................... 43
Table 9 Descriptive statistics for high/low CPRS scores by ART level........... 44
Table 10 Descriptive statistics for SOT, SV, and PAC by ART level................ 45
Table 11 Descriptive statistics for SOT, SV, and PAC by ART level, sorted by high/low group membership .................................................................. 45
Table 12 Descriptive statistics for WMC by ART level ...................................... 48
Table 13 Descriptive statistics for WMC by ART level, sorted by high/low group membership .................................................................................. 48
Table 14 Descriptive statistics for incorrect acceptances and DTs sorted by ART level ......................................................................................................... 60
Table 15 Descriptive statistics for route-selection scores and DTs sorted by ART level ................................................................................................ 63
Table 16 Descriptive statistics for incorrect rejections and Usability and Trust Survey results across ART level ............................................................ 65
Table 17 Descriptive statistics for eye-tracking measures by ART condition ... 70

Approved for public release; distribution is unlimited. xi
Table 18 Evaluation of NASA-TLX workload factors across ART conditions. 71
Table 19 Descriptive statistics for SA scores by ART level ............................... 73
Table 20 Descriptive statistics for target-detection task measures by ART level ................................................................................................................. 74
Table 21 Descriptive statistics for CPRS scores by ART level .......................... 76
Table 22 Descriptive statistics for high/low CPRS scores by ART level........... 76
Table 23 Descriptive statistics for SOT, SV, and PAC by ART level................ 79
Table 24 Descriptive statistics for SOT, SV, and PAC by ART level, sorted by high/low group membership .................................................................. 79
Table 25 Descriptive statistics for WMC by ART level ...................................... 82
Table 26 Descriptive statistics for WMC by ART level, sorted by high/low group membership .................................................................................. 83
Table 27 Descriptive statistics for incorrect acceptances sorted by experiment for each ART level, and t-test results for between-experiment comparisons ............................................................................................ 92
Table 28 Descriptive statistics for average DT at those locations where the agent recommendation is incorrect sorted by experiment for each ART level, and t-test results for between-experiment comparisons ....................... 94
Table 29 Descriptive statistics for DTs (in seconds) for participant responses at decision points where the agent recommendation was incorrect ........ 95
Table 30 Descriptive statistics for route-selection task scores sorted by experiment for each ART level, and t-test results for between-experiment comparisons ........................................................................ 97
Table 31 Descriptive statistics for overall DTs (in seconds) for the route-selection task sorted by experiment for each ART level, and t-test results for between-experiment comparisons ....................................... 98
Table 32 Descriptive statistics for DTs (in seconds) for the route-selection task sorted by correct and incorrect responses and experiment for each ART level, and t-test results for between-experiment comparisons ... 99
Table 33 Descriptive statistics for incorrect rejections sorted by experiment for each ART level, and t-test results for between-experiment comparisons ............................................................................................................... 100
Table 34 Descriptive statistics for average DT at those locations where the agent recommendation is correct sorted by experiment for each ART level, and t-test results for between-experiment comparisons ..................... 102
Table 35 Descriptive statistics for DTs (in seconds) for participant responses at decision points where the agent recommendation was correct .......... 103
Table 36 Descriptive statistics for Usability and Trust Survey score sorted by experiment for each ART level, and t-test results for between-experiment comparisons ...................................................................... 104

Approved for public release; distribution is unlimited. xii
Table 37 Descriptive statistics for usability-survey score sorted by experiment for each ART level, and t-test results for between-experiment comparisons .......................................................................................... 105
Table 38 Descriptive statistics for trust-survey score sorted by experiment for each ART level, and t-test results for between-experiment comparisons ............................................................................................................... 106
Table 39 Descriptive statistics for global NASA-TLX scores sorted by experiment for each ART level, and t-test results for between-experiment comparisons ...................................................................... 107
Table 40 Descriptive statistics for PDia sorted by experiment for each ART level, and t-test results for between-experiment comparisons ........... 108
Table 41 Descriptive statistics for FC sorted by experiment for each ART level, and t-test results for between-experiment comparisons ..................... 109
Table 42 Descriptive statistics for FD sorted by experiment for each ART level, and t-test results for between-experiment comparisons ..................... 109
Table 43 Descriptive statistics for SA1 scores sorted by experiment for each ART level, and t-test results for between-experiment comparisons . 110
Table 44 Descriptive statistics for SA2 scores sorted by experiment for each ART level, and t-test results for between-experiment comparisons . 110
Table 45 Descriptive statistics for SA3 scores sorted by experiment for each ART level, and t-test results for between-experiment comparisons . 111
Table 46 Descriptive statistics for target-detection scores sorted by experiment for each ART level, and t-test results for between-experiment comparisons .......................................................................................... 112
Table 47 Descriptive statistics for FAs (count) sorted by experiment for each ART level, and t-test results for between-experiment comparisons . 113
Table 48 Descriptive statistics for d’ scores, sorted by experiment (EXP), for each agent reasoning transparency (ART) level, and t-test results for between-experiment comparisons ....................................................... 114
Table 49 Descriptive statistics for Beta scores sorted by experiment for each ART level, and t-test results for between-experiment comparisons . 114

Approved for public release; distribution is unlimited. xiii
Acknowledgments
The authors would like to thank Jonathan Harris, Isacc Yi, Daniel Barber, Olivia Newton, Florian Jentsch, and James Szalma for their contributions to this project.

Approved for public release; distribution is unlimited. xiv
INTENTIONALLY LEFT BLANK.

Approved for public release; distribution is unlimited. xv
Executive Summary
This research examined how the information available to the operator in a human–robot team and the transparency of an intelligent agent’s reasoning affected complacent behavior in a route-selection task in a simulated environment. In 2 between-subjects experiments, participants supervised a 3-vehicle convoy as it traversed a simulated environment and rerouted the convoy when needed with the assistance of an intelligent agent. Participants received information regarding potential events along their route; in Experiment 1 (low information setting) they received information about their current route only; in Experiment 2 (high information setting) they received information about both their current route and the suggested alternate route.
In Experiment 1, access to agent reasoning was found to be an effective deterrent to complacent behavior. However, the addition of information that created ambiguity for the operator encouraged complacency, resulting in reduced performance and poorer trust calibration. These findings align with studies that have shown ambiguous information can encourage complacency; as such, caution should be exercised when considering how transparent to make agent reasoning and what information should be included. In Experiment 2, access to agent reasoning was found to have little effect on complacent behavior. However, the addition of information that created ambiguity for the operator appeared to encourage complacency, as indicated by reduced performance and shorter decision times. Unlike the first experiment, there were notable differences in complacent behavior, performance, operator trust, and situation awareness due to individual difference factors. As such, these findings suggest that when the operator has more information regarding their task environment, access to agent reasoning may be beneficial; however, individual difference factors will greatly influence performance outcomes.
The amount of information the operator has regarding the task environment has a profound effect on the proper use of the agent. These findings indicate some negative outcomes resulting from the incongruous transparency of agent reasoning may be mitigated by increasing the information the operator has regarding the task environment.

Approved for public release; distribution is unlimited. xvi
INTENTIONALLY LEFT BLANK.
Approved for public release; distribution is unlimited. 1
1. Introduction
Human–agent teaming is an essential component to the future of the next generation of defense, as outlined in the US Department of Defense’s Third Offset Strategy (DoDLive 2015). Autonomous technology is rapidly becoming part of our everyday lives, and humans find themselves increasingly reliant on their autonomous partners for support in a variety of tasks and settings (Chen and Barnes 2014). In military applications, successful collaboration within these teams will determine whether the teaming results in a decided advantage in the field or is a potentially dangerous pairing of incompatible entities. Key to the successful collaboration between the human and the autonomous agent is communication; specifically, as the degree of autonomy of the agent increases, it becomes more difficult for the human to understand the reasoning behind the agent’s actions (Kim and Hinds 2006; Chen and Barnes 2014). Increased transparency of the agent’s reasoning has been proposed to bridge this gap in understanding (Chen et al. 2014).
The present research investigated how the transparency of agent reasoning, within the context of human–agent teaming, influences operator performance and behavior in a dynamic, multitasking environment. The effect of access to agent reasoning was evaluated across 2 experiments with different contexts; Experiment 1 was a low-information environment, and Experiment 2 was a high-information environment. In both experiments, participants supervised a 3-vehicle convoy—his/her manned ground vehicle (MGV), an unmanned aerial vehicle (UAV), and an unmanned ground vehicle (UGV)—as it traversed a simulated environment and rerouted the convoy when needed with the assistance of an intelligent agent. Participants received communications from a commander confirming either the presence or absence of activity along the main route. They also received information regarding potential events along their route via icons that appeared on a map displaying the convoy route and surrounding area. Participants in Experiment 1 (low-information setting) received information about their current route only; they did not receive any information about the suggested alternate route. Participants in Experiment 2 (high-information setting) received information about both their current route and the agent-recommended alternative route. Within each experiment participants were assigned to a level of agent reasoning transparency, and results were compared between subjects to evaluate how the difference in transparency affected operator performance, workload, trust, situation awareness (SA), and complacent behavior. Finally, the 2 experiments’ findings were compared to evaluate how differences in available information affected operators’ performance at each level of agent reasoning transparency.

Approved for public release; distribution is unlimited. 2
The findings of this research are expected to elucidate the interaction between a human’s access to the reasoning behind an intelligent agent’s actions and the human’s knowledge of their task environment. Understanding this relationship and its effect on the human operator’s performance, trust in the agent, SA, and workload, as well as the role individual differences play in this interaction, is key to the development of effective human–agent teams.
2. Human–Agent Teaming
A Soldier on the battlefield may be required to conduct multiple concurrent tasks such as maintaining local security and SA and performing threat assessment and identification. While commonplace for Soldiers to concurrently conduct several tasks, switching between tasks causes performance decrements in the primary task when it is interrupted by a secondary task (Monsell 2003; Cummings 2004). Employing robotic assets to assist in these duties allows the Soldier to manage multiple tasks of increasing complexity and expands the Soldier’s scope of influence via the robotic capabilities. But, without successful integration of these robotic assets there could be an increase in performance decrements such as reduced SA and increased workload, as shown in previous research into single-operator management of multiple robotic assets (Chen et al. 2008; Wang et al. 2008; Wang et al. 2009). In response to these concerns, an intelligent agent, RoboLeader (RL), was developed to help a human supervisor manage a team of robots (Chen et al. 2010). Several studies have indicated that using an intelligent agent as the point of contact for the robotic team can improve the human operators’ SA and task performance and decrease their perceived workload (Chen and Joyner 2009; Chen and Terrence 2009; Wright et al. 2013).
The addition of the intelligent agent to manage the robotic team brings its own unique problems. While the operator benefits from reduced workload, findings indicate they do not always improve on task performance and SA. Chen et al. (2010) found no difference in target-detection performance between the baseline and RL conditions, although there was an improvement in mission-completion times. Similar findings were reported in Wright et al. (2013), in that increasing the RL’s level of autonomy (LOA) did not always improve SA or task performance and, in some cases, performance in the highest LOA decreased. This might be due to the occurrence of automation-induced complacency (Parasuraman et al. 1993; Parasuraman et al. 2000). Whether this behavior was due to premature cognitive commitment (Langer 1989) or some other complacent behavior, such as automation bias, or if the operator understood they had insufficient knowledge to appropriately override the automation remained unclear. What is clear is there is still much to learn about human performance issues associated with human–agent teaming.

Approved for public release; distribution is unlimited. 3
In the realm of human–automation interaction, a current topic of investigation is the quality of the interaction between the human operator and automated systems; specifically, how the operators’ understanding of the system’s actions affect their performance and what qualities are contained within the automated system that might enhance this interaction. When the intelligent agent is managing vehicle tasking and route planning or managing vehicles of differing constraints and capabilities, it becomes even more challenging to effectively convey the information to the supervising operator in a manner that allows them to assimilate the information and stay engaged in their supervisory task (Kilgore and Voshell 2014). Transparency of the agent’s intent and reasoning may encourage the operator to stay engaged and in the loop, improving performance and reducing complacency. This study investigates complacency associated with human–agent teaming as it pertains to agent reasoning transparency.
2.1 Issues with Automated Systems
An ongoing dilemma in the application of automated systems is task assignment; specifically, which tasks should be automated and which should be performed by the operator (Fitts 1951; Chapanis 1965; Sheridan 2006).
The “Ten Levels of Automation of Decision and Action Selection” model by Parasuraman et al. (2000) defines automation as varying along a continuum of levels, with each level specifying which responsibilities are assigned to the human and which to the automation. While the lowest levels have the human maintaining authority and executing all actions, at each successive level the automation increasingly becomes more autonomous. As the automation level increases, the responsibilities of the human operator decrease, until at the highest level of automation the human no longer has a role. At each increasing level of automation, the operator becomes more removed from the inner loop of control as their role changes from actor to supervisor. Paraphrasing Parasuraman et al. (2000), as the automation level increases from the lowest, Level 1, the responsibilities of the human operator decrease:
• Lowest—system offers no aid and human makes all decisions and takes all actions
• System offers a complete set of possible decisions/actions • System narrows the selection to a few alternatives • System suggests one alternative • System executes a suggestion if the human approves • System gives the human a specified time to veto before its
automatic execution

Approved for public release; distribution is unlimited. 4
• System executes automatically and then informs the human • System informs the human only if the human asks • System informs the human only if the computer decides to inform • Highest—system decides everything, acts on its own, ignores the
human This distance of control eventually creates an “out-of-the-loop (OOTL) condition that leads to increased automation-induced complacency (Parasuraman et al. 1993; Endsley 1996) and reduced operator SA (Parasuraman et al. 1993; Endsley 1995; Chen and Joyner 2009; Chen and Barnes 2010).
2.1.1 Automation-Induced Complacency
Automation-induced complacency is thought to occur when conditions are such that the operator’s trait complacency combines with task conditions that favor such complacent behavior, typically in multitasking environments when an operator must divide their attention across multiple tasks (Parasuraman et al. 1993). Complacent behavior occurs when factors create conditions that favor inaction (or continued repetitive action) on the part of the operator. Complacent behavior may be expressed in many ways, such as failure to follow all steps in set procedures or an overload condition causing the operator to attend to one task while (erroneously) entrusting the less than perfectly reliable automation to carry out another (Parasuraman et al. 1993). Operator inexperience, high workload, and consistently reliable systems encourage such overtrust, resulting in more complacent behavior (Parasuraman et al. 1993; Lee and See 2004; Chen and Barnes 2010).
2.1.2 Situation Awareness
SA is defined as “the perception of the elements in the environment within a volume of time and space, the comprehension of their meaning, and the projection of their status in the near future” (Endsley 1988, 1995). This model describes SA as something contained within the individual, separate from yet influenced by individual differences, as well as a function of system design (environment) (Hancock and Diaz 2002). Endsley operationalized the SA model into “levels”. Level 1 SA (SA1) is the operators’ perception of current situation, Level 2 SA (SA2) is how well the Level 1 SA elements are combined into comprehension of current situation, and Level 3 SA (SA3) is the ability to combine the perception and comprehension from earlier levels into a projection of future state (Endsley 1995). Each level is distinct from the others, yet they have a culmultive nature (e.g., in that SA3 cannot be attained without first achieving SA1). Although we attempt to assess SA at a single point in time, SA is not acquired instantly but developed over time (Endsley 1995). Time is often a critical aspect of SA, both in understanding when an event will occur in the future as well as assessing how relevant information is to

Approved for public release; distribution is unlimited. 5
current state. Time is particularly impactful on Levels 2 and 3 SA (see Endsley 1995) as these incorporate understanding of the past to present state awareness for comprehension and projection of future states.
As the level of automation increases the operator becomes more removed from control, creating an “out-of-of-the-loop” situation, resulting in reduced SA (Parasuraman et al. 1993; Endsley 1995; Chen and Joyner 2009; Chen and Barnes 2010). Endsley and Kiris (1995) found that an intermediate level of automation was partially effective in keeping the operator in the loop, increasing operators’ Level 1 SA but not their Level 2 SA. This finding indicated the increase in the level of automation encourages a more passive engagement, resulting in reduced understanding that threatens task effectiveness when comprehension and problem-solving are crucial.
2.2 Autonomy
Unlike automated systems, which follow scripts in which all possible courses of action have already been determined, autonomous sytems exercise a degree of choice regarding their actions. They do this using information gathered rather than relying exclusively on information supplied at the design stage (Russell and Norvig 2003). Parasuraman et al.’s (2000) model defines automation in regards to 2 particular aspects of human information processing (Manzey et al. 2012). The first is how thoroughly the automation supports the 4 stages of human information processing: information acquisition, information analysis, decision and action selection, and action implementation. The second aspect is how involved the human is in the information processing (and subsequent action taken). The first aspect is assessed within each level of automation. This ranges from simple “detect and react” scenarios to more advanced “analyze inputs, select appropriate action, and execute selected action” decisions. The second aspect is delineated by each successive level of automation (Parasuraman et al. 2000); system autonomy is increasing while human involvement is decreasing, until a point is reached where the system even decides whether to inform the human as to its actions. As such, the levels of automation encompass autonomy, particularly in Levels 5 (concurrence: computer suggests and executes if human approves) and higher, as these levels incorporate a dynamic, self-governing aspect to automation’s behavior. The focus in this study is on the decision aspect of autonomy; specifically, the shared decision space between the human operator and the autonomous agent. Consequently, the present focus is on Level 5, or concurrence, automation.

Approved for public release; distribution is unlimited. 6
2.3 RoboLeader, an Intelligent Agent
In the computer/artificial-intelligence realm, an agent is defined as capable of perceiving its environment through sensors (e.g., eyes, ears, cameras, and proximity switches) and of affecting its environment through actuators (e.g., hands and motors) (Russell and Norvig 2003). An intelligent agent can be human, robot, or even a disembodied entity, such as a computer software program, so long as it is capable of detecting the environment through some sort of input (e.g., hands, eyes, sensors, and network packets) and then affecting the environment through some kind of output or actuator (e.g., hands, actuators, information display, and network packets). Not only can these intelligent agents be independent, they can also be rational. That is, they interact with their environment in order to achieve a specific goal and measure their success according to specific performance criteria.
One such intelligent agent, RoboLeader, was developed to simplify interactions between a human supervisor and a robotic team (Chen et al. 2010). The human supervisor interacts with the RL, which interprets the supervisor’s goals and then commands a team of lower-capability robots through route planning and convoy management. This allows the human to focus on high-level decisions regarding convoy management, freeing their attention for other tasks such as maintaining security and communications. While the addition of the intelligent agent can be a boon to an operator managing multiple tasks, it also creates the distance that makes effective supervision of the team more difficult. Often this “distance” results in the operator displaying automation bias in favor of agent recommendations. It remains unknown whether this bias is a result of the operator recognizing they do not have enough information to confidently override the agent suggestions when appropriate, or whether complacency is due to an operator’s OOTL situation. Increasing the transparency of the agent has been recommended as one way to reduce this distance, pulling the operator back into the inner loop of control (Chen et al. 2014). One way to do this is to increase the operator's understanding of the agent’s reasoning (i.e., why the agent is making this recommendation).
2.4 Agent Transparency and SA-based Agent Transparency (SAT) Model
The human–automation-research community has not yet reached a consensus as to how transparency should be defined. Transparency has been described both as something the automation provides, whether by design or behavior (Kim and Hinds 2006; Cuevas et al. 2007; Cramer et al. 2008), and as the understanding or knowledge an operator has regarding the system’s behavior (Jameson et al. 2004; Cheverst et al. 2005; Cring and Lenfestey 2009). When referring to automation or

Approved for public release; distribution is unlimited. 7
automated systems, early constructs of transparency focused on explaining the system’s behavior in an effort to foster trust. Users begin to question the accuracy and effectiveness of a system when they do not understand the rationale behind the system’s recommendations (Linegang et al. 2006). As the users’ understanding of the rationale behind a system’s behavior grows, the better the users’ calibration of their trust and reliance (Lee and See 2004; Lyons 2013; Mercado et al. 2015). The more autonomous that a system becomes, the more important transparency becomes as a factor in user understanding and trust (Dzindolet et al. 2003; Kim and Hinds 2006). A recent definition of agent transparency, “the descriptive quality of an interface pertaining to its abilities to afford an operator’s comprehension about an intelligent agent’s intent, performance, future plans, and reasoning process” (Chen et al. 2014), expands on earlier constructs by extending the idea of agent transparency beyond simply explaining the agents’ behavior and fostering user trust, but also facilitating the operator’s comprehension and SA.
The SAT model (Chen et al. 2014) describes knowledge of what is happening in the environment and the agent’s goals as supporting the operator’s Level 1 SA (i.e., what is the agent trying to do); understanding the agent’s reasoning process as supporting the operators’ Level 2 SA (i.e., why does the agent do it); and providing future projections, likelihood of success, and uncertainty information as supporting the operators’ Level 3 SA (i.e., what should happen) (Endsley 1995). When the operator knows the agent’s intent, understands the agent’s reasoning, and can anticipate likely outcomes based on the information and reasoning, the operator can calibrate their trust in the agent (Lee and See 2004). This is particularly important in an evolving environment, where operator goals may not always be in agreement with agent goals (Linegang et al. 2006). When specific environmental information or the agent’s reasoning is not available to the operator, the operator has no reason to participate in the decision-making process, thus encouraging a human-OOTL situation (Wickens 1994; Parasuraman et al. 2000), which could contribute to automation-induced complacency (Parasuraman et al. 1993). An OOTL situation is also likely to occur when the operator is conducting multiple tasks in a high-workload environment (Parasuraman et al. 2000). Transparency of the agent’s intent and reasoning may encourage the operator to stay engaged and in the loop, improving performance and reducing complacency. The SAT model provides a systematic structure within which the effects of agent transparency can be examined. As such, this study focused on examining the utility of SAT Level 2 information (agent reasoning); specifically, how the transparency of agent reasoning affected the human operator’s decision-making ability, as measured via the route-selection task, when the operator has limited knowledge of the task environment. Figure 1 depicts the SAT model.

Approved for public release; distribution is unlimited. 8
Fig. 1 SAT model illustrating how agent transparency is defined at each level (Chen et al. 2014)
2.5 Current Study
The present research investigated how the transparency of agent reasoning, within the context of human–agent teaming, influences operator performance and behavior in a dynamic, multitasking environment. The effect of access to agent reasoning was evaluated across 2 experiments with different contexts: Experiment 1 was a low-environmental-information environment and Experiment 2 was a high-information environment. Within each experiment participants were assigned to a level of agent transparency, and results were compared between subjects to evaluate how the difference in transparency affected operator performance, workload, trust, SA, and complacent behavior. Finally, the 2 experiments’ findings were compared to evaluate how differences in available information affected operators’ performance at each level of agent reasoning transparency.
In each experiment, we simulated a multitasking environment where the operator had to supervise an autonomous agent’s route-revision recommendations for a convoy of 3 vehicles—his/her MGV, a UAV, and a UGV—as it proceeded along a predetermined route through a simulated environment. As the convoy travelled its route, events occurred that may have necessitated altering the convoy’s route to avoid a potentially hazardous situation. These events included potential threats to the convoy, environmental hazards (e.g., dense fog), and obstacles (e.g., congested traffic). These potential events were indicated by icons that appeared on the map on the operator’s control unit (OCU). Operators also had access to intel messages from command, which specified if the events indicated by the map icons were actual threats that required route revision or if the potentially hazardous conditions had cleared and the original route was now safe. When the convoy approached an area with potential events identified, the RL automatically suggested a route revision and the operator had to either accept the suggestion or reject it and keep the convoy on its original path. The RL’s suggestions were correct 66% of the time. Operators needed to recognize and correctly reject any incorrect RL suggestions.
Approved for public release; distribution is unlimited. 9
Transparency of the agent’s reasoning was manipulated by varying the operator’s access to the agents’ reasoning. There were 3 agent reasoning transparency (ART) conditions (i.e., ART1, ART2, and ART3). The ART1 condition was the baseline in which the agent notified the operator that a route revision was recommended; however, no agent reasoning for the suggestion was given to the operator. In the ART2 condition, operators had the same information as in ART1 but RL also explained the reason for the suggested route change. In the ART3 condition, operators had the same information as in ART2, but RL also reported when the intel information was received, which gave the operator insight into how stale the information was. In addition to the supervisory duties, participants maintained local security around the convoy via the vehicles’ indirect-vision camera feeds by reporting any threats present in the immediate vicinity of the convoy. Participants were also required to maintain SA and received SA queries throughout each trial.
The present results are expected to elucidate how the operators’ knowledge of the environment interacts with their understanding of agent reasoning to create “transparency”, as well as how increased access to the reasoning behind automation “decisions” affects a human operators’ ability to interact effectively with said automation. Too little transparency may hinder human trust in the automation. However, too much may have similarly detrimental effects on operator performance, SA, and decision-making, thus encouraging complacent behavior. In addition, this work investigated how several individual difference factors of common interest within the human–automation-interaction community influence the human–agent relationship in terms of agent transparency, and the subsequent effect on the related human performance issues.
2.5.1 Individual Differences
When evaluating the effectiveness of human–agent teaming, individual differences must be considered. Research has indicated that persons with higher perceived attentional control (PAC) are more effective at allocating attention and less susceptible to performance degradation in a multitasking environment than those with low PAC (Rubinstein et al. 2001; Derryberry and Reed 2002; Chen and Joyner 2009). Previous RL studies found links among PAC, system reliability, and cognitive workload (Chen and Terrence 2009; Wright et al. 2013). Differential effects on performance due to spatial ability (SpA) have been found on teleoperation tasks, robotic operation, and target-detection tasks (Lathan and Tracey 2002; Chen et al. 2008; Chen et al. 2010), as well as improved SA and target-detection performance (Fincannon 2013; Wright et al. 2013). Working memory capacity (WMC) differences have been shown to affect performance in multirobot supervisory tasks (Ahmed et al. 2014) and SA (Endsley 1995; Wickens

Approved for public release; distribution is unlimited. 10
and Holland 2000). In the current experiment, we examined the differential effects of PAC, SpA, and WMC on multitasking performance, operator SA, and perceived workload. Complacency Potential (CP) affects an individual’s ability to adequately monitor automation and to detect automation failures, so it was assessed using the Complacency Potential Rating Scale (CPRS) (Singh et al. 1993; Pop and Stearman 2015) as a possible mediating factor on the route-selection task. WMC has been shown to correlate with an individual’s attentional control (Engle et al. 1999), so WMC was evaluated as a covariate for assessing individual differences in performance due to PAC and SpA.
2.5.2 Eye-Tracking Measures
It has been asserted that underlying cognitive activities can be reliably inferred from eye-tracking metrics (Beatty 1980; Jacob and Karn 2003). In an earlier RL study (Wright et al. 2013), eye-tracking metrics proved useful in evaluating differences in workload that subjective measures of workload did not reveal. This work incorporates 3 visual measures as objective measures of cognitive workload: 1) fixation count, 2) fixation duration, and 3) pupil diameter.
2.5.2.1 Fixation Count (FC)
Fixations are low-velocity eye movements that correspond to a person staring at a particular point. The number of fixations, FC, has been shown to correlate positively with search difficulty (Ehmke and Wilson 2007) and negatively with search efficiency and increased mental workload (Goldberg and Kotval 1999; Van Orden et al. 2000).
2.5.2.2 Fixation Duration (FD)
The FD is the period of time the eye remains relatively still. In general, longer fixations times are associated with deeper cognitive processing. Studies have shown that longer fixation duration implies more mental processing (Unema and Rotting 1990) and increased search difficulty (Goldberg and Kotval 1999), however vigilance studies have indicated that longer fixation duration could also be an indicator of disinterest or daydreaming (Chapman and Underwood 1998).
2.5.2.3 Pupil Diameter (PDia)
Pupil size is sensitive to lighting changes, view angles, and distance to the screen, and is measured by imposing an ellipse over the pupil and measuring the vertical and horizontal axes (Holmqvist et al. 2011). Increases in pupil diameter have been found to be positively correlated with increased mental workload and interest (Peavler 1974; Beatty 1980; Van Orden et al. 2001).
Approved for public release; distribution is unlimited. 11
3. Experiment 1
3.1 Overview
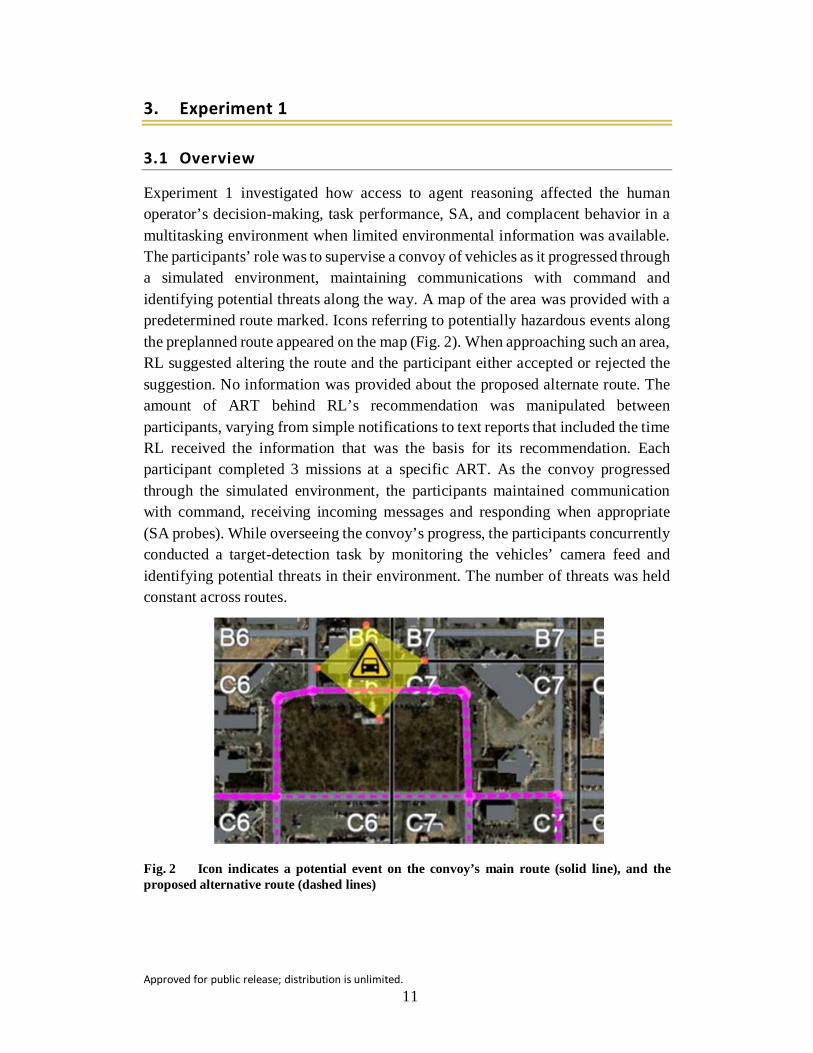
Experiment 1 investigated how access to agent reasoning affected the human operator’s decision-making, task performance, SA, and complacent behavior in a multitasking environment when limited environmental information was available. The participants’ role was to supervise a convoy of vehicles as it progressed through a simulated environment, maintaining communications with command and identifying potential threats along the way. A map of the area was provided with a predetermined route marked. Icons referring to potentially hazardous events along the preplanned route appeared on the map (Fig. 2). When approaching such an area, RL suggested altering the route and the participant either accepted or rejected the suggestion. No information was provided about the proposed alternate route. The amount of ART behind RL’s recommendation was manipulated between participants, varying from simple notifications to text reports that included the time RL received the information that was the basis for its recommendation. Each participant completed 3 missions at a specific ART. As the convoy progressed through the simulated environment, the participants maintained communication with command, receiving incoming messages and responding when appropriate (SA probes). While overseeing the convoy’s progress, the participants concurrently conducted a target-detection task by monitoring the vehicles’ camera feed and identifying potential threats in their environment. The number of threats was held constant across routes.
Fig. 2 Icon indicates a potential event on the convoy’s main route (solid line), and the proposed alternative route (dashed lines)

Approved for public release; distribution is unlimited. 12
3.2 Stated Hypotheses
3.2.1 Complacent Behavior, Primary Task Performance, and Trust in the Agent
We hypothesized that access to agent reasoning would reduce complacent behavior, improve task performance, and increase trust in the agent—but only to a degree, beyond which increased access to agent reasoning would result in information overload that would negatively impact performance, increase complacent behavior, and reduce trust in the agent (i.e., ART1 < ART2 > ART3). It has been previously stated that high attentional demands can cause aftereffects similar to those resulting from high stress (Cohen 1980); as such, this hypothesis resembles an inverted (extended) U-shaped function often observed in operators in stressful conditions (Yerkes and Dodson 1908; Hancock and Warm 1989). Decision time was also examined as a facet of performance and as such was expected to increase as access to agent reasoning increased: ART1 < ART2 < ART3. Although RL’s messages were slightly longer in ARTs 2 and 3 than in ART1, the difference in reading time is expected to be negligible. Participants were expected to take longer to process the information and reach their decision, resulting in longer decision times. We hypothesize that shorter response times indicate less deliberation on the part of the operator before accepting or rejecting the agent recommendation, indicating complacent behavior.
Hypothesis 1: Access to agent reasoning will reduce incorrect acceptances, ART1 > ART2, and increased transparency of agent reasoning will increase incorrect acceptances, ART2 < ART3. When agent reasoning is not available, incorrect acceptances will be greater than when agent reasoning is present, ART1 > ART2+3 (combined result of conditions with agent reasoning transparency).
Hypothesis 2: Access to agent reasoning will improve performance (number of correct rejections and acceptances) on the route-selection task, ART1 < ART2, and increased transparency of agent reasoning will reduce performance on the route-selection task, ART2 > ART3. When agent reasoning is not available, performance will be lower than when agent reasoning is present, ART1 < ART2+3.
Hypothesis 3: Access to agent reasoning will increase operator trust in the agent, ART1 < ART2, and increased transparency of agent reasoning will decrease operator trust in the agent, ART2 > ART3.
3.2.2 Workload
We hypothesize that increasing agent reasoning transparency will in turn increase the operators’ workload. Typically, increased automation assistance reduces
Approved for public release; distribution is unlimited. 13
operator workload, as the operator is able to offload a portion of their duties to the automation. However, in the case of agent reasoning transparency, the amount of information the operator must process increases as the agent reasoning becomes more transparent. It is expected that this increased mental demand will be reflected in the workload measures.
Hypothesis 4: Access to agent reasoning will increase operator workload, ART1 < ART2; and increased transparency of agent reasoning will increase operator workload, ART2 < ART3. When agent reasoning is not available, workload will be lower than when agent reasoning is present, ART1 < ART2+3.
3.2.3 Situation Awareness
We hypothesize that agent reasoning transparency will support operator SA. Access to the agent reasoning will help the operator better comprehend how objects/events in the task environment affect their mission, thus informing their task of monitoring the environment surrounding the convoy and making them cognizant of potential risks. This understanding will also enable them to make more accurate projections regarding future safety of their convoy. However, the addition of information that appears ambiguous to the operator will have a detrimental effect on their ability to correctly project future status.
Hypothesis 5: Access to agent reasoning will improve SA scores; increased transparency of agent reasoning will improve SA1 and SA2 scores, but will reduce SA3 scores:
• SA1: ART1 < ART2, ART2 < ART3
• SA2: ART1 < ART2, ART2 < ART3
• SA3: ART1 < ART2, ART2 > ART3.
3.2.4 Target-Detection Task Performance
We hypothesize that increasing agent reasoning transparency will reduce performance on the target-detection task. The increased mental demand on the operator will affect their ability to effectively monitor the environment for threats. However, access to agent reasoning will allow operators’ to maintain higher selection criteria, resulting in fewer false alarms (FA).
Hypothesis 6: Access to agent reasoning will reduce the number of targets detected and the number of FAs on the secondary task, ART1 > ART2; increased transparency of agent reasoning will reduce the number of targets detected and the number of FAs, ART2 > ART3.

Approved for public release; distribution is unlimited. 14
3.2.5 Individual Differences
The effects of individual differences in CP, PAC, SpA, and WMC on the operator’s task performance, trust, and SA were also investigated.
Hypothesis 7: Higher-CP individuals will have fewer correct rejections on the route planning task than lower-CP individuals.
Hypothesis 8: Higher-CP individuals will have higher scores on the usability and trust survey than lower-CP individuals.
Hypothesis 9: Higher-CP individuals will have lower SA scores than lower-CP individuals.
Hypothesis 10: Individual differences, such as SpA and PAC, will have differential effects on the operator’s performance on the route-selection task and their ability to maintain SA.
Hypothesis 11: Higher-WMC individuals will have more correct rejections and higher SA2 and SA3 scores than lower-WMC individuals.
3.3 Method
3.3.1 Participants
Seventy-six participants (ages 18–40) were recruited from the Sona System in the University of Central Florida’s (UCF) Institute for Simulation and Training and Psychology Department. UCF’s Sona System is a participant-recruitment system that allows students and members of the local community to participate in research. Participants received their choice of compensation: either cash payment ($15/h) or Sona Credit at the rate of 1 credit/h. Sixteen potential participants were excused or dismissed from the study, of which 9 left early due to equipment malfunctions, one withdrew during training claiming insufficient time to participate, 3 fell asleep during their session, 2 could not pass the training assessments, and one did not pass the color-vision screening test. Those who were determined to be ineligible or withdrew from the experiment received payment for the amount of time they participated, with a minimum of one hour’s pay. Sixty participants (26 males, 33 females, 1 unreported; Minage = 18 years, Maxage = 32 years, Mage = 21.4 years) successfully completed the experiment, and their data were used in the analysis.

Approved for public release; distribution is unlimited. 15
3.3.2 Apparatus
3.3.2.1 Simulator
The Mixed Initiative Experimental (MIX) Testbed (Fig. 3) was used for this experiment. The MIX Testbed is a distributed simulation environment for researching how unmanned systems are used and how automation affects human operator performance (Barber et al. 2008). This platform includes a camera payload and supports multiple levels of automation. Users can send mission plans or teleoperate the platform with a computer mouse while observing a video feed from the camera payload. Typical tasks include reconnaissance and surveillance. RoboLeader has the capability of collecting information from subordinate robots with limited autonomy (e.g., collision avoidance and self-guidance capabilities), making tactical decisions, and coordinating the robots by issuing commands, waypoints, or motion trajectories (Chen et al. 2010). The simulation was modified from the experimental design described by Wright et al. (2013) and delivered via a commercial desktop computer system, 22-inch monitor, standard keyboard, and 3-button mouse.
Fig. 3 The operator’s control unit is the user interface for convoy management and 360° tasking environment. OCU windows are (clockwise from the upper center) map and route overview, RL communications window, command communications window, MGV’s forward 180° camera feed, MGV’s rearward 180° camera feed, UGV’s forward camera feed, and UAV’s camera feed.

Approved for public release; distribution is unlimited. 16
3.3.2.2 Eye Tracker
The Sensomotoric Instrument (SMI) Remote Eyetracking Device (RED) was used to collect eye-movement data. The SMI–RED system uses an IR-camera-based tracking system, which allows noncontact operation. Eye and head movements, which can be observed at approximately 0.03° of spatial resolution and sampled at the rate of 120 Hz, along with measurement-reliability data were logged in real time and synchronized with performance data from other systems. Only the participants’ eye-gaze coordinates were measured and recorded; no video of the participants’ eyes and faces was recorded. The system was individually calibrated for each participant before each scenario.
3.3.3 Surveys and Tests
3.3.3.1 Demographics Questionnaire
A demographics questionnaire was administered at the beginning of the training session (see Appendix A). Information on participant’s age, gender, education level, computer familiarity, and gaming experience was collected.
3.3.3.2 Ishihara Color Vision Test
An Ishihara Color Vision Test comprising 9 test plates (Ishihara 1917) was administered via PowerPoint slide presentation. Since the RL’s OCU employs several colors to display the plans for the robots, normal color vision is required to effectively interact with the system. One potential participant failed to correctly identify at least 7 of the plates and was paid for 1 h and dismissed.
3.3.3.3 Attentional Control Survey
A questionnaire on Attentional Control (Derryberry and Reed 2002) was used to measure participants’ PAC (see Appendix B) by evaluating their perception of their attention focus and shifting. The Attentional Control survey consists of 20 items scored on a 1–4-point Likert scale, with half of the items reverse-scored. Score range is 20–80 points, with higher scores indicating better attentional control. The scale has been shown to have good internal reliability (α = .88). High/low group membership by number (N) was determined by median (Mdn) split of all participants’ scores (MinPAC = 41.0, MaxPAC = 74.0, MdnPAC = 61.0, MPAC = 60.5, SDPAC = 7.5; PACLOW N = 28, PACHIGH N = 32).
3.3.3.4 Spatial Ability Tests
The Cube Comparison Test (Ekstrom et al. 1976) assesses the spatial ability factor known as spatial visualization (SV) by measuring an individual’s ability to mentally manipulate objects in 3-D space. (See Appendix C.) It consists of 2 parts

Approved for public release; distribution is unlimited. 17
and requires participants to compare, in 3 min per part, 21 pairs of 6-sided cubes and determine if the rotated cubes are the same or different. Each part was scored using the formula
� �#𝑎𝑎𝑎𝑎𝑎𝑎𝑎𝑎𝑎𝑎𝑎𝑎𝑎𝑎𝑎𝑎𝑎𝑎
21 � � #𝑐𝑐𝑐𝑐𝑐𝑐𝑐𝑐𝑎𝑎𝑐𝑐𝑎𝑎
#𝑎𝑎𝑎𝑎𝑎𝑎𝑎𝑎𝑎𝑎𝑐𝑐𝑎𝑎𝑎𝑎 �� ∗ 100, (1)
where attempted items included both answered and skipped items, answered items included any item where an answer was supplied (whether correct or incorrect), and skipped items were items that were not answered but were followed by at least one answered item. The scores of the 2 parts were then averaged to give the participants’ overall score. Higher scores imply greater SV ability. High/low group membership was determined by median split of all participants’ scores (MinSV = 0.234, MaxSV = 0.95, MdnSV = 0.60, MSV = 0.61, SDSV = 0.18, SV LOW N = 30, SV HIGH N = 30).
The Spatial Orientation Test (SOT) measures an individual’s ability to orient themselves in a 3-D world (Gugerty and Brooks 2004). It is a computerized test consisting of a brief training segment and 32 test questions whose score is based on both accuracy and response time. Scores are calculated by dividing average response time by total number correct, and higher performance is indicated by lower scores. (See Appendix D.) High/low group membership was determined by median split of all participants’ scores (MinSOT = 3.97, MaxSOT = 39.32, MdnSOT = 12.72, MSOT = 14.15, SDSOT = 8.41, SOTLOW N = 27, SOTHIGH N = 33).
3.3.3.5 National Aeronautics and Space Administration-Task Load Index (NASA-TLX)
Participants’ perceived workload was evaluated with the computerized version of the NASA-TLX questionnaire, which uses a pairwise comparison weighting procedure (Hart and Staveland 1988). The NASA-TLX is a self-reported questionnaire of perceived demands in 6 areas: mental demand, physical demand, temporal demand, effort (mental and physical), frustration, and performance. Participants evaluated their perceived workload in these areas on 10-point scales as well as completing pairwise comparisons for each subscale. (See Appendix E.)
3.3.3.6 Complacency Potential Rating Scale
The updated CPRS (Singh et al. 1993; Pop and Stearman 2015) measures an individual’s attitude toward automation and automated devices and has been shown to have high internal consistency (r > 0.98) and test–retest reliability (r = 0.90). The CPRS has 20 items, 4 of which are filler, and each item is scored from 1 (“Strongly agree”) to 5 (“Strongly disagree”). Several items are negatively worded and are reverse-scored in the final tally (see Appendix F). CPRS scores range from 16 (low complacency potential) to 80 (high complacency potential). The developers suggest
Approved for public release; distribution is unlimited. 18
classifying participants as either low or high complacency potential using the median split of the CPRS scores. High/low group membership was determined by median split of all participants’ scores (MinCPRS = 28.0, MaxCPRS = 49.0, MdnCPRS = 39.5, MCPRS = 39.9, CPRSLOW N = 30, CPRSHIGH N = 30).
3.3.3.7 Reading Span Task (RSPAN)
Verbal WMC was assessed using the automated RSPAN (Daneman and Carpenter 1980; Unsworth et al. 2005; Redick et al. 2012), which has high internal (partial score α = 0.86) and test-retest (α = 0.82) reliability (see Appendix G). Participants were shown a sentence and determined if the sentence made sense as written (e.g., “Andy was stopped by the policeman because he crossed the yellow heaven”). When viewing the sentence, they answered “Yes” (the sentence makes sense) or “No” (the sentence does not make sense). Participants were given feedback how they were performing on this task and were instructed to keep their performance above 80%. A minimum score of 80% correct on the sentence-comprehension portion was required to continue with the study. However, no participants were dismissed. After evaluating the sentence, they were shown a letter to be recalled later. At the end of each set, participants were prompted to recall the letters in the proper order. Sentence–letter set sizes varied between 3 and 6 items, and each participant received 3 sets of each set size, for a total of 54 sentence–letter sets. WMC was evaluated by using the participants’ letter-set score (total number of letters in perfectly recalled letter sets), and higher values indicate greater WMC (MinRSPAN = 5.0, MaxRSPAN = 51.0, MdnRSPAN = 32.5, MRSPAN = 31.3, SDRSPAN = 11.1). High/low group membership was determined by median split of all participants’ scores, RSPANLOW N = 30, RSPANHIGH N = 30.
3.3.3.8 Usability and Trust Survey
Participants’ perceived usability of and trust in the system were evaluated using a modified version of the Usability and Trust Survey (Chen and Barnes 2012). The survey consists of 20 questions rated on a scale of 1 to 7, with an overall scoring range of 20–140 points (see Appendix H). Items 1–8 assess usability (score range 8–56) while items 9–20 assess trust (score range 12–84). Negative questions such as “The RoboLeader display was confusing” were reverse coded (e.g., a score of 7 = 1, 6 = 2). Positive questions such as “The RoboLeader system is dependable” and “I can trust the RoboLeader system” were regularly coded, with the sums of the positive and inverse-scored negative questions combined to create a global score. Higher scores indicate greater trust and better usability.

Approved for public release; distribution is unlimited. 19
3.3.4 Experimental Design and Performance Measures
The study was a between-subjects experiment. Independent variables were ART level and individual-difference factors. Dependent measures were route-selection task score, decision time, target-detection task scores, workload, SA, and trust scores.
3.3.4.1 Independent Variables
ART was manipulated via RL messages (see Appendix K). In ART1 the agent recommended a course of action but otherwise offered no insight as to the reasoning behind the recommendation. In ART2 the agent recommended a course of action and gave the reason behind this recommendation. In ART3 the agent’s recommendation was the same as in ART2. However, the message also said how long ago the information was received (e.g., 1 h, 4 h, 6 h). Participants completed 3 missions in their assigned ART.
3.3.4.2 Dependent Measures 3.3.4.2.1 Route-Selection Task Measures
• Performance Score: Participants were scored on whether they correctly accepted or rejected RL’s route selection, and those scores summed across all missions. The score range for this score is 0 (no correct rejections or acceptances) to 18 (correctly accepted or rejected all RL suggestions).
• Complacent behavior was operationalized in this study as automation bias (complacency in decision-making) and was evaluated as accepting RL’s route suggestion when it was not correct. Twice each mission, RL made a suggestion that should be rejected. Incorrect acceptances of these suggestions were indicative of complacent behavior; the participant scored 1 point for each incorrect “accept” and these were summed across all missions. The score range for this measure is 0–6, with higher scores indicating more complacent behavior and lower scores indicating less. Decision time was assessed concurrently in order to better distinguish between complacent behavior and simple errors. Reduced decision times, particularly when ART increases, could indicate less deliberation (i.e. more complacent behavior).
• Incorrect Rejections: Four times each mission RL made a suggestion that should have been correctly accepted. Incorrect rejections of these suggestions were indicative of low trust and/or poor SA; the participant scored 1 point for each incorrect reject, and these were summed across all

Approved for public release; distribution is unlimited. 20
missions. The score range for this measure is 0–12, with higher scores indicating more distrustful behavior and lower scores indicating less.
• Decision Time (DT): DT was averaged across missions. DT was quantified as the time between agent alert and participant route selection. Reduced DT when ART was available or increased (compared to DT in the notification-only condition) could indicate overwork resulting in complacent behavior.
3.3.4.2.2 Target-Detection Task Measures • Targets Detected (Hits): Number of targets correctly identified was
expected to decrease as access to agent reasoning increased.
• False Alarms: Number of FAs was expected to increase as ART increases.
• In addition to hits and FAs, 2 signal-detection theory measures were used to assess participant performance on the target-detection task:
o d’: A measure of sensitivity to target. Values near 0 indicate correct detection probability near chance while higher values indicate increased discernibility of targets and participant sensitivity to targets.
o β: The likelihood ratio, an area-based measure of response bias. Higher values indicate a more conservative response bias.
3.3.4.2.3 SA Scores In this study, the agent’s level of automation is kept at an intermediate LOA to control the effects of information and reasoning, and the state of the operator’s SA is assessed via real-time probes that appear as requests for information from “command”. The Level 1 SA probes enquire about objects and persons in the simulated environment, with the idea that elements within the environment influence the participants’ responses (Hancock and Diaz 2002). The Level 2 SA probes enquire about the reasoning behind the participants’ choices in an attempt to gauge their understanding and comprehension of the events in the environment that should influence their decision. The Level 3 SA probes ask the participant to project the future status of their convoy based upon their understanding of upcoming threats along their route.
Each mission contained 18 SA queries, 6 for each of the 3 SA levels. SA queries were designed to assess the participants’ SA at a specific SA level (i.e., SA1—Level 1 SA, perception; SA2—Level 2 SA, reasoning, comprehension; SA3—Level 3 SA, the projection of future state). Higher scores indicate better SA (see Appendix L).
Approved for public release; distribution is unlimited. 21
3.3.4.2.4 Trust After completing 3 missions, the Usability and Trust Survey was administered to assess the participants’ trust in the agent.
3.3.4.2.5 Workload Perceived Workload: After completing 3 missions, the NASA-TLX was administered to assess the participants’ perceived workload. Both global and individual factor workload scores were evaluated.
Cognitive Workload: This was evaluated using several ocular indices (i.e., fixation count, fixation duration, and pupil diameter). Data for these measures were collected at a sampling rate of 120 Hz over the length of each mission, and then averaged across all missions.
3.3.5 Procedure
After being briefed on the purpose of the study and signing the informed-consent form (see Appendix I), participants completed the demographics questionnaire, the RSPAN, and a brief Ishihara Color Vision Test. Then participants completed the Attentional Control Survey, the Cube Comparisons test, the SOT, and the CPRS.
Participants then received training and practice on their tasks. Training was self-paced and delivered by PowerPoint slides (see Appendix J). Participants were trained on the elements of the OCU, identification of map icons and their meanings, and steps for completing various tasks and then completed several mini-exercises for practice. The training session lasted approximately 1.5 h. Before proceeding to the experimental session, participants had to demonstrate they could recall all icons and their meanings, as well as perform all tasks, without any help. Participants were required to score 90% proficiency on the assessments; those who scored too low on the assessments were allowed to review the information again. If after additional training the participant could not pass the asssessments, they were paid for the time they had spent in the experiment and dismissed.
The experimental session lasted approximately 2 h and began immediately after the training session. Participants were randomly assigned to an ART condition (ART1, ART2, or ART3), which was counterbalanced across participants to ensure an equal N in each condition. The experimental session had 3 scenarios. Each scenario consisted of a different convoy route through the same simulated environment and lasted approximately 30 min. The scenario order was counterbalanced across participants to avoid order effects. At the beginning of each scenario, the eye tracker was calibrated using the 9-point calibration setting.

Approved for public release; distribution is unlimited. 22
During the scenarios, participants guided a convoy of 3 vehicles (their own MGV, a UAV, and a UGV) through a simulated urban environment, moving from checkpoint to checkpoint along a preplanned route. As the convoy proceeded through the environment, events occurred that necessitated altering the route. Information regarding potential events along the preplanned route, together with communications from a commander confirming either the presence or absence of activity in the area, were provided to all participants. They did not receive any information about the suggested alternate route. However, they were instructed that the proposed path was at least as safe as their original route. When the convoy approached a potentially unsafe area, the intelligent agent would recommend rerouting the convoy. Each scenario had 6 events that caused RoboLeader to suggest a route revision. Events and their associated area of influence were displayed on the map with icons. The participants viewed communications from RL (see Appendix K) via a text feed in the upper right-hand corner of the OCU. The RL suggested a potential route revision, and the operator either had to accept or reject the suggestion. Two of RL’s route-change suggestions per scenario were inappropriate (66% reliable), which the participant needed to correctly reject. Once RL suggested a route, there was a limited amount of time (15 s) for the participant to acknowledge the suggested change, which they did by clicking the “acknowledge” button on the RL-communication window. If time expired before the participant acknowledged RL’s suggestion, RL automatically continued convoy movement along the original route; however, all participants acknowledged RL’s suggestion within the allotted time. Once the participant acknowledged RL’s suggestion, the simulation paused until the participant either agreed with or rejected RL’s suggestion.
The participant maintained communication with their command via a text feed directly below RL’s communication window. Participants viewed messages from command, not all of which were directed to the participant. Each mission contained 12 information updates from command, 2 of which would result in the need to override RoboLeader’s route recommendation. Communications included messages directed at other units (e.g., “Lima Unit: Return to rally point”), which the participant should have disregarded. These messages were intended to create “noise” as well as maintain a consistent rate for incoming messages (one message from either source approximately every 30 s). In all conditions, command would also request information from the operator (SA queries). Requests for information required a response from the participant, which they did by selecting the appropriate response in the communication window on the OCU. Each mission contained 18 requests for information, and these were used to assess the participants SA.

Approved for public release; distribution is unlimited. 23
Simultaneously, the participants had to maintain local security surrounding his/her MGV by monitoring the MGV and UGV indirect-vision displays and detect targets in the immediate environment. Once a hostile target was detected, the participants identified the target by clicking on it with the mouse. Mouse clicks in the camera feed windows produced a camera-shutter sound, so the participant had verification that they did successfully click in the window. However, they did not receive feedback regarding their performance on the target-detection task. There were civilians and friendly dismounted soldiers in the simulated environment to increase the visual noise present in the target-detection tasks.
After completing 3 missions, participants assessed their perceived workload and trust in RL’s suggestions. Participants were then debriefed, and any questions they had were answered by the experimenter.
3.4 Results
Data analysis was performed using SPSS Version 22 software. Data were examined using planned comparisons (α = 0.05), using a Bonferroni correction for multiple comparisons when applicable. When there was a violation of the homogeneity of variance assumption, Welch’s correction was used and contrast tests did not assume equal variance between conditions. Specifically, ART1 was compared to ART2, ART2 to ART3, and ART1 to ART2+3 (average of ART2 and ART3 scores) unless otherwise noted. Means, standard deviation (SD), and 95% confidence intervals (CIs) are reported for each measure.
Categorical data, such as grouped participant responses, were evaluated using Chi-squared analysis (α = 0.05).
Individual difference (ID) factors (i.e., SpA, PAC, and WMC) were assessed as potential covariates for all dependent measures. When an ID factor was revealed to be a significant predictor or correlate highly with the measure of interest, these results were reported. However, none passed the heterogeneity of regression requirement for use as a covariate in an analysis of covariance.
Preliminary GPower 3.1.3 analysis indicated that 60 participants, in 3 groups (20 per group), in a between-factors analysis of variance (ANOVA) had an estimated power of 0.83 at a medium-to-large effect size (f = 0.35).

Approved for public release; distribution is unlimited. 24
3.4.1 Complacent behavior, Primary Task Performance, and Trust in the Agent
3.4.1.1 Complacent Behavior
Hypothesis 1: Access to agent reasoning will reduce incorrect acceptances, ART1 > ART2, and increased transparency of agent reasoning will increase incorrect acceptances, ART2 < ART3. When agent reasoning is not available, incorrect acceptances will be greater than when agent reasoning is present, ART1 > ART2+3.
Descriptive statistics for incorrect acceptances and decision times at the locations where the agent recommendation should have been rejected are shown in Table 1.
Table 1 Descriptive statistics for incorrect acceptances and decision times, sorted by ART level (with SE = standard error and CI = confidence interval)
N Mean SD SE 95% CI for mean
Incorrect acceptances
ART1 20 3.25 2.27 0.51 (2.19, 4.31) ART2 20 1.14 1.28 0.29 (0.54, 1.73) ART3 20 2.65 2.32 0.52 (1.56, 3.74)
Overall DT at reject
locations (s)
ART1 20 3.82 1.88 0.42 (2.94, 4.70) ART2 20 2.96 1.44 0.32 (2.29, 3.64) ART3 20 3.41 1.55 0.35 (2.69, 4.14)
DT correct rejects (s)
ART1 14 7.47 4.29 1.15 (4.99, 9.95) ART2 20 7.49 3.17 0.71 (6.01, 8.98) ART3 18 8.14 3.47 0.82 (6.41, 9.86)
DT incorrect accepts (s)
ART1 18 8.04 2.86 0.67 (6.62, 9.46) ART2 11 6.09 1.76 0.53 (4.91, 7.28) ART3 14 7.90 3.20 0.86 (6.06, 9.75)
Planned comparisons revealed that mean incorrect acceptances were lower in ART2 than in ART1, t(29.9) = –3.63, p = 0.001, rc = 0.55, and ART3, t(29.5) = 2.55, p = 0.016, rc = 0.43 (see Fig. 4). Overall, incorrect acceptances were significantly lower when agent reasoning was provided (ART1 > ART2+3), t(31.8) = –2.31, p = 0.028, rc = 0.38. The hypothesis was supported, since access to agent reasoning did reduce incorrect acceptances in a low-information environment, and increased transparency of agent reasoning began to overwhelm participants resulting in increased incorrect acceptances.

Approved for public release; distribution is unlimited. 25
Fig. 4 Average incorrect acceptances by ART level; bars denote SE
Complacent behavior could also be indicated by reduced DT for responses on the route-selection task, particularly at those locations where the agent recommendation is incorrect. We hypothesized that DT would increase as ART increased, as participants should require additional time to process the extra information. Thus, reduced time could indicate less time spent on deliberation, which could be an indication of complacent behavior. In addition to the overall time to respond, DTs for correct rejections and incorrect acceptances were also examined (Fig. 5).
There was no significant difference in overall DTs, nor for DTs for correct rejections among the ART levels. However, DTs for incorrect acceptances were longer in ART1 than in ART2, t(27.0) = –2.27, p = 0.032, rc = 0.40, and shorter in ART2 than in ART3, t(20.9) = 1.80, p = 0.087, rc = 0.37. While overall DTs remain relatively unchanged across ART levels, DTs for incorrect acceptances drop significantly in ART2, which could be an indication of less deliberation and potentially complacent behavior. Paired t-tests were used to compare differences between DTs for correct and incorrect responses within each ART; however, none were found to be statistically significant.

Approved for public release; distribution is unlimited. 26
Fig. 5 Average DT in seconds for participant responses at decision points where the agent recommendation was incorrect: DTs are shown for all responses (overall), correct rejections, and incorrect acceptances, sorted by ART level; bars denote SE.
Participants’ responses were further analyzed by the number of incorrect acceptances per ART level (Fig. 6). In total, 17 participants had no incorrect acceptances, 15 of whom were in ARTs 2 and 3—evidence that access to agent reasoning was beneficial in avoiding incorrect acceptances. Chi-square analysis found a significant effect of ART on the number of incorrect acceptances, Χ2(14) = 29.45, p = 0.009, Cramer’s V = 0.495. Forty-three participants had at least one incorrect acceptance; 42% of these were in ART1, 32% in ART3, and 26% in ART2. The incorrect scores were sorted into groups: <50% (score 3 or less) or >50% (score 4 or higher). Participants in ART1 were evenly split between these groups, indicating that in the notification-only condition performance was no better than chance. Also, of the 8 participants who scored 6/6 on incorrect acceptances, 6 were in ART1. The majority of participants who had >50% incorrect acceptances when agent reasoning was available were in ART3. An examination of the distribution of scores shows that access to agent reasoning had a beneficial effect on performance. However, the increase in incorrect acceptances in ART3 could indicate too much access to agent reasoning can have a detrimental effect on performance.

Approved for public release; distribution is unlimited. 27
Fig. 6 Distribution of incorrect acceptance scores across ART levels
3.4.1.2 Route-Selection Task Performance
Hypothesis 2: Access to agent reasoning will improve performance (total number of correct rejections and acceptances) on the route-selection task, ART1 < ART2, and increased transparency of agent reasoning will reduce performance on the route-selection task, ART2 > ART3. When agent reasoning is not available performance will be lower than when agent reasoning is present, ART1 < ART2+3.
Descriptive statistics for route-selection task scores and DTs for all decision points across 3 missions are shown in Table 2.
Table 2 Descriptive statistics for route-selection scores and DTs, sorted by ART level
N Mean SD SE 95% CI for mean
Route-selection
score
ART1 20 14.10 2.59 0.58 (12.89, 15.31) ART2 20 15.70 2.23 0.50 (14.66, 16.74) ART3 20 14.70 2.81 0.63 (13.38, 16.02)
Overall DT ART1 20 7.64 3.60 0.81 (5.95, 9.32) ART2 20 7.51 3.36 0.75 (5.93, 9.08) ART3 20 8.14 3.62 0.81 (6.45, 9.84)
DT correct responses
ART1 20 7.53 3.52 0.79 (5.88, 9.18) ART2 20 7.42 3.37 0.75 (5.85, 9.00) ART3 20 7.98 3.33 0.74 (6.43, 9.54)
DT correct responses
ART1 18 8.02 2.80 0.66 (6.63, 9.42) ART2 17 8.44 4.20 1.02 (6.28, 10.60) ART3 14 9.16 5.20 1.39 (6.16, 12.16)

Approved for public release; distribution is unlimited. 28
Planned comparisons revealed that mean route-selection task scores were higher in ART2 than in ART1, t(57) = 1.98, p = 0.053, rc = 0.25 (see Fig. 7). The hypothesis was partially supported, as the medium–large-effect size between ARTs 1 and 2 indicates the addition of agent reasoning did improve route-selection performance. Scores in ART3 were somewhat lower than those in ART2; however, this difference was not significant, indicating performance in these 2 conditions was essentially the same.
Fig. 7 Average route-selection task score by ART level; bars denote SE
Overall DT in ART2 was slightly shorter than in ART1 or ART3; however, this difference was not significant. Although this result is contrary to what was expected (DT increasing as ART increased), this could provide additional support for Hypothesis 2, as the slight reduction in DT regardless of the increased amount of information to process could indicate a performance improvement in ART2 over ART1 when considered jointly with the route-selection task performance. The lack of difference between ARTs 2 and 3 for overall DT could indicate the increased access to reasoning had little effect on DT.
Overall DTs for acceptances were compared to those for rejections (of the agent recommendation) using paired t-tests, and there was no significant difference across ART levels. Overall DTs for correct responses were compared to those for incorrect responses using paired t-tests and were found to be significantly shorter, t(48) = –2.15, p = 0.037, d = 0.17. Within each ART, this difference neared significance only in ART 2, t(16) = –1.91, p = 0.074, d = 0.27 (see Fig. 8). DTs for correct responses and for incorrect responses were evaluated between ARTs, and there were no significant differences.
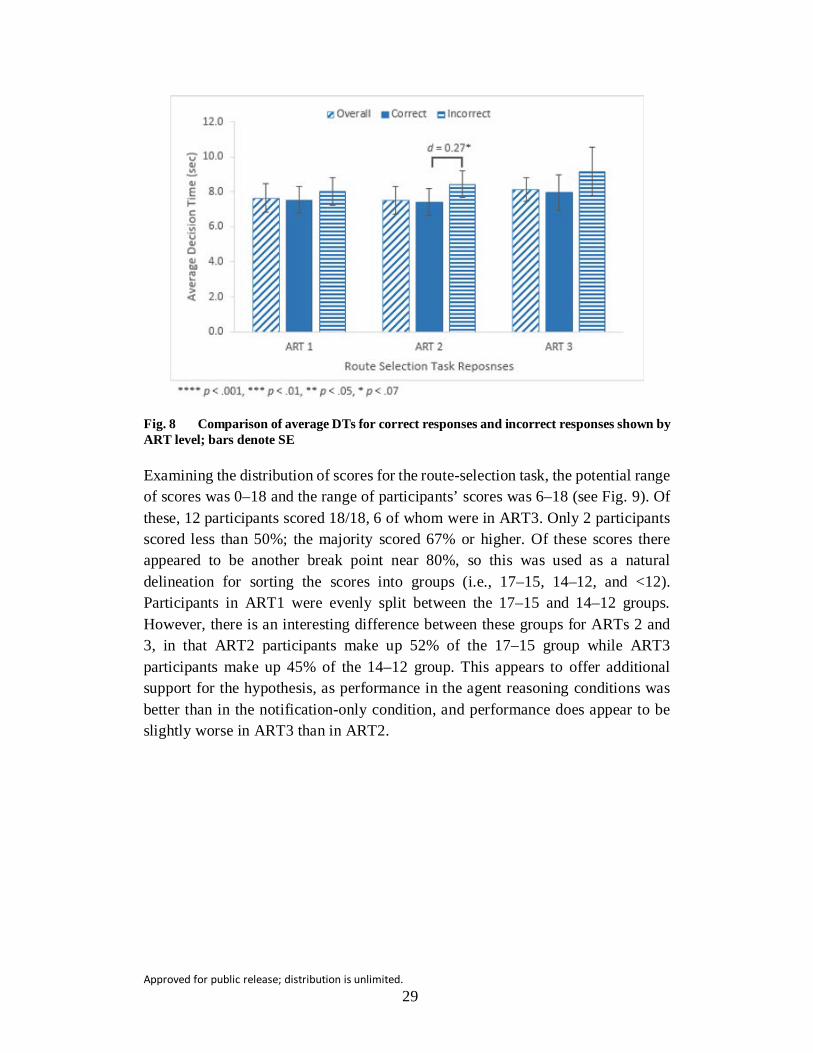
Approved for public release; distribution is unlimited. 29
Fig. 8 Comparison of average DTs for correct responses and incorrect responses shown by ART level; bars denote SE
Examining the distribution of scores for the route-selection task, the potential range of scores was 0–18 and the range of participants’ scores was 6–18 (see Fig. 9). Of these, 12 participants scored 18/18, 6 of whom were in ART3. Only 2 participants scored less than 50%; the majority scored 67% or higher. Of these scores there appeared to be another break point near 80%, so this was used as a natural delineation for sorting the scores into groups (i.e., 17–15, 14–12, and <12). Participants in ART1 were evenly split between the 17–15 and 14–12 groups. However, there is an interesting difference between these groups for ARTs 2 and 3, in that ART2 participants make up 52% of the 17–15 group while ART3 participants make up 45% of the 14–12 group. This appears to offer additional support for the hypothesis, as performance in the agent reasoning conditions was better than in the notification-only condition, and performance does appear to be slightly worse in ART3 than in ART2.

Approved for public release; distribution is unlimited. 30
Fig. 9 Distribution of scores for the route-selection task across ART levels
3.4.1.3 Operator-Trust Evaluation
Hypothesis 3: Access to agent reasoning will increase operator trust in the agent, ART1 < ART2, and increased transparency of agent reasoning will decrease operator trust in the agent, ART2 > ART3.
Descriptive statistics for incorrect rejections and the Usability and Trust Survey scores are shown in Table 3.
Table 3 Descriptive statistics for incorrect rejections and Usability and Trust Survey results sorted by ART level
N Mean SD SE 95% CI for mean
Incorrect rejections
ART1 20 0.85 1.53 0.34 (0.13, 1.57) ART2 20 1.10 1.33 0.30 (0.48, 1.72) ART3 20 0.75 1.68 0.38 (–0.04, 1.54)
Usability and trust survey
ART1 20 62.75 7.38 1.65 (59.29, 66.21) ART2 20 56.25 9.24 2.07 (51.92, 60.58) ART3 20 62.50 8.27 1.85 (58.63, 66.37)
Usability responses
ART1 20 46.75 5.33 1.19 (44.26, 49.24) ART2 20 40.75 6.60 1.48 (37.66, 43.84) ART3 20 45.75 7.03 1.57 (42.46, 49.04)
Trust responses
ART1 20 58.55 8.28 1.85 (54.67, 62.43) ART2 20 54.40 10.23 2.29 (49.61, 59.19) ART3 20 61.60 11.72 2.62 (56.12, 67.08)

Approved for public release; distribution is unlimited. 31
Planned comparisons revealed incorrect rejections were slightly higher in ART2 than in ART1 and ART3, which is contrary to predicted outcomes; however, this difference was not statistically significant (see Fig. 10).
Fig. 10 Average incorrect rejections by ART level; bars denote SE
The DT for responses at the locations where the agent recommendation was correct was evaluated as a potential indicator of operator trust. It was hypothesized that DT would increase as agent reasoning transparency increased, as participants should require additional time to process the extra information. Thus, increased time could indicate more time spent on deliberation, which may imply lower trust (e.g., less complacent behavior). However, reduced DTs for incorrect rejections of the agent recommendation at those locations could be indicative of complacent behavior or greater trust.
Paired t-tests were used to compare differences between DTs for correct acceptances and incorrect rejections within each ART at those locations where the agent recommendation was correct (see Fig. 11). DTs for incorrect rejections were significantly longer than for correct acceptances in ART2, t(13) = –2.56, p = 0.024, d = 0.47. However, there was no difference between the 2 in ART1 or ART3. This lack of difference between correct and incorrect DTs in ARTs 1 and 3 could indicate a more complacent stance toward critiquing the agent recommendation in those conditions, while participants in ART2 appeared to maintain a more engaged, critical stance.

Approved for public release; distribution is unlimited. 32
Fig. 11 Average DT, in seconds, for correct acceptances and incorrect rejections within each ART level; bars denote SE
Examining the distribution of incorrect rejections at those locations where the agent recommendation was correct across ARTs, 33 participants had no incorrect rejections. These were predominately in ARTs 1 and 3, ART2 having half as many perfect scores as the other 2 conditions (see Fig. 12). The range for potential scores for incorrect rejections was 0–12, and the range of participants’ scores was 0–6. Twenty-seven participants had at least one incorrect rejection, and these scores were sorted into <50% (score 3 or less) and >50% (score 4 or higher). Half of the participants in ART2 (10) had only one incorrect rejection. Considering perfect scores and one incorrect rejection together, it appears performance between the ARTs was relatively consistent. However, this may also be evidence of more complacent behavior in ARTs 1 and 3, where the agent recommendation was accepted more often, compared to more engaged, critical behavior in ART2, which resulted in occasional errors in judgment and incorrect responses.

Approved for public release; distribution is unlimited. 33
Fig. 12 Distribution of scores for incorrect rejections sorted by ART level
Operator trust was also evaluated using the Usability and Trust Survey. A between-groups ANOVA was conducted to assess the effect of ART on Usability and Trust Survey scores and found a significant effect, F(2,57) = 3.00, p = 0.057, ω2 = 0.06 (see Fig. 13). Usability and trust scores in ART2 were lower than in either ART1, t(57) = –1.83, p = 0.073, rc = 0.24, or ART3, t(57) = 2.33, p = 0.023, rc = 0.29, which is contrary to the hypothesis. These scores indicate participants trusted the agent more in ARTs 1 and 3 than in ART2. Adding ART reduced perceived usability and trust; however, increased transparency of agent reasoning appeared to improve perceived usability and trust of the agent.
Fig. 13 Average Usability and Trust Survey scores by ART level; bars denote SE

Approved for public release; distribution is unlimited. 34
The Usability and Trust Survey is a combination of surveys measuring usability and trust. These individual surveys were also evaluated separately to assess whether the findings were due to mainly operator trust or perceived usability.
PAC scores were found to be significant predictors of trust-survey scores, R2 = 0.078, b = 0.384, t(58) = 2.21, p = 0.031, and usability-survey scores, R2 = 0.084, b = 0.260, t(58) = 2.31, p = 0.025. Participants who scored higher on PAC also scored higher on the trust survey and the usability survey than their counterparts.
There was not a significant overall effect of ART on trust score (see Fig. 14). Planned comparisons revealed trust scores in ART2 were slightly lower than in ART1 and significantly lower than ART3 scores, t(57) = 2.24, p = 0.029, rc = 0.28. These findings do not support the hypothesis, as ART2 had the lowest trust scores while ART3 had the highest.
Fig. 14 Average trust scores by ART level; bars denote SE
There was a significant effect of ART on usability scores, F(2,57) = 5.11, p = 0.009, ω2 = 0.12, (see Fig. 15). Planned comparisons show usability scores in ART2 were significantly lower than those in either ART1, t(57) = –2.98, p = 0.004, rc = 0.37, or ART3, t(57) = 2.49, p = 0.049, rc = 0.31. Overall, usability scores were significantly lower when agent reasoning was present than when it was not, t(57) = –2.01, p = 0.049, rc = 0.26. While access to agent reasoning appeared to decrease perceived usability of the agent, increased access to agent reasoning appeared to improve perceived usability of the agent.

Approved for public release; distribution is unlimited. 35
Fig. 15 Average usability scores by ART level; bars denote SE
3.4.2 Workload
Hypothesis 4: Access to agent reasoning will increase operator workload, ART1 < ART2; and, increased transparency of agent reasoning will increase operator workload, ART2 < ART3. When agent reasoning is not available, workload will be lower than when agent reasoning is present, ART1 < ART2+3.
SOT scores were found to be significant predictors of global NASA-TLX scores, R2 = 0.10, b = 0.57, t(58) = 2.52, p = 0.015. Participants who scored higher on the SOT, indicating a lesser ability to orient and navigate in their environment, also scored higher on the global NASA-TLX than their counterparts.
Planned contrasts revealed there was no overall difference in participant workload when agent reasoning was available compared to the no-reasoning condition (see Fig. 16). Participants in ART1 reported lower workload than those in ART2 and workload was higher in ART2 than in ART3. Although workload scores decreased in ART3, there was no significant difference between ARTs.
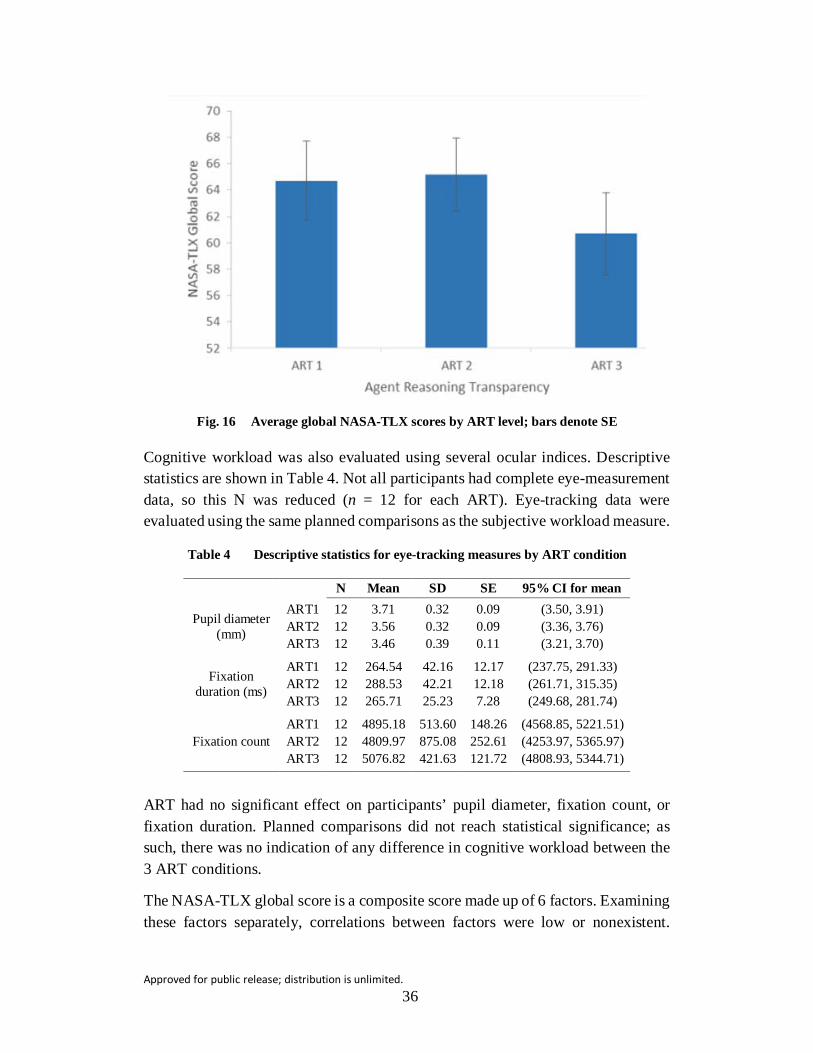
Approved for public release; distribution is unlimited. 36
Fig. 16 Average global NASA-TLX scores by ART level; bars denote SE
Cognitive workload was also evaluated using several ocular indices. Descriptive statistics are shown in Table 4. Not all participants had complete eye-measurement data, so this N was reduced (n = 12 for each ART). Eye-tracking data were evaluated using the same planned comparisons as the subjective workload measure.
Table 4 Descriptive statistics for eye-tracking measures by ART condition
N Mean SD SE 95% CI for mean
Pupil diameter (mm)
ART1 12 3.71 0.32 0.09 (3.50, 3.91) ART2 12 3.56 0.32 0.09 (3.36, 3.76) ART3 12 3.46 0.39 0.11 (3.21, 3.70)
Fixation duration (ms)
ART1 12 264.54 42.16 12.17 (237.75, 291.33) ART2 12 288.53 42.21 12.18 (261.71, 315.35) ART3 12 265.71 25.23 7.28 (249.68, 281.74)
Fixation count ART1 12 4895.18 513.60 148.26 (4568.85, 5221.51) ART2 12 4809.97 875.08 252.61 (4253.97, 5365.97) ART3 12 5076.82 421.63 121.72 (4808.93, 5344.71)
ART had no significant effect on participants’ pupil diameter, fixation count, or fixation duration. Planned comparisons did not reach statistical significance; as such, there was no indication of any difference in cognitive workload between the 3 ART conditions.
The NASA-TLX global score is a composite score made up of 6 factors. Examining these factors separately, correlations between factors were low or nonexistent.
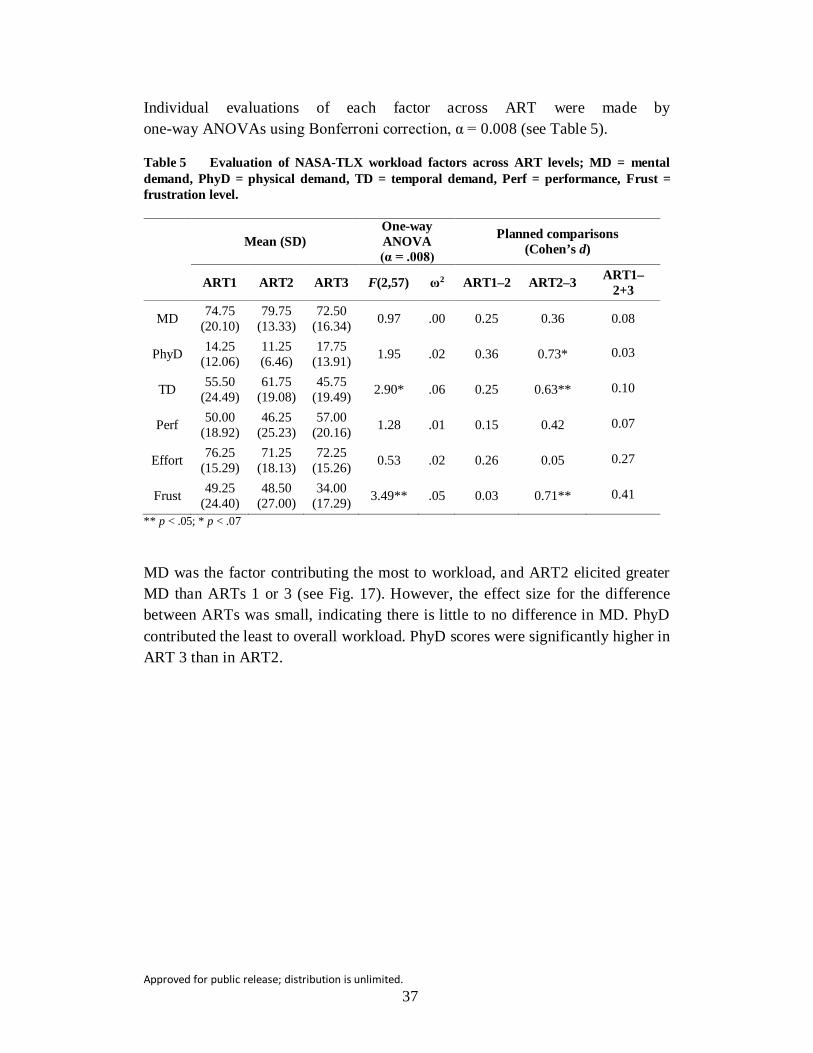
Approved for public release; distribution is unlimited. 37
Individual evaluations of each factor across ART were made by one-way ANOVAs using Bonferroni correction, α = 0.008 (see Table 5).
Table 5 Evaluation of NASA-TLX workload factors across ART levels; MD = mental demand, PhyD = physical demand, TD = temporal demand, Perf = performance, Frust = frustration level.
Mean (SD) One-way ANOVA (α = .008)
Planned comparisons (Cohen’s d)
ART1 ART2 ART3 F(2,57) ω2 ART1–2 ART2–3 ART1–2+3
MD 74.75 (20.10)
79.75 (13.33)
72.50 (16.34) 0.97 .00 0.25 0.36 0.08
PhyD 14.25 (12.06)
11.25 (6.46)
17.75 (13.91) 1.95 .02 0.36 0.73* 0.03
TD 55.50 (24.49)
61.75 (19.08)
45.75 (19.49) 2.90* .06 0.25 0.63** 0.10
Perf 50.00 (18.92)
46.25 (25.23)
57.00 (20.16) 1.28 .01 0.15 0.42 0.07
Effort 76.25 (15.29)
71.25 (18.13)
72.25 (15.26) 0.53 .02 0.26 0.05 0.27
Frust 49.25 (24.40)
48.50 (27.00)
34.00 (17.29) 3.49** .05 0.03 0.71** 0.41
** p < .05; * p < .07
MD was the factor contributing the most to workload, and ART2 elicited greater MD than ARTs 1 or 3 (see Fig. 17). However, the effect size for the difference between ARTs was small, indicating there is little to no difference in MD. PhyD contributed the least to overall workload. PhyD scores were significantly higher in ART 3 than in ART2.
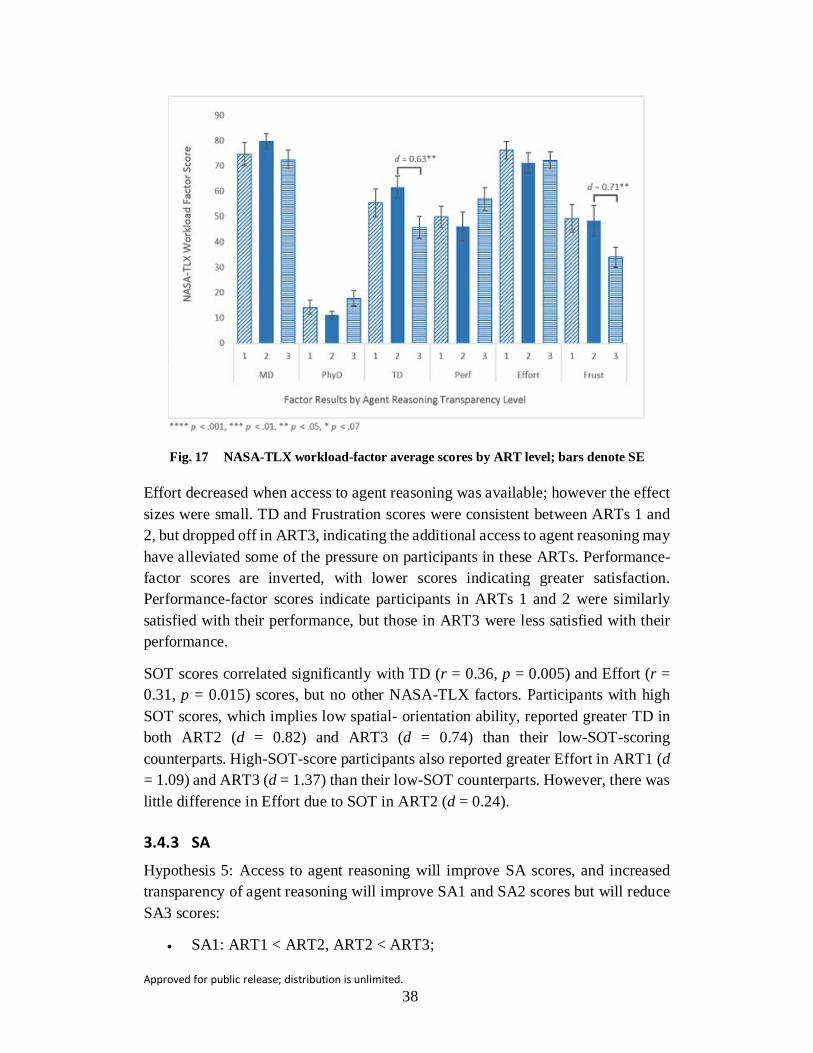
Approved for public release; distribution is unlimited. 38
Fig. 17 NASA-TLX workload-factor average scores by ART level; bars denote SE
Effort decreased when access to agent reasoning was available; however the effect sizes were small. TD and Frustration scores were consistent between ARTs 1 and 2, but dropped off in ART3, indicating the additional access to agent reasoning may have alleviated some of the pressure on participants in these ARTs. Performance-factor scores are inverted, with lower scores indicating greater satisfaction. Performance-factor scores indicate participants in ARTs 1 and 2 were similarly satisfied with their performance, but those in ART3 were less satisfied with their performance.
SOT scores correlated significantly with TD (r = 0.36, p = 0.005) and Effort (r = 0.31, p = 0.015) scores, but no other NASA-TLX factors. Participants with high SOT scores, which implies low spatial- orientation ability, reported greater TD in both ART2 (d = 0.82) and ART3 (d = 0.74) than their low-SOT-scoring counterparts. High-SOT-score participants also reported greater Effort in ART1 (d = 1.09) and ART3 (d = 1.37) than their low-SOT counterparts. However, there was little difference in Effort due to SOT in ART2 (d = 0.24).
3.4.3 SA
Hypothesis 5: Access to agent reasoning will improve SA scores, and increased transparency of agent reasoning will improve SA1 and SA2 scores but will reduce SA3 scores:
• SA1: ART1 < ART2, ART2 < ART3;
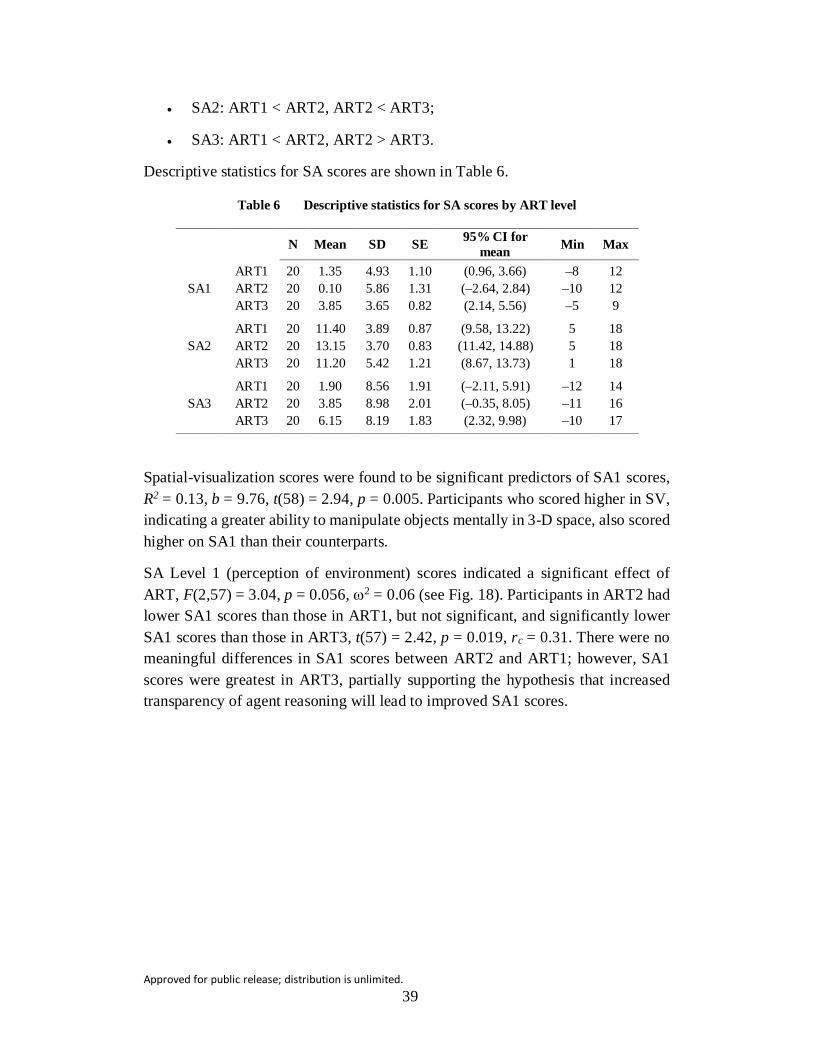
Approved for public release; distribution is unlimited. 39
• SA2: ART1 < ART2, ART2 < ART3;
• SA3: ART1 < ART2, ART2 > ART3.
Descriptive statistics for SA scores are shown in Table 6.
Table 6 Descriptive statistics for SA scores by ART level
N Mean SD SE 95% CI for mean Min Max
SA1 ART1 20 1.35 4.93 1.10 (0.96, 3.66) –8 12 ART2 20 0.10 5.86 1.31 (–2.64, 2.84) –10 12 ART3 20 3.85 3.65 0.82 (2.14, 5.56) –5 9
SA2 ART1 20 11.40 3.89 0.87 (9.58, 13.22) 5 18 ART2 20 13.15 3.70 0.83 (11.42, 14.88) 5 18 ART3 20 11.20 5.42 1.21 (8.67, 13.73) 1 18
SA3 ART1 20 1.90 8.56 1.91 (–2.11, 5.91) –12 14 ART2 20 3.85 8.98 2.01 (–0.35, 8.05) –11 16 ART3 20 6.15 8.19 1.83 (2.32, 9.98) –10 17
Spatial-visualization scores were found to be significant predictors of SA1 scores, R2 = 0.13, b = 9.76, t(58) = 2.94, p = 0.005. Participants who scored higher in SV, indicating a greater ability to manipulate objects mentally in 3-D space, also scored higher on SA1 than their counterparts.
SA Level 1 (perception of environment) scores indicated a significant effect of ART, F(2,57) = 3.04, p = 0.056, ω2 = 0.06 (see Fig. 18). Participants in ART2 had lower SA1 scores than those in ART1, but not significant, and significantly lower SA1 scores than those in ART3, t(57) = 2.42, p = 0.019, rc = 0.31. There were no meaningful differences in SA1 scores between ART2 and ART1; however, SA1 scores were greatest in ART3, partially supporting the hypothesis that increased transparency of agent reasoning will lead to improved SA1 scores.

Approved for public release; distribution is unlimited. 40
Fig. 18 Average SA1 scores by ART level; bars denote SE
SV scores were found to be significant predictors of SA2 scores, R2 = 0.11, b = 7.71, t(58) = 2.62, p = 0.011. Participants who scored higher in SV, indicating a greater ability to manipulate objects mentally in 3-D space, also scored higher on SA2 than their counterparts.
SA2 (comprehension) scores indicated no significant effect of ART. SA2 scores were evaluated regardless of route selection and along the ground-truth route and no significant difference in results was found. The hypothesis was not supported, in that access to agent reasoning appeared to have no effect on SA2 scores.
SA3 (projection) scores indicated a marginally significant difference between ARTs, F(2,36.7) = 2.92, p = 0.067, ω2 = 0.04 (see Fig. 19). There was also a significant linear trend, F(1,36.7) = 4.35, p = 0.041, ω2 = 0.05, indicating SA3 scores increased as ART increased. SA3 was evaluated regardless of route selection and along the ground-truth route only, and no significant difference in results was found. The hypotheses were not supported. Although SA3 scores in ART2 were greater than those in ART1, as predicted, this difference did not reach significance. SA3 scores in ART3 were predicted to be lower than those in ART2; instead, they increased as access to agent reasoning increased. While the difference between groups did not reach significance, the significant linear trend indicates increased access to agent reasoning does help participants project future status.

Approved for public release; distribution is unlimited. 41
Fig. 19 Average SA3 score by ART level; bars denote SE
3.4.4 Target-Detection Task Performance
Hypothesis 6: Access to agent reasoning will reduce the number of targets detected and the number of FAs, ART1 > ART2, and increased transparency of agent reasoning will again result in fewer targets detected and fewer FAs, ART2 > ART3.
Descriptive statistics for Target Detection measures are shown in Table 7.
Table 7 Descriptive statistics for target detection task measures by ART level; dʹ = sensitivity, β = selection bias
N Mean SD SE 95% CI for mean Min Max
Targets detected (count)
ART1 20 44.45 10.10 2.26 (39.72, 49.18) 30 69 ART2 20 45.05 13.64 3.05 (38.66, 51.44) 11 65 ART3 20 44.75 10.19 2.28 (39.98, 49.52) 29 65
FAs (count)
ART1 20 20.80 6.25 1.40 (17.87, 23.73) 10 33 ART2 20 16.35 5.29 1.18 (13.87, 18.83) 7 27 ART3 20 17.30 7.53 1.68 (13.78, 20.82) 8 32
dʹ ART1 20 2.20 0.32 0.07 (2.05, 2.35) 1.73 2.94 ART2 20 2.31 0.44 0.10 (2.11, 2.52) 1.40 3.19 ART3 20 2.29 0.38 0.09 (2.11, 2.46) 1.57 2.94
β ART1 20 2.42 0.28 0.06 (2.29, 2.56) 2.00 3.06 ART2 20 2.60 0.33 0.07 (2.45, 2.76) 1.90 3.21 ART3 20 2.60 0.37 0.08 (2.43, 2.78) 1.91 3.23
SV scores were found to be significant predictors of total number of Targets Detected, R2 = 0.07, b = 15.71, t(58) = 2.06, p = 0.044. Participants who scored

Approved for public release; distribution is unlimited. 42
higher in SV, indicating a greater ability to mentally manipulate objects in 3-D space, also detected more targets in their environment than their counterparts.
There was no significant effect of ART on the number of targets detected. The number of targets detected was slightly greater in ART2 than in ART1 or ART3; however, these differences were not significant.
SV scores (r = –0.39, p = 0.001) and WMC scores (r = –0.31, p = 0.009) correlated significantly with the total number of FAs reported. SV scores were found to be significant predictors of FAs, R2 = 0.15, b = –14.55, t(57) = –2.80, p = 0.007, while WMC scores were shown to be marginal predictors of number of FAs reported, R2 = 0.05, b = –0.16, t(57) = M –1.87, p = 0.067. Participants who scored higher in SV, as well as those who scored higher on WMC measures, reported fewer FAs than their counterparts.
The number of FAs was lower in ART2 than in ART1, t(57) = –2.19, p = 0.033, rc = 0.28; however, there was little to no difference in number of reported FAs between ARTs 2 and 3 (see Fig. 20). Thus, the hypothesis was partially supported, as the addition of agent reasoning transparency did result in fewer FAs; however, the increased transparency did not further reduce FAs.
Fig. 20 Average number of FAs by ART level; bars denote SE
Results of the target-detection task were also evaluated using SDT to determine if there were differences in d’ or β between the 3 ARTs. There was no significant effect of ART on d’ (see Fig. 21). Participants were slightly more sensitive to targets in ART2 than in ART1 or ART3; however, these differences did not achieve statistical significance.

Approved for public release; distribution is unlimited. 43
Evaluating β across ART, there was no significant effect of ART on β scores (see Fig. 21). Beta scores were slightly lower in ART1 than in ART2, t(57) = 1.71, p = 0.094, rc = 0.22, and there was no difference in β between ART2 and ART3. This could indicate the presence of agent reasoning allowed the participants to use a stricter selection criterion than in the no-reasoning condition, but increasing the amount of agent reasoning did not have any further effect on participants’ selection criteria. The slightly more-lenient selection criteria in ART1 could be why there were more FAs reported in ART1 than in either ARTs 2 or 3.
Fig. 21 Average beta (β) scores by ART level; bars denote SE
3.4.5 Individual Differences Evaluations
3.4.5.1 Complacency Potential
CP was evaluated via the CPRS scores. The effect of CP on several measures of interest across ART level was evaluated via 2-way between-groups ANOVAs, α = .05. Post hoc t-tests within each ART compared performance differences between high/low group memberships. Descriptive statistics for CP, as measured using the CPRS, are shown in Tables 8 and 9.
Table 8 Descriptive statistics for CPRS scores by ART level
Mdn split count Group N Min Max Mdn Mean SD Hi Lo Overall 60 28 49 39.50 39.90 4.90 30 30 ART1 20 28 46 38.00 38.50 4.90 8 12 ART2 20 29 48 41.50 40.90 5.00 10 10 ART3 20 33 49 41.00 40.30 4.60 12 8

Approved for public release; distribution is unlimited. 44
Table 9 Descriptive statistics for high/low CPRS scores by ART level
N Mean SD SE 95% CI for mean
ART1 Low CPRS 12 35.33 3.11 0.90 (33.35, 37.31) High CPRS 8 43.25 2.55 0.90 (41.12, 45.38)
ART2 Low CPRS 10 36.80 3.50 1.11 (34.20, 38.20) High CPRS 10 45.10 1.37 0.43 (44.12, 46.08)
ART3 Low CPRS 8 35.50 1.77 0.63 (34.02, 36.98) High CPRS 12 43.50 2.68 0.77 (41.80, 45.20)
Hypothesis 7: High-CPRS individuals will have fewer correct rejections on the route-selection task than low-CPRS individuals.
A 2-way, between-groups ANOVA revealed no significant interaction between CPRS and ART on the number of correct rejections in the route-planning task nor any significant main effect of CPRS on the number of correct rejections in the route-planning task.
Hypothesis 8: High-CPRS individuals will have higher scores on the Usability and Trust Survey than low-CPRS individuals.
A 2-way, between-groups ANOVA revealed no significant interaction between CPRS and ART on Usability and Trust Survey scores nor any significant main effect of CPRS on usability scores.
Hypothesis 9: High-CPRS individuals will have lower SA scores than low-CPRS individuals.
A 2-way, between-groups ANOVA revealed no significant interaction between CPRS and ART on SA scores nor any significant main effect of CPRS on SA scores.
3.4.5.2 Spatial Ability (SOT and SV) and Perceived Attentional Control
Hypothesis 10: Individual differences, such as SpA and PAC, will have differential effects on the participant’s performance on the route-selection task and their ability to maintain SA.
The effects of ID factors and ART level on route-selection performance were evaluated via 2-way, between-groups ANOVAs, α = 0.05. When Levene’s Test of Equality of Error Variance was significant, the evaluation was repeated at α = 0.01. Post hoc t-tests within each ART compared performance differences between high- and low-group memberships for each ID factor. Descriptive statistics for SOT, SV, and PAC are shown in Tables 10 and 11.
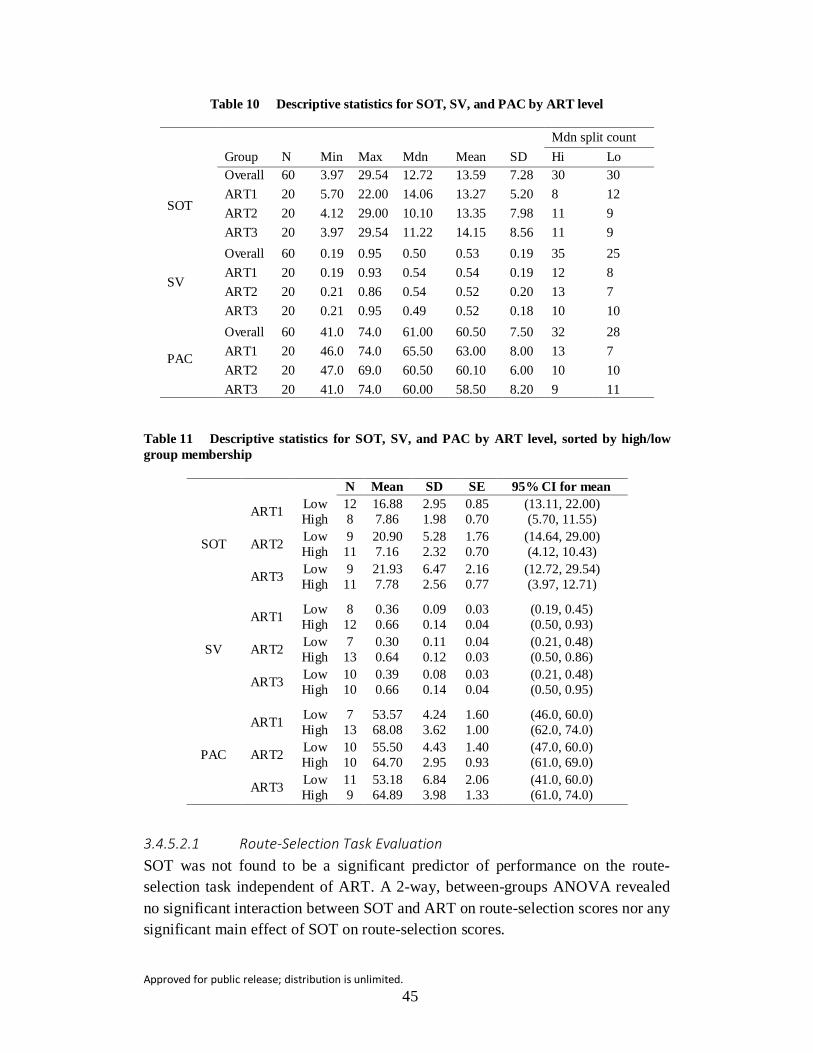
Approved for public release; distribution is unlimited. 45
Table 10 Descriptive statistics for SOT, SV, and PAC by ART level
Mdn split count Group N Min Max Mdn Mean SD Hi Lo
SOT
Overall 60 3.97 29.54 12.72 13.59 7.28 30 30 ART1 20 5.70 22.00 14.06 13.27 5.20 8 12 ART2 20 4.12 29.00 10.10 13.35 7.98 11 9 ART3 20 3.97 29.54 11.22 14.15 8.56 11 9
SV
Overall 60 0.19 0.95 0.50 0.53 0.19 35 25 ART1 20 0.19 0.93 0.54 0.54 0.19 12 8 ART2 20 0.21 0.86 0.54 0.52 0.20 13 7 ART3 20 0.21 0.95 0.49 0.52 0.18 10 10
PAC
Overall 60 41.0 74.0 61.00 60.50 7.50 32 28 ART1 20 46.0 74.0 65.50 63.00 8.00 13 7 ART2 20 47.0 69.0 60.50 60.10 6.00 10 10 ART3 20 41.0 74.0 60.00 58.50 8.20 9 11
Table 11 Descriptive statistics for SOT, SV, and PAC by ART level, sorted by high/low group membership
N Mean SD SE 95% CI for mean
SOT
ART1 Low 12 16.88 2.95 0.85 (13.11, 22.00) High 8 7.86 1.98 0.70 (5.70, 11.55)
ART2 Low 9 20.90 5.28 1.76 (14.64, 29.00) High 11 7.16 2.32 0.70 (4.12, 10.43)
ART3 Low 9 21.93 6.47 2.16 (12.72, 29.54) High 11 7.78 2.56 0.77 (3.97, 12.71)
SV
ART1 Low 8 0.36 0.09 0.03 (0.19, 0.45) High 12 0.66 0.14 0.04 (0.50, 0.93)
ART2 Low 7 0.30 0.11 0.04 (0.21, 0.48) High 13 0.64 0.12 0.03 (0.50, 0.86)
ART3 Low 10 0.39 0.08 0.03 (0.21, 0.48) High 10 0.66 0.14 0.04 (0.50, 0.95)
PAC
ART1 Low 7 53.57 4.24 1.60 (46.0, 60.0) High 13 68.08 3.62 1.00 (62.0, 74.0)
ART2 Low 10 55.50 4.43 1.40 (47.0, 60.0) High 10 64.70 2.95 0.93 (61.0, 69.0)
ART3 Low 11 53.18 6.84 2.06 (41.0, 60.0) High 9 64.89 3.98 1.33 (61.0, 74.0)
3.4.5.2.1 Route-Selection Task Evaluation SOT was not found to be a significant predictor of performance on the route-selection task independent of ART. A 2-way, between-groups ANOVA revealed no significant interaction between SOT and ART on route-selection scores nor any significant main effect of SOT on route-selection scores.

Approved for public release; distribution is unlimited. 46
SV was found to be a significant predictor of performance on the route-selection task independent of ART level, R2 = 0.10, β = 0.31, t(58) = 2.52, p = 0.015. A 2-way, between-groups ANOVA, α = 0.01, revealed no significant interaction between SV and ART on route-selection scores; however, there was a significant main effect of SV on route-selection scores, F(1,54) = 4.31, p = 0.043, ηp2 = 0.07 (see Fig. 22). Post hoc comparisons between high- and low-SV groups within each ART level show that high-SV and low-SV individuals had similar route-selection scores in ART1 and ART3. However, in ART2 the high-SV individuals had higher route-selection scores, t(18) = –3.08, p = 0.017, d = 1.59, indicating they benefited from the access to agent reasoning more than their low-SV counterparts.
Fig. 22 Average route-selection scores by high/low SV group membership, sorted by ART level; bars denote SE
A 2-way, between-groups ANOVA revealed no significant interaction between PAC and ART on route-selection scores nor any significant main effect of SOT on route-selection scores.
3.4.5.2.2 SA1 Evaluation A 2-way, between-groups ANOVA revealed no significant interaction between SOT and ART on SA1 scores nor any significant main effect of SOT on SA1 scores.
A 2-way, between-groups ANOVA revealed no significant interaction between SV and ART on SA1 scores; however, there was a significant main effect of SV on SA1 scores, F(1,54) = 14.62, p < .001, ηp2 = 0.21 (see Fig. 23). High-SV individuals had higher SA1 scores in all ARTs—ART1, t(18) = –1.73, p = 0.101, d = 0.81; ART2, t(18) = –2.39, p = 0.028, d = 1.09; and ART3, t(18) = –2.79, p = 0.012,
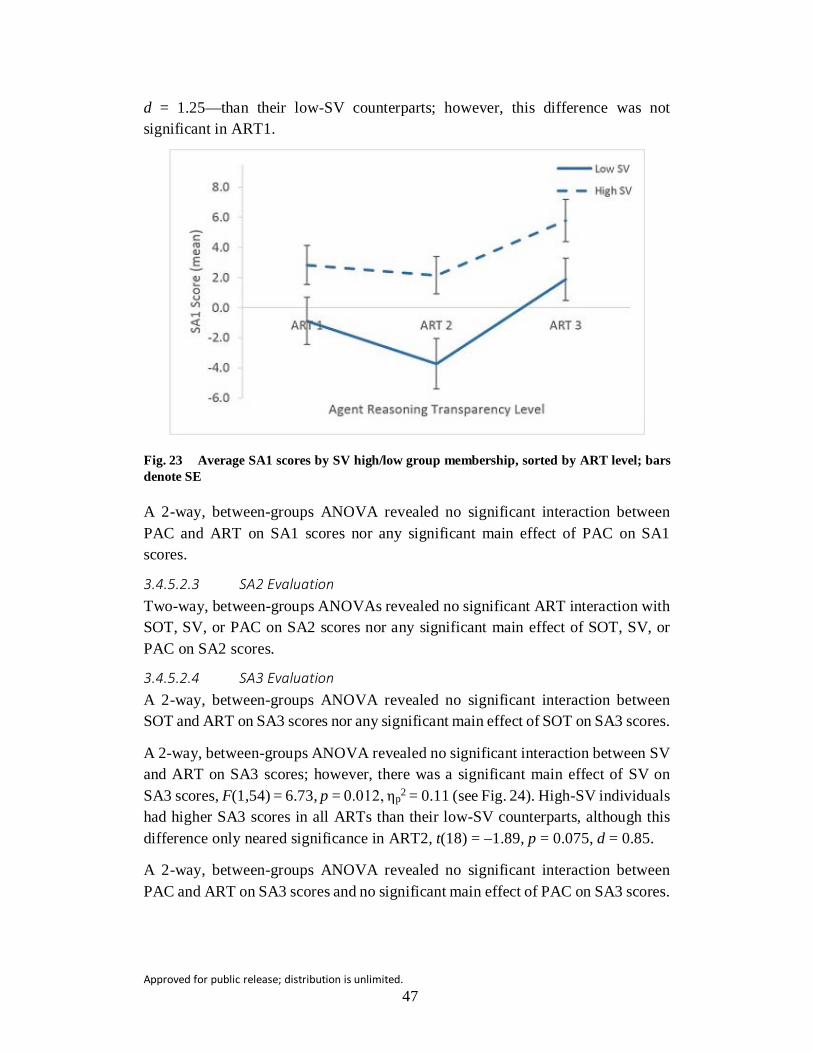
Approved for public release; distribution is unlimited. 47
d = 1.25—than their low-SV counterparts; however, this difference was not significant in ART1.
Fig. 23 Average SA1 scores by SV high/low group membership, sorted by ART level; bars denote SE
A 2-way, between-groups ANOVA revealed no significant interaction between PAC and ART on SA1 scores nor any significant main effect of PAC on SA1 scores.
3.4.5.2.3 SA2 Evaluation Two-way, between-groups ANOVAs revealed no significant ART interaction with SOT, SV, or PAC on SA2 scores nor any significant main effect of SOT, SV, or PAC on SA2 scores.
3.4.5.2.4 SA3 Evaluation A 2-way, between-groups ANOVA revealed no significant interaction between SOT and ART on SA3 scores nor any significant main effect of SOT on SA3 scores.
A 2-way, between-groups ANOVA revealed no significant interaction between SV and ART on SA3 scores; however, there was a significant main effect of SV on SA3 scores, F(1,54) = 6.73, p = 0.012, ηp2 = 0.11 (see Fig. 24). High-SV individuals had higher SA3 scores in all ARTs than their low-SV counterparts, although this difference only neared significance in ART2, t(18) = –1.89, p = 0.075, d = 0.85.
A 2-way, between-groups ANOVA revealed no significant interaction between PAC and ART on SA3 scores and no significant main effect of PAC on SA3 scores.

Approved for public release; distribution is unlimited. 48
Fig. 24 Average SA3 scores by SV high/low membership sorted by ART level; bars denote SE
3.4.5.3 WMC
Hypothesis 11: High-WMC individuals will have more correct rejections and higher SA2 and SA3 scores than low-WMC individuals.
The effects of Working Memory Capacity and ART level were evaluated via 2-way, between-groups ANOVAs, α = 0.05. Post hoc t-tests within each ART compared performance differences between high/low group memberships. Descriptive statistics for WMC, as measured using the RSPAN test, are shown in Tables 12 and 13.
Table 12 Descriptive statistics for WMC by ART level
Mdn split count Group N Min Max Mdn Mean SD Hi Lo
WMC
Overall 60 5.0 51.0 32.50 31.30 11.10 30 30 ART1 20 8.0 51.0 30.50 30.90 10.98 9 11 ART2 20 8.0 49.0 36.00 33.85 9.95 13 7 ART3 20 5.0 51.0 28.50 29.15 12.39 8 12
Table 13 Descriptive statistics for WMC by ART level, sorted by high/low group membership
N Mean SD SE 95% CI for mean
WMC
ART1 Low 11 22.64 6.36 1.92 (18.36, 26.91) High 9 41.00 5.22 1.74 (36.99, 45.01)
ART2 Low 7 23.29 7.85 2.97 (16.03, 30.54) High 13 39.54 5.09 1.41 (36.46, 42.62)
ART3 Low 12 20.92 7.59 2.19 (16.10, 25.74) High 8 41.50 5.98 2.11 (36.50, 46.50)

Approved for public release; distribution is unlimited. 49
3.4.5.3.1 Correct Rejections A 2-way, between-groups ANOVA revealed no significant interaction between WMC and ART on correct-rejection scores nor any significant main effect of WMC on correct-rejection scores.
3.4.5.3.2 SA scores A 2-way, between-groups ANOVA revealed no significant interaction between WMC and ART on SA scores nor any significant main effect of WMC on SA scores.
3.5 Discussion
Our primary goal was to examine how the transparency of an intelligent agent’s reasoning in a low-information environment affected complacent behavior in a route-selection task. Participants supervised a 3-vehicle convoy as it traversed a simulated environment and rerouted the convoy when needed with the assistance of an intelligent agent, RL. Information regarding potential events along the preplanned route, together with communications from a commander confirming either the presence or absence of activity in the area, were provided to all participants. They did not receive any information about the suggested alternate route. However, they were instructed that the proposed path was at least as safe as their original route. When the convoy approached a potentially unsafe area, the intelligent agent would recommend rerouting the convoy. The agent recommendations were correct 66% of the time. The participant was required to recognize and correctly reject any incorrect suggestions. The secondary goal of this study was to examine how differing levels of agent transparency affected main-task and secondary-task performance, response time, workload, SA, trust, and system usability along with implications of ID factors such as spatial ability, WMC, PAC, and CP.
Each participant was assigned to a specific level of ART. The reasoning was provided as to why the agent was making the recommendation and this differed among these levels. ART1 provided no reasoning information; RL notified that a change was recommended without explanation. The type of information the agent supplied varied slightly between ARTs 2 and 3. In ART2 the agent reasoning was a simple statement of fact (e.g., Recommend revise convoy route due to Potential IED [improvised explosive device]). In ART3 an additional piece of information was added that conveyed how long ago the agent had received the information (time of report: TOR) leading to its recommendation (e.g., Recommend revise convoy route due to Potential IED, TOR: 1 [h]). This additional information did not convey any confidence level or uncertainty, but was designed to encourage the operator to actively evaluate the quality of the information rather than simply respond.

Approved for public release; distribution is unlimited. 50
Therefore, not only was access to agent reasoning examined, but the impact of the type of information the agent supplied was examined as well.
Complacent behavior was examined via primary (route-selection) task response in the form of automation bias. Automation bias was quantified as incorrect acceptances of the agent recommendation, an objective measure of errors of commission (Parasuraman et al. 2000). As predicted, access to agent reasoning reduced these incorrect accepts, and increased access to agent reasoning increased incorrect accepts. Complacent behavior was greatest when no agent reasoning was available. When the amount of agent reasoning was increased to its highest level, complacent behavior increased to nearly the same level as in the no-reasoning condition. This pattern of results indicated that while access to agent reasoning in a decision-supporting agent can counter automation bias, too much information resulted in an OOTL situation and increased complacent behavior. Similar to previous findings (Mercado et. al. 2015) access to agent reasoning did not increase response time. In fact, decision times were reduced in the agent reasoning conditions, even though the agent messages in the reasoning conditions were slightly longer than in the no-reasoning condition and required slightly more time to process. Similar studies have suggested that a reduction in accuracy with consistent response times could be attributed to a speed–accuracy trade-off (Wickens et al. 2015). However, the present findings indicated that may not be the case. Initially, there was an increase in accuracy with no accompanying increase in response time (hence, no trade-off). What appears to be more likely is that not only does the access to agent reasoning assist the operator in determining the correct course of action, but the type of information the operator receives also influences their behavior.
In all conditions, the participant received all information needed to correctly route the convoy without the agent’s suggestion. In the no-reasoning condition, the participants were less likely to override the agent suggestion, demonstrating a clear bias for the agent suggestion. With a moderate amount of information regarding the agent reasoning, the participants were more confident in overriding erroneous suggestions. In the highest reasoning condition, participants were also given information regarding when the agent had received the information; while this information did not imply any confidence or uncertainty rating, such additional information appeared to create ambiguity for the participant. This encouraged them to defer to the agent’s suggestion.
Performance on the route-selection task was evaluated via correct rejections and acceptances of the agent suggestion. An increased number of correct acceptances and rejections, as well as reduced response times, were all indicative of improved performance. Route-selection performance was anticipated as improving with
Approved for public release; distribution is unlimited. 51
access to agent reasoning and then declining as access to agent reasoning increased. This hypothesis was partially supported. Performance did improve when access to agent reasoning was provided. Increased transparency of agent reasoning did result in a subsequent decline in scores; however, the small–medium-effect size indicated these results are not strong evidence in support of the latter demand of the hypothesis. SV was predictive of performance on the route-selection task. Individuals with high SV scores outperformed their low-SV counterparts on the route-selection task in ART2. This demonstrated their advantage in the agent reasoning information supplied in this condition. However, this advantage was lost when additional reasoning in ART3 was supplied.
Workload was evaluated using the NASA-TLX and several ocular indices shown to be informative as to cognitive workload, and was hypothesized to increase as agent reasoning transparency increased. Global NASA-TLX scores and pupil diameter decreased slightly, but not significantly, as ART increased, indicating overall cognitive workload decreased as ART increased. This contradicts our stated hypothesis. Similar to Mercado et al. (2015), access to agent reasoning did not increase overall workload, as assessed via global NASA-TLX scores. However, Fixation Count and Fixation Duration did not cohere with the PDia results. FC did not differ significantly between the 3 ARTs. FD was slightly longer in ART2 than in ARTs 1 or 3. Reviewing the NASA-TLX-factor scores yields interesting insights. Participants reported higher satisfaction to queries about their performance (i.e., “How successful do you think you were in accomplishing the goals of the task set by the experimenter? How satisfied were you with your performance in accomplishing these goals?”) in ART2. Considered alongside the FD findings, this may be indicative of their level of engagement in that condition. The ratings for NASA-TLX effort (i.e., “How hard did you have to work to accomplish your level of performance?”) increased as ART increased. This does support our original hypothesis. The ratings for factor Temporal Demand (i.e., “How much time pressure did you feel due to the rate or pace at which the task or tasks elements occurred? Was the pace slow and leisurely or rapid and frantic?”) were greater in ARTs 1 and 2 than in ART3. However, when also considering the low FD in ART3, the reduced TD rating for ART3 may be an indication of increased OOTL. This observation tends to support the findings of increased complacency in this ART. These findings also indicate that although complacent behavior was greatest in ARTs 1 and 3, the reasons behind such complacent behavior are different. While the automation bias in ART1 may be due to high workload, the automation bias in ART3 may be due to more complex reasons than simply higher workload.
SA scores were hypothesized to improve with access to agent reasoning—with the exception of SA3 scores in ART3. In this study, SA1 scores evaluated how well the

Approved for public release; distribution is unlimited. 52
participant maintained a general awareness of their environment, with the idea that increased access to agent reasoning would also give the participant context for events within their environment, thus making certain events and situations more salient. Those who were more successful at this integration would then show improved performance on the route-selection task as well as improved SA2 scores (Hancock and Diaz 2002). SA1 scores did not improve with access to agent reasoning. However, with increased ART, SA1 scores improved substantially. This could indicate that additional access to reasoning made the route-selection task easier, which allowed participants more time to monitor their environment. However, since there was also a reduction in performance on the route-selection task, as well as demonstrated automation bias in ART3, it is more likely the improvement in SA1 scores was a result of neglecting duties in other tasks (i.e., an intertask trade-off). There was no significant difference in SA2 (comprehension) scores between ARTs; however, SA3 scores did show a significant upward trend across ARTs. This suggests that, while access to agent reasoning does not improve comprehension, it could incrementally improve an operator’s ability to predict future outcomes. In previous studies, increased autonomous assistance did result in improved SA (Wright et al. 2013). However, the present findings indicate access to agent reasoning does little to improve SA. There were differences in SA scores dependent upon the ID factor for SV. High-SV individuals had higher SA1 and SA3 scores than their low-SV counterparts. This was most likely due to their increased ability to scan their environment (Lathan and Tracey 2002; Chen et al. 2008, 2010).
Access to agent reasoning appeared to have little influence on performance in the target-detection task. There were no significant differences in the mean number of targets correctly detected across ART. However, access to agent reasoning did mitigate the number of participant FAs reported. Signal Detection Theory (SDT) measured whether access to agent reasoning had any effect on sensitivity or selection criteria. Sensitivity to targets, assessed as d’, appeared to be slightly lower in the no-reasoning condition. Selection criteria were also lower in the no-reasoning condition. Thus, participants appeared to use a higher selection criterion when targets were more readily identifiable, and subsequently loosened their selection bias when target sensitivity was lower. This pattern of behavior could explain the greater number of false alarms reported in the no-reasoning condition. The presence of agent reasoning appears to have positively affected performance on the secondary target-detection task. While the overall number of targets detected did not differ among conditions, the sensitivity to target and selection criterion appeared to have been higher in the agent reasoning conditions, resulting in fewer reported FAs.

Approved for public release; distribution is unlimited. 53
Operator trust in the agent was assessed objectively by evaluating incorrect rejections of the agent’s suggestions (a potential indicator of distrust), and subjectively using the Usability and Trust Survey. The objective measure of operator trust indicated no difference in trust due to ART. However, subjective measures indicated access to agent reasoning reduced trust and usability evaluations. Increased transparency of agent reasoning resulted in increased trust and usability ratings; however, there was no associated improvement in performance. Interestingly, operators reported highest trust and usability in the conditions that also had the highest complacency and lowest in the condition that had the highest performance. In the conditions when the agent reasoning was not transparent, and when the agent reasoning was highly transparent, the participant’s trust and usability evaluations were highest (albeit for potentially different reasons) even though they knew the agent was not completely reliable. However, in the condition with a moderate amount of ART, the participants reported lower trust and usability, indicating they were more critical of the agent recommendations in this condition, resulting in reduced complacency and improved performance.
3.6 Conclusion
The findings of the present study are important for the design of intelligent recommender and decision-aid systems. Keeping the operator engaged and in the loop is important for reducing complacency, which could allow lapses in system reliability to go unnoticed. To that end, we examined how agent transparency affected complacent behavior as well as task performance and trust. Access to agent reasoning was found to be an effective deterrent to complacent behavior when the operator has limited information about their task environment. Contrary to the position adopted by Paradis et al. (2005), operators do accept agent recommendations even when they do not know the rationale behind the suggestions. While the absence of agent reasoning appears to encourage automation bias, access to the agent’s reasoning appears to allow the operator to calibrate their trust in the system, reducing automation bias and improving performance. This outcome is similar to findings previously reported by Helldin et al. (2014) and Mercado et al. (2015). However, the additional reasoning information created ambiguity for the operator, which encouraged complacency, resulting in reduced performance and poorer trust calibration. Prior work has shown that irrelevant or ambiguous information can increase workload and encourage complacent behavior (Westerbeek and Maes 2013; Chen and Barnes 2014), and these findings align with those. As such, caution should be exercised when considering how transparent to make agent reasoning and what information should be included.

Approved for public release; distribution is unlimited. 54
This work represents the first of 2 studies exploring the effect of agent transparency on complacent behavior. In the follow-up study, the amount of information the operator has regarding the task environment will be increased. As a result of this increase, the amount of agent reasoning provided will also be increased to incorporate additional information into agent recommendations. This will allow us to compare differences in operator complacency and performance due to further operator knowledge of their task environment as well as that which results from greater access to agent reasoning.
4. Experiment 2
4.1 Overview
Experiment 2 investigated how access to the agent’s reasoning affected the human operator’s decision-making, task performance, SA, and complacent behavior in a multitasking environment when additional, sometimes competing, environmental information is available. It differed from Experiment 1 in 2 ways: first, the level of environmental information was increased, and second, the degree of ART, when available, was increased. Environmental information was displayed by icons appearing on the map, with events affecting both the original route and the proposed alternative displayed (see Fig. 25). ART was manipulated via RoboLeader’s detailed notifications, which were expanded from Experiment 1 (EXP1) to include each of the icons affecting the area, along with weighing information as to how each event was factored into RL’s recommendation.
Fig. 25 Icons indicating a potential event on the convoy’s main route (solid line) and potential events on the proposed alternative route (dashed lines)

Approved for public release; distribution is unlimited. 55
4.2 Stated Hypothesis
4.2.1 Complacent Behavior, Primary Task Performance, Trust in the Agent
We hypothesized that 1) access to agent reasoning would reduce complacent behavior, improve task performance, and increase trust in the agent, but 2) increased access to agent reasoning would increase complacent behavior, negatively impact performance, and reduce trust in the agent. Although decision time decreased with the access to agent reasoning in EXP1, the increase in agent transparency in this study was expected to increase DT (aside from clearly complacent behavior): ART1 < ART2 < ART3. Unlike EXP1, RL’s messages were considerably longer in ARTs 2 and 3 than in ART1; as such, additional time was expected to be required for reading the messages. Participants were expected to take longer to process the information and reach their decision, resulting in a longer DT. Shorter response times may indicate less deliberation on the part of the operator before accepting or rejecting the agent recommendation. This could mean either positive complacent behavior or reduced task difficulty.
Hypothesis 1: Access to agent reasoning will reduce incorrect acceptances, ART1 > ART2, and increased transparency of agent reasoning will increase incorrect acceptances, ART2 < ART3. When agent reasoning is not available, incorrect acceptances will be greater than when agent reasoning is present, ART1 > ART2+3.
Hypothesis 2: Access to agent reasoning will improve performance (number of correct rejects and accepts) on the route-selection task, ART1 < ART2, and increased transparency of agent reasoning will reduce performance on the route-selection task, ART2 > ART3. When agent reasoning is not available, performance will be lower than when agent reasoning is present, ART1 < ART2+3.
Hypothesis 3: Access to agent reasoning will increase operator trust in the agent, ART1 < ART2, and increased transparency of agent reasoning will decrease operator trust in the agent, ART2 > ART3.
4.2.2 Workload
We hypothesize that increasing ART will, in turn, increase the operators’ workload. In EXP1, increased access to agent reasoning reduced operator perceived workload. However, in this study, as the agent reasoning becomes more transparent the amount of information the operator must process has increased considerably from that presented in EXP1. It is expected that this increased mental demand will be reflected in the workload measures.

Approved for public release; distribution is unlimited. 56
Hypothesis 4: Access to agent reasoning will increase operator workload, ART1 < ART2, and increased transparency of agent reasoning will increase operator workload, ART2 < ART3. When agent reasoning is not available, workload will be lower than when agent reasoning is present, ART1 < ART2+3.
4.2.3 SA
We hypothesize that ART will support the operators’ SA. Access to the agent reasoning will help the operator better comprehend how objects/events in the task environment affect their mission, thus informing their task of monitoring the environment surrounding the convoy and making them cognizant of potential risks. This understanding will also enable them to make more accurate projections regarding the future safety of their convoy. However, the addition of information that appears ambiguous to the operator will have a detrimental effect on both their ability continuously monitor their environment as well as their ability to correctly project future status.
Hypothesis 5: Access to agent reasoning will improve SA scores, and increased transparency of agent reasoning will improve SA2 scores but will reduce SA1 and SA3 scores:
• SA1: ART1 < ART2, ART2 > ART3;
• SA2: ART1 < ART2, ART2 < ART3;
• SA3: ART1 < ART2, ART2 > ART3.
4.2.4 Target-Detection Task Performance
We hypothesize that increasing ART will reduce performance in the target-detection task. The increased mental demand on the operator will affect their ability to effectively monitor the environment for threats. The increased amount of environmental information will also affect the operators’ selection bias, resulting in increased false alarms.
Hypothesis 6: Access to agent reasoning will reduce performance in the target-detection task (fewer targets detected, higher FAs), ART1 > ART2, and increased transparency of agent reasoning will further reduce performance on the target-detection task, ART2 > ART3.
4.2.5 Individual Differences
The effects of ID in complacency potential, perceived attentional control, spatial ability, and working memory capacity on the operator’s task performance, trust, and SA were also investigated. While the results of EXP1 did not always show
Approved for public release; distribution is unlimited. 57
differences due to ID factors, it is expected those results occurred because the operators did not experience as heavy of a cognitive load as expected. If that is the case, the increased amount of environmental information and agent reasoning present in Experiment 2 (EXP2) should increase the cognitive burden and differences due to ID factors will become apparent.
Hypothesis 7: High-CPRS individuals will have fewer correct rejects on the route-planning task than low-CPRS individuals.
Hypothesis 8: High-CPRS individuals will have higher scores on the Usability and Trust Survey than low-CPRS individuals.
Hypothesis 9: High-CPRS individuals will have lower SA scores than low-CPRS individuals.
Hypothesis 10: IDs, such as SpA and PAC, will have differential effects on the operator’s performance on the route-selection task and their ability to maintain SA.
Hypothesis 11: High-WMC individuals will have more correct rejects and higher SA2 and SA3 scores than low-WMC individuals.
4.3 Method
4.3.1 Participants
Seventy-three participants (ages 18–44) were recruited from the Sona Systems at UCF’s Institute for Simulation and Training and Psychology Departments. Participants received their choice of compensation: either cash payment ($15/h) or Sona Credit at the rate of 1 credit/h. Thirteen potential participants were excused or dismissed from the study: 8 were dismissed early due to equipment malfunctions, one withdrew during training claiming they did not have time to participate, 2 fell asleep during their session and were dismissed, one could not pass the training assessments and was dismissed, and one did not pass the color-vision screening test and was dismissed. Those who were determined to be ineligible or withdrew from the experiment were paid for the amount of time they participated, with a minimum of 1 h. Sixty participants (21 males, 39 females; Minage = 18 years, Maxage = 44 years, Mage = 21.0 years) successfully completed the experiment and their data were used in the analysis.
4.3.2 Apparatus
The simulator and eye tracker were the same as in EXP1.

Approved for public release; distribution is unlimited. 58
4.3.3 Surveys and Tests
All surveys, questionnaires, and tests were the same as in EXP1. Descriptive statistics pertaining to EXP2 ID measures are listed here. Since the ID measures were dichotomized into high/low groups similar to those in EXP1, these groups were also compared between experiments to ensure consistent delineation between high- and low-group scores. For each ID measure, the high and low groups were found to be distinct from one another, and this difference was consistent between EXPs 1 and 2.
4.3.3.1 Attentional Control Survey
High/low group membership was determined by median split of all participants’ scores (MinPAC = 33, MaxPAC = 75, MdnPAC = 58, MPAC = 57.6, SDPAC = 8.16; PACLOW n = 29, PACHIGH n = 31).
4.3.3.2 Spatial Ability Tests 4.3.3.2.1 Cube Comparison Test High/Low group membership was determined by median split of all participants’ scores (MinSV = 0.19, MaxSV = 0.88, MdnSV = 0.50, MSV = 0.52, SDSV = 0.14, SVLOW n = 27, SVHIGH n = 33).
4.3.3.2.2 Spatial Orientation Test High/low group membership was determined by median split of all participants’ scores (MinSOT = 3.96, MaxSOT = 50.60, MdnSOT = 11.19, MSOT = 13.79, SDSOT = 8.48, SOTLOW n = 27, SOTHIGH n = 34).
4.3.3.3 CPRS
High/low group membership was determined by median split of all participants’ scores (MinCPRS = 25, MaxCPRS = 47, MdnCPRS = 37, MCPRS = 36.8, CPRSLOW n = 28, CPRSHIGH n = 32).
4.3.3.4 RSPAN
WMC was evaluated by using the participants’ total letter-set score (sum of all perfectly recalled letter sets), with higher numbers indicating greater WMC (MinRSPAN = 10.0, MaxRSPAN = 54.0, MdnRSPAN = 31.0, MRSPAN = 31.5, SDRSPAN = 12.1). High/low group membership was determined by median split of all participants’ scores, RSPANLOW n = 29, RSPANHIGH n = 31.

Approved for public release; distribution is unlimited. 59
4.3.4 Experimental Design and Performance Measures
The study was a between-subjects experiment. Independent variables were ART level and ID factors. Dependent measures were route-selection task score, DT, target-detection task scores, workload, SA, and trust scores.
4.3.4.1 Independent Variables
ART was manipulated via RL messages (see Appendix K). In ART1, the agent recommended a course of action but otherwise offered no insight as to the reasoning behind the recommendation. In ART2, the agent recommended a course of action and gave the reason behind this recommendation. In ART3, the agent recommendation was the same as in ART2; however, the message also included information as to how long ago the information was received (e.g., 1 h, 4 h, 6 h). RL messages in ARTs 2 and 3 included details about events denoted by the map icons for both primary and alternate routes, as well as weighing factors illustrating how RL used this information in its recommendation. Transcripts of RL messages for each ART are in Appendix J. Participants completed 3 missions in their assigned ART.
4.3.4.2 Dependent Measures
The dependent measures were the same as in EXP1.
4.3.5 Procedure
The procedure was the same as in EXP1.
4.4 Results
Results were analyzed using the same methods and procedures as outlined in EXP1.
4.4.1 Complacent Behavior, Primary Task Performance, Trust in the Agent
4.4.1.1 Complacent behavior
Hypothesis 1: Access to agent reasoning will reduce incorrect acceptances, ART1 > ART2, and increased transparency of agent reasoning will increase incorrect acceptances, ART2 < ART3. When agent reasoning is not available, incorrect acceptances will be greater than when agent reasoning is present, ART1 > ART2+3.
Descriptive statistics for incorrect acceptances and DTs at the locations where the agent recommendation should have been rejected are shown in Table 14.

Approved for public release; distribution is unlimited. 60
Table 14 Descriptive statistics for incorrect acceptances and DTs sorted by ART level
N Mean SD SE 95% CI for mean
Incomplete acceptances
ART1 20 1.00 1.17 0.26 (0.45, 1.55) ART2 20 0.90 0.91 0.20 (0.47, 1.33) ART3 20 1.50 1.64 0.37 (0.73, 2.27)
Overall DT at reject
locations (s)
ART1 20 11.14 3.68 0.82 (9.42, 12.87) ART2 20 11.51 3.35 0.75 (9.94, 13.08) ART3 20 12.30 3.96 0.89 (10.45, 14.16)
DT correct rejects (s)
ART1 20 10.84 3.45 0.77 (9.23, 12.45) ART2 20 11.25 3.19 0.71 (9.75, 12.74) ART3 20 12.52 4.21 0.94 (10.55, 14.49)
DT incorrect accepts (s)
ART1 11 12.17 5.76 1.74 (8.30, 16.05) ART2 12 14.37 4.49 1.30 (11.51, 17.22) ART3 12 12.39 4.60 1.33 (9.46, 15.31)
WMC score was found to be a significant predictor of incorrect acceptances, in that participants with lower WMC had more incorrect acceptances than those with greater WMC, R2 = 0.079, b = –0.03, t(58) = –2.23, p = 0.029.
A between-groups ANOVA was conducted to assess the effect of ART on incorrect acceptances, and no significant effect was found (Fig. 26). Planned comparisons revealed the number of incorrect acceptances were lower in ART2 than in ART1; however, these differences were not significant.
Fig. 26 Average number of incorrect acceptances by ART level; bars denote SE

Approved for public release; distribution is unlimited. 61
Participants’ scores were further analyzed by the number of incorrect acceptances per ART level (see Fig. 27). Chi-square analysis found no significant effect of ART on the number of incorrect acceptances. Across all ART levels, 25 participants had no incorrect acceptances, and these were (roughly) equally distributed among ARTs, indicating the addition of agent reasoning had no more effect on performance than operator knowledge alone. The range of potential scores for incorrect acceptances was 0–6, and the range of participants’ scores was 0–5. Thirty-five participants had at least 1 incorrect acceptance, and these scores were sorted into groups: <50% (score 3 or less) or >50% (score 4 or higher). The participants who made incorrect acceptances appeared to be evenly distributed among ARTs. Of these, 31 out of 35 participants scored under 50%. This is evidence that ART had little to no effect on the number of incorrect acceptances. It is interesting to note that no participants in ART2 had more than 3 incorrect acceptances. However, of the participants who had >50% incorrect acceptances, most were in ART3, which could be an indication that too much access to agent reasoning can have a detrimental effect on performance.
Fig. 27 Distribution of number of incorrect acceptances across ART level
As in EXP1, the DT for responses at the locations where the agent recommendation was incorrect was evaluated as a potential indicator of complacent behavior. It was hypothesized that DT would increase as ART increased, as participants should require additional time to process the extra information, particularly in EXP2 as the text conveying agent reasoning in ARTs 2 and 3 was much longer than the notification presented in ART1 (see Appendix J). Thus, reduced time could indicate less time spent on deliberation, which may imply complacent behavior. In addition to the overall time to respond, DTs for correct rejects and incorrect accepts were

Approved for public release; distribution is unlimited. 62
also examined (see Fig. 28). There was no significant effect of ART on overall DT. Overall DT was slightly shorter in ART1 than in ART2, and slightly shorter in ART2 than in ART3; however, these differences were not significant. There was no significant effect of ART on DT for correct rejections. Mean decision times for correct rejections were slightly shorter in ART1 than in ART2, and shorter in ART2 than in ART3, but also were not significant. There was no significant main effect of ART on DT for incorrect acceptances. Mean DTs for incorrect acceptances were longer in ART2 than in ART1 and ART3. DTs remained relatively unchanged across ART levels; however, in ART2 DTs for incorrect acceptances were longer than DTs for correct rejects. This is evidence these incorrect responses were most likely due to errors in judgment rather than complacent behavior. Paired t-tests were used to compare differences between DTs for correct and incorrect responses within each ART. The largest difference in DT was in ART2, t(11) = –1.57, p = .146, d = 0.47, which had a medium-effect size although the p-value was not significant. Although these results did not achieve statistical significance, it is interesting that DTs between correct and incorrect responses are similar in ARTs 1 and 3, while those in ART2 indicate that participants in this condition spent more time in deliberation when their response was incorrect than when it was correct, and the medium-effect size indicates this difference is meaningful.
Fig. 28 Average DT in seconds for participant responses at decision points where the agent recommendation was incorrect: DTs are shown for all responses (overall), correct rejections, and incorrect acceptances sorted by ART level; bars denote SE.
4.4.1.2 Route-Selection Task Performance
Hypothesis 2: Access to agent reasoning will improve performance (number of correct rejects and accepts) on the route-selection task, ART1 < ART2, and

Approved for public release; distribution is unlimited. 63
increased transparency of agent reasoning will reduce performance on the route-selection task, ART2 > ART3. When agent reasoning is not available, performance will be lower than when agent reasoning is present, ART1 < ART2+3.
Descriptive statistics for route-selection task scores and DTs for all decision points across 3 missions are shown in Table 15.
Table 15 Descriptive statistics for route-selection scores and DTs sorted by ART level
N Mean SD SE 95% CI for mean
Route-selection score
ART1 20 13.20 3.46 0.77 (11.58, 14.82) ART2 20 13.30 3.18 0.71 (11.81, 14.79) ART3 20 13.40 3.28 0.73 (11.86, 14.94)
Overall DT(s) ART1 20 10.86 3.04 0.68 (9.44, 12.28) ART2 20 12.53 3.09 0.69 (11.08, 13.97) ART3 20 12.52 4.91 1.10 (10.22, 14.81)
DT correct responses (s)
ART1 20 10.32 2.79 0.62 (9.02, 11.63) ART2 20 11.95 3.40 0.76 (10.36, 13.54) ART3 20 11.79 3.98 0.89 (9.33, 13.65)
DT incorrect responses (s)
ART1 20 13.06 5.39 1.21 (10.54, 15.59) ART2 19 15.21 3.05 0.70 (13.74, 16.68) ART3 17 12.65 4.39 1.07 (10.40, 14.91)
Participants who scored higher on the CPRS, indicating a greater potential to demonstrate complacent behavior when interacting with automation, performed worse on the route-selection task than their counterparts, R2 = 0.138, b = –0.276, t(58) = –3.04, p = 0.004. Participants who scored lower on the SOT, demonstrating greater spatial-orientation abilities, also performed better on the route-selection task than their counterparts, R2 = 0.064, b = –0.111, t(58) = –2.00, p = 0.051.
A between-groups ANOVA was conducted to assess the effect of ART on route-selection scores and found no significant effect. Planned comparisons revealed route-selection scores were higher in ART2 than in ART1 and higher in ART3 than in ART2. The results trended as predicted; however, they were not significant.
Examining the distribution of scores, the potential range of scores for the route-selection task was 0–18 and the range of participants’ scores was 7–18 (see Fig. 29). Of these, 4 participants scored 18/18, 3 of whom were in ART3. Only 9 participants scored 50% or less; the majority scored 67% or higher. For comparative purposes, scores were sorted into similar groups as in EXP1 (i.e., 17–15, 14–12, <12). Interestingly, scores in each ART appear to be nearly evenly distributed

Approved for public release; distribution is unlimited. 64
among the groups. This does support the hypothesis, as performance in the agent reasoning conditions appears to be no better than in the notification-only condition.
Fig. 29 Distribution of scores for the route-selection task across ART levels
Planned comparisons revealed DTs were longer in ART2 than in ART1, t(38.0) = 1.72, p = 0.094, rc = 0.27, but not significantly different than in ART3. Overall, DTs were longer in the conditions with agent reasoning than without (ART1 < ART2+3), t(46.5) = 1.77, p = 0.083, rc = 0.25. These results were not significant, but they do follow the same pattern as those for the task-performance evaluation.
Overall, decision times for acceptances were compared to those for rejections of the agent recommendation using paired t-tests; this difference was marginally significant, t(59) = –1.91, p = 0.061, d = 0.17, across ART levels. Overall, DTs for correct responses were significantly shorter than those for incorrect responses, t(55) = –5.20, p < 0.001, d = 0.58. Within each ART, this difference was greater in ART2, t(18) = –3.61, p = 0.002, d = 0.95, than in ART1, t(19) = –3.21, p = 0.005, d = 0.67, and smallest in ART3, t(16) = –2.56, p = 0.021, d = 0.23 (see Fig. 30). DTs for incorrect responses among ARTs were evaluated, and there was no significant difference between ART1 and ART2 and a marginally significant difference between ART2 and ART3, t(28.11) = –2.00, p = 0.055, d = 0.76. While not offering additional support for the hypothesis, the difference in mean DT for incorrect responses demonstrated in ART3 could be indicative of some participants’ increased complacent behavior in the highest agent reasoning condition.

Approved for public release; distribution is unlimited. 65
Fig. 30 Comparison of average DTs for correct responses and incorrect responses shown by ART level; bars denote SE
4.4.1.3 Operator Trust Evaluation
Hypothesis 3: Access to agent reasoning will increase operator trust in the agent, ART1 < ART2, and increased transparency of agent reasoning will decrease operator trust in the agent, ART2 > ART3.
Descriptive statistics for incorrect rejections and the Usability and Trust Survey scores are shown in Table 17.
Table 16 Descriptive statistics for incorrect rejections and Usability and Trust Survey results across ART level
N Mean SD SE 95% CI for mean
Incorrect rejections
ART1 20 3.75 3.49 0.78 (2.12, 5.38) ART2 20 3.80 2.76 0.62 (2.51, 5.09) ART3 20 3.10 3.04 0.68 (1.68, 4.52)
Usability and Trust Survey
ART1 20 91.30 19.29 4.31 (82.27, 100.33) ART2 20 91.20 15.73 3.52 (83.84, 98.56) ART3 20 93.60 13.03 2.91 (87.50, 99.70)
Usability responses
ART1 20 40.35 7.18 1.61 (36.99, 43.71) ART2 20 39.45 6.05 1.35 (36.62, 42.28) ART3 20 41.60 5.70 1.27 (38.93, 44.27)
Trust responses
ART1 20 50.95 13.08 2.92 (44.83, 57.07) ART2 20 51.75 11.19 2.50 (46.51, 56.99) ART3 20 52.00 8.61 1.93 (47.97, 56.03)

Approved for public release; distribution is unlimited. 66
CPRS was found to be a significant predictor of incorrect rejections, R2 = 0.110, b = 0.23, t(58) = 2.67, p = 0.010. Persons who scored low in CP had fewer incorrect rejections than their higher-CP counterparts, which could be an indication of better calibrated trust of the agent for those individuals.
Examining the distribution of incorrect rejections at those locations where the agent recommendation was correct across ARTs showed, 11 participants had no incorrect rejections, and this number appears to be relatively even across ARTs (see Fig. 31). The range for potential scores for incorrect rejections was 0–12, and the range of participants’ scores was 0–9. Forty-nine participants had at least one incorrect rejection, and these scores were sorted into <50% (score 5 or less) and >50% (score 6 or higher). While scores in ART1 appeared to near the rate for chance, the majority of scores in ARTs 2 and 3 were below 50%, indicating that access to agent reasoning was helpful in reducing incorrect rejections.
Fig. 31 Distribution of scores for incorrect rejections sorted by ART level
Planned comparisons revealed there were more incorrect rejections in ART2 than in ART1 and ART3; however, these differences were not significant.
As in EXP1, the DT for responses at the locations where the agent recommendation was correct was evaluated as a potential indicator of operator trust. It was hypothesized that DT would increase as ART increased, as participants should require additional time to process the extra information. Thus, increased time could indicate more time spent on deliberation, which may imply lower trust. In addition, DTs for incorrect rejections of the agent recommendation at those locations could be indicative of complacent behavior (i.e., reduced DTs for incorrect responses). There was no significant effect of ART on overall DT at the agent’s correct

Approved for public release; distribution is unlimited. 67
locations (see Fig. 32). Planned comparisons show that overall DTs in ART2 were longer than those in ART1, t(57) = 2.00, p = 0.051, rc = 0.26, but not significantly longer than those in ART3. Overall, DTs were longer in the conditions with agent reasoning access than in the notification-only condition—(ART1 – ART2+3), t(57) = 1.86, p = 0.068, rc = 0.24—and this difference was marginally significant. DTs for correct accepts were significantly higher in the agent reasoning conditions than in the notification-only condition: (ART1 – ART2+3), t(48.2) = 2.44, p = 0.018, rc = 0.33. DTs for correct responses were shorter in ART1 than in ART2, t(37.4) = 2.48, p = 0.018, rc = 0.38, but not significantly different in ART2 than in ART3. DTs for incorrect responses were not significantly longer in ART2 than in ART1, and significantly longer than in ART3, t(31.0) = –2.21, p = 0.042, rc = 0.36.
Fig. 32 Average DTs in seconds at the locations where the agent recommendation was correct, sorted by correct/incorrect selections for each ART level; bars denote SE
Paired t-tests were used to compare differences between DTs for correct acceptances and incorrect rejections within each ART at those locations where the agent recommendation was correct (see Fig. 33). DTs for incorrect rejections were significantly longer than for correct acceptances in ART1, t(11) = –3.36, p = 0.004, d = 0.79, and ART2, t(17) = –3.40, p = 0.003, d = 0.84. However, there was no difference between the 2 in ART3. While the difference in DTs in ARTs 1 and 2 could indicate difficulty integrating the information, resulting in incorrect choices, the lack of the same difference in ART3 could indicate complacent behavior.

Approved for public release; distribution is unlimited. 68
Fig. 33 Average DT in seconds for correct acceptances and incorrect rejections within each ART level; bars denote SE
Operator trust was also evaluated using the Usability and Trust Survey. CPRS was found to be a significant predictor of scores on the Usability and Trust Survey, R2 = 0.120, b = –1.26, t(58) = –2.81, p = 0.007. Participants who scored higher on the CPRS measure rated the agent as being less usable and trusted than did their counterparts.
A 1-way ANOVA evaluating overall usability and trust scores found no significant effect of ART. Planned comparisons revealed scores were higher in ART1 than in ART2 and higher in ART3 than in ART2; however, these differences were not significant.
The Usability and Trust Survey is a combination of surveys measuring usability and trust. These individual surveys were also evaluated separately to assess whether the findings were due to mainly operator trust or perceived usability.
Planned comparisons revealed trust scores were higher in ART2 than in ART1 and higher in ART3 than in ART2; however, these differences were not significant.
Planned comparisons revealed scores were slightly higher in ART1 than in ART2 and higher in ART3 than in ART2; however, these differences were not significant.
4.4.2 Workload Evaluation
Hypothesis 4: Access to agent reasoning will increase operator workload, ART1 < ART2; increased transparency of agent reasoning will increase operator workload,

Approved for public release; distribution is unlimited. 69
ART2 < ART3. When agent reasoning is not available, workload will be lower than when agent reasoning is present, ART1 < ART2+3.
ART had no significant effect on participants’ global workload (see Fig. 34). Planned contrasts revealed no overall difference in participant workload when agent reasoning was available compared to the no-reasoning condition, (ART1 – ART2+3). Participants in ART1 (M = 67.03, SD = 10.87) reported higher workload than those in ART2 (M = 62.80, SD = 13.78), and workload was higher in ART2 than in ART3 (M = 61.48, SD = 11.58). The nonsignificant omnibus p-value, along with the small effect sizes, indicate that although workload scores decreased as ART increased there was no significant difference among ARTs.
Fig. 34 Average global NASA-TLX scores by ART level; bars denote SE
Cognitive workload was also evaluated using several ocular indices. Descriptive statistics are shown in Table 17. Not all participants had complete eye-measurement data, so this N was reduced (ART1 N = 18, ART2 N = 17, ART3 N = 17) and unweighted results reported. Eye-tracking data were evaluated using the same planned comparisons as the subjective workload measure.
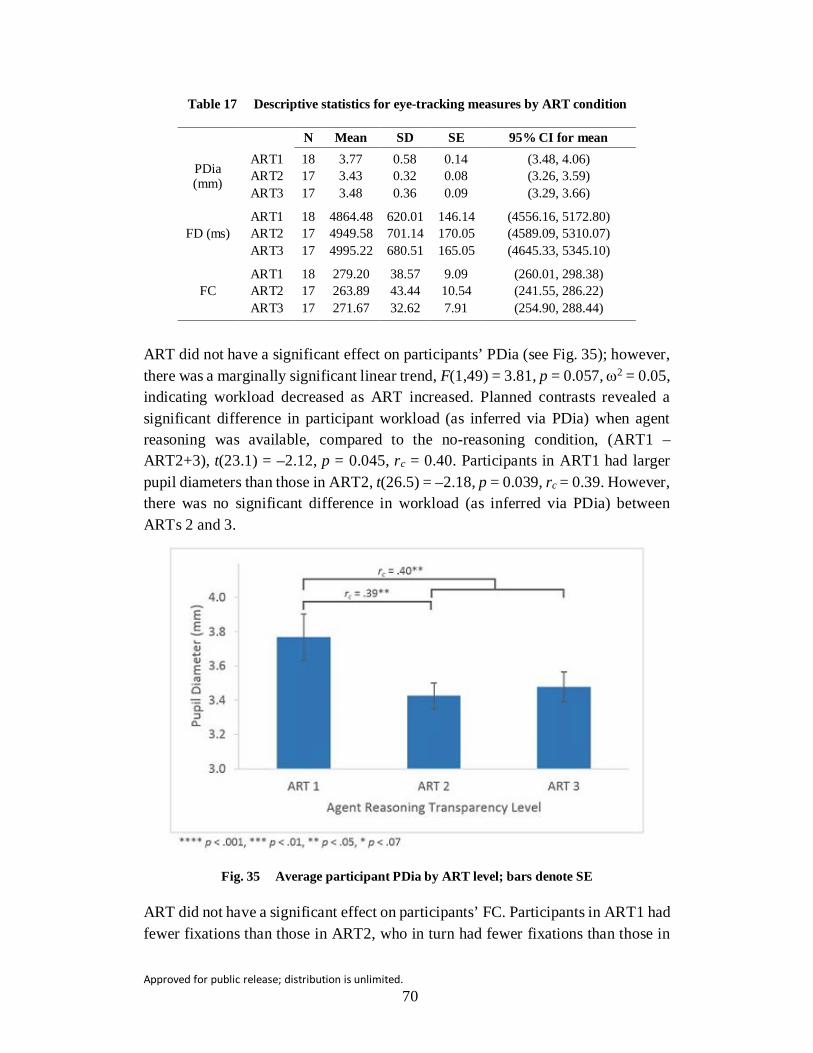
Approved for public release; distribution is unlimited. 70
Table 17 Descriptive statistics for eye-tracking measures by ART condition
N Mean SD SE 95% CI for mean
PDia (mm)
ART1 18 3.77 0.58 0.14 (3.48, 4.06) ART2 17 3.43 0.32 0.08 (3.26, 3.59) ART3 17 3.48 0.36 0.09 (3.29, 3.66)
FD (ms) ART1 18 4864.48 620.01 146.14 (4556.16, 5172.80) ART2 17 4949.58 701.14 170.05 (4589.09, 5310.07) ART3 17 4995.22 680.51 165.05 (4645.33, 5345.10)
FC ART1 18 279.20 38.57 9.09 (260.01, 298.38) ART2 17 263.89 43.44 10.54 (241.55, 286.22) ART3 17 271.67 32.62 7.91 (254.90, 288.44)
ART did not have a significant effect on participants’ PDia (see Fig. 35); however, there was a marginally significant linear trend, F(1,49) = 3.81, p = 0.057, ω2 = 0.05, indicating workload decreased as ART increased. Planned contrasts revealed a significant difference in participant workload (as inferred via PDia) when agent reasoning was available, compared to the no-reasoning condition, (ART1 – ART2+3), t(23.1) = –2.12, p = 0.045, rc = 0.40. Participants in ART1 had larger pupil diameters than those in ART2, t(26.5) = –2.18, p = 0.039, rc = 0.39. However, there was no significant difference in workload (as inferred via PDia) between ARTs 2 and 3.
Fig. 35 Average participant PDia by ART level; bars denote SE
ART did not have a significant effect on participants’ FC. Participants in ART1 had fewer fixations than those in ART2, who in turn had fewer fixations than those in

Approved for public release; distribution is unlimited. 71
ART3. While these results trend in the hypothesized direction of increased workload as ART increases, the findings are not significant.
ART did not have a significant effect on participants’ FD. Participants in ART2 had shorter fixations than those in ART1 and ART3. While these results indicate the addition of ART could alleviate workload, the results were not significant and the effect sizes were small.
In EXP1, the NASA-TLX factors were also examined individually; so, this analysis is repeated for EXP2 results. An omnibus Multivariate ANOVA indicated there was no significant difference across ARTs for any individual factor. Individual evaluations of each factor across ART were made by one-way ANOVA using Bonferroni correction, α = 0.008 (see Table 18).
Table 18 Evaluation of NASA-TLX workload factors across ART conditions
Mean (SD) One-way ANOVA (α = .008)
Planned comparisons (Cohen’s d)
ART1 ART2 ART3 F(2,57) ω2 ART1–2 ART2–3 ART1–2+3
MD 83.75 (12.45)
76.50 (20.27)
72.25 (20.10) 2.09 0.04 0.34 0.20 0.50*
PhyD 21.00 (12.94)
15.25 (8.66)
13.50 (9.61) 2.76* 0.06 0.46 0.14 0.61**
TD 54.25 (23.69)
51.25 (24.00)
46.00 (19.10) 0.70 0.01 0.11 0.20 0.24
Perf 52.75 (20.99)
49.50 (19.93)
55.00 (18.06) 0.39 0.02 0.14 0.23 0.02
Effort 73.75 (17.08)
73.75 (19.79)
68.50 (19.67) 0.52 0.02 0.00 0.23 0.13
Frust 45.00 (25.75)
43.25 (26.77)
42.25 (21.67) 0.06 0.03 0.06 0.03 0.09
** p < .05; * p < .07 Mental demand was the factor contributing the most to workload, and ART1 elicited greater MD than ARTs 2 or 3 (see Fig. 36). Although this difference did not reach significance, planned comparisons among ART levels indicate the medium–large-effect sizes for the differences between ART1 and the RL conditions ARTs 2 and 3 were significant. This is evidence that the presence of agent reasoning alleviates MD, contradicting the stated hypothesis that workload in ART1 would be lower than in ARTs 2 and 3. Physical demand contributed the least to overall workload. While the difference between ARTs 1 and 2 had a medium-effect size, it did not reach significance (p = 0.091). However, there was a significant difference

Approved for public release; distribution is unlimited. 72
between the no-reasoning condition (ART1) and the transparent-reasoning conditions (ART 2+3).
Fig. 36 Average NASA-TLX workload factor scores by ART level; bars denote SE
Unlike EXP1, there was no significant difference in factors Temporal Demand or Effort across ARTs. However, there was an interesting negative correlation between TD and the number of hours of sleep the participant reported for the previous night (r = –0.26, p = 0.042), indicating those who had less sleep found the task more demanding overall.
4.4.3 SA Evaluation
Hypothesis 5: Access to agent reasoning will improve SA scores, and increased transparency of agent reasoning will improve SA2 scores but will reduce SA1 and SA3 scores:
• SA1: ART1 < ART2, ART2 > ART3;
• SA2: ART1 < ART2, ART2 < ART3;
• SA3: ART1 < ART2, ART2 > ART3.
Descriptive statistics for SA scores are shown in Table 19.

Approved for public release; distribution is unlimited. 73
Table 19 Descriptive statistics for SA scores by ART level
N Mean SD SE 95% CI for mean Min Max
SA1 ART1 20 1.60 4.31 0.96 (–0.42, 3.62) –6 10 ART2 20 2.25 3.84 0.86 (0.45, 4.05) –6 10 ART3 20 1.55 5.43 1.21 (–0.99, 4.09) –7 10
SA2 ART1 20 14.80 3.35 0.75 (13.23, 16.37) 9 20 ART2 20 13.20 7.15 1.60 (9.85, 16.55) 0 24 ART3 20 15.20 6.28 1.40 (12.26, 18.14) 1 25
SA3 ART1 20 2.90 9.40 2.10 (–1.50, 7.30) –16 16 ART2 20 0.45 8.51 1.90 (–3.53, 4.43) –18 16 ART3 20 2.00 8.78 1.96 (–2.11, 6.11) –14 18
WMC scores were found to be a significant predictor of SA1 scores, R2 = 0.069, b = 0.10, t(58) = 2.07, p = 0.043. Participants who scored higher on the WMC measure scored higher on SA1 queries than their counterparts.
Planned comparisons revealed SA1 scores were higher in ART2 than in ART1 or ART3; however, these differences were not significant.
SV scores (r = 0.27, p = 0.018) correlated significantly with SA2 scores, but were not found to be a significant predictor of SA2 scores. WMC scores—R2 = 0.143, b = 0.18, t(58) = 3.11, p = 0.003—and SOT scores—R2 = 0.208, b = –0.36, t(58) = –3.90, p < 0.001—were found to be significant predictors of SA2 scores. Participants who scored higher on the WMC and SV measures, or who performed better on the SOT, scored higher on SA2 queries than their counterparts.
A 1-way ANOVA evaluating SA2 scores found no significant effect of ART. Planned comparisons revealed no change in scores between ART1 and ART2, and scores in ART3 were slightly higher than in ART2; however, this difference was not significant.
CPRS scores (r = –0.25, p = 0.026) and SOT scores (r = –0.27, p = 0.018) correlated significantly with SA3 scores. Participants who scored lower on the CPRS, indicating a lower potential for complacent behavior, as well as those who performed better on the SOT, scored higher on SA3 queries than their counterparts.
Planned comparisons revealed SA3 scores in ART1 were higher than those in ART2 and scores in ART2 were lower than in ART3. These results were contrary to the stated hypothesis, in that SA3 scores were lowest in ART2; however, these results were not significant.

Approved for public release; distribution is unlimited. 74
4.4.4 Task-Detection Task Performance
Hypothesis 6: Access to agent reasoning will reduce performance on the target-detection task (fewer targets detected, higher FAs), ART1 > ART2, and increased transparency of agent reasoning will further reduce performance on the target-detection task, ART2 > ART3.
Descriptive statistics for target-detection measures are shown in Table 20.
Table 20 Descriptive statistics for target-detection task measures by ART level
N Mean SD SE 95% CI for mean Min Max
Targets detected (count)
ART1 20 45.25 10.96 2.45 (40.12, 50.38) 24 59 ART2 20 47.65 10.74 2.40 (42.62, 52.68) 30 73 ART3 20 40.30 13.27 2.97 (34.09, 46.51) 18 61
FAs (count)
ART1 20 16.30 6.18 1.38 (13.41, 19.19) 4 28 ART2 20 16.65 4.97 1.11 (14.33, 18.97) 11 26 ART3 20 15.90 6.12 1.37 (13.04, 18.76) 6 26
dʹ ART1 20 2.30 0.40 0.09 (2.11, 2.49) 1.62 2.95 ART2 20 2.38 0.35 0.08 (2.21, 2.54) 1.81 3.32 ART3 20 2.19 0.44 0.10 (1.99, 2.39) 1.49 2.88
β ART1 20 2.64 0.34 0.08 (2.48, 2.80) 2.17 3.24 ART2 20 2.59 0.28 0.06 (2.46, 2.72) 1.88 2.96 ART3 20 2.65 0.39 0.09 (2.47, 2.83) 2.14 3.51
SV scores were found to be significant predictors of total number of targets detected, R2 = 0.143, b = 32.15, t(58) = 3.12, p = 0.003. Participants who scored higher in SV, indicating a greater ability to mentally manipulate objects in 3-D space, also detected more targets in their environment than their counterparts.
Planned comparisons revealed the number of targets detected was not significantly different in ART2 than in ART1 and significantly higher in ART2 than in ART3, t(57) = –1.98, p = 0.052, rc = 0.25 (see Fig. 37). While access to agent reasoning did not appear to improve performance on the target-detection task, increasing the amount of agent reasoning did result in a decline in performance, indicating the participants may have become overwhelmed.
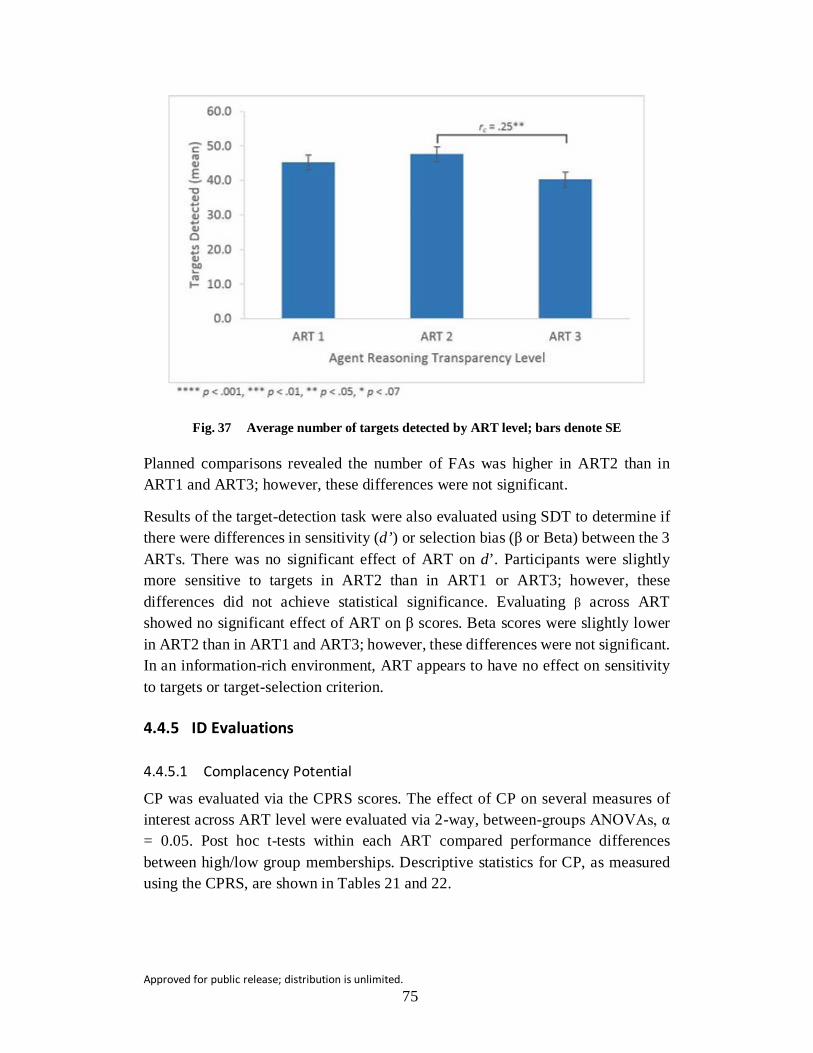
Approved for public release; distribution is unlimited. 75
Fig. 37 Average number of targets detected by ART level; bars denote SE
Planned comparisons revealed the number of FAs was higher in ART2 than in ART1 and ART3; however, these differences were not significant.
Results of the target-detection task were also evaluated using SDT to determine if there were differences in sensitivity (d’) or selection bias (β or Beta) between the 3 ARTs. There was no significant effect of ART on d’. Participants were slightly more sensitive to targets in ART2 than in ART1 or ART3; however, these differences did not achieve statistical significance. Evaluating β across ART showed no significant effect of ART on β scores. Beta scores were slightly lower in ART2 than in ART1 and ART3; however, these differences were not significant. In an information-rich environment, ART appears to have no effect on sensitivity to targets or target-selection criterion.
4.4.5 ID Evaluations
4.4.5.1 Complacency Potential
CP was evaluated via the CPRS scores. The effect of CP on several measures of interest across ART level were evaluated via 2-way, between-groups ANOVAs, α = 0.05. Post hoc t-tests within each ART compared performance differences between high/low group memberships. Descriptive statistics for CP, as measured using the CPRS, are shown in Tables 21 and 22.
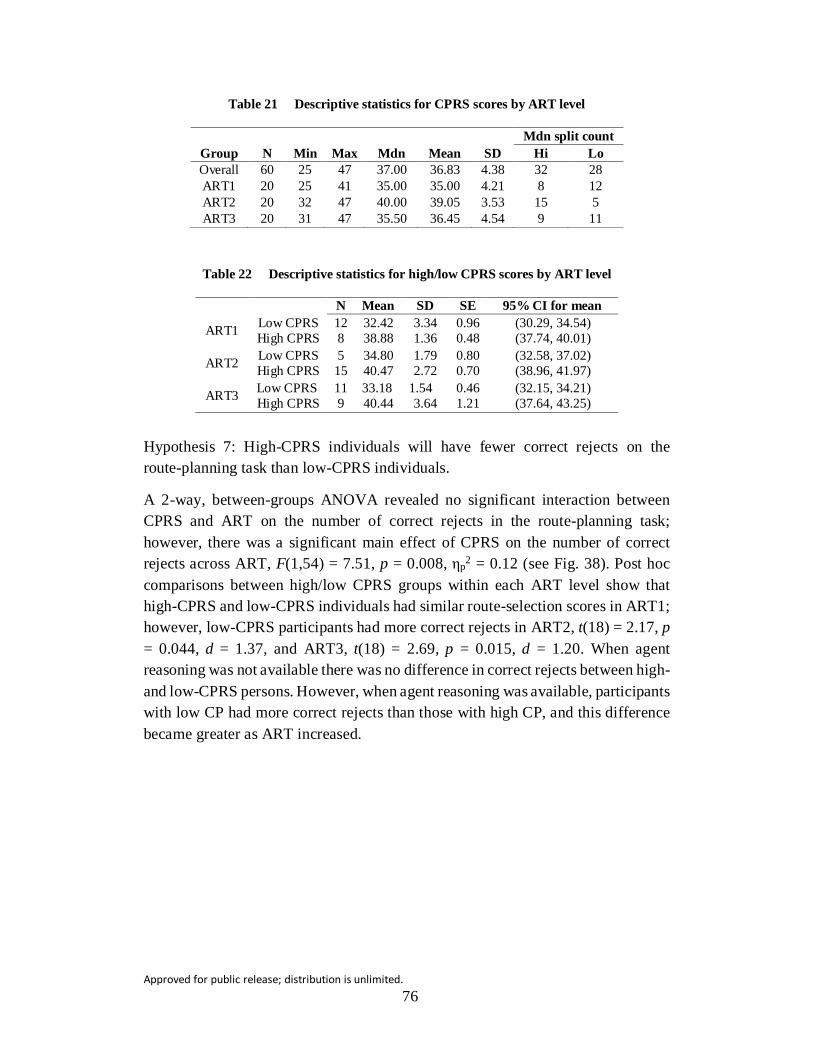
Approved for public release; distribution is unlimited. 76
Table 21 Descriptive statistics for CPRS scores by ART level
Mdn split count Group N Min Max Mdn Mean SD Hi Lo Overall 60 25 47 37.00 36.83 4.38 32 28 ART1 20 25 41 35.00 35.00 4.21 8 12 ART2 20 32 47 40.00 39.05 3.53 15 5 ART3 20 31 47 35.50 36.45 4.54 9 11
Table 22 Descriptive statistics for high/low CPRS scores by ART level
N Mean SD SE 95% CI for mean
ART1 Low CPRS 12 32.42 3.34 0.96 (30.29, 34.54) High CPRS 8 38.88 1.36 0.48 (37.74, 40.01)
ART2 Low CPRS 5 34.80 1.79 0.80 (32.58, 37.02) High CPRS 15 40.47 2.72 0.70 (38.96, 41.97)
ART3 Low CPRS 11 33.18 1.54 0.46 (32.15, 34.21) High CPRS 9 40.44 3.64 1.21 (37.64, 43.25)
Hypothesis 7: High-CPRS individuals will have fewer correct rejects on the route-planning task than low-CPRS individuals.
A 2-way, between-groups ANOVA revealed no significant interaction between CPRS and ART on the number of correct rejects in the route-planning task; however, there was a significant main effect of CPRS on the number of correct rejects across ART, F(1,54) = 7.51, p = 0.008, ηp2 = 0.12 (see Fig. 38). Post hoc comparisons between high/low CPRS groups within each ART level show that high-CPRS and low-CPRS individuals had similar route-selection scores in ART1; however, low-CPRS participants had more correct rejects in ART2, t(18) = 2.17, p = 0.044, d = 1.37, and ART3, t(18) = 2.69, p = 0.015, d = 1.20. When agent reasoning was not available there was no difference in correct rejects between high- and low-CPRS persons. However, when agent reasoning was available, participants with low CP had more correct rejects than those with high CP, and this difference became greater as ART increased.

Approved for public release; distribution is unlimited. 77
Fig. 38 Average number of correct rejects by high/low CPRS-score group sorted by ART level; bars denote SE
Hypothesis 8: High-CPRS-score individuals will have higher scores on the Usability and Trust Survey than low-CPRS-score individuals.
A 2-way, between-groups ANOVA revealed no significant interaction between CPRS score and ART on Usability and Trust Survey scores nor any significant main effect of CP on usability scores.
Hypothesis 9: High-CPRS-score individuals will have lower SA scores than low- CPRS-score individuals.
A 2-way, between-groups ANOVA revealed no significant interaction between CPRS scores and ART on SA1 scores; however, there was a significant main effect of CP on SA1 scores across ART, F(1,54) = 4.12, p = 0.047, ηp2 = 0.12 (see Fig. 39). Post hoc comparisons between high/low CPRS-score groups within each ART level show that low-CP individuals had higher SA1 scores in each ART—ART1, t(18) = 0.93, p = 0.365, d = 0.42; ART2, t(18) = 1.05, p = 0.310, d = 0.72; and ART3, t(18) = 1.54, p = 0.142, d = 0.69—than their high-CP counterparts, and while these post hoc comparisons did not reach statistical significance, the medium–large-effect sizes indicate this difference is meaningful in each ART. Thus, in a high-information environment low-CP individuals monitored their environment better than high-CP individuals.

Approved for public release; distribution is unlimited. 78
Fig. 39 Average level 1 situation awareness (SA1) scores by high/low CPRS group sorted by ART level; bars denote SE
A 2-way, between-groups ANOVA revealed no significant interaction between CPRS and ART on SA2 scores nor any significant main effect of CPRS on SA2 scores across ART. A 2-way, between-groups ANOVA revealed no significant interaction between CPRS and ART on SA3 scores nor any significant main effect of CPRS on SA3 scores across ART.
4.4.5.2 Spatial Ability (SOT and SV) and PAC
Hypothesis 10: Individual differences, such as SpA and PAC, will have differential effects on the operator’s performance on the route-selection task and their ability to maintain SA.
The effects of ID factors and ART level on route-selection performance were evaluated via 2-way, between-groups ANOVAs, α = 0.05. When Levene’s Test of Equality of Error Variance was significant, the evaluation was repeated at α = 0.01. Post hoc t-tests within each ART compared performance differences between high/low group memberships for each ID factor. SOT is reverse-scored, so lower test scores imply greater spatial ability (high-SOT group), while SV and PAC are scored normally (higher test scores imply greater ability). Descriptive statistics for SOT, SV, and PAC are shown in Tables 23 and 24.

Approved for public release; distribution is unlimited. 79
Table 23 Descriptive statistics for SOT, SV, and PAC by ART level
Mdn split count Group N Min Max Mdn Mean SD Hi Lo
SOT
Overall 60 3.96 33.01 11.19 13.39 7.40 30 30 ART1 20 4.58 27.00 9.26 12.75 7.08 12 8 ART2 20 4.52 33.01 13.74 14.71 8.14 8 12 ART3 20 3.96 27.81 10.23 12.71 7.15 10 10
SV
Overall 60 0.19 0.88 0.50 0.52 0.14 30 30 ART1 20 0.36 0.76 0.54 0.52 0.11 12 8 ART2 20 0.36 0.88 0.51 0.53 0.13 13 7 ART3 20 0.19 0.83 0.48 0.50 0.17 8 12
PAC
Overall 60 33 75 58.00 57.55 8.23 31 29 ART1 20 33 74 57.50 56.35 8.87 10 10 ART2 20 41 75 60.50 60.05 7.67 13 7 ART3 20 41 70 57.00 56.25 7.93 8 12
Table 14 Descriptive statistics for SOT, SV, and PAC by ART level, sorted by high/low group membership
N Mean SD SE 95% CI for mean
SOT
ART1 Low 8 20.03 5.50 1.94 (15.44, 24.63) High 12 7.90 1.78 0.51 (6.77, 9.03)
ART2 Low 12 19.59 6.82 1.97 (15.25, 23.92) High 8 7.40 2.14 0.76 (5.60, 9.19)
ART3 Low 10 18.67 5.18 1.64 (14.96, 22.37) High 10 6.75 1.54 0.49 (5.65, 7.86)
SV
ART1 Low 8 0.41 0.05 0.02 (0.37, 0.45) High 12 0.59 0.08 0.02 (0.54, 0.64)
ART2 Low 7 0.40 0.04 0.01 (0.37, 0.44) High 13 0.60 0.11 0.03 (0.54, 0.67)
ART3 Low 12 0.38 0.11 0.03 (0.31, 0.45) High 8 0.67 0.09 0.03 (0.59, 0.75)
PAC
ART1 Low 10 50.10 7.42 2.34 (44.80, 55.41) High 10 62.60 4.93 1.56 (59.08, 66.12)
ART2 Low 7 52.29 5.50 2.08 (47.20, 57.37) High 13 64.23 4.90 1.36 (61.27, 67.19)
ART3 Low 12 51.25 5.56 1.61 (47.72, 54.78) High 8 63.75 3.85 1.36 (60.54, 66.97)
4.4.5.2.1 Route-Selection Task Evaluation A 2-way, between-groups ANOVA revealed no significant interaction between SOT and ART on route-selection scores; however, there was a significant main effect of SOT on route-selection scores, F(1,54) = 4.40, p = 0.041, ηp2 = 0.08 (see Fig. 40). Post hoc comparisons between high/low SOT groups within each ART level show that low-SOT individuals (those who performed better on the SOT) had

Approved for public release; distribution is unlimited. 80
higher route-selection scores in each ART: ART1, t(18) = –1.29, p = 0.214, d = 0.61; ART2, t(18) = –1.10, p = 0.287, d = 0.50; and ART3, t(18) = –1.24, p = 0.230, d = 0.56. Although these post hoc analyses did not reach statistical analysis, they had medium-effect sizes.
Fig. 40 Average route-selection scores by high/low SOT group membership across ART level; bars denote SE
A 2-way, between-groups ANOVA revealed no significant interaction between SV and ART on route-selection scores nor any significant main effect of SV on route-selection scores.
A 2-way, between-groups ANOVA revealed no significant interaction between PAC and ART on route-selection scores; however, there was a significant main effect of PAC on route-selection scores, F(1,54) = 3.98, p = 0.051, ηp2 = 0.07 (see Fig. 41). Post hoc comparisons between high/low PAC groups within each ART level show that high-PAC individuals had higher route-selection scores in each ART: ART1, t(18) = –1.18, p = 0.255, d = 0.53; ART2, t(18) = –0.74, p = 0.467, d = 0.34; and ART3, t(18) = –1.56, p = 0.137, d = 0.69. Although these post hoc analyses did not reach statistical analysis, they had medium-effect sizes.

Approved for public release; distribution is unlimited. 81
Fig. 41 Average route-selection scores by high/low PAC group membership across ART level; bars denote SE
4.4.5.2.2 SA1 Evaluation Two-way, between-groups ANOVAs revealed no significant ART interaction among SOT, SV, or PAC on SA1 scores nor any significant main effect of SOT, SV, or PAC on SA1 scores across ART levels.
4.4.5.2.3 SA2 Evaluation A 2-way, between-groups ANOVA revealed no significant interaction between SOT and ART on SA2 scores; however, there is a significant main effect of SOT on SA2 scores, F(1,54) = 16.98, p < 0.001, ηp2 = 0.24 (see Fig. 42). Post hoc comparisons between high/low SOT groups within each ART level show that high-SOT and low-SOT individuals had similar SA2 scores in ART1; however, high-SOT participants had higher SA2 scores in ART2, t(18) = –2.78, p = 0.012, d = 1.29, and ART3, t(18) = –3.09, p = 0.006, d = 1.42. When agent reasoning was not available there was no significant difference in SA2 scores between high- and low-SOT persons. However, when agent reasoning was available participants who performed better on the SOT also had higher SA2 scores than their counterparts.
Two-way, between-groups ANOVAs revealed no significant interaction between SV or PAC and ART on SA2 scores nor any significant main effect of SV or PAC on SA2 scores across ART levels.

Approved for public release; distribution is unlimited. 82
Fig. 42 Average SA2 scores by SOT high/low group membership sorted by ART level; bars denote SE
4.4.5.2.4 SA3 Evaluation Two-way, between-groups ANOVAs revealed no significant ART interaction among SOT, SV, or PAC on SA3 scores nor any significant main effect of SOT, SV, or PAC on SA3 scores across ART levels.
4.4.5.3 WMC
Hypothesis 11: High-WMC individuals will have more correct rejects and higher SA2 and SA3 scores than low-WMC individuals.
The effects of WMC and ART level were evaluated via 2-way, between-groups ANOVAs, α = 0.05. Post hoc t-tests within each ART compared performance differences between high/low group memberships. Descriptive statistics for WMC, as measured using the RSPAN test, are shown in Tables 25 and 26.
Table 25 Descriptive statistics for WMC by ART level
Mdn split count Group N Min Max Mdn Mean SD Hi Lo
WMC
Overall 60 10 54 31.00 31.47 12.06 31 29 ART1 20 17 54 31.00 33.15 11.86 11 9 ART2 20 11 54 32.50 31.10 13.75 11 9 ART3 20 10 54 28.00 30.15 11.17 9 11
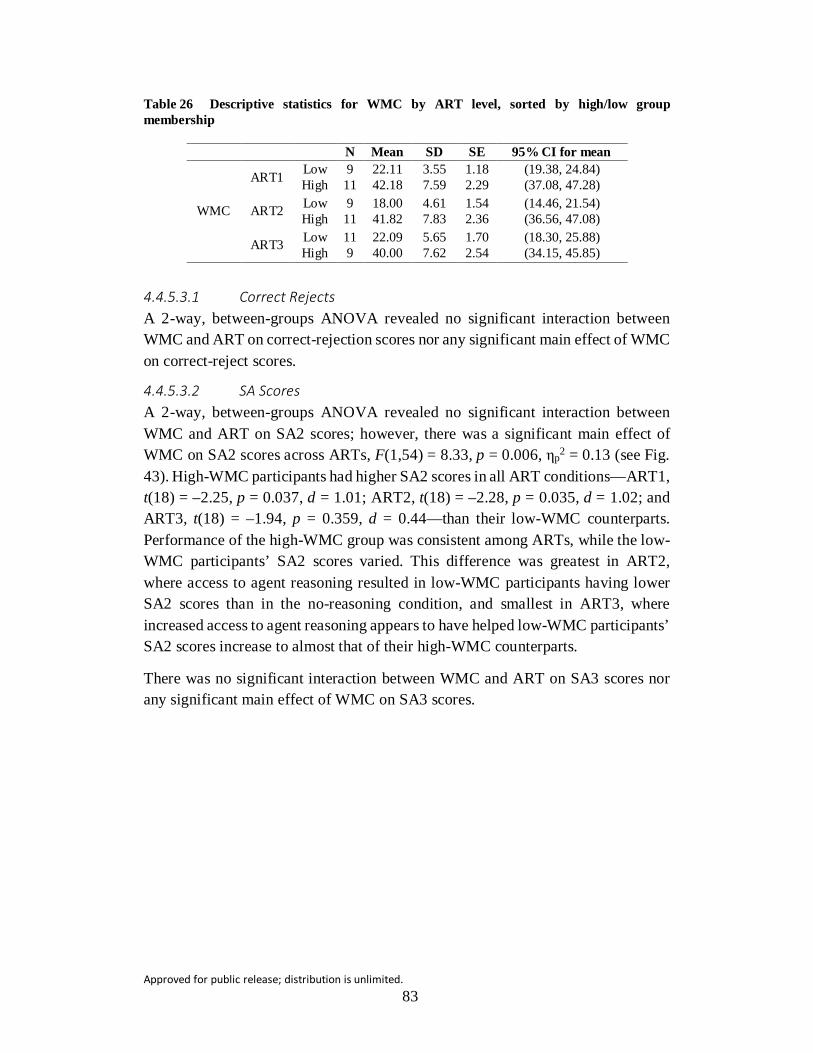
Approved for public release; distribution is unlimited. 83
Table 26 Descriptive statistics for WMC by ART level, sorted by high/low group membership
N Mean SD SE 95% CI for mean
WMC
ART1 Low 9 22.11 3.55 1.18 (19.38, 24.84) High 11 42.18 7.59 2.29 (37.08, 47.28)
ART2 Low 9 18.00 4.61 1.54 (14.46, 21.54) High 11 41.82 7.83 2.36 (36.56, 47.08)
ART3 Low 11 22.09 5.65 1.70 (18.30, 25.88) High 9 40.00 7.62 2.54 (34.15, 45.85)
4.4.5.3.1 Correct Rejects A 2-way, between-groups ANOVA revealed no significant interaction between WMC and ART on correct-rejection scores nor any significant main effect of WMC on correct-reject scores.
4.4.5.3.2 SA Scores A 2-way, between-groups ANOVA revealed no significant interaction between WMC and ART on SA2 scores; however, there was a significant main effect of WMC on SA2 scores across ARTs, F(1,54) = 8.33, p = 0.006, ηp2 = 0.13 (see Fig. 43). High-WMC participants had higher SA2 scores in all ART conditions—ART1, t(18) = –2.25, p = 0.037, d = 1.01; ART2, t(18) = –2.28, p = 0.035, d = 1.02; and ART3, t(18) = –1.94, p = 0.359, d = 0.44—than their low-WMC counterparts. Performance of the high-WMC group was consistent among ARTs, while the low-WMC participants’ SA2 scores varied. This difference was greatest in ART2, where access to agent reasoning resulted in low-WMC participants having lower SA2 scores than in the no-reasoning condition, and smallest in ART3, where increased access to agent reasoning appears to have helped low-WMC participants’ SA2 scores increase to almost that of their high-WMC counterparts.
There was no significant interaction between WMC and ART on SA3 scores nor any significant main effect of WMC on SA3 scores.

Approved for public release; distribution is unlimited. 84
Fig. 43 Average SA2 scores by WMC high/low group membership sorted by ART level; bars denote SE
4.5 Discussion
The primary goal of this study was to examine how the transparency of an intelligent agent’s reasoning in a high-information environment affected complacent behavior in a route-selection task. Participants supervised a 3-vehicle convoy as it traversed a simulated environment and rerouted the convoy when needed with the assistance of an intelligent agent, RoboLeader. Information regarding potential events along the preplanned route, together with communications from a commander confirming either the presence or absence of activity in the area, were provided to all participants. They received information about both their current route and the agent-recommended alternative route. When the convoy approached a potentially unsafe area, the intelligent agent would recommend rerouting the convoy. The agent recommendations were correct 66% of the time. The participant was required to recognize and correctly reject any incorrect suggestions. The secondary goal of this study was to examine how differing levels of agent transparency affected main-task and secondary-task performance, response time, workload, SA, trust, and system usability along with implications of ID factors such as spatial ability, WMC, PAC, and CP.
Each participant was assigned to a specific level of ART. The reasoning explained why the agent was making the recommendation and this differed among these levels. ART1 provided no reasoning information; RL notified that a change was recommended without explanation. The type of information the agent supplied
Approved for public release; distribution is unlimited. 85
varied slightly between ARTs 2 and 3. In ART2 the agent reasoning was simple statements of fact corresponding to the information icons that appeared on the map, along with reasoning as to how the agent factored each piece of information into its final recommendation (e.g., Recommend revise convoy route: Potential IED (H[igh]), Potential Sniper (M[edium]), Dense Fog (L[ow]). In ART3 an additional piece of information was added, time of report, that conveyed when the agent had received the information leading to its recommendation (e.g., Recommend revise convoy route: Potential IED (H), TOR: 1 [h]; Potential Sniper (M), TOR: 2; Dense Fog (L), TOR: 4). This additional information did not convey any confidence level or uncertainty but was designed to encourage the operator to actively evaluate the quality of the information rather than simply respond. Therefore, not only was access to agent reasoning examined, but the impact of the type of information the agent supplied was reviewed, as well.
Complacent behavior was investigated via primary (route-selection) task response at those decision points where the agent recommendation was incorrect, in the form of incorrect acceptances of the agent recommendation, an objective measure of errors of commission (Parasuraman et al. 2000). Access to agent reasoning was predicted to reduce the number of incorrect acceptances while an increase in ART was expected to increase incorrect acceptances. The trend in the data appeared to support this prediction even though the findings were not significant. While there was a slight decrease in the mean score for incorrect acceptances when ART was added, the highest mean score for incorrect acceptances was in ART3, when ART was highest. Response times for incorrect acceptances were longer than those for correct rejections in the ART condition, indicating these incorrect acceptances could be the result of errors in judgment rather than an indication of complacent behavior. However, in the condition with the highest amount of ART, not only are there more incorrect acceptances of the agent suggestion, but the decision times for these responses are no different from those for correct rejections. Considered together, this may indicate the combination of high information and increased access to agent reasoning could overwork the operator, resulting in an OOTL situation. Differences due to IDs support this notion, as individuals with higher WMC had fewer incorrect acceptances overall, demonstrating an ability to process more information more effectively than their counterparts. Additionally, individuals who scored low on complacency potential had fewer incorrect acceptances in the ART conditions. There was no difference in performance between high- and low-CP individuals in the information-only condition. However, when agent reasoning was transparent, low-CP individuals had more correct rejections than the high-CP individuals, and when ART was increased the difference in performance became more pronounced. The better performance of low-CP individuals could indicate either their willingness to engage with the agent

Approved for public release; distribution is unlimited. 86
rather than defer or their calibrated trust in the ability of the intelligent agent (Parasuraman and Manzey 2010).
As in EXP1, the operator received all information needed to route the convoy correctly without the agent’s suggestion. While the addition of agent reasoning did result in fewer incorrect acceptances than in the no-reasoning condition, the difference was not significant. However, the small reduction in the number of incorrect acceptances considered with the increased response times does provide evidence that the addition of ART is effective at keeping the operator engaged in the task, even if the performance gains are small. In the highest reasoning-transparency condition, operators were also given information that could have seemed ambiguous and, as a result, the number of incorrect acceptances increased while the response times were unchanged from those for correct responses. Thus, the addition of information whose use is not clear created a situation that encouraged the operator to defer to the agent suggestion.
Performance on the route-selection task was evaluated via correct rejections and acceptances of the agent suggestion. An increased number of correct acceptances and rejections, as well as reduced decision times, were all indicative of improved performance. Route-selection performance was anticipated to improve with access to agent reasoning and then decline as access to agent reasoning increased. This hypothesis was not supported. Performance was unchanged in the ART conditions compared to the information-only condition. Decision times (overall and correct responses) were slightly longer in the ART conditions compared to the information-only condition, which is to be expected due to the additional processing required for the ART. However, decision times for incorrect responses did not follow this trend, with mean decision time in the most transparent agent reasoning condition being shortest of all conditions. This shortening of deliberation time could indicate complacent behavior is occurring in this condition.
CP, as evaluated using the Complacency Potential Rating Scale, and Spatial Orientation Test scores were found to be predictive of performance on the route-selection task, in that individuals with low CP and those with high SO ability were found to score higher on the route-selection task overall. There were also performance differences due to Perceived Attentional Control; individuals with higher PAC had better performance on the route-selection task in all ART conditions. When considered together, these findings support the notion that automation bias is, at least to some degree, an issue stemming from attention-resource issues (Parasuraman and Manzey 2010).
Participant trust in the agent was assessed objectively by evaluating incorrect rejections of the agent’s suggestions and subjectively using the Usability and Trust

Approved for public release; distribution is unlimited. 87
Survey. As in EXP1, the objective measure of operator trust indicated no difference in trust due to ART. However, unlike EXP1, the subjective measures also indicated no difference in trust or perceived usability due to ART. The CP, as evaluated using the CPRS, was found to be predictive of operator trust as evaluated via incorrect rejections and scores on the Usability and Trust Survey. Individuals with low CP were found to have fewer incorrect rejections of the agent recommendation overall and reported higher trust and usability of the agent than their high-CP counterparts. However, there was no difference in incorrect rejections, trust, or usability evaluations across ART conditions between high- and low-CP individuals, which indicates these findings were not affected by the presence (or lack thereof) of ART.
Participant workload was expected to increase as ART increased. However, this hypothesis was not supported. Workload was evaluated using the NASA-TLX and several ocular indices that have been shown to be informative as to cognitive workload. Global NASA-TLX scores decreased as ART increased, but such changes were not significant. Pupil diameter also decreased as ART increased, indicating overall cognitive workload decreased as ART increased. Participant PDia was larger in the information-only condition compared to the ART conditions, indicating the presence of ART reduced cognitive workload. This finding contradicts our stated hypothesis. Fixation Count and Fixation Duration did not differ significantly among the 3 ART levels, indicating no difference in cognitive workload.
Similar to global scores, Mental Demand and Physical Demand were greater in ART1 than in ARTs 2 or 3, suggesting the access to agent reasoning reduced cognitive workload. The ratings for NASA-TLX Temporal Demand and Effort were higher in ART1 than in either ART2 or 3, albeit not significantly different, which would support the MD ratings. Interestingly, participants also reported higher satisfaction in their Performance in ART2 than in ART3. Although participants reported greater MD in ART2 than in ART3, they also stayed more engaged in the task as indicated by their increased decision times for incorrect responses, resulting in higher performance ratings. Alternatively, the addition of the recency information in ART3 created an overwork condition for the operator, which encouraged complacent behavior. The combination of decreased satisfaction in their performance and reduced DTs for incorrect responses in ART3 could indicate an OOTL situation.
Situation Awareness scores were hypothesized to improve with access to agent reasoning—with the exceptions of SA1 and SA3 scores in ART3. In this study, SA1 scores evaluated how well the participant maintained a general awareness of their environment. The additional context gained by access to agent reasoning would make certain events and situations more salient, which in turn would lead to

Approved for public release; distribution is unlimited. 88
improved performance on the route-selection task (Hancock and Diaz 2002). However, increased access to agent transparency was expected to overwhelm the participant, leading to a decline in SA1 and SA3 scores. The hypotheses were not supported; SA scores did not improve with access to agent reasoning nor did they vary across ART levels. In a high-information environment, access to agent reasoning does not appear to affect operator SA. These results offer limited support for EXP1 findings in which access to agent reasoning does little to improve SA.
While there were no differences in SA because of agent reasoning access, there were notable distinctions in SA scores for several ID factors. Low-CP individuals overall had higher SA1 scores than their high-CP counterparts in all ART levels, which could be due to reduced trust in the agent encouraging them to monitor their surroundings more carefully (Pop et al. 2015)—in effect, supervising the agent. High-WMC individuals had higher SA2 scores across all ART levels than their low-WMC counterparts, demonstrating their improved ability to assimilate the information from various sources into a coherent understanding (Wickens and Holland 2000). Low-WMC individuals’ SA2 scores were lowest in ART2, which could indicate the access to agent reasoning overtasked them. High spatial orientation (SO) individuals had higher SA2 scores when ART was available than their low-SO counterparts. While both groups had similar SA2 scores in the absence of agent reasoning, when access to agent reasoning became available the high-SO individuals’ SA2 scores improved while the low-SO individuals’ SA2 scores decreased. Gugerty and Brooks (2004) found that high-SO individuals were better able to overlook slight disparities in reference-frame alignments. This ability could explain why high-SO individuals appear to have increased skill when combining information from several sources (one of which being a map of the area) into a comprehensive understanding of the environment surrounding the convoy’s route.
Access to agent reasoning appeared to have little influence on performance in the target-detection task. The number of targets detected in ART3 was significantly lower than the other 2 conditions, indicating that increased ART interfered with this task. However, access to agent reasoning had no effect on the number of FAs reported. The SDT was used to evaluate whether access to agent reasoning had any effect on sensitivity or selection criteria. There was no significant difference in either sensitivity to targets, assessed as d’, or selection criteria, assessed as Beta, across ART levels. In an information-rich environment, ART appears to have no effect on sensitivity to targets or target-selection criteria.
As in EXP1, a potential limitation of this work could be the added time information in ART3. Participants in that agent reasoning condition were instructed that the time reflected when the agent received the information upon which it based its recommendation; however, they were not instructed how they should use that

Approved for public release; distribution is unlimited. 89
information in their deliberations. Thus, this information could have appeared ambiguous to the participants and there could be variability in how they factored this information into their decision based upon their personal experience.
4.6 Conclusion
The findings of the present study are important for the design of intelligent recommender and decision-aid systems. Keeping the operator engaged and in the loop is important for reducing complacency that could allow lapses in system reliability to go unnoticed. To that end, we examined how agent reasoning transparency affected complacent behavior, as well as task performance, workload, and trust when the operator had complete information about their task environment.
Access to agent reasoning was found to have little effect on complacent behavior when the operator has complete information about the task environment. However, the addition of information that created ambiguity for the operator appeared to encourage complacency, as indicated by reduced performance and shorter DTs. ART did not increase overall workload, which agrees with previous studies (Mercado et al. 2015), and operators reported higher satisfaction with their performance and reduced mental demand. Contrary to findings previously reported by Helldin et al. (2014) and Mercado et al. (2015), access to agent reasoning did not improve operators’ secondary-task performance, SA, or operator trust. However, this access did not have a negative effect until transparency increased to such a level as to include ambiguous information, thus encouraging complacency. As such, these findings suggest that when the operator has complete information regarding their task environment, access to agent reasoning may be beneficial but not dramatically so. However, ART that includes ambiguous information does have negative effects; as such, the amount of transparency and the type of information conveyed to the operator should be carefully considered.
5. Comparison of EXP1 and EXP2
5.1 Objective
Results from Experiments 1 and 2 were compared to evaluate how differences in the level of information available to the operator interacted with access to the agents’ reasoning and uncertainty information. In ART1, the only difference between EXP1 and EXP2 was the amount of information the participant received via the map icons. In ARTs 2 and 3, ART was similar between the 2 experiments in that participants were shown the agent reasoning equating to each map icon; there were simply more icons in EXP2 to explain. However, in EXP2 participants

Approved for public release; distribution is unlimited. 90
were also told how the agent factored each piece of information into its recommendation via the weighing factor; thus, there was a slight increase in ART in ARTs 2 and 3 compared to EXP1.
5.2 Stated Hypotheses
5.2.1 Complacent Behavior, Primary Task Performance, Trust in the Agent
We hypothesize that complacent behavior in the high-information environment (EXP2) will be lower than in the low-information environment (EXP1) in the absence of agent reasoning (ART1). The additional information should help the participant successfully maneuver their environment more safely. The presence of agent reasoning (ART2) will assist the operator in understanding the additional environmental information, resulting in reduced incorrect acceptances in the high-information environment (EXP2) from the low-information environment (EXP1). However, the increase in agent reasoning transparency (ART3) will overload the operator; as a result, incorrect acceptances will be greater in the high-information environment (EXP2) than in the low-information environment (EXP1).
Hypothesis 1: Incorrect acceptances will be lower in EXP2 than in EXP1 in ART1 (EXP1 > EXP2), as the additional environmental information will reduce the operator’s dependency on the agent’s recommendations. In ART2, incorrect acceptances will be lower in EXP2 than in EXP1 due to the presence of agent reasoning (EXP1 > EXP2). In ART3, incorrect acceptances will be higher in EXP2 than in EXP1 (EXP1 < EXP2) due to overloading the operator with information.
Hypothesis 2: Performance (number of correct rejections and acceptances) on the route-selection task in EXP2, compared to EXP1, will be
• Lower in ART1 due to increased environmental information without access to agent reasoning (EXP1 > EXP2).
• Greater in ART2 due to access to agent reasoning, (EXP1 < EXP2).
• Lower in ART3 due to information overload as a result of the increase in transparency of the agent reasoning, which included ambiguous information (EXP1 > EXP2).
In all conditions, time to decide on the route-selection task will be higher in EXP2 than EXP1 (EXP1 < EXP2).
Hypothesis 3: Operator trust in the agent will be greater in EXP2 than in EXP1 for ARTs 1 and 2 (EXP1 < EXP2). However, operator trust will be lower in EXP2 than in EXP1 for ART3 (EXP1 > EXP2).

Approved for public release; distribution is unlimited. 91
5.2.2 Workload
Hypothesis 4: Operator perceived workload will be greater in EXP2 than in EXP1 for all ARTs (EXP1 < EXP2). Inferred measures of workload (i.e., PDia, FC, and FD) will also show increased workload.
5.2.3 SA
Hypothesis 5: The increased environmental information will result in lower SA scores in EXP2 than in EXP1 in ARTs 1 and 3 (EXP1 > EXP2) for SA1 and SA3 measures. SA2 scores will be higher in EXP2 than in EXP1 in ARTs 1 and 2; however, they will be lower in ART3:
• SA1: ARTs 1, 2 and 3: EXP1 > EXP2
• SA2: ARTs 1 and 2: EXP1 < EXP2; ART3: EXP1 > EXP2.
• SA3: ARTs 1, 2 and 3: EXP1 > EXP2
5.2.4 Target-Detection Task Performance
Hypothesis 6: Performance in the target-detection task, in both targets detected and FAs, will be worse in EXP2 than in EXP1 in all ARTs due to information overload.
• Number of targets detected: EXP1 > EXP2
• False alarms: EXP1 < EXP2.
5.3 Results
Data were examined using independent samples t-tests (α = 0.05) within each ART level between EXP1 and EXP2. Equal variances between groups were not assumed. Specifically, ART1 was compared to ART1, ART2 to ART2, and ART3 to ART3 for each measure of interest. Means, SD, SE, and 95% CI are reported for each measure.
5.3.1 Complacent Behavior, Primary Task Performance, Trust in the Agent
5.3.1.1 Complacent-Behavior Evaluation
Hypothesis 1: Incorrect acceptances will be lower in EXP2 than in EXP1 in ART1 (EXP1 > EXP2) as the additional environmental information will reduce the operator’s dependency on the agent’s recommendations. In ART2, incorrect acceptances will be lower in EXP2 than in EXP1 due to the presence of agent

Approved for public release; distribution is unlimited. 92
reasoning (EXP1 > EXP2). In ART3, incorrect acceptances will be higher in EXP2 than in EXP1 (EXP1 < EXP2) due to overloading of the operator with information.
Descriptive statistics for incorrect acceptances and EXP1–EXP2 t-test results are shown in Table 27.
Table 27 Descriptive statistics for incorrect acceptances sorted by experiment for each ART level, and t-test results for between-experiment comparisons
N Mean SD SE 95% CI for mean df t p Cohen’s
d
ART1 EXP1 20 3.25 2.27 0.51 (2.19, 4.31)
27.6 4.03 <.001 1.35 EXP2 20 0.98 1.11 0.25 (0.46, 1.49)
ART2 EXP1 20 1.15 1.31 0.29 (0.54, 1.76)
33.9 0.70 .488 0.23 EXP2 20 0.90 0.91 0.20 (0.47, 1.33)
ART3 EXP1 20 2.65 2.32 0.52 (1.56, 3.74) 34.2 1.81 .079 0.58 EXP2 20 1.50 1.64 0.37 (0.73, 2.27)
Evaluating incorrect acceptances between experiments shows that, overall, more incorrect acceptances occurred in EXP1 than EXP2 (see Fig. 44). There was a significant correlation between experiment and the number of incorrect acceptances regardless of ART, r = –0.26, p = 0.013. In ART1, which had no agent reasoning available for the operator, there were fewer incorrect acceptances in EXP2 than EXP1. This supports the hypothesis and is strong evidence that operator knowledge of the task environment can reduce complacent behavior even in the absence of agent reasoning. As predicted, incorrect acceptances were also lower in EXP2 than in EXP1 in ART2. However, this result was not statistically significant. It was expected that the increased ART in ART3 would overwhelm the operator in EXP2, resulting in higher incorrect acceptances. However, this was not the case. Although EXP2 mean scores in ART3 were greater than those in ARTs 1 or 2, indicating the increased transparency was not without its cost, scores were significantly lower than in EXP1. Overall, these findings are evidence of the importance of information in addition to ART for reducing the complacent behavior.
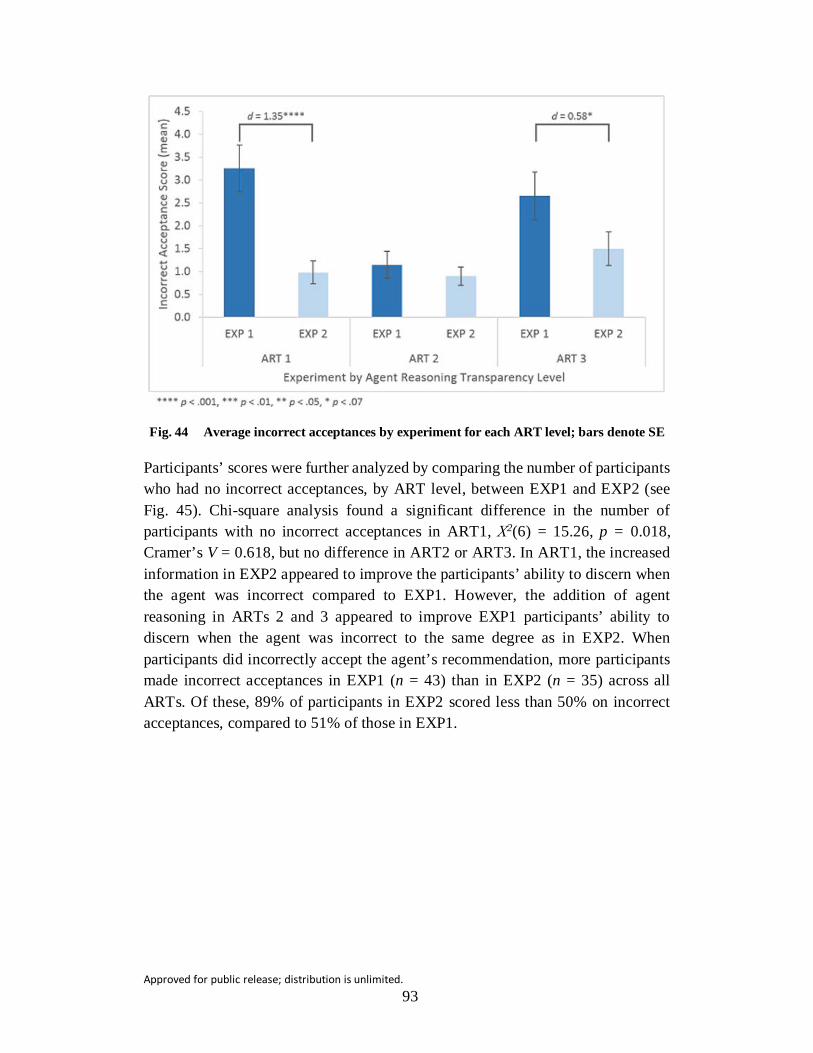
Approved for public release; distribution is unlimited. 93
Fig. 44 Average incorrect acceptances by experiment for each ART level; bars denote SE
Participants’ scores were further analyzed by comparing the number of participants who had no incorrect acceptances, by ART level, between EXP1 and EXP2 (see Fig. 45). Chi-square analysis found a significant difference in the number of participants with no incorrect acceptances in ART1, Χ2(6) = 15.26, p = 0.018, Cramer’s V = 0.618, but no difference in ART2 or ART3. In ART1, the increased information in EXP2 appeared to improve the participants’ ability to discern when the agent was incorrect compared to EXP1. However, the addition of agent reasoning in ARTs 2 and 3 appeared to improve EXP1 participants’ ability to discern when the agent was incorrect to the same degree as in EXP2. When participants did incorrectly accept the agent’s recommendation, more participants made incorrect acceptances in EXP1 (n = 43) than in EXP2 (n = 35) across all ARTs. Of these, 89% of participants in EXP2 scored less than 50% on incorrect acceptances, compared to 51% of those in EXP1.

Approved for public release; distribution is unlimited. 94
Fig. 45 Between-experiment comparisons of the number of participants who had no incorrect acceptances in each ART level
Decision time for responses on the route-selection task at those locations where the agent recommendation was incorrect was evaluated. It was hypothesized that DT would increase as ART increased, and DTs in EXP2 would be longer than those in EXP1, as participants should require additional time to process the extra information. Thus, reduced time could indicate less time spent in deliberation, which could be an indication of complacent behavior. Descriptive statistics for DTs and EXP1–EXP2 t-test results are shown in Table 28.
Table 28 Descriptive statistics for average DT at those locations where the agent recommendation is incorrect sorted by experiment for each ART level, and t-test results for between-experiment comparisons
N Mean SD SE 95% CI for mean df t p Cohen’s
d
ART1 EXP1 20 7.63 3.10 0.69 (6.18, 9.08) 36.9 –3.27 0.002 1.04 EXP2 20 11.14 3.68 0.82 (9.42, 12.87)
ART2 EXP1 20 7.20 2.77 0.62 (5.91, 8.50) 36.7 –4.43 <0.001 1.41 EXP2 20 11.51 3.35 0.75 (9.94, 13.08)
ART3 EXP1 20 7.89 3.01 0.67 (6.48, 9.30) 35.5 –3.97 <0.001 1.27 EXP2 20 12.30 3.96 0.89 (10.45, 14.16)
Evaluating DTs at those locations where the agent recommendation was incorrect between experiments shows that participants took longer deliberating in EXP2 than EXP1 (see Fig. 46) across all ARTs, which supports the hypothesis. This difference was smallest in ART1 (ΔM = 3.52) and larger when ART was present (ART2, ΔM = 4.31; ART3, ΔM = 4.42). Participants took longer to reach their decisions in

Approved for public release; distribution is unlimited. 95
EXP2 than in EXP1, most likely due to the increased environmental information and increased agent reasoning.
Fig. 46 Average DT in seconds for participant responses at decision points where the agent recommendation was incorrect sorted by experiment for each ART level; bars denote SE
It is interesting that in ART3, when ART was at its highest, DT was the roughly the same as in ART2. In order to understand this lack of difference, DTs were also evaluated by correct/incorrect responses. In Table 29, DTs are sorted by correct rejections, incorrect acceptances, and experiment for each ART level; further, t-test results are included for between-experiment comparisons.
Table 29 Descriptive statistics for DTs (in seconds) for participant responses at decision points where the agent recommendation was incorrect
N Mean SD SE df t p Cohen’s d
Cor
rect
re
ject
ions
ART1 EXP1 14 8.96 8.69 2.32 32.0 –0.98 0.337 0.34 EXP2 20 11.15 4.25 0.95
ART2 EXP1 20 7.49 3.17 0.71 38.0 –3.73 0.001 1.18 EXP2 20 11.25 3.19 0.71
ART3 EXP1 18 8.14 3.47 0.82 36.0 –3.36 0.002 1.12 EXP2 20 12.94 5.09 1.14
Inco
rrect
ac
cept
ance
s ART1 EXP1 18 8.72 4.88 1.15 27.0 –1.73 0.096 0.65 EXP2 11 12.17 5.76 1.74
ART2 EXP1 11 6.09 1.76 0.53 14.6 –5.91 <0.001 2.65 EXP2 12 14.37 4.49 1.30
ART3 EXP1 14 8.94 5.27 1.41 24.0 –2.01 0.056 0.82 EXP2 12 15.70 11.23 3.24

Approved for public release; distribution is unlimited. 96
Response times for both correct rejections and incorrect acceptances were significantly longer in EXP2 than EXP1 in all ARTs. However, the differences in response times between EXP1 and EXP2 were greater for the incorrect responses than the associated correct responses in each ART (see Fig. 47). There was no significant difference in response times between experiments for the notification-only condition, indicating the increase in information alone did not result in an associated increase in DT, regardless of correct or incorrect status. Considered along with the reduced number of incorrect acceptances in EXP2, this could be evidence that information alone appears to be effective at mitigating complacent behavior. For correct rejections, differences in response time for the agent reasoning conditions were similar but longer than the response time for the notification-only condition. Response times for incorrect acceptances were considerably longer than those for correct rejections in the same ARTs, which could be evidence the incorrect responses were due to difficulty integrating all of the available information. In ART3 the difference in response time for incorrect acceptances is considerably longer than that for correct rejections and not significantly different between the 2 experiments. This is mainly due to the increased variability of response times in EXP2 in this ART level. The increased variability could indicate that while some participants erred due to difficulty in assimilating the information, others were exhibiting complacent behavior.
Fig. 47 Differences in mean DTs (EXP2–EXP1) for average DTs (in seconds) for correct rejections and incorrect acceptances, sorted by ART level; asterisk (*) denotes significant difference between experiments
5.3.1.2 Route-Selection Task Performance

Approved for public release; distribution is unlimited. 97
Hypothesis 2: Performance (number of correct rejects and accepts) on the route-selection task in EXP2, compared to EXP1, will be
• Lower in ART1, due to increased environmental information without access to agent reasoning (EXP1 > EXP2).
• Greater in ART2, due to access to agent reasoning, (EXP1 < EXP2).
• Lower in ART3, due to information overload as a result of the increase in transparency of the agent reasoning, which included ambiguous information (EXP1 > EXP2).
In all conditions, time to decide on the route-selection task will be higher in EXP2 than EXP1 (EXP1 < EXP2).
Descriptive statistics for route-selection task scores and EXP1–EXP2 t-test results are shown in Table 30.
Table 30 Descriptive statistics for route-selection task scores sorted by experiment for each ART level, and t-test results for between-experiment comparisons
N Mean SD SE 95% CI for mean df t p Cohen’s
d
ART1 EXP1 20 14.10 2.59 0.58 (12.89, 15.31) 35.2 0.93 0.358 0.30 EXP2 20 13.20 3.46 0.77 (11.58, 14.82)
ART2 EXP1 20 15.90 1.80 0.40 (15.06, 16.74) 30.1 3.18 0.003 1.04 EXP2 20 13.30 3.18 0.71 (11.81, 14.79)
ART3 EXP1 20 14.70 2.81 0.63 (13.38, 16.02) 37.1 1.35 0.187 0.43 EXP2 20 13.40 3.28 0.73 (11.86, 14.94)
Evaluating route-selection scores between experiments makes evident that, overall, scores were higher in EXP1 than in EXP2 (see Fig. 48), although this difference was only significant in ART2. In ART1, which had no agent reasoning available for the operator, and ART3, which had the greatest access to agent reasoning, route-selection scores were essentially the same between the 2 experiments. Increasing the amount of information available to the operator did not improve overall performance on the primary task as predicted, nor did performance improve when agent reasoning transparency was at its highest level. This is evidence that too much access to agent reasoning can have a similar effect on performance as too little. Results in ART2 are contrary to the predicted direction, where performance in EXP2 was expected to be greater than in EXP1. Instead, route-selection scores were significantly higher in EXP1 than in EXP2. These results indicate the combination of high environmental information and access to agent reasoning can have a detrimental effect on task performance.
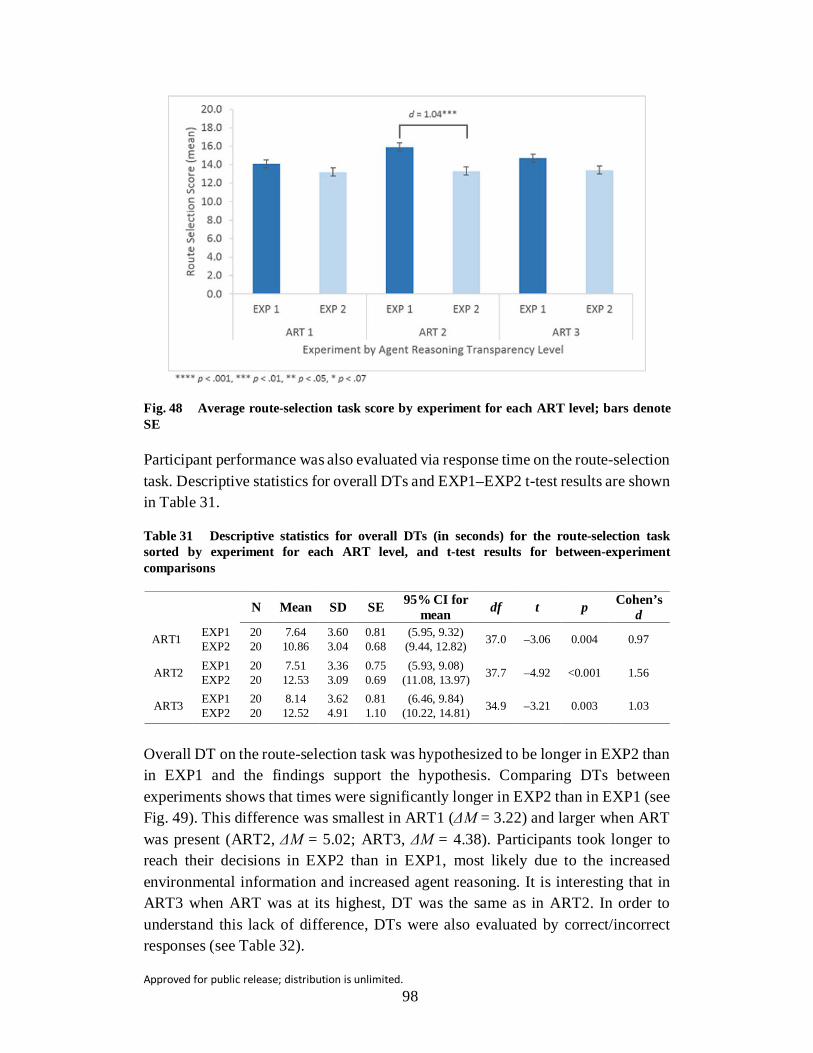
Approved for public release; distribution is unlimited. 98
Fig. 48 Average route-selection task score by experiment for each ART level; bars denote SE
Participant performance was also evaluated via response time on the route-selection task. Descriptive statistics for overall DTs and EXP1–EXP2 t-test results are shown in Table 31.
Table 31 Descriptive statistics for overall DTs (in seconds) for the route-selection task sorted by experiment for each ART level, and t-test results for between-experiment comparisons
N Mean SD SE 95% CI for mean df t p Cohen’s
d
ART1 EXP1 20 7.64 3.60 0.81 (5.95, 9.32) 37.0 –3.06 0.004 0.97 EXP2 20 10.86 3.04 0.68 (9.44, 12.82)
ART2 EXP1 20 7.51 3.36 0.75 (5.93, 9.08) 37.7 –4.92 <0.001 1.56 EXP2 20 12.53 3.09 0.69 (11.08, 13.97)
ART3 EXP1 20 8.14 3.62 0.81 (6.46, 9.84) 34.9 –3.21 0.003 1.03 EXP2 20 12.52 4.91 1.10 (10.22, 14.81)
Overall DT on the route-selection task was hypothesized to be longer in EXP2 than in EXP1 and the findings support the hypothesis. Comparing DTs between experiments shows that times were significantly longer in EXP2 than in EXP1 (see Fig. 49). This difference was smallest in ART1 (ΔM = 3.22) and larger when ART was present (ART2, ΔM = 5.02; ART3, ΔM = 4.38). Participants took longer to reach their decisions in EXP2 than in EXP1, most likely due to the increased environmental information and increased agent reasoning. It is interesting that in ART3 when ART was at its highest, DT was the same as in ART2. In order to understand this lack of difference, DTs were also evaluated by correct/incorrect responses (see Table 32).

Approved for public release; distribution is unlimited. 99
Fig. 49 Average route-selection task score by experiment for each ART level; bars denote SE
Table 32 Descriptive statistics for DTs (in seconds) for the route-selection task sorted by correct and incorrect responses and experiment for each ART level, and t-test results for between-experiment comparisons
N Mean SD SE df t p Cohen’s d
Cor
rect
re
ject
ions
ART1 EXP1 20 7.52 3.50 0.78 38.0 –2.80 0.008 0.89 EXP2 20 10.32 2.79 0.62
ART2 EXP1 20 7.42 3.37 0.75 38.0 –4.23 <0.001 1.34 EXP2 20 11.95 3.40 0.76
ART3 EXP1 20 7.98 3.33 0.74 38.0 –3.42 0.002 1.04 EXP2 20 12.10 4.60 1.03
Inco
rrect
ac
cept
ance
s ART1 EXP1 18 8.85 5.38 1.27 36.0 –2.40 0.022 0.78 EXP2 20 13.06 5.39 1.21
ART2 EXP1 17 8.44 4.20 1.02 34.0 –4.67 <0.001 1.57 EXP2 19 15.58 4.89 1.12
ART3 EXP1 14 9.16 5.20 1.39
29.0 –2.16 0.039 0.82 EXP2 17 14.77 8.46 2.05
Response times for both correct and incorrect responses were significantly longer in EXP2 than EXP1 in all ARTs. However, the differences in response times between EXP1 and EXP2 were greater for the incorrect responses than the associated correct responses in each ART (see Fig. 50). For correct responses, the difference in response time for the agent reasoning conditions was similar but longer than the response time for the notification-only condition. Response times for incorrect responses were longer than those for correct responses in the same ARTs, which could be evidence the incorrect responses were due to difficulty integrating all of the available information. The reduced route-selection score along

Approved for public release; distribution is unlimited. 100
with the increased DTs in ART2 supports this notion. However, if this were the case, the difference in response times for incorrect responses in ART3 would be at least as long as that in ART2; instead, it is shorter, and there is no difference in route-selection task scores between experiments in ART3. This reduction in response time may indicate some participants exhibited complacent behavior in the highest ART.
Fig. 50 Differences in mean DTs (EXP2–EXP1) for average DTs (in seconds) for correct and incorrect responses sorted by ART level; asterisk denotes significant difference between experiments
5.3.1.3 Operator-Trust Evaluation
Hypothesis 3: Operator trust in the agent will be greater in EXP2 than in EXP1 for ARTs 1 and 2 (EXP1 < EXP2). However, operator trust will be lower in EXP2 than in EXP1 for ART3 (EXP1 > EXP2).
Descriptive statistics for incorrect rejections and EXP1–EXP2 t-test results are shown in Table 33.
Table 33 Descriptive statistics for incorrect rejections sorted by experiment for each ART level, and t-test results for between-experiment comparisons
N Mean SD SE 95% CI for mean df t p Cohen’s
d
ART1 EXP1 20 0.75 1.14 0.26 (0.19, 1.26) 23.0 –3.68 <0.001 1.31 EXP2 20 3.75 3.49 0.78 (2.12, 5.39)
ART2 EXP1 20 0.93 0.77 0.17 (0.57, 1.28) 21.9 –4.48 <0.001 1.63 EXP2 20 3.80 2.76 0.62 (2.51, 5.09)
ART3 EXP1 20 0.34 0.54 0.12 (0.08, 0.59) 20.2 –4.00 <0.001 1.54 EXP2 20 3.10 3.04 0.68 (1.68, 4.52)

Approved for public release; distribution is unlimited. 101
Incorrect rejections of the agent recommendation at those locations where the agent recommendation was correct were evaluated as indicative of operator trust. There were significantly more incorrect rejections in EXP2 than in EXP1 in all ARTs (see Fig. 51). Incorrect rejections in ARTs 1 and 2 were expected to be lower in EXP2 than in EXP1; as such, these findings are contrary to the stated hypothesis. Incorrect rejections in ART3 were expected to be higher in EXP2 than in EXP1 due to the combination of the high-information environment and increased access to ART, and this was supported. Across all ARTs, more participants had no incorrect rejections in EXP1 (33 out of 60) than in EXP2 (11 out of 60). The increased number of incorrect rejections in EXP2 is most likely due to the increase in task-environment information, which was consistent across ARTs.
Fig. 51 Average number of incorrect rejections of agent recommendations by experiment for each ART level; bars denote SE
The DT on the route-selection task for the locations where the agent recommendation was correct was also compared between experiments. It was hypothesized that DT would increase as ART increased and DTs in EXP2 would be longer than those in EXP1 as participants should require additional time to process the extra information. Descriptive statistics for DTs and EXP1–EXP2 t-test results are shown in Table 34.
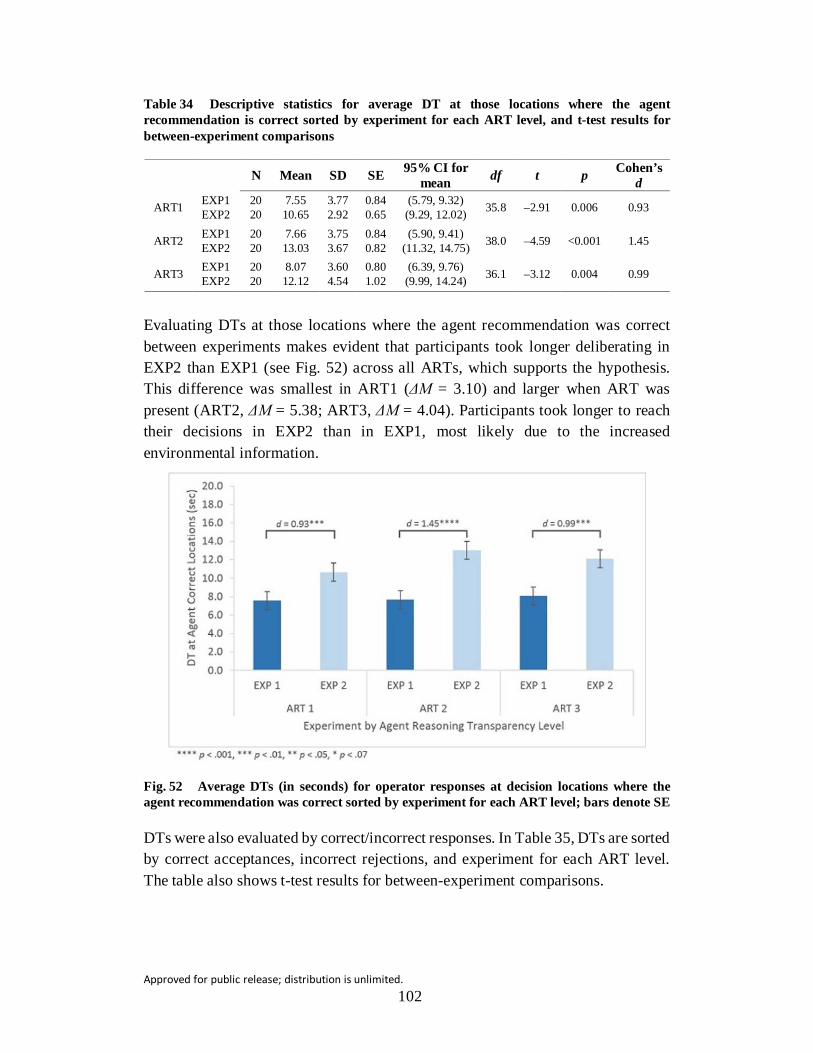
Approved for public release; distribution is unlimited. 102
Table 34 Descriptive statistics for average DT at those locations where the agent recommendation is correct sorted by experiment for each ART level, and t-test results for between-experiment comparisons
N Mean SD SE 95% CI for mean df t p Cohen’s
d
ART1 EXP1 20 7.55 3.77 0.84 (5.79, 9.32) 35.8 –2.91 0.006 0.93 EXP2 20 10.65 2.92 0.65 (9.29, 12.02)
ART2 EXP1 20 7.66 3.75 0.84 (5.90, 9.41) 38.0 –4.59 <0.001 1.45 EXP2 20 13.03 3.67 0.82 (11.32, 14.75)
ART3 EXP1 20 8.07 3.60 0.80 (6.39, 9.76) 36.1 –3.12 0.004 0.99 EXP2 20 12.12 4.54 1.02 (9.99, 14.24)
Evaluating DTs at those locations where the agent recommendation was correct between experiments makes evident that participants took longer deliberating in EXP2 than EXP1 (see Fig. 52) across all ARTs, which supports the hypothesis. This difference was smallest in ART1 (ΔM = 3.10) and larger when ART was present (ART2, ΔM = 5.38; ART3, ΔM = 4.04). Participants took longer to reach their decisions in EXP2 than in EXP1, most likely due to the increased environmental information.
Fig. 52 Average DTs (in seconds) for operator responses at decision locations where the agent recommendation was correct sorted by experiment for each ART level; bars denote SE
DTs were also evaluated by correct/incorrect responses. In Table 35, DTs are sorted by correct acceptances, incorrect rejections, and experiment for each ART level. The table also shows t-test results for between-experiment comparisons.

Approved for public release; distribution is unlimited. 103
Table 35 Descriptive statistics for DTs (in seconds) for participant responses at decision points where the agent recommendation was correct
N Mean SD SE df t p Cohen’s d C
orre
ct
reje
ctio
ns ART1 EXP1 20 8.21 5.82 1.30 38.0 –1.15 0.256 0.38 EXP2 20 9.89 2.91 0.65
ART2 EXP1 20 7.53 3.75 0.84 38.0 –3.79 0.001 1.20 EXP2 20 12.35 4.28 0.96
ART3 EXP1 20 8.04 3.59 0.80 38.0 –2.89 0.006 0.93 EXP2 20 12.10 5.14 1.15
Inco
rrect
ac
cept
ance
s ART1 EXP1 7 10.79 9.82 3.71 21.0 –0.77 0.448 0.32 EXP2 16 13.26 5.57 1.39
ART2 EXP1 14 9.69 4.57 1.22 30.0 –3.54 0.001 1.28 EXP2 18 15.95 5.24 1.24
ART3 EXP1 6 9.62 4.59 1.88 19.0 –2.21 0.242 0.64 EXP2 15 13.20 6.62 1.71
Response times for both correct acceptances and incorrect rejections were longer in EXP2 than EXP1 in all ARTs (see Fig. 53). There was no significant difference in response times between experiments for the notification-only condition (ART1), indicating the increase in information alone did not result in an associated increase in DT regardless of correct or incorrect response status. DTs in ART2 were significantly longer in EXP2 than in EXP1 regardless of correct or incorrect response status. This could indicate more-distrustful behavior, the participant’s level of engagement with the agent, or difficulty integrating the information. However, it is likely the large increase in DT for EXP2 for incorrect rejections is an indication of difficulty integrating the available information.
In ART3, DTs for incorrect rejections were shorter than those for correct acceptances. This difference was significant for correct acceptances. However, there was no significant difference in DTs for incorrect rejections even though there were considerably more incorrect rejections in EXP2 than in EXP1. This could be an indication the incorrect rejections in ART3 were due to an overwork situation rather than difficulty integrating information (i.e., complacent behavior or overtrust).
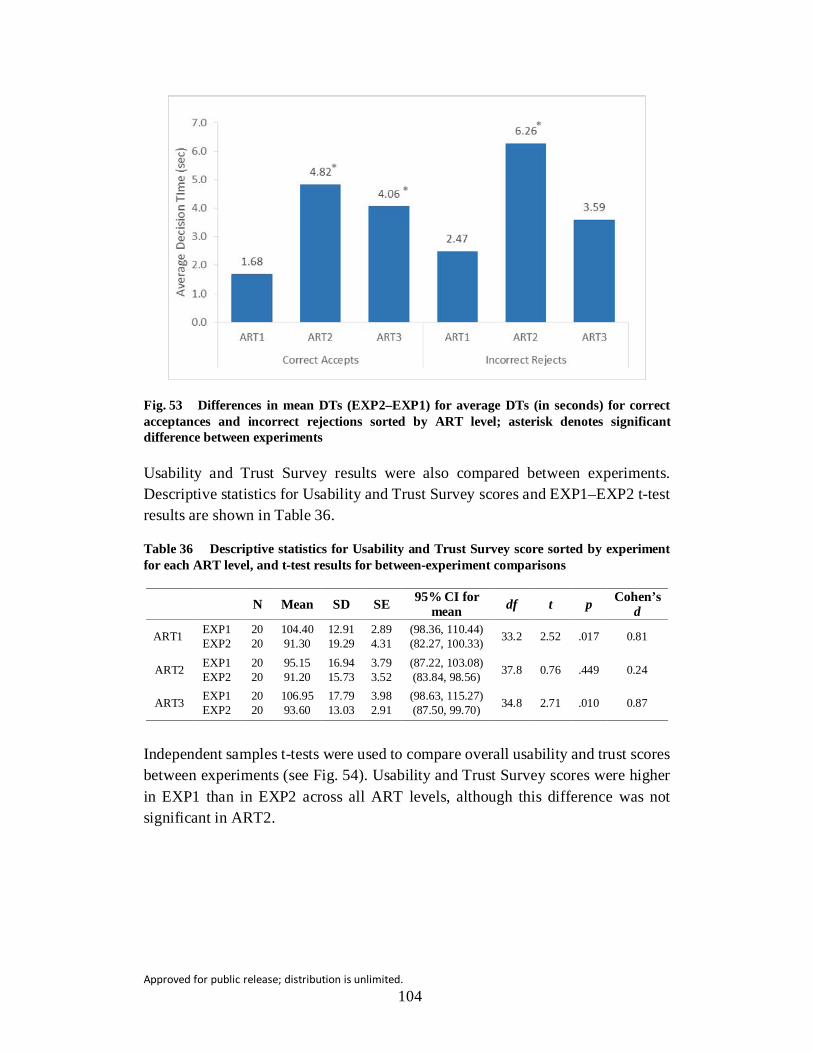
Approved for public release; distribution is unlimited. 104
Fig. 53 Differences in mean DTs (EXP2–EXP1) for average DTs (in seconds) for correct acceptances and incorrect rejections sorted by ART level; asterisk denotes significant difference between experiments
Usability and Trust Survey results were also compared between experiments. Descriptive statistics for Usability and Trust Survey scores and EXP1–EXP2 t-test results are shown in Table 36.
Table 36 Descriptive statistics for Usability and Trust Survey score sorted by experiment for each ART level, and t-test results for between-experiment comparisons
N Mean SD SE 95% CI for mean df t p Cohen’s
d
ART1 EXP1 20 104.40 12.91 2.89 (98.36, 110.44) 33.2 2.52 .017 0.81 EXP2 20 91.30 19.29 4.31 (82.27, 100.33)
ART2 EXP1 20 95.15 16.94 3.79 (87.22, 103.08) 37.8 0.76 .449 0.24 EXP2 20 91.20 15.73 3.52 (83.84, 98.56)
ART3 EXP1 20 106.95 17.79 3.98 (98.63, 115.27) 34.8 2.71 .010 0.87 EXP2 20 93.60 13.03 2.91 (87.50, 99.70)
Independent samples t-tests were used to compare overall usability and trust scores between experiments (see Fig. 54). Usability and Trust Survey scores were higher in EXP1 than in EXP2 across all ART levels, although this difference was not significant in ART2.

Approved for public release; distribution is unlimited. 105
Fig. 54 Average Usability and Trust Survey score by experiment for each ART level; bars denote SE
Usability survey results were compared between experiments. Descriptive statistics for usability-survey scores and EXP1–EXP2 t-test results are shown in Table 37.
Table 37 Descriptive statistics for usability-survey score sorted by experiment for each ART level, and t-test results for between-experiment comparisons
N Mean SD SE 95% CI for mean df t p Cohen’s
d
ART1 EXP1 20 46.75 5.33 1.19 (44.26, 49.24) 35.1 3.20 0.003 1.02 EXP2 20 40.35 7.18 1.61 (36.99, 43.71)
ART2 EXP1 20 40.75 6.60 1.48 (37.66, 43.84) 37.7 0.65 0.520 0.21 EXP2 20 39.45 6.05 1.35 (36.62, 42.28)
ART3 EXP1 20 46.20 5.90 1.32 (43.44, 48.96) 38.0 2.51 0.017 0.79 EXP2 20 41.60 5.70 1.27 (38.93, 44.27)
Examining the usability scores separately from the trust-survey scores, there is a significant difference in perceived usability between the 2 experiments. Usability scores were higher for EXP1 than EXP2 in ARTs 1 and 3 (see Fig. 55). This indicates the extra information provided in EXP2 affected the operator perception of agent usability in these ARTs. However, this appears to have been mitigated in ART2, where there was no significant difference in evaluation between the 2 experiments.
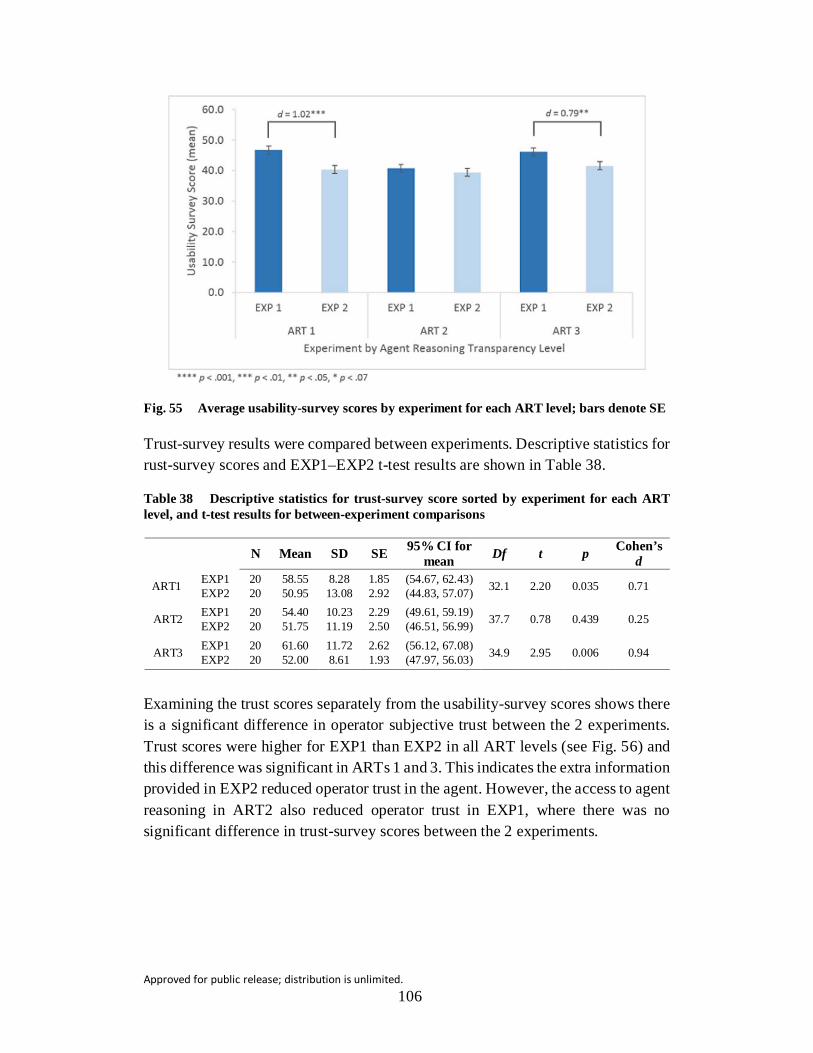
Approved for public release; distribution is unlimited. 106
Fig. 55 Average usability-survey scores by experiment for each ART level; bars denote SE
Trust-survey results were compared between experiments. Descriptive statistics for rust-survey scores and EXP1–EXP2 t-test results are shown in Table 38.
Table 38 Descriptive statistics for trust-survey score sorted by experiment for each ART level, and t-test results for between-experiment comparisons
N Mean SD SE 95% CI for mean Df t p Cohen’s
d
ART1 EXP1 20 58.55 8.28 1.85 (54.67, 62.43) 32.1 2.20 0.035 0.71 EXP2 20 50.95 13.08 2.92 (44.83, 57.07)
ART2 EXP1 20 54.40 10.23 2.29 (49.61, 59.19) 37.7 0.78 0.439 0.25 EXP2 20 51.75 11.19 2.50 (46.51, 56.99)
ART3 EXP1 20 61.60 11.72 2.62 (56.12, 67.08) 34.9 2.95 0.006 0.94 EXP2 20 52.00 8.61 1.93 (47.97, 56.03)
Examining the trust scores separately from the usability-survey scores shows there is a significant difference in operator subjective trust between the 2 experiments. Trust scores were higher for EXP1 than EXP2 in all ART levels (see Fig. 56) and this difference was significant in ARTs 1 and 3. This indicates the extra information provided in EXP2 reduced operator trust in the agent. However, the access to agent reasoning in ART2 also reduced operator trust in EXP1, where there was no significant difference in trust-survey scores between the 2 experiments.

Approved for public release; distribution is unlimited. 107
Fig. 56 Average trust-survey scores by experiment for each ART level; bars denote SE
5.3.2 Workload Evaluation
Hypothesis 4: Operator perceived workload will be greater in EXP2 than in EXP1 for all ARTs (EXP1 < EXP2). Objective measures of workload (i.e., PDia, FC, and FD) will also show increased workload.
Operator perceived workload was evaluated using the NASA-TLX workload survey and results were compared between experiments. Descriptive statistics for global NASA-TLX scores and EXP1–EXP2 t-test results are shown in Table 39.
Table 39 Descriptive statistics for global NASA-TLX scores sorted by experiment for each ART level, and t-test results for between-experiment comparisons
N Mean SD SE 95% CI for mean df t p Cohen’s
d EXP1 20 64.70 13.47 3.01 (58.40, 70.01) 36.4 –0.60 0.550 0.19 EXP2 20 67.03 10.87 2.43 (61.95, 72.12) EXP1 20 65.19 12.38 2.77 (59.39, 70.98) 37.6 0.58 0.569 0.18 EXP2 20 62.80 13.89 3.08 (56.35, 69.25) EXP1 20 60.70 14.01 3.13 (54.15, 67.26) 36.7 –0.19 0.848 0.06 EXP2 20 61.48 11.58 2.59 (56.06, 66.90)
Using independent samples t-tests to compare findings, no significant difference in global NASA-TLX scores was found between experiments (see Fig. 57).

Approved for public release; distribution is unlimited. 108
Fig. 57 Average global NASA-TLX score by experiment for each ART level; bars denote SE
Cognitive workload was also evaluated using several ocular indices and results were compared between experiments. Descriptive statistics for PDia, FC, and FD and EXP1–EXP2 t-test results are shown in Tables 40, 41, and 42, respectively.
Table 40 Descriptive statistics for PDia sorted by experiment for each ART level, and t-test results for between-experiment comparisons
N Mean SD SE 95% CI for mean Df t p Cohen’s
d
ART1 EXP1 19 3.74 0.31 0.07 (3.58, 3.94) 25.7 –0.20 0.844 0.07 EXP2 18 3.77 0.58 0.14 (3.48, 4.06)
ART2 EXP1 20 3.62 0.35 0.08 (3.46, 3.78) 34.8 1.79 0.082 0.59 EXP2 17 3.43 0.32 0.08 (3.26, 3.59)
ART3 EXP1 19 3.51 0.40 0.09 (3.31, 3.70) 34.0 0.23 0.820 0.08 EXP2 17 3.48 0.36 0.09 (3.29, 3.66)

Approved for public release; distribution is unlimited. 109
Table 41 Descriptive statistics for FC sorted by experiment for each ART level, and t-test results for between-experiment comparisons
N Mean SD SE 95% CI for mean df t p Cohen’s
d
ART1 EXP1 19 4830.81 689.30 158.14 (4498.58,
5163.04) 34.9 –0.16 .877 0.05 EXP2 18 4864.48 620.01 146.14 (4556.16,
5172.80)
ART2 EXP1 20 5109.85 819.94 183.34 (4726.10,
5493.59) 35.0 0.64 .526 0.21 EXP2 17 4949.58 701.14 170.05 (4589.09,
5310.07)
ART3 EXP1 19 4897.41 667.18 153.06 (4575.84,
5218.98) 33.4 –0.43 .667 0.15 EXP2 17 4995.22 680.51 165.05 (4645.33,
5345.10)
Table 42 Descriptive statistics for FD sorted by experiment for each ART level, and t-test results for between-experiment comparisons
N Mean SD SE 95% CI for mean df t p Cohen’s
d
ART1 EXP1 19 260.82 40.24 9.23 (241.43, 280.22) 35.0 –1.42 0.165 0.47 EXP2 18 279.20 38.57 9.09 (260.01, 298.38)
ART2 EXP1 20 276.59 37.11 8.30 (259.23, 293.96) 31.7 0.95 0.351 0.32 EXP2 17 263.89 43.44 10.54 (241.55, 286.22)
ART3 EXP1 19 267.18 38.98 8.94 (248.39, 285.97) 33.9 –0.38 0.709 0.13 EXP2 17 271.67 32.62 7.91 (254.90, 288.44)
Using independent samples t-tests to compare findings, no significant difference in workload between experiments was found for any agent reasoning transparency level, as evaluated using eye-measure metrics.
5.3.3 SA Evaluation
Hypothesis 5: The increased environmental information will result in lower SA scores in EXP2 than in EXP1 in ARTs 1 and 3 (EXP1 > EXP2) for SA1 and SA3 measures. SA2 scores will be higher in EXP2 than in EXP1 in ARTs 1 and 2; however, SA2 scores will be lower in ART3:
SA1: ARTs 1, 2, and 3: EXP1 > EXP2.
SA2: ARTs 1 and 2: EXP1 < EXP2; ART3: EXP1 > EXP2.
SA3: ARTs 1, 2, and 3: EXP1 > EXP2.
Descriptive statistics for SA1 scores and EXP1–EXP2 t-test results are shown in Table 43.

Approved for public release; distribution is unlimited. 110
Table 43 Descriptive statistics for SA1 scores sorted by experiment for each ART level, and t-test results for between-experiment comparisons
N Mean SD SE 95% CI for mean df t p Cohen’s
d
ART1 EXP1 20 1.35 4.93 1.10 (–0.96, 3.66) 37.3 –0.17 0.865 0.05 EXP2 20 1.60 4.31 0.96 (–0.42, 3.62)
ART2 EXP1 20 0.10 5.86 1.31 (–2.64, 2.84) 32.8 –1.37 0.179 0.44 EXP2 20 2.25 3.84 0.86 (0.45, 4.05)
ART3 EXP1 20 3.85 3.65 0.82 (2.14, 5.56) 33.2 1.57 0.125 0.51 EXP2 20 1.55 5.43 1.22 (–0.99, 4.09)
SA1 scores were expected to be lower in EXP2 than in EXP1 in all ART levels. When comparing results from EXP1 to EXP2 it is evident SA1 scores varied widely between experiments and ART levels; however, there were no significant differences between EXP2 and EXP1 at any ART level. The hypothesis was not supported.
Descriptive statistics for SA2 scores and EXP1–EXP2 t-test results are shown in Table 44.
Table 44 Descriptive statistics for SA2 scores sorted by experiment for each ART level, and t-test results for between-experiment comparisons
N Mean SD SE 95% CI for mean df t p Cohen’s
d
ART1 EXP1 20 10.90 4.51 1.01 (8.79, 13.01) 35.1 –3.11 0.004 0.99 EXP2 20 14.80 3.35 0.75 (13.23, 16.37)
ART2 EXP1 20 12.55 3.76 0.84 (10.79, 14.31) 28.8 –0.36 0.722 0.12 EXP2 20 13.20 7.15 1.60 (9.85, 16.55)
ART3 EXP1 20 11.25 4.96 1.11 (8.93, 13.57) 36.1 –2.21 0.034 0.70 EXP2 20 15.20 6.28 1.40 (12.26, 18.14)
SA2 scores were expected to be lower in EXP1 than in EXP2 in ART Levels 1 and 2, but higher in EXP1 than EXP2 in ART3. Comparing results from EXP1 to EXP2, it is evident that SA2 scores were higher in EXP2 than in EXP1 for all ART levels although this difference was not significant in ART2 (see Fig. 58). Thus, the hypothesis was partially supported. The additional environmental information in EXP2 did improve SA2 scores in ART1, compared to EXP1, which supported the hypothesis. In ART3, the high-information environment and the increased access to agent transparency were expected to overload the operator, resulting in lower SA2 scores in EXP2 than in EXP1. However, this was not the case. Participants in EXP2 had higher SA2 scores than their EXP1 counterparts, contrary to the stated hypothesis.
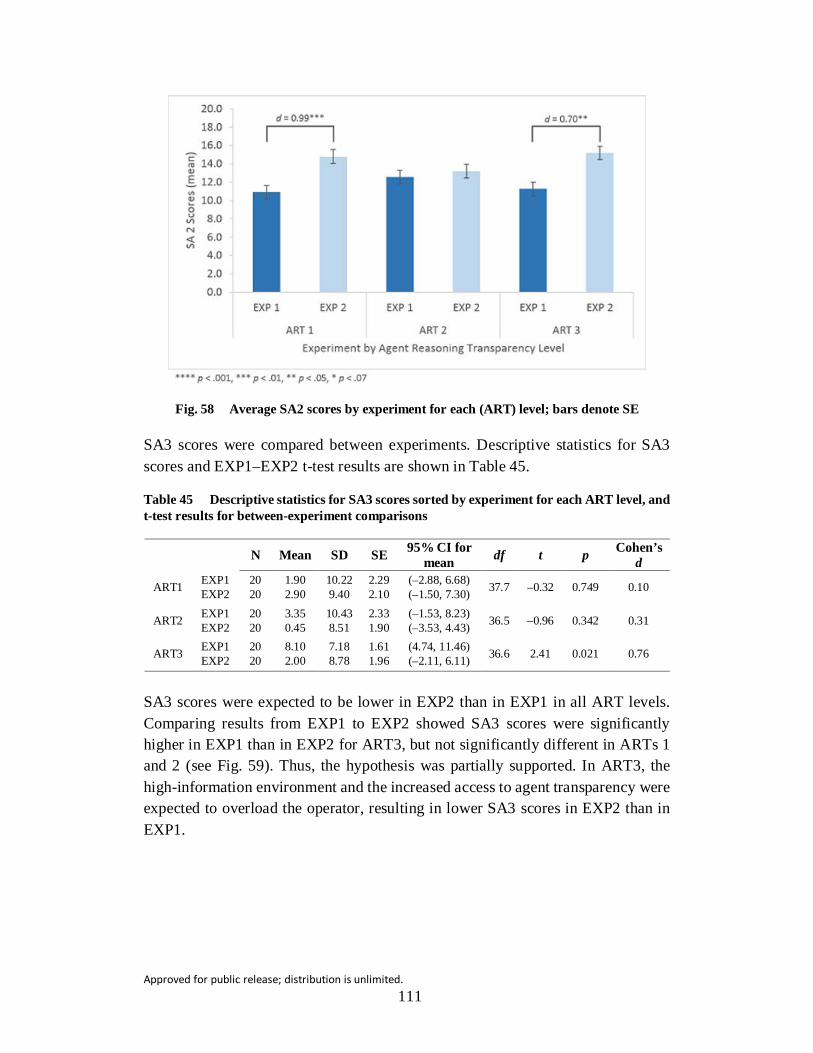
Approved for public release; distribution is unlimited. 111
Fig. 58 Average SA2 scores by experiment for each (ART) level; bars denote SE
SA3 scores were compared between experiments. Descriptive statistics for SA3 scores and EXP1–EXP2 t-test results are shown in Table 45.
Table 45 Descriptive statistics for SA3 scores sorted by experiment for each ART level, and t-test results for between-experiment comparisons
N Mean SD SE 95% CI for mean df t p Cohen’s
d
ART1 EXP1 20 1.90 10.22 2.29 (–2.88, 6.68) 37.7 –0.32 0.749 0.10 EXP2 20 2.90 9.40 2.10 (–1.50, 7.30)
ART2 EXP1 20 3.35 10.43 2.33 (–1.53, 8.23) 36.5 –0.96 0.342 0.31 EXP2 20 0.45 8.51 1.90 (–3.53, 4.43)
ART3 EXP1 20 8.10 7.18 1.61 (4.74, 11.46) 36.6 2.41 0.021 0.76 EXP2 20 2.00 8.78 1.96 (–2.11, 6.11)
SA3 scores were expected to be lower in EXP2 than in EXP1 in all ART levels. Comparing results from EXP1 to EXP2 showed SA3 scores were significantly higher in EXP1 than in EXP2 for ART3, but not significantly different in ARTs 1 and 2 (see Fig. 59). Thus, the hypothesis was partially supported. In ART3, the high-information environment and the increased access to agent transparency were expected to overload the operator, resulting in lower SA3 scores in EXP2 than in EXP1.

Approved for public release; distribution is unlimited. 112
Fig. 59 Average SA3 score by experiment for each ART level; bars denote SE
5.3.4 Target-Detection Task Performance
Hypothesis 6: Performance in the target-detection task, in both targets detected and false alarms, will be worse in EXP2 than in EXP1 in all ARTs due to information overload:
• Number of targets detected: EXP1 > EXP2.
• FAs: EXP1 < EXP2.
Descriptive statistics for target-detection task scores and EXP1–EXP2 t-test results are shown in Table 46.
Table 46 Descriptive statistics for target-detection scores sorted by experiment for each ART level, and t-test results for between-experiment comparisons
N Mean SD SE 95% CI for mean df t p Cohen’s
d
ART1 EXP1 20 44.45 10.10 2.26 (39.72, 49.18) 37.8 –0.24 0.812 0.08 EXP2 20 45.25 10.96 2.45 (40.12, 50.38)
ART2 EXP1 20 45.05 13.64 3.05 (38.66, 51.44) 36.0 –0.67 0.507 0.21 EXP2 20 47.65 10.74 2.40 (42.62, 52.68)
ART3 EXP1 20 44.75 10.19 2.28 (39.98, 49.52) 35.6 1.19 0.242 0.38 EXP2 20 40.30 13.28 2.97 (34.09, 46.51)
Target-detection task scores were expected to be lower in EXP2 than in EXP1 in all ART levels. Comparing results from EXP1 to EXP2 shows target-detection scores were not significantly different in any ART level. Thus, the hypothesis was not supported.
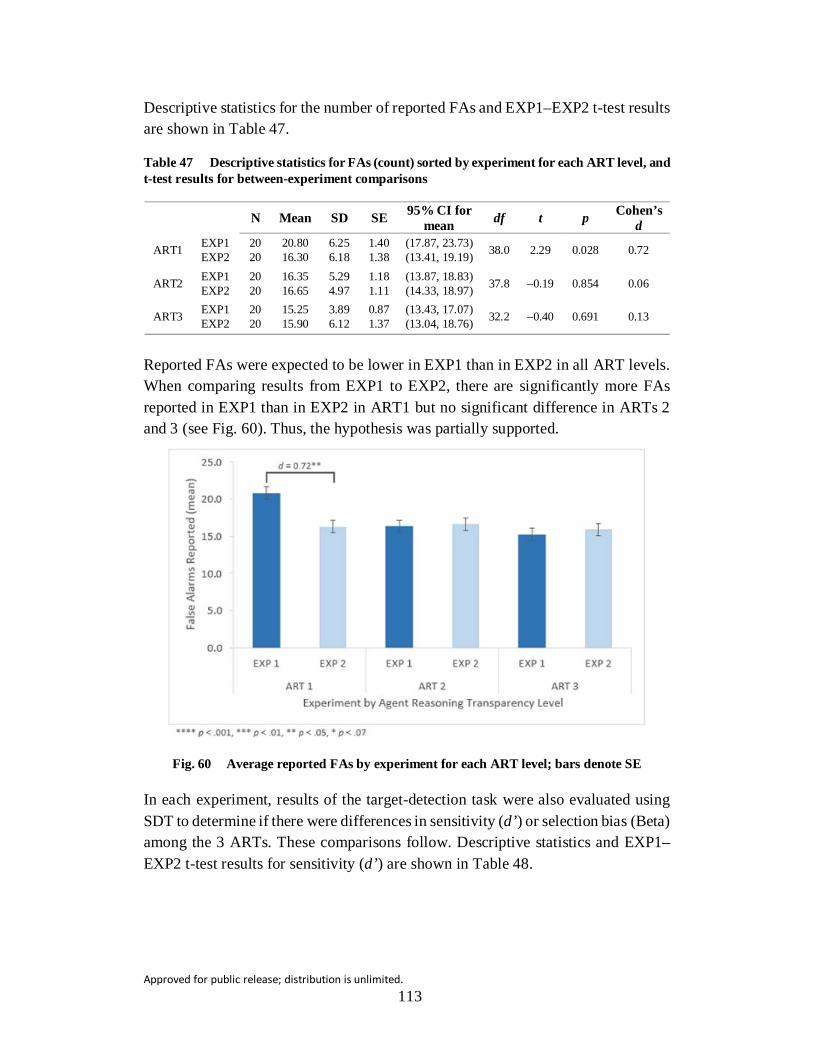
Approved for public release; distribution is unlimited. 113
Descriptive statistics for the number of reported FAs and EXP1–EXP2 t-test results are shown in Table 47.
Table 47 Descriptive statistics for FAs (count) sorted by experiment for each ART level, and t-test results for between-experiment comparisons
N Mean SD SE 95% CI for mean df t p Cohen’s
d
ART1 EXP1 20 20.80 6.25 1.40 (17.87, 23.73) 38.0 2.29 0.028 0.72 EXP2 20 16.30 6.18 1.38 (13.41, 19.19)
ART2 EXP1 20 16.35 5.29 1.18 (13.87, 18.83) 37.8 –0.19 0.854 0.06 EXP2 20 16.65 4.97 1.11 (14.33, 18.97)
ART3 EXP1 20 15.25 3.89 0.87 (13.43, 17.07) 32.2 –0.40 0.691 0.13 EXP2 20 15.90 6.12 1.37 (13.04, 18.76)
Reported FAs were expected to be lower in EXP1 than in EXP2 in all ART levels. When comparing results from EXP1 to EXP2, there are significantly more FAs reported in EXP1 than in EXP2 in ART1 but no significant difference in ARTs 2 and 3 (see Fig. 60). Thus, the hypothesis was partially supported.
Fig. 60 Average reported FAs by experiment for each ART level; bars denote SE
In each experiment, results of the target-detection task were also evaluated using SDT to determine if there were differences in sensitivity (d’) or selection bias (Beta) among the 3 ARTs. These comparisons follow. Descriptive statistics and EXP1–EXP2 t-test results for sensitivity (d’) are shown in Table 48.

Approved for public release; distribution is unlimited. 114
Table 48 Descriptive statistics for d’ scores, sorted by experiment (EXP), for each agent reasoning transparency (ART) level, and t-test results for between-experiment comparisons
N Mean SD SE 95% CI for mean df t p Cohen’s
d
ART1 EXP1 20 2.20 0.32 0.07 (2.05, 2.35) 36.4 –0.85 0.400 0.27 EXP2 20 2.30 0.40 0.09 (2.11, 2.49)
ART2 EXP1 20 2.31 0.43 0.10 (2.11, 2.52) 36.6 –0.49 0.626 0.16 EXP2 20 2.38 0.35 0.08 (2.21, 2.54)
ART3 EXP1 20 2.29 0.38 0.09 (2.11, 2.46) 37.3 0.73 0.467 0.23 EXP2 20 2.19 0.44 0.10 (1.99, 2.39)
Target-detection task scores were expected to be lower in EXP2 than in EXP1 in all ART levels, so it would be expected that sensitivity to target presence would be higher in EXP1 compared to EXP2. Comparing results from EXP1 to EXP2 showed mean d’ scores for EXP2 were higher than those in EXP1 in ARTs 1 and 2, which was contrary to the expected results. However, these results were not significant. The mean d’ scores in ART3 were higher in EXP1 than in EXP2, which was in the expected direction. However, this finding was not significant. Thus, the hypothesis was not supported.
Descriptive statistics and EXP1–EXP2 t-test results for selection bias (Beta) are shown in Table 49.
Table 49 Descriptive statistics for Beta scores sorted by experiment for each ART level, and t-test results for between-experiment comparisons
N Mean SD SE 95% CI for mean df t p Cohen’s
d
ART1 EXP1 20 2.42 0.28 0.06 (2.29, 2.56) 36.8 –2.22 0.033 0.70 EXP2 20 2.64 0.34 0.08 (2.48, 2.80)
ART2 EXP1 20 2.59 0.35 0.08 (2.43, 2.76) 34.0 –0.11 0.912 0.04 EXP2 20 2.60 0.25 0.06 (2.49, 2.72)
ART3 EXP1 20 2.60 0.37 0.08 (2.43, 2.78) 37.9 –0.39 0.701 0.12 EXP2 20 2.65 0.39 0.09 (2.47, 2.83)
The number of reported FAs were expected to be lower in EXP1 than in EXP2 in all ART levels, so it would be expected that selection bias (Beta) would be stricter (higher Beta scores) in EXP1 compared to EXP2. Comparing results from EXP1 to EXP2 makes evident that mean Beta scores for EXP2 were significantly higher than those in EXP1 in ART1. However, there was no significant difference in Beta scores between the 2 experiments in ARTs 2 and 3 (see Fig. 61). The lower Beta scores for EXP1 for ART1 indicate a looser selection criterion was used in this setting, agreeing with the finding that there were more reported FAs in this condition. This is evidence the additional environmental information supplied in EXP2 supported this task, most likely by removing ambiguity for the operator, thus
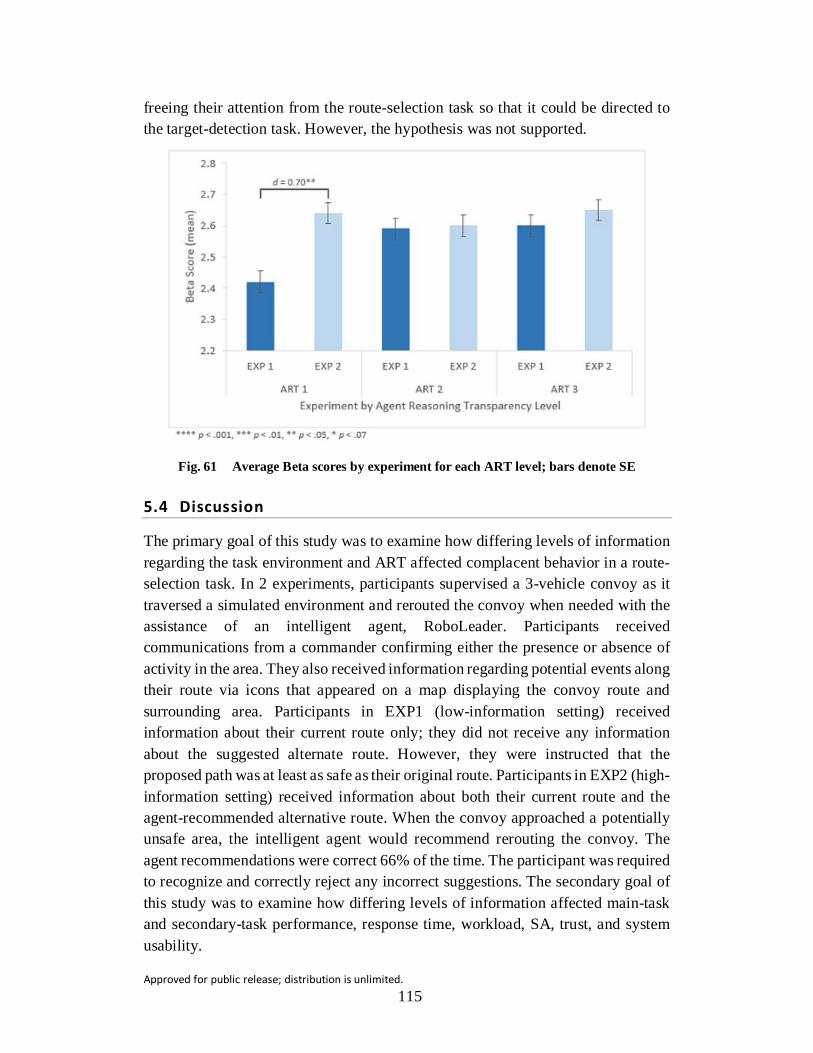
Approved for public release; distribution is unlimited. 115
freeing their attention from the route-selection task so that it could be directed to the target-detection task. However, the hypothesis was not supported.
Fig. 61 Average Beta scores by experiment for each ART level; bars denote SE
5.4 Discussion
The primary goal of this study was to examine how differing levels of information regarding the task environment and ART affected complacent behavior in a route-selection task. In 2 experiments, participants supervised a 3-vehicle convoy as it traversed a simulated environment and rerouted the convoy when needed with the assistance of an intelligent agent, RoboLeader. Participants received communications from a commander confirming either the presence or absence of activity in the area. They also received information regarding potential events along their route via icons that appeared on a map displaying the convoy route and surrounding area. Participants in EXP1 (low-information setting) received information about their current route only; they did not receive any information about the suggested alternate route. However, they were instructed that the proposed path was at least as safe as their original route. Participants in EXP2 (high-information setting) received information about both their current route and the agent-recommended alternative route. When the convoy approached a potentially unsafe area, the intelligent agent would recommend rerouting the convoy. The agent recommendations were correct 66% of the time. The participant was required to recognize and correctly reject any incorrect suggestions. The secondary goal of this study was to examine how differing levels of information affected main-task and secondary-task performance, response time, workload, SA, trust, and system usability.

Approved for public release; distribution is unlimited. 116
Complacent behavior was quantified as incorrect acceptances of agent suggestion (Parasuraman et al. 2000) and evaluated via primary (route-selection) task response at those decision points where the agent recommendation was incorrect. Increased environmental information was predicted to reduce the number of incorrect acceptances except when the agent reasoning included information that may be ambiguous for the operator. This prediction was partially supported, as the number of incorrect acceptances was lower in all ARTs in EXP2 than in EXP1. However, the participants in the high-information setting (in all ART conditions) may have been more inclined to reject the agent suggestion overall, as the information manipulation gave them more reasons to reject than accept (Shafir 1993). As such, the low number of incorrect acceptances in EXP2 is not particularly informative on its own.
In ART2, participants in EXP1 reduced their incorrect acceptances to nearly the same as those in EXP2. Considering that the number of incorrect acceptances for EXP2 were the same in all ARTs, this result underscores how effective the addition of ART was in EXP1 in mitigating complacent behavior. There were also interesting differences in the amount of time it took participants to reach their decisions. Even though there was more information available in EXP2 than in EXP1, participants in EXP2 did not take any more time to respond (whether correctly or incorrectly) to the agent suggestion in ART1 than those in EXP1, which may suggest that the additional route information also encouraged more complacent behavior in the absence of agent reasoning. Decision times were significantly longer in ART2 in EXP2 than those in EXP1, particularly for incorrect acceptances, which were nearly twice as long as their DTs for correct rejections. This could indicate difficulty integrating the information or, more likely, difficulty deciding to accept (albeit incorrectly) the agent suggestion in the face of the additional inducement to reject.
Participants in ART3 in EXP2 also had significantly longer DTs for correct rejections than their EXP1 counterparts. However there was no significant difference in their DTs for incorrect acceptances. Considering the results from the other ARTs, it is reasonable to deduce this lack of difference in DTs could indicate an overwork situation that encouraged more complacent behavior.
Overall performance on the route-selection task was predicted to be worse in the high-information setting, except in ART2, when performance in the high-information setting would be improved. These predictions were not supported; there was no difference in route-selection scores in ARTs 1 or 3 between the 2 experiments and route-selection task scores were lower in ART2 for EXP2 than for EXP1. As previously discussed, these results are most likely due to the added inducement to reject that was present in EXP2. While DTs were longer in EXP2

Approved for public release; distribution is unlimited. 117
than in EXP1 for route-selection choices, these findings were anticipated and did not indicate any supervisory-control issues.
Operator trust of the agent was expected to be greater in EXP2 than in EXP1, except when access to agent reasoning was at its highest (ART3). Incorrect rejections of the agent recommendation when the agent was correct, along with the associated DTs, were assessed as objective indicators of operator trust. There were significantly more incorrect rejections in EXP2 than in EXP1 in all ARTs. The increased number of incorrect rejections in EXP2 is most likely due to the increase in task-environment information, which probably encouraged participants to reject the agent suggestion. Participants took longer deliberating in EXP2 than EXP1 in all ARTs. The difference in DTs between experiments for ART1 was not significant, which could indicate the increase in information alone did not result in any associated increase in DT. In ART2 the DTs were significantly longer in EXP2 than in EXP1, and this difference was twice as long for incorrect rejections as for correct acceptances. Considering this, it is most likely this increase is an indication of difficulty integrating the available information rather than a reflection of the operators trust in the agent. In ART3, the difference in DTs between experiments was significant for correct acceptances. However, there was no significant difference in DTs for incorrect rejections even though there were considerably more incorrect rejections in EXP2 than in EXP1. This could indicate the incorrect rejections in ART3 were due to an overwork situation rather than difficulty integrating information (i.e., complacent behavior or overtrust). Taken as a whole, the objective assessments of operator trust indicate no discernable distrust of the agent. However, there could be indications of overtrust when ART was at its highest.
The Usability and Trust Survey, the subjective measure of operator trust, indicates that in 2 conditions, ART1—when no agent reasoning was available—and ART3—when ART was greatest—operators reported higher trust and greater usability in EXP1 than in EXP2. However, in ART2—when ART was available but contained no information that would be considered ambiguous or subjective—there was no difference in operator trust of reported usability. Therefore, the hypothesis was only partially supported. In the high-information setting, operators appeared to question the agent suggestions more and reported lower trust and usability than in the low-information setting. These findings agree with previous research that found when operators question the agent’s accuracy and rationale they will demonstrate reduced trust and reliance on the agent (Linegang et al. 2006; Lyons and Havig 2014). Operator workload was expected to be greater in the high-information setting than in the low-information setting. However, this hypothesis was not supported. Workload was evaluated using the NASA-TLX and several ocular indices that have

Approved for public release; distribution is unlimited. 118
been shown to be informative as to cognitive workload. Similar to findings by Mercado et al. (2015), there were no significant differences in global NASA-TLX scores or eye-behavior metrics due to information level.
Situation-awareness scores were hypothesized to be lower in the high-information setting than the low-information setting, with the exception of SA2 scores in ART2. There was no difference in SA1 scores between experiments. Contrary to the predicted outcome, SA2 scores were higher in the high-information setting when ART was not available and again when ART was at its highest. However, there was no difference in SA2 scores between experiments in ART2. There was no difference in SA3 scores between the 2 experiments except in the highest ART condition, where scores in the low-information setting were much higher than those in the high-information setting. These findings partially support the hypothesis. Operator comprehension (SA2) benefitted from the increased level of information in EXP2 when ART was not available and again when it was ambiguous.
Performance on the secondary task, target detection, was not different between the 2 experiments. However, the number of FAs was greater in the low-information setting than in the high-information setting when ART was not available. Higher Beta scores indicate participants were using a looser selection criterion in ART1 in the low-information setting than in the high, indicating that having more information about their task environment allowed them to be more discerning when conducting the target-detection task.
There were several limitations to this comparative analysis. First, the ART in EXP2 was arguably greater than that in EXP1, as it contained the weight factors that were not present in EXP1. Therefore, within-condition comparisons contained analysis that attempted to tease apart the effects from the increase in ART from those that resulted from the increase in environmental information. A second limitation would be the study paradigm itself. At each decision point, the participant is not choosing which path to take so much as they are deciding whether to reject the agent suggestion. In EXP1, where there is no other information available about the agent’s recommended route, there is no strong reason to reject the route. However, in EXP2, where the participants receive information about the alternative route, they receive 2 pieces of information as compared to the one piece of information they have about their original route. According to decision theory, this additional information would make it more likely the participant would reject the agent suggestion (Shafir 1993). Thus, the comparison of the effect of information level between the 2 experiments is not equitable. A third limitation is a difference in information between EXP1 and EXP2. In EXP1, the participant is given one piece of information about their main path and no information about the alternative route. In EXP2 the participant is given one piece of information about the main path and
Approved for public release; distribution is unlimited. 119
2 pieces of information about the alternative route. Hence, the comparison is not of the effects of an increase in information as much as it is of the difference between no information and some information. While these limitations do not negate the findings of the comparative analysis, their potential effect on the outcome of this comparison warrants caution in the interpretation of the comparison and generalizing the findings to larger populations.
5.5 Conclusion
Understanding the interaction between the amount of information available to the operator and the transparency of agent reasoning is important to designers of intelligent recommender and decision-aid systems. To that end, we examined how the amount of task-environment information the operator had and the increase in ART affected complacent behavior as well as task performance, workload, and trust.
The amount of information the operator had regarding the task environment had a profound effect on their proper use of the agent. Increased environmental information resulted in more rejections of the agent recommendation regardless of the transparency of agent reasoning. The way in which the information was presented in EXP2 appeared to create a situation wherein operators were encouraged to reject the agent recommendation. Even so, the addition of ART appeared to be effective at countering this bias by keeping the operator engaged.
Objective evidence indicated probable complacent behavior in the high-information setting when agent reasoning was either not transparent or so transparent as to become ambiguous. However, operators reported lower trust and usability for the agent than when environmental information was limited. This suggests dissonance between operator performance and operator perception of the agent.
Situation-awareness (SA2) scores were also higher in the high-information environment when agent reasoning was either not transparent or so transparent as to become ambiguous, compared to the low-information environment. However, when a moderate amount of agent reasoning was available to the operator, the amount of information available had no effect on the operator’s complacent behavior, subjective trust, or SA. These findings indicate some negative outcomes from the incongruous transparency of agent reasoning may be mitigated by increasing the task-environment information the operator has.
Approved for public release; distribution is unlimited. 120
6. References
Ahmed N, de Visser E, Shaw T, Mohamed-Ameen A, Campbell M, Parasuraman R. Statistical modeling of networked human-automation performance using working memory capacity. Ergo. 2014;57(3):295–318.
Barber D, Davis L, Nicholson D, Finkelstein N, Chen JYC. The mixed initiative experimental (MIX) testbed for human robot interactions with varied levels of automation. Proceedings of the 26th Army Science Conference, 2008 Dec 1–4; Orlando, FL. Washington (DC): Department of the Army (US).
Beatty J. Pupil dilation as an index of workload. Arlington (VA): Office of Naval Research (US); 1980 Feb 1. Technical Report No.: 20. www.dtic.mil/cgi-bin/GetTRDoc?AD=ADA088022.
Chapanis A. On the allocation of functions between men and machines. Occ Psy. 1965;39(1):1–11.
Chapman PR, Underwood G. Visual search of driving situations: danger and experience. Perception. 1998;27(8):951–964.
Chen JYC, Barnes MJ. Supervisory control of robots using RoboLeader. Proceedings of the Human Factors and Ergonomics Society 54th Annual Meeting; 2010 Sep 27–Oct 1; San Francisco, CA. Thousand Oaks (CA): Sage Publications; c2010. p. 1483–1487.
Chen JYC, Barnes MJ. Supervisory control of multiple robots: effects of imperfect automation and individual differences. Hum Fact. 2012;54(2):157–174.
Chen JYC, Barnes MJ. Human–agent teaming for multirobot control: a review of human factors issues. IEEE Trans Hum Mach Sys. 2014;44(1):13-29.
Chen JYC, Barnes MJ, Qu Z. RoboLeader: a surrogate for enhancing the human control of a team of robots. Aberdeen Proving Ground (MD): Army Research Laboratory (US); 2010 Feb. Report No.: ARL-MR-0735. http://www.dtic.mil/get-tr-doc/pdf?AD=ADA514855.
Chen JYC, Durlach PJ, Sloan JA, Bowens LD. Human robot interaction in the context of simulated route reconnaissance missions. Mil Psy. 2008;20(3):135–149.
Chen JYC, Joyner CT. Concurrent performance of gunner’s and robotic operator’s tasks in a multi-tasking environment. Mil Psy. 2009;21(1):98–113.
Chen JYC, Procci K, Boyce M, Wright J, Garcia A, Barnes M. Situation awareness-based agent transparency. Aberdeen Proving Ground (MD): Army Research
Approved for public release; distribution is unlimited. 121
Laboratory (US); 2014 Apr. Report No.: ARL-TR-6905. http://www.arl.army .mil/www/default.cfm?technical_report=7066.
Chen JYC, Terrence PI. Effects of imperfect automation and individual differences on concurrent performance of military and robotics tasks in a simulated multitasking environment. Ergo. 2009;52(8):907–920.
Cheverst K, Byun HE, Fitton D, Sas C, Kray C, Villar N. Exploring issues of user model transparency and proactive behaviour in an office environment control system. User Model User Adapt Inter. 2005;15(3–4):235–273.
Cohen S. Aftereffects of stress on human performance and social behavior: a review of research and theory. Psy Bull. 1980;88(1):82.
Cramer H, Wielinga B, Ramlal S, Evers V, Rutledge L, Stash N. The effects of transparency on perceived and actual competence of a content-based recommender. In: Degler D, Schraefel MC, Golbeck, J, Bernstein A, Rutledge L, editors. CHI 2008. Proceedings of the 5th International Workshop on Semantic Web User Interaction; 2008 Apr 5–10; Florence, Italy. CEUR-WS.org; c2009. p. 1–11.
Cring EA, Lenfestey AG. Architecting human operator trust in automation to improve system effectiveness in multiple unmanned aerial vehicles (UAV) control [thesis]. Wright–Patterson AFB (OH): Air Force Institute of Technology, Graduate School of Engineering and Management (US); 2009.
Cuevas HM, Fiore SM, Caldwell BS, Strater L. Augmenting team cognition in human–automation teams performing in complex operational environments. Av Space Env Med. 2007;78(5):B63–B70.
Cummings ML. The need for command and control instant message adaptive interfaces: lessons learned from Tactical Tomahawk human-in-the-loop simulations. Cyber Psy Beh. 2004, 7(6), 653–661.
Daneman M, Carpenter PA. Individual differences in working memory and reading. J Verb Learn Verb Beh. 1980;19(4):450–466.
Derryberry D, Reed MA. Anxiety-related attentional biases and their regulation by attentional control. J Abn Psy. 2002;111(2):225–236.
DoDLive. 3rd Offset Strategy 101: what is it, what the tech focuses are. 2016 Mar 30 [accessed 2017 Feb 15]. http://www.dodlive.mil/index.php/2016/03/3rd -offset-strategy-101-what-it-is-what-the-tech-focuses-are/.
Dzindolet MT, Peterson SA, Pomranky RA, Pierce LG, Beck HP. The role of trust in automation reliance. Int J Hum Comp Stud. 2003;58(6):697–718.
Approved for public release; distribution is unlimited. 122
Ehmke C, Wilson S. Identifying web usability problems from eye-tracking data. Proceedings of the 21st British HCI Group Annual Conference on People and Computers: HCI... but not as we know it. Volume 1; 2007 Sep 3–7; Lancaster, UK. Swinton (UK): British Computer Society; c2007. p. 119–128.
Ekstrom RB, French JW, Harman HH, Dermen D. Manual for kit of factor referenced cognitive tests. Princeton (NJ): Educational Testing Service; 1976. p. 109–113.
Endsley MR. Design and evaluation for situation awareness enhancement. Proceedings of the Human Factors and Ergonomics Society 32nd Annual Meeting; 1988 Oct 24–28; Anaheim, CA. Thousand Oaks (CA): Sage Publications; c1988. p. 97–101.
Endsley MR. Toward a theory of situation awareness in dynamic systems. Hum Fact. 1995;37(1):32–64.
Endsley MR, Kiris EO. The out-of-the-loop performance problem and level of control in automation. Hum Fact. 1995;37(2):381–394.
Endsley MR. Automation and situation awareness. In: Parasuraman R, Mouloua M, editors. Automation and human performance: theory and applications. Hillsdale (NJ): Lawrence Erlbaum Associates, Inc.; c1996. p. 163–181.
Engle RW, Kane MJ, Tuholski SW. Individual differences in working memory capacity and what they tell us about controlled attention, general fluid intelligence, and functions of the prefrontal cortex. In: Miyake A, Shah P, editors. Models of working memory: mechanisms of active maintenance and executive control. Cambridge (UK): Cambridge University Press; c1999. p. 102–134.
Fincannon TD. Visio-spatial abilities in remote perception: a meta-analysis of empirical work [dissertation]. [Orlando (FL)]: University of Central Florida; 2013.
Fitts PM. Human engineering for an effective air navigation and traffic control system. Washington (DC): National Research Council; 1951.
Goldberg JH, Kotval XP. Computer interface evaluation using eye movements: methods and constructs. Int J Ind Ergo. 1999;24(6):631–645.
Gugerty L, Brooks J. Reference-frame misalignment and cardinal direction judgments: group differences and strategies. J Exp Psy: App. 2004;10(2):75–88.
Approved for public release; distribution is unlimited. 123
Hancock PA, Warm JS. A dynamic model of stress and sustained attention. Hum Fact. 1989;31(5):519–37.
Hancock PA, Diaz DD. Ergonomics as a foundation for a science of purpose. Theor Issues Ergo Sci. 2002;3(2):115–23.
Hart S, Staveland L. Development of NASA TLX (task load index): results of empirical and theoretical research. In: Hancock P, Meshkati N, editors. Human mental workload. Amsterdam (The Netherlands): Elsevier; 1988. p. 139–183.
Helldin T, Ohlander U, Falkman G, Riveiro M. Transparency of automated combat classification. In: Harris D, editor. Engineering psychology and cognitive ergonomics. Berlin (Germany): Springer; 2014. p. 22–33.
Holmqvist K, Nystrom M, Andersson R, Dewhurst R, Jarodzka H, Van de Weijer J. Eye tracking: a comprehensive guide to methods and measures. New York (NY): Oxford University Press; 2011.
Ishihara S. Tests for color-blindness. Handaya (Tokyo): Hongo Harukicho; 1917.
Jacob RJK, Karn KS. Eye tracking in human-computer interaction and usability research: ready to deliver the promises. Mind. 2003;2(3):573–605.
Jameson A, Baldes S, Bauer M, Kroner A. Resolving the tension between invisibility and transparency. AVI 2004. Proceedings of 1st International Workshop on Invisible and Transparent Interfaces; 2004 May 25–28; Gallipoli, Italy. New York (NY): ACM Press; c2004. p. 29–33.
Kilgore R, Voshell M. Increasing the transparency of unmanned systems: applications of ecological interface design. In: Shumaker R, Lackey S, editors. Proceedings of the 6th International Conference on Virtual, Augmented and Mixed Reality; 2014 Jun 22–27; Crete, Greece. Cham (Switzerland): Springer International Publishing; c2014. p. 378–389.
Kim T, Hinds P. Who should I blame? Effects of autonomy and transparency on attributions in human–robot interaction. Robot and Human Interactive Communication, ROMAN. The 15th IEEE International Symposium; 2006 Sep 6–8; University of Hertfordshire; Hatfield, UK; Piscataway (NJ): IEEE Publishing; c2006. p. 80–85.
Langer EJ. Mindfulness. Reading (MA): Addison-Wey; 1989.
Lathan C, Tracey M. The effects of operator spatial perception and sensory feedback on human–robot teleoperation performance. Presence. 2002;11(4):368–377.

Approved for public release; distribution is unlimited. 124
Lee JD, See KA. Trust in automation: designing for appropriate reliance. Hum Fact. 2004;46(1):50–80.
Linegang M, Stoner HA, Patterson MJ, Seppelt BD, Hoffman JD, Crittendon ZB, Lee JD. Human-automation collaboration in dynamic mission planning: a challenge requiring an ecological approach. Proceedings of the Human Factors and Ergonomics Society 50th Annual Meeting; 2006 Oct 16–20; San Francisco, CA. Thousand Oaks (CA): Sage Publications; c2006. p. 2482–2486.
Lyons JB. Being transparent about transparency: a model for human–robot interaction. Papers from the 2013 AAAI Spring Symposium Series; 2013 Mar 25–27; Stanford, CA. Palo Alto (CA): The AAAI Press; c2013. p. 48–53.
Lyons JB, Havig PR. Transparency in a human-machine context: approaches for fostering shared awareness/intent. In: Shumaker R, Lackey S, editors. Virtual, augmented and mixed reality. Designing and developing virtual and augmented environments. VAMR 2014. Lecture notes in computer science, vol. 8525. Cham (Switzerland): Springer International Publishing; 2014. p. 181–190.
Manzey D, Reichenbach J, Onnasch L. Human performance consequences of automated decision aids: the impact of degree of automation and system experience. J Cog Eng Dec Making. 2012;6(1):57–87. DOI: 10.1177/ 1555343411433844.
Mercado JE, Rupp MA, Chen JYC, Barber D, Procci K, Barnes MJ. Effects of agent transparency on multi-robot management effectiveness. Aberdeen Proving Ground (MD): Army Research Laboratory (US); 2015 Sep. Report No.: ARL-TR-7466.
Monsell S. Task switching. Trends Cog Sci. 2003;7(3):134–140.
Paradis S, Benaskeur A, Oxenham M, Cutler P. Threat evaluation and weapons allocation in network-centric warfare. 8th International Conference on Information Fusion. 2005 July 25; IEEE. Vol. 2, p. 1078–1085.
Parasuraman R, Manzey DH. Complacency and bias in human use of automation: an attentional integration. Hum Fact. 2010;52(3):381–410.
Parasuraman R, Molloy R, Singh IL. Performance consequences of automation-induced complacency. Int J Av Psy. 1993;3(1):1–23.
Approved for public release; distribution is unlimited. 125
Parasuraman R, Sheridan TB, Wickens CD. A model for types and levels of human interaction with automation. IEEE Trans Sys Man Cyber Part A: Sys Hum. 2000;30(3):286–297.
Peavler WS. Pupil size, information overload, and performance differences. Psychophys. 1974;11(5):559–566.
Pop VL, Shrewsbury A, Durso FT. Individual differences in the calibration of trust in automation. Hum Fact. 2015;57(4):545–556.
Pop VL, Stearman EJ. An updated automation induced complacency rated scale (measurement instrument). Georgia Institute of Technology, Atlanta, GA. Personal communication, 2015 Jan.
Redick TS, Broadway JM, Meier ME, Kuriakose PS, Unsworth N, Kane MJ, Engle RW. Measuring working memory capacity with automated complex span tasks. Euro J Psy Assess. 2012;28(3):164–171.
Rubinstein JS, Meyer DE, Evans JE. Executive control of cognitive processes in task switching. J Exp Psy: Hum Perc Perf. 2001;27(4):763.
Russell S, Norvig P. Artificial intelligence: a modern approach. Upper Saddle River (NJ): Prentice-Hall; 2003.
Shafir E. Choosing versus rejecting: why some options are both better and worse than others. Mem Cog. 1993;21(4):546–556.
Sheridan TB. Supervisory control. In: Salvendy G, editor. Handbook of human factors and ergonomics. 3rd ed. Hoboken (NJ): John Wiley and Sons, Inc.; c2006. p. 1025–1052.
Singh IL, Molloy R, Parasuraman R. Automation-induced “complacency”: development of the complacency-potential rating scale. Int J Av Psy. 1993;3(2):111–122.
Unema P, Rotting M. Differences in eye movements and mental workload between experienced and inexperienced motor-vehicle drivers. In: Brogan D, editor. Visual search. London (UK): Taylor & Francis Group; 1990. p. 193–202.
Unsworth N, Heitz RP, Schrock JC, Engle RW. An automated version of the operation span task. Behav Res Meth. 2005;37:498–505.
Van Orden KF, Jung TP, Makeig S. Combined eye activity measures accurately estimate changes in sustained visual task performance. Bio Psy. 2000;52(3): 221–240.

Approved for public release; distribution is unlimited. 126
Van Orden KF, Limbert W, Makeig S, Jung TP. Eye activity correlates of workload during a visuospatial memory task. Hum Fact. 2001;43(1):111–121.
Wang H, Lewis M, Velagapudi P, Scerri P, Sycara K. How search and its subtasks scale in N robots. Proceedings of the 4th ACM/IEEE International Conference on Human Robot Interaction; 2009 Mar 9–13; La Jolla, CA. New York (NY): ACM Press; c2009. p. 141–148.
Wang J, Wang, H, Lewis M. Assessing cooperation in human control of heterogeneous robots. Proceedings of the 3rd ACM/IEEE International Conference on Human Robot Interaction; 2008 Mar 12–15; Amsterdam, The Netherlands. New York (NY): ACM Press; c2008. p. 9–15.
Westerbeek H, Maes A. Route‐external and route‐internal landmarks in route descriptions: effects of route length and map design. App Cog Psy. 2013;27(3):297–305.
Wickens CD. Designing for situation awareness and trust in automation. Proceedings of the International Federation of Automatic Control (IFAC) Conference; 1994 Sep 27–29; Baden-Baden, Germany. Amsterdam (The Netherlands): Elsevier Ltd. p. 174–179.
Wickens CD, Clegg BA, Vieane AZ, Sebok AL. Complacency and automation bias in the use of imperfect automation. Hum Fact. 2015;57(5):728–739.
Wickens CD, Holland JG. Engineering psychology and human performance. 3rd ed. Upper Saddle River (NJ): Prentice Hall; 2000.
Wright JL, Chen JYC, Quinn SA, Barnes MJ. The effects of level of autonomy on human-agent teaming for multi-robot control and local security maintenance. Aberdeen Proving Grounds (MD): Army Research Laboratory (US); 2013 Nov. Report No.: ARL-TR6724. www.dtic.mil/cgi-bin/GetTRDoc?AD =ADA595105.
Yerkes RM, Dodson JD. The relation of strength of stimulus to rapidity of habit-formation. J Comp Neuro Psy. 1908;18:459–82.

Approved for public release; distribution is unlimited. 127
Appendix A. Demographics Questionnaire
______________________ This appendix appears in its original form, without editorial change.

Approved for public release; distribution is unlimited. 128
Demographic Questionnaire
Date: ________________ Participant ID: _________
1. General Information
a. Age: _____ Gender: M F Handedness: L R
b. How long ago did you have an eye exam? Within the last (Circle one): 6 months 1 year 2 years 4 years or more
c. Do you have any of the following (Circle all that apply): Astigmatism Near-sightedness Far-sightedness Other (explain): __________
d. Do you have corrected vision (Circle one)? Yes No Glasses Contact Lenses If so, are you wearing them today? Yes No
e. Are you in your good/ comfortable state of health physically? YES NO If NO, please briefly explain:
f. How many hours of sleep did you get last night? ______ hours
2. Military Experience
a. Do you have prior military service? YES NO If Yes, how long __________
3. Educational Data
a. What is your highest level of education completed? Select one. ____ GED ____ Bachelor’s Degree
____ High School ____ M.S/M.A
____ Some College ____ Ph.D.
____ Associates or Technical Degree
What subject is your degree in (for example, Engineering)? __________________
4. Computer Experience
a. How long have you been using a computer? __Less than 1 year ___1-3 years ___4-6 years ___7-10 years ___10 years or more
b. How often do you play computer/video games? (Circle one) Daily 3-4X/ Week Weekly Monthly Once or twice a year Never
c. Enter the names of the games you play most frequently: __________________________________________________________________
d. How often do you operate a radio-controlled vehicle (car, boat, or plane)? Daily Weekly Monthly Once or twice a year Never
e. How often do you use graphics/drawing features in software packages? Daily Weekly Monthly Once or twice a year Never

Approved for public release; distribution is unlimited. 129
Appendix B. Attentional Control Survey
______________________ This appendix appears in its original form, without editorial change.

Approved for public release; distribution is unlimited. 130

Approved for public release; distribution is unlimited. 131
Appendix C. Cube Comparisons Test
_____________________________
This appendix appears in its original form, without editorial change.

Approved for public release; distribution is unlimited. 132

Approved for public release; distribution is unlimited. 133

Approved for public release; distribution is unlimited. 134

Approved for public release; distribution is unlimited. 135
Appendix D. Spatial Orientation Test
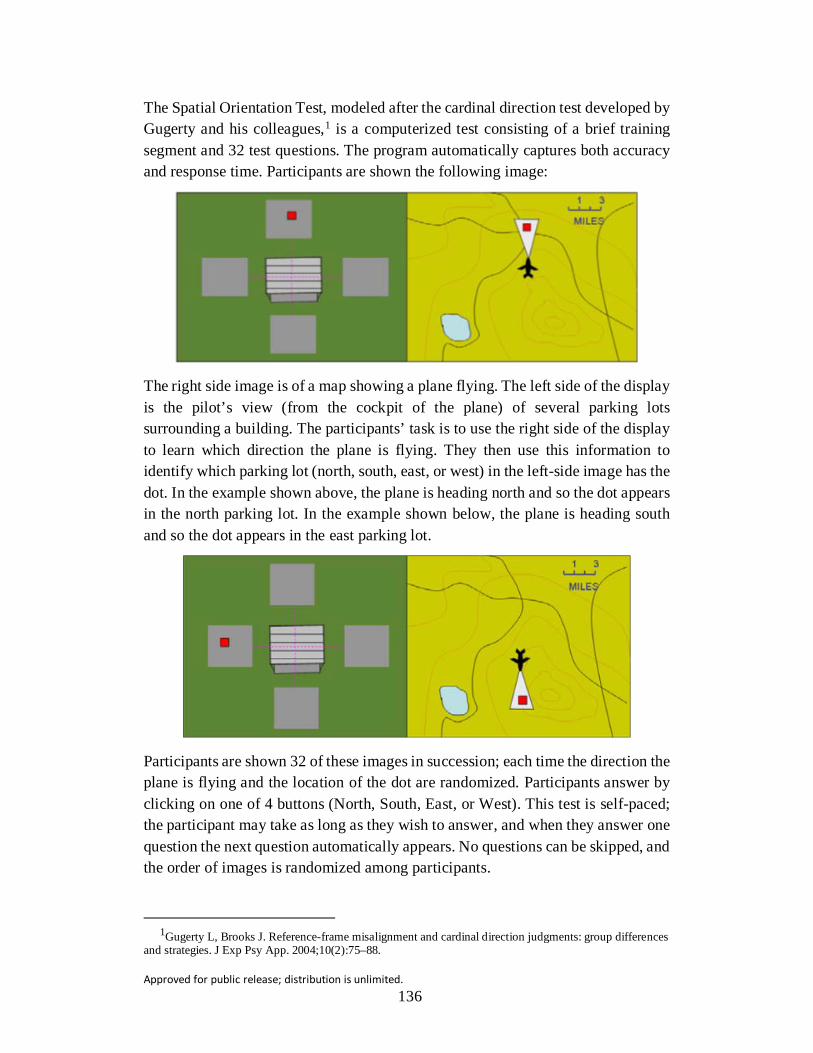
Approved for public release; distribution is unlimited. 136
The Spatial Orientation Test, modeled after the cardinal direction test developed by Gugerty and his colleagues,1 is a computerized test consisting of a brief training segment and 32 test questions. The program automatically captures both accuracy and response time. Participants are shown the following image:
The right side image is of a map showing a plane flying. The left side of the display is the pilot’s view (from the cockpit of the plane) of several parking lots surrounding a building. The participants’ task is to use the right side of the display to learn which direction the plane is flying. They then use this information to identify which parking lot (north, south, east, or west) in the left-side image has the dot. In the example shown above, the plane is heading north and so the dot appears in the north parking lot. In the example shown below, the plane is heading south and so the dot appears in the east parking lot.
Participants are shown 32 of these images in succession; each time the direction the plane is flying and the location of the dot are randomized. Participants answer by clicking on one of 4 buttons (North, South, East, or West). This test is self-paced; the participant may take as long as they wish to answer, and when they answer one question the next question automatically appears. No questions can be skipped, and the order of images is randomized among participants.
1Gugerty L, Brooks J. Reference-frame misalignment and cardinal direction judgments: group differences
and strategies. J Exp Psy App. 2004;10(2):75–88.

Approved for public release; distribution is unlimited. 137
Appendix E. National Aeronautics and Space Administration-Task Load Index (NASA-TLX)
_________________________
This appendix appears in its original form, without editorial change.

Approved for public release; distribution is unlimited. 138

Approved for public release; distribution is unlimited. 139
Approved for public release; distribution is unlimited. 140
INTENTIONALLY LEFT BLANK.
Approved for public release; distribution is unlimited. 141
Appendix F. Complacency Potential Rating Scale
_____________________________
This appendix appears in its original form, without editorial change.

Approved for public release; distribution is unlimited. 142
Complacency Potential Rating Scale

Approved for public release; distribution is unlimited. 143
Appendix G. Reading Span Task (RSPAN)

Approved for public release; distribution is unlimited. 144
Participants will be administered a computerized version of the RSPAN task1,2 in order to evaluate their working memory capacity as well as remove participants with potential reading-comprehension issues.
RSPAN Instructions for Automated Presentation
The experiment is broken down into 2 sections. First, participants receive practice and second, the participants perform the actual experiment. The practice sessions are further broken down into 3 sections.
The first practice is simple letter span. They see letters appear on the screen one at a time and then must recall these letters in the same order they saw them. In all experimental levels, letters remain on the screen for 800 ms. Recall consists of filling in boxes with the appropriate letters. Entering a letter or space in a box should advance the cursor to the next box. At the final box, hitting the spacebar will advance to the next slide. After each recall slide, the computer provides feedback about the number of letters correctly recalled.
Next, participants practice the sentence portion of the experiment. Participants first see a sentence (e.g., “Andy was stopped by the policeman because he crossed the yellow heaven”). Once the participant has read the sentence, they are required to answer YES or NO (did the sentence make sense). After each sentence sense verification participants are given feedback. The reading practice serves to familiarize participants with the sentence portion of the experiment as well as calculate how long it takes a given person to solve the sentence problems. Thus, it attempts to account for individual differences in the time it takes to solve reading problems. After the reading practice, the program calculates the individual’s mean time required to solve the problems. This time (plus 2.5 standard deviations [SDs]) is then used as a time limit for the reading portion of the experimental session.
The final practice session has participants perform both the letter recall and reading portions together, just as they will do in the experimental block. As with traditional RSPAN, participants first see the sentence and after verifying that it makes sense or not, they see the letter to be recalled. If participants take more time to verify the sentence than their average time plus 2.5 SDs, the program automatically moves on. This serves to prevent participants from rehearsing the letters when they should
1Unsworth N, Heitz RP, Schrock JC, Engle RW. An automated version of the operation span task. Behav Res Meth.
2005;37:498–505. 2Daneman M, Carpenter PA. Individual differences in working memory and reading. J Verb Learn Verb Beh. 1980;
19(4):450-466.

Approved for public release; distribution is unlimited. 145
be verifying the sense of the sentences. After the participant completes all of the practice sessions, the program moves them to the real trials.
The experimental trials consist of 3 trials of each set size with the set sizes ranging from 3 to 6. This makes for a total of 54 letters and 54 sentence problems. Subjects are instructed to keep their reading accuracy at or above 80% at all times. During recall, a percentage in red is presented in the upper right-hand corner. Subjects are instructed to keep a careful watch on the percentage in order to keep it above 80%. Subjects get feedback at the end of each trial. Subjects who do not finish with a reading accuracy score of 80% or better will be excused from continuing with the study.
RSPAN Timing (may be adjusted after review)
Sentence-verification screen: Min = none, Max = mean of practice trials +2.5 SD.
Letter presentation: 800 ms.
Recall screen: Min = none, Max = 2 min (there is a “Continue” button to move forward faster).
READY screen: 3 s (no keys active, cannot skip this screen).
Slide Examples
Ready screen
Letter screen

Approved for public release; distribution is unlimited. 146
Sentence screen
Sentence screen with feedback (for sentence practice only)
Recall screen; always 7 boxes shown
Feedback screen, letter practice

Approved for public release; distribution is unlimited. 147
Feedback screen, sentence practice
Feedback screen, final practice and main experiment

Approved for public release; distribution is unlimited. 148
INTENTIONALLY LEFT BLANK.

Approved for public release; distribution is unlimited. 149
Appendix H. Usability Survey
_____________________________
This appendix appears in its original form, without editorial change.

Approved for public release; distribution is unlimited. 150
Usability Survey
1. I made use of RoboLeader’s recommendations. Strongly Strongly
DISAGREE 1 2 3 4 5 6 7 AGREE
2. I sometimes felt ‘lost’ using the RoboLeader display. Strongly Strongly
DISAGREE 1 2 3 4 5 6 7 AGREE
3. I do not feel the RoboLeader display was helpful in the task. Strongly Strongly
DISAGREE 1 2 3 4 5 6 7 AGREE
4. I relied heavily on the RoboLeader for the task. Strongly Strongly
DISAGREE 1 2 3 4 5 6 7 AGREE
5. Threats were visible on the screen(s) long enough to accurately detect them. Strongly Strongly
DISAGREE 1 2 3 4 5 6 7 AGREE
6. The RoboLeader display was confusing. Strongly Strongly
DISAGREE 1 2 3 4 5 6 7 AGREE
7. The RoboLeader display was annoying. Strongly Strongly
DISAGREE 1 2 3 4 5 6 7 AGREE
8. The RoboLeader display improved my performance on the task. Strongly Strongly
DISAGREE 1 2 3 4 5 6 7 AGREE

Approved for public release; distribution is unlimited. 151
9. The RoboLeader display can be deceptive. Strongly Strongly
DISAGREE 1 2 3 4 5 6 7 AGREE
10. The RoboLeader display sometimes behaves in an unpredictable manner. Strongly Strongly
DISAGREE 1 2 3 4 5 6 7 AGREE
11. I am often suspicious of the RoboLeader system’s intent, action, or outputs. Strongly Strongly
DISAGREE 1 2 3 4 5 6 7 AGREE
12. I am sometimes unsure of the RoboLeader system. Strongly Strongly
DISAGREE 1 2 3 4 5 6 7 AGREE
13. The RoboLeader system may have harmful effects on the task. Strongly Strongly
DISAGREE 1 2 3 4 5 6 7 AGREE
14. I am confident in the RoboLeader system. Strongly Strongly
DISAGREE 1 2 3 4 5 6 7 AGREE
15. The RoboLeader system can provide security. Strongly Strongly
DISAGREE 1 2 3 4 5 6 7 AGREE

Approved for public release; distribution is unlimited. 152
16. The RoboLeader system has integrity. Strongly Strongly DISAGREE 1 2 3 4 5 6 7 AGREE
17. The RoboLeader system is dependable. Strongly Strongly
DISAGREE 1 2 3 4 5 6 7 AGREE
18. The RoboLeader system is consistent. Strongly Strongly DISAGREE 1 2 3 4 5 6 7 AGREE
19. I can trust the RoboLeader system. Strongly Strongly
DISAGREE 1 2 3 4 5 6 7 AGREE
20. I am familiar with the RoboLeader display. Strongly Strongly DISAGREE 1 2 3 4 5 6 7 AGREE

Approved for public release; distribution is unlimited. 153
Appendix I. Informed Consent
_____________________________
This appendix appears in its original form, without editorial change.

Approved for public release; distribution is unlimited. 154

Approved for public release; distribution is unlimited. 155

Approved for public release; distribution is unlimited. 156

Approved for public release; distribution is unlimited. 157

Approved for public release; distribution is unlimited. 158
INTENTIONALLY LEFT BLANK.

Approved for public release; distribution is unlimited. 159
Appendix J. Training Materials
__________________________ This appendix appears in its original form, without editorial change.
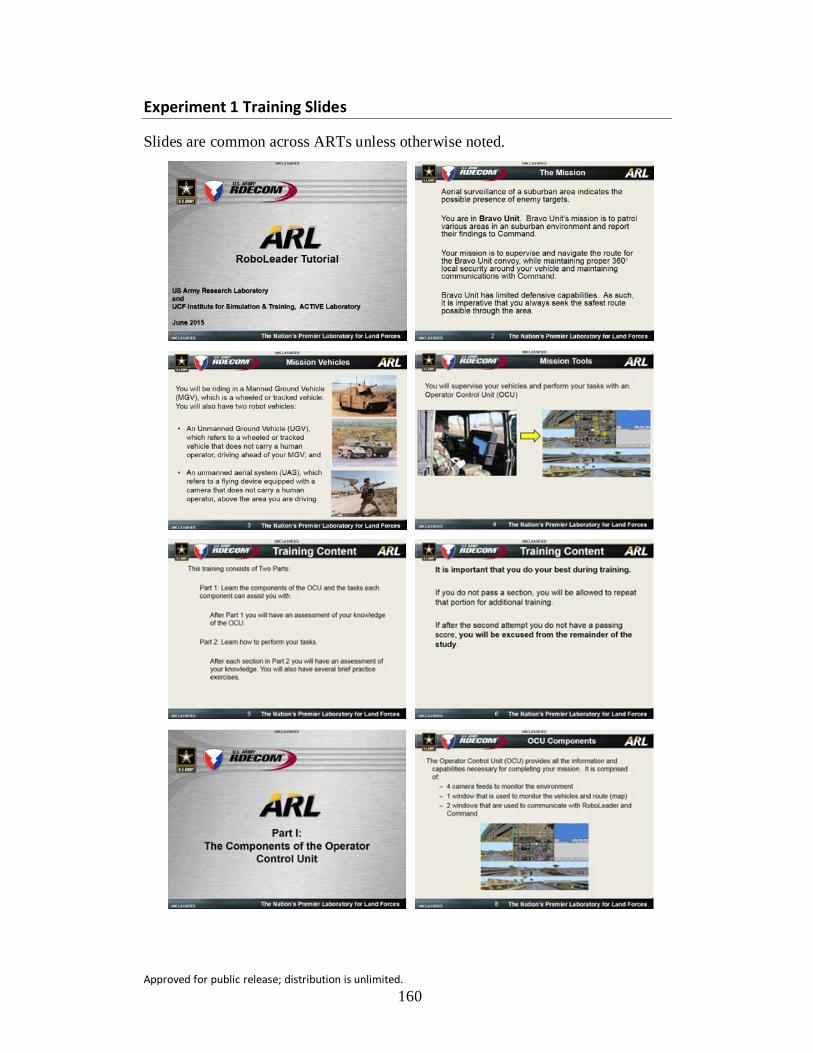
Approved for public release; distribution is unlimited. 160
Experiment 1 Training Slides
Slides are common across ARTs unless otherwise noted.

Approved for public release; distribution is unlimited. 161

Approved for public release; distribution is unlimited. 162

Approved for public release; distribution is unlimited. 163

Approved for public release; distribution is unlimited. 164
The following slides in the section “Route Supervision,” parts a and b, vary according to Agent Reasoning Transparency (ART) level.
Route Supervision training slides, ART 3

Approved for public release; distribution is unlimited. 165
Route Supervision training slides, ART 2

Approved for public release; distribution is unlimited. 166
Route Supervision training slides, ART 1

Approved for public release; distribution is unlimited. 167
The following slides are common to all ART levels.
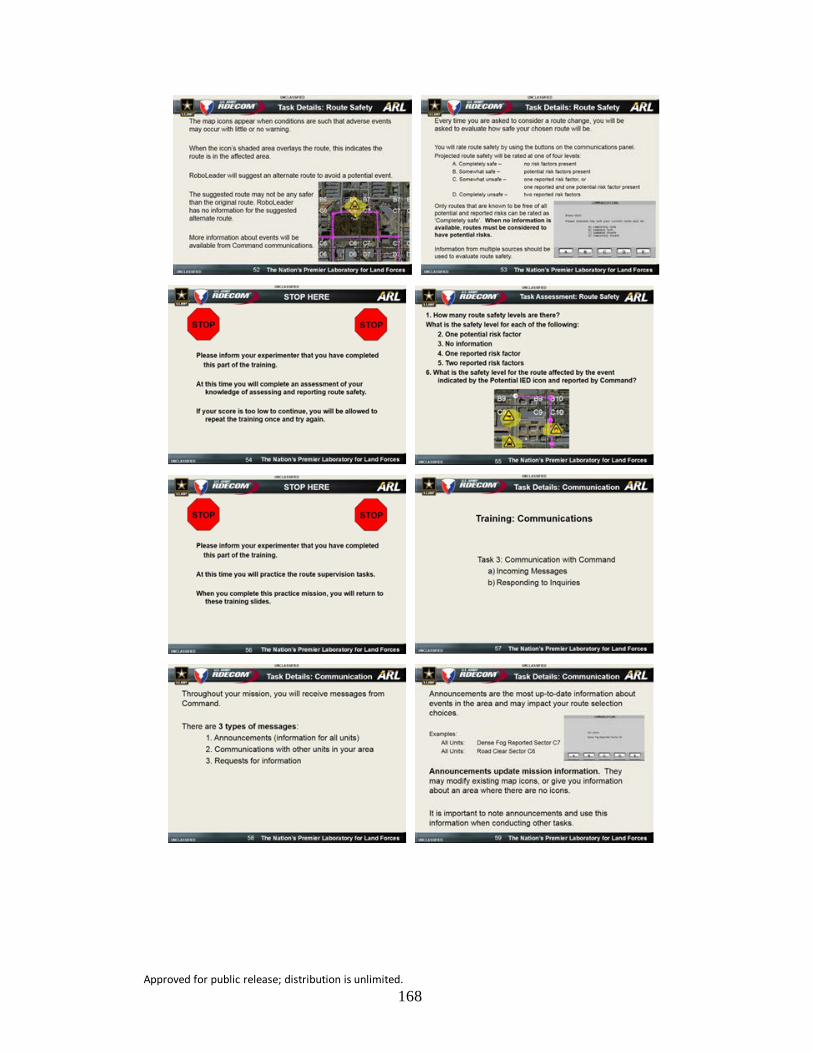
Approved for public release; distribution is unlimited. 168

Approved for public release; distribution is unlimited. 169
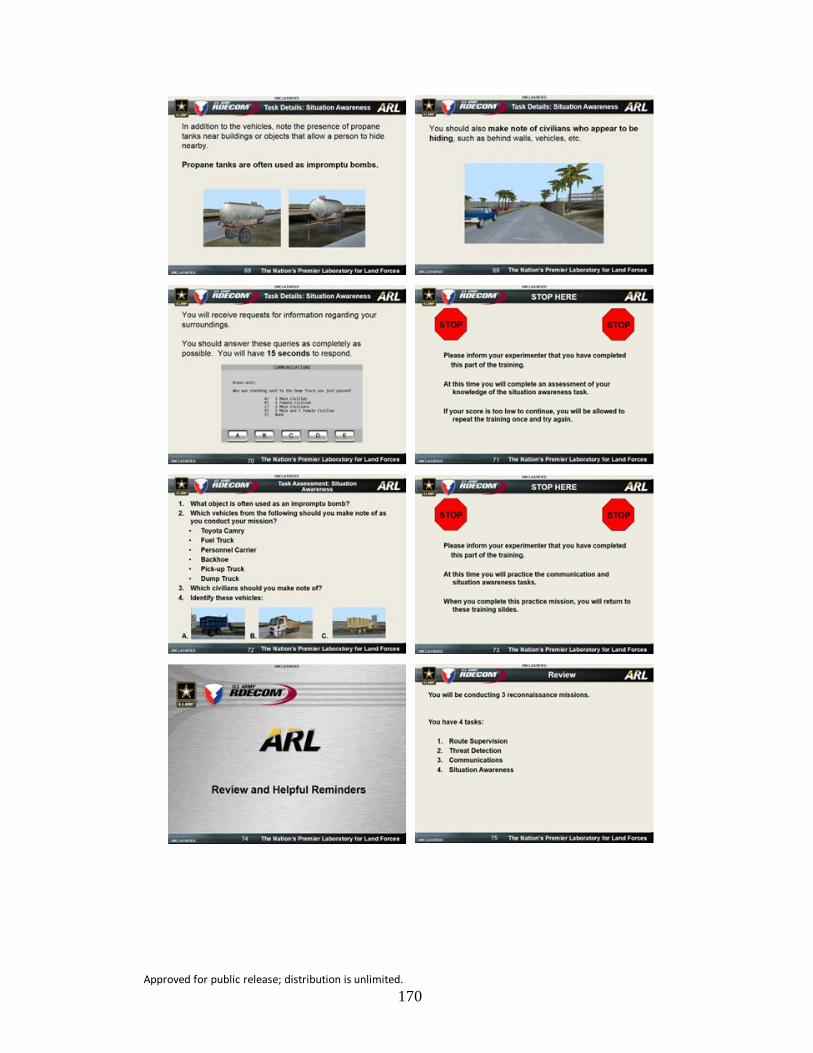
Approved for public release; distribution is unlimited. 170
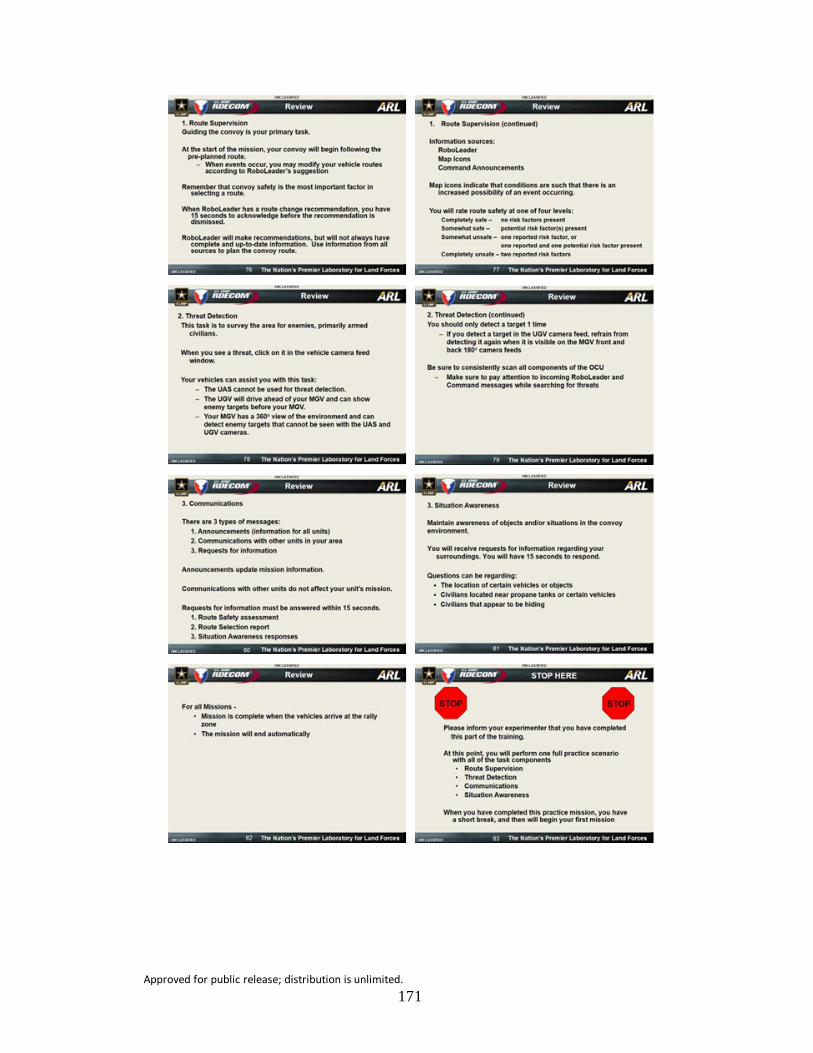
Approved for public release; distribution is unlimited. 171

Approved for public release; distribution is unlimited. 172
Experiment 2 Training Slides
Slides are common across ARTs unless otherwise noted.
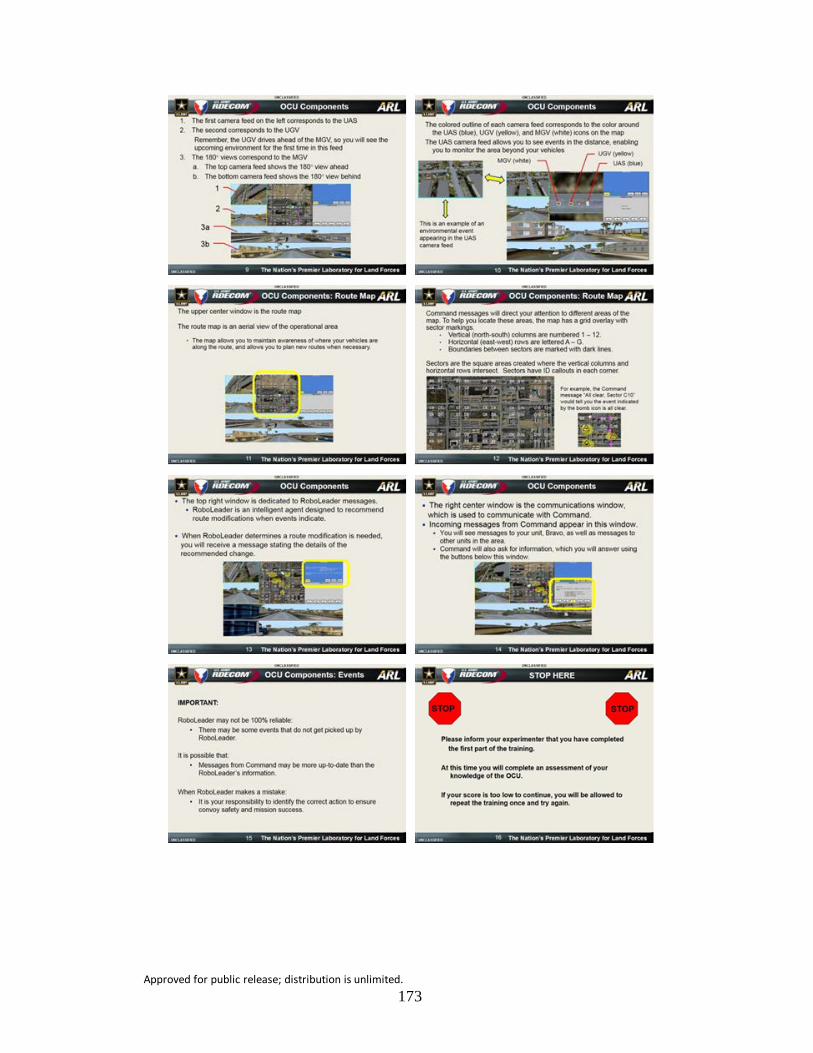
Approved for public release; distribution is unlimited. 173
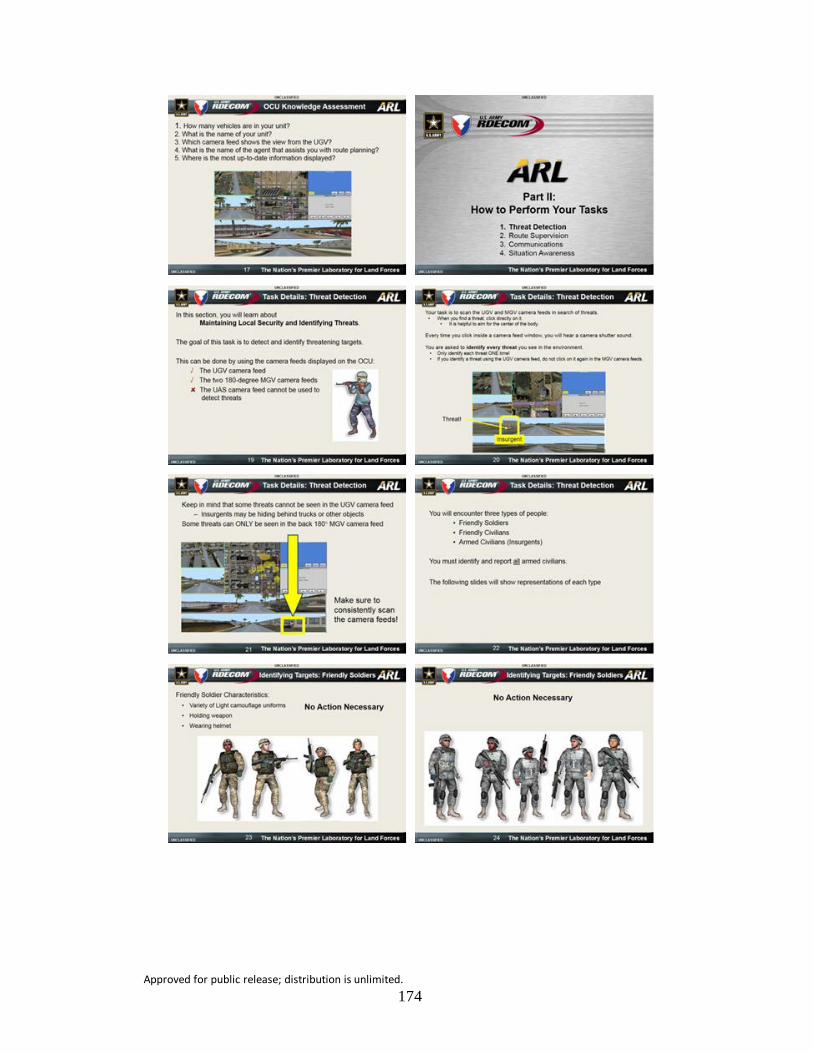
Approved for public release; distribution is unlimited. 174

Approved for public release; distribution is unlimited. 175

Approved for public release; distribution is unlimited. 176
The following slides in the section “Route Supervision,” parts a and b, vary according to Agent Reasoning Transparency (ART) level.
Route Supervision training slides, ART 3

Approved for public release; distribution is unlimited. 177
Route Supervision training slides, ART 2

Approved for public release; distribution is unlimited. 178
Route Supervision training slides, ART 1

Approved for public release; distribution is unlimited. 179
The following slides are common to all ART levels.

Approved for public release; distribution is unlimited. 180

Approved for public release; distribution is unlimited. 181
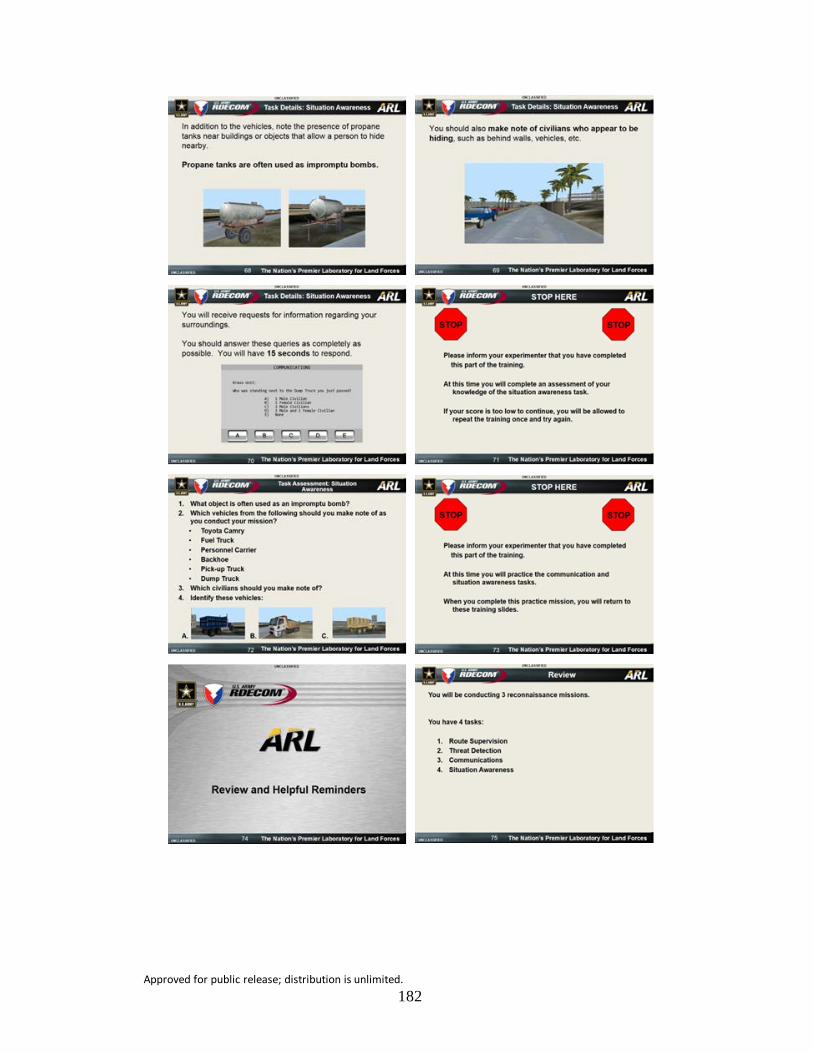
Approved for public release; distribution is unlimited. 182

Approved for public release; distribution is unlimited. 183

Approved for public release; distribution is unlimited. 184
INTENTIONALLY LEFT BLANK.

Approved for public release; distribution is unlimited. 185
Appendix K. RoboLeader Messages
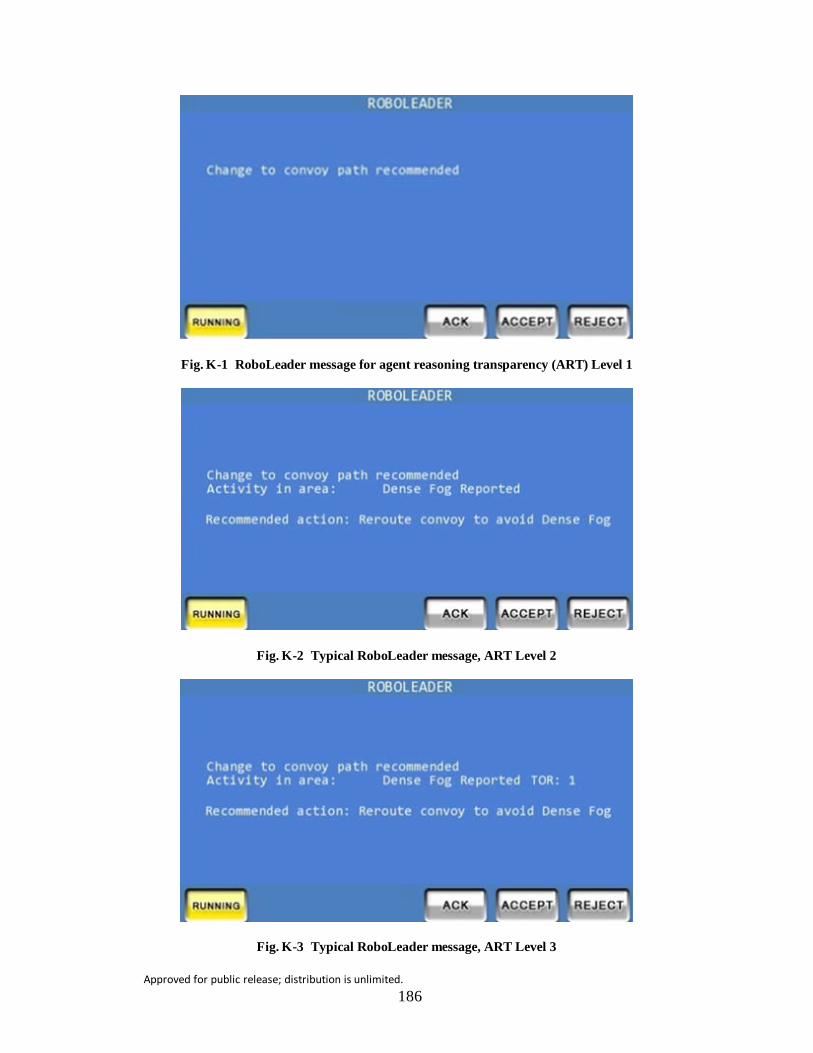
Approved for public release; distribution is unlimited. 186
Fig. K-1 RoboLeader message for agent reasoning transparency (ART) Level 1
Fig. K-2 Typical RoboLeader message, ART Level 2
Fig. K-3 Typical RoboLeader message, ART Level 3

Approved for public release; distribution is unlimited. 187
Appendix L. Situation Awareness (SA) Questions
_____________________________
This appendix appears in its original form, without editorial change.

Approved for public release; distribution is unlimited. 188
Level 1- What is happening? SA1 Queries gauge how well the participant is monitoring and perceiving information about the experimental environment. Mission 1
1. How many Dump trucks have you passed? Answer: B. 2
A. 1 D. 4 B. 2 E. None C. 3
2. What vehicle was positioned between the two walls? Answer: E. Tank
A. Personnel Carrier D. Dump Truck B. Pickup Truck E. Tank C. Fuel Truck
3. What vehicle/object of interest did you just pass? Answer: B. Garbage Truck
A. Personnel Carrier D. Dump Truck B. Garbage Truck E. Propane Tank C. Fuel Truck
4. You have just passed a person standing behind the wall. Identify them. Answer: A. Male Civilian
A. Male Civilian D. Armed Civilian B. Female Civilian E. None C. US Military
5. Who was standing next to the Dump truck you just passed? Answer: D. 1 Male & 1 Female Civilian
A. 1 Male Civilian D. 1 Male & 1 Female Civilian B. 1 Female Civilian E. None C. 2 Male Civilians
6. What object/vehicle of interest was next to the Garbage Truck you just passed? Answer: C. 2 Male Civilians

Approved for public release; distribution is unlimited. 189
A. Personnel Carrier D. Dump Truck B. Garbage Truck E. Propane Tank C. Fuel Truck

Approved for public release; distribution is unlimited. 190
Mission 2
1. Who was standing next to the Dump truck you just passed? Answer: C. 2 Male Civilians
A. 1 Male Civilian D. 1 Male & 1 Female Civilian B. 1 Female Civilian E. None C. 2 Male Civilians
2. How many U.S. Military were standing by the Garbage truck? Answer: C. 3
A. 1 D. 4 B. 2 E. None C. 3
3. What vehicle/object of interest did you just pass? Answer: C. Fuel Truck
A. Personnel Carrier D. Dump Truck B. Garbage Truck E. Propane Tank C. Fuel Truck
4. How many destroyed vehicles were near the Dump truck? Answer: A. 1
A. 1 D. 4 B. 2 E. None C. 3
5. What vehicle/object of interest was near the Propane Tank that you just passed? Answer: C. Fuel Truck
A. Personnel Carrier D. Dump Truck B. Garbage Truck E. Propane Tank C. Fuel Truck
6. What was behind the wall that you just passed? Answer: B. Propane Tank
A. Pickup Truck D. Tank B. Propane Tank E. Dump Truck C. Fuel Truck
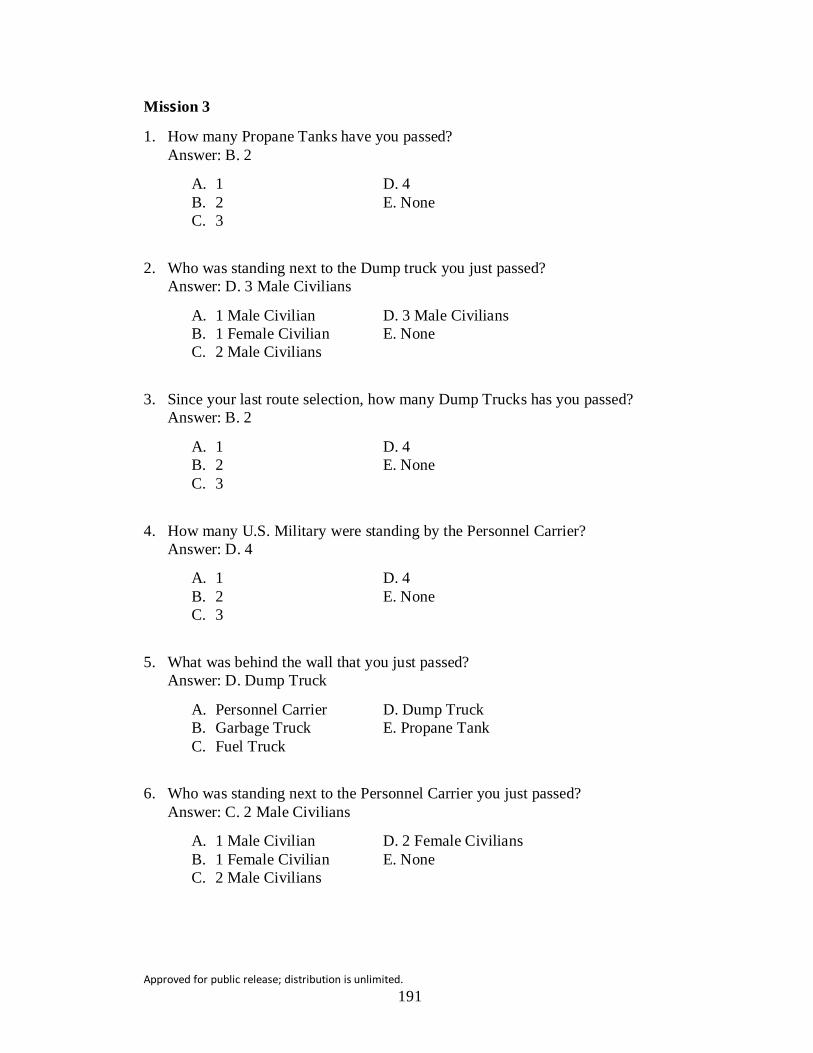
Approved for public release; distribution is unlimited. 191
Mission 3
1. How many Propane Tanks have you passed? Answer: B. 2
A. 1 D. 4 B. 2 E. None C. 3
2. Who was standing next to the Dump truck you just passed? Answer: D. 3 Male Civilians
A. 1 Male Civilian D. 3 Male Civilians B. 1 Female Civilian E. None C. 2 Male Civilians
3. Since your last route selection, how many Dump Trucks has you passed? Answer: B. 2
A. 1 D. 4 B. 2 E. None C. 3
4. How many U.S. Military were standing by the Personnel Carrier? Answer: D. 4
A. 1 D. 4 B. 2 E. None C. 3
5. What was behind the wall that you just passed? Answer: D. Dump Truck
A. Personnel Carrier D. Dump Truck B. Garbage Truck E. Propane Tank C. Fuel Truck
6. Who was standing next to the Personnel Carrier you just passed? Answer: C. 2 Male Civilians
A. 1 Male Civilian D. 2 Female Civilians B. 1 Female Civilian E. None C. 2 Male Civilians
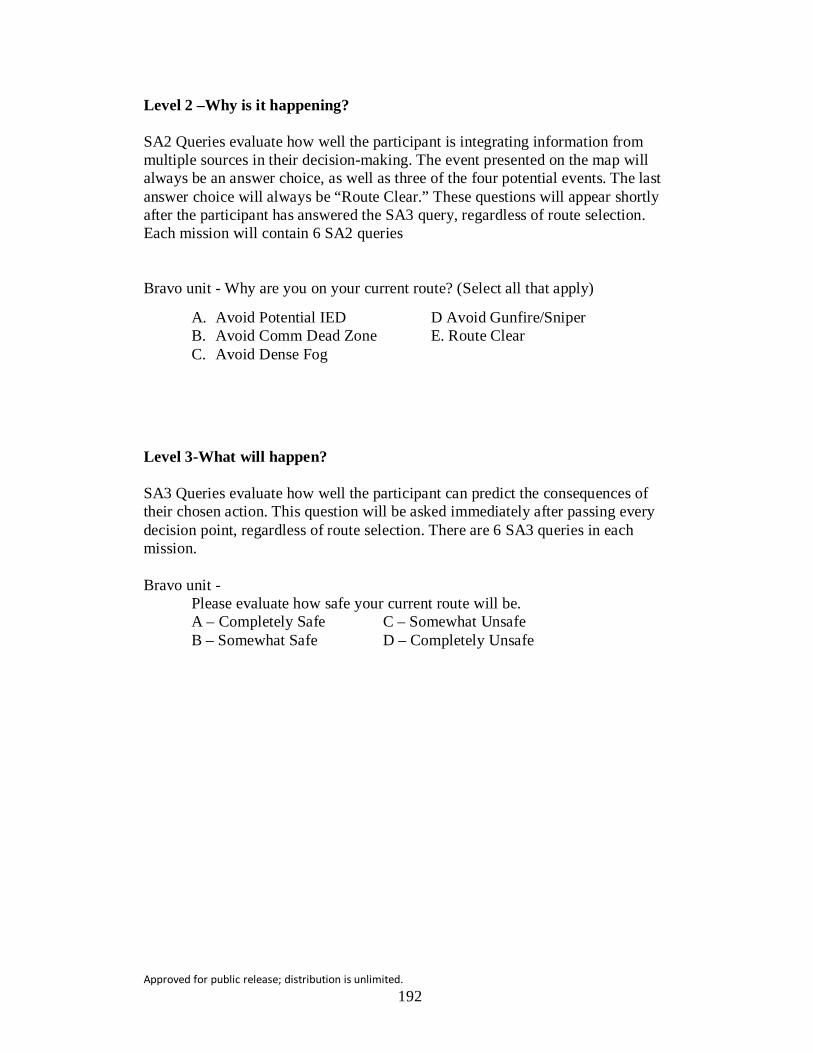
Approved for public release; distribution is unlimited. 192
Level 2 –Why is it happening? SA2 Queries evaluate how well the participant is integrating information from multiple sources in their decision-making. The event presented on the map will always be an answer choice, as well as three of the four potential events. The last answer choice will always be “Route Clear.” These questions will appear shortly after the participant has answered the SA3 query, regardless of route selection. Each mission will contain 6 SA2 queries Bravo unit - Why are you on your current route? (Select all that apply)
A. Avoid Potential IED D Avoid Gunfire/Sniper B. Avoid Comm Dead Zone E. Route Clear C. Avoid Dense Fog
Level 3-What will happen? SA3 Queries evaluate how well the participant can predict the consequences of their chosen action. This question will be asked immediately after passing every decision point, regardless of route selection. There are 6 SA3 queries in each mission. Bravo unit -
Please evaluate how safe your current route will be. A – Completely Safe C – Somewhat Unsafe B – Somewhat Safe D – Completely Unsafe

Approved for public release; distribution is unlimited. 193
List of Symbols, Abbreviations, and Acronyms
ANOVA analysis of variance
ARL US Army Research Laboratory
ART Agent Reasoning Transparency
CI Confidence Interval
CP Complacency Potential
CPRS Complacency Potential Rating Scale
DT Decision Time
ET elapsed time
EXP1 Experiment 1
EXP2 Experiment 2
FA false alarm
FC Fixation Count
FD Fixation Duration
Frust frustration level
ID individual difference
IED improvised explosive device
IR infrared
LOA level of autonomy
MD mental demand
Mdn Median
MGV manned ground vehicle
MIX Mixed Initiative Experimental
N Number
NASA-TLX National Aeronautics and Space Administration-Task Load Index
OCU operator control unit
Approved for public release; distribution is unlimited. 194
OOTL out of the loop
PAC perceived attentional control
PDia pupil diameter
Perf performance
PhyD physical demand
RED Remote Eyetracking Device
RL Roboleader
RSPAN Reading Span Task
SA situation awareness
SAT Situation-awareness based Agent Transparency
SD Standard Deviation
SE Standard Error of the mean
SDT Signal Detection Theory
SMI Sensomotoric Instrument
SO spatial orientation
SOT Spatial Orientation Test
SpA spatial ability
SV spatial visualization
TD temporal demand
TOR Time of Report
UAV unmanned aerial vehicle
UCF University of Central Florida
UGV unmanned ground vehicle
WMC working memory capacity
d’ sensitivity
β selection bias
Approved for public release; distribution is unlimited. 195
1 DEFENSE TECHNICAL (PDF) INFORMATION CTR DTIC OCA 2 DIRECTOR (PDF) US ARMY RSRCH LAB RDRL CIO L IMAL HRA MAIL & RECORDS MGMT 1 GOVT PRINTG OFC (PDF) A MALHOTRA 6 DIR USARL (PDF) RDRL HR J LOCKETT RDRL HRF J Y C CHEN RDRL HRF D A MARATHE RDRL HRF D J L WRIGHT RDRL HRB D HEADLEY RDRL HRB D M J BARNES

Approved for public release; distribution is unlimited. 196
INTENTIONALLY LEFT BLANK.