Embed Size (px)
Citation preview
AgFiMS Tanzania 2011Headline Findings
Irma Grundling, Annette Altvater, Linda Helgesson Sekei15 February 2012
The problem …
• Smallholder & agri-business finance perceived as risky
• There is lack of financial services suited for agriculture
• Limited penetration of financial services into agri/rural areas

AgFiMS objectives
The overall aim - A survey to:• Assess the need for financial services and support
• Assess factors prohibiting access to financial services
• Facilitate interventions to address the need
AgFiMS has two complementary components: •Demand side component
•Supply side component
• To quantify the degree and type of finance provision
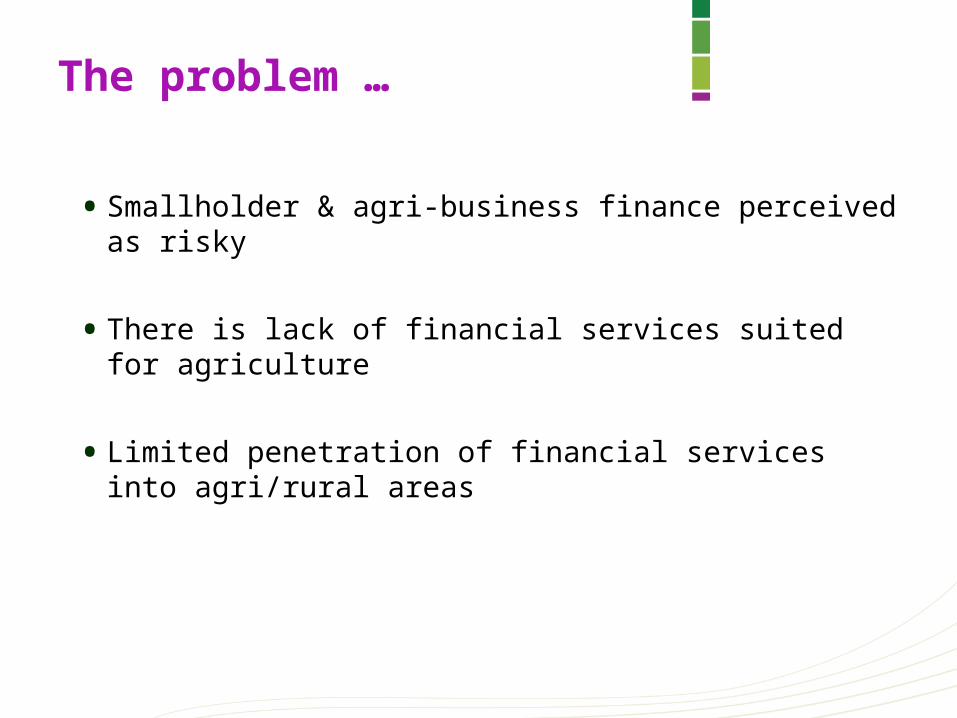
Objective
Land-size or turnover-based selection criteria applied
?
AgFiMS Tanzania 2011 sample
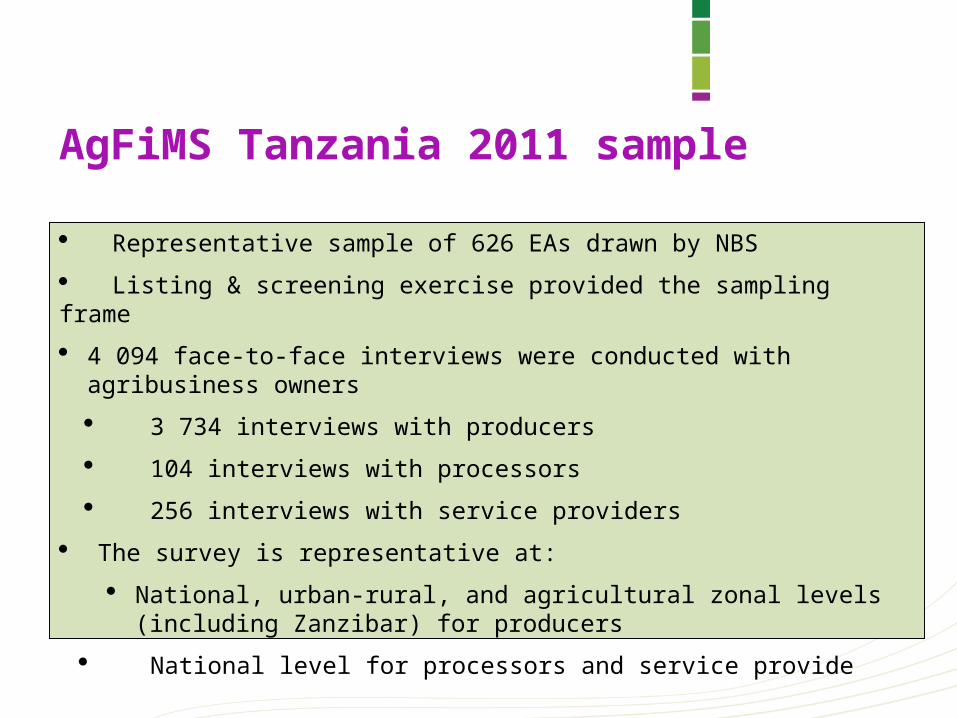
· Representative sample of 626 EAs drawn by NBS
· Listing & screening exercise provided the sampling frame
· 4 094 face-to-face interviews were conducted with agribusiness owners
· 3 734 interviews with producers
· 104 interviews with processors
· 256 interviews with service providers
· The survey is representative at:
· National, urban-rural, and agricultural zonal levels (including Zanzibar) for producers
· National level for processors and service provide
Size & Scope of the AgFiMS Tanzania 2011
identified Agribusiness Market

AgFiMS Tanzania 2011
Agri-businesses Total AgFiMS qualifiers
Number of qualifiers
% qualifying
Producers - farmers selling more than they consume and earning an income from cash crop, food crop or livestock farming
1 932 222
492 980 earn at least $600 p.a. OR use at least
5acres
25.5%
Processors 21 017 8 199 earn at least $1500 p.a. 39.0%
Service Providers 62 502 18 793 earn at least $1500 p.a. 30.1%
TOTAL
2 015 742
519 972 25.8%
• +- 7m farming households• +- 5m households with farming as main income source• AgFiMS – 2 million agri-businesses
AgFiMS Tanzania 2011
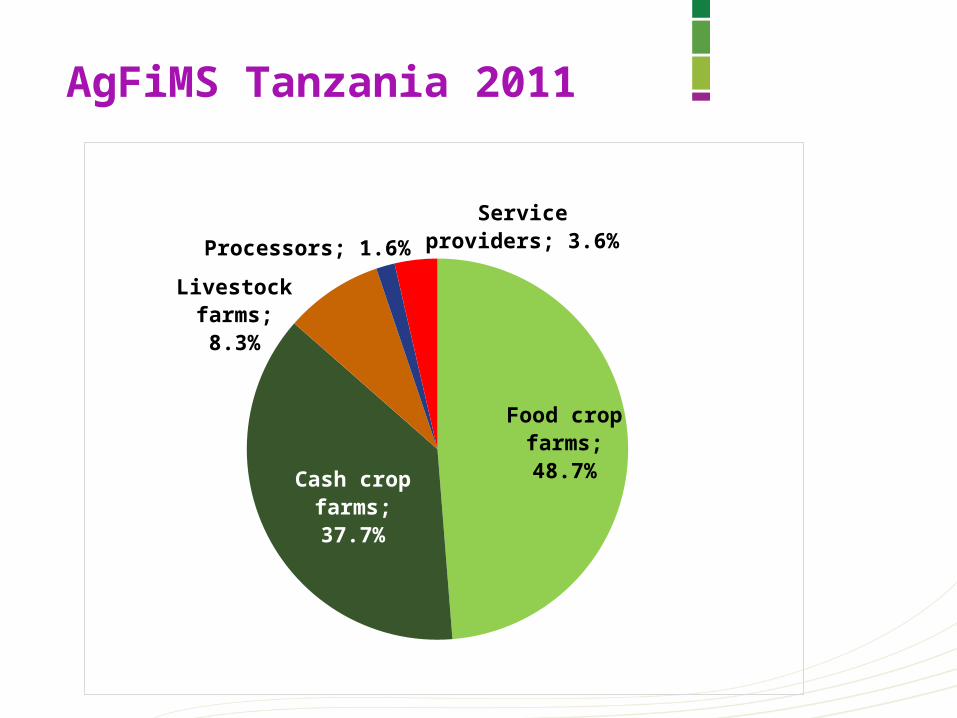
Food crop farms; 48.7%Cash crop
farms; 37.7%
Livestock farms; 8.3%
Processors; 1.6%
Service providers; 3.6%
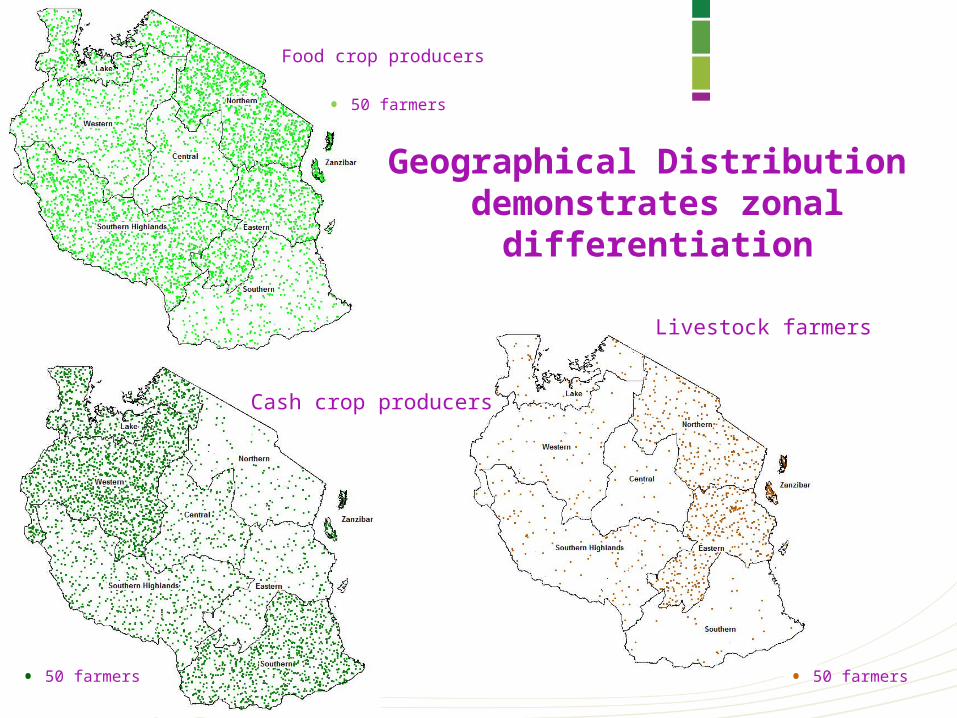
Geographical Distribution demonstrates zonal
differentiation
Food crop producers
Cash crop producers
Livestock farmers
• 50 farmers
• 50 farmers • 50 farmers
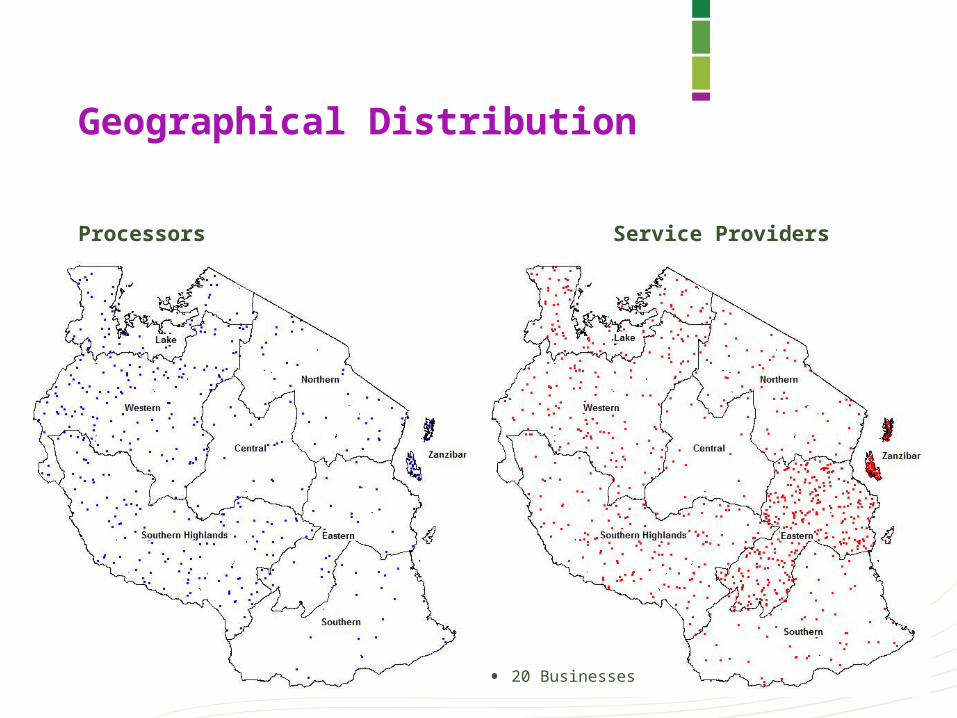
Geographical Distribution
Processors Service Providers
• 20 Businesses

AgFiMS Tanzania 2011 Business Profile

Business Profile Most agribusinesses focus on crop farming as main source of income
48.5%
37.5%
8.3%1.8%3.9%
Food cropsCash cropsLivestockProcessorsService providers
Maize
Rice
Beans
33.2%
23.9%
8.8%
Main income gen-erating activity:
Food crop farmers
Tobacco
Cotton
Cashew
Coffee
Sunflower
27.3%
19.9%
19.0%
17.2%
6.8%
Main income gen-erating activity:
Cash crop farmers
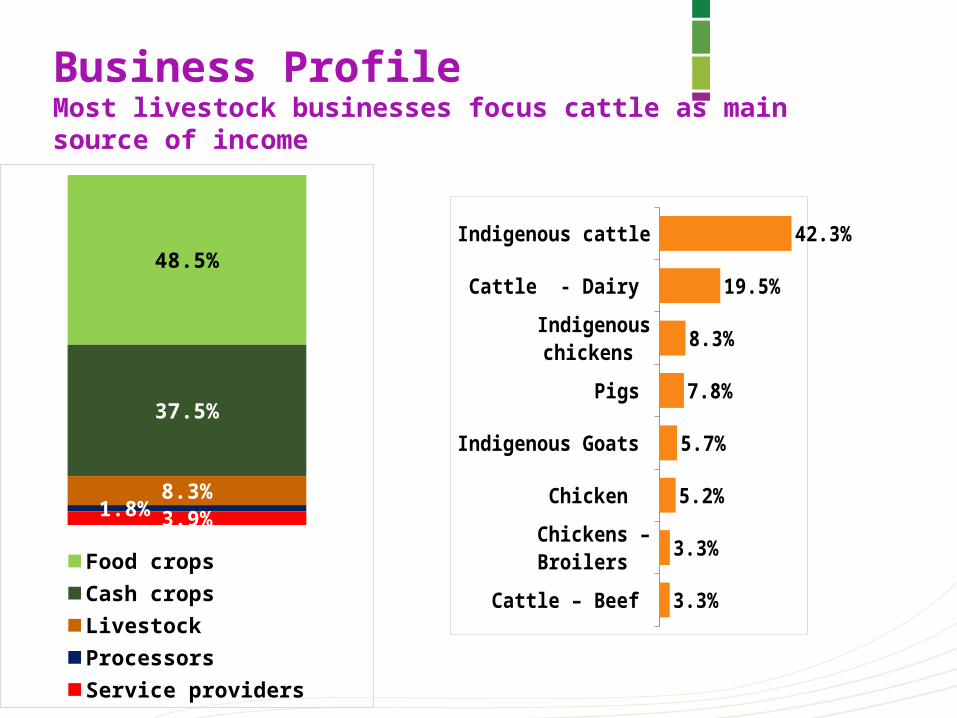
Business Profile Most livestock businesses focus cattle as main source of income
Indigenous cattle
Cattle - Dairy
Indigenous chickens
Pigs
Indigenous Goats
Chicken
Chickens – Broilers
Cattle – Beef
42.3%
19.5%
8.3%
7.8%
5.7%
5.2%
3.3%
3.3%
48.5%
37.5%
8.3%1.8%3.9%
Food cropsCash cropsLivestockProcessorsService providers
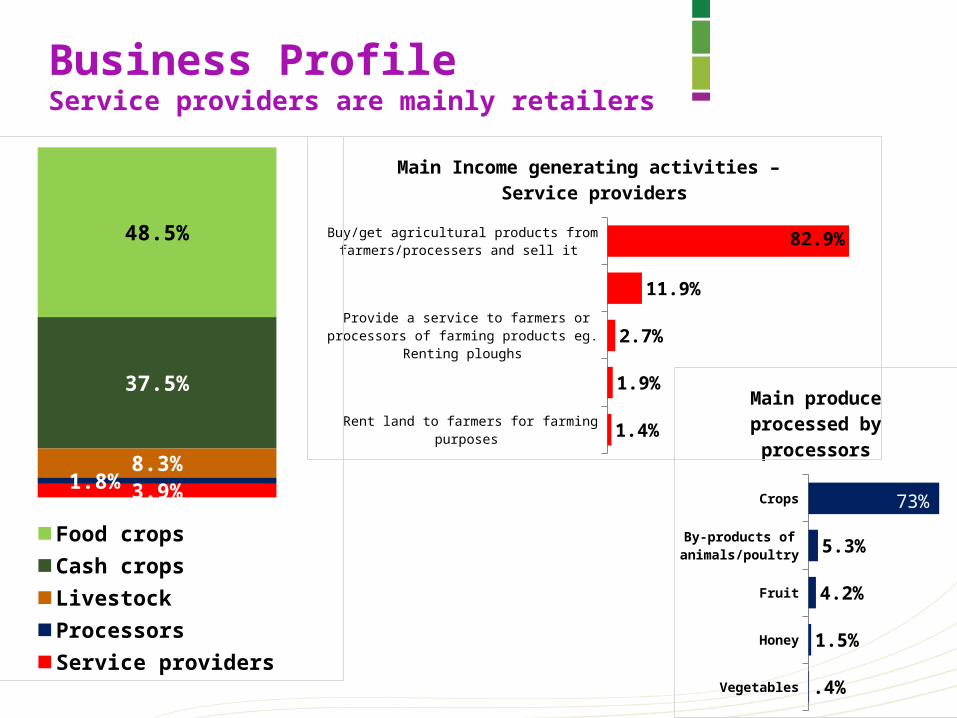
Crops
By-products of animals/poultry
Fruit
Honey
Vegetables
73%
5.3%
4.2%
1.5%
.4%
Main produce processed by pro-
cessors
Business Profile Service providers are mainly retailers
Buy/get agricultural products from farmers/processers and sell it
Sell something to farmers for the purpose of farming eg. Seeds
Provide a service to farmers or processors of farming products eg. Renting ploughs
Sell something to processors of farming products for the purpose of processing eg. Processing machinery
Rent land to farmers for farming purposes
82.9%
11.9%
2.7%
1.9%
1.4%
Main Income generating activities – Service providers
48.5%
37.5%
8.3%1.8%3.9%
Food cropsCash cropsLivestockProcessorsService providers

AgFiMS Tanzania 2011Business Owner Profile
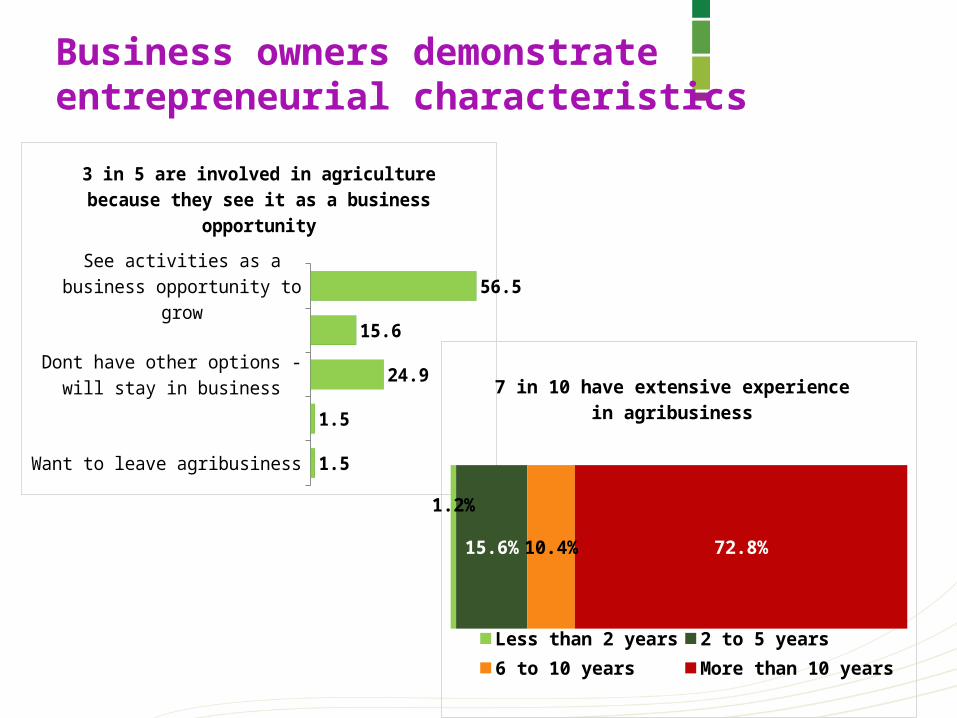
Business owners demonstrate entrepreneurial characteristics
Want to leave agribusiness
Do not want to grow the business
Dont have other options - will stay in business
Love farming dont want to do anything else
See activities as a business opportunity to grow
1.5
1.5
24.9
15.6
56.5
3 in 5 are involved in agriculture because they see it as a business
opportunity
1.2%
15.6%10.4% 72.8%
7 in 10 have extensive experience in agribusiness
Less than 2 years 2 to 5 years
6 to 10 years More than 10 years
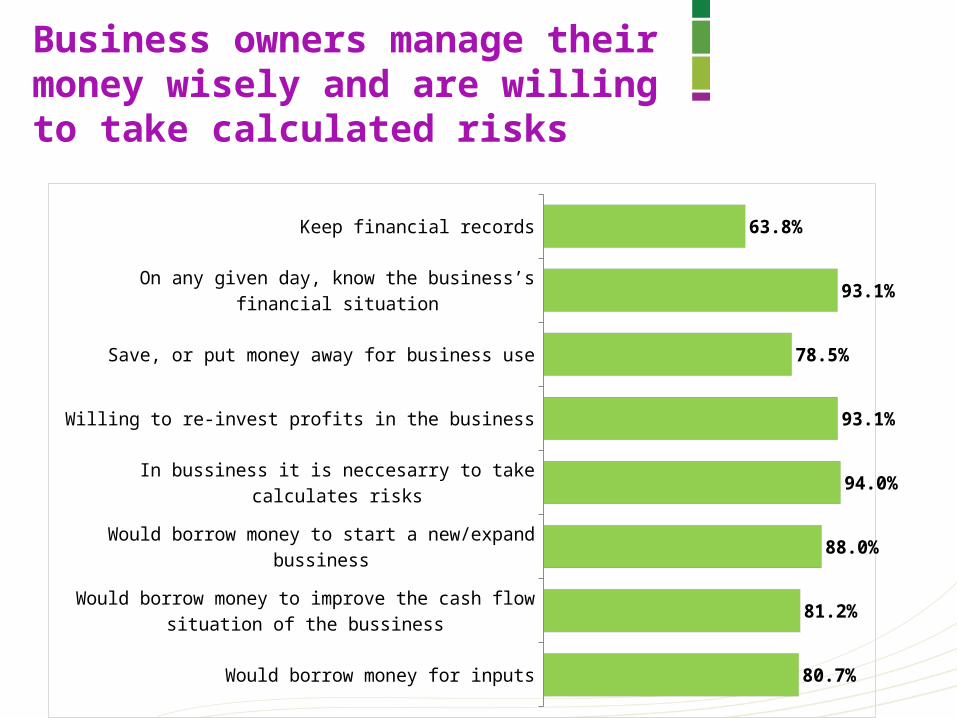
Business owners manage their money wisely and are willing to take calculated risks
Keep financial records
On any given day, know the business’s financial situation
Save, or put money away for business use
Willing to re-invest profits in the business
In bussiness it is neccesarry to take calculates risks
Would borrow money to start a new/expand bussiness
Would borrow money to improve the cash flow situation of the bussiness
Would borrow money for inputs
63.8%
93.1%
78.5%
93.1%
94.0%
88.0%
81.2%
80.7%
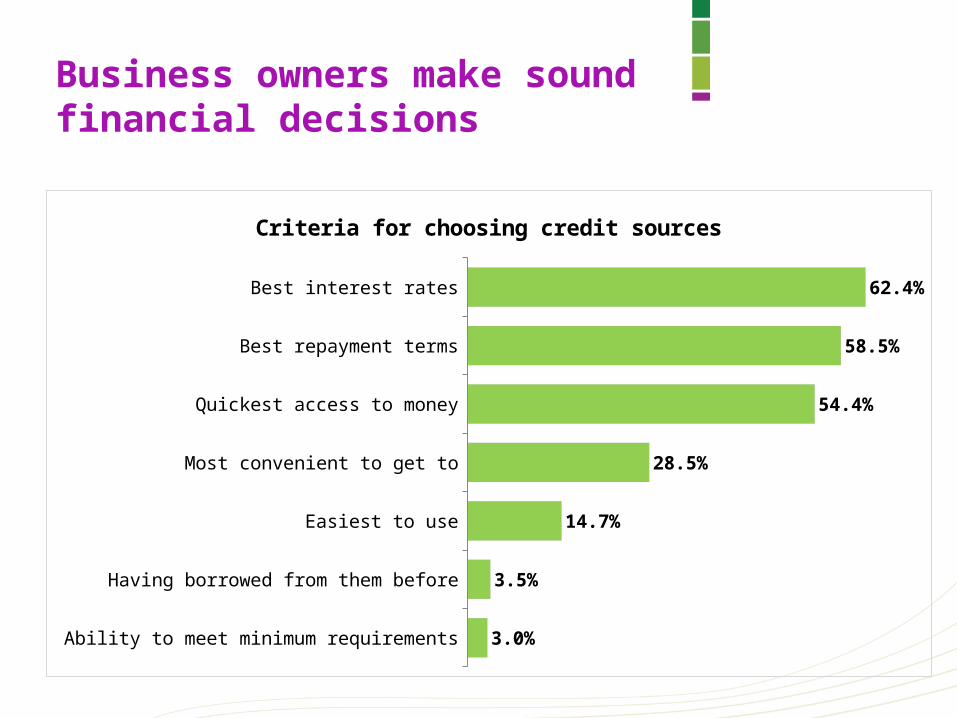
Business owners make soundfinancial decisions
Ability to meet minimum requirements
Having borrowed from them before
Easiest to use
Most convenient to get to
Quickest access to money
Best repayment terms
Best interest rates
3.0%
3.5%
14.7%
28.5%
54.4%
58.5%
62.4%
Criteria for choosing credit sources

Research Issues
• What makes this group of business owners so different?
• What will incentivise them to be more productive?

AgFiMS Tanzania 2011 Business Environment
Is the environment conducive for these entrepreneurs
to achieve business success?
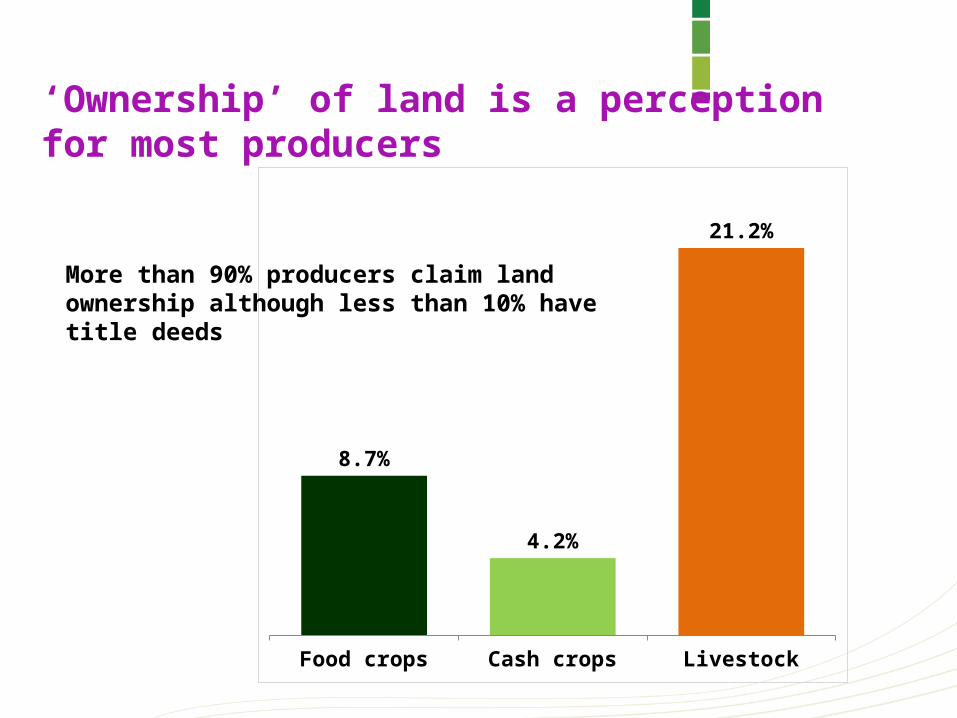
Food crops Cash crops Livestock
8.7%
4.2%
21.2%
‘Ownership’ of land is a perception for most producers
More than 90% producers claim land ownership although less than 10% have title deeds
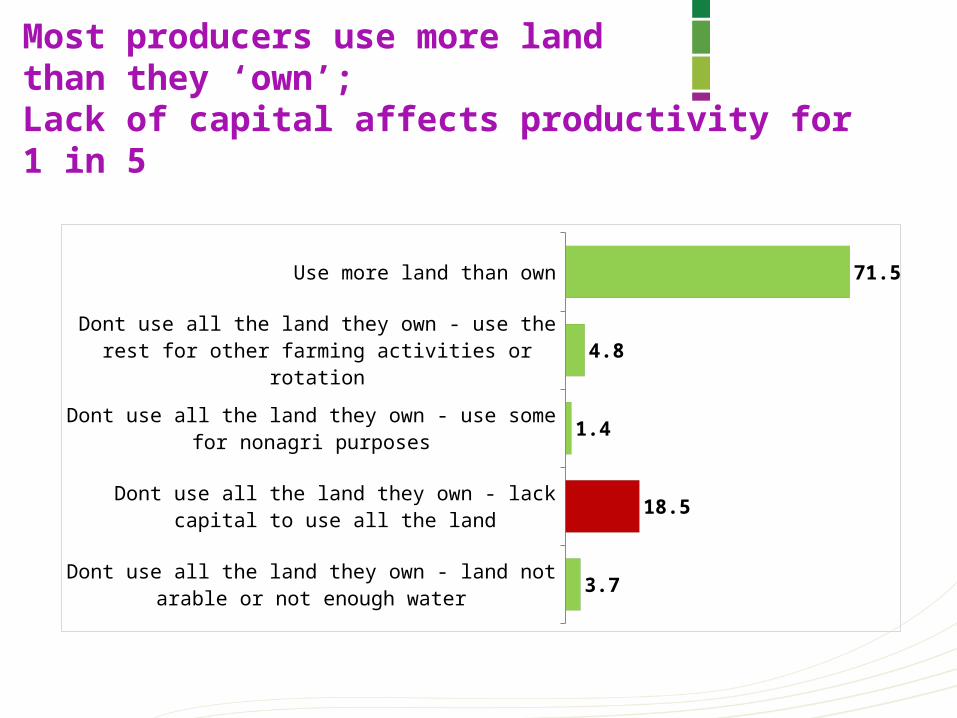
Most producers use more land than they ‘own’; Lack of capital affects productivity for 1 in 5
Dont use all the land they own - land not arable or not enough water
Dont use all the land they own - lack capital to use all the land
Dont use all the land they own - use some for nonagri purposes
Dont use all the land they own - use the rest for other farming activities or rotation
Use more land than own
3.7
18.5
1.4
4.8
71.5
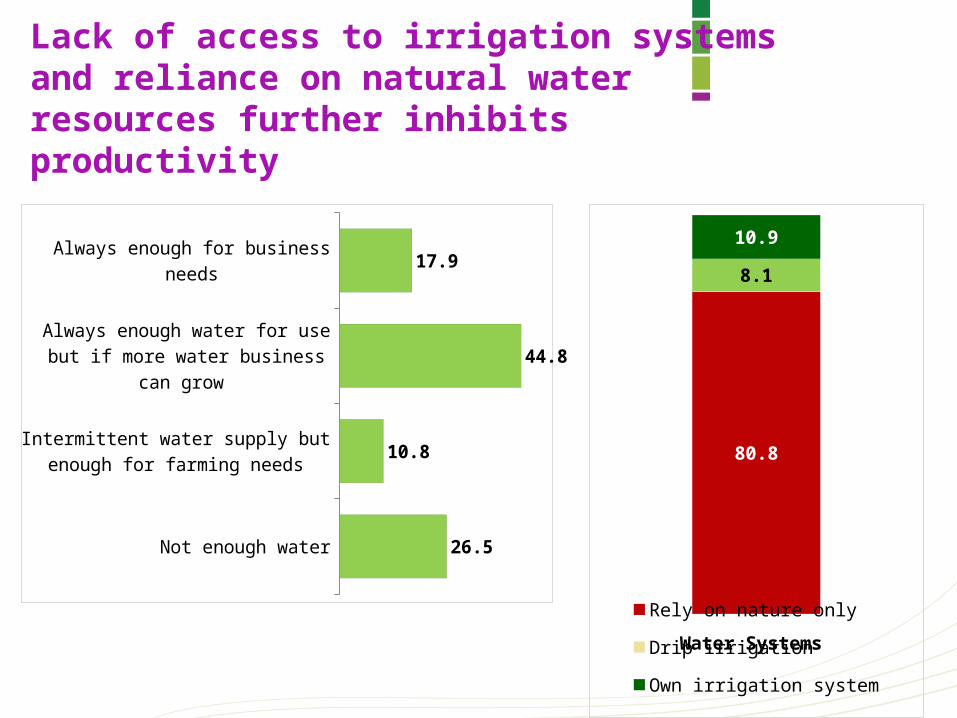
Lack of access to irrigation systems and reliance on natural water resources further inhibits productivity
Not enough water
Intermittent water supply but enough for farming needs
Always enough water for use but if more water business can grow
Always enough for business needs
26.5
10.8
44.8
17.9
80.8
8.1
10.9
Rely on nature only
Drip irrigation
Own irrigation system
Water Systems
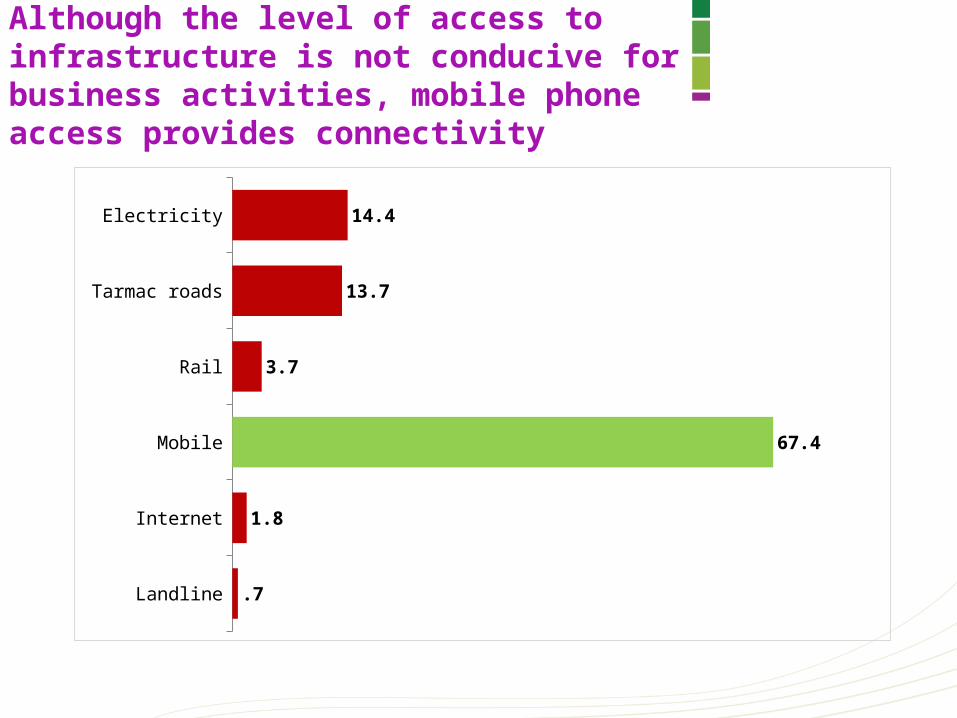
Although the level of access to infrastructure is not conducive for business activities, mobile phone access provides connectivity
Electricity
Tarmac roads
Rail
Mobile
Internet
Landline
14.4
13.7
3.7
67.4
1.8
.7

Limitations in the business environment seems to result in distressed sales
Sell mainly in village or to pub-
lic32.1%
Sell mainly to middle-
men19.5%
Sell to a co-op, whole-
saler, trad-ing com-pany or govern-
ment48.3%
Distressed sales?
12% sell on contract
10% sell all products on
contract
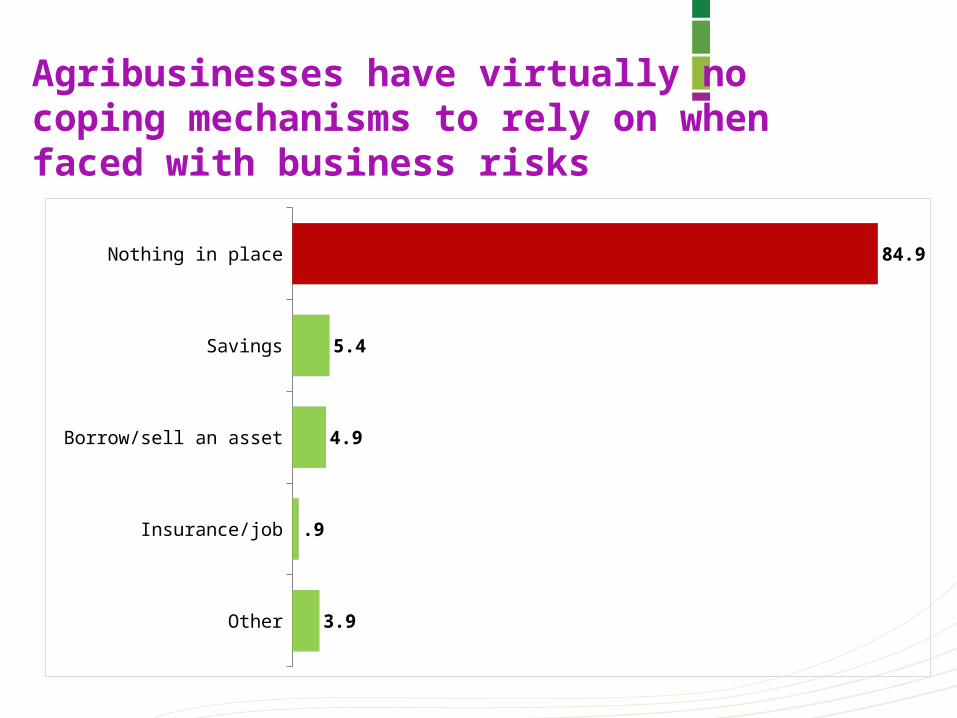
Other
Insurance/job
Borrow/sell an asset
Savings
Nothing in place
3.9
.9
4.9
5.4
84.9
Agribusinesses have virtually no coping mechanisms to rely on when faced with business risks
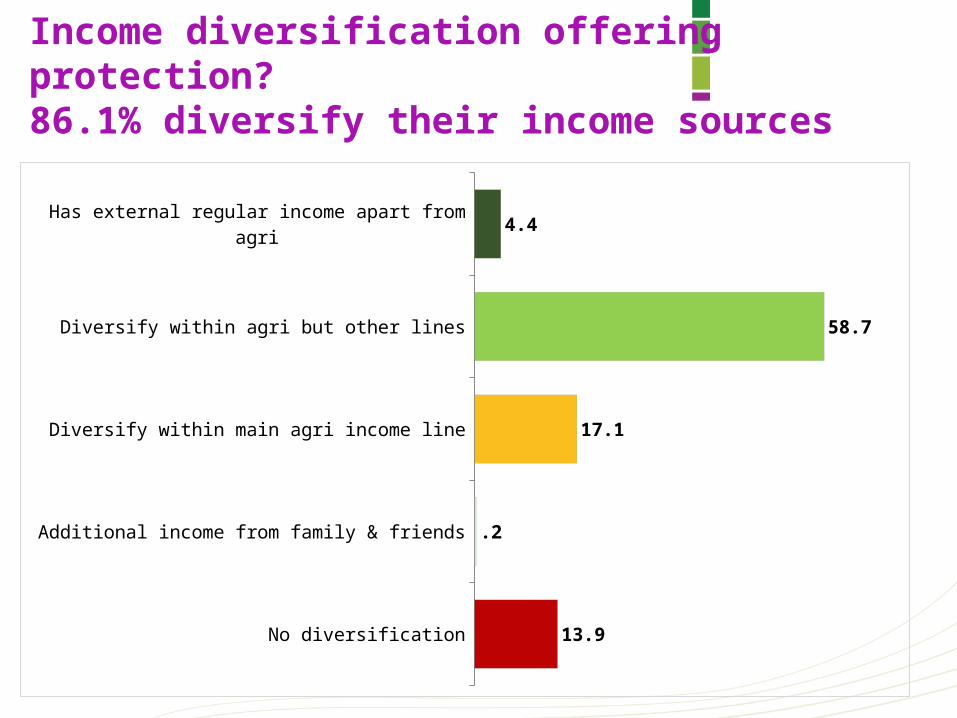
Income diversification offering protection?86.1% diversify their income sources
No diversification
Additional income from family & friends
Diversify within main agri income line
Diversify within agri but other lines
Has external regular income apart from agri
13.9
.2
17.1
58.7
4.4
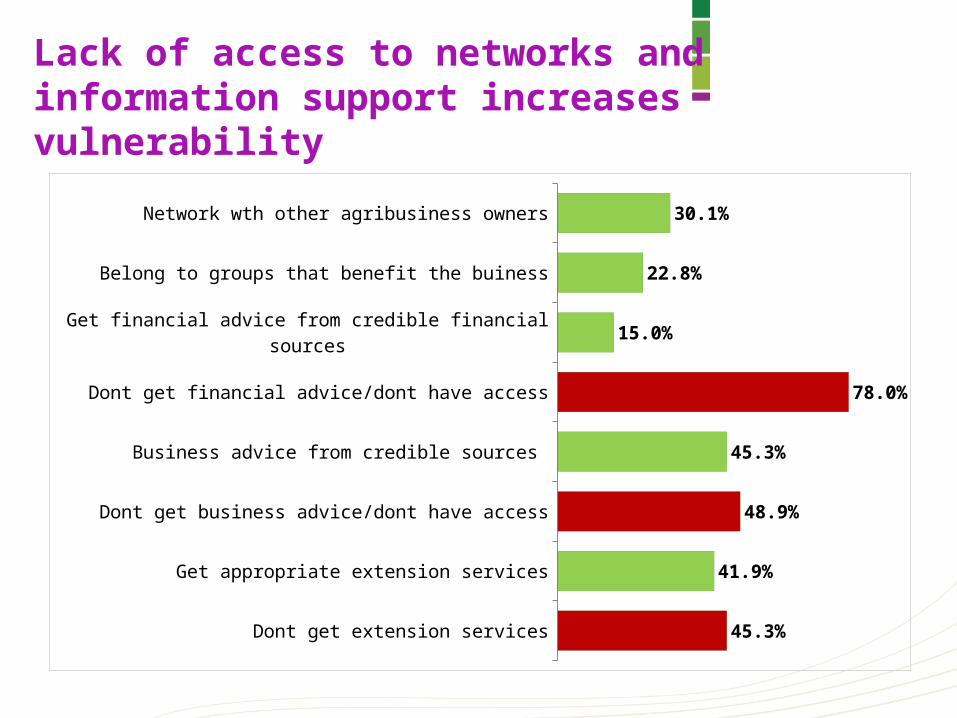
Lack of access to networks and information support increases vulnerability
Network wth other agribusiness owners
Belong to groups that benefit the buiness
Get financial advice from credible financial sources
Dont get financial advice/dont have access
Business advice from credible sources
Dont get business advice/dont have access
Get appropriate extension services
Dont get extension services
30.1%
22.8%
15.0%
78.0%
45.3%
48.9%
41.9%
45.3%
Research Issues
• Better understanding of risk and risk mitigation
• Tanzania’s history – the impact of nationalisation of co-ops on groups and networking. How was social capital affected?
• Comparing Tanzania and Kenya – what makes Kenyan agri-businesses different?
AgFiMS Tanzania 2011 Financial Business Operations
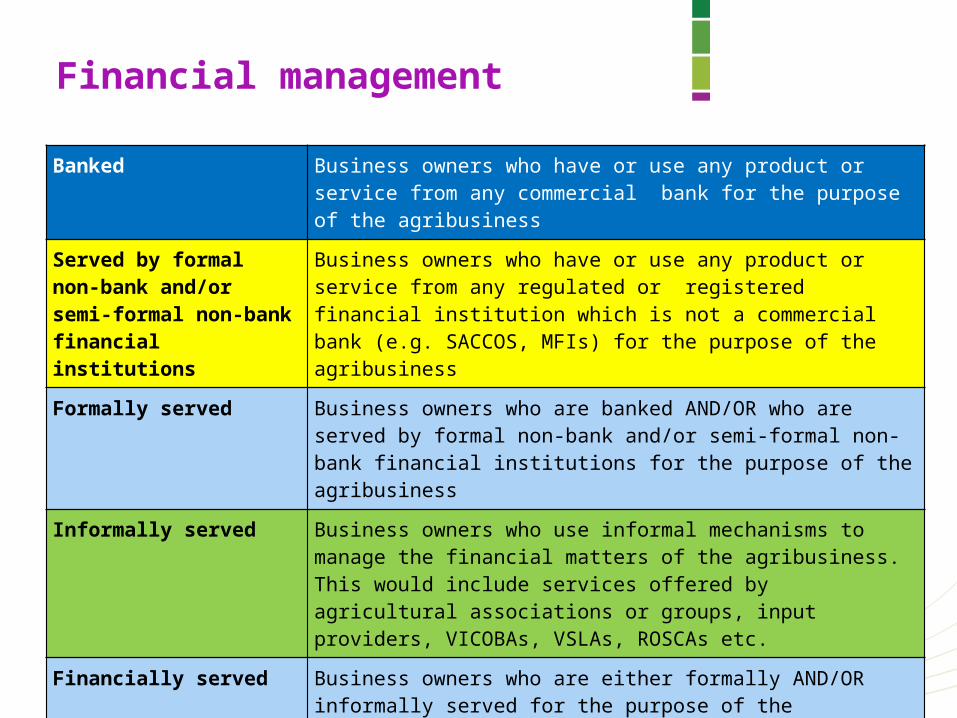
Financial management
Banked Business owners who have or use any product or service from any commercial bank for the purpose of the agribusiness
Served by formal non-bank and/or semi-formal non-bank financial institutions
Business owners who have or use any product or service from any regulated or registered financial institution which is not a commercial bank (e.g. SACCOS, MFIs) for the purpose of the agribusiness
Formally served Business owners who are banked AND/OR who are served by formal non-bank and/or semi-formal non-bank financial institutions for the purpose of the agribusiness
Informally served Business owners who use informal mechanisms to manage the financial matters of the agribusiness. This would include services offered by agricultural associations or groups, input providers, VICOBAs, VSLAs, ROSCAs etc.
Financially served Business owners who are either formally AND/OR informally served for the purpose of the agribusiness
Financially unserved/excluded
Business owners who are neither formally OR informally served for the purpose of the agribusiness
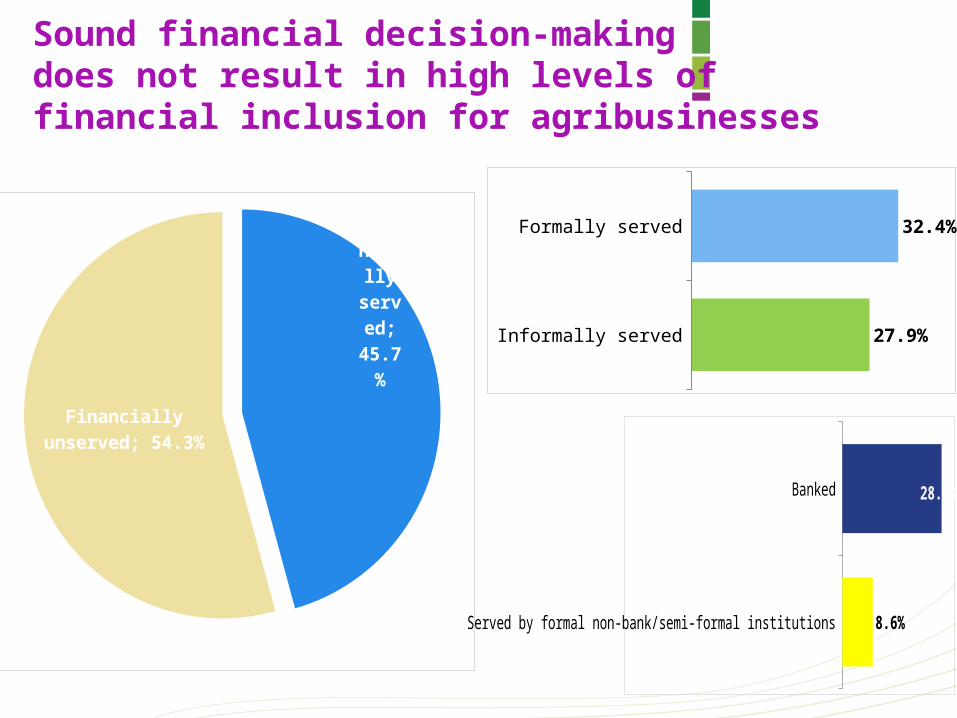
Sound financial decision-making does not result in high levels of financial inclusion for agribusinesses
Finan-ciall
y served; 45.7%
Financially unserved;
54.3%
Formally served
Informally served
32.4%
27.9%
Banked
Served by formal non-bank/semi-formal institutions
28.2%
8.6%
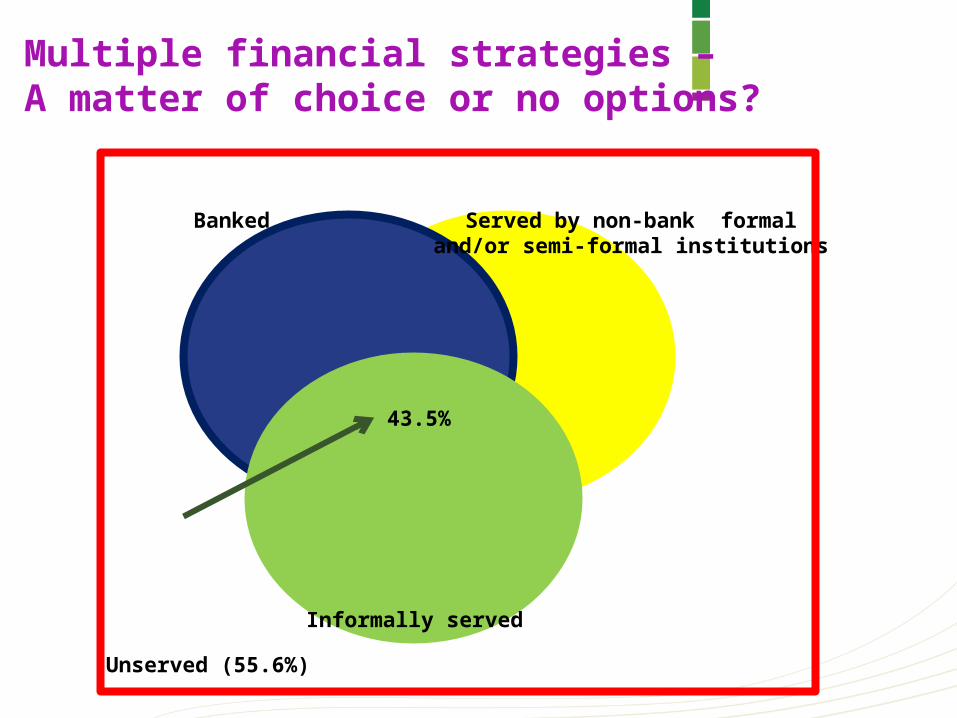
Multiple financial strategies – A matter of choice or no options?
Banked Served by non-bank formaland/or semi-formal institutions
Unserved (55.6%)
Informally served
43.5%
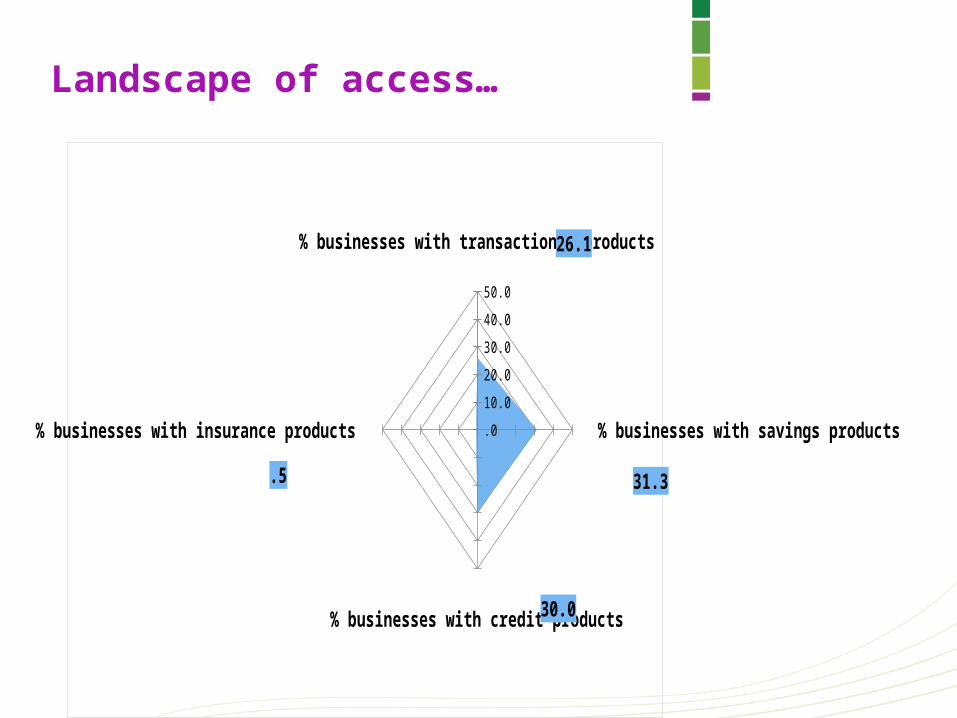
% businesses with transactional products
% businesses with savings products
% businesses with credit products
% businesses with insurance products .0
10.0
20.0
30.0
40.0
50.0
26.1
31.3
30.0
.5
Landscape of access…

147 000 banked …What do they use banks for?
Transactional products
Savings products
Credit products
Insurance .0
20.0
40.0
60.0
80.0
100.0
92.4
97.8
13.8
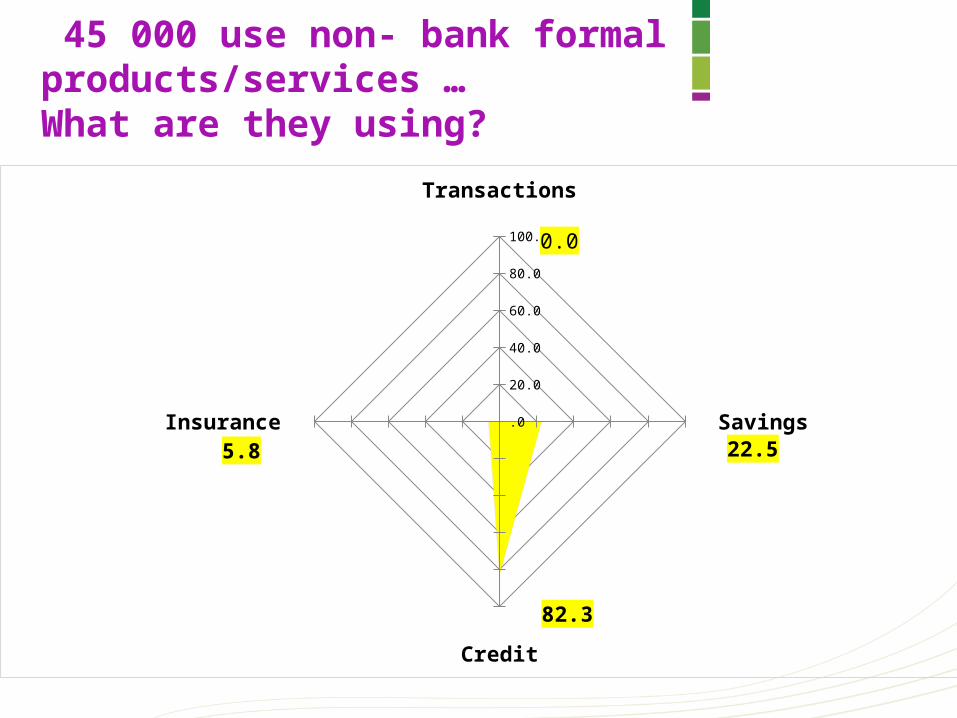
45 000 use non- bank formal products/services …What are they using?
Transactions
Savings
Credit
Insurance .0
20.0
40.0
60.0
80.0
100.00.0
22.5
82.3
5.8
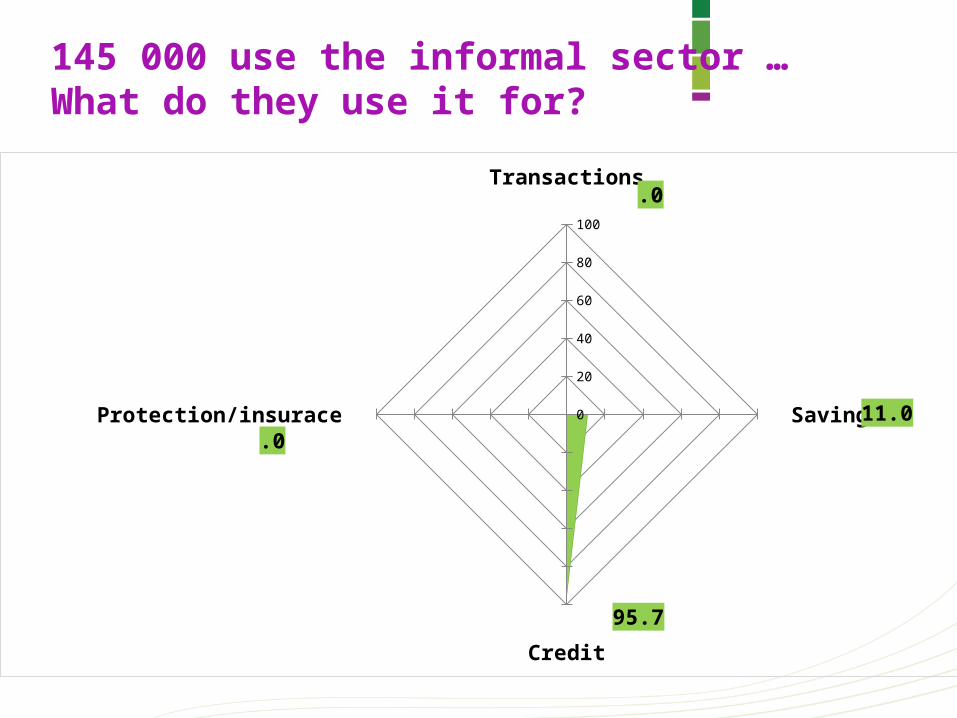
145 000 use the informal sector …What do they use it for?
Transactions
Saving
Credit
Protection/insurace 0
20
40
60
80
100
.0
11.0
95.7
.0
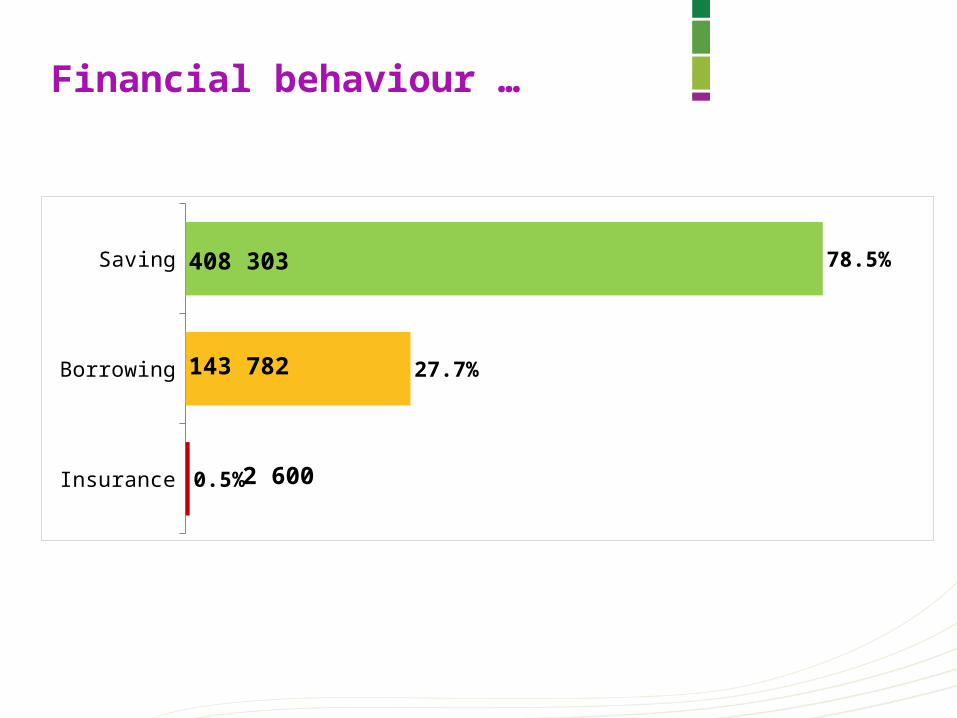
Saving
Borrowing
Insurance
78.5%
27.7%
0.5%
Financial behaviour …
143 782
2 600
408 303
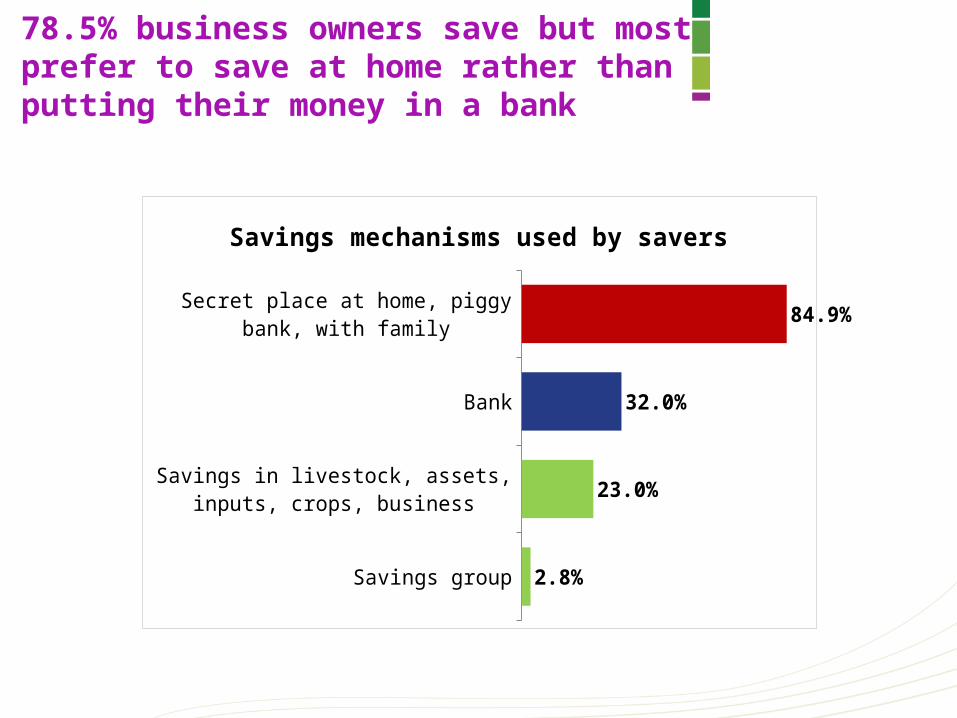
78.5% business owners save but most prefer to save at home rather than putting their money in a bank
Savings group
Savings in livestock, assets, inputs, crops, business
Bank
Secret place at home, piggy bank, with family
2.8%
23.0%
32.0%
84.9%
Savings mechanisms used by savers
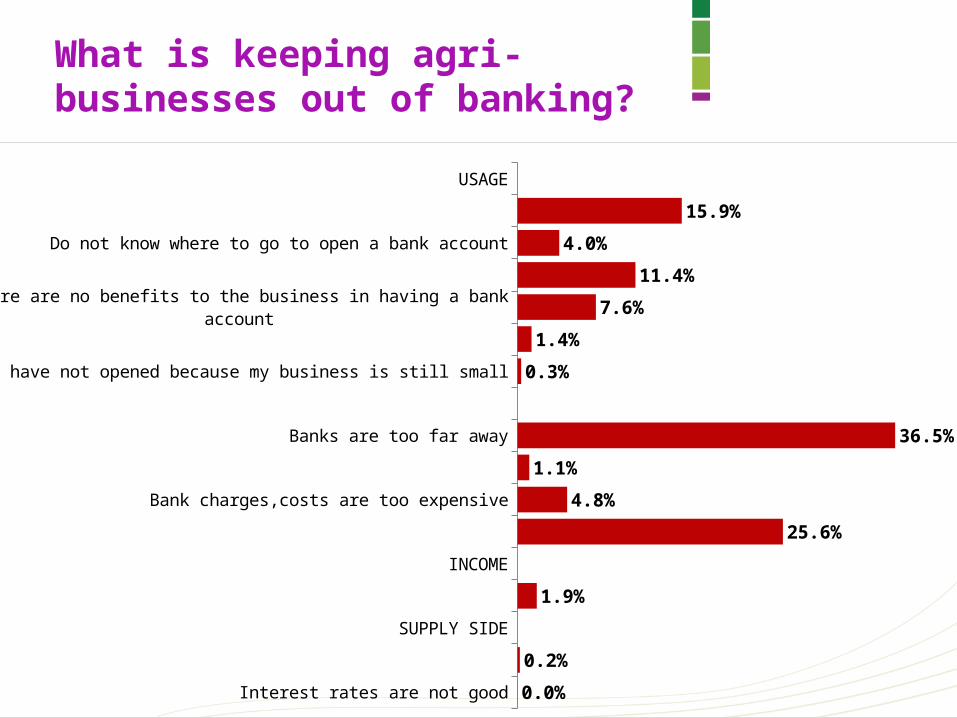
What is keeping agri-businesses out of banking?
USAGE
Do not know how to open a bank account
Do not know where to go to open a bank accountBusiness does not need a bank account, use other facilities that
workThere are no benefits to the business in having a bank account
I have not decided on opening an account yet
I have not opened because my business is still small
ACCESS
Banks are too far away
Bank operating hours are inconvenient
Bank charges,costs are too expensive
Business does not meet the requirements for a bank account
INCOME
I don’t have enough money to open a bank account
SUPPLY SIDE
I do not like the disturbance regarding bank services
Interest rates are not good
15.9%
4.0%
11.4%
7.6%
1.4%
0.3%
36.5%
1.1%
4.8%
25.6%
1.9%
0.2%
0.0%
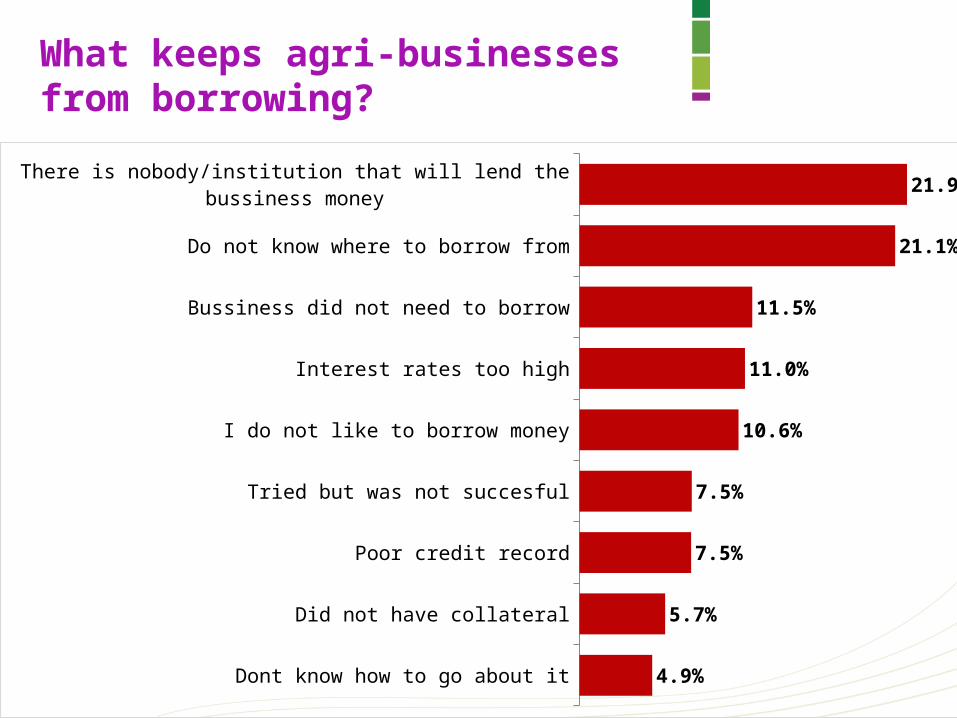
What keeps agri-businesses from borrowing?
There is nobody/institution that will lend the bussiness money
Do not know where to borrow from
Bussiness did not need to borrow
Interest rates too high
I do not like to borrow money
Tried but was not succesful
Poor credit record
Did not have collateral
Dont know how to go about it
21.9%
21.1%
11.5%
11.0%
10.6%
7.5%
7.5%
5.7%
4.9%
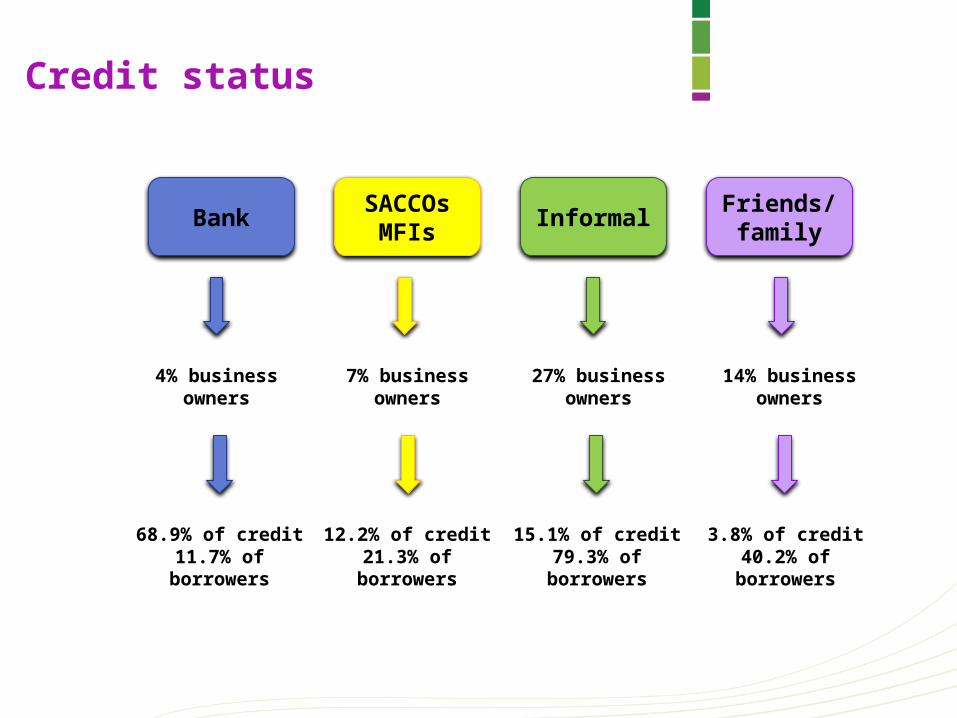
Credit status
BankSACCOs
MFIsInformal
Friends/ family
4% business owners
7% business owners
27% business owners
14% business owners
68.9% of credit11.7% of
borrowers
12.2% of credit21.3% of
borrowers
15.1% of credit79.3% of
borrowers
3.8% of credit40.2% of
borrowers
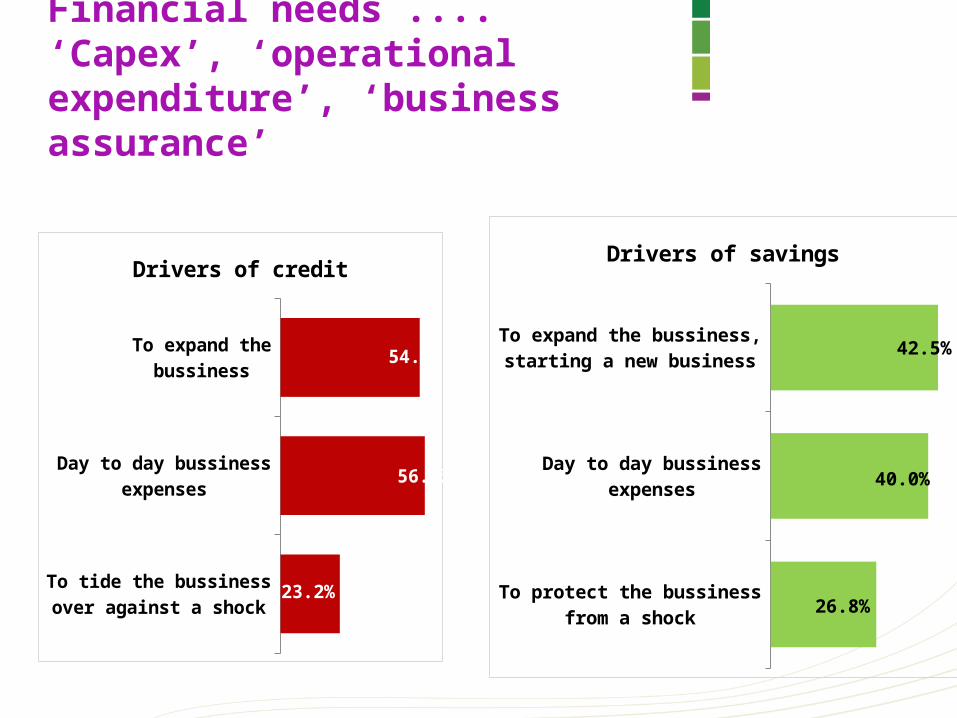
Financial needs ....‘Capex’, ‘operational expenditure’, ‘business assurance’
To expand the bus-siness
Day to day bussiness expenses
To tide the bussiness over against a shock
54.3%
56.2%
23.2%
Drivers of credit
To expand the bussiness, starting a new business
Day to day bussiness expenses
To protect the bussiness from a shock
42.5%
40.0%
26.8%
Drivers of savings
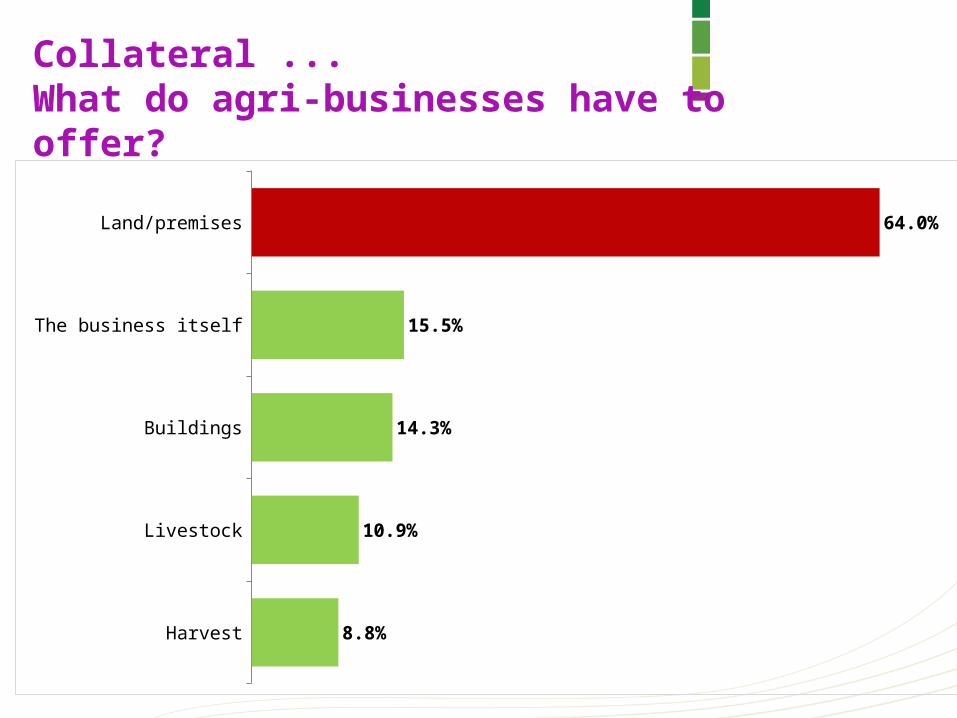
Collateral ... What do agri-businesses have to offer?
Land/premises
The business itself
Buildings
Livestock
Harvest
64.0%
15.5%
14.3%
10.9%
8.8%
AgFiMS Tanzania 2011 Identifying Development Needs
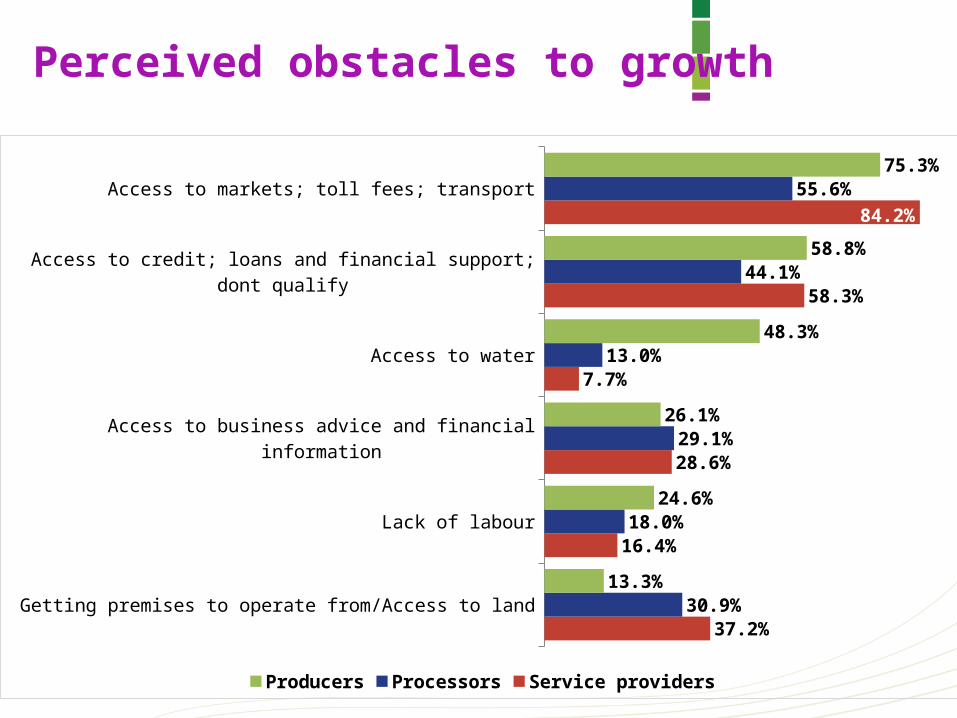
Perceived obstacles to growth
Getting premises to operate from/Access to land
Lack of labour
Access to business advice and financial information
Access to water
Access to credit; loans and financial support; dont qualify
Access to markets; toll fees; transport
37.2%
16.4%
28.6%
7.7%
58.3%
84.2%
30.9%
18.0%
29.1%
13.0%
44.1%
55.6%
13.3%
24.6%
26.1%
48.3%
58.8%
75.3%
Producers Processors Service providers

Key capacities for Agri-businesses
• Usage of financial services & products
•Accessing credit
• Access to/usage of credible financial advisory resources
• Access to/usage of credible business advisory resources
• Access to/exposure to appropriate agricultural advice/support
• Access to networks &support structures; coping mechanisms
• Access to infrastructure
• Access to markets
• Access to/usage of credible financial advisory resources
• Access to/usage of credible business advisory resources
• Access to/exposure to appropriate agricultural advice/support
• Social capital – Access to networks &support structures;
coping mechanisms
Formal inclusionTop income category
AgFiMS Tanzania 2011 Evidence-led Intervention
Approach?
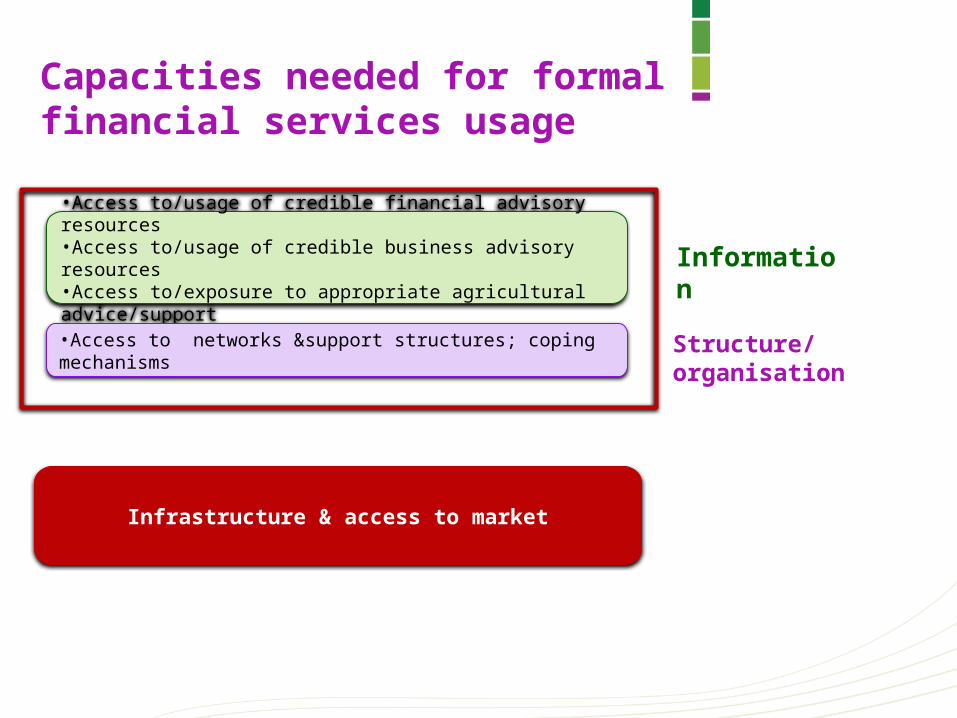
Capacities needed for formalfinancial services usage
•Access to/usage of credible financial advisory resources•Access to/usage of credible business advisory resources•Access to/exposure to appropriate agricultural advice/support
•Access to networks &support structures; coping mechanisms
Information
Structure/organisation
Infrastructure & access to market
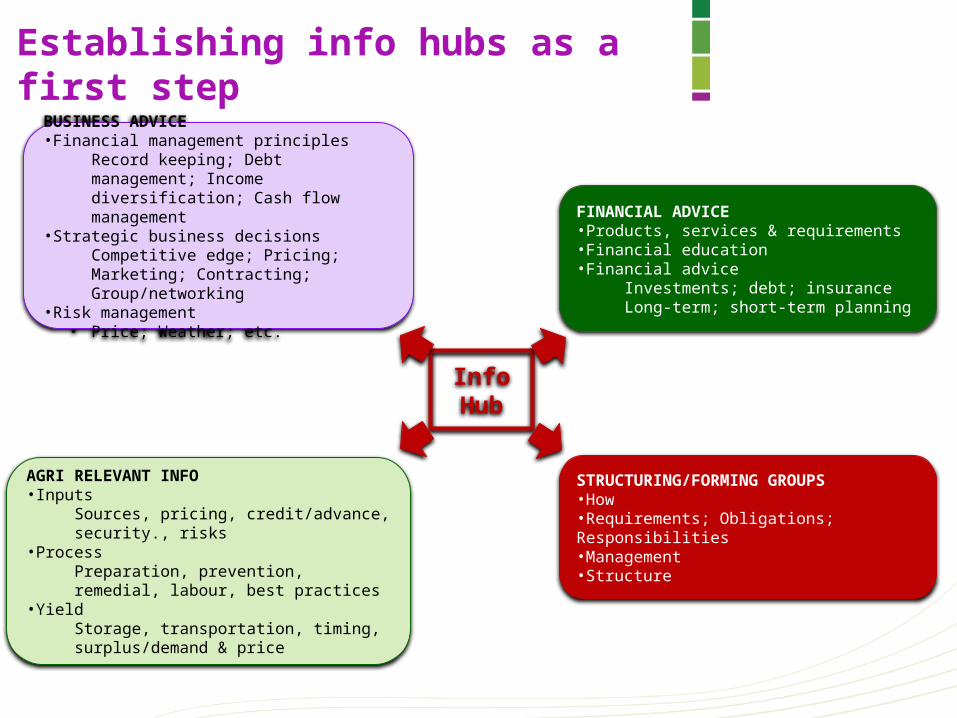
Info Hub
BUSINESS ADVICE•Financial management principles
Record keeping; Debt management; Income diversification; Cash flow management
•Strategic business decisionsCompetitive edge; Pricing; Marketing; Contracting; Group/networking
•Risk management• Price; Weather; etc.
AGRI RELEVANT INFO•Inputs
Sources, pricing, credit/advance, security., risks
•ProcessPreparation, prevention, remedial, labour, best practices
•YieldStorage, transportation, timing, surplus/demand & price
FINANCIAL ADVICE•Products, services & requirements•Financial education•Financial advice
Investments; debt; insuranceLong-term; short-term planning
STRUCTURING/FORMING GROUPS•How•Requirements; Obligations; Responsibilities•Management•Structure
Establishing info hubs as a first step
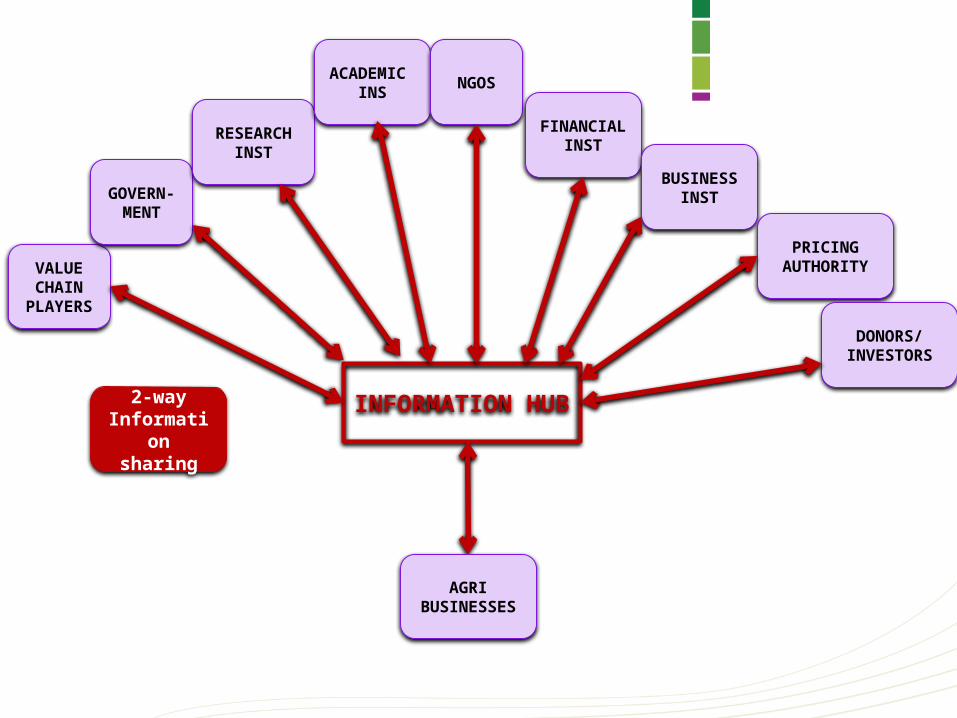
INFORMATION HUB
VALUE CHAIN PLAYER
S
GOVERN-MENT
RESEARCH
INST
ACADEMIC INS
NGOS
FINANCIAL
INSTBUSINES
SINST
PRICINGAUTHORITY
DONORS/INVESTORS
AGRIBUSINESSE
S
2-wayInformati
on sharing
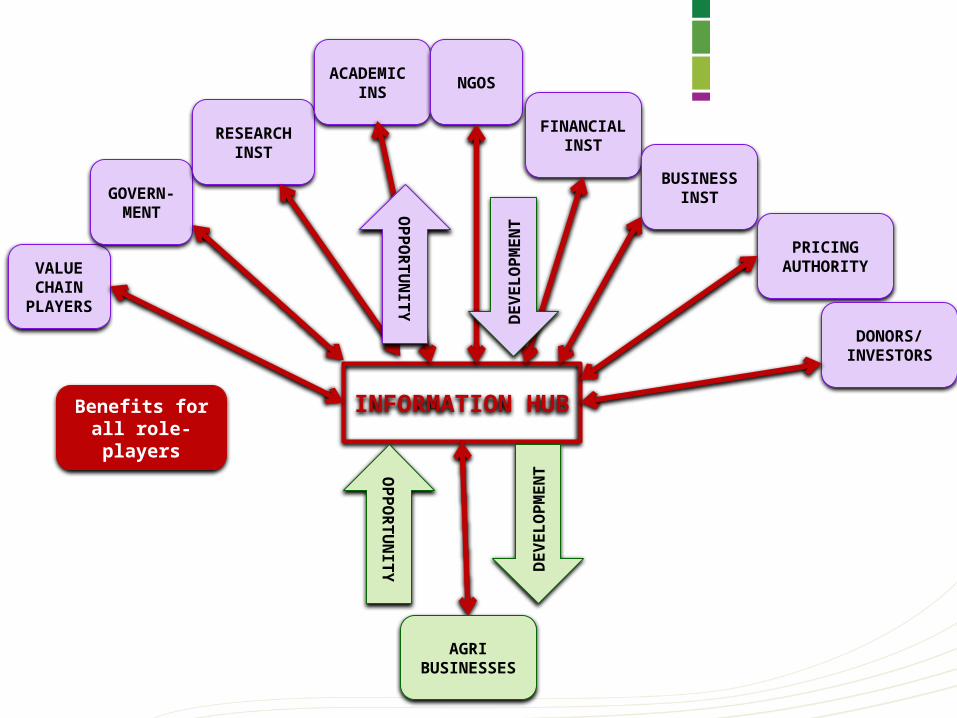
INFORMATION HUB
VALUE CHAIN PLAYER
S
GOVERN-MENT
RESEARCH
INST
ACADEMIC INS
NGOS
FINANCIAL
INSTBUSINES
SINST
PRICINGAUTHORITY
DONORS/INVESTORS
AGRIBUSINESSE
S
OP
PO
RTU
NIT
Y
DEV
ELO
PM
EN
T
OP
PO
RTU
NIT
Y
DEV
ELO
PM
EN
T
Benefits for all role-players
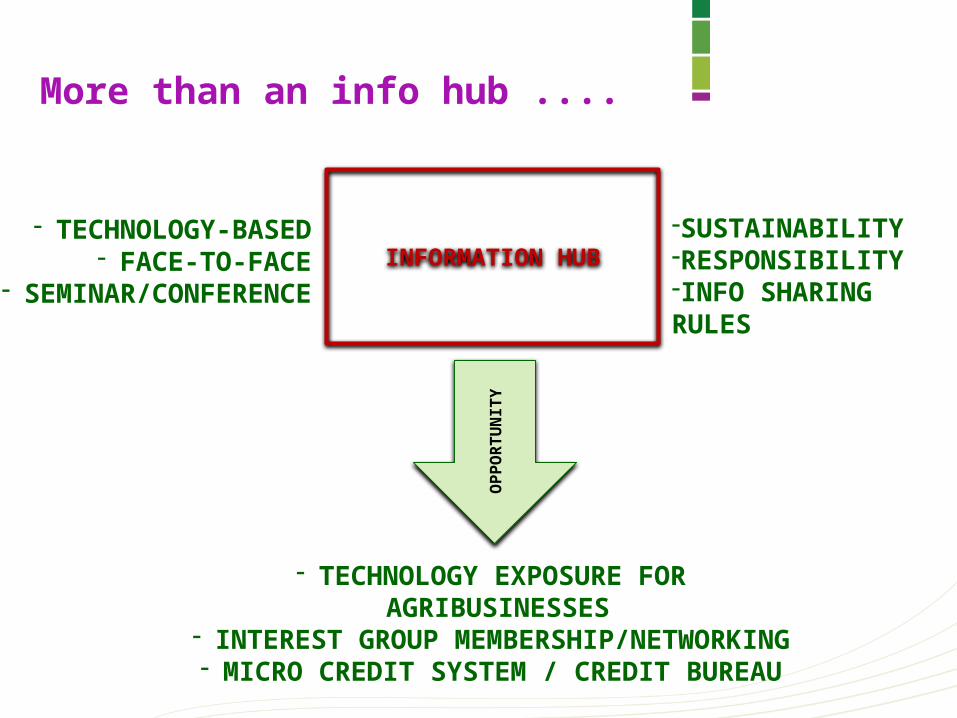
- TECHNOLOGY-BASED- FACE-TO-FACE
- SEMINAR/CONFERENCE
-SUSTAINABILITY-RESPONSIBILITY-INFO SHARING RULES
INFORMATION HUB
- TECHNOLOGY EXPOSURE FOR AGRIBUSINESSES- INTEREST GROUP MEMBERSHIP/NETWORKING
- MICRO CREDIT SYSTEM / CREDIT BUREAU
OP
PO
RTU
NIT
Y
More than an info hub ....
Towards change …
• Effective dissemination of the AgFiMS findings
• Facilitating debate/dialogue between different stakeholders with regard to a holistic approach to agricultural development basic on a common understanding of the status quo
• Specific focused discussions to guide interventions• Policy makers – what do we need to change in the business
environment?
• Financial institutions – what kind of services and/or products do agri-business need?
• Telco’s – how can we develop products/services for agri-businesses? Can our platforms be used broader than currently?
• Development agents – what should the focus/priorities be? Where do we allocate resources?
• Getting buy-in from all role-players for the information-hub approach• Agri-business buy-in crucial
Towards change …
• Determining which activities are being undertaken by various players in the agricultural sector • Collaborative effort aligned with multiple objectives
• Avoid duplication
• Share resources and align activities
• Initiate discussions with potential technical partners for the development of the information hub platform

Thank you