Embed Size (px)
Citation preview
GE.16-07126(E)
Conference of the Parties
Twenty-second session
Marrakech, 7–18 November 2016
Item X of the provisional agenda
Aggregate effect of the intended nationally determined contributions: an update
Synthesis report by the secretariat
Summary
This synthesis report on the aggregate effect of the 161 intended nationally
determined contributions (INDCs) communicated by 189 Parties by 4 April 2016 provides
estimates of the aggregate greenhouse gas emission levels in 2025 and 2030 resulting from
the implementation of those INDCs. Those levels are compared with the emission levels in
1990, 2000 and 2010 as well as with emission trajectories consistent with (1) action
communicated by Parties for the pre-2020 period and (2) holding the average global
temperature rise below 2 ºC and 1.5 ºC above pre-industrial levels. This document
identifies and discusses trends that indicate opportunities for enhanced action to address
climate change in the longer term. In addition, it synthesizes information relating to
adaptation, which was included in the INDCs communicated by 137 Parties.
United Nations FCCC/CP/2016/2
Distr.: General
2 May 2016
Original: English
FCCC/CP/2016/2
2
Contents
Paragraphs Page
I. Summary ................................................................................................................ 1–74 3
A. Mandate and approach .................................................................................... 1–6 3
B. Overview of the communicated intended nationally determined contributions 7–8 4
C. Synthesis of the information in the communicated intended nationally
determined contributions ................................................................................ 9–33 4
D. Aggregate effect of the communicated intended nationally determined
contributions ................................................................................................... 34–58 9
E. Adaptation component of the intended nationally determined contributions . 59–74 16
II. Aggregate effect of the communicated intended nationally determined
contributions ............................................................................................................ 75–329 19
A. Mandate and background ................................................................................ 75–81 19
B. Overview of the communicated intended nationally determined contributions 82–85 20
C. Approach and methods ................................................................................... 86–115 21
D. Synthesis of the information in the communicated intended nationally
determined contributions ................................................................................ 116–191 28
E. Aggregate effect of the communicated intended nationally determined
contributions ................................................................................................... 192–251 42
F. Adaptation component of the communicated intended nationally
determined contributions ................................................................................ 252–329 59
FCCC/CP/2016/2
3
I. Summary
A. Mandate and approach
1. The Conference of the Parties (COP), by decision 1/CP.21, paragraph 19, requested
the secretariat to update the synthesis report prepared pursuant to decision 1/CP.20,
paragraph 16(b) so as to cover all the information in the intended nationally determined
contributions (INDCs) communicated by Parties by 4 April 2016.
2. This document, containing the update referred to in paragraph 1 above, contains
information compiled and synthesized from the 161 INDCs of 189 Parties communicated
by 4 April 2016. The scope of the update is summarized in paragraph 80 below. An online
technical annex contains further detailed information on the methodology used for the
quantitative assessment presented in this document.1
3. This document provides estimates of the aggregate greenhouse gas (GHG) emission
levels in 2025 and 2030 resulting from the implementation of the communicated INDCs.
The estimates have been calculated in both annual and cumulative terms. In addition, the
document synthesizes information relating to the adaptation component of the INDCs
communicated by Parties.
4. Given that not all Parties had communicated an INDC by 4 April 2016, and that not
all of the INDCs cover all gases and sectors, the estimated aggregate level of emissions
covered by the INDCs is a subset of total global emissions.2 To arrive at a global estimate
of emissions for a certain year, Intergovernmental Panel on Climate Change (IPCC)
reference scenarios have been used to estimate the emissions not covered by the INDCs
until 2030. The chosen reference scenarios capture action communicated by Parties for the
pre-2020 period and assume constant climate policies thereafter (hereinafter referred to as
pre-INDC trajectories). Global emission levels in 2025 and 2030 based on the INDCs are
thus arrived at by adding the aggregate emissions resulting from the INDCs to the
remaining emissions derived from IPCC reference scenarios.3 The estimates are presented
as median values and associated ranges, owing to the various assumptions and conditions
specified by Parties in their submissions and the uncertainties associated with gaps in
information.
5. The estimated global emission levels in 2025 and 2030 are discussed in relation to
the following past and projected future emission trends:
(a) Global GHG emission levels in 1990, 2000 and 2010;
(b) Global GHG emission levels in 2025 and 2030 consistent with pre-INDC
trajectories;
1 Available at <http://unfccc.int/focus/indc_portal/items/9240.php>.
2 INDCs also do not include emissions from international aviation and maritime transport. Assumptions
about such emissions are based on the post-2020 carbon-neutral growth target presented by the
International Civil Aviation Organization (see
<http://www.icao.int/Meetings/a38/Documents/WP/wp430_en.pdf>) and the range of carbon dioxide
emission projection scenarios presented by the International Maritime Organization (IMO) in the
Third IMO GHG Study 2014 (see
<http://www.imo.org/en/OurWork/Environment/PollutionPrevention/AirPollution/Pages/Greenhouse-
Gas-Studies-2014.aspx>).
3 For further information on the approach, see chapter II.C below.
FCCC/CP/2016/2
4
(c) Global GHG emission levels in 2025 and 2030 under least-cost scenarios
consistent with holding the average global temperature rise below 2 °C above pre-industrial
levels (hereinafter referred to as 2 °C scenarios);
(d) Global GHG emission levels in 2025 and 2030 under scenarios consistent
with holding the average global temperature rise below 1.5 °C above pre-industrial levels
(hereinafter referred to as 1.5 °C scenarios).
6. Finally, with a view to providing information on the aggregate effect of the
communicated INDCs beyond 2030, a number of trends that indicate opportunities for
enhanced action in the longer term are discussed. Such trends, identified from the
information contained in the INDCs, are discussed with regard to participation, policies and
institutions, cooperation, national circumstances and ambition.
B. Overview of the communicated intended nationally determined
contributions
7. As at 4 April 2016, 161 INDCs had been received, covering 189 Parties to the
Convention,4 including one regional economic integration organization,5 representing 96
per cent of Parties to the Convention. The Parties that have communicated INDCs cover
about 99 per cent of the emissions of all Parties to the Convention.6 All Parties included
information on their mitigation contributions. A total of 137 Parties, accounting for 83 per
cent of the INDCs, also included an adaptation component in their INDCs.
8. While the structure and content of the communicated INDCs vary, most7 Parties
explicitly addressed the information elements listed in decision 1/CP.20, paragraph 14.
Most Parties provided additional information, such as on market-based mechanisms,
support needs for the implementation of their INDCs, response measures and economic
diversification.
C. Synthesis of the information in the communicated intended nationally
determined contributions
9. Many of the INDCs are national in scope: they address all major sources and
sinks of national GHG emissions or at least the most significant ones. Several contain
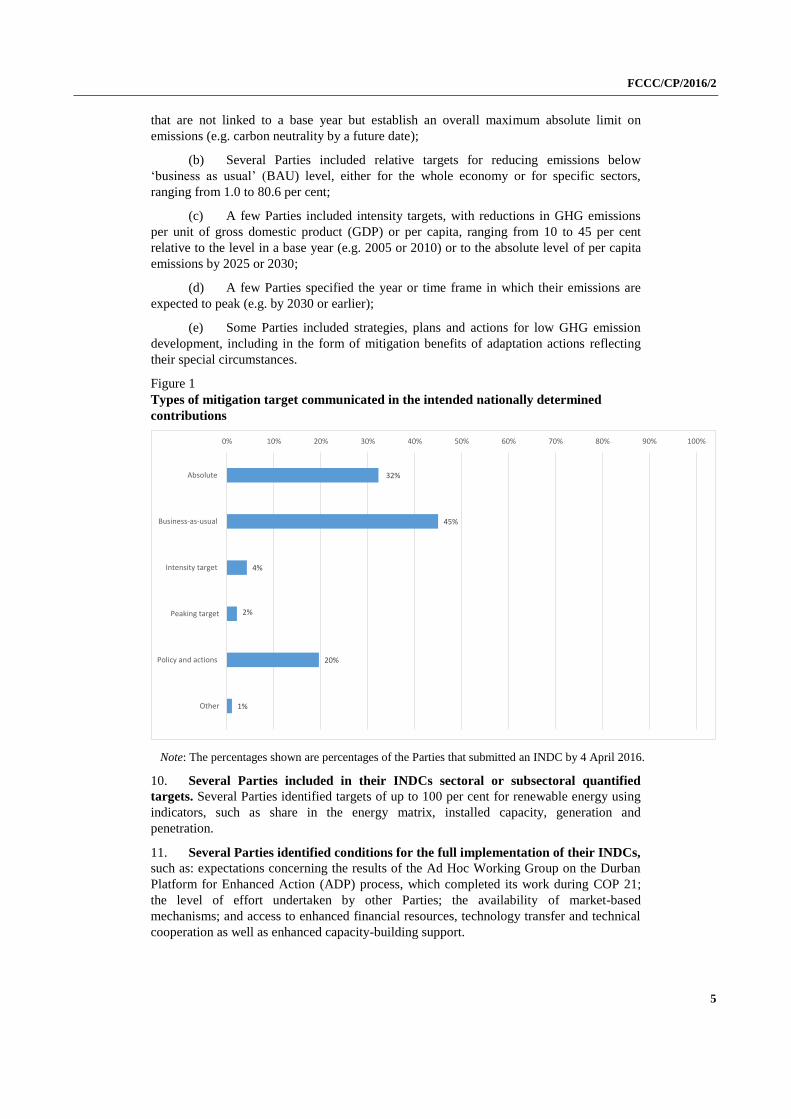
quantified emission reduction targets, which take a variety of forms (see figure 1):
(a) Some Parties included economy-wide mitigation targets, with absolute
emission reduction targets expressed as an emission reduction below the level in a specified
base year, ranging from 9.8 to 75.0 per cent. A few of the INDCs contain absolute targets
4 A complete list of the Parties that submitted INDCs by 4 April 2016 is provided in footnote 31 below.
5 The INDC of the European Union and its member States is counted as one INDC representing 29
Parties (the European Union and its 28 member States).
6 In comparison, the Parties that have submitted INDCs account for 95.7 per cent of global emissions
(including emissions from international aviation and maritime transport and from Parties that are not
Parties to the Convention).
7 In this document, the following qualifiers are applied to denote the percentage of Parties that
submittedINDCsandmentionedtheissueinquestion:“afew”forlessthan10percent;“some”for
10–40percent;“several”for40–70percent;“many”for70–90percent;and“most”for 90 per cent
and above. In chapter I.E below these qualifiers are used to indicate the percentage range of the
INDCs submitted that elaborate on a certain adaptation issue.
FCCC/CP/2016/2
5
that are not linked to a base year but establish an overall maximum absolute limit on
emissions (e.g. carbon neutrality by a future date);
(b) Several Parties included relative targets for reducing emissions below
‘business as usual’ (BAU) level, either for the whole economy or for specific sectors,
ranging from 1.0 to 80.6 per cent;
(c) A few Parties included intensity targets, with reductions in GHG emissions
per unit of gross domestic product (GDP) or per capita, ranging from 10 to 45 per cent
relative to the level in a base year (e.g. 2005 or 2010) or to the absolute level of per capita
emissions by 2025 or 2030;
(d) A few Parties specified the year or time frame in which their emissions are
expected to peak (e.g. by 2030 or earlier);
(e) Some Parties included strategies, plans and actions for low GHG emission
development, including in the form of mitigation benefits of adaptation actions reflecting
their special circumstances.
Figure 1
Types of mitigation target communicated in the intended nationally determined
contributions
Note: The percentages shown are percentages of the Parties that submitted an INDC by 4 April 2016.
10. Several Parties included in their INDCs sectoral or subsectoral quantified
targets. Several Parties identified targets of up to 100 per cent for renewable energy using
indicators, such as share in the energy matrix, installed capacity, generation and
penetration.
11. Several Parties identified conditions for the full implementation of their INDCs,
such as: expectations concerning the results of the Ad Hoc Working Group on the Durban
Platform for Enhanced Action (ADP) process, which completed its work during COP 21;
the level of effort undertaken by other Parties; the availability of market-based
mechanisms; and access to enhanced financial resources, technology transfer and technical
cooperation as well as enhanced capacity-building support.
32%
45%
4%
2%
20%
1%
0% 10% 20% 30% 40% 50% 60% 70% 80% 90% 100%
Absolute
Business-as-usual
Intensity target
Peaking target
Policy and actions
Other
FCCC/CP/2016/2
6
12. Some of the INDCs include an unconditional mitigation component alongside
an enhanced conditional one. Most of the conditional components relate to the provision
of finance, technology or capacity-building support and translate into a percentage increase
in the level of effort associated with the related unconditional component. The percentage
increase is specific to the type of target selected by the Party (e.g. percentage reduction in
emissions against a base year, BAU or emission intensity level) and ranges from 2 to
around 53 per cent of additional mitigation effort.
13. Furthermore, some Parties stated in their INDCs the expectation that negotiations
under the ADP would provide the clarity required for meeting some of the conditions
referred to in paragraph 11 above. Some Parties communicated provisional INDCs or
indicated that they reserve the right to revise their INDCs in the light of the outcome of the
ADP process.
14. In addition to setting mitigation objectives for 2025 or 2030, some Parties included
a longer-term vision for low-emission development. Related goals range from a 25 per
cent GHG emission reduction by 2050 below BAU or base year level (e.g. 1990 or 2000) to
lower per capita emission levels in the future or achieving carbon neutrality by 2050 or
2085.
15. As their reference point, some Parties chose 1990, some chose 2005 and others
referred in their contributions to 2000, 2002, 2006, 2007, 2008, 2009, 2010, 2013, 2014 or
2015. Several Parties specified their level of emissions in a base year or provided
information on BAU reference scenarios for the mitigation objectives expressed relative to
BAU level. Most Parties indicated either a 5- or 10-year implementation period for
their INDCs. Most of the INDCs refer to an implementation timeline of up to 2030, while
some refer to up to 2025. A few of the INDCs communicate targets for both 2025 and
2030, one of which is indicative or interim. A few Parties indicated a target for 2035 or
2040, while others included a long-term target for 2050, in conjunction with another target
year. Furthermore, some Parties communicated an implementation period starting before
2020, several starting in 2020 and a few starting in 2021.
16. Mitigation targets vary in their scope and coverage of the sectors and GHGs. Many
cover most or all of the IPCC sectors. Several Parties specifically highlighted transport
and buildings, while others mentioned shipping and aviation, mining, oil industry flaring,
solvents and electric power, tourism and water management. In line with what is currently
reported by Parties under the Convention, most Parties covered carbon dioxide (CO2)
and many covered methane (CH4) and nitrous oxide (N2O) emissions, while some also
covered emissions of sulphur hexafluoride (SF6), hydrofluorocarbons (HFCs),
perfluorocarbons (PFCs) and nitrogen trifluoride (NF3). A few of the INDCs include
additional gases or emissions, including short-lived climate forcers (SLCFs), black carbon
or mononitrogen oxides (NOX), non-methane volatile organic compounds (NMVOCs) and
sulphur dioxide (SO2).
17. Many Parties communicated information on the assumptions and methodological
approaches used for estimating and accounting emissions and removals, with varying level
of detail. Many Parties provided information on their use of IPCC guidelines. Several
Parties also provided information on the global warming potential (GWP) values used. Of
those Parties, most indicated that they used values from the IPCC Second Assessment
Report and Fourth Assessment Report (AR4) (including the INDCs that refer to decision
24/CP.19), while a few used values from the IPCC Fifth Assessment Report (AR5). One
Party reported the use of global temperature potentials.
18. Many Parties included information relating to land use, land-use change and
forestry (LULUCF). A few Parties indicated that a common framework for LULUCF
accounting may be desirable, which could be based on existing guidance and experience
FCCC/CP/2016/2
7
under the Convention and its Kyoto Protocol. However, several of the INDCs do not
provide comprehensive information on the assumptions and methods applied in relation to
LULUCF, which presents a major challenge for the quantitative evaluation of the aggregate
effect of the INDCs.
19. As regards future GHG emission levels, several Parties provided a baseline, BAU
scenario or projections. Most of those Parties referred to assumptions regarding
macroeconomic variables, such as GDP or population, or to growth rates of those two
variables or to sector-specific variables, in particular for the energy sector. Only a few
Parties provided values and some referred to sources of data such as national statistics or
international databases.
20. Most Parties provided information relating to planning processes, at both the
national and international levels. In this context, Parties communicated information on
existing and future institutional arrangements, on existing and planned legislation and
policies, on priority areas for future implementation and on stakeholder engagement.
21. Most Parties’ INDCs build on and/or are embedded in existing climate change
and/or development strategies, policies and legislation. Further, many of the INDCs are
already backed by existing national laws. Some Parties noted that the implementation
phase of their INDCs will involve strengthening laws and regulations on climate change
and further integrating related objectives into long-term economic and social development
plans. Some Parties stressed the need for strengthening institutional arrangements and
administration procedures in relation to the monitoring and evaluation of climate change
related targets.
22. Information provided by several Parties indicated concrete areas for undertaking
action to address climate change, focusing on, inter alia, renewable energy and energy
efficiency, sustainable transport, carbon capture and storage, conservation and
sustainable management of forests and reducing non-CO2 gases. Parties highlighted
their intention to transform their energy systems and energy consumption patterns and at
the same time emphasized the need to enhance carbon sinks. In this context, several Parties
mentioned specific measures, such as renewable energy targets, financial schemes to
promote clean investment, environmental taxes, subsidy reforms, fuel economy and energy
conservation standards, grid modernization, programmes for low-emission agriculture and
waste management, and measures to promote forest conservation and reduce deforestation.
23. Several Parties emphasized that their INDCs had been subject to national
stakeholder consultation processes with a view to raising awareness and securing buy-in
with respect to their INDCs and related long-term development plans. Parties highlighted
that support from actors such as the private sector, academia and civil society, as well
as from relevant sectoral ministries and regional and local governments, is critical for
the identification of realistic targets. Examples of processes to engage stakeholders
include parliamentary hearings, sectoral dialogues, research cooperation, cross-cutting
working groups, workshops, expert teams and technical peer review, large-scale public
consultations, different platforms for information exchange, media, awareness-raising and
education campaigns, and an invitation for written submissions as part of the national
consultation process on the INDC. A few Parties noted that they still plan to hold
consultations on the overall national climate policy underlying their INDCs.
24. Several of the INDCs highlighted the link between actions to address climate change
and development priorities, including social and economic development and poverty
eradication. Some Parties highlighted synergies between their development and climate
action, while some provided concrete examples of specific co-benefits related to their
action to address climate change, including: reduced local air pollution and resulting
health benefits; improved access to energy and enhanced energy security; improved water
FCCC/CP/2016/2
8
quality and management; social progress, including poverty reduction, increased well-being
and job creation; economic diversification; and synergies between adaptation and
mitigation actions towards building resilience, in particular in agriculture and forestry, as
well as relating to food security.
25. All Parties included a narrative on how they consider their INDCs to be fair and
ambitious, as well as how they contribute towards achieving the objective of the
Convention. Many Parties provided information on the global context in which their INDCs
should be viewed, including: a shared global effort undertaken in a fair and equitable
manner with the participation of all Parties; equity; common but differentiated
responsibilities and respective capabilities; recognition of national circumstances and the
right to sustainable development; and application of the same rules to all Parties and the use
by all Parties of the same legal form of commitment. Some Parties noted that no single
indicator can reflect fairness or a globally equitable distribution of efforts.
26. Many Parties referred to their specific national circumstances when outlining why
their INDCs are fair and ambitious, including social, economic and geographical factors or
often a combination thereof.
27. Several Parties provided information on specific criteria for evaluating fairness,
including responsibility, capability and historical responsibility, based on climate justice,
share of emissions, development and/or technological capacity, mitigation potential, cost of
mitigation actions, degree of progression or stretching beyond the current level of effort,
and the link to objectives and global goals. Many Parties viewed their responsibility
directly or indirectly in the context of their past, current and future share in global
emissions and per capita emissions in comparison with global averages, as well as in
relation to the trends in one or several of those indicators.
28. In explaining how their INDCs are ambitious, many Parties elaborated on how
their contributions represent a significant progression beyond their current
undertakings. In doing so, some Parties showed that their INDCs imply the acceleration of
the rate of decarbonization and/or diversification of their economies, the decoupling of
GHG emissions from economic growth and the reduction of emissions below BAU level.
Falling per capita emissions, peaking years for emissions and the translation of previously
aspirational objectives into domestically legally binding goals were also used by Parties to
communicate ambition. A few Parties highlighted their contribution to the provision of
support, including for the development and diffusion of low-emission technologies, and
referred to their past performance in reducing emissions.
29. In discussing how their INDCs contribute towards achieving the objective of
the Convention, several Parties indicated that their expected level of emissions in the
future would fall within the scope of a global emission pathway that is consistent with the
goal of keeping the global average temperature increase below 2 °C, while some Parties
referred to 1.5 °C. In this context, some Parties referred to global and national
decarbonization or to specific emission reduction levels in the future, such as an 80–95 per
cent emission reduction by 2050 compared with the 1990 level for developed countries, or
to global emissions being at least halved by 2050 compared with the 1990 level, in
accordance with the findings of the IPCC.
30. Several Parties that communicated INDCs indicated that they plan to use or are
considering the use of market-based instruments from international, regional or
domestic schemes, including the clean development mechanism. Some Parties indicated
that they would use market instruments to meet only part of their targets. Some Parties
stressed that the use of market-based mechanisms is important for the cost-efficiency of the
mitigation effort and for enhancing the level of ambition. The assessment of the aggregate
FCCC/CP/2016/2
9
effect of INDCs presented in this document assumes that no double counting of outcomes
of actions to reduce emissions will occur.
31. Many Parties provided information on their support needs, highlighting the
need for enhanced international support for the implementation of their INDCs and for
enhancing ambition over time. Some Parties included quantitative estimates of the
investment and financial support required for the full implementation of their
communicated INDCs or for achieving the upper level of their conditional targets.
32. Some Parties communicated information on domestic measures to support the
implementation of their INDCs, including: increased budget and budgetary support for
climate action; green procurement programmes; reformation of pricing and taxation
regimes; and the establishment of national funds. Several Parties noted the need to enhance
existing institutional arrangements under the Convention for delivering international
financial, technology and capacity-building support.
33. A few Parties provided information on the adverse impacts of international
policy responses to climate change and mentioned the importance of understanding those
responses and of assessing and addressing their impacts. A few Parties referred to actions
and plans in pursuit of economic diversification. Finally, a few Parties referred to other
issues, including gender, human rights and the prerogative of protecting the integrity of
Mother Earth.
D. Aggregate effect of the communicated intended nationally determined
contributions
1. Aggregate effect of the intended nationally determined contributions until 2030
34. The implementation of the communicated INDCs is estimated to result in aggregate
global emission levels8 of 55.0 (51.4 to 57.3)9 Gt CO2 eq in 2025 and 56.2 (52.0 to 59.3)
Gt CO2 eq in 2030. The global levels of emissions in 2025 and 2030 were calculated by
adding the estimated aggregate emission levels resulting from the implementation of the
communicated INDCs, that is 46.5 (44.3 to 48.9) Gt CO2 eq in 2025 and 48.0 (45.1 to 51.4)
Gt CO2 eq in 2030, to the levels of emissions not covered by the INDCs.10 Global
cumulative CO2 emissions after 201111 are expected to reach 533.1 (509.6 to 557.2) Gt CO2
in 2025 and 738.8 (703.6 to 770.9) Gt CO2 in 2030.
35. Aside from various uncertainties in the aggregation of the effect of the INDCs, the
ranges referred to in paragraph 34 above capture the effect of both unconditional and
conditional targets. If only the unconditional components of the INDCs are taken into
account, global total emissions12 are projected to be 55.6 (53.1 to 57.3) Gt CO2 eq in 2025
and 57.9 (54.4 to 59.3) Gt CO2 eq in 2030, while including the conditional components of
the INDCs lowers the estimated level of such emissions12 to 54.1 (51.4 to 55.8) Gt CO2 eq
in 2025 and 55.5 (52.0 to 57.0) Gt CO2 eq in 2030. The discussion of the aggregate effect
8 Reported emission levels in this document, unless otherwise indicated, include emissions from land-
use change and use metric GWP values from the AR4 with a 100-year time-horizon.
9 Unless otherwise stated, ranges indicate 20–80 per cent ranges and single values indicate medians.
10 Estimates of emissions in 2025 and 2030 not covered by the INDCs were made by extracting from
AR5 scenarios (reflecting the 2020 pledges under the Cancun Agreements) the emission growth rates
of relevant countries, regions, sectors and/or GHGs.
11 The sum of all global fossil, industrial and land-use change emissions for the years 2012–2025 or
2012–2030 inclusive.
12 Global total emissions encompass emissions covered and not covered by INDCs; they include
emissions from international transport.
FCCC/CP/2016/2
10
of the INDCs in this document is based on the assumption of the full range of
implementation of both the unconditional and conditional components of the INDCs.
36. Compared with global emission levels in 1990, 2000 and 2010,13 global
aggregate emission levels resulting from the INDCs are expected to be higher by: 40
(33–47) per cent in 2025 and 44 (34–53) per cent in 2030 in relation to the global emission
level in 1990; 35 (28–41) per cent in 2025 and 38 (29–47) per cent in 2030 in relation to the
global emission level in 2000; and 13 (7–19) per cent in 2025 and 16 (8–23) per cent in
2030 in relation to the global emission level in 2010. While these figures show that global
emissions considering the effect of the INDCs are expected to continue to grow until 2025
and 2030, growth is expected to slow down substantially, to 16 (8–23) per cent in the
2010–2030 period compared with 24 per cent in the 1990–2010 period.
37. Global average per capita emissions considering the effect of the INDCs are
expected to decline by 8 and 4 per cent by 2025 and by 10 and 5 per cent by 2030
compared with the levels in 1990 and 2010, respectively. This is based on estimated
global average per capita emissions, considering the effect of the INDCs, of 6.8 (6.4 to 7.2)
t CO2 eq/capita in 2025 and 6.7 (6.3 to 7.2) t CO2 eq/capita in 2030.14 However, per capita
emissions in 2025 and 2030 are expected to be approximately 2 (–3 to +7) per cent and
0 (–7 to +7) per cent, respectively, above per capita emission levels in 2000.
38. Implementation of the communicated INDCs would lead to sizeably lower
aggregate global emission levels than in pre-INDC trajectories.15 The level of global
GHG emissions associated with the implementation of the INDCs is expected to be lower
than the emission level in pre-INDC trajectories, by 2.8 (0.0 to 6.0) Gt CO2 eq in 2025 and
3.3 (0.3 to 8.2) Gt CO2 eq in 2030.16 These figures provide an estimate of the aggregate
effect of the INDCs stemming from actions to reduce emissions and enhance sinks
compared with emission scenarios that are consistent with actions communicated by Parties
for the pre-2020 period.
39. Compared with the emission levels under least-cost 2 ºC scenarios,17 aggregate GHG
emission levels resulting from the implementation of the INDCs are expected to be higher
13 Historical annual emission time series are derived from gas-by-gas data sources in order to allow for
consistent treatment of metrics, like GWP values from the AR4. These gas-by-gas data sources are
reported UNFCCC inventory data for Parties included in Annex I to the Convention, available
national communication data or biannual update report data, complemented by authoritative global
data sources used by AR5 Working Group III to estimate historical emission data, including the
International Energy Agency and the Emission Database for Global Atmospheric Research.
14 Assuming the United Nations low, high and median population scenarios for 2015 in combination
with other uncertainties. In the median population scenario, population is expected to reach 8.04
billion in 2025 and 8.40 billion in 2030 (see the 2015 revision of the United Nations 2012 population
projections, available at <http://esa.un.org/unpd/wpp/>).
15 The 22 trajectories are a subset of scenarios from the AR5 scenario database, specifically the 450 ppm
scenarios and their high short-term target (HST) implementations with delayed 2030 onset of
coordinated emission reductions as designed within the AMPERE project.
16 In contrast to the given median reduction and 20–80 per cent range, the average emission reduction
resulting from the implementation of the INDCs below reference scenarios is 2.9 Gt CO2 eq in 2025
and 3.9 Gt CO2 eq in 2030.
17 Scenarios consistent with limiting the global average temperature rise below 2 °C above pre-industrial
levels were taken from the AR5 scenario database. Scenarios that follow a least-cost emission
trajectory from 2010 onwards (so-called P1 scenarios) with a greater than 66 per cent likelihood of
temperature rise staying below 2 °C correspond to 44.3 (38.2–46.6) Gt CO2 eq emissions in 2025 and
42.7 (38.3–43.6) Gt CO2 eq emissions in 2030. Scenarios that follow an economically optimal
emission trajectory from 2020 onwards (so-called P2 scenarios) with a greater than 66 per cent
likelihood of temperature rise staying below 2 °C correspond to 49.7 (46.2–51.6) Gt CO2 eq
FCCC/CP/2016/2
11
by 8.7 (4.5 to 13.3) Gt CO2 eq (19 per cent, range 9–30 per cent) in 2025 and by 15.2 (10.1
to 21.1) Gt CO2 eq (36 per cent, range 24–60 per cent) in 2030.
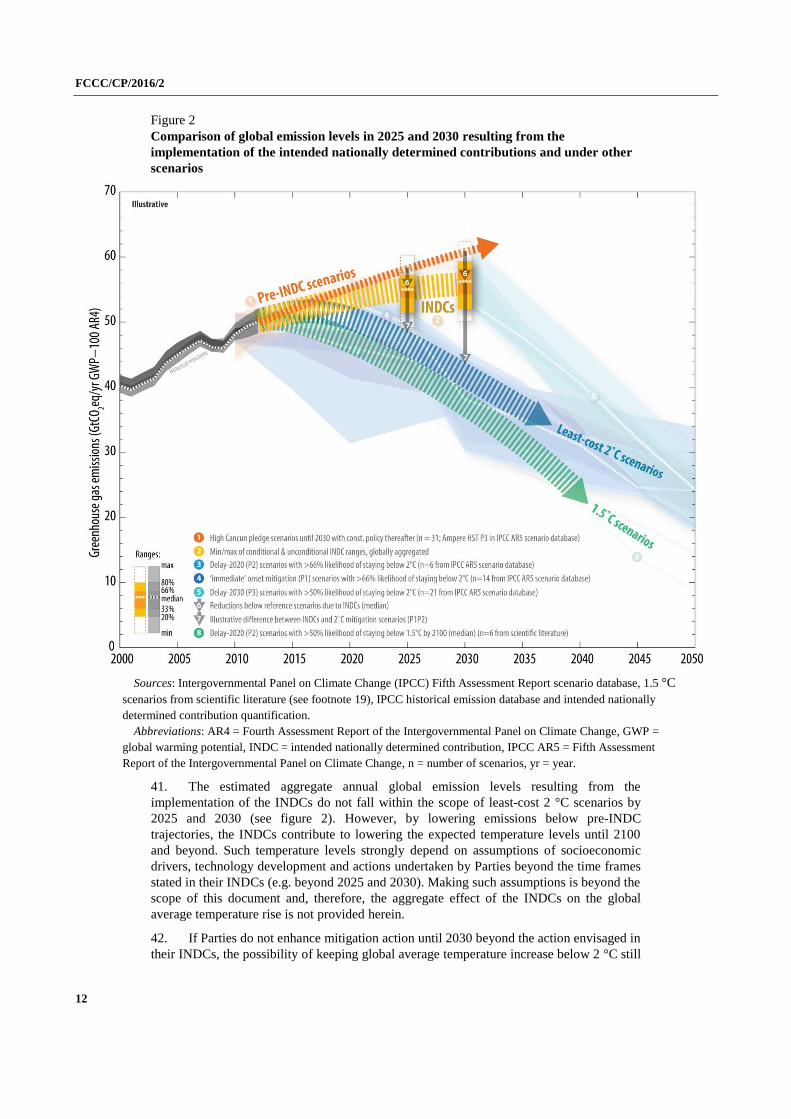
40. Figure 2 compares the global emission levels resulting from the implementation of
the INDCs in 2025 and 2030 with those under pre-INDC reference scenarios and 2 °C
scenarios, and shows the illustrative pathway for 1.5 °C scenarios. GHG reference
scenarios consistent with the actions communicated by Parties for the pre-2020 period have
been derived from the contribution of Working Group III to the AR5 (red). The aggregate
emissions expected to result from the implementation of the INDCs show a wide range,
owing to the various assumptions and conditions specified by Parties in their submissions
and the uncertainties associated with gaps in information (yellow bars). Mitigation
scenarios for a least-cost trajectory to keep the global average temperature rise below 2 °C
are shown in blue, with an enhancement of global mitigation starting today (dark blue), by
2020 (medium blue) or with an assumed delay to only after 2030 (turquoise). In those
scenarios, subsequent emission reduction rates over the period 2030–2050 are higher if
there is a delayed enhancement of global mitigation. Mitigation scenarios from scientific
literature in which the global average temperature rise stays below 1.5 °C are shown in
green.
emissions in 2025 and 38.1 (30.3–45.0) Gt CO2 eq emissions in 2030. Given the similarity of
emissions under P1 scenarios to emissions in 2015 and the similarity of emissions under P1 and P2
scenarios by 2030, in this document the difference between emission levels considering the effect of
the INDCs and under the joint set of P1 and P2 scenarios is given. When comparing with P2 scenarios
only, the difference is smaller in 2025, namely 4.8 (1.6 to 8.2) Gt CO2 eq, and larger in 2030, namely
17.0 (10.0 to 25.6) Gt CO2 eq.
FCCC/CP/2016/2
12
Figure 2
Comparison of global emission levels in 2025 and 2030 resulting from the
implementation of the intended nationally determined contributions and under other
scenarios
Sources: Intergovernmental Panel on Climate Change (IPCC) Fifth Assessment Report scenario database, 1.5 °C
scenarios from scientific literature (see footnote 19), IPCC historical emission database and intended nationally
determined contribution quantification.
Abbreviations: AR4 = Fourth Assessment Report of the Intergovernmental Panel on Climate Change, GWP =
global warming potential, INDC = intended nationally determined contribution, IPCC AR5 = Fifth Assessment
Report of the Intergovernmental Panel on Climate Change, n = number of scenarios, yr = year.
41. The estimated aggregate annual global emission levels resulting from the
implementation of the INDCs do not fall within the scope of least-cost 2 °C scenarios by
2025 and 2030 (see figure 2). However, by lowering emissions below pre-INDC
trajectories, the INDCs contribute to lowering the expected temperature levels until 2100
and beyond. Such temperature levels strongly depend on assumptions of socioeconomic
drivers, technology development and actions undertaken by Parties beyond the time frames
stated in their INDCs (e.g. beyond 2025 and 2030). Making such assumptions is beyond the
scope of this document and, therefore, the aggregate effect of the INDCs on the global
average temperature rise is not provided herein.
42. If Parties do not enhance mitigation action until 2030 beyond the action envisaged in
their INDCs, the possibility of keeping global average temperature increase below 2 °C still
FCCC/CP/2016/2
13
remains. However, the scenarios in the AR5 indicate that this could be achieved only at
substantially higher annual emission reduction rates and cost compared with the least-cost
scenarios that start today or in 2020. Therefore, much greater emission reduction efforts
than those associated with the INDCs will be required in the period after 2025 and
2030 to hold the temperature rise below 2 °C above pre-industrial levels.
43. The average annual emission reductions in the period between 2030 and 2050 under
least-cost scenarios that start in 2030 from emission levels consistent with the
implementation of the INDCs and bring back emissions to the level under 2 °C scenarios
are estimated at 3.3 (2.8–3.9) per cent. This is around double the reduction rate under the
least-cost scenarios that assume enhanced mitigation action by 2010 or 2020, which require
annual emission reductions of only 1.6 (0.8–2.0) per cent in the same period.
44. Given the fact that GHGs are long-lived in the atmosphere and therefore cumulative
emissions determine the impact on the climate system, higher emissions in the early years
(compared with least-cost 2 °C scenarios) would necessitate greater and more costly
emission reductions later on in order to keep the global average temperature rise below the
same level with the same likelihood. According to the AR5, the total global cumulative
emissions since 2011 that are consistent with a global average temperature rise of less than
2 °C above pre-industrial levels at a likely (>66 per cent) probability is approximately
1,000 Gt CO2. Considering the aggregate effect of the INDCs, global cumulative CO2
emissions are expected to equal 53 (51–56) per cent by 2025 and 74 (70–77) per cent by
2030 of that 1,000 Gt CO2.18
45. Compared with emission levels that are estimated to be consistent with 1.5 °C
scenarios,19 aggregate emission levels resulting from INDCs are expected to be higher by
16.1 (10.7 to 20.6) Gt CO2 eq (42 per cent, range 26–59 per cent) in 2025 and by 22.6 (17.8
to 27.5) Gt CO2 eq (67 per cent, range 49–90 per cent) in 2030 (see figure 12). This means
that 2030 emission levels considering the effect of the INDCs are farther from those under
1.5 °C scenarios that start global emission reductions between 2010 and 2020 than those
under comparable 2 °C scenarios. The distinction between 1.5 °C and 2 °C scenarios is
however less pronounced in 2030 if only scenarios that start global emission reductions by
2020 (see figure 12 and para. 229) are considered. At the time of publication of this
document, no scenarios were available in the literature in which warming was limited to
below 1.5 °C considering global emission levels in 2030 resulting from the implementation
of the INDCs. It should be noted, however, that the findings of this document should be
reviewed in the light of the invitation for the IPCC to provide a special report in 2018 on
the impacts of global warming of 1.5 °C above pre-industrial levels and related global GHG
emission pathways.
18 For a 50 per cent probability of global average temperature increase staying below 2 °C, the AR5 (see
table 2.2 of the Synthesis Report, available at
<http://ar5-syr.ipcc.ch/ipcc/ipcc/resources/pdf/IPCC_SynthesisReport.pdf>) indicates cumulative
CO2 emissions of 1,300 Gt CO2 after 2011. Considering the aggregate effect of the INDCs, global
cumulative CO2 emissions are expected to equal 41 (39–43) per cent by 2025 and 57 (54–59) per cent
by 2030 of that 1,300 Gt CO2.
19 Luderer G, Pietzcker RC, Bertram C, Kriegler E, Meinshausen M, Edenhofer O. 2013. Economic
mitigation challenges: how further delay closes the door for achieving climate targets. Environmental
Research Letters 8:034033); Rogelj J, McCollum DL, O'Neill BC and Riahi K. 2013. 2020 emissions
levels required to limit warming to below 2°C. Nature Climate Change. 3(4): pp.405–412; Rogelj J,
McCollum DL, Reisinger A, Meinshausen M and Riahi K. 2013. Probabilistic cost estimates for
climate change mitigation. Nature. 493(7430): pp.79–83; and Rogelj J, Luderer G, Pietzcker RC,
Kriegler E, Schaeffer M, Krey V, Riahi K. 2015. Energy system transformations for limiting end-of-
century warming to below 1.5 °C. Nature Climate Change. 5(6): pp.519–527.
FCCC/CP/2016/2
14
46. According to the AR5, the total global cumulative emissions since 2011 that are
consistent with a global average temperature rise of less than 1.5 °C above pre-industrial
levels with 50 per cent probability is 550 Gt CO2. Considering the aggregate effect of the
INDCs, global cumulative CO2 emissions are expected to equal 97 (93–101) per cent by
2025 and 134 (128–140) per cent by 2030 of the cumulative emissions consistent with
achieving a temperature increase of less than 1.5 °C. These findings should be reviewed in
the light of the information to be provided in the special report by the IPCC referred to in
paragraph 45 above.
2. Opportunities in the medium and longer terms emerging from the intended nationally
determined contributions
47. The extent to which efforts to reduce emissions will be sufficient to limit the global
average temperature rise to less than 2 or 1.5 °C above pre-industrial levels strongly
depends on the long-term changes in the key economic drivers that will be induced by the
implementation of the communicated INDCs, as well as on the determination of Parties to
increase their level of ambition before and after 2030. Paragraphs 48–58 below provide
general information on trends emerging from the INDCs that could provide opportunities
for increased ambition in the future.
Participation
48. The INDCs indicate a significant increase in the number of countries taking
climate action, which is often national in scope and covers a large number of sectors
and GHGs. Of particular importance is the increase in the number of Parties that have
moved from project-, programme- or sector-based actions towards economy-wide policies
and objectives. Whereas in the pre-2020 period a total of 61 Parties presented absolute,
BAU, intensity or peaking year based quantified targets, in their INDCs 155 Parties
communicated such targets.
49. Furthermore, most Parties provided information that facilitates the clarity,
transparency and understanding of their INDCs. While the information provided reflects
national circumstances and capabilities, in terms of data consistency, completeness and
quality the information communicated in the INDCs represents a significant step forward
compared with the information communicated in relation to action in the pre-2020 period.
50. The increasing determination of Parties to take national action to combat
climate change, together with the increasing national capacity to do so, is clearly
manifested through the significant number of Parties submitting INDCs and their
enhanced scope of action. However, problems remain in relation to data gaps and the
quality of the information submitted in the INDCs, showing that further efforts are needed
to increase the capacity of many countries to plan, implement and monitor their climate-
related actions.
Policies and institutions
51. Information in the INDCs shows a clear and increasing trend towards
introducing national policies and related instruments for low-emission and climate-
resilient development. Many INDCs are already backed by existing national legislation or
policies and several have triggered national processes to establish relevant policy
frameworks. Furthermore, several INDCs were subject to public consultation and involved
the engagement of a wide range of stakeholders to demonstrate the developmental benefits
of action to combat climate change and to secure their buy-in.
52. Information provided by Parties highlights the increasing prominence of climate
change on national political agendas, driven in many cases by interministerial
coordination arrangements as well as by the increasing mainstreaming of climate change in
FCCC/CP/2016/2
15
national and sectoral development priorities. At the same time, several Parties have made
efforts to ensure that the private sector, civil society and other non-governmental actors
recognize the importance of, and provide support for, national action to combat climate
change.
53. National political and institutional processes have been influenced by Parties being
invited to communicate their INDCs and they could provide a foundation for enhanced
action in the future. While INDCs may have served as a catalyst for the consolidation and
enhancement of climate-related policies in a few countries, in many they have represented
an incentive to initiate such policies. In general, it can be argued that the realities of policy
development and of social acceptance related to the preparation of the INDCs provide a
foundation for enhanced action in the future. However, the timing and scale of such
enhanced action depends on the determination of governments. In this context, many
Parties referred to the Paris Agreement as a common framework for action and as a means
to enhance the capacity of those countries that need it the most.
Cooperation and support
54. The INDCs show the increasing interest of Parties in enhanced cooperation to
achieve climate change goals collectively through a multilateral response and to raise
ambition in the future. In particular, Parties stressed the need for strengthening finance,
technology transfer and capacity-building support for climate action in general as a means
of creating an enabling environment and scaling up action. Some Parties mentioned
opportunities in the development and implementation of policy, economic and market-
based instruments.
55. Information in some of the INDCs points to the need for identifying, exploring and
implementing further opportunities for cooperation on addressing climate change. In this
context, Parties referred to the need for the Paris Agreement to foster and promote
cooperation, including through the strengthening of existing mechanisms and tools under
the Convention or the establishment of new ones.
National circumstances and ambition
56. All Parties have raised the ambition of the climate action included in their
INDCs compared with efforts communicated for the pre-2020 period. There is strong
recognition of the need for enhanced global action in the context of achieving the
objective of the Convention and of the commitment to doing so multilaterally. In this
context, many Parties referred to the goal of limiting the global average temperature rise to
below 2 °C above pre-industrial levels as a benchmark for guiding national and global
ambition. Many Parties expressed their determination to achieve this goal and
acknowledged that this would only be possible through collective efforts.
57. As noted in paragraph 36 above, while actions enshrined in the INDCs will deliver
sizeable emission reductions compared with in the pre-2020 period, global aggregate
emission levels in 2025 and 2030 resulting from the implementation of the INDCs do not
fall within the scope of 2 °C scenarios. The INDCs signal, however, the increasing
determination of Parties to take action to reduce emissions and increase the resilience of
their economies, with a few Parties already indicating the aim to reduce their net emissions
to zero in the longer term. National determination has enabled Parties to shape their efforts
in line with their circumstances, with several already recognizing related sustainable
development and socioeconomic co-benefits. Yet, the need remains to scale up and
accelerate efforts before and after 2030.
58. Narratives provided by Parties in their INDCs convey the vision that each country
should implement its own strategy and reveal the need for a process to reconcile efforts
made in the context of different national circumstances with the efforts needed to keep the
FCCC/CP/2016/2
16
global temperature rise below 2 °C. This issue should be addressed as Parties consider
current and future efforts in relation to any agreed goal under the Convention.
E. Adaptation component of the communicated intended nationally
determined contributions
59. A total of 137 Parties included an adaptation component in their INDCs. The
secretariat received adaptation components from 54 African States, 42 Asia-Pacific States,
30 Latin American and Caribbean States, 7 Eastern European States and 2 Western
European and other States.
60. Parties highlighted their common determination to strengthen national
adaptation efforts in the context of the Paris Agreement. Some stressed that adaptation
is their main priority for addressing climate change, in particular as they see it to be
strongly linked to national development, sustainability and security.
61. Although the INDCs are diverse and each has some unique features, information on
the following featured in many adaptation components:
(a) National circumstances informing the adaptation component;
(b) Long-term goals and/or visions guiding the adaptation component;
(c) Impact and vulnerability assessments;
(d) Legal and regulatory frameworks, strategies, programmes and plans that
provide the basis for, or have informed, adaptation actions;
(e) Measures or actions planned or under implementation in specific areas and/or
sectors;
(f) Costs, losses and/or damage due to climate impacts;
(g) Means of implementation;
(h) Monitoring and evaluation of adaptation;
(i) Synergies between mitigation and adaptation.
62. This document provides an overview of the adaptation components of the INDCs by
summarizing key information, identifying emerging trends and illustrating the various
elements of the adaptation components by providing concrete examples. It was not possible
to evaluate the aggregate effect of the adaptation components given the methodological
uncertainties associated with such an evaluation.
63. The diversity of the national circumstances of Parties is reflected in all INDCs with
information pertaining to geographical characteristics, population dynamics and
socioeconomic situation. Many Parties communicated that their adaptation components are
guided by long-term development aspirations as well as by global climate objectives,
including the goal of holding the increase in the global average temperature below 2 °C or
1.5 °C above pre-industrial levels, which a few Parties used as a reference point for
defining their adaptation components. In many cases, the time-horizon for Parties to
implement their national long-term goals and/or vision is by 2030.
64. All adaptation components of the INDCs included information on key impacts
and vulnerabilities. Parties reported in particular on observed changes or projections of
future changes, the most vulnerable sectors or geographical zones, high-risk impacts and
incurred costs resulting from the impacts of extreme events. In terms of climate hazards, the
FCCC/CP/2016/2
17
main sources of concern identified by most Parties are flooding, sea level rise and drought
or desertification.
65. The information provided clearly demonstrates that Parties are moving to full-
scale planning and implementation of adaptation and strengthening and scaling up
existing efforts. Most Parties referred to developing nationwide adaptation plans and
strategies. Several Parties indicated that they are conducting the process to formulate and
implement national adaptation plans (NAPs) and most of those foresee having developed
their NAP by 2020. Such national efforts are often accompanied by specific policies,
measures and initiatives in practically all key economic sectors and areas, with water,
agriculture, health, ecosystems, forestry and infrastructure being reported as the priority
ones. A few Parties intend to undertake actions with regional or global impacts as they will
address transboundary issues.
66. The recognition of the need to involve relevant stakeholders in the planning and
implementation of adaptation, including vulnerable communities, was high on the agenda
of several Parties. In addition, many emphasized the need to consider gender issues when
undertaking adaptation.
67. Costs, losses and/or damage associated with past and projected impacts of
climate variability and change were reported by several Parties, some of which
provided quantified projections of such costs, losses and/or damage, for example in the
form of absolute costs, annual loss of GDP or percentage of land or agricultural production
lost by a certain year or a particular threshold, for example a specific rise in sea level. A
few Parties provided details on projected costs of climate change impacts and how intended
adaptation measures are expected to reduce them while leaving some residual damage,
clearly making an economic case for investing in adaptation and disaster risk reduction
(DRR).
68. Most Parties provided information on the means of implementation (e.g.
finance, technology and capacity-building) needed to support the implementation of
their planned adaptation actions, including related to support needs and envisaged
domestic and international support. Financial needs for adaptation were quantified by some
Parties, with individual needs ranging from USD 100 million to over 200 billion for the
whole INDC period and from USD 10 million to 3 billion per year. A few Parties provided
projected adaptation costs for different mitigation scenarios, thus clearly indicating that the
need for adaptation depends on mitigation ambition.
69. Some Parties emphasized that they are and will be undertaking adaptation with
domestic support, giving a clear signal that countries are already investing significant
resources in adaptation. Many underlined the need for international finance, technology
transfer and capacity-building support in line with the Convention, as such support will
determine the ability of Parties to safeguard developmental gains, fulfil their mitigation
actions and use their domestic resources for developmental purposes rather than for
adaptation.
70. In addition to national efforts and international support, a few adaptation
components included new forms of cooperation, such as South–South and triangular
cooperation, and Parties announced their readiness to support the adaptation efforts of other
countries through such activities.
71. Noting that climate change actions require a holistic approach, several Parties
elaborated on the synergies between adaptation and mitigation as part of their overall
low-emission climate-resilient development strategies, including economic
diversification efforts. Synergies are being sought at the project and sector levels, in
planning or institutional frameworks at the national, regional or local level and in urban and
FCCC/CP/2016/2
18
rural settings and by prioritizing adaptation measures that offer significant mitigation co-
benefits.
72. Given that the complex and long-term nature of climate change and its impacts
require adaptation to be designed as a continuous and flexible process and subject to
periodic review, several Parties described how they will monitor and evaluate their intended
adaptation actions and the support provided and received.
73. Regarding the monitoring and evaluation of adaptation action, some Parties
highlighted that they have or will establish quantitative and qualitative indicators for
adaptation and vulnerability to measure progress. In terms of the monitoring and
evaluation of domestic and international support provided and received, in particular
finance, a few Parties are putting in place climate finance systems for determining,
disbursing and monitoring climate expenditure and for enhancing the visibility of
adaptation measures within national budgets.
74. Overall, the adaptation components of the INDCs constitute a representative
overview of how Parties, building on progress made so far, intend to address
adaptation and costs, losses and damage due to climate impacts at the national level in
the coming decades. The wide range of communicated initiatives to enhance adaptation
reflects the relevance of adaptation to all socioeconomic areas and the strong interest of
Parties in continuing to strengthen their adaptation efforts together with their mitigation
efforts.
FCCC/CP/2016/2
19
II. Aggregate effect of the communicated intended nationally determined contributions
[English only]
A. Mandate and background
75. COP 21 represented a major milestone in the strengthening of the international
response to the threat of climate change. The political momentum of the UNFCCC process
culminated in the adoption of the Paris Agreement and the participation of over 96 per cent
of Parties to the Convention in communicating their INDCs.20
76. COP 19 invited all Parties to initiate or intensify domestic preparations for their
INDCs, without prejudice to the legal nature of the contributions, in the context of adopting
a protocol, another legal instrument or an agreed outcome with legal force under the
Convention applicable to all Parties towards achieving the objective of the Convention as
set out in its Article 2, and to communicate those INDCs to the secretariat well in advance
of COP 21 in a manner that facilitated the clarity, transparency and understanding of
them.21 That invitation was reiterated at COP 20.22
77. COP 20 agreed thateachParty’s INDCwould represent a progression beyond the
current undertaking of that Party,23 and that the least developed countries (LDCs) and small
island developing States could communicate information on strategies, plans and actions
for low GHG emission development reflecting their special circumstances.24 All Parties
were invited to consider communicating their undertakings in adaptation planning or to
consider including an adaptation component in their INDCs.25
78. COP 20 also agreed that the information to be provided by Parties communicating
their INDCs, in order to facilitate clarity, transparency and understanding, might include, as
appropriate, inter alia, quantifiable information on the reference point (including, as
appropriate, a base year), time frames and/or periods of implementation, scope and
coverage, planning processes, assumptions and methodological approaches, including those
for estimating and accounting for anthropogenic GHG emissions and, as appropriate,
removals, as well as information on how the Party considers that its INDC is fair and
ambitious, in the light of its national circumstances, and how it contributes towards
achieving the objective of the Convention as set out in its Article 2.26
79. In response to a request from the COP,27 the secretariat prepared a synthesis report
on the aggregate effect of the INDCs communicated by Parties by 1 October 2015 on the
basis of the information contained in 119 INDCs presented by 147 Parties.28 In view of the
developments that took place after 1 October 2015, COP 21 requested the secretariat to
20 It should be noted that Article 4, paragraph 2, of the Paris Agreement requests each Party to prepare,
communicate and maintain successive nationally determined contributions that it intends to achieve.
21 Decision 1/CP.19, paragraph 2(b).
22 Decision 1/CP.20, paragraph 9.
23 Decision 1/CP.20, paragraph 10.
24 Decision 1/CP.20, paragraph 11.
25 Decision 1/CP.20, paragraph 12.
26 Decision 1/CP.20, paragraph 14.
27 Decision 1/CP.20, paragraph 16(b).
28 FCCC/CP/2015/7.
FCCC/CP/2016/2
20
update that synthesis report so as to cover all the information communicated by Parties in
their INDCs by 4 April 2016.29
80. This document provides the update referred to in paragraph 79 above by:
(a) Incorporating the information contained in the 42 INDCs received between
1 October 2015 and 4 April 2016, as well as that in the 5 INDCs revised during that period,
including as regards adaptation;
(b) Recalculating the aggregate effect of the INDCs using the approach and
methods described in chapter II.C below;
(c) Providing additional details on the aggregate effect of the achievement of
conditional and unconditional components of the INDCs;
(d) Including a discussion on the aggregate effect of the INDCs in relation to
1.5 °C scenarios.
81. Chapter II.B below provides an overview of the communicated INDCs, including
their coverage and key components. Chapter II.C presents the approach and methods used
for assessing the aggregate effect of the INDCs, as well as key challenges and assumptions
adopted; chapter II.D provides a synthesis of the information contained in the INDCs; and
chapter II.E presents the aggregate effect of the INDCs, with the exception of information
relating to the adaptation component of the INDCs. Chapter II.F focuses on the adaptation
component of the INDCs. An online technical annex contains further detailed information
on the methodology used for the quantitative assessment presented in this document.30
B. Overview of the communicated intended nationally determined
contributions
82. As at 4 April 2016, 161 INDCs had been communicated to the secretariat, covering
189 Parties to the Convention,31 including one regional economic integration organization,32
29 Decision 1/CP.21, paragraph 19.
30 Available at <http://unfccc.int/focus/indc_portal/items/9240.php>.
31 Afghanistan, Albania, Algeria, Andorra, Angola, Antigua and Barbuda, Argentina, Armenia,
Australia, Azerbaijan, Bahamas, Bahrain, Bangladesh, Barbados, Belarus, Belize, Benin, Bhutan,
Bolivia (Plurinational State of), Bosnia and Herzegovina, Botswana, Brazil, Brunei Darussalam,
Burkina Faso, Burundi, Cambodia, Cameroon, Cabo Verde, Canada, Central African Republic, Chad,
Chile, China, Colombia, Comoros, Congo, Cook Islands, Costa Rica, Côte d’Ivoire,Cuba,
Democratic Republic of the Congo, Djibouti, Dominica, Dominican Republic, Ecuador, Egypt, El
Salvador, Equatorial Guinea, Eritrea, Ethiopia, Fiji, Gabon, Gambia, Georgia, Ghana, Grenada,
Guatemala, Guinea, Guinea-Bissau, Guyana, Haiti, Honduras, Iceland, India, Indonesia, Iran (Islamic
Republic of), Iraq, Israel, Jamaica, Japan, Jordan, Kazakhstan, Kenya, Kiribati, Kuwait, Kyrgyzstan,
LaoPeople’sDemocraticRepublic,Latvia and the European Commission on behalf of the European
Union and its member States (Austria, Belgium, Bulgaria, Croatia, Cyprus, Czech Republic,
Denmark, Estonia, Finland, France, Germany, Greece, Hungary, Ireland, Italy, Latvia, Lithuania,
Luxembourg, Malta, Netherlands, Poland, Portugal, Romania, Slovakia, Slovenia, Spain, Sweden and
United Kingdom of Great Britain and Northern Ireland) acting jointly, Lebanon, Lesotho, Liberia,
Liechtenstein, Madagascar, Malawi, Malaysia, Maldives, Mali, Marshall Islands, Mauritania,
Mauritius, Mexico, Micronesia (Federated States of), Monaco, Mongolia, Montenegro, Morocco,
Mozambique, Myanmar, Namibia, Nauru, Nepal, New Zealand, Niger, Nigeria, Niue, Norway,
Oman, Pakistan, Palau, Papua New Guinea, Paraguay, Peru, Philippines, Qatar, Republic of Korea,
Republic of Moldova, Russian Federation, Rwanda, Saint Kitts and Nevis, Saint Lucia, Saint Vincent
and the Grenadines, Samoa, San Marino, Sao Tome and Principe, Saudi Arabia, Senegal, Serbia,
Seychelles, Sierra Leone, Singapore, Solomon Islands, Somalia, South Africa, South Sudan,
FCCC/CP/2016/2
21
representing 96 per cent of Parties to the Convention and covering 95.7 per cent of global
emissions in 2010. If only emissions from countries (e.g. excluding emissions from
international aviation and maritime transport) are taken into account, then the Parties that
have communicated INDCs represent 98.2 per cent of total global emissions. Those Parties
even represent 99.0 per cent of total global emissions if emissions from international
aviation and maritime transport as well as from countries that are not Parties to the
Convention are excluded from the global total.33
83. The communicated INDCs vary in their form, structure and content, reflecting
different national circumstances. Most Parties included information on their plans to reduce
GHG emissions or enhance sinks, in the form of either mitigation targets, strategies, plans
and actions for low GHG emission development, or mitigation co-benefits resulting from
their adaptation actions and/or economic diversification plans. A synthesis of that
information is presented in chapter II.D below. A total of 134 Parties, accounting for 83 per
cent of the INDCs, included an adaptation component in their INDCs (see chapter II.F
below).
84. Most34 Parties explicitly addressed the information elements listed in decision
1/CP.20, paragraph 14, in their INDCs. Some Parties provided information on all of those
elements. A summary of the information Parties provided in their INDCs in accordance
with decision 1/CP.20, paragraph 14, is provided in chapter II.D below.
85. In addition to providing the information outlined in decision 1/CP.20, several
INDCs contain information relating to the use of market mechanisms; many contain
information on the means of implementation necessary for the implementation of the
INDCs; and a few contain information on other issues, including economic diversification
and response measures (see paras. 180–188 below).
C. Approach and methods
86. The following is a brief overview of the approach, methods, challenges and
assumptions involved in the preparation of this document, with the exception of those
related to the adaptation component of the INDCs, which are discussed in chapter II.F
below. Further information and details on methodology and related assumptions have been
compiled in the online technical annex.
Sri Lanka, Sudan, Suriname, Swaziland, Switzerland, Tajikistan, Thailand, the former Yugoslav
Republic of Macedonia, Togo, Tonga, Trinidad and Tobago, Tunisia, Turkey, Turkmenistan, Tuvalu,
Uganda, Ukraine, United Arab Emirates, United Republic of Tanzania, United States of America,
Uruguay, Vanuatu, Venezuela (Bolivarian Republic of), Viet Nam, Yemen, Zambia and Zimbabwe.
32 The INDC of the European Union and its member States is counted as one INDC representing 29
Parties (the European Union and its 28 member States).
33 A database developed for the preparation of this document is the source of this information. Countries
that are not Parties to the Convention are estimated to have represented 0.9 per cent of global
emissions in 2010, with international aviation and maritime transport representing 2.5 per cent. Only
CO2 emissions are taken into account for international aviation and maritime transport emissions.
34 In this document, the following qualifiers are applied depending on the percentage of Parties that
submitted INDCsandmentionedtheissueinquestion:“afew”forlessthan10percent;“some”for
10–40percent;“several”for40–70percent;“many”for70–90percent;and“most”for90percent
and above. These qualifiers are used in chapter II.F below to indicate the percentage range of the
submitted INDCs that elaborate on a certain adaptation issue.
FCCC/CP/2016/2
22
1. Approach
87. In response to the mandate referred to in paragraph 79 above, this document
provides a synthesis of the information submitted by Parties in their INDCs, which has
been structured following the information elements listed in decision 1/CP.20,
paragraph 14.
88. With a view to evaluating the aggregate effect of the communicated INDCs, this
document provides estimates of the aggregate emission levels in 2025 and 2030 for the
sectors and gases covered by the INDCs resulting from their achievement. The emission
levels were calculated in both annual and cumulative terms (i.e. cumulative emissions from
2011 to 2025 and from 2011 to 2030). The estimates are presented as median values and
associated ranges, owing to the various assumptions and conditions specified by Parties in
their submissions and the uncertainties associated with gaps in information.
89. It should be noted that the estimates depend on, among other things, the share of
emissions that is covered by the INDCs. As noted in chapter II.B above, the INDCs
communicated to date cover most, but not all, Parties to the Convention and not all Parties
that have communicated INDCs included all gases and sectors. Therefore, the aggregate
emission levels of the Parties, gases and sectors covered by the INDCs cover approximately
88 per cent of global emissions.35
90. The estimates of the global levels of emissions in 2025 and 2030 resulting from the
implementation of the communicated INDCs were calculated using IPCC scenarios. Those
scenarios were also used to obtain estimates of emissions in 2025 and 2030 not covered by
the INDCs by extracting from them the emission growth rates of relevant countries,
regions, sectors and gases. The global levels of emissions in 2025 and 2030 were estimated
by adding the estimated aggregate emission levels of the sectors and gases covered by the
INDCs that result from the implementation of the communicated INDCs in 2025 and 2030
to the levels of emissions not covered by the INDCs from IPCC scenarios for the same
years. The method used to estimate the global levels of emissions in 2025 and 2030
resulting from the implementation of the communicated INDCs is further explained in
paragraphs 94–101 below.
91. The estimated global levels of emissions in 2025 and 2030 associated with the
implementation of the INDCs are discussed in relation to:
(a) The global levels of emissions in 1990, 2000 and 2010;
(b) The global emission levels in 2025 and 2030 corresponding to pre-INDC
trajectories consistent with action communicated by Parties for 2020 or earlier;
(c) The global emission levels in 2025 and 2030 corresponding to least-cost
scenarios consistent with holding the global average temperature rise below 2 °C above
pre-industrial levels (hereinafter referred to as 2 °C scenarios);
(d) The global emission levels in 2025 and 2030 corresponding to least-cost
scenarios consistent with holding or returning the global average temperature rise to below
1.5 °C above pre-industrial levels by 2100 (hereinafter referred to as 1.5 °C scenarios).36
35 This percentage refers to the share of global emissions (including emissions from international
aviation and maritime transport and emissions from countries that are not Parties to the Convention)
in 2010 of the sectors and gases covered by the communicated INDCs.
36 Further information on the 1.5 °C scenarios can be found in the online technical annex available at
<http://unfccc.int/focus/indc_portal/items/9240.php>.
FCCC/CP/2016/2
23
92. Finally, with a view to providing information on the aggregate effect of the
implementation of the INDCs beyond 2030, identified trends that could provide
opportunities for enhanced action in the longer term are discussed. Using the information
contained in the INDCs, such trends are discussed with regard to participation, policies and
institutions, cooperation, national circumstances and ambition.
93. In accordance with the mandate for its preparation, this document does not present
or analyse any individual INDC. It focuses on the effect of the implementation of the
INDCs in aggregate. Furthermore, it represents a single study of the INDCs rather than an
overview of the outcomes of multiple studies conducted by other institutions. For the
purpose of this document, the following ground rules have been applied:
(a) The document is based on the information communicated by Parties in their
INDCs. The use of additional information is described in paragraph 101 below;
(b) The analysis is focused on the sectors and gases covered by the INDCs. GHG
emissions that do not fall within the scope of the INDCs were only assessed at the
aggregate global level using IPCC scenarios, as explained in paragraphs 102 and 103
below;
(c) Likewise, the report does not include in its analysis the effect of any other
policy or target not communicated by Parties in their INDCs;
(d) Information is aggregated and not presented at any national or regional level;
(e) No assumptions have been made on the likelihood of the INDCs being fully
implemented or exceeded. In preparing this document, the secretariat assumed that Parties
will achieve the level of emissions implied in their INDCs.
2. Methods
94. As noted in paragraph 91 above, the estimates of global emissions in 2025 and 2030
associated with the implementation of the communicated INDCs were derived by adding
the estimated aggregate emissions resulting from the implementation of the INDCs to the
estimated global aggregate emissions not covered by the INDCs. In the context of this
document, methods were used:
(a) To estimate the aggregate levels of emissions resulting from the
implementation of the communicated INDCs in 2025 and 2030;
(b) To estimate the levels of the emissions not covered by the INDCs in 2025
and 2030 using IPCC reference scenarios.37
95. The aggregate levels of emissions in 2025 and 2030 resulting from the
implementation of the communicated INDCs were estimated by adding up the expected
levels of emissions in the same year communicated in each individual INDC. The resulting
emission levels are expressed as median values with an associated range (20th
to 80th
percentile), owing to the uncertainties underlying the aggregation of the INDCs as well as
the conditions expressed by Parties in their submissions.
37 Such estimates are based on global emission figures for 2025 and 2030 for the countries, sectors and
gases not covered by the communicated INDCs derived from IPCC scenarios in the AR5 scenario
database that reflect the 2020 pledges under the Cancun Agreements. The specific scenarios used for
the sector-, gas-, country- and region-specific growth rates of emissions until 2025 and 2030 are from
the so-called P3 set of scenarios, specificallytheAMPERE‘HST’subset(number=22), which
investigated climate policies implemented to meet the 2020 pledges under the Cancun Agreements
and kept climate policies constant thereafter until 2030.
FCCC/CP/2016/2
24
96. Regarding the conditions expressed by Parties in their submissions, this document
presents estimates of the expected aggregate levels of emissions in 2025 and 2030 for three
scenarios:
(a) The full range of implementation of both the unconditional and conditional
components of the INDCs;38
(b) The implementation of the unconditional components of the INDCs: Parties
with INDCs are assumed to implement only the unconditional components of their targets
and Parties that have only a conditional target, or have not submitted an INDC, are assumed
to follow their current policy trajectory;
(c) The implementation of the conditional components of the INDCs: Parties
with INDCs are assumed to implement the conditional components of their targets; Parties
that have only an unconditional target are assumed to implement that; and Parties without
an INDC are assumed to follow their current policy trajectory.
97. Further discussion of the aggregate effect of the implementation of the
communicated INDCs in this document is based on the assumption of the full range of
implementation of both the unconditional and conditional components of the INDCs.
98. Whenever a Party included in its INDC an expected level of emissions in 2025 or
2030, that figure was used in the calculation of the aggregate level. In the absence of such a
figure, the method used for quantifying that level differed, depending on the type of INDC,
as follows:
(a) For absolute economy-wide emission reduction targets relative to a base year,
the estimated level of emissions in the target year (2025 or 2030) was calculated directly by
subtracting from the level of emissions in the base year the percentage specified by the
Party for that target year;
(b) For emission reductions below BAU level, the estimated level of emissions in
the target year was calculated by subtracting from the expected level of emissions in the
target year the percentage reduction specified by the Party for that year;
(c) For intensity targets (e.g. targets expressed as a percentage reduction in the
relationship between emissions and GDP), the estimated level of emissions in the target
year was calculated by, firstly, subtracting from the intensity in the reference year the
percentage specified by the Party for that target year and, secondly, by multiplying the
resulting intensity by the expected level of GDP in the target year, as communicated by the
Party, if available;
(d) For emission peaking targets, historical emission growth rates were projected
linearly towards zero in the year of peaking to obtain an estimate of maximum emissions;39
(e) For Parties that used a combination of any of the above and for which sectors
and gases may overlap, expected levels of emissions in 2025 and 2030 were estimated
individually. The target that resulted in the lowest emission levels was used in the
calculation of aggregate emissions;
(f) This document does not contain a quantification of the effect of other types
of INDC, including mitigation co-benefits of adaptation actions and policies and measures,
38 In cases where Parties stated a range of conditional and/or unconditional targets, individual country
ranges for the purpose of calculating a global aggregate were assumed to stretch from the lower
emission end of the conditional range to the higher emission end of the unconditional range.
39 Whenever necessary, multiple initial growth rates were used. The secretariat ensured that the
estimates were consistent with national expert assessments.
FCCC/CP/2016/2
25
unless official estimates of emissions in 2025 and 2030 were provided by the Party
concerned.
99. Most Parties indicated a time frame of up to either 2025 or 2030 in their INDCs. For
Parties that applied a time frame of up to 2030, the level of emissions in 2025 was
estimated using linear interpolation between the latest available emission level and the
estimated level of emissions in 2030 resulting from the implementation of their INDC. If
the Party in question had previously communicated a target with a time frame of up to 2020
(e.g. action communicated in the context of the pre-2020 period), the level of expected
emissions in 2020 pursuant to that target was used in the interpolation alongside the current
level of emissions. In that case, both emission levels for 2025 were aggregated to achieve
the global emission level in order to reflect the uncertainty inherent to the quantification.
100. For Parties that applied a time frame of up to 2025, their estimated level of
emissions in 2030 resulting from the implementation of their INDC was calculated as
follows:
(a) If the Party provided a long-term trajectory or target, that information was
used to interpolate emissions from the expected emission level in 2025 resulting from the
implementation of its INDC to the level specified by the long-term trajectory or target;
(b) If the Party did not provide a long-term trajectory, linear extrapolation from
the estimated emission level in 2025 was used to estimate the emission level in 2030 using
an average change in emissions until 2025 on the basis of available historical data and, if
available, of actions communicated for up to 2020 or earlier.
101. In applying the methods specified above, the targets communicated by each Party as
part of its INDC took precedence. That information was complemented, as necessary, by
data contained in the latest official inventories, national communications, biennial update
reports and biennial reports. Any remaining data gaps were addressed by using a set of
scientific global data sets.40
102. As noted in paragraph 89 above, the estimated level of emissions communicated in
each INDC for the target years (2025 and 2030) includes only the sectors and gases
specified by each Party in its INDC. As a result, the aggregate level of emissions resulting
from the implementation of the communicated INDCs is a partial estimate that excludes
Parties that did not communicate INDCs as well as the sectors and gases that each Party
chose not to include in its INDC. In order to discuss that partial estimate in the global
context, total global emissions in 2025 and 2030 were estimated as described in
paragraph 91 above.
40 For a consistent aggregation of emissions, a gas-by-gas data basis was necessary to allow conversion
from different metrics, such as GWPs from the IPCC Second Assessment Report or AR5 into GWPs
from the AR4, which were used consistently for the aggregation presented in this document. This is
part of the reason why, in some cases, complementary data sets were necessary in order to arrive at an
estimate of the aggregate effect of the INDCs. The primary complementary source of gas-by-gas data
on the emissions of Parties not included in Annex I to the Convention was the AR5 historical
emission database (as shown in figure SPM.1 of the contribution of Working Group II to the AR5),
which is a composite database including sources such as the International Energy Agency, the
Emission Database for Global Atmospheric Research and Houghton RA, van der Werf GR, DeFries
RS, Hansen MC, House JI, Le Quéré C, Pongratz J and Ramankutty N. 2012. Carbon emissions from
land use and land-cover change. Biogeosciences. 9: pp. 5125–5142 in combination with data from the
Food and Agriculture Organization of the United Nations, the Carbon Dioxide Information Analysis
Center and others.
FCCC/CP/2016/2
26
103. To derive the level of the emissions not covered by the communicated INDCs,
global emission scenarios41 were adjusted to remove the reference emissions strictly
associated with the INDCs by extracting any relevant gas-, sector-, country- or region-
specific growth rate. Additional details on this are available in the technical web-based
annex.
104. Cumulative CO2 emissions were calculated by assuming the same growth rates in
CO2 and non-CO2 emissions as projected in the IPCC reference scenarios, starting from the
last available year of historical emission data in the underlying emission database. The
resulting share of CO2 emissions was then applied to the linearly estimated trajectory of
GHG emissions between the last historical data point and estimated emission levels for
2020, 2025 and 2030. Consistent with the report of IPCC Working Group I,42 future carbon
emissions were then summed for the cumulative emission estimate, starting after 2011.
105. The results presented in chapter II.E below correspond to a 60 per cent range from
the 20th
to the 80th
percentile across the set of a total of 304 emission estimates for 2025 and
2030, with 152 being different implementations of the high and 152 being different
implementations of the low emission estimates. Those estimates are taken from the
respective ends of any communicated INDC target ranges. The high end aggregates all
unconditional INDC targets (or the upper ends of any unconditional ranges) or, if a Party
did not communicate an unconditional INDC target, the reference scenario. The low end
aggregates all conditional INDC targets (or the lower ends of any conditional ranges) or, if
a Party did not communicate a conditional INDC target, all unconditional INDC targets (or
the lower ends of any unconditional ranges).
3. Key challenges and assumptions
106. The approach and methods described above include a number of uncertainties linked
to data availability and quality.
107. One key challenge relates to the different ways in which Parties have chosen to
express their INDCs, including time frames and reference years as well as the sectors and
gases covered.
108. Further challenges relate to the methodologies used for estimating and projecting
GHG emissions as well as to the quality, clarity and completeness of the data used (see
chapter II.D below). The latter includes, for example: missing information on metrics, such
as GWP values applied; lack of gas-by-gas emission data to be able to aggregate emissions
with the same consistent metrics; missing or incomplete data on the BAU scenario and
expected future values for GDP or population; lack of clarity on approaches to the
accounting of the LULUCF sector; missing information on the application of conditions in
the target year; and lack of information on the use of international market-based
mechanisms and how double counting was avoided.
109. The above-listed challenges were addressed by applying a consistent approach, as
follows:
(a) Uncertainties arising from the different ways in which Parties have chosen to
express their INDCs were addressed by applying the method described in paragraph 98
above;
41 The scenarios were taken from the AR5 scenario database, available at <https://secure.iiasa.ac.at/web-
apps/ene/AR5DB/dsd?Action=htmlpage&page=about>.
42 Climate Change 2013: The Physical Science Basis. Available at
<http://www.ipcc.ch/report/ar5/wg1/>.
FCCC/CP/2016/2
27
(b) As noted in chapter II.C.1 above, the analysis is based on data included by
Parties in their INDCs. Challenges related to missing data were addressed as described in
paragraph 100 above;
(c) Differences in the coverage of sectors and emissions were addressed by
limiting the country-level analysis to the GHG emissions covered by the INDCs;
(d) Uncertainties linked to conditions specified by Parties in their INDCs were
addressed by estimating unconditional and conditional emission reduction levels and
expressing the result as a range.
110. A major area of uncertainty relates to the approaches used for estimating, projecting
and accounting emissions and removals from the LULUCF sector. The results presented in
this document are dependent upon the high sensitivity of the methods used to estimate
global emissions to how emissions and removals from that sector were considered. For
example, some Parties intend to follow specific accounting rules, while others take a full
carbon accounting approach (i.e. include LULUCF net emissions or removals like
emissions from any other sector).43
111. This document takes those divergent treatments of the LULUCF sector into account
when estimating global emission levels. For example, a relative target below a historical
base year was applied to the total national emissions including LULUCF emissions if the
country stated its intention to account for the LULUCF sector as any other sector. To the
extent quantifiable with the available data sources, exceptions were taken into account, for
example reported wildfire-related (and approximate estimates for insect-related) emissions
were subtracted for the base year if emissions related to natural disturbances were intended
not to be counted up to 2025 or 2030. In the absence of other methods to estimate
LULUCF-related accounting for some Parties, if applicable a (discounted) continuation of
credits or debits from the first commitment period under the Kyoto Protocol was assumed
(see the online technical annex for more details). Where available, reported projections
‘with existing measures’ formed the basis for LULUCF-related emission and removal
estimates in the future, unless the Party specified LULUCF projections in its INDC.
Alternatively, the last available historical data points were assumed to remain constant.
112. There is a definitional difference between the UNFCCC guidance on estimating
anthropogenic GHG emissions and removals from the LULUCF sector on the one side and
the land-use change related emissions that are part of the global emission estimates of the
IPCC44 and scenarios in the AR5 scenario database on the other. In order to be able to
compare estimated global emission levels with estimates from the AR5 and AR5 scenarios,
the underlying calculations undertaken for this assessment take into account LULUCF
emissions and removals as indicated by Parties with regard to their effect on the other
sectors in the total national emissions by 2025 and 2030. In order to arrive at global total
emission estimates in line with the global emission estimates of the IPCC, a range of global
land-use change emission scenarios in line with the pledges under the Cancun Agreements
was assumed for the timeline up to 2025 and 2030.45 This enables the comparison of the
43 A few Parties specified how natural disturbances and harvested wood products are to be accounted
for.
44 See, for example, figure SPM.1 contained in the contribution of Working Group III to the AR5.
45 Specifically, global land-use change emissions in the past up to 2013 follow the Houghton et al. data
set used in the contribution of Working Group III to the AR5 and are merged with the land-use
change emissions that are part of the P3 AMPERE HST scenarios from the AR5 scenario database.
The estimated change in LULUCF emissions between current levels and 2025 or 2030 (a change of
–1.0 Gt CO2 by 2025 compared with 2005 and a change of –1.1 Gt CO2 by 2030 compared with
2005) pursuant to the information in Parties’INDCs,inventoriesandreferencelevelprojectionsis
within the range spanned by the change of emissions in the applied land-use change emission
FCCC/CP/2016/2
28
aggregate emission estimates presented in this document with the emission levels provided
by the IPCC.46
113. It should be noted that, in addition to the conditions stated by Parties in their INDCs,
the uncertainty related to the accounting of LULUCF emissions and projections of
LULUCF emissions and removals is a factor contributing to the need to express the
estimated aggregate emissions in 2025 and 2030 as a range. The change in the aggregate
LULUCF emissions and projections is within the range of the AR5 reference scenarios’
change in land-use change emissions from current levels to 2025 and 2030. This
qualitatively supports the chosen approach described in paragraph 112 above of how the
global emission estimates presented in this document were made consistent with those in
AR5 scenarios.
114. Emissions from international transport also have to be included in order to estimate
total global anthropogenic emission estimates and in order to achieve comparability with
emission scenarios from the AR5 scenario database and scientific literature. For the
assessment presented in this document, the International Civil Aviation Organization 2013
target of carbon-neutral growth from 2020 was used47 (i.e. the plateauing of international
aviation CO2 emissions from 2020). The level of CO2 emissions from international aviation
in 2020 is estimated to range between 0.68 and 0.76 Gt CO2 or between 52 per cent and 68
per cent above the 2010 level.48 For maritime transport emissions, a low and a high scenario
to span the range of mitigation scenarios presented by the International Maritime
Organization (IMO) were used. Specifically, scenario 5 (1.19 Gt CO2 emissions in 2030)
from the Third IMO 2014 GHG study49 was used as a higher-bound scenario, assuming a
2.9 per cent reduction below a high-growth baseline. As the lower bound, scenario 3 (0.94
Gt CO2 emissions in 2030) was used, which assumes a similar 2.9 per cent reduction, but
below a low-growth baseline.
115. As regards the use of international market-based mechanisms, the present analysis
assumes that any international offset will lead to additional emission reductions abroad. In
other words, it is assumed that emission reductions in the context of the implementation of
one INDC are not counted twice in the context of implementing another one.
D. Synthesis of the information in the communicated intended nationally
determined contributions
116. This chapter provides a synthesis of the information communicated by Parties in
their INDCs, except for the information in the adaptation component.50 It is structured in
accordance with the information elements listed in decision 1/CP.20, paragraph 14, as
described in paragraph 78 above, with a slightly changed order to allow for technical
information relevant to the quantitative analysis to be presented together.
scenarios, which supports the validity of this aggregation step in order to yield global emission
estimates that are comparable with the AR5 scenarios.
46 As footnote 41 above.
47 See <http://www.icao.int/Meetings/a38/Documents/WP/wp430_en.pdf>.
48 See <http://www.icao.int/Meetings/a38/Documents/WP/wp026_en.pdf>.
49 Available at
<http://www.imo.org/en/OurWork/Environment/PollutionPrevention/AirPollution/Pages/Greenhouse-
Gas-Studies-2014.aspx>.
50 A synthesis of the information communicated by Parties in their adaptation components is contained
in chapter II.F below.
FCCC/CP/2016/2
29
1. Types and targets of intended nationally determined contributions
117. All of the INDCs contain information on mitigation targets or on strategies, plans
and actions for low GHG emission development within a specified time frame or
implementation period (see figure 3).
118. Many of the INDCs are national in scope; they address all major national GHG
emissions or at least the most significant sources; and take a variety of forms:
(a) Some Parties included economy-wide mitigation targets, with absolute
emission reduction targets expressed as an emission reduction below the level in a specified
base year, ranging from a 9.8 to a 75.0 per cent emission reduction below the respective
base year level. A few of the INDCs contain absolute targets that are not linked to a base
year but establish an overall maximum absolute limit on emissions (e.g. carbon neutrality
by a future date or a specified amount of GHGs to be emitted over a period of time);
(b) Several Parties included relative targets for reducing emissions below BAU
level, either for the whole economy or for specific sectors, ranging from 1.0 to 80.6 per
cent;
(c) A few Parties included intensity targets, with reductions in GHG emissions
per unit of GDP or per capita, ranging from 10 to 45 per cent relative to the level in a base
year (e.g. 2005 or 2010) or to the absolute level of per capita emissions by 2025 or 2030;
(d) A few Parties specified mitigation contributions through to the year or time
frame in which their emissions are expected to peak (e.g. by 2030 or earlier);
(e) Some Parties included strategies, plans and actions for low GHG emission
development reflecting their special circumstances.
119. A few Parties provided information on mitigation co-benefits resulting from their
adaptation actions and/or economic diversification plans, mostly in combination with other
targets.
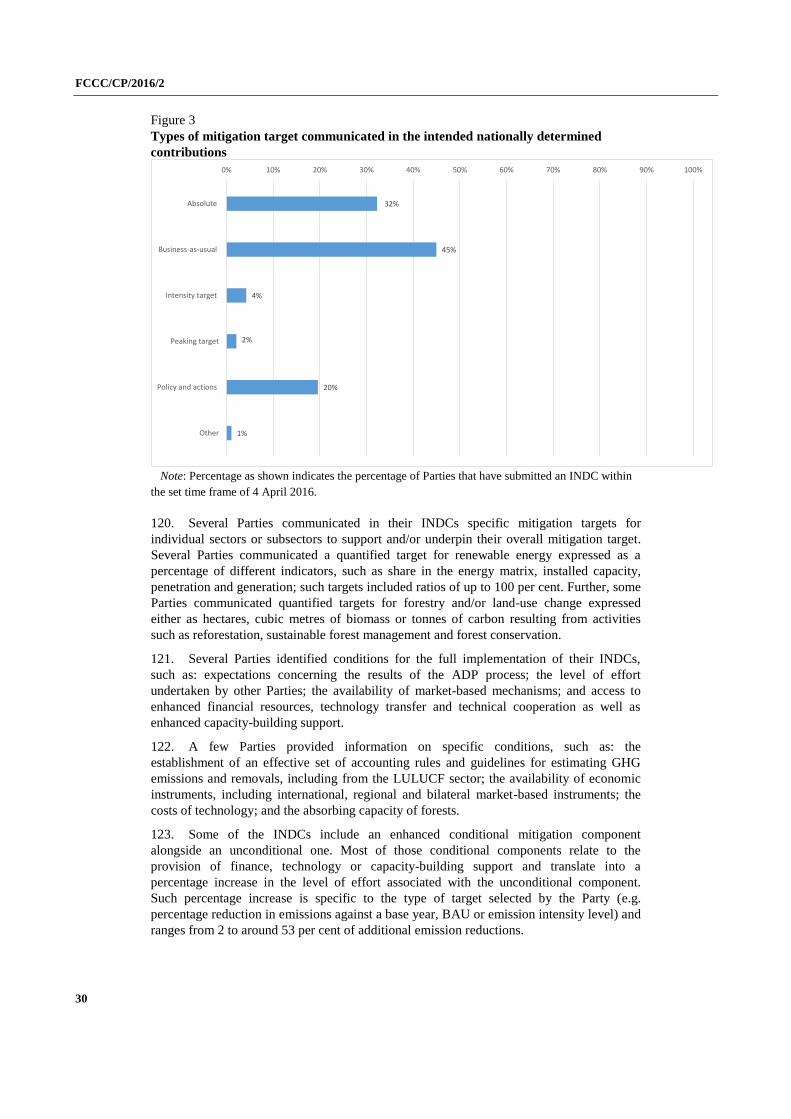
FCCC/CP/2016/2
30
Figure 3
Types of mitigation target communicated in the intended nationally determined
contributions
Note: Percentage as shown indicates the percentage of Parties that have submitted an INDC within
the set time frame of 4 April 2016.
120. Several Parties communicated in their INDCs specific mitigation targets for
individual sectors or subsectors to support and/or underpin their overall mitigation target.
Several Parties communicated a quantified target for renewable energy expressed as a
percentage of different indicators, such as share in the energy matrix, installed capacity,
penetration and generation; such targets included ratios of up to 100 per cent. Further, some
Parties communicated quantified targets for forestry and/or land-use change expressed
either as hectares, cubic metres of biomass or tonnes of carbon resulting from activities
such as reforestation, sustainable forest management and forest conservation.
121. Several Parties identified conditions for the full implementation of their INDCs,
such as: expectations concerning the results of the ADP process; the level of effort
undertaken by other Parties; the availability of market-based mechanisms; and access to
enhanced financial resources, technology transfer and technical cooperation as well as
enhanced capacity-building support.
122. A few Parties provided information on specific conditions, such as: the
establishment of an effective set of accounting rules and guidelines for estimating GHG
emissions and removals, including from the LULUCF sector; the availability of economic
instruments, including international, regional and bilateral market-based instruments; the
costs of technology; and the absorbing capacity of forests.
123. Some of the INDCs include an enhanced conditional mitigation component
alongside an unconditional one. Most of those conditional components relate to the
provision of finance, technology or capacity-building support and translate into a
percentage increase in the level of effort associated with the unconditional component.
Such percentage increase is specific to the type of target selected by the Party (e.g.
percentage reduction in emissions against a base year, BAU or emission intensity level) and
ranges from 2 to around 53 per cent of additional emission reductions.
32%
45%
4%
2%
20%
1%
0% 10% 20% 30% 40% 50% 60% 70% 80% 90% 100%
Absolute
Business-as-usual
Intensity target
Peaking target
Policy and actions
Other
FCCC/CP/2016/2
31
124. Furthermore, some Parties stated in their INDCs the expectation that negotiations
under the ADP will provide the clarity required for meeting some of the conditions referred
to in paragraphs 121 and 122 above. Some Parties indicated that they reserve the right to
revise their INDCs in the light of the outcome of the ADP process.
125. Given that the emission reductions communicated by some Parties are dependent
upon the fulfilment of certain conditions, the emission levels of those Parties can be
expressed as a range depending on whether the unconditional or conditional component of
the respective INDCs is implemented. In this document, aggregate emission levels for 2025
and 2030 are generally expressed on the assumption of the full range of implementation of
both the unconditional and conditional components that Parties communicated in their
INDCs. Where appropriate, aggregate emission levels for 2025 and 2030 are assessed
assuming that only the unconditional components of the INDCs are implemented, or
alternatively assuming that the conditional components of the INDCs are implemented (and
only where no conditional component exists is the unconditional component assumed to be
implemented).
126. In addition to communicating information on mitigation targets or strategies, plans
and actions for the near to medium terms, some Parties included information on long-term
mitigation strategies for the period up to and beyond 2050. In many of those INDCs, the
near- to medium-term mitigation contribution is embedded in the long-term development
strategy, aiming at greater ambition over time. The long-term goals communicated in the
INDCs range from a 25 per cent GHG emission reduction by 2050 below BAU level,
through emission reductions or per capita emission reductions by 2050 below a specific
base year level (e.g. 1990 or 2000), to achieving carbon neutrality or the transition to a low-
emission society by 2050 or 2085.
2. Information on the reference point (including, as appropriate, a base year)
127. Information on the reference point indicates a specific year (base year) or time frame
when the emission levels or emission intensity levels serve as reference to set a mitigation
target for the future. Information on the base year applies to absolute emission reductions or
intensity-based mitigation objectives rather than to the objectives expressed as reductions
below BAU level or as a peaking year, although a few Parties indicated a reference year for
their BAU projections.
128. Many Parties provided information on the reference point. Some Parties chose 1990
as a base year, some chose 2005 and others referred in their INDCs to 2000, 2002, 2006,
2007, 2008, 2009, 2010, 2013, 2014 or 2015. Several Parties specified the level of their
emissions for the reference point and/or the specific source of the emission data for the
reference point, such as a national inventory or other report submitted to the UNFCCC.
Several Parties that expressed their mitigation objectives as a reduction below BAU level
provided information on the reference emission scenarios.
3. Time frames and/or periods of implementation
129. Time frame and/or period of implementation refers to a time period in the future
during which an objective included in an INDC is to be achieved. Depending on their
national circumstances, Parties communicated a single year or a period.
130. Most Parties communicated information on time frame and/or period of
implementation in their INDCs. Most Parties communicated either a 5- or 10-year time
frame for the implementation of their INDC. Most of the communicated INDCs refer to a
period of implementation of up to 2030, while some Parties specified a period of up to
2025. A few of the INDCs communicated targets for both 2025 and 2030, one of which is
indicative or interim. A few Parties indicated a target for 2035 or 2040. Some Parties
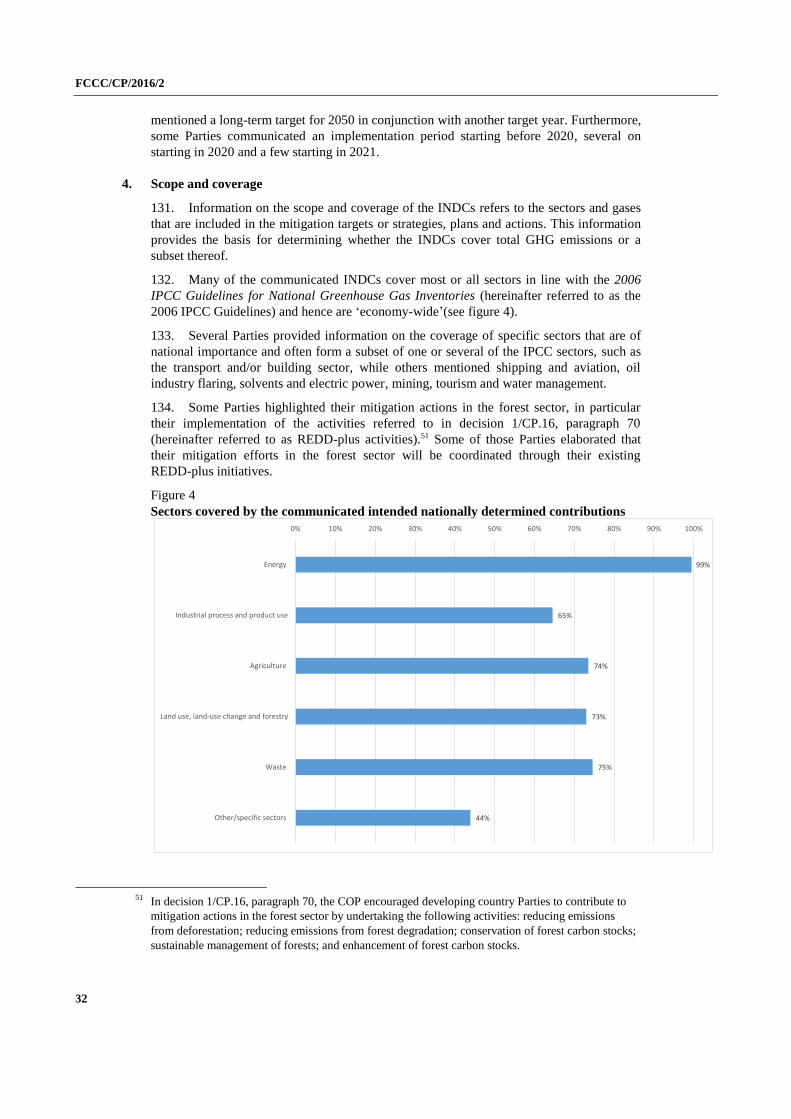
FCCC/CP/2016/2
32
mentioned a long-term target for 2050 in conjunction with another target year. Furthermore,
some Parties communicated an implementation period starting before 2020, several on
starting in 2020 and a few starting in 2021.
4. Scope and coverage
131. Information on the scope and coverage of the INDCs refers to the sectors and gases
that are included in the mitigation targets or strategies, plans and actions. This information
provides the basis for determining whether the INDCs cover total GHG emissions or a
subset thereof.
132. Many of the communicated INDCs cover most or all sectors in line with the 2006
IPCC Guidelines for National Greenhouse Gas Inventories (hereinafter referred to as the
2006 IPCC Guidelines) and hence are ‘economy-wide’(see figure 4).
133. Several Parties provided information on the coverage of specific sectors that are of
national importance and often form a subset of one or several of the IPCC sectors, such as
the transport and/or building sector, while others mentioned shipping and aviation, oil
industry flaring, solvents and electric power, mining, tourism and water management.
134. Some Parties highlighted their mitigation actions in the forest sector, in particular
their implementation of the activities referred to in decision 1/CP.16, paragraph 70
(hereinafter referred to as REDD-plus activities).51 Some of those Parties elaborated that
their mitigation efforts in the forest sector will be coordinated through their existing
REDD-plus initiatives.
Figure 4
Sectors covered by the communicated intended nationally determined contributions
51 In decision 1/CP.16, paragraph 70, the COP encouraged developing country Parties to contribute to
mitigation actions in the forest sector by undertaking the following activities: reducing emissions
from deforestation; reducing emissions from forest degradation; conservation of forest carbon stocks;
sustainable management of forests; and enhancement of forest carbon stocks.
99%
65%
74%
73%
75%
44%
0% 10% 20% 30% 40% 50% 60% 70% 80% 90% 100%
Energy
Industrial process and product use
Agriculture
Land use, land-use change and forestry
Waste
Other/specific sectors
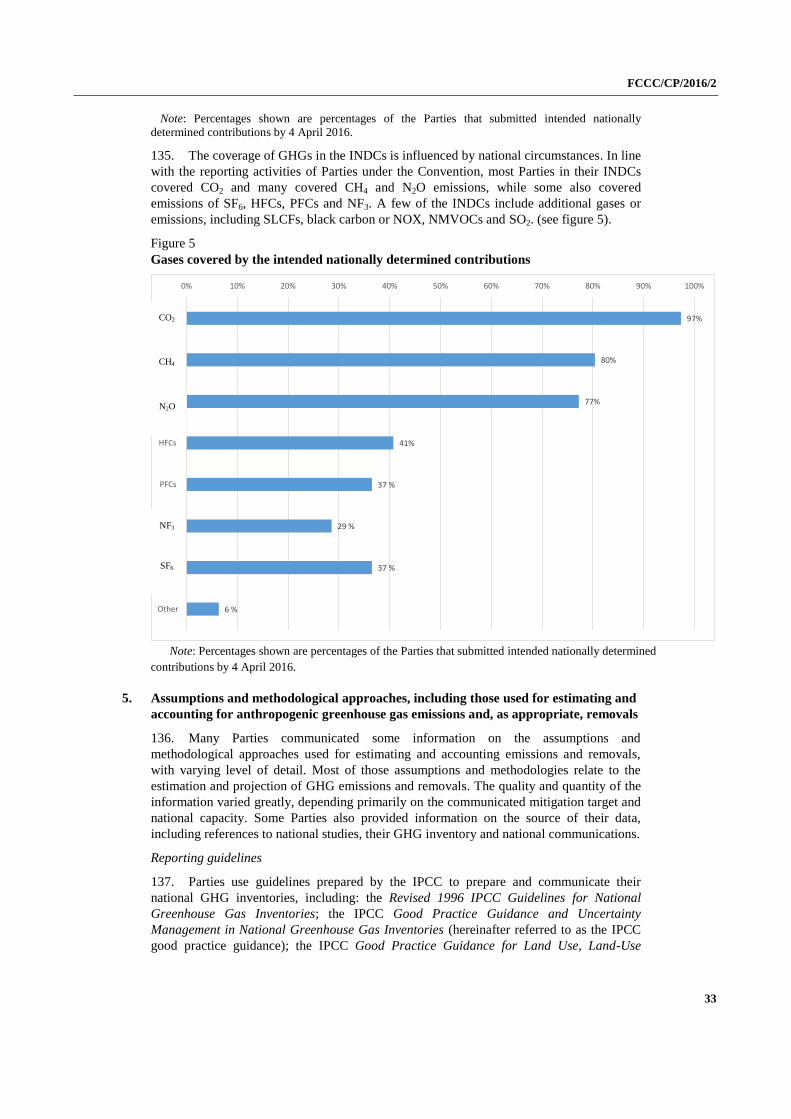
FCCC/CP/2016/2
33
Note: Percentages shown are percentages of the Parties that submitted intended nationally
determined contributions by 4 April 2016.
135. The coverage of GHGs in the INDCs is influenced by national circumstances. In line
with the reporting activities of Parties under the Convention, most Parties in their INDCs
covered CO2 and many covered CH4 and N2O emissions, while some also covered
emissions of SF6, HFCs, PFCs and NF3. A few of the INDCs include additional gases or
emissions, including SLCFs, black carbon or NOX, NMVOCs and SO2. (see figure 5).
Figure 5
Gases covered by the intended nationally determined contributions
Note: Percentages shown are percentages of the Parties that submitted intended nationally determined
contributions by 4 April 2016.
5. Assumptions and methodological approaches, including those used for estimating and
accounting for anthropogenic greenhouse gas emissions and, as appropriate, removals
136. Many Parties communicated some information on the assumptions and
methodological approaches used for estimating and accounting emissions and removals,
with varying level of detail. Most of those assumptions and methodologies relate to the
estimation and projection of GHG emissions and removals. The quality and quantity of the
information varied greatly, depending primarily on the communicated mitigation target and
national capacity. Some Parties also provided information on the source of their data,
including references to national studies, their GHG inventory and national communications.
Reporting guidelines
137. Parties use guidelines prepared by the IPCC to prepare and communicate their
national GHG inventories, including: the Revised 1996 IPCC Guidelines for National
Greenhouse Gas Inventories; the IPCC Good Practice Guidance and Uncertainty
Management in National Greenhouse Gas Inventories (hereinafter referred to as the IPCC
good practice guidance); the IPCC Good Practice Guidance for Land Use, Land-Use
97%
80%
77%
41%
37 %
29 %
37 %
6 %
0% 10% 20% 30% 40% 50% 60% 70% 80% 90% 100%
CO2
CH4
N2O
HFCs
PFCs
NF3
SF6
Other
CO2
N2O
CH4
NF3
SF6
FCCC/CP/2016/2
34
Change and Forestry (hereinafter referred to as the IPCC good practice guidance for
LULUCF); and the 2006 IPCC Guidelines.
138. Many Parties referred in their INDCs to the standard methods and procedures
contained in the different IPCC guidelines. Some Parties mentioned the use of the 2013
Revised Supplementary Methods and Good Practice Guidance Arising from the Kyoto
Protocol as well as the IPCC good practice guidance, the IPCC good practice guidance for
LULUCF and the 2013 Supplement to the 2006 IPCC Guidelines for National Greenhouse
Gas Inventories: Wetlands.
Global warming potentials and other metrics
139. GWPs are used to aggregate emissions of the different GHGs into a single national
total. Several Parties communicated in their INDCs information on GWPs. Several of those
INDCs considered GWPs on a 100-year timescale in accordance with either the IPCC
Second Assessment Report (including the INDCs that refer to decision 17/CP.8) or the AR4
(including the INDCs that refer to decision 24/CP.19). A few Parties used GWP values
published in the AR5 and one Party used GWP values and also global temperature
potentials to describe its mitigation targets.52
Land use, land-use change and forestry
140. Many Parties included emissions and removals from LULUCF or specific mitigation
actions targeting them in their INDCs. Some Parties mentioned actions in the LULUCF
sector among the priority areas in the implementation of their INDCs.
141. Some Parties included in their INDCs information specific to LULUCF accounting.
Several of them did not include comprehensive information on the assumptions and
methods used in the accounting of emissions and removals from LULUCF. This presents a
major challenge in the assessment of the aggregate effect as it represents a major area of
uncertainty.
142. Several Parties stated their intention to account for LULUCF, covering all emissions
and removals from all pools and gases, using a net-net approach, or they listed a number of
activities, namely afforestation, reforestation, revegetation, wetland restoration, reducing
emissions from deforestation and forest degradation.
143. A few Parties indicated that they are switching to a comprehensive land-based
approach but that the actual approach for quantifying LULUCF is still to be defined. A few
Parties explained that the decision on whether LULUCF would be included, and on any
related methods, would be made at a later stage once better information on mitigation
potential is available.
144. A few Parties stated that they will make use of specific provisions for LULUCF in
order to address specific issues, such as how to address the inclusion of harvested wood
products, the exclusion of emissions from natural disturbances, permanence, land-use
flexibility, legacy and non-anthropogenic effects.
145. A few Parties indicated that a common framework for accounting for LULUCF may
be desirable, which could be based on existing guidance and experience under the
Convention and its Kyoto Protocol. Most of those Parties are of the view that such a
framework should be comprehensive and should ensure transparency and environmental
integrity. Finally, one Party indicated that reference scenarios or levels used in the
52 One Party used GWPs for black carbon described in Bond et al. 2013. Bounding the role of black
carbon in the climate system: A scientific assessment. Journal Of Geophysical Research Atmosphere.
118(11): pp. 5380–5552.
FCCC/CP/2016/2
35
accounting of LULUCF should, when based on a projection, be subject to a technical
assessment process.
Future greenhouse gas emission levels
146. For mitigation targets other than economy-wide absolute emission reductions,
information on expected GHG emissions in the future is required to assess the aggregate
effect of the implementation of the INDCs. Several Parties provided a quantitative baseline,
BAU scenario or projections of emissions for 2025 and/or 2030. A few Parties indicated
that they will provide related information once it becomes available.
147. Several Parties provided information on the assumptions used to develop a BAU
scenario or to project GHG emissions. Most of those Parties referred to macroeconomic
variables such as GDP or population or to growth rates of those two variables. Other Parties
mentioned the use of sector-specific variables, in particular for the energy sector, such as
future demand for energy or electricity, electrification rates, efficiency and grid loss, as
well as activity data for other sectors. A few only provided values for those variables and
some referred to sources of data such as national statistics or international databases.
148. Some Parties mentioned the use of models to estimate future emissions, such as the
Long-range Energy Alternatives Planning system or the Greenhouse Gas Costing Model. A
few indicated the development of scenarios to estimate future emissions under BAU and
different levels of mitigation effort and on the basis of the implementation of a series of
mitigation measures. Other Parties mentioned the use of ad hoc models, the climate justice
index or regional climate models.
6. Planning processes
149. Most of the INDCs communicated by Parties contain information on planning
processes, at both the national and international level. In this context, Parties communicated
information on existing and future institutional arrangements, existing and planned
legislation and policies, priority areas for future implementation and stakeholder
engagement.
Institutional arrangements
150. Institutional arrangements, including institutional structures and processes, were
indicated by many Parties to be a key element of their overall national climate change
planning process.
151. Many Parties in their INDCs communicated that, as a result of the implementation
of their current climate policies, they can draw upon already established institutions and
instruments to implement their INDCs. Some Parties highlighted that they are strengthening
existing institutions and their capacity in response to the challenges of implementing their
INDCs and the transition towards low-emission development by broadening their scope and
equipping them with additional mandates and/or resources. Such institutions include
domestic laws and regulations related to climate change, implemented policies and
measures to address climate change and national, regional or local administration related to
climate change. Some Parties communicated information referring to their established
domestic measurement, reporting and verification systems. Some Parties have established
institutions to provide capacity-building and information-sharing platforms related to their
INDCs at the national and regional levels.
Existing legislation and policies
152. While the level of ambition and degree of advancement of national climate policies
vary, most Parties’ INDCs build on and/or are embedded in existing climate change and/or
development strategies, policies and legislation, owing to ongoing national sustainable
FCCC/CP/2016/2
36
development or climate change processes as well as experience with implementing the
Convention and its Kyoto Protocol.
153. Most of the INDCs are already backed up by existing domestic legislation or
policies. Many Parties in this context elaborated on their: national climate change policies
and strategies; national development plans and strategies; national green growth and
sustainable development policies and related sectoral policies (e.g. energy, renewable
energy, transport, agricultural and forestry policy); international commitments under the
Kyoto Protocol and the Doha Amendment; existing domestic regulations and laws; and
performance to date. A few of the INDCs identify a lack of sufficient legislation and
policies that would be needed for their implementation and resulting capacity-building
requirements.
154. Several Parties noted that the implementation of their INDCs will involve
strengthening laws and regulations on climate change and further integrating related
objectives into long-term economic and social development plans as well as the
improvement of the overall administration, performance evaluation and accountability
system on climate change and low-emission development targets. In some cases, this will
require revisions to the existing legal and policy frameworks. Some Parties highlighted
specific laws and policies that need to be revised or enhanced during the implementation of
their INDCs. Several Parties specified that their INDC as a whole or the revisions to
existing policies will be subject to approval by their national parliament.
155. Several Parties provided information on processes for creating new legislation and
policies, triggered by the preparation of their INDCs, including: the mainstreaming of
climate change related policies into development strategies; the establishment of national
carbon pricing instruments; energy efficiency policies and targets; emission standards; and
incentives for low-carbon technologies; while some Parties provided information
acknowledging that new institutions will be created to facilitate the implementation of their
INDCs.
Priority areas for future implementation
156. On the basis of their national circumstances and development priorities, several
Parties outlined priority areas with high mitigation potential relevant to the implementation
of their INDCs, often linked to the transformation of the existing energy system and the
expansion of carbon sinks.
157. Renewable energy was highlighted in several INDCs. Related actions are aimed at
increasing the share of and improving access to clean energy, such as feed-in tariffs,
investment programmes for renewable energy generation and the improvement of the grid
infrastructure to make it fit for renewable energy sources. Several Parties communicated
quantified renewable energy targets, with some aiming to achieve 100 per cent renewable
energy supply.
158. Actions to achieve energy efficiency, highlighted in several INDCs, include: energy
efficiency standards; the modernization of energy generation and transmission
infrastructure; the promotion of smart grids; efficiency improvements in industrial
processes and the building sector; and energy conservation standards. Some Parties
communicated quantitative energy efficiency targets. Sustainable transport was highlighted
by several Parties in the context of enhancing energy efficiency through measures such as
improving public transport, expanding the fleet of electric and biofuel vehicles, limiting the
import of inefficient vehicles and using fuel efficiency standards.
159. In several INDCs, Parties provided information on their plans to implement policies
and measures to reduce methane and other non-CO2 gases by: improving crop and livestock
production; promoting low-carbon agriculture; reducing fugitive emissions; recovering
FCCC/CP/2016/2
37
methane emissions; and establishing waste management and recycling programmes and
waste-to-energy facilities. Furthermore, some INDCs highlight measures to promote the
conservation and sustainable management of forests, increase forest cover and reduce the
drivers of deforestation. Some Parties particularly highlighted the importance of REDD-
plus activities in this context. A few Parties mentioned carbon capture and storage as their
priority area for national climate policy efforts, as a research and development priority to be
strengthened or as actions to be promoted and encouraged.
160. In providing information on their priority areas for future work, several Parties
highlighted the link between the actions to address climate change presented in their INDCs
and their development priorities, including social and economic development as well as
poverty eradication. In this context, Parties highlighted the need to further integrate climate
change related objectives into national economic and social development plans.
161. Some Parties highlighted additional priority areas relating to the implementation of
their INDCs, such as: the development of long-term low-emission development strategies
and the decoupling of economic growth from GHG emissions; the systematic assessment of
possible sources of funding; the enhancement of relevant research and development
agendas; the promotion of a low-emission lifestyle; the protection of biodiversity; and the
development of a climate change resilient society and economy.
162. Some Parties included specific policies in their INDCs that provide the potential for
scaling up and further development in the context of their implementation. Some examples
of current policies include: comprehensive national legally binding climate change and
energy legislation; national climate change strategies; carbon taxes or levies on CO2
emissions; domestic and regional emissions trading schemes; GHG emission inventories
and registries; and controlling GHG emissions in urbanized zones and cities.
163. In addition to priority areas with high mitigation potential relevant to the
implementation of their INDCs, some Parties indicated their intention to improve the
existing system or establish a new system for the measurement, reporting and verification
of emissions as a precursor to the full implementation of their INDCs. Examples of planned
measures include: establishing effective systems for collecting, processing, reporting and
archiving required data and information; improving statistical indicator systems and
accounting systems for emissions; further developing analytical capabilities; personnel
training and capacity-building; improving the quality of data; and establishing reporting
mechanisms at the national, subnational and entity levels.
164. Several Parties highlighted in particular the link between the actions to address
climate change presented in their INDCs and their development priorities, including social
and economic development as well as poverty eradication. Some Parties highlighted
synergies between their development and climate priorities and several Parties noted
specific co-benefits of action to address climate change, including: reduced local air
pollution and resulting health benefits; improved access to energy and enhanced energy
security; improved water quality and management; social progress, including poverty
reduction, increased well-being and job creation; economic diversification; and synergies
between adaptation and mitigation actions towards building resilience, in particular in
agriculture and forestry, as well as relating to food security.
Stakeholder engagement
165. Many Parties referred in their INDCs to the importance of national consultation and
interdisciplinary coordination to ensure strong alignment with socioeconomic development
objectives and buy-in from all relevant stakeholders.
166. Many Parties stated the high political priority of developing and communicating an
INDC. Several Parties mentioned that their INDC has been approved at the highest political
FCCC/CP/2016/2
38
level, for example by the national parliament, the cabinet of ministers or the president.
Furthermore, the importance of national, subnational and regional cooperative action
undertaken both by the government and non-state actors was noted by several Parties.
Several Parties specifically highlighted that several government levels share responsibility
for action and for establishing coordinating mechanisms in relation to climate change.
Some Parties specifically noted that initiatives undertaken by cities and subnational
governments will be an important driver for the implementation of their INDC.
167. Several Parties emphasized that their INDC has been subject to national stakeholder
consultation with a view to raising awareness and securing buy-in. Parties highlighted that
support from actors such as the private sector, academia and civil society, as well as from
relevant sectoral ministries and regional and local governments, is critical for identifying
realistic targets. Some Parties still plan to hold consultations on the overall national climate
policy underlying their INDC and on specific measures that allow emission reductions,
with a few already having specified the target time frame for them to take place.
168. The preparation of the INDCs has led to the establishment of new institutional
arrangements and consultation processes, in some cases involving not only sectoral
ministries, businesses, environmental non-governmental organizations, academia and local
governments, but also the general public. Some Parties have put in place new processes to
engage relevant public and private actors, such as parliamentary hearings, sectoral
dialogues, research cooperation, cross-cutting working groups, workshops, expert teams
and technical peer review, large-scale public consultations, different platforms for
information exchange, media, awareness-raising and education campaigns and the
invitation for written submissions as part of the national consultation process on the INDC.
7. Fairness, ambition and contribution to the objective of the Convention
Fairness
169. Most Parties provided information on how they consider their INDC to be fair and
ambitious in the light of their national circumstances.
170. In setting the framework for the discussion on fairness and ambition, many Parties
provided information on the global context in which their INDC and related actions should
be viewed, namely in the context of: a shared global effort to be undertaken in a fair and
equitable manner; the principles of equity and common but differentiated responsibilities
and respective capabilities; historical responsibilities, including based on climate justice;
the need for taking into account Parties’ national circumstances; the recognition that all
countries need to act and cooperate to address climate change; the application of the same
legal form and rules to all Parties; and the recognition that fairness considerations include
various aspects and national circumstances, as no single indicator can accurately reflect
fairnessoragloballyequitabledistributionofParties’efforts.
171. Many of the INDCs refer to specific national circumstances when outlining why
they are fair and ambitious. National circumstances relevant to determining the fairness and
ambition of the INDCs communicated by Parties include social, economic and geographical
factors, such as considerations related to: the need for poverty eradication and the
improvement of living standards; population structure and urban density; the impacts of
local or regional conflicts; economic development and the current industrial structure (e.g.
share of energy-intense or energy-efficient industries; or if it is a fossil fuel producing or
exporting country); energy mix and related limitations; economic diversification processes;
dependence on the global supply chain for food and energy security; sensitivity to the
volatility of regional and global developments; the size and geography of the country;
climatic conditions; natural resource endowment, including for renewable energy; and
vulnerability to climate change impacts, including dependency on climate-sensitive sectors
FCCC/CP/2016/2
39
such as agriculture, tourism and water. In this context, most of these Parties highlighted
their special status as an LDC or small island developing State.
172. In providing information on how they consider their INDC to be fair and ambitious,
many Parties viewed responsibility directly or indirectly in the context of their past, current
and future share in the global emissions and per capita emissions in comparison with global
averages, as well as of the trends in one or several of those indicators. Further, several
Parties provided information on specific criteria for evaluating fairness and ambition,
including criteria relating to: responsibility and capability; share of emissions; development
and/or technological capacity; mitigation potential; cost of mitigation actions; the degree of
progression or stretching beyond the current level of effort; and the link to objectives and
global goals.
Ambition
173. Many Parties placed ambition in the context of their national circumstances and
fairness considerations. For many Parties, ambition corresponds to the size of their efforts
to address climate change in relation to their national circumstances, capacity and
responsibility. The interpretation of ambition varies from country to country and is
manifestedinnarrativesthatexplainParties’levelofefforts.
174. In explaining how their INDC is ambitious, some Parties elaborated on how their
contribution represents a progression beyond their current undertakings, either in terms of
scope and scale of emission reductions, the type of INDC and financial effort, or in
comparison with the efforts of other Parties in similar circumstances and in terms of how
the INDC links to the global objectives under the Convention (including temperature
targets).
175. Some Parties communicated that their mitigation targets, mitigation co-benefits
resulting from their adaptation actions and/or economic diversification plans, or strategies,
plans and actions for low GHG emission development imply an acceleration in the national
rate of decarbonization and/or diversification of their economies and that the decoupling of
GHG emissions from economic growth will be achieved, transitioning towards a low-
carbon and climate-resilient development pathway. Several Parties provided information on
ambition and progression by highlighting emission reductions below BAU level and/or
substantial acceleration in the annual pace of emission reduction, in terms of both absolute
and relative reductions. Some Parties noted that their mitigation targets, mitigation co-
benefits resulting from their adaptation actions and/or economic diversification plans, or
strategies, plans and actions for low GHG emission development are in line with or go
beyond the reduction requirements stated by the IPCC and/or relevant COP decisions for
the global emission level or for specific groups of Parties.
176. Several Parties provided information on ambition by linking their INDC to the
objective of the global transition towards a low-carbon economy, with some specifically
referring in their INDC to the overall low-carbon transformation of the economy, the
decarbonization of energy supply, increasing carbon sinks and the modernization and
diversification of the economy. A few Parties highlighted their contribution to the provision
of support, including for the development and diffusion of low-emission technologies, and
referred to their past performance in reducing their emissions.
Contribution towards achieving the objective of the Convention
177. Most Parties communicated information on their contribution towards achieving the
objective of the Convention together with information on fairness and ambition.
178. Several Parties indicated that their expected level of emissions in the future would
fall within the scope of a global emission pathway that is consistent with the goal of
keeping the global average temperature increase below 2 °C, while some Parties referred to
FCCC/CP/2016/2
40
1.5 °C. In this context, some Parties referred to global and national decarbonization or to
specific emission reduction levels in the future, such as an 80–95 per cent emission
reduction by 2050 compared with the 1990 level for developed countries, or to global
emissions being at least halved by 2050 compared with the 1990 level, in accordance with
the findings of the IPCC.
179. Regarding the capacity to contribute to global mitigation actions towards achieving
the objective of the Convention, considerations of several Parties include the overall level
of socioeconomic development, GDP per capita, vulnerability to climate change, ability to
invest in long-term mitigation measures, such as carbon-efficient technologies, and the
support received from the international community that is framing the national capacity to
prepare and implement the INDC. A few Parties considered the carbon intensity of their
economy, the potential for cost-efficient mitigation and overall abatement costs, as well as
past efforts (ensuring that first movers are recognized for past mitigation actions), in
relation to their contribution towards achieving the objective of the Convention.
8. Additional information
180. Most Parties included in their INDCs information in addition to the elements
specified in decision 1/CP.20, paragraph 14, including on the use of market-based
mechanisms, support needs for the implementation of their INDCs, response measures and
economic diversification.
Market-based mechanisms
181. Several Parties indicated their intention to use market-based mechanisms, with a few
of those Parties identifying those instruments as a condition for the implementation of their
INDCs. Those Parties explicitly noted plans to use carbon credits from international,
regional or domestic schemes, including some Parties that expressed an interest in using the
clean development mechanism. Moreover, some Parties stated either a general interest in
market-based mechanisms or an intention to further explore their use.
182. Some of those Parties highlighted the role of market-based mechanisms in
enhancing the cost-efficiency of mitigation efforts, thus creating opportunities to raise
overall ambition. While almost no quantitative information was provided on the expected
degree of use, some Parties indicated that they would use market-based mechanisms to
meet only part of their mitigation targets.
183. Finally, some Parties stressed the need for principles and/or rules for governing the
use of such mechanisms. Such rules would aim at preventing double counting of emissions,
ensuring the environmental integrity of the credits generated and promoting sustainable
development benefits.
Support needs for implementing intended nationally determined contributions
184. Many Parties provided information on support for their INDCs, including general
support needs, domestic measures and views in relation to international support.
185. Information on support needs was included in many of the INDCs. The majority
noted the need for enhanced international support in the form of finance, technology
transfer and capacity-building for the implementation of the INDCs and for enhancing
ambition over time. A few Parties mentioned opportunities for South–South cooperation,
including through the promotion of mutual learning and international dialogue. A few
Parties specifically referred to support being required in view of the lack of institutional
capacity to plan and implement sector-specific actions or measures and to project and
monitor GHG emissions. Some Parties identified the provision of international support as a
condition for the full implementation of their INDCs. Others included a conditional
FCCC/CP/2016/2
41
component in their INDCs related to the provision of support, alongside an unconditional
component.
186. Some Parties included quantitative estimates of the domestic and/or international
finance required for the full implementation of their INDCs or for achieving their
conditional targets. Some Parties indicated only headline figures, while others included
figures at the sectoral level or provided in tabular format a detailed list of intended actions
and costs. Several Parties noted that they are still in the process of quantifying their
financial needs or refining their current analysis.
187. Some Parties included information on planned measures to make available the
domestic finance necessary for the implementation of their INDCs, including: the use of
market instruments; increased budgetary support for climate action; the development of
public–private partnerships; green procurement programmes; reformation of pricing and
taxation regimes; improvement of green credit mechanisms; and establishment of national
funds to channel and stimulate financial flows from different public and private sources.
188. With regard to international support, several Parties noted the need for enhancing
existing institutional arrangements for delivering international financial, technology and
capacity-building support, including mechanisms under the Convention, such as the Green
Climate Fund (GCF), the Global Environment Facility (GEF), the Adaptation Fund and the
Technology Mechanism, and for increasing the scale of, and expanding access to, financial
support for climate change action from bilateral and multilateral sources.
Response measures and economic diversification
189. A few Parties emphasized their special circumstance of being highly dependent upon
fossil fuel production. Most of them identified a portfolio of actions and plans in pursuit of
economic diversification with mitigation co-benefits, including: investing in clean energy
technology, energy efficiency, carbon capture and storage, methane recovery and flare
minimization; improving emission standards in the transportation sector; education; and
sustainable tourism. They indicated that some of their identified actions and plans will
result in less domestic fossil fuel consumption and thus yield mitigation co-benefits.
190. A few Parties included information on the adverse impacts of international policy
responses to climate change. Some of them mentioned the importance of understanding
such policy responses and assessing their impacts, and they stressed the need to take the
necessary steps to increase resilience to those impacts. Given their special circumstance of
being heavily reliant on hydrocarbons, most of those Parties included economic
diversification as one of their strategies for building such resilience. In addition, some of
them stated that international cooperation is important for them in addressing response
measures.
Other
191. A few Parties referred in their INDCs to other issues, such as: innovation as a driver
for green growth; gender; human rights, including the right to live free of poverty, and the
full realization of economic, social and cultural rights; the need to protect vulnerable
communities, including indigenous populations, traditional communities and workers in
sectors affected by climate change; and the prerogative of living in harmony with nature
and protecting the integrity of Mother Earth.
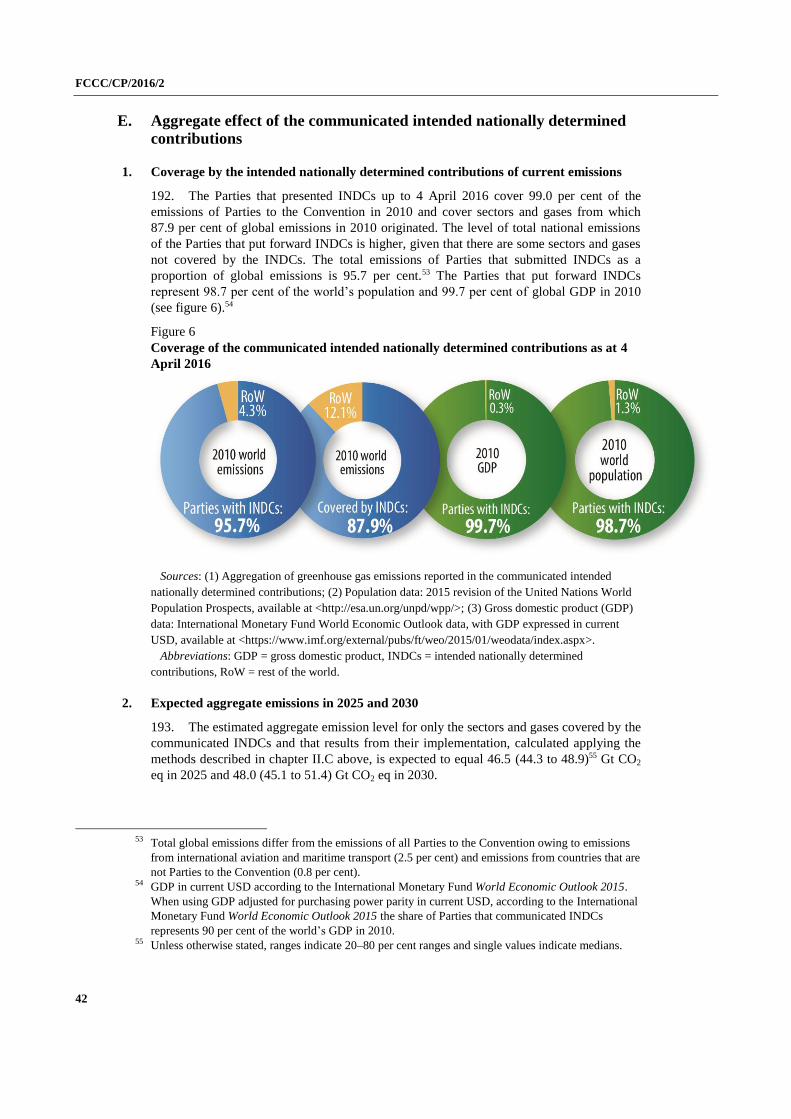
FCCC/CP/2016/2
42
E. Aggregate effect of the communicated intended nationally determined
contributions
1. Coverage by the intended nationally determined contributions of current emissions
192. The Parties that presented INDCs up to 4 April 2016 cover 99.0 per cent of the
emissions of Parties to the Convention in 2010 and cover sectors and gases from which
87.9 per cent of global emissions in 2010 originated. The level of total national emissions
of the Parties that put forward INDCs is higher, given that there are some sectors and gases
not covered by the INDCs. The total emissions of Parties that submitted INDCs as a
proportion of global emissions is 95.7 per cent.53 The Parties that put forward INDCs
represent98.7percentoftheworld’spopulationand99.7percentofglobal GDP in 2010
(see figure 6).54
Figure 6
Coverage of the communicated intended nationally determined contributions as at 4
April 2016
Sources: (1) Aggregation of greenhouse gas emissions reported in the communicated intended
nationally determined contributions; (2) Population data: 2015 revision of the United Nations World
Population Prospects, available at <http://esa.un.org/unpd/wpp/>; (3) Gross domestic product (GDP)
data: International Monetary Fund World Economic Outlook data, with GDP expressed in current
USD, available at <https://www.imf.org/external/pubs/ft/weo/2015/01/weodata/index.aspx>.
Abbreviations: GDP = gross domestic product, INDCs = intended nationally determined
contributions, RoW = rest of the world.
2. Expected aggregate emissions in 2025 and 2030
193. The estimated aggregate emission level for only the sectors and gases covered by the
communicated INDCs and that results from their implementation, calculated applying the
methods described in chapter II.C above, is expected to equal 46.5 (44.3 to 48.9)55 Gt CO2
eq in 2025 and 48.0 (45.1 to 51.4) Gt CO2 eq in 2030.
53 Total global emissions differ from the emissions of all Parties to the Convention owing to emissions
from international aviation and maritime transport (2.5 per cent) and emissions from countries that are
not Parties to the Convention (0.8 per cent).
54 GDP in current USD according to the International Monetary Fund World Economic Outlook 2015.
When using GDP adjusted for purchasing power parity in current USD, according to the International
Monetary Fund World Economic Outlook 2015 the share of Parties that communicated INDCs
represents 90 per cent of the world’s GDP in 2010.
55 Unless otherwise stated, ranges indicate 20–80 per cent ranges and single values indicate medians.
FCCC/CP/2016/2
43
194. The global levels of emissions in 2025 and 2030 were estimated by adding the
estimated aggregate emission levels resulting from the implementation of the
communicated INDCs to the levels of emissions not covered by the INDCs, in accordance
with IPCC reference scenarios. Thus, the global emission level resulting from the
implementation of the INDCs56 is expected to amount to 55.0 (51.4 to 57.3) Gt CO2 eq in
2025 and 56.2 (52.0 to 59.3) Gt CO2 eq in 2030.57, 58
195. These values assume the full range of implementation of both the unconditional and
conditional components of the INDCs. In addition, many of the targets in the INDCs were
stated as ranges, or alternatively the quantification underlying this document used in some
cases a low and a high scenario, if the quantification was not unambiguous. The discussion
of the aggregate effect of the implementation of the INDCs presented in chapters 3–6 below
is based on these values.
196. If only the unconditional components of the INDCs are aggregated, the resulting
global total emissions are projected to be 55.6 (53.1 to 57.3) Gt CO2 eq in 2025 and 57.9
(54.4 to 59.3) Gt CO2 eq in 2030. When aggregating all of the conditional components of
the INDCs, the resulting estimated level of global emissions is equal to 54.1 (51.4 to 55.8)
Gt CO2 eq in 2025 and 55.5 (52.0 to 57.0) Gt CO2 eq in 2030.
197. This comparison of the effect of the unconditional and conditional components of
the INDCs demonstrates that global emission reductions of 1.5 Gt CO2 eq in 2025 and 2.4
Gt CO2 eq (medians) in 2030, additional to the reductions resulting from the
implementation of the unconditional components of the INDCs, can be achieved if the
conditions stated in the conditional components of the INDCs are satisfied.
198. Global cumulative CO2 emissions resulting from the implementation of the
communicated INDCs after 2011 are expected to reach 533.1 (509.6 to 557.2) Gt CO2 in
2025 and 738.8 (703.6 to 770.9) Gt CO2 in 2030.
3. Expected aggregate emissions in relation to emission levels in 1990, 2000 and 2010
199. The estimated level of global total emissions was 38.7 Gt CO2 eq in 1990, 40.2 Gt
CO2 eq in 2000 and 48.1 Gt CO2 eq in 2010.59
56 Reported emission levels in this document, unless otherwise indicated, include land-use change
emissions and use GWP AR4 metric values with a 100-year time-horizon.
57 These estimates are based on adding the assessed aggregate level of emissions covered by the INDCs
and global emission figures for 2025 and 2030 for the countries, sectors and gases not covered by the
INDCs derived from scenarios in the AR5 scenario database that reflect 2020 pledges under the
Cancun Agreements. The quantification of the INDCs has been done separately for the lower and
higher ends of any provided ranges, distinguishing as well into conditional and unconditional targets.
In each of those cases, uncertainties related to estimating and accounting methodologies, data gaps
and interpolation of 2025 values in the case of INDCs communicating targets for 2030 etc. were taken
into account as previously discussed. If a Party provided only a single value of emission reduction
(without a range), that single value is reflected in both distributions, possibly with a respective low
and high quantification, if there was ambiguity around the appropriate estimated 2025 or 2030
emission level.
58 In contrast to the given median values, the estimated average global emission level resulting from the
implementation of the INDCs is 54.8 Gt CO2 eq in 2025 and 56.3 Gt CO2 eq in 2030, compared with
average global emission levels of 54.8 Gt CO2 eq in 2025 and 56.6 Gt CO2 eq in 2030 reported in the
synthesis report published on 30 October 2015 (FCCC/CP/2015/7).
59 The contribution of Working Group III to the AR5 reported estimated emissions in 1990 at 38 Gt CO2
eq, in 2000 at 40 Gt CO2 eq and in 2010 at 49 Gt CO2 eq (with uncertainty ranges) using GWPs from
the IPCC Second Assessment Report for aggregation (see figure SPM.1 in the contribution of
Working Group III to the AR5). For this document, 100-year GWPs from the AR4 were used, but
FCCC/CP/2016/2
44
200. The global aggregate level of emissions resulting from the implementation of the
communicated INDCs, assuming the full range of implementation of both unconditional
and conditional components, is thus expected to increase as follows:
(a) In relation to 1990: by 40 (33–47) per cent by 2025 and by 44 (34–53) per
cent by 2030;
(b) In relation to 2000: by 35 (28–41) per cent by 2025 and by 38 (29–47) per
cent by 2030;
(c) In relation to 2010: by 13 (7–19) per cent by 2025 and by 16 (8–23) per cent
by 2030.
201. If the ambition level of the announced INDC targets is maintained, targets not
enhanced and those stated targets exactly met, rather than overachieved, global emissions
are likely to increase until 2030. The rate of emission increase over the past two decades is
however very unlikely to be repeated, with an expected increase of 16 (8–23) per cent in the
period 2010–2030 compared with 24 per cent in the period 1990–2010, thus reflecting the
impact of the implementation of the INDCs.
202. Global average per capita emissions are expected to be 6.8 (6.4 to 7.2) t CO2
eq/capita in 2025 and 6.7 (6.3 to 7.2) t CO2 eq/capita in 2030.60
203. Per capita emissions were equal to 7.4 t CO2 eq/capita in 1990; 6.6 t CO2 eq/capita
in 2000; and 7.0 t CO2 eq/capita in 2010. Thus, future global average per capita emissions
show a slight decline of 8 and 4 per cent by 2025 and 10 and 5 per cent by 2030 compared
with their historical levels in 1990 and 2010, respectively.61 However, per capita emissions
in 2025 and 2030 are expected to be approximately 2 (–3 to +7) per cent and equal to 0 (–7
to +7) per cent above, respectively, per capita emission levels in 2000. After a decade of
decreasing global average per capita emissions from 1990 to 2000 and the recent increase
from 2000 to 2010, the implementation of the communicated INDCs hence represents a
turning point, namely a return to decreasing per capita emissions.
global numbers are comparable with and within the uncertainty range of the contribution of Working
Group III. In order to estimate historical emissions that are consistent and comparable with the
provided emission estimates considering the INDCs, the historical emission estimates were derived
from AR5 scenario estimates. The set of AR5 scenario estimates is not harmonized and exhibits slight
variations in recent historical emissions between the scenarios. Specifically, historical emission
estimates were derived by backwards extending AR5 scenarios on the basis of UNFCCC inventory
data for Parties included in Annex I to the Convention, IPCC historical data for Parties not included in
Annex I to the Convention, the Houghton et al. emissions used by the IPCC for land-use change
emissions and any remainder emission differences in 2010. Those remainder emission differences
between the bottom-up emission estimates and the IPCC scenarios in 2010 vary from scenario to
scenario (–0.9 (–0.9 to 0) Gt CO2 eq), but are small when compared with global emissions (–1.8 (–1.9
to 0) per cent). To capture the uncertainty, those remainder differences were backcasted
proportionally and projected into the future by a range of four different methods: (1) keeping the
remainder emissions constant or making them proportional to the other emissions at a (2) global, (3)
regional or, where IPCC scenario information was available, (4) country level.
60 The projections of per capita emissions assume three different population growth projections, namely
the low, median and high ones according to the 2015 revision of the United Nations 2012 population
projections (median: 8.04 billion by 2025 and 8.40 billion by 2030).
61 The declines in per capita emissions are stated here as averages of the median values for the default
case, which spans quantifications of conditional and unconditional INDCs. The 60 per cent
uncertainty range is approximately +/–4 and +/–6 per cent around those median values for 2025 and
2030, respectively.
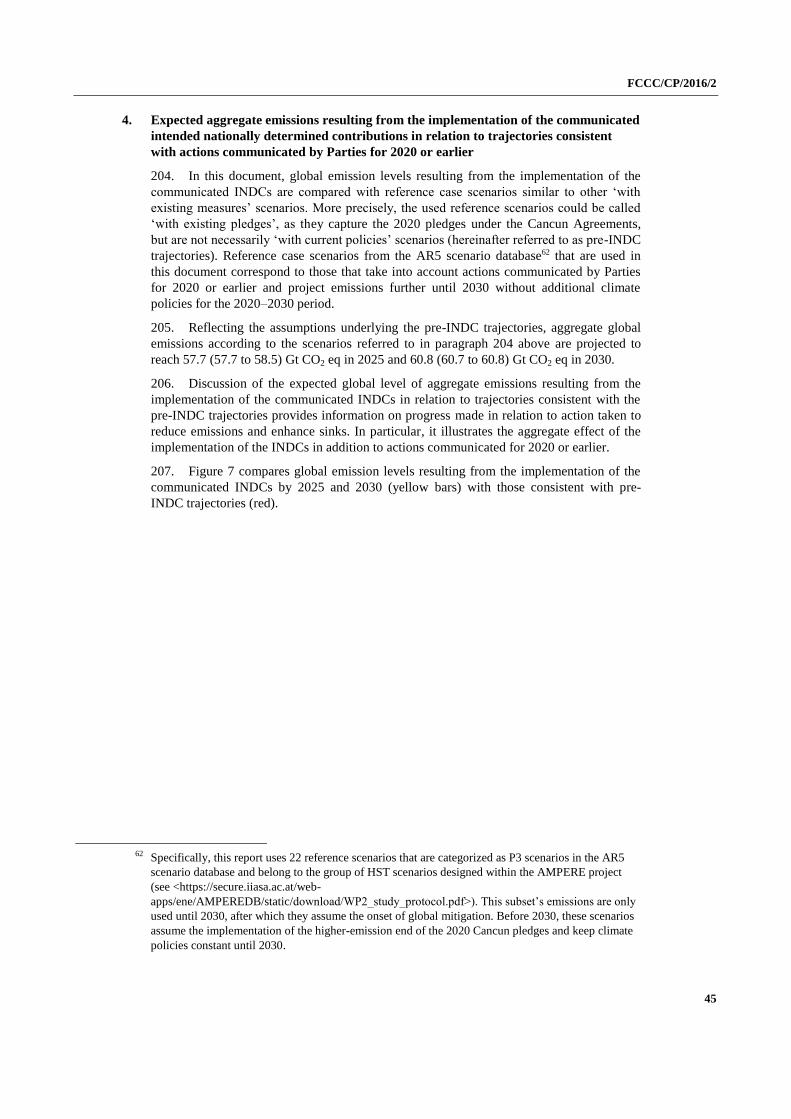
FCCC/CP/2016/2
45
4. Expected aggregate emissions resulting from the implementation of the communicated
intended nationally determined contributions in relation to trajectories consistent
with actions communicated by Parties for 2020 or earlier
204. In this document, global emission levels resulting from the implementation of the
communicated INDCs are comparedwith reference case scenarios similar to other ‘with
existingmeasures’scenarios.Moreprecisely,theusedreferencescenarioscouldbecalled
‘with existingpledges’, as they capture the 2020 pledges under the Cancun Agreements,
butarenotnecessarily‘withcurrentpolicies’scenarios(hereinafterreferredtoaspre-INDC
trajectories). Reference case scenarios from the AR5 scenario database62 that are used in
this document correspond to those that take into account actions communicated by Parties
for 2020 or earlier and project emissions further until 2030 without additional climate
policies for the 2020–2030 period.
205. Reflecting the assumptions underlying the pre-INDC trajectories, aggregate global
emissions according to the scenarios referred to in paragraph 204 above are projected to
reach 57.7 (57.7 to 58.5) Gt CO2 eq in 2025 and 60.8 (60.7 to 60.8) Gt CO2 eq in 2030.
206. Discussion of the expected global level of aggregate emissions resulting from the
implementation of the communicated INDCs in relation to trajectories consistent with the
pre-INDC trajectories provides information on progress made in relation to action taken to
reduce emissions and enhance sinks. In particular, it illustrates the aggregate effect of the
implementation of the INDCs in addition to actions communicated for 2020 or earlier.
207. Figure 7 compares global emission levels resulting from the implementation of the
communicated INDCs by 2025 and 2030 (yellow bars) with those consistent with pre-
INDC trajectories (red).
62 Specifically, this report uses 22 reference scenarios that are categorized as P3 scenarios in the AR5
scenario database and belong to the group of HST scenarios designed within the AMPERE project
(see <https://secure.iiasa.ac.at/web-
apps/ene/AMPEREDB/static/download/WP2_study_protocol.pdf>).Thissubset’semissionsareonly
used until 2030, after which they assume the onset of global mitigation. Before 2030, these scenarios
assume the implementation of the higher-emission end of the 2020 Cancun pledges and keep climate
policies constant until 2030.
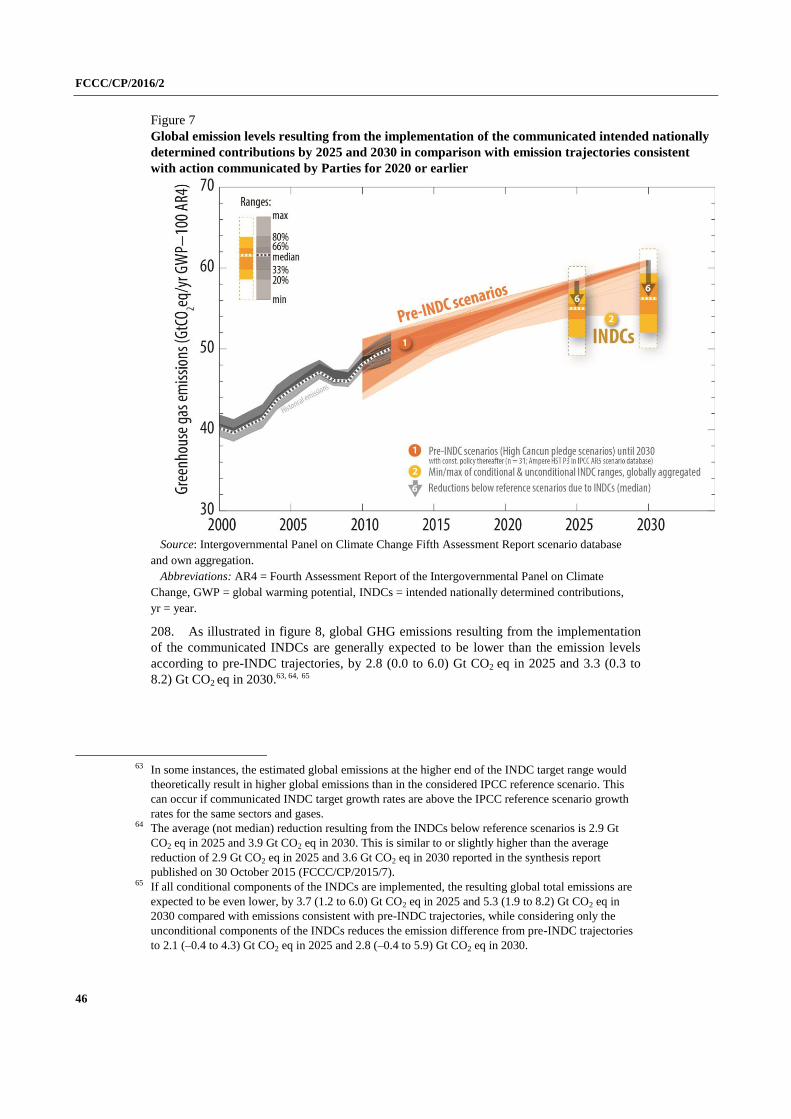
FCCC/CP/2016/2
46
Figure 7
Global emission levels resulting from the implementation of the communicated intended nationally
determined contributions by 2025 and 2030 in comparison with emission trajectories consistent
with action communicated by Parties for 2020 or earlier
Source: Intergovernmental Panel on Climate Change Fifth Assessment Report scenario database
and own aggregation.
Abbreviations: AR4 = Fourth Assessment Report of the Intergovernmental Panel on Climate
Change, GWP = global warming potential, INDCs = intended nationally determined contributions,
yr = year.
208. As illustrated in figure 8, global GHG emissions resulting from the implementation
of the communicated INDCs are generally expected to be lower than the emission levels
according to pre-INDC trajectories, by 2.8 (0.0 to 6.0) Gt CO2 eq in 2025 and 3.3 (0.3 to
8.2) Gt CO2 eq in 2030.63, 64, 65
63 In some instances, the estimated global emissions at the higher end of the INDC target range would
theoretically result in higher global emissions than in the considered IPCC reference scenario. This
can occur if communicated INDC target growth rates are above the IPCC reference scenario growth
rates for the same sectors and gases.
64 The average (not median) reduction resulting from the INDCs below reference scenarios is 2.9 Gt
CO2 eq in 2025 and 3.9 Gt CO2 eq in 2030. This is similar to or slightly higher than the average
reduction of 2.9 Gt CO2 eq in 2025 and 3.6 Gt CO2 eq in 2030 reported in the synthesis report
published on 30 October 2015 (FCCC/CP/2015/7).
65 If all conditional components of the INDCs are implemented, the resulting global total emissions are
expected to be even lower, by 3.7 (1.2 to 6.0) Gt CO2 eq in 2025 and 5.3 (1.9 to 8.2) Gt CO2 eq in
2030 compared with emissions consistent with pre-INDC trajectories, while considering only the
unconditional components of the INDCs reduces the emission difference from pre-INDC trajectories
to 2.1 (–0.4 to 4.3) Gt CO2 eq in 2025 and 2.8 (–0.4 to 5.9) Gt CO2 eq in 2030.
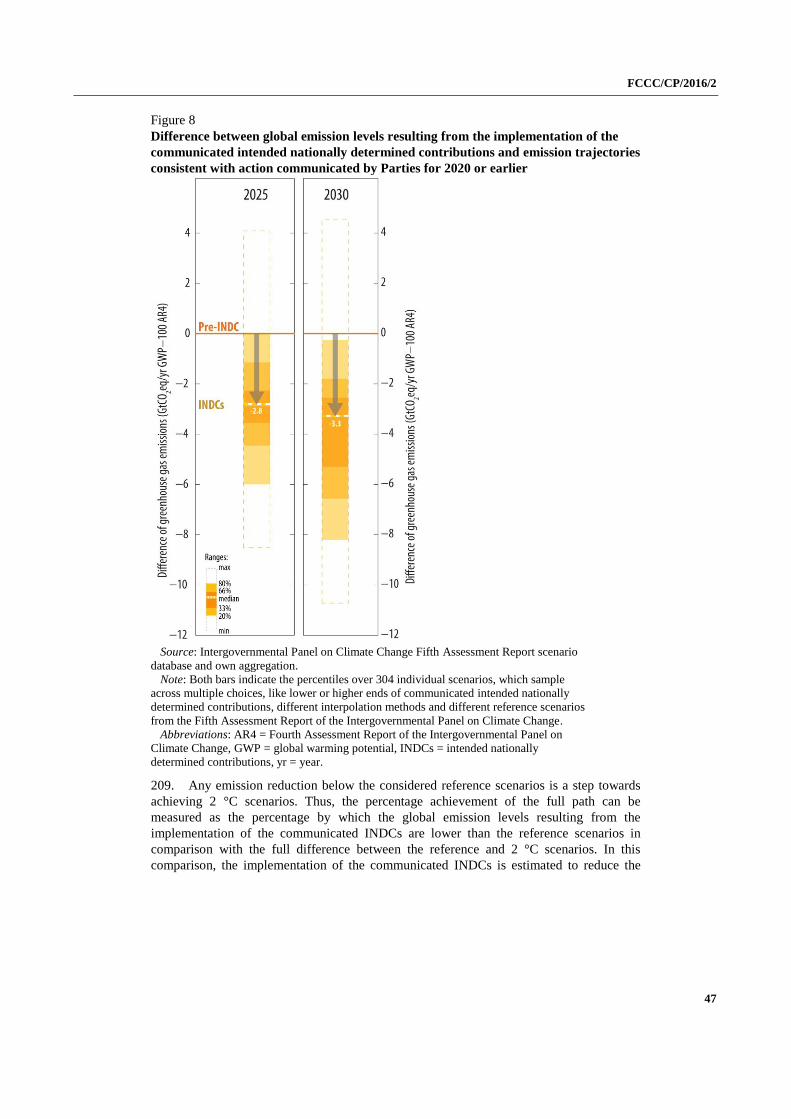
FCCC/CP/2016/2
47
Figure 8
Difference between global emission levels resulting from the implementation of the
communicated intended nationally determined contributions and emission trajectories
consistent with action communicated by Parties for 2020 or earlier
Source: Intergovernmental Panel on Climate Change Fifth Assessment Report scenario
database and own aggregation.
Note: Both bars indicate the percentiles over 304 individual scenarios, which sample
across multiple choices, like lower or higher ends of communicated intended nationally
determined contributions, different interpolation methods and different reference scenarios
from the Fifth Assessment Report of the Intergovernmental Panel on Climate Change.
Abbreviations: AR4 = Fourth Assessment Report of the Intergovernmental Panel on
Climate Change, GWP = global warming potential, INDCs = intended nationally
determined contributions, yr = year.
209. Any emission reduction below the considered reference scenarios is a step towards
achieving 2 °C scenarios. Thus, the percentage achievement of the full path can be
measured as the percentage by which the global emission levels resulting from the
implementation of the communicated INDCs are lower than the reference scenarios in
comparison with the full difference between the reference and 2 °C scenarios. In this
comparison, the implementation of the communicated INDCs is estimated to reduce the
FCCC/CP/2016/2
48
emission difference between pre-INDC trajectories and 2 °C scenarios by 24 (0 to 51) per
cent by 2025 and 18 (1 to 40) per cent by 2030.66
5. Expected aggregate emissions resulting from the implementation of the communicated
intended nationally determined contributions in relation to least-cost 2 °C scenarios
210. Least-cost 2 °C scenarios were taken from the AR5 scenario database.67 The
scenarios that follow a least-cost emission trajectory from 2010 onwards exhibit on average
a slight emission increase until 2015 (see figure 9) and many scenarios in that set could be
considered as approximating a world in which mitigation action is beingenhanced‘today’.
A second set of scenarios implies an enhancement of least-cost global mitigation action by
2020, reaching on average even lower emissions by 2030 compared with in the first set of
scenarios. Taking both groups of 2 °C scenarios together, emissions in 2025 tend to be
between the 2000 and 2010 emission levels, namely at 45.4 (43.0 to 48.9) Gt CO2 eq. By
2030, the emissions under the joint set of scenarios are at 42.5 (36.3 to 43.6) Gt CO2 eq,
close to the emission level in 2000. In comparison, considering only scenarios with an
enhancement of global mitigation action by 2020 implies an emission levels in 2030 of 38.1
(30.3 to 45.0) Gt CO2 eq, which is similar to emissions in 1990.
211. According to the AR5, global cumulative CO2 emissions after 2011, for a likely
chance of keeping global average temperature rise below 2 °C, should be limited to less
than 1,000 Gt CO2.68
212. In general terms, aggregate emissions resulting from the implementation of the
communicated INDCs do not fall within the range of least-cost 2 °C scenarios, as illustrated
in figure 9.
213. The global temperature at the end of this century depends on both emissions up to
2030 and emissions in the post-2030 period. By lowering emissions below those consistent
with pre-INDC trajectories, the INDCs contribute to lowering the expected temperature rise
until and beyond 2100. However, temperature levels by the end of the century strongly
depend on assumptions on socioeconomic drivers, technology development and action
undertaken by Parties beyond the time frames stated in their INDCs (e.g. beyond 2025 and
2030).
66 The provided reductions below reference scenarios, expressed as percentages of the full difference
between reference scenarios and least-cost mitigation scenarios, take both the 2 °C mitigation
scenarios into account that enhance mitigation in 2010 (P1 scenarios) and those that enhance
mitigation in 2020 (P2 scenarios), as shown in figure 9. When taking into account only the 2 °C
mitigation scenarios with an enhancement of global mitigation action by 2020 (P2), the respective
percentages are 37 (0 to 78) per cent by 2025 and 18 (1 to 35) per cent by 2030.
67 Scenarios consistent with limiting global average temperature rise below 2 °C above pre-industrial
levels were taken from the AR5 scenario database. Scenarios that follow a least-cost emission
trajectory from 2010 onwards (so-called P1 scenarios) with a greater than 66 per cent likelihood of
temperature rise staying below 2 °C correspond to a range of 44.3 (38.2–46.6) Gt CO2 eq emissions in
2025 and 42.7 (38.3–43.6) Gt CO2 eq emissions in 2030. Scenarios that follow a least-cost emission
trajectory from 2020 onwards (so-called P2 scenarios) with a greater than 66 per cent likelihood of
temperature rise staying below 2 °C correspond to a range of 49.7 (46.2–51.6) Gt CO2 eq emissions in
2025 and 38.1 (30.3–45.0) Gt CO2 eq emissions in 2030. Given the similar emissions of P1 scenarios
to current emissions in 2015 (see figure 9), and given the similarity between P1 and P2 scenarios by
2030, this document analyses the joint set of P1 and P2 mitigation scenarios in addition to separate
considerations of P1 or P2 only.
68 Thisfigurerelatestoa‘likelychance’.Fora50percentprobabilityofstayingbelow2°C,theAR5
indicates 1,300 Gt CO2 as the amount of cumulative CO2 emissions after 2011.

FCCC/CP/2016/2
49
214. If Parties do not enhance mitigation action until 2030, but assume mitigation action
after 2030 that still aims at staying below a 2 °C temperature increase, scenarios from the
AR5 scenario database indicate that this is possible, but only at substantially higher annual
reduction rates compared with under the least-cost 2 °C scenarios. Thus, it can be
concluded that greater reductions in the aggregate global emissions than those presented in
the INDCs will be required for the period after 2025 and 2030 to hold the temperature rise
below 2 °C above pre-industrial levels.
215. Reductions in GHG emissions compared with 2010 emission levels are on average
3.3 (2.8–3.9) per cent per annum for the 2030–2050 period in mitigation scenarios that
approximately start from global emission levels resulting from the implementation of the
INDCs by 2030. In comparison, under least-cost mitigation scenarios that enhance
mitigation action by 2010 or 2020 annual reductions of only 1.6 (0.8–2.0) per cent in
comparison with 2010 emission levels will suffice for the 2030–2050 period.
216. The assessment of end-of-centurytemperaturesispossibleunder‘what-if’casesfor
the level of emissions beyond 2030. While this document draws a comparison between
emission levels expected to result from the implementation of the INDCs in 2025 and 2030
and various IPCC scenarios, the use of climate models to estimate end-of-century
temperatures resulting from specific post-2030 assumptions (like constant or linear
extensions of emissions or assumed constant climate policies) is considered to be out of its
scope.
217. The following discussion is therefore limited to a comparison of the level of global
emissions resulting from the implementation of the communicated INDCs in 2025 and
2030 and GHG emission levels for the same years implied under the 2 °C scenarios.
218. The discussion provides only a snapshot comparison of the level of emissions in the
individual years. Whether or not current efforts are enough to limit the temperature rise to
2 °C or whether exceeding the cumulative emission budget corresponding to that limit after
2030 can be compensated by net negative emissions can only be evaluated on the basis of
information on action within and beyond the time frame covered by the INDCs, including
all countries, gases and sectors as well as efforts to reduce emissions from 2030 onwards.
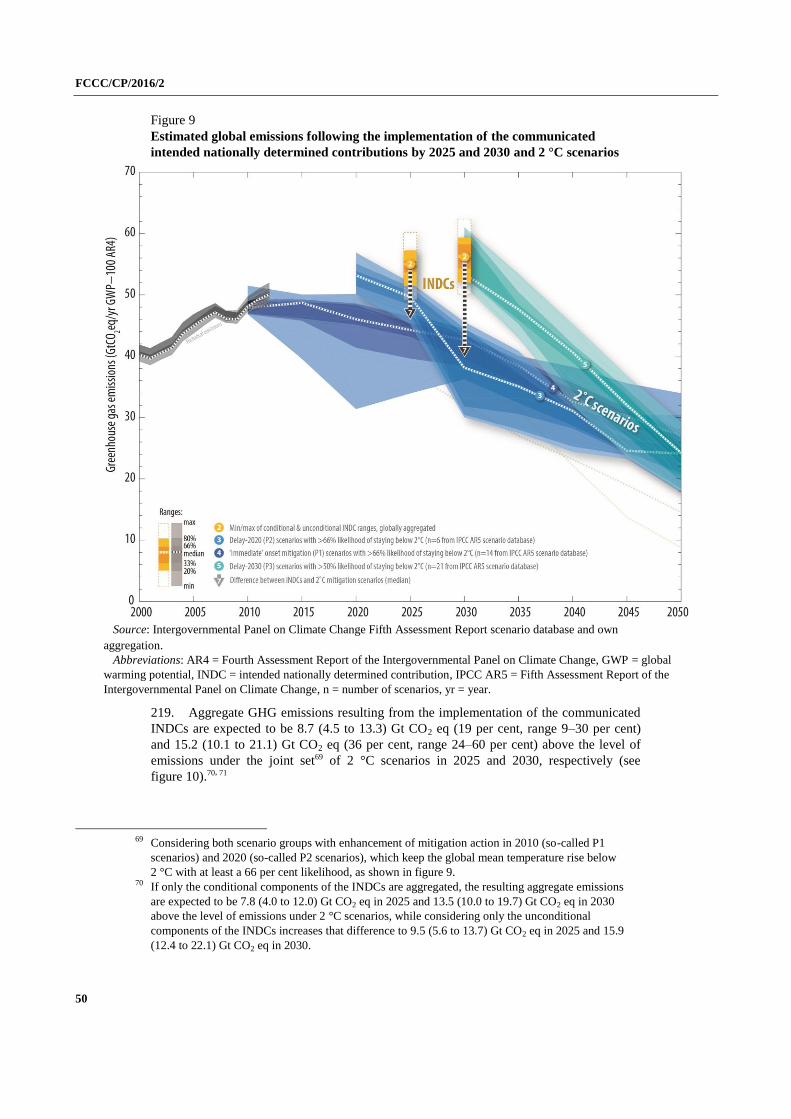
FCCC/CP/2016/2
50
Figure 9
Estimated global emissions following the implementation of the communicated
intended nationally determined contributions by 2025 and 2030 and 2 °C scenarios
Source: Intergovernmental Panel on Climate Change Fifth Assessment Report scenario database and own
aggregation.
Abbreviations: AR4 = Fourth Assessment Report of the Intergovernmental Panel on Climate Change, GWP = global
warming potential, INDC = intended nationally determined contribution, IPCC AR5 = Fifth Assessment Report of the
Intergovernmental Panel on Climate Change, n = number of scenarios, yr = year.
219. Aggregate GHG emissions resulting from the implementation of the communicated
INDCs are expected to be 8.7 (4.5 to 13.3) Gt CO2 eq (19 per cent, range 9–30 per cent)
and 15.2 (10.1 to 21.1) Gt CO2 eq (36 per cent, range 24–60 per cent) above the level of
emissions under the joint set69 of 2 °C scenarios in 2025 and 2030, respectively (see
figure 10).70, 71
69 Considering both scenario groups with enhancement of mitigation action in 2010 (so-called P1
scenarios) and 2020 (so-called P2 scenarios), which keep the global mean temperature rise below
2 °C with at least a 66 per cent likelihood, as shown in figure 9.
70 If only the conditional components of the INDCs are aggregated, the resulting aggregate emissions
are expected to be 7.8 (4.0 to 12.0) Gt CO2 eq in 2025 and 13.5 (10.0 to 19.7) Gt CO2 eq in 2030
above the level of emissions under 2 °C scenarios, while considering only the unconditional
components of the INDCs increases that difference to 9.5 (5.6 to 13.7) Gt CO2 eq in 2025 and 15.9
(12.4 to 22.1) Gt CO2 eq in 2030.
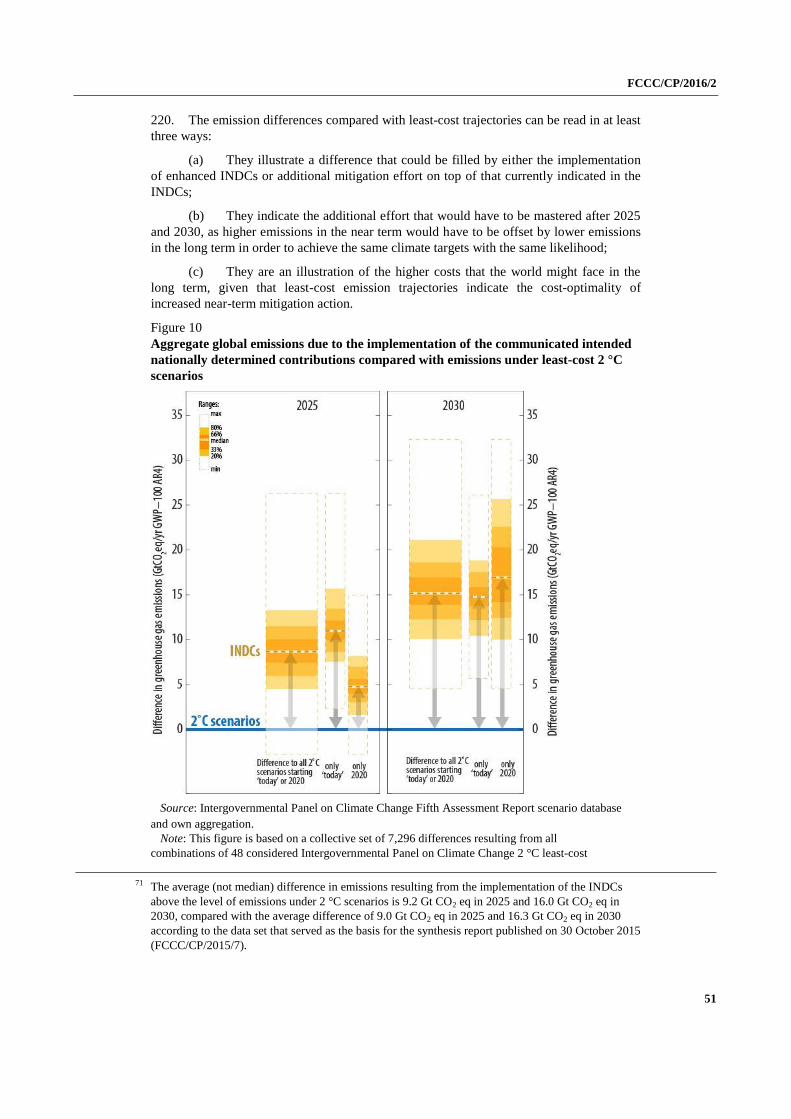
FCCC/CP/2016/2
51
220. The emission differences compared with least-cost trajectories can be read in at least
three ways:
(a) They illustrate a difference that could be filled by either the implementation
of enhanced INDCs or additional mitigation effort on top of that currently indicated in the
INDCs;
(b) They indicate the additional effort that would have to be mastered after 2025
and 2030, as higher emissions in the near term would have to be offset by lower emissions
in the long term in order to achieve the same climate targets with the same likelihood;
(c) They are an illustration of the higher costs that the world might face in the
long term, given that least-cost emission trajectories indicate the cost-optimality of
increased near-term mitigation action.
Figure 10
Aggregate global emissions due to the implementation of the communicated intended
nationally determined contributions compared with emissions under least-cost 2 °C
scenarios
Source: Intergovernmental Panel on Climate Change Fifth Assessment Report scenario database
and own aggregation.
Note: This figure is based on a collective set of 7,296 differences resulting from all
combinations of 48 considered Intergovernmental Panel on Climate Change 2 °C least-cost
71 The average (not median) difference in emissions resulting from the implementation of the INDCs
above the level of emissions under 2 °C scenarios is 9.2 Gt CO2 eq in 2025 and 16.0 Gt CO2 eq in
2030, compared with the average difference of 9.0 Gt CO2 eq in 2025 and 16.3 Gt CO2 eq in 2030
according to the data set that served as the basis for the synthesis report published on 30 October 2015
(FCCC/CP/2015/7).
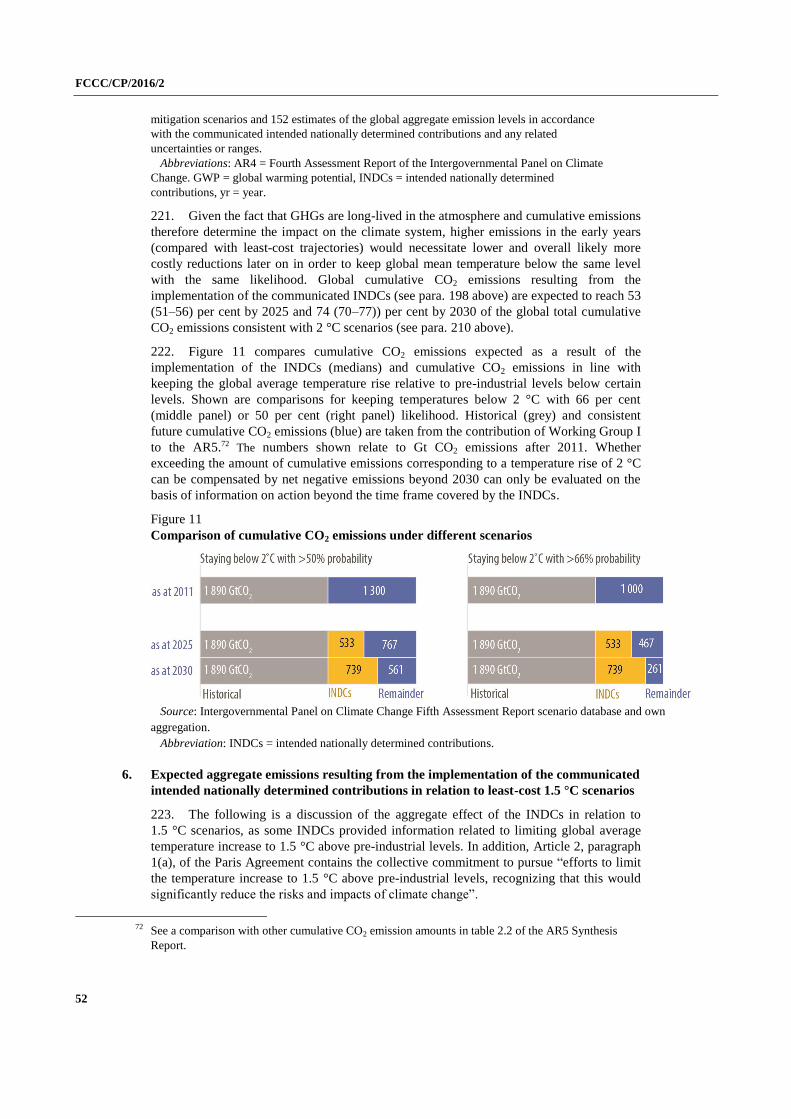
FCCC/CP/2016/2
52
mitigation scenarios and 152 estimates of the global aggregate emission levels in accordance
with the communicated intended nationally determined contributions and any related
uncertainties or ranges.
Abbreviations: AR4 = Fourth Assessment Report of the Intergovernmental Panel on Climate
Change. GWP = global warming potential, INDCs = intended nationally determined
contributions, yr = year.
221. Given the fact that GHGs are long-lived in the atmosphere and cumulative emissions
therefore determine the impact on the climate system, higher emissions in the early years
(compared with least-cost trajectories) would necessitate lower and overall likely more
costly reductions later on in order to keep global mean temperature below the same level
with the same likelihood. Global cumulative CO2 emissions resulting from the
implementation of the communicated INDCs (see para. 198 above) are expected to reach 53
(51–56) per cent by 2025 and 74 (70–77)) per cent by 2030 of the global total cumulative
CO2 emissions consistent with 2 °C scenarios (see para. 210 above).
222. Figure 11 compares cumulative CO2 emissions expected as a result of the
implementation of the INDCs (medians) and cumulative CO2 emissions in line with
keeping the global average temperature rise relative to pre-industrial levels below certain
levels. Shown are comparisons for keeping temperatures below 2 °C with 66 per cent
(middle panel) or 50 per cent (right panel) likelihood. Historical (grey) and consistent
future cumulative CO2 emissions (blue) are taken from the contribution of Working Group I
to the AR5.72 The numbers shown relate to Gt CO2 emissions after 2011. Whether
exceeding the amount of cumulative emissions corresponding to a temperature rise of 2 °C
can be compensated by net negative emissions beyond 2030 can only be evaluated on the
basis of information on action beyond the time frame covered by the INDCs.
Figure 11
Comparison of cumulative CO2 emissions under different scenarios
Source: Intergovernmental Panel on Climate Change Fifth Assessment Report scenario database and own
aggregation.
Abbreviation: INDCs = intended nationally determined contributions.
6. Expected aggregate emissions resulting from the implementation of the communicated
intended nationally determined contributions in relation to least-cost 1.5 °C scenarios
223. The following is a discussion of the aggregate effect of the INDCs in relation to
1.5 °C scenarios, as some INDCs provided information related to limiting global average
temperature increase to 1.5 °C above pre-industrial levels. In addition, Article 2, paragraph
1(a), of the Paris Agreement contains the collective commitment to pursue “efforts to limit
the temperature increase to 1.5 °C above pre-industrial levels, recognizing that this would
significantlyreducetherisksandimpactsofclimatechange”.
72 See a comparison with other cumulative CO2 emission amounts in table 2.2 of the AR5 Synthesis
Report.
FCCC/CP/2016/2
53
224. Scenarios used in this document are taken from original scientific literature and not
from an IPCC database, given that the AR5 database was predominantly compiled from
model intercomparison exercises that did not envisage a 1.5 °C temperature goal. There are
a large number of emission scenarios in the scientific literature of limiting or returning
global temperature increase to below 1.5 °C by 2100 with at least a 50 per cent likelihood.73
Unlike 2 °C scenarios, there are no scenarios of keeping warming below the 1.5 °C goal
with at least a 66 per cent likelihood. It should be noted, however, that this discussion
should be reviewed in the light of the invitation for the IPCC to provide a special report in
2018 on the impacts of global warming of 1.5 °C above pre-industrial levels and related
global GHG emission pathways.
225. Under 1.5 °C scenarios, faster and deeper emission reductions over the course of the
century are required compared with 2 °C scenarios. They imply an emission level of 14.2
Gt CO2 eq (median) in 2050, compared with 25.5 Gt CO2 eq in 2050 for 2 °C scenarios.
They also envisage net zero global GHG emissions around 2075 (2070 to 2085) compared
with around 2095 (2085 to beyond 2100) for 2 °C scenarios.
226. As is the case with 2 °C scenarios, this discussion provides only a snapshot
comparison of the level of emissions under 1.5 °C scenarios in the years 2025 and 2030.
Whether or not enhanced efforts until 2030 are enough to limit warming to a 1.5 °C
temperature rise or whether exceeding the 1.5 °C cumulative emission budget can be
compensated by net negative emissions after 2030 can only be evaluated on the basis of
information on action beyond the time frame covered by the INDCs, including all
countries, gases and sectors.
227. In the scenarios used for this document in which the 1.5 °C goal is reached by 2100
with at least 50 per cent likelihood, global emission reductions start between 2010 and
2020.74 The emission levels in 2025 and 2030 under those scenarios are 38.4 (34.5 to 42.7)
Gt CO2 eq and 33.9 (29.6 to 37.3) Gt CO2 eq, respectively. This is 7.0 and 8.6 Gt CO2 eq
lower in 2025 and 2030, respectively, than the emission levels under corresponding 2 °C
scenarios.75 Unlike 2 °C scenarios, there are currently no integrated assessment model
scenarios in the scientific literature that delay until 2030 the start of global emission
reductions that limit the temperature rise to 1.5 °C with a 50 per cent likelihood.
228. Aggregate GHG emissions resulting from the implementation of the communicated
INDCs are expected to be 16.1 (10.7 to 20.6) Gt CO2 eq in 2025 and 22.6 (17.8 to 27.5) Gt
CO2 eq in 2030 above the level of emissions under the 1.5 °C scenarios in which global
73 Luderer G, Pietzcker RC, Bertram C, Kriegler E, Meinshausen M, Edenhofer O. 2013. Economic
mitigation challenges: how further delay closes the door for achieving climate targets. Environmental
Research Letters 8:034033); Rogelj J, McCollum DL, O'Neill BC and Riahi K. 2013. 2020 emissions
levels required to limit warming to below 2°C. Nature Climate Change. 3(4): pp.405–412; Rogelj J,
McCollum DL, Reisinger A, Meinshausen M and Riahi K. 2013. Probabilistic cost estimates for
climate change mitigation. Nature. 493(7430): pp.79–83; and Rogelj J, Luderer G, Pietzcker RC,
Kriegler E, Schaeffer M, Krey V, Riahi K. 2015. Energy system transformations for limiting end-of-
century warming to below 1.5 °C. Nature Climate Change. 5(6): pp.519–527; and the online technical
annex (see footnote 1).
74 Consistent with the treatment of 2 °C scenarios, the analysis considers both scenario groups with
enhancement of mitigation action in 2010 (so-called P1 scenarios) and 2020 (so-called P2 scenarios),
which limit the global mean temperature rise to below 1.5 °C by 2100 with at least a 50 per cent
likelihood.
75 For P1 scenarios, the emission level in 2030 is 32.0 (29.0 to 36.0) Gt CO2 eq, which is around 10.7 Gt
CO2 eq lower than the emission level in 2030 under corresponding 2 °C scenarios. For P2 scenarios,
the 2030 emission level corresponding to 1.5 °C is 39.5 (37.4 to 41.2) Gt CO2 eq, which is
approximately the same (1.4 Gt CO2 eq higher) as the emission level in 2030 under corresponding
2 °C scenarios.
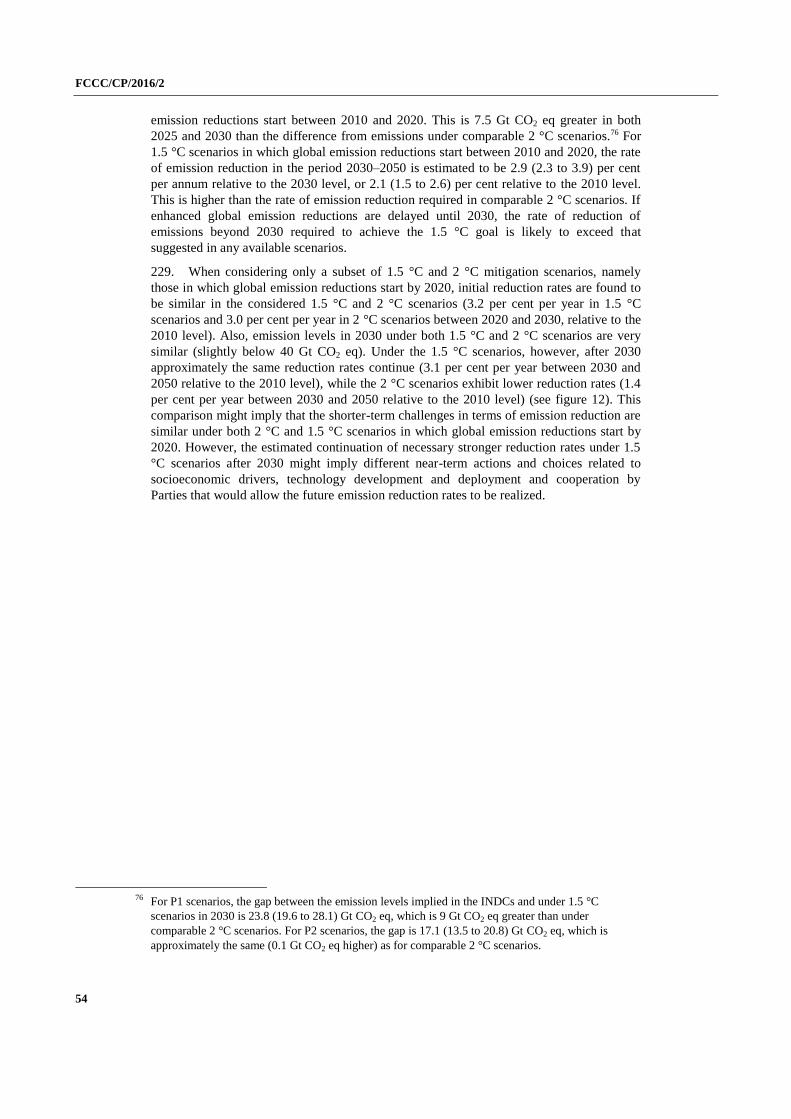
FCCC/CP/2016/2
54
emission reductions start between 2010 and 2020. This is 7.5 Gt CO2 eq greater in both
2025 and 2030 than the difference from emissions under comparable 2 °C scenarios.76 For
1.5 °C scenarios in which global emission reductions start between 2010 and 2020, the rate
of emission reduction in the period 2030–2050 is estimated to be 2.9 (2.3 to 3.9) per cent
per annum relative to the 2030 level, or 2.1 (1.5 to 2.6) per cent relative to the 2010 level.
This is higher than the rate of emission reduction required in comparable 2 °C scenarios. If
enhanced global emission reductions are delayed until 2030, the rate of reduction of
emissions beyond 2030 required to achieve the 1.5 °C goal is likely to exceed that
suggested in any available scenarios.
229. When considering only a subset of 1.5 °C and 2 °C mitigation scenarios, namely
those in which global emission reductions start by 2020, initial reduction rates are found to
be similar in the considered 1.5 °C and 2 °C scenarios (3.2 per cent per year in 1.5 °C
scenarios and 3.0 per cent per year in 2 °C scenarios between 2020 and 2030, relative to the
2010 level). Also, emission levels in 2030 under both 1.5 °C and 2 °C scenarios are very
similar (slightly below 40 Gt CO2 eq). Under the 1.5 °C scenarios, however, after 2030
approximately the same reduction rates continue (3.1 per cent per year between 2030 and
2050 relative to the 2010 level), while the 2 °C scenarios exhibit lower reduction rates (1.4
per cent per year between 2030 and 2050 relative to the 2010 level) (see figure 12). This
comparison might imply that the shorter-term challenges in terms of emission reduction are
similar under both 2 °C and 1.5 °C scenarios in which global emission reductions start by
2020. However, the estimated continuation of necessary stronger reduction rates under 1.5
°C scenarios after 2030 might imply different near-term actions and choices related to
socioeconomic drivers, technology development and deployment and cooperation by
Parties that would allow the future emission reduction rates to be realized.
76 For P1 scenarios, the gap between the emission levels implied in the INDCs and under 1.5 °C
scenarios in 2030 is 23.8 (19.6 to 28.1) Gt CO2 eq, which is 9 Gt CO2 eq greater than under
comparable 2 °C scenarios. For P2 scenarios, the gap is 17.1 (13.5 to 20.8) Gt CO2 eq, which is
approximately the same (0.1 Gt CO2 eq higher) as for comparable 2 °C scenarios.
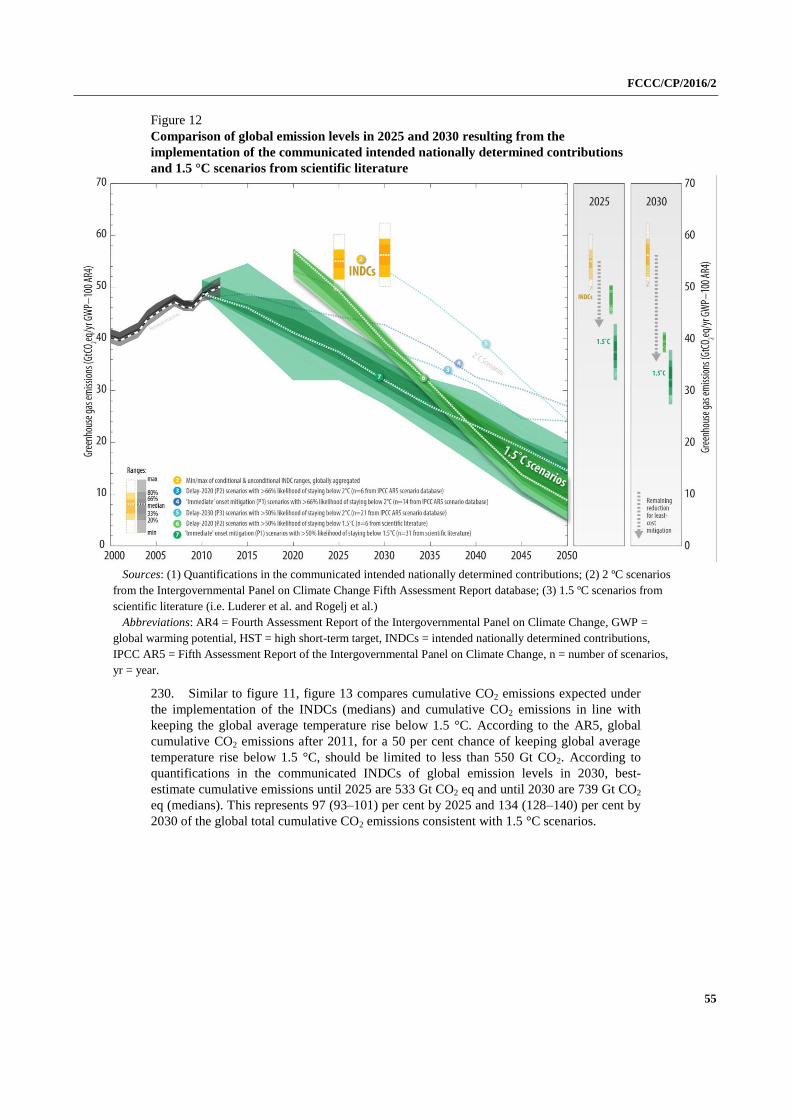
FCCC/CP/2016/2
55
Figure 12
Comparison of global emission levels in 2025 and 2030 resulting from the
implementation of the communicated intended nationally determined contributions
and 1.5 °C scenarios from scientific literature
Sources: (1) Quantifications in the communicated intended nationally determined contributions; (2) 2 ºC scenarios
from the Intergovernmental Panel on Climate Change Fifth Assessment Report database; (3) 1.5 ºC scenarios from
scientific literature (i.e. Luderer et al. and Rogelj et al.)
Abbreviations: AR4 = Fourth Assessment Report of the Intergovernmental Panel on Climate Change, GWP =
global warming potential, HST = high short-term target, INDCs = intended nationally determined contributions,
IPCC AR5 = Fifth Assessment Report of the Intergovernmental Panel on Climate Change, n = number of scenarios,
yr = year.
230. Similar to figure 11, figure 13 compares cumulative CO2 emissions expected under
the implementation of the INDCs (medians) and cumulative CO2 emissions in line with
keeping the global average temperature rise below 1.5 °C. According to the AR5, global
cumulative CO2 emissions after 2011, for a 50 per cent chance of keeping global average
temperature rise below 1.5 °C, should be limited to less than 550 Gt CO2. According to
quantifications in the communicated INDCs of global emission levels in 2030, best-
estimate cumulative emissions until 2025 are 533 Gt CO2 eq and until 2030 are 739 Gt CO2
eq (medians). This represents 97 (93–101) per cent by 2025 and 134 (128–140) per cent by
2030 of the global total cumulative CO2 emissions consistent with 1.5 °C scenarios.
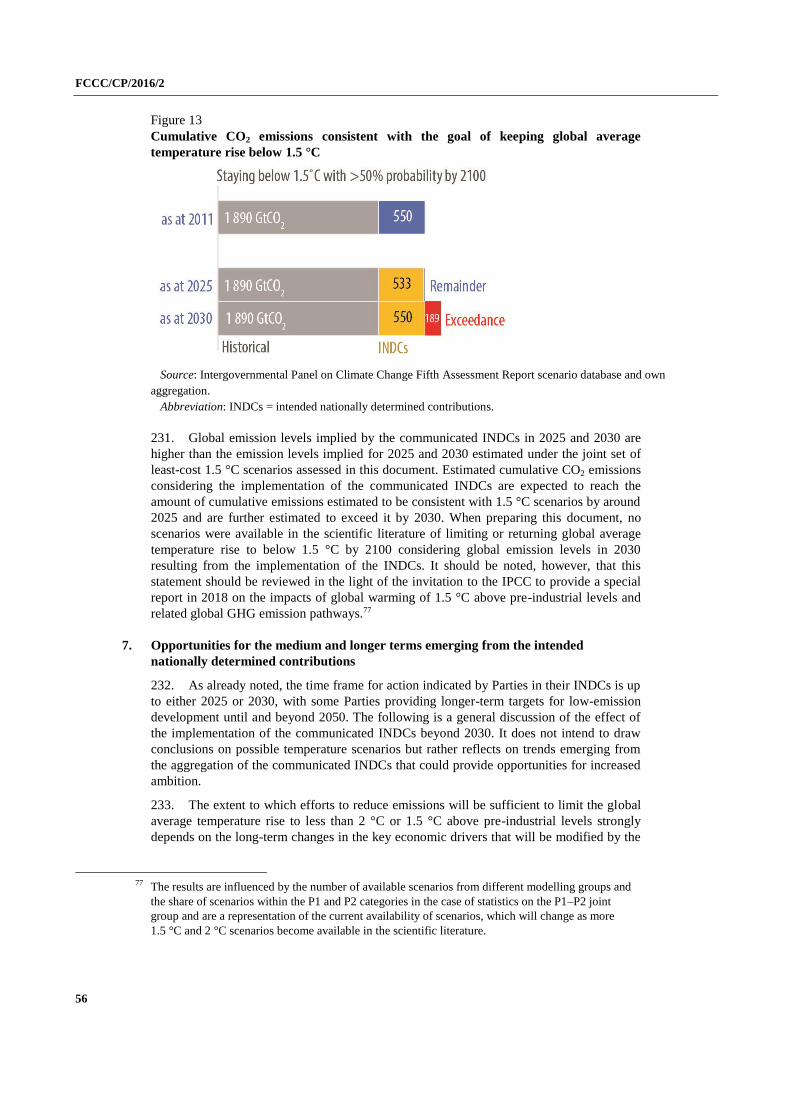
FCCC/CP/2016/2
56
Figure 13
Cumulative CO2 emissions consistent with the goal of keeping global average
temperature rise below 1.5 °C
Source: Intergovernmental Panel on Climate Change Fifth Assessment Report scenario database and own
aggregation.
Abbreviation: INDCs = intended nationally determined contributions.
231. Global emission levels implied by the communicated INDCs in 2025 and 2030 are
higher than the emission levels implied for 2025 and 2030 estimated under the joint set of
least-cost 1.5 °C scenarios assessed in this document. Estimated cumulative CO2 emissions
considering the implementation of the communicated INDCs are expected to reach the
amount of cumulative emissions estimated to be consistent with 1.5 °C scenarios by around
2025 and are further estimated to exceed it by 2030. When preparing this document, no
scenarios were available in the scientific literature of limiting or returning global average
temperature rise to below 1.5 °C by 2100 considering global emission levels in 2030
resulting from the implementation of the INDCs. It should be noted, however, that this
statement should be reviewed in the light of the invitation to the IPCC to provide a special
report in 2018 on the impacts of global warming of 1.5 °C above pre-industrial levels and
related global GHG emission pathways.77
7. Opportunities for the medium and longer terms emerging from the intended
nationally determined contributions
232. As already noted, the time frame for action indicated by Parties in their INDCs is up
to either 2025 or 2030, with some Parties providing longer-term targets for low-emission
development until and beyond 2050. The following is a general discussion of the effect of
the implementation of the communicated INDCs beyond 2030. It does not intend to draw
conclusions on possible temperature scenarios but rather reflects on trends emerging from
the aggregation of the communicated INDCs that could provide opportunities for increased
ambition.
233. The extent to which efforts to reduce emissions will be sufficient to limit the global
average temperature rise to less than 2 °C or 1.5 °C above pre-industrial levels strongly
depends on the long-term changes in the key economic drivers that will be modified by the
77 The results are influenced by the number of available scenarios from different modelling groups and
the share of scenarios within the P1 and P2 categories in the case of statistics on the P1–P2 joint
group and are a representation of the current availability of scenarios, which will change as more
1.5 °C and 2 °C scenarios become available in the scientific literature.
FCCC/CP/2016/2
57
implementation of the INDCs already and subsequently communicated, as well as on the
determination of Parties to increase their level of ambition before and after 2030.
Participation
234. The INDCs indicate a significant increase in the number of countries taking
climate action, which is often of national character and covers multiple GHGs. Parties
responded actively to the invitation from the COP for them to communicate their INDCs.
At the time of the adoption of the Cancun Agreements (decision 1/CP.16), 108 Parties
submitted their quantified economy-wide emission reduction targets and nationally
appropriate mitigation actions. In comparison, by 4 April 2016, 189 Parties had submitted
their INDCs.
235. A large number of Parties communicated INDCs that are national in scope, using a
variety of ways to express them. Of particular importance is the increase in the number of
Parties that have moved from project-, programme- or sector-based actions towards
economy-wide policies and objectives. Whereas in the pre-2020 period a total of 61 Parties
presented absolute, BAU, intensity or peaking year based quantified targets, in their INDCs
155 Parties communicated such targets.
236. Most Parties provided information to facilitate the clarity, transparency and
understanding of their INDCs, with many following the guidance contained in decision
1/CP.20, paragraph 14. This enabled many Parties to be explicit on the technical aspects of
their contributions, such as scope, coverage, assumptions and methodologies. While there
are gaps and issues of consistency and data quality, this information provided a basis for the
evaluation contained in this document and constitutes a significant improvement compared
with the sharing of information on the pre-2020 period, which occurred in many cases
informally through the work programmes under the subsidiary bodies.
237. The high level of response of Parties as well as the presence of information
communicated as part of the INDCs point towards an increase in national capacity to plan,
develop and communicate mitigation actions in the form of targets, strategies and plans.
The identified areas where data quality, transparency and completeness could be further
improved indicate, however, that further efforts are needed to increase the capacity of many
countries, including through enhanced cooperation, support and/or an enabling institutional
environment.
Policies and institutions
238. The INDCs show an increasing trend for introducing national policies and
related instruments for low-emission and climate-resilient development. One key driver
for understanding the aggregate effect of the implementation of the INDCs in the longer
term is the induced institutional, legislative and policy change at the national level. All
Parties that communicated INDCs have already taken steps to develop a strong basis at the
domestic level for the implementation of their INDCs and are planning on building on those
efforts going forward.
239. The information communicated by Parties related to planning processes (see chapter
II.D.6 above) shows that a large number of the INDCs were prepared by Parties on the
basis of existing institutions, policies and legislative frameworks, with many being already
backed up by national law. This information also suggests the need for strengthening and
further developing national institutional arrangements, legislation, policies and measures
for addressing climate change in the future.
240. In their INDCs, several Parties communicated that their preparation and finalization
were underpinned by a number of national consultation and interdisciplinary coordination
processes, many of which were established solely for the INDC preparation process. Such
stakeholder engagement processes generally aim at fostering the understanding of the
FCCC/CP/2016/2
58
INDCs on a political and societal level in order to ensure alignment with development
objectives and enhance broad support across relevant stakeholder groups.
241. Information provided by Parties highlights the increasing prominence of climate
change on national political agendas, where related action is mainstreamed in national and
sectoral development priorities. At the same time, several Parties have made efforts to
ensure that the private sector, civil society and other non-governmental actors recognize the
importance of, and provide support for, national action to combat climate change.
242. National political and institutional processes have been partly influenced by the
invitation for Parties to communicate their INDCs. While INDCs may have served as a
catalyst for the consolidation and enhancement of climate-related policies in a few
countries, in many it has represented an incentive to initiate them. In general, it can be
argued that the realities of policy development and social acceptance related to the
preparation of the INDCs provide the grounds for increased action in the future.
Cooperation and support
243. The INDCs show the increasing interest of Parties in cooperating to achieve
climate change goals and raise ambition in the future. Several Parties referred to the
enhanced cooperation required for the implementation of their INDCs, as well as it being an
important driver of future ambition. They also referred to the need for enhanced
cooperation to enable Parties to enhance domestic actions related to climate change and to
address related challenges collectively in the future. Several countries may have to
overcome a range of economic, technological and capacity-related barriers to achieve the
objectives of their INDCs.
244. Some Parties indicated the general role of cooperation related to financial,
technology transfer and capacity-building support for implementing domestic measures to
achieve the objectives of their INDCs, while other Parties referred to specific areas,
including sustainable energy, low-carbon agriculture, biofuels, forest monitoring systems,
restoration and reforestation activities and sustainable transport.
245. The information communicated by Parties in their INDCs indicates a move towards
enhanced international cooperation, including South–South cooperation, in order to drive
the implementation of the INDCs as well as to raise the ambition of future action.
Cooperation and partnerships are increasingly taking place among various stakeholders,
including subnational governmental organizations, private-sector organizations, research
centres, academia, technology funds and financing institutions.
246. Parties indicated in their INDCs the role that the bodies and arrangements under the
Convention could play in fostering cooperation and support, including the Technology
Mechanism, the Financial Mechanism, the Climate Technology Centre and Network, the
GEF and the GCF.
National circumstances and ambition
247. All Parties have raised the ambition of their climate action in relation to efforts
communicated for the pre-2020 period. Many Parties referred to the goal of limiting
global average temperature rise below 2 °C or 1.5 °C above pre-industrial levels as a
benchmark for national and aggregate ambition. They stressed the clarity provided by this
goal to guide national and international efforts. Many Parties expressed their determination
to achieve the goal and acknowledged that this would only be possible through collective
efforts, including enhanced cooperation.
248. As previously noted, while significant progress has been made with regard to the
pre-2020 period, global aggregate emission levels in 2025 and 2030 resulting from the
implementation of the communicated INDCs do not fall within the scope of 2 °C or 1.5 °C
FCCC/CP/2016/2
59
scenarios. It has also already been stressed that the extent to which efforts to reduce
emissions linked to the INDCs are sufficient to meet the temperature goal strongly depends
on the long-term changes in the key economic drivers that will be induced by the
implementation of the communicated INDCs, as well as on the determination of Parties to
increase their level of ambition before and after 2030.
249. While it is beyond the scope of this document to discuss efforts beyond 2025 and
2030 and changes and factors mentioned in paragraph 228 above, the communicated
INDCs signal the increasing determination of Parties to take action to reduce emissions and
increase the resilience of their economies. National determination has enabled Parties to
shape their efforts in line with their circumstances, with many already recognizing and
realizing related socioeconomic co-benefits. Yet the need for sustained and longer-term
action requires not only maintaining those trends after 2025 or 2030 but also some degree
of acceleration and scaling up.
250. As noted in paragraph 163 above, most Parties provided information on how they
consider their INDCs to be fair and ambitious and how they contribute towards achieving
the objective of the Convention. The information contained in the communicated INDCs
suggests that there is strong recognition among Parties of the need for enhanced global
action in the context of the objective of the Convention to address climate change and the
commitment to doing so through a multilateral response with all countries contributing their
fair share. The understanding of what is considered fair and ambitious, however, varies
depending on the particular national circumstances (see chapter II.D.7 above).
251. Related narratives convey the vision that each country has of its own efforts. Such
information could potentially lead to a higher degree of understanding of how national
circumstances and other factors determine the efforts of each country. At the same time, the
narratives reveal the need to balance a wide variety of national circumstances with the
information provided by science on the efforts required to keep global average temperature
rise below any given level. This question should be addressed as Parties prepare further
efforts beyond current time frames in the context of the Paris Agreement.
F. Adaptation component of the communicated intended nationally
determined contributions
1. Background information
252. By 2 April 2016, 137 Parties, including 46 LDC Parties, had included an adaptation
component in their INDCs. The secretariat received adaptation components from 54
African States, 42 Asia-Pacific States, 30 Latin American and Caribbean States, 7 Eastern
European States and 2 Western European and other States. Some of them indicated that
adaptation is their main priority in addressing climate change.
253. This chapter provides a concise overview of the adaptation component of the INDCs
communicated by Parties in accordance with decision 1/CP.20, paragraph 12. It focuses on
the elements of the adaptation component that featured in most INDCs:
(a) National circumstances informing the adaptation component;
(b) Long-term goals and/or vision guiding the adaptation component;
(c) Impact and vulnerability assessments;
(d) Legal and regulatory frameworks, strategies, programmes and plans that
provide the basis for, or have informed, adaptation actions;
(e) Measures or actions planned or under implementation for different time
frames, in particular for the shorter (2015–2020) and longer (2020–2030) terms;
FCCC/CP/2016/2
60
(f) Costs, losses and/or damage due to climate impacts;
(g) Means of implementation;
(h) Monitoring and evaluation;
(i) Synergies between adaptation and mitigation.
254. The secretariat has synthesized the information submitted by Parties on each element
with a focus on areas of information communicated by a critical mass of Parties. Additional
examples and specific aspects of the adaptation component are highlighted throughout. For
each information element, a number of emerging trends have been identified. It was not
possible at this point to evaluate the aggregate effect of the adaptation components given
the methodological uncertainties associated with such an evaluation.
2. Synthesis of the information communicated by Parties in the adaptation component of
their intended nationally determined contributions
National circumstances informing the adaptation component
255. Most Parties provided information on their national circumstances, in particular on
aspects that are particularly important for the adaptation component, including geography,
population, political context and economic indicators. A few Parties stated that their INDC
is subject to revision, taking into account future changes in their national circumstances.
256. Several Parties described their overall geographical characteristics, including the
overall location and geography of the country as well as geographical factors that increase
vulnerability, such as low elevation, small land area, insularity, landlocked nature and
geographical discontinuity. In addition, Parties referred to key climatic zones, length of
coastline, deserts, mountain chains and levels of forest coverage and biodiversity.
Descriptions of the overall climate of the country were included in some INDCs, with
references to indicators such as mean temperature, mean precipitation, arid- or semi-arid
character and level of climate variability. Some Parties provided more specific parameters,
such as estimated amount of land available for agriculture and/or livestock, overall land
quality, estimated amount of available groundwater, proportion of protected land and rate
of deforestation. One Party highlighted that the country’swide ranging climate creates a
wide range of climate risks. Specific environmental developments were highlighted,
including the disappearance of major water bodies, high deforestation rate and the rapid
spread of desertification in past decades.
257. Some Parties described their population dynamics and considered how they relate to
climate change and adaptation, referring to, for example, high population density or growth,
high proportion of youth in the population and the need to adapt under the assumption that
the population is likely to be significantly higher in 2030, as well as the proportion of the
population living in rural and urban areas. In this context, a number of Parties reflected on
how their national demographic realities create conditions for additional vulnerabilities.
Others highlighted the challenges associated with concentrations of population or
infrastructure in vulnerable areas such as low-lying coasts.
258. Most Parties described their overall economic situation and associated development
challenges, with many using key economic parameters such as GDP, GDP growth and the
Gini coefficient or their position in the Human Development Index to indicate their overall
development status. They described their main national economic activities as well as the
number of people engaged in those activities. Some drew attention to the multiple
challenges of pursuing economic development and undertaking climate action under the
limitations posed by their economic situation. Such limitations include dependence on
climate-sensitive sectors such as agriculture and tourism. Dependence on exports of
hydrocarbons or other resources or dependence on imported fuels, all of which create
FCCC/CP/2016/2
61
exposure to fluctuations in global energy prices and demand, were referred to by a few
Parties. Others referred to economic weaknesses due to, for example, the narrow focus of
their economy, dependence on international aid or the location of economic activity and/or
infrastructure in vulnerable areas. In addition, a few Parties drew attention to overall
economic limitations created by economic sanctions, embargoes and restrictive trade
regimes. One Party highlighted that the illegal export of charcoal from the country drives
deforestation and land degradation and damages its pastoral economy.
259. In addition, Parties drew attention to various specific development indicators,
including the proportion of people employed in vulnerable sectors, the proportion of people
with access to electricity, sanitation, drinking water and basic services and health care, the
number of people living in poverty or with lack of food security and the proportion of
infants suffering malnutrition. Poor infrastructure and institutional capacity were
highlighted as limiting factors.
260. Some Parties drew attention to successes and improvements in their development. A
few highlighted that they have improved their development parameters, including lower
infant mortality and unemployment, or have achieved, for example, the United Nations
Millennium Development Goals.
261. Political stability was highlighted by some Parties. While a few Parties emphasized
that they have recently stabilized a political crisis and are now focusing on development,
others highlighted the priority of stabilizing an ongoing conflict, ensuring national security
and territorial integrity, and providing humanitarian assistance to people in view of regional
conflicts and/or the additional pressures brought on by absorbing large numbers of
refugees. One Party highlighted that civil conflict has interrupted many development
projects in the country.
262. Finally, Parties highlighted some key development setbacks, such as the Ebola
outbreak in West Africa and major hurricanes in the Caribbean, illustrating how
development gains can be fragile in the light of climate change impacts.
Long-term goals and/or vision guiding the adaptation component
263. Most Parties defined a long-term goal or vision to guide the adaptation component
of their INDC. Their long-term goals or visions are aspirational, qualitative, quantitative or
a combination of the three. Some goals and visions are enshrined in the constitution of a
Party, while others are contained in national laws, strategies and plans.
264. Several goals and visions are climate-specific, but all of them are closely intertwined
with development objectives such as poverty eradication, economic development or
improvement of living standards, environmental sustainability, security and human rights.
A few Parties referred to the United Nations Millennium Development Goals and
subsequent Sustainable Development Goals in defining their national goals.
265. Some Parties articulated their vision in climate- or adaptation-specific terms, for
example as the objective of mainstreaming adaptation into development or into planning for
critical sectors. In sharing their long-term goals or visions, Parties emphasized specific
elements, such as the need to reduce losses, the participation of all segments or sectors of
the population and the consideration of related issues, such as the welfare of women,
children, the elderly, people with disabilities and environmental refugees.
266. Others expressed their vision in broader and non-climate or adaptation-specific
terms, such as a commitment to safeguarding security, territory and population, human
rights and/or nature and biodiversity, as well as advancing development goals in the light of
projected climate impacts. Several Parties, in particular the LDCs, mentioned that they
aspire to become an emerging country with a middle-income economy by 2030. Others
referred to their aspiration to diversify their economy. Another example of a broader
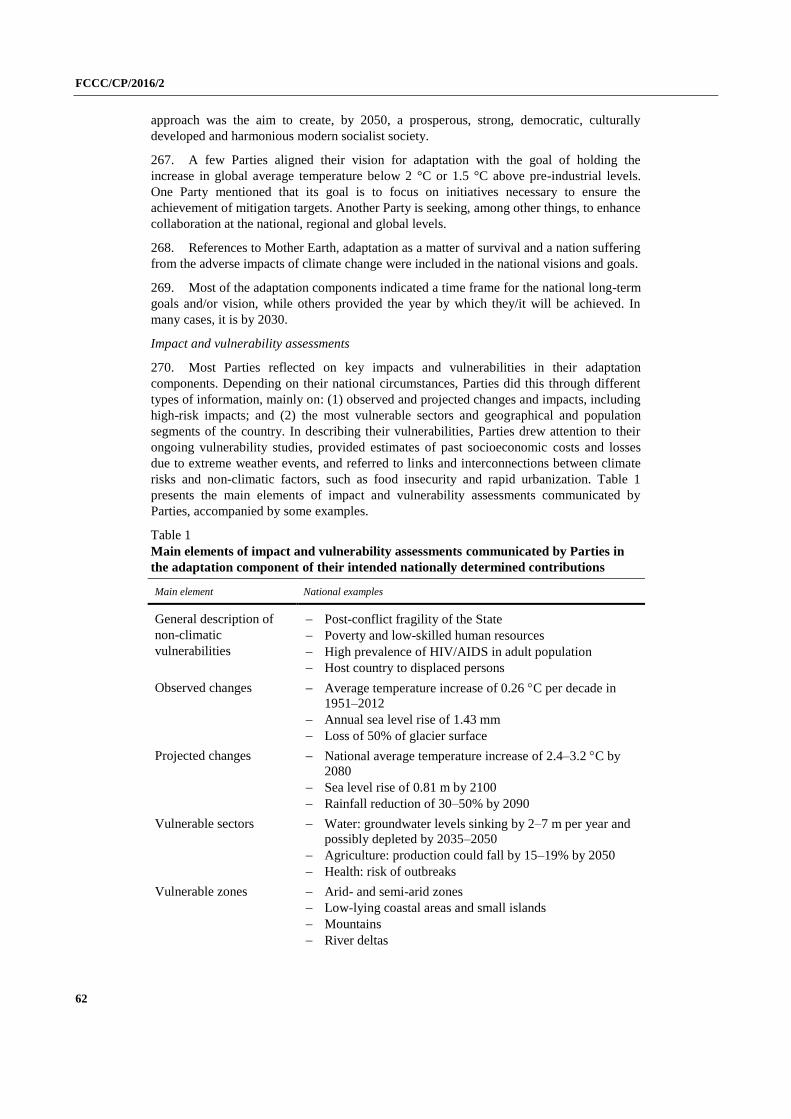
FCCC/CP/2016/2
62
approach was the aim to create, by 2050, a prosperous, strong, democratic, culturally
developed and harmonious modern socialist society.
267. A few Parties aligned their vision for adaptation with the goal of holding the
increase in global average temperature below 2 °C or 1.5 °C above pre-industrial levels.
One Party mentioned that its goal is to focus on initiatives necessary to ensure the
achievement of mitigation targets. Another Party is seeking, among other things, to enhance
collaboration at the national, regional and global levels.
268. References to Mother Earth, adaptation as a matter of survival and a nation suffering
from the adverse impacts of climate change were included in the national visions and goals.
269. Most of the adaptation components indicated a time frame for the national long-term
goals and/or vision, while others provided the year by which they/it will be achieved. In
many cases, it is by 2030.
Impact and vulnerability assessments
270. Most Parties reflected on key impacts and vulnerabilities in their adaptation
components. Depending on their national circumstances, Parties did this through different
types of information, mainly on: (1) observed and projected changes and impacts, including
high-risk impacts; and (2) the most vulnerable sectors and geographical and population
segments of the country. In describing their vulnerabilities, Parties drew attention to their
ongoing vulnerability studies, provided estimates of past socioeconomic costs and losses
due to extreme weather events, and referred to links and interconnections between climate
risks and non-climatic factors, such as food insecurity and rapid urbanization. Table 1
presents the main elements of impact and vulnerability assessments communicated by
Parties, accompanied by some examples.
Table 1
Main elements of impact and vulnerability assessments communicated by Parties in
the adaptation component of their intended nationally determined contributions
Main element National examples
General description of
non-climatic
vulnerabilities
Post-conflict fragility of the State
Poverty and low-skilled human resources
High prevalence of HIV/AIDS in adult population
Host country to displaced persons
Observed changes Average temperature increase of 0.26 C per decade in
1951–2012
Annual sea level rise of 1.43 mm
Loss of 50% of glacier surface
Projected changes National average temperature increase of 2.4–3.2 C by
2080
Sea level rise of 0.81 m by 2100
Rainfall reduction of 30–50% by 2090
Vulnerable sectors Water: groundwater levels sinking by 2–7 m per year and
possibly depleted by 2035–2050
Agriculture: production could fall by 15–19% by 2050
Health: risk of outbreaks
Vulnerable zones Arid- and semi-arid zones
Low-lying coastal areas and small islands
Mountains
River deltas
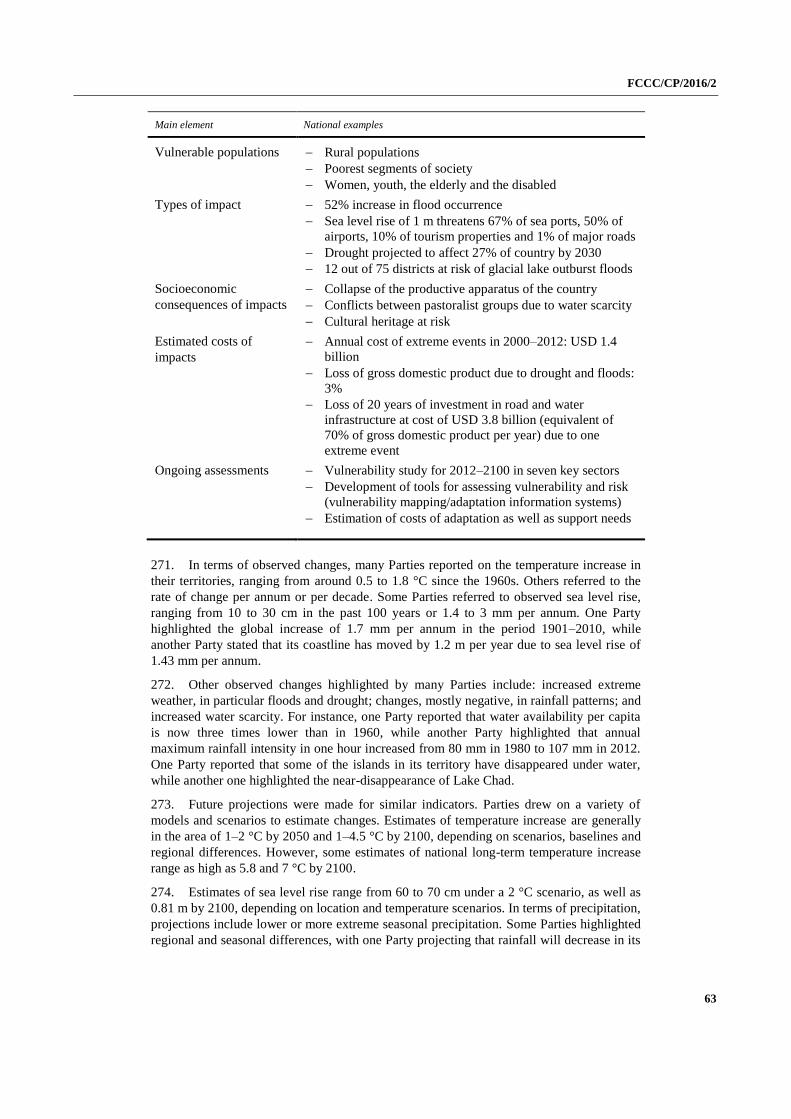
FCCC/CP/2016/2
63
Main element National examples
Vulnerable populations Rural populations
Poorest segments of society
Women, youth, the elderly and the disabled
Types of impact 52% increase in flood occurrence
Sea level rise of 1 m threatens 67% of sea ports, 50% of
airports, 10% of tourism properties and 1% of major roads
Drought projected to affect 27% of country by 2030
12 out of 75 districts at risk of glacial lake outburst floods
Socioeconomic
consequences of impacts
Collapse of the productive apparatus of the country
Conflicts between pastoralist groups due to water scarcity
Cultural heritage at risk
Estimated costs of
impacts
Annual cost of extreme events in 2000–2012: USD 1.4
billion
Loss of gross domestic product due to drought and floods:
3%
Loss of 20 years of investment in road and water
infrastructure at cost of USD 3.8 billion (equivalent of
70% of gross domestic product per year) due to one
extreme event
Ongoing assessments Vulnerability study for 2012–2100 in seven key sectors
Development of tools for assessing vulnerability and risk
(vulnerability mapping/adaptation information systems)
Estimation of costs of adaptation as well as support needs
271. In terms of observed changes, many Parties reported on the temperature increase in
their territories, ranging from around 0.5 to 1.8 °C since the 1960s. Others referred to the
rate of change per annum or per decade. Some Parties referred to observed sea level rise,
ranging from 10 to 30 cm in the past 100 years or 1.4 to 3 mm per annum. One Party
highlighted the global increase of 1.7 mm per annum in the period 1901–2010, while
another Party stated that its coastline has moved by 1.2 m per year due to sea level rise of
1.43 mm per annum.
272. Other observed changes highlighted by many Parties include: increased extreme
weather, in particular floods and drought; changes, mostly negative, in rainfall patterns; and
increased water scarcity. For instance, one Party reported that water availability per capita
is now three times lower than in 1960, while another Party highlighted that annual
maximum rainfall intensity in one hour increased from 80 mm in 1980 to 107 mm in 2012.
One Party reported that some of the islands in its territory have disappeared under water,
while another one highlighted the near-disappearance of Lake Chad.
273. Future projections were made for similar indicators. Parties drew on a variety of
models and scenarios to estimate changes. Estimates of temperature increase are generally
in the area of 1–2 °C by 2050 and 1–4.5 °C by 2100, depending on scenarios, baselines and
regional differences. However, some estimates of national long-term temperature increase
range as high as 5.8 and 7 °C by 2100.
274. Estimates of sea level rise range from 60 to 70 cm under a 2 °C scenario, as well as
0.81 m by 2100, depending on location and temperature scenarios. In terms of precipitation,
projections include lower or more extreme seasonal precipitation. Some Parties highlighted
regional and seasonal differences, with one Party projecting that rainfall will decrease in its
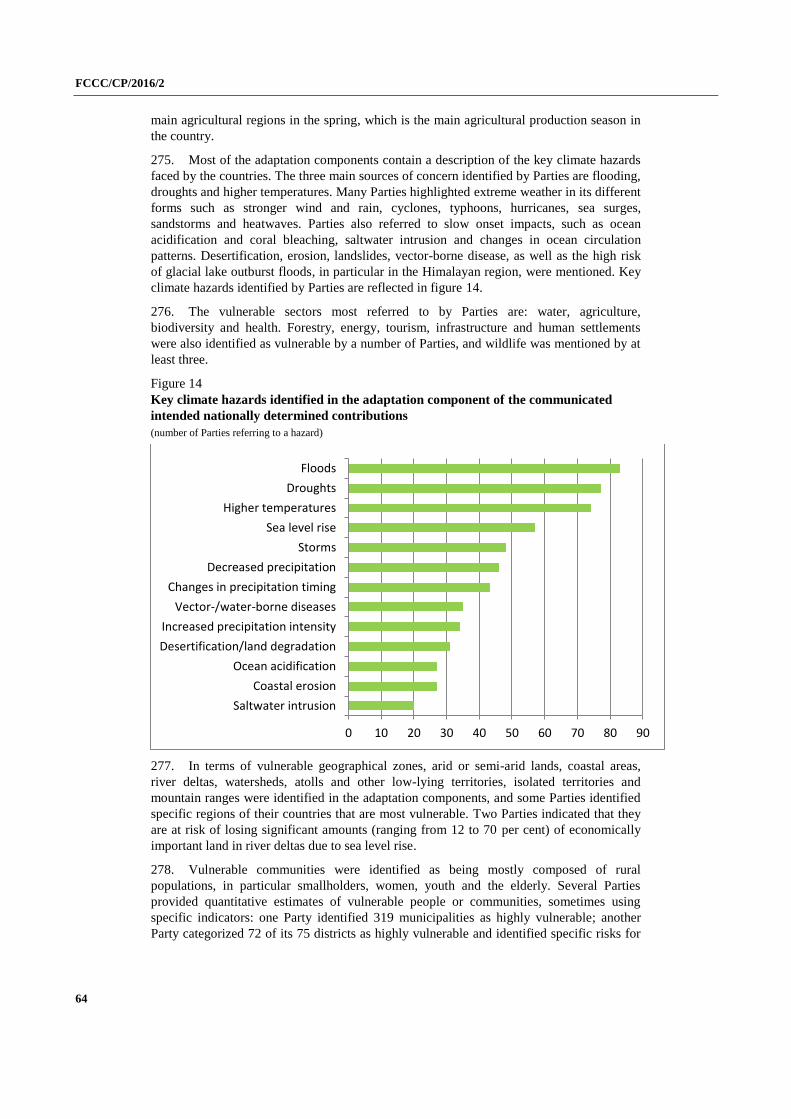
FCCC/CP/2016/2
64
main agricultural regions in the spring, which is the main agricultural production season in
the country.
275. Most of the adaptation components contain a description of the key climate hazards
faced by the countries. The three main sources of concern identified by Parties are flooding,
droughts and higher temperatures. Many Parties highlighted extreme weather in its different
forms such as stronger wind and rain, cyclones, typhoons, hurricanes, sea surges,
sandstorms and heatwaves. Parties also referred to slow onset impacts, such as ocean
acidification and coral bleaching, saltwater intrusion and changes in ocean circulation
patterns. Desertification, erosion, landslides, vector-borne disease, as well as the high risk
of glacial lake outburst floods, in particular in the Himalayan region, were mentioned. Key
climate hazards identified by Parties are reflected in figure 14.
276. The vulnerable sectors most referred to by Parties are: water, agriculture,
biodiversity and health. Forestry, energy, tourism, infrastructure and human settlements
were also identified as vulnerable by a number of Parties, and wildlife was mentioned by at
least three.
Figure 14
Key climate hazards identified in the adaptation component of the communicated
intended nationally determined contributions
(number of Parties referring to a hazard)
277. In terms of vulnerable geographical zones, arid or semi-arid lands, coastal areas,
river deltas, watersheds, atolls and other low-lying territories, isolated territories and
mountain ranges were identified in the adaptation components, and some Parties identified
specific regions of their countries that are most vulnerable. Two Parties indicated that they
are at risk of losing significant amounts (ranging from 12 to 70 per cent) of economically
important land in river deltas due to sea level rise.
278. Vulnerable communities were identified as being mostly composed of rural
populations, in particular smallholders, women, youth and the elderly. Several Parties
provided quantitative estimates of vulnerable people or communities, sometimes using
specific indicators: one Party identified 319 municipalities as highly vulnerable; another
Party categorized 72 of its 75 districts as highly vulnerable and identified specific risks for
0 10 20 30 40 50 60 70 80 90
Saltwater intrusion
Coastal erosion
Ocean acidification
Desertification/land degradation
Increased precipitation intensity
Vector-/water-borne diseases
Changes in precipitation timing
Decreased precipitation
Storms
Sea level rise
Higher temperatures
Droughts
Floods
FCCC/CP/2016/2
65
each; one Party considered 115 of its 272 municipalities vulnerable; while another Party
stated that 42 million people might be affected by sea level rise due to its long coastline.
279. In addition to climate impacts, Parties referred to the social, economic and political
consequences of those climate change impacts. Many referred to the risk of fluctuations in
food prices and other related risks, such as declining productivity of coral reef systems or
reduced crops or fishing, as well as to water security challenges due to scarcity or
contamination. For example, one Party stated that the flow of the Nile is projected to
decrease by 20–30 per cent in the next 40 years, creating strong water supply concerns.
Others are concerned about the loss of pastoral land and some fear that changes in
precipitation and the growing season may disrupt their agricultural calendars. Others drew
attention to specific threats to infrastructure and property. In this context, a few Parties
referred to elements of social justice, highlighting that high-risk areas are often populated
by the poorest and most marginalized segments of the population. A few Parties are
recovering from conflicts and indicated that climate change poses an additional burden on
their fragile state. Two Parties highlighted that water scarcity has triggered conflicts
between nomadic peoples or pastoral communities.
280. In describing their vulnerabilities, a few Parties referred to their rank in the Human
Development Index or in climate change vulnerability indices.
281. Transboundary aspects were mentioned, with Parties explaining how some national
vulnerabilities have regional and even global effects. For instance, one Party explained that
it is the home of four major rivers of West Africa, which are threatened by the impacts of
climate change, and that its geographical situation could make it a shelter for neighbouring
countries, in particular nomadic pastoralists, increasing the pressure on river basins already
affected by drought and changing rainfall patterns. Two major food exporters reported on
their contribution to global food security and the global risk induced by the vulnerability of
their agriculture and livestock sectors.
282. Some Parties drew attention to ongoing vulnerability assessments. Parties are
engaging in various types of activity, for example: developing guidance and tools to
support the assessment of vulnerability and risk at the national level for a comprehensive
and quantitative analysis of impacts; mapping regional vulnerabilities; developing an
adaptation information system; and identifying vulnerabilities in key sectors (e.g. one Party
is identifying vulnerabilities for 2021–2100 in seven key sectors with the aim of defining an
adaptation action plan). In addition, a few Parties shared their intention to regularly update
their climate vulnerability assessments on the basis of new climate information, while a few
highlighted their limited capacity to undertake vulnerability assessments.
283. Some of the adaptation components provide assessments of the costs, losses and/or
damage incurred either over a given period or due to a specific extreme event, mostly
drought, floods or storms. Some Parties highlighted the overall costs of adaptation
nationally, which were expressed mostly in financial terms. For example, one Party
suffered losses of USD 48 million per annum in the period 1980–1999 and USD 1.4 billion
per annum in the period 2000–2012, while another one referred to total losses of USD 6
billion due to extreme events in the period 2010–2011. A devastating hurricane in August
2015 was reported to have led to losses and damage amounting to USD 392.3 million for
one Party.
284. Past costs, losses and/or damage due to climate impacts were also expressed by a
few Parties as a percentage of their GDP. For example, one Party stated that floods and
drought have caused economic losses worth an estimated 3 per cent of GDP; another
indicated a loss of 35 per cent of GDP in 2010–2014; and another Party highlighted the loss
of 8 per cent of its GDP and 48 per cent of the total value of health, housing and education
due to a single hurricane. A few Parties indicated their spending on adaptation as a
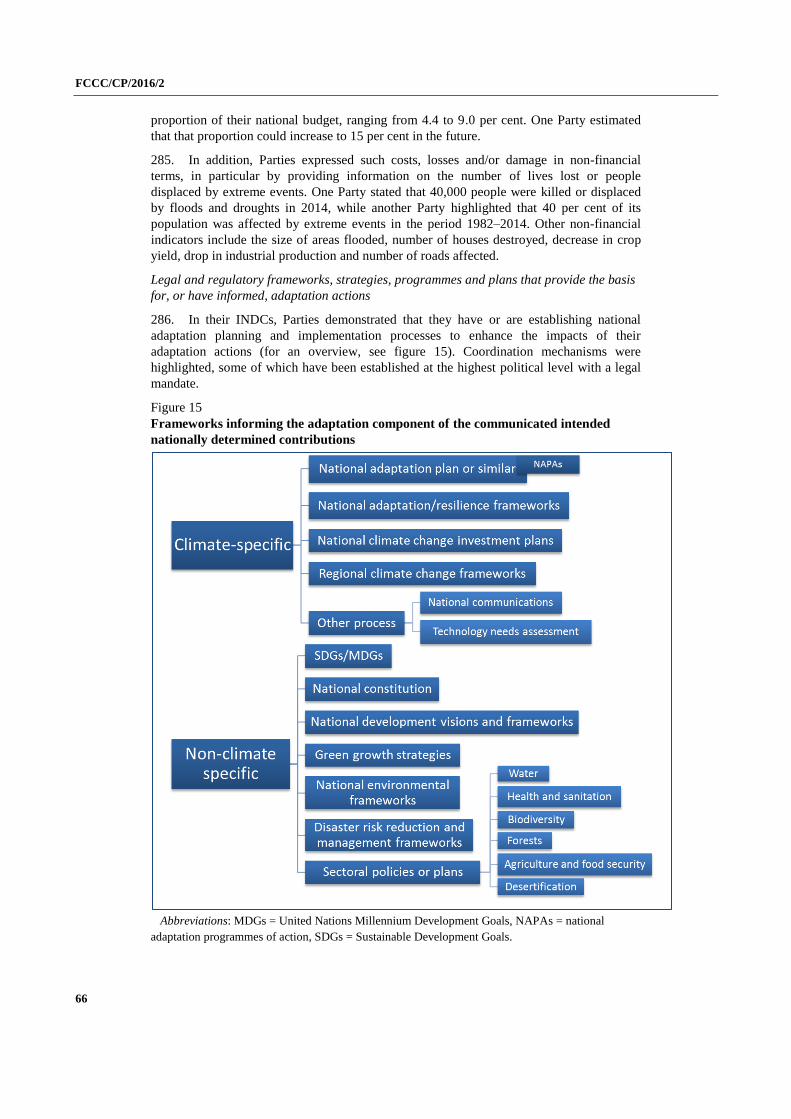
FCCC/CP/2016/2
66
proportion of their national budget, ranging from 4.4 to 9.0 per cent. One Party estimated
that that proportion could increase to 15 per cent in the future.
285. In addition, Parties expressed such costs, losses and/or damage in non-financial
terms, in particular by providing information on the number of lives lost or people
displaced by extreme events. One Party stated that 40,000 people were killed or displaced
by floods and droughts in 2014, while another Party highlighted that 40 per cent of its
population was affected by extreme events in the period 1982–2014. Other non-financial
indicators include the size of areas flooded, number of houses destroyed, decrease in crop
yield, drop in industrial production and number of roads affected.
Legal and regulatory frameworks, strategies, programmes and plans that provide the basis
for, or have informed, adaptation actions
286. In their INDCs, Parties demonstrated that they have or are establishing national
adaptation planning and implementation processes to enhance the impacts of their
adaptation actions (for an overview, see figure 15). Coordination mechanisms were
highlighted, some of which have been established at the highest political level with a legal
mandate.
Figure 15
Frameworks informing the adaptation component of the communicated intended
nationally determined contributions
Abbreviations: MDGs = United Nations Millennium Development Goals, NAPAs = national
adaptation programmes of action, SDGs = Sustainable Development Goals.
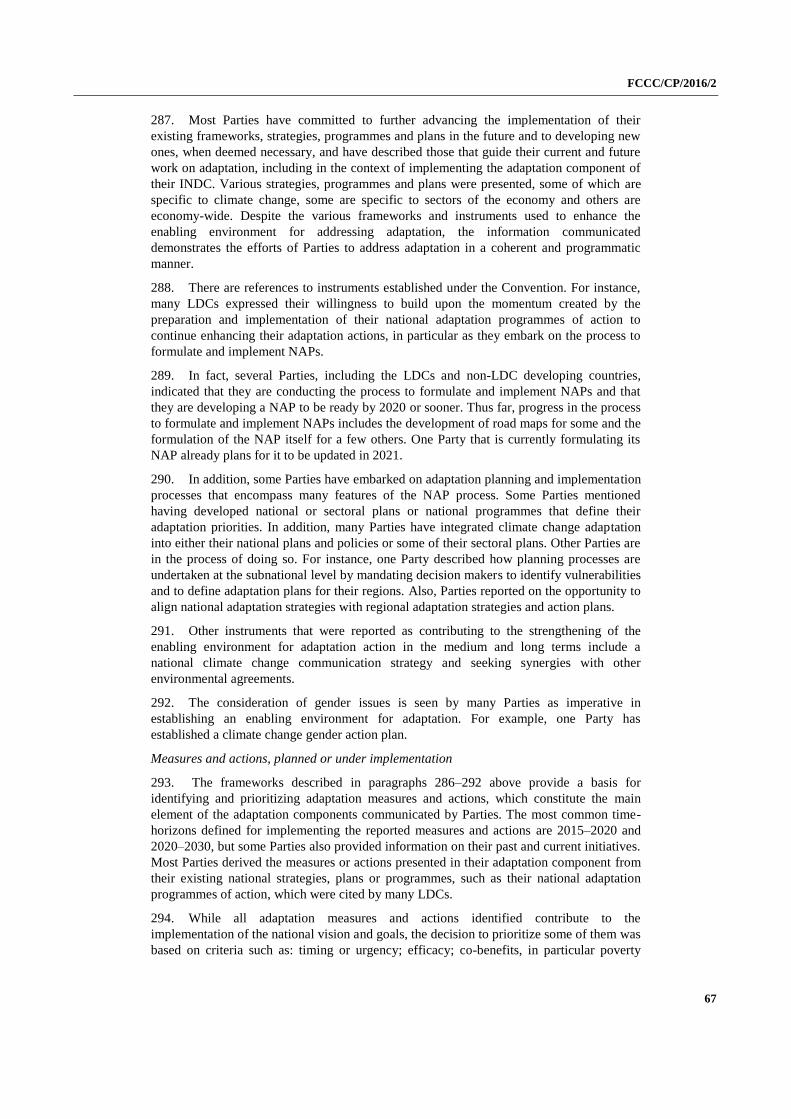
FCCC/CP/2016/2
67
287. Most Parties have committed to further advancing the implementation of their
existing frameworks, strategies, programmes and plans in the future and to developing new
ones, when deemed necessary, and have described those that guide their current and future
work on adaptation, including in the context of implementing the adaptation component of
their INDC. Various strategies, programmes and plans were presented, some of which are
specific to climate change, some are specific to sectors of the economy and others are
economy-wide. Despite the various frameworks and instruments used to enhance the
enabling environment for addressing adaptation, the information communicated
demonstrates the efforts of Parties to address adaptation in a coherent and programmatic
manner.
288. There are references to instruments established under the Convention. For instance,
many LDCs expressed their willingness to build upon the momentum created by the
preparation and implementation of their national adaptation programmes of action to
continue enhancing their adaptation actions, in particular as they embark on the process to
formulate and implement NAPs.
289. In fact, several Parties, including the LDCs and non-LDC developing countries,
indicated that they are conducting the process to formulate and implement NAPs and that
they are developing a NAP to be ready by 2020 or sooner. Thus far, progress in the process
to formulate and implement NAPs includes the development of road maps for some and the
formulation of the NAP itself for a few others. One Party that is currently formulating its
NAP already plans for it to be updated in 2021.
290. In addition, some Parties have embarked on adaptation planning and implementation
processes that encompass many features of the NAP process. Some Parties mentioned
having developed national or sectoral plans or national programmes that define their
adaptation priorities. In addition, many Parties have integrated climate change adaptation
into either their national plans and policies or some of their sectoral plans. Other Parties are
in the process of doing so. For instance, one Party described how planning processes are
undertaken at the subnational level by mandating decision makers to identify vulnerabilities
and to define adaptation plans for their regions. Also, Parties reported on the opportunity to
align national adaptation strategies with regional adaptation strategies and action plans.
291. Other instruments that were reported as contributing to the strengthening of the
enabling environment for adaptation action in the medium and long terms include a
national climate change communication strategy and seeking synergies with other
environmental agreements.
292. The consideration of gender issues is seen by many Parties as imperative in
establishing an enabling environment for adaptation. For example, one Party has
established a climate change gender action plan.
Measures and actions, planned or under implementation
293. The frameworks described in paragraphs 286–292 above provide a basis for
identifying and prioritizing adaptation measures and actions, which constitute the main
element of the adaptation components communicated by Parties. The most common time-
horizons defined for implementing the reported measures and actions are 2015–2020 and
2020–2030, but some Parties also provided information on their past and current initiatives.
Most Parties derived the measures or actions presented in their adaptation component from
their existing national strategies, plans or programmes, such as their national adaptation
programmes of action, which were cited by many LDCs.
294. While all adaptation measures and actions identified contribute to the
implementation of the national vision and goals, the decision to prioritize some of them was
based on criteria such as: timing or urgency; efficacy; co-benefits, in particular poverty
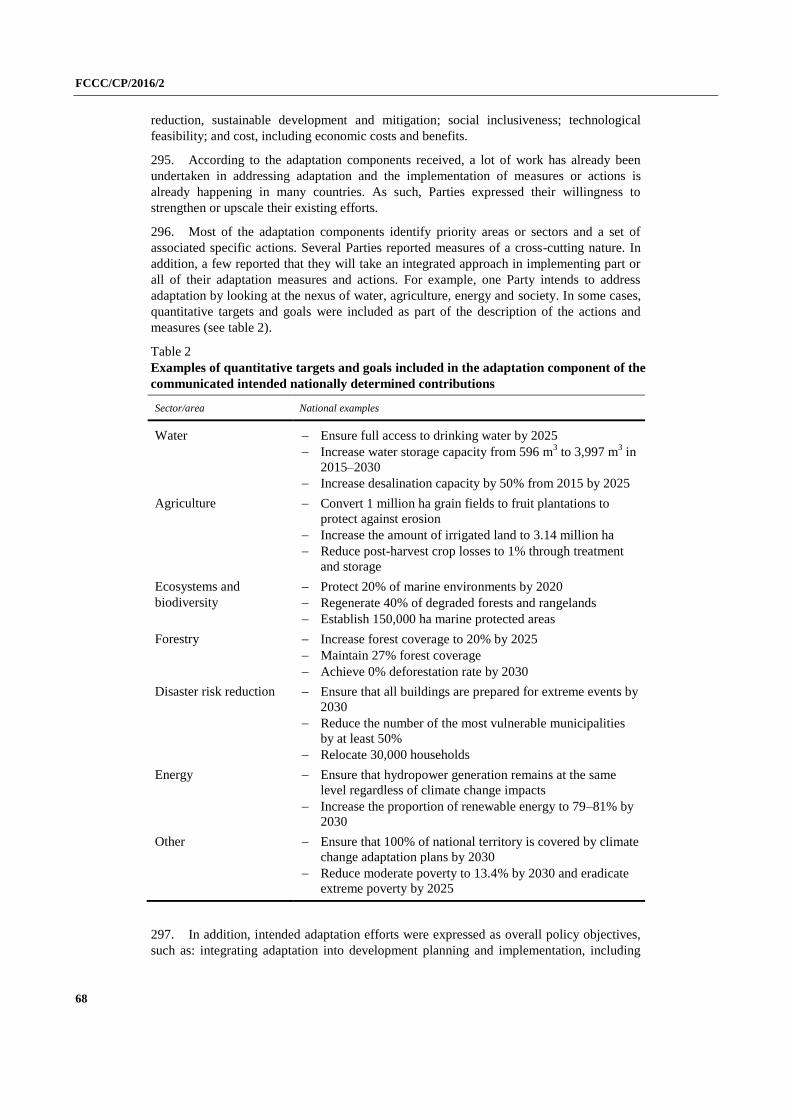
FCCC/CP/2016/2
68
reduction, sustainable development and mitigation; social inclusiveness; technological
feasibility; and cost, including economic costs and benefits.
295. According to the adaptation components received, a lot of work has already been
undertaken in addressing adaptation and the implementation of measures or actions is
already happening in many countries. As such, Parties expressed their willingness to
strengthen or upscale their existing efforts.
296. Most of the adaptation components identify priority areas or sectors and a set of
associated specific actions. Several Parties reported measures of a cross-cutting nature. In
addition, a few reported that they will take an integrated approach in implementing part or
all of their adaptation measures and actions. For example, one Party intends to address
adaptation by looking at the nexus of water, agriculture, energy and society. In some cases,
quantitative targets and goals were included as part of the description of the actions and
measures (see table 2).
Table 2
Examples of quantitative targets and goals included in the adaptation component of the
communicated intended nationally determined contributions
Sector/area National examples
Water Ensure full access to drinking water by 2025
Increase water storage capacity from 596 m3 to 3,997 m
3 in
2015–2030
Increase desalination capacity by 50% from 2015 by 2025
Agriculture Convert 1 million ha grain fields to fruit plantations to
protect against erosion
Increase the amount of irrigated land to 3.14 million ha
Reduce post-harvest crop losses to 1% through treatment
and storage
Ecosystems and
biodiversity
Protect 20% of marine environments by 2020
Regenerate 40% of degraded forests and rangelands
Establish 150,000 ha marine protected areas
Forestry Increase forest coverage to 20% by 2025
Maintain 27% forest coverage
Achieve 0% deforestation rate by 2030
Disaster risk reduction Ensure that all buildings are prepared for extreme events by
2030
Reduce the number of the most vulnerable municipalities
by at least 50%
Relocate 30,000 households
Energy Ensure that hydropower generation remains at the same
level regardless of climate change impacts
Increase the proportion of renewable energy to 79–81% by
2030
Other Ensure that 100% of national territory is covered by climate
change adaptation plans by 2030
Reduce moderate poverty to 13.4% by 2030 and eradicate
extreme poverty by 2025
297. In addition, intended adaptation efforts were expressed as overall policy objectives,
such as: integrating adaptation into development planning and implementation, including
FCCC/CP/2016/2
69
‘climate proofing’ key development sectors and integrating adaptation into the national
budget; strengthening institutional capacity; enforcing behavioural change; ensuring
various types of resilience (economic, social and environmental); and preventing and
resolving conflict.
298. Approaches to implementing adaptation described in the adaptation components
include:
(a) Community-based adaptation;
(b) Ecosystem-based adaptation;
(c) Landscape approach to adaptation;
(d) Livelihood diversification;
(e) Exploring synergies between adaptation and mitigation (see paras. 328
and 329 below).
299. In their adaptation components, Parties referred to actions in virtually every sector
and area of the economy, as indicated in figure 16. The three priority areas were water,
agriculture and health.
Figure 16
Priority areas and sectors for adaptation actions identified in the adaptation
component of the communicated intended nationally determined contributions
(number of Parties referring to area or sector)
300. Water security is clearly a key development priority for most Parties. Various types
of action related to the protection of water resources were included in the adaptation
components, which generally aim at ensuring the security of water supply by saving water,
enhancing the allocation of water and broadening the resource base. Parties highlighted
many broader considerations, such as mainstreaming climate change adaptation in the water
sector (e.g. by considering climate criteria in water management efforts), implementing a
national water master plan, putting in place integrated water management systems or
building a water-saving society. Parties outlined many specific water-saving measures and
techniques, such as developing water-saving irrigation systems, using desalination
(including with renewable energy), constructing water conservation facilities for farmlands,
0 20 40 60 80 100 120 140
Fisheries
Coastal protection
Food security
Disaster risk reduction
Energy
Forestry
Infrastructure
Ecosystems
Health
Agriculture
Water
FCCC/CP/2016/2
70
building a man-made lake, constructing reservoirs for glacier meltwater harvesting, and
watershed management. Some Parties outlined more specific techniques, such as digging
wells, rainwater harvesting or substituting water withdrawal from aquifers with surface
water. One Party emphasized that the issue of water resources cuts across other sectors (e.g.
health, food security and energy).
301. Many Parties referred to actions in the agriculture sector and emphasized the
importance of integrating adaptation into agriculture and food production and ensuring food
security and sustainability of agriculture. Parties have introduced various programmes and
policies, such as promoting sustainable agriculture and land and resource management,
implementing integrated adaptation programmes for agriculture, developing climate criteria
for agricultural programmes and adapting agricultural calendars. Others described specific
agricultural methods for combating climate-related problems. For example, Parties
described methods for pest management, including integrated pest management,
introduction of heat-, drought- and disease-resistant crops, fodder types and livestock
breeds and the distribution of medicine and vet services. Many referred to the importance of
more diversified and resilient crops and livestock, for example by promoting native maize
species and other improved crop varieties. Parties also referred to key agricultural
improvements, such as enhanced irrigation systems, drought management and methods to
reduce erosion. Other measures mentioned include affordable insurance, climate research,
use of information and traditional knowledge and early warning systems.
302. Human health was commonly cited as a priority sector. A number of Parties are
aiming to achieve: an overall integration of climate impacts and/or the identification of
priority actions in the health sector; an enhanced understanding of climate–health
connections and changing disease patterns; and enhanced management systems or
contingency plans for public health to improve the adaptive capacity of public medical
services. In terms of more specific measures to combat vector-borne diseases, Parties
referred to, for example, protecting pregnant women and children under five against vector-
borne diseases, suppressing mosquito populations and distributing test kits for vector-borne
diseases. Other measures include early warning systems with epidemiological information,
health surveillance programmes and contingency plans in the event of heatwaves.
303. Another priority area identified by many Parties was ecosystems, including in the
context of biodiversity conservation. Many defined enhancing the resilience of or
rehabilitating ecosystems as one of their objectives and they highlighted their national
and/or regional biodiversity strategies and/or action plans. In terms of biodiversity, Parties
identified some specific objectives and actions, including establishing biodiversity
corridors, protecting moorlands and other ecosystems, increasing the conservation of
species and recovering forest, coastal and marine ecosystems (in particular mangroves and
corals) and tracking, monitoring and assessing impacts on biodiversity. Specific measures
mentioned by Parties include preparing a biodiversity index and atlas or biodiversity
centres, protecting wildlife species, establishing watering points for wildlife and stopping
coastal mining.
304. DRR was addressed concomitantly to adaptation by several Parties and they reported
on their current and future efforts relating to DRR, in particular against storms, floods, sea
level rise and glacial lake outburst floods. Many provided information on their national and
regional DRR strategies, policies, plans, platforms and frameworks. Specific measures
highlighted by Parties include early warning systems, risk management institutions, hazard
maps, building codes and other standards, infrastructure protection measures and
contingency plans. Some Parties are developing insurance schemes, in particular to protect
the most vulnerable communities and to incentivize climate-proof construction. A few
Parties intend to resettle part of their population highly exposed to climate risk in safer
FCCC/CP/2016/2
71
areas. In this context, one Party announced that it is preparing its people for emigration
owing to its high vulnerability to sea level rise.
305. In line with emerging trends seen in national frameworks and policies as reported by
Parties, some of the actions and measures seek to address transboundary issues. Most of
such issues are regional and involve the management of shared river basins, but one Party
mentioned its intention to contribute to the integration of climate change into regional
transhumance plans. A few Parties referred to regional cooperation, in particular in the area
of DRR. Transboundary issues with a global scope were reported. For instance, a few
Parties highlighted that sectors of their economies, for example food production, contribute
to ensuring global security, and one Party is studying the impacts of climate change on
major food exporters in order to understand the risks to food imports.
306. There is recognition that progress has already been made by many Parties in
addressing adaptation. For example, one Party indicated that it has made great strides in
reducing vulnerability in the tourism, agriculture and ecosystem management sectors,
among others; it has also enhanced its research and data management. In addition, a few
Parties mentioned that the methodologies and tools that they have developed for their
national adaptation work have been recognized by the international community as good
practices.
307. In addition, several Parties indicated that they are encouraging the active
participation of relevant stakeholders as a means of strengthening the implementation of
their adaptation actions. Some Parties specifically mentioned the need to enhance the
participation of vulnerable communities, including women, with a view to empowering
them.
308. A few Parties provided objectives and targets for the overall coverage and scope of
their adaptation plans, measures or actions.
Costs, losses and/or damage due to climate impacts
309. Costs, losses and/or damage associated with past78 and projected impacts of climate
variability and change were reported by several Parties. Such costs, losses and/or damage
are projected to be incurred because of extreme hydrometeorological events such as
drought, floods or tropical storms, but also because of sea level rise and associated coastal
erosion, increases in vector-borne and waterborne diseases and fires.
310. Projected costs, losses and/or damage due to climate impacts have been quantified
by some Parties, for example in the form of absolute costs, annual loss of GDP (ranges
provided included from 1 to 2 per cent by 2030, 1.8 to 8.6 per cent by 2050 and 9.4 per cent
by 2100; percentage of land or agricultural production lost, or percentage of population
affected by a certain year or a particular threshold, for example a specific rise in sea level.
One Party estimated that climate impacts will affect 80 per cent of the population. Another
Party highlighted that it is in the process of calculating loss and damage through the NAP
process. A few Parties provided details on projected costs of climate change impacts and
how intended adaptation measures are expected to reduce the projected costs of impacts,
leaving some residual damage, thus clearly making an economic case for investing in
adaptation and DRR.
311. Measures highlighted by Parties with the potential to reduce projected costs, losses
and/or damage due to climate impacts include, first and foremost: aligning development,
adaptation and DRR; enhancing risk sharing and transfer, including setting up insurance
78 Information on costs, losses and/or damage due to past climate impacts is included in the section on
impact and vulnerability assessments above.
FCCC/CP/2016/2
72
schemes; strengthening institutional arrangements and legislative frameworks;
strengthening early warning systems; enhancing building codes and land-use planning; and
promoting social protection.
Means of implementation of adaptation actions
312. Most Parties provided information on the means of implementation, including
finance, technology and capacity-building, needed to support the implementation of their
envisaged adaptation actions. The information reported relates to:
(a) Support received and needed, including needs for finance, technology and
capacity-building;
(b) Domestic support, including institutional arrangements;
(c) International support;
(d) North–South and South–South cooperation.
313. Specific support needs identified by Parties include:
(a) Favourable enabling environments with appropriate institutional
arrangements and legislation, including for mainstreaming climate change in development
planning, gender mainstreaming and strengthening the engagement of subnational
communities and the private sector;
(b) Sufficient financial resources to assess, plan, implement, monitor and
evaluate adaptation actions;
(c) Technologies for adaptation,79 including in the areas of climate observation
and monitoring, early warning systems, water resources management, including irrigation
and wastewater management, coastal zones, resilient transportation systems, sustainable or
climate-smart agriculture, forestry (including forest fires) and land management;
(d) Training and building of institutional and human capacities and technical
expertise, including in the area of vulnerability and adaptation assessments, cost–benefit
analysis and the development of sectoral finance plans;
(e) Research, data and information, including in the areas of climate forecasting
and modelling, satellite data, regionally downscaled climate data and research into
international energy markets;
(f) Education, raising awareness and outreach on climate change impacts and
adaptation.
314. While several Parties quantified their financial needs, others are in the process or are
planning to do so. Needs for finance were expressed either as total quantified financial
needs to implement mitigation and adaptation actions identified in the INDCs or as specific
adaptation finance needs. Parties that reported specific financial needs for adaptation did so
for either the whole INDC period (with individual needs ranging from USD 100 million to
over USD 200 billion) or on an annual basis (with individual needs ranging from around
USD 10 million to USD 3 billion per year). A few Parties provided additional information
on their finance needs by sector or plan or strategy and two Parties provided projected
adaptation costs for different mitigation scenarios.
315. Several Parties reported on how they are or will be addressing their identified
support needs through the provision of domestic support, in particular finance, and some
identified the amount of resources allocated in their domestic budgets. Financial resources
were reported to come from a variety of sources, including: the national budget; insurance;
79 Some Parties referred to their technology needs assessments.
FCCC/CP/2016/2
73
contingent credit and catastrophe bonds; income credits of the domestic market; allocations
from valued-added tax as well as environmental fees, taxes and levies; soft and low-interest
loans; and the domestic private sector. Others highlighted support that they have received
from international finance institutions, funds under the Convention and bilateral and
multilateral donors.
316. Investment strategies and plans and national climate change and adaptation funds are
being set up by some Parties to assist in allocating resources in their national budgets, to
mobilize additional resources, to assist in engaging the private sector, including through
establishing public–private partnerships, and to ensure adequate uptake of finance.
317. In addition, several Parties noted their ongoing capacity-building, training and
research efforts, including related to research cooperation, innovation clusters and
cooperation with regional and local governments as well as the financial sector.
318. While developing country Parties are providing significant domestic support for
adaptation, many underlined the need to receive international support in the form of
finance, technology transfer and capacity-building in line with the Convention. While one
Party noted that all adaptation costs should be borne by developed country Parties, several
Parties stressed that a substantial amount should be provided by developed countries to
allow for the implementation of additional adaptation activities. International support for
adaptation is further soughtas itwilldetermineParties’ability to safeguarddevelopment
gains, fulfil their intended unconditional mitigation actions and use their domestic resources
for developmental purposes rather than for adaptation.
319. International finance is to come from the GCF, the Adaptation Fund, the GEF,
including the Least Developed Countries Fund and the Special Climate Change Fund, other
bilateral and multilateral funds, including United Nations programmes and organizations,
and foreign direct investment and soft loans.
320. In addition to finance, Parties called for international support in the areas of:
(a) Clean technology transfer on concessional and preferential terms, including
through the Climate Technology Centre and Network;
(b) Capacity-building.
321. South–South cooperation on the basis of solidarity and common sustainable
development priorities was highlighted by a few developing country Parties as a further
means to support and strengthen adaptation, including at the regional level. For example,
one Party communicated its intention to establish a fund for South–South cooperation on
climate change.
Monitoring and evaluation
322. Given that the complex and long-term nature of climate change and its impacts
require adaptation to be designed as a continuous and flexible process and subject to
periodic review, several Parties described how they will monitor and evaluate their intended
measures.
323. While some Parties have developed or are in the process of developing an integrated
system for monitoring, reporting and verifying their mitigation and adaptation components,
others have developed or are in the process of developing adaptation-specific monitoring
and evaluating systems and institutional set-ups. A few Parties intend to integrate the
review of adaptation into existing monitoring and evaluation systems and processes for
national development, for example into annual sector-based progress reports or results-
based management systems, or into reporting supervised by a designated national authority
to ensure that adaptation achievements are captured and reported in regular development
reports.
FCCC/CP/2016/2
74
324. Parties seek to monitor and evaluate adaptation actions as well as support provided
and received, with a view to:
(a) Tracking progress in implementation to inform the adaptation process by
sharing lessons learned and to update adaptation plans;
(b) Determining the degree to which the adaptive capacity of individuals,
communities and systems has been raised and vulnerability has decreased;
(c) Improving transparency, performance evaluation and accountability;
(d) Ensuring that resources are well utilized to increase resilience and produce
real benefits;
(e) Tracking climate finance as well as technology transfer and capacity-
building.
325. Regarding the monitoring and evaluation of adaptation action, some Parties
highlighted that they have established or will establish adaptation and vulnerability
indicators and baselines to monitor and measure progress. Parties reported both quantitative
(e.g. number of people benefiting from adaptation activities, number of hectares with
drought-resistant crops under cultivation, and forest coverage increases to 45 per cent) and
qualitative (e.g. degree of integration of adaptation into sectoral policies and plans and level
of awareness) indicators.
326. The focus on short-term monitoring of activities, processes and outputs rather than
on longer-term outcomes was stressed by one Party. A few Parties have initially tested the
monitoring and evaluation of adaptation for specific regions, sectors or projects and, on the
basis of those experiences and lessons learned, are now planning to scale up monitoring and
evaluation to the national level. Connecting project-level with national-level monitoring
and evaluation of adaptation is the goal of the three-tier monitoring and evaluation
approach80 highlighted by one Party.
327. In terms of the monitoring and evaluation of domestic and international support
provided and received, in particular finance, a few Parties are putting in place climate
finance systems for determining, disbursing and monitoring climate expenditure and for
enhancing the visibility of adaptation measures within the allocation of their national
budgets.
Synergies between adaptation and mitigation
328. Noting that climate change actions require a holistic approach, several Parties
elaborated on the synergies between adaptation and mitigation as part of their overall low-
emission climate-resilient development strategies. One Party indicated that it considers
mitigation to be a function of adaptation. Synergies are being sought at project, sector or
landscape level, in planning or institutional frameworks at national, regional or local level
and in urban and rural settings. One Party estimated that its adaptation measures would
generate emission reductions of up to 130 Mt CO2 eq. Table 3 provides an overview of the
frequently highlighted sectors offering adaptation and mitigation synergies along with
example measures.
80 The first tier, macro-level monitoring, would allow for tracking the evolution of the national
adaptation planning process as a whole. The second tier, meso-level monitoring, would allow for
tracking progress and results at a disaggregated level, either sectoral or geographical. The third tier, a
micro-level structure of reporting, would apply to specific adaptation actions. Reporting is envisaged
to be undertaken annually. Every four years (i.e. at the end of a planning cycle), an aggregated NAP
impact study would elaborate on results achieved and make recommendations for the next cycle.
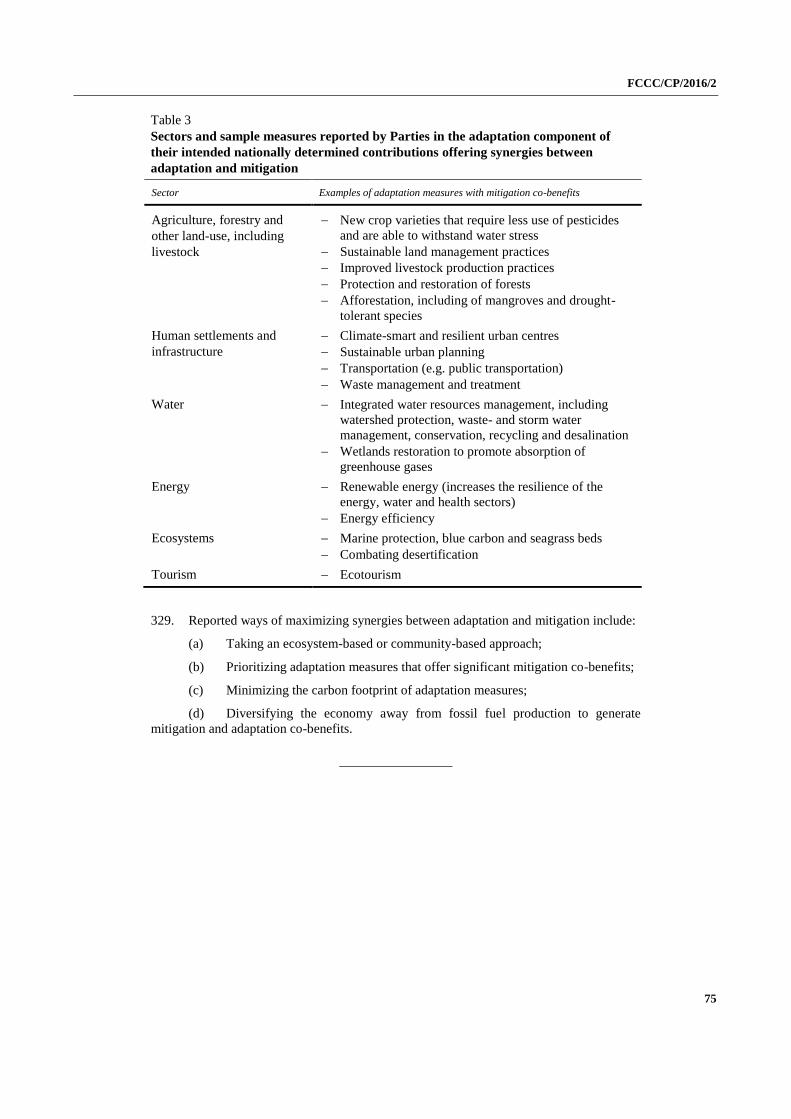
FCCC/CP/2016/2
75
Table 3
Sectors and sample measures reported by Parties in the adaptation component of
their intended nationally determined contributions offering synergies between
adaptation and mitigation
Sector Examples of adaptation measures with mitigation co-benefits
Agriculture, forestry and
other land-use, including
livestock
New crop varieties that require less use of pesticides
and are able to withstand water stress
Sustainable land management practices
Improved livestock production practices
Protection and restoration of forests
Afforestation, including of mangroves and drought-
tolerant species
Human settlements and
infrastructure
Climate-smart and resilient urban centres
Sustainable urban planning
Transportation (e.g. public transportation)
Waste management and treatment
Water Integrated water resources management, including
watershed protection, waste- and storm water
management, conservation, recycling and desalination
Wetlands restoration to promote absorption of
greenhouse gases
Energy Renewable energy (increases the resilience of the
energy, water and health sectors)
Energy efficiency
Ecosystems Marine protection, blue carbon and seagrass beds
Combating desertification
Tourism Ecotourism
329. Reported ways of maximizing synergies between adaptation and mitigation include:
(a) Taking an ecosystem-based or community-based approach;
(b) Prioritizing adaptation measures that offer significant mitigation co-benefits;
(c) Minimizing the carbon footprint of adaptation measures;
(d) Diversifying the economy away from fossil fuel production to generate
mitigation and adaptation co-benefits.