Embed Size (px)
Citation preview
Moaveni, Wang, Hart, Tutumluer, and Ahuja
Revised Manuscript 13-4167 for Annual Meeting Compendium of Papers
AGGREGATE SIZE AND SHAPE EVALUATION USING 1 SEGMENTATION TECHNIQUES AND AGGREGATE IMAGE 2
PROCESSING ALGORITHMS 3 4
Accepted for Presentation and Publication at the 92nd Annual Meeting of the
Transportation Research Board Washington, DC, January 2013
by
Maziar Moaveni, Ph.D. Student, Graduate Research Assistant Department of Civil and Environmental Engineering
Phone: (217) 778-2503 / Email: [email protected]
Shengnan Wang, Ph.D. Student, Graduate Research Assistant Department of Electrical and Computer Engineering Phone: (217) 244-4392 / Email: [email protected]
John M. Hart, Senior Research Engineer
Beckman Institute for Advanced Science and Technology Phone: (217) 244-4147 / Email: [email protected]
Erol Tutumluer, Professor (Corresponding Author)
Paul F. Kent Endowed Faculty Scholar Department of Civil and Environmental Engineering
Phone: (217) 333-8637 / Fax: (217) 333-1924 / Email: [email protected]
Narendra Ahuja, Professor Donald Biggar Willet Professor of Engineering
Department of Electrical and Computer Engineering Phone: (217) 333-1837 / Email: [email protected]
University of Illinois at Urbana-Champaign 205 North Mathews, Urbana, Illinois 61801
Word Count: 4,739 words + 4 Tables (4*250) + 7 Figures (7*250) = 7,489
November 2012 5
TRB 2013 Annual Meeting Paper revised from original submittal.
Moaveni, Wang, Hart, Tutumluer, and Ahuja
2
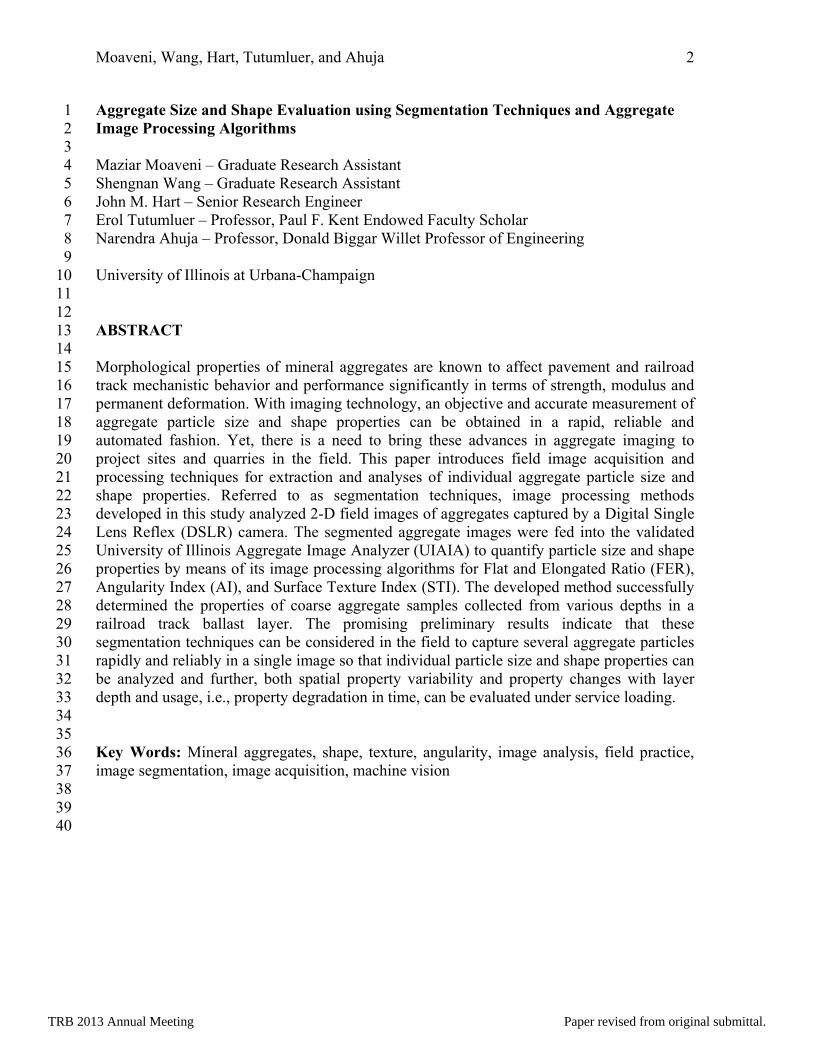
Aggregate Size and Shape Evaluation using Segmentation Techniques and Aggregate 1 Image Processing Algorithms 2 3 Maziar Moaveni – Graduate Research Assistant 4 Shengnan Wang – Graduate Research Assistant 5 John M. Hart – Senior Research Engineer 6 Erol Tutumluer – Professor, Paul F. Kent Endowed Faculty Scholar 7 Narendra Ahuja – Professor, Donald Biggar Willet Professor of Engineering 8 9 University of Illinois at Urbana-Champaign 10 11
12 ABSTRACT 13 14 Morphological properties of mineral aggregates are known to affect pavement and railroad 15 track mechanistic behavior and performance significantly in terms of strength, modulus and 16 permanent deformation. With imaging technology, an objective and accurate measurement of 17 aggregate particle size and shape properties can be obtained in a rapid, reliable and 18 automated fashion. Yet, there is a need to bring these advances in aggregate imaging to 19 project sites and quarries in the field. This paper introduces field image acquisition and 20 processing techniques for extraction and analyses of individual aggregate particle size and 21 shape properties. Referred to as segmentation techniques, image processing methods 22 developed in this study analyzed 2-D field images of aggregates captured by a Digital Single 23 Lens Reflex (DSLR) camera. The segmented aggregate images were fed into the validated 24 University of Illinois Aggregate Image Analyzer (UIAIA) to quantify particle size and shape 25 properties by means of its image processing algorithms for Flat and Elongated Ratio (FER), 26 Angularity Index (AI), and Surface Texture Index (STI). The developed method successfully 27 determined the properties of coarse aggregate samples collected from various depths in a 28 railroad track ballast layer. The promising preliminary results indicate that these 29 segmentation techniques can be considered in the field to capture several aggregate particles 30 rapidly and reliably in a single image so that individual particle size and shape properties can 31 be analyzed and further, both spatial property variability and property changes with layer 32 depth and usage, i.e., property degradation in time, can be evaluated under service loading. 33 34 35 Key Words: Mineral aggregates, shape, texture, angularity, image analysis, field practice, 36 image segmentation, image acquisition, machine vision 37 38 39 40
TRB 2013 Annual Meeting Paper revised from original submittal.
Moaveni, Wang, Hart, Tutumluer, and Ahuja
3
INTRODUCTION 1 2 As the transportation infrastructure continues to age and grow, the need for repairs, 3 reconstruction and new construction grows, and the demand for aggregates expands. 4 Nevertheless, high quality aggregate materials are becoming increasingly scarce and 5 expensive in many parts of the country because gravel mines and rock quarries are being lost 6 to other land uses. These aggregate materials are classified for use and placed in quantities 7 based on specifications and testing techniques that are not always linked to the application of 8 the aggregate resource. The most commonly used aggregate property, which makes a certain 9 aggregate material to pass agency specifications for a certain transportation application, has 10 typically been the grain size distribution or gradation. 11
The morphological or shape properties of mineral aggregates used in asphalt concrete, 12 cement concrete, and unbound subbase/base/ballast layers can affect highway pavement as 13 well as railroad track performance significantly in terms of strength and permanent 14 deformation (1-4). Imaging technology provides an objective and accurate measurement of 15 aggregate particle size and shape properties in a rapid, reliable and automated fashion when 16 compared to traditional manual methods/tools, and has been successfully used as a research 17 tool in the last decade for quantifying aggregate particle shape properties (5,6). Each 18 available imaging system uses a specific mathematical procedure in calculating a validated 19 index to evaluate form, angularity, and texture properties of aggregates. Among the most 20 widely used techniques in aggregate shape characterization, the Flat and Elongated Ratio 21 (FER), Angularity Index (AI), and Surface Texture Index (STI) were recognized as key 22 indices from national studies such as NCHRP 4-30 and the TPF-5(023) pool fund study. 23 These indices were determined using the University of Illinois Aggregate Image Analyzer 24 (UIAIA) (7-9). A recent Minnesota Department of Transportation research project at the 25 University of Illinois showed that incorporating the aggregate parameters FER, AI, and STI 26 improved considerably the ability of the regression based predictive models in estimating the 27 modulus and strength properties of commonly used aggregates in highway pavement 28 construction (10). Further, railroad track ballast layers constructed from angular aggregate 29 particles were determined from laboratory tests as well as Discrete Element Modeling (DEM) 30 simulations to have higher strength properties and thus improved lateral stability when 31 compared to rounded aggregate particles due to better stone on stone contact and aggregate 32 interlock (11). 33
Designing and utilizing different types of aggregate image analyzers have been 34 recognized as a promising method in evaluating aggregate shape properties. However, there 35 are difficulties in implementing this method in the field. These include aggregate sampling in 36 project sites/quarries for shipping to the laboratory, the slow speed of one at a time single 37 particle image scanning/processing and finally the cost needed for building the image 38 analyzer frame and camera mounts. Recently, low cost, high-resolution digital cameras have 39 been available for everyday use by practitioners. A fast, simple, and cost effective procedure 40 using user friendly hardware and software components needs to be developed to facilitate 41 quantifying aggregate shape properties in project sites/quarries using high resolution color 42 images captured by commercially available digital handheld cameras. 43
To analyze individual aggregate particle shape properties, one way is to apply image 44 segmentation techniques to the field-captured images of aggregate samples. Image 45
TRB 2013 Annual Meeting Paper revised from original submittal.
Moaveni, Wang, Hart, Tutumluer, and Ahuja
4
segmentation is the process of partitioning a digital image into multiple sets/classes of pixels 1 (“superpixels”). Each segmented set/class should correspond to a well-defined object or a 2 coherent region in the image. The segmentation results are commonly used to recognize 3 regions and objects of interest in the scene. This aids in subsequent image analysis or 4 annotation (12). There are many approaches for image segmentation (13); they are either 5 completely automatic or are based, to different degrees, on user interaction. 6
A basic technique for image segmentation is “thresholding”. The thresholding 7 technique seeks to find boundaries between different regions in the image according to the 8 difference in intensity/color. Usually, the threshold value(s) are either preset or adaptively 9 (automatically and iteratively) chosen, and are used to partition pixels into different sets 10 based on their intensities/colors (14). Clustering is another widely used technique for image 11 segmentation (15,16). In this technique, a feature vector, which records pertinent information 12 about the pixel such as its spatial coordinates, intensity/color, gradient, and so on, is first 13 generated for each pixel in the image. It is then used as an input to a clustering method (such 14 as k-means) (17). Thus, the image is segmented according to the clusters in the high 15 dimensional feature vector space. Another major technique in image segmentation is region 16 growing (18). This technique begins with a selection of a set of seed pixels by the user. After 17 that, comparison tests are run in order to find pixels bearing similarity to the seed pixels. The 18 process is then iterated until convergence. Region growing techniques provide users with 19 better control of the process and output segmented regions that the users define with clear 20 edges. Graph based approaches are also popular for image segmentation. A graph is 21 constructed where every pixel corresponds to a node and every pair of neighboring pixels is 22 connected by an (weighted) edge. The technique then aims to cut the graph into certain 23 connected components so that the total weight of the edges that are cut is minimal. Many 24 cutting algorithms are suggested in the literature, such as, the graph-cuts algorithm (19) and 25 normalized-cuts algorithm (20). Note that the graph-cut techniques are minimizing an 26 underlying energy/cost functional. There is a multitude of other segmentation techniques that 27 are also based on the minimization of a suitable cost functional. 28
This paper describes aggregate image analysis and segmentation techniques that 29 combines a Markov Random Field (MRF) approach for modeling, graph cut for optimization 30 and user interaction for enforcing hard constraints (21,22). The methodology is intended to 31 demonstrate image acquisition and processing for extraction and analyses of individual 32 aggregate particle size and shape properties from 2-D field images of multi-aggregate 33 samples captured using a Digital Single Lens Reflex (DSLR) camera. A case study involving 34 collected field images of railroad ballast aggregate samples is also used to demonstrate the 35 effectiveness of the field imaging and segmentation approach in producing single aggregate 36 particle images, which are subsequently analyzed for size and shape properties through the 37 use of image processing algorithms of an enhanced, second generation UIAIA. 38
39 40
OBJECTIVE AND SCOPE 41 42 The primary objective of this study is to provide a capability to characterize aggregate size 43 and shape properties by developing a customized machine vision system designed to operate 44 in the field. The scope of initial research tasks described in this paper deals with aggregate 45
TRB 2013 Annual Meeting Paper revised from original submittal.
Moaveni, Wang, Hart, Tutumluer, and Ahuja
5
image acquisition and processing through field imaging and laboratory UIAIA analyses. 1 Field imaging involves capturing color photos of multiple aggregate particles in single 2-D 2 images using a high-resolution DSLR camera. Separate small images of single aggregate 3 particles are then extracted by applying the appropriate segmentation techniques to the field 4 image containing multiple aggregate particles (23,24). The size and shape properties of each 5 particle are subsequently analyzed based on image processing algorithms of an enhanced, 6 second generation UIAIA. 7
8
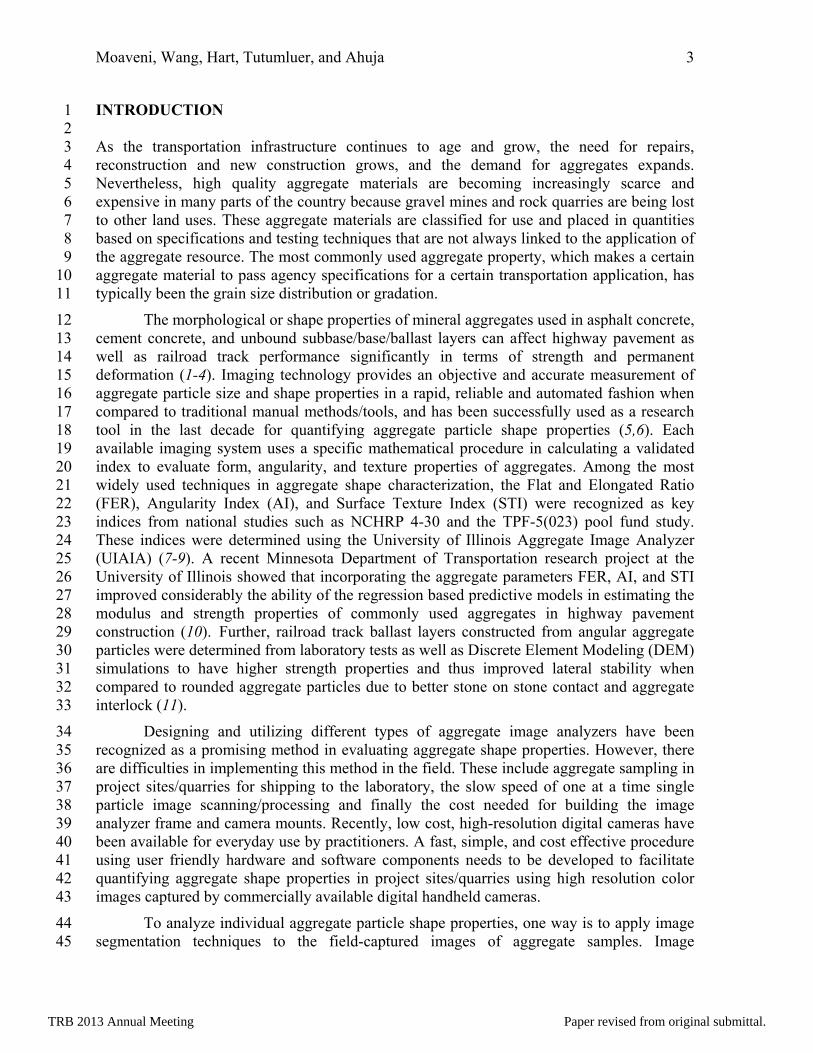
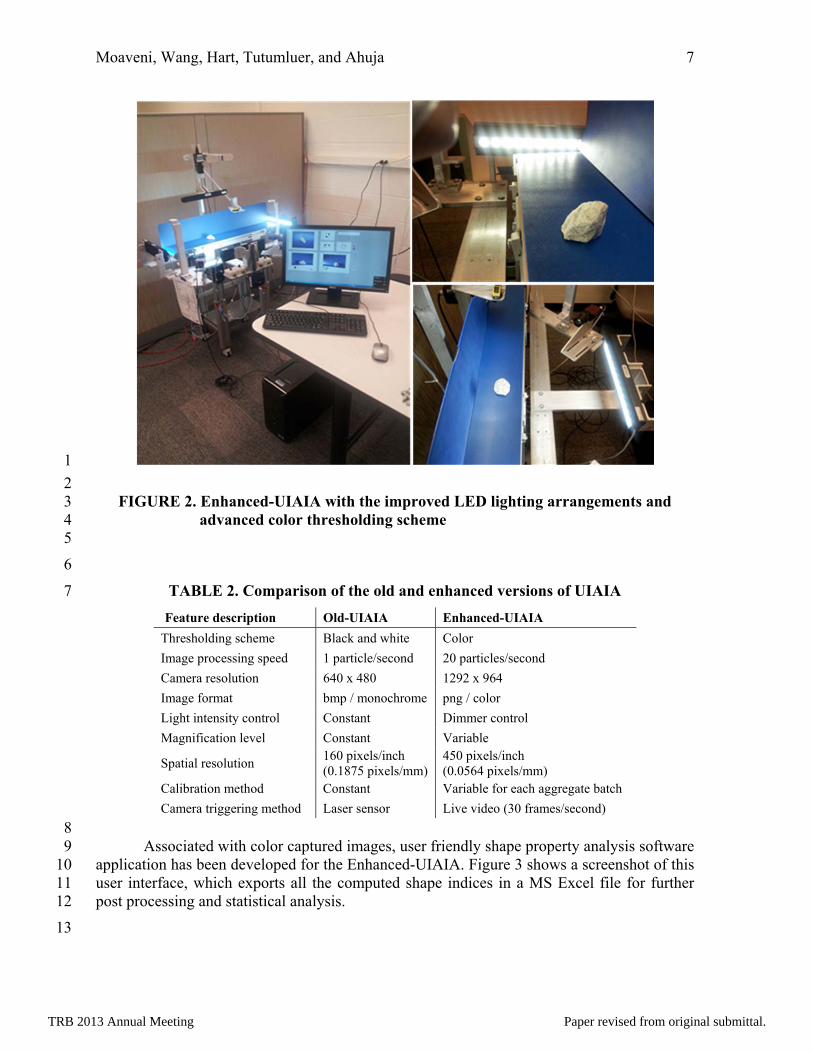
AGGREGATE IMAGE ACQUISITION 9 10 Capturing the images of aggregate samples can be performed either using aggregate image 11 analysis systems such as the UIAIA utilizing one at a time aggregate particle scanning option 12 or a handheld camera that can capture multi-aggregate images. More details about each 13 method are described in this section. 14 15 Procedure for Field Imaging Using DSLR Camera 16 17 This section describes the procedure developed to capture images of aggregate particles out 18 in the field, to enable the desired image processing techniques to perform successfully. Key 19 elements in the capture of the images of aggregate particles under ambient conditions are the 20 following: appropriate contrast between the background and the edge of the particles, proper 21 exposure to avoid having any areas in the image that are overexposed, a specified resolution 22 (pixels/inch), and elimination of any shadows caused by the sun or the camera’s flash; these 23 are necessary in order to successfully perform the segmentation procedure described. A 24 Canon EOS Rebel T1i camera with 15.1-megapixel resolution, Complementary Metal–25 Oxide–Semiconductor (CMOS) sensor technology, and 18-55 mm lens was used in this study 26 (see Figure 1). Camera settings to achieve proper aggregate images are summarized in Table 27 1. Other factors affecting field imaging, such as depth of field and lens distortion, were also 28 addressed for the image acquisition system. 29 30 Enhanced University of Illinois Aggregate Image Analyzer (E-UIAIA) 31 32 Recently, an enhanced, second generation UIAIA has been designed and manufactured at the 33 University of Illinois with many improvements over the old system. Figure 2 illustrates this 34 new system featuring an aggregate particle with three orthogonal views captured using high 35 resolution progressive scan digital color cameras. These views are used to quantify imaging 36 based FER, AI, and STI morphological indices. 37
38
TRB 2013 Annual Meeting Paper revised from original submittal.
Moaveni, Wang, Hart, Tutumluer, and Ahuja
6
1
FIGURE 1. Camera setup developed for aggregate imaging in an outdoor setting 2
(Left: front view of camera and tripod, Right: top view camera screen) 3 4
5
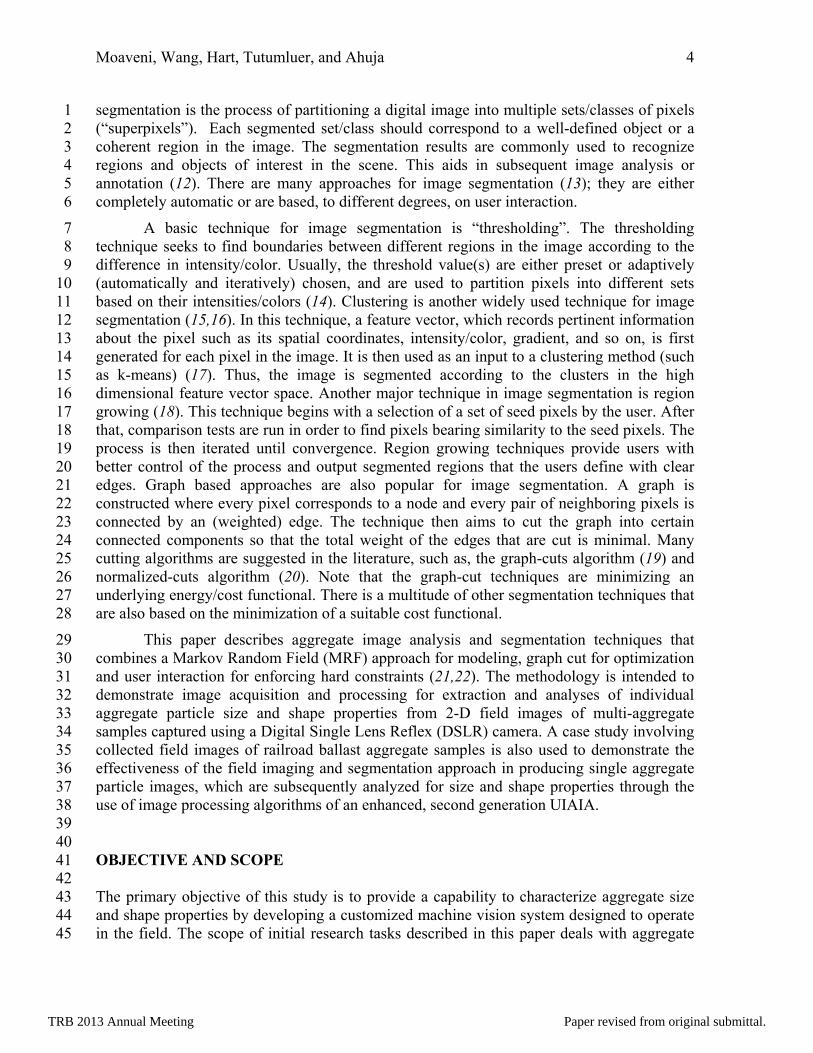
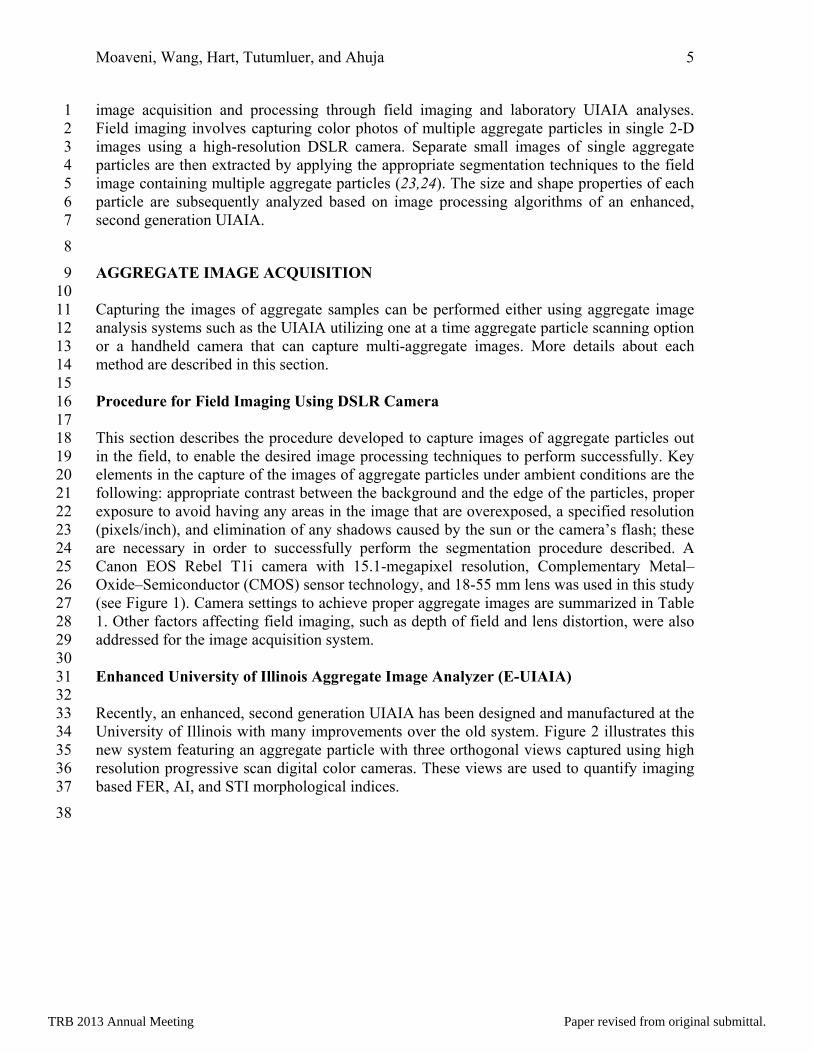
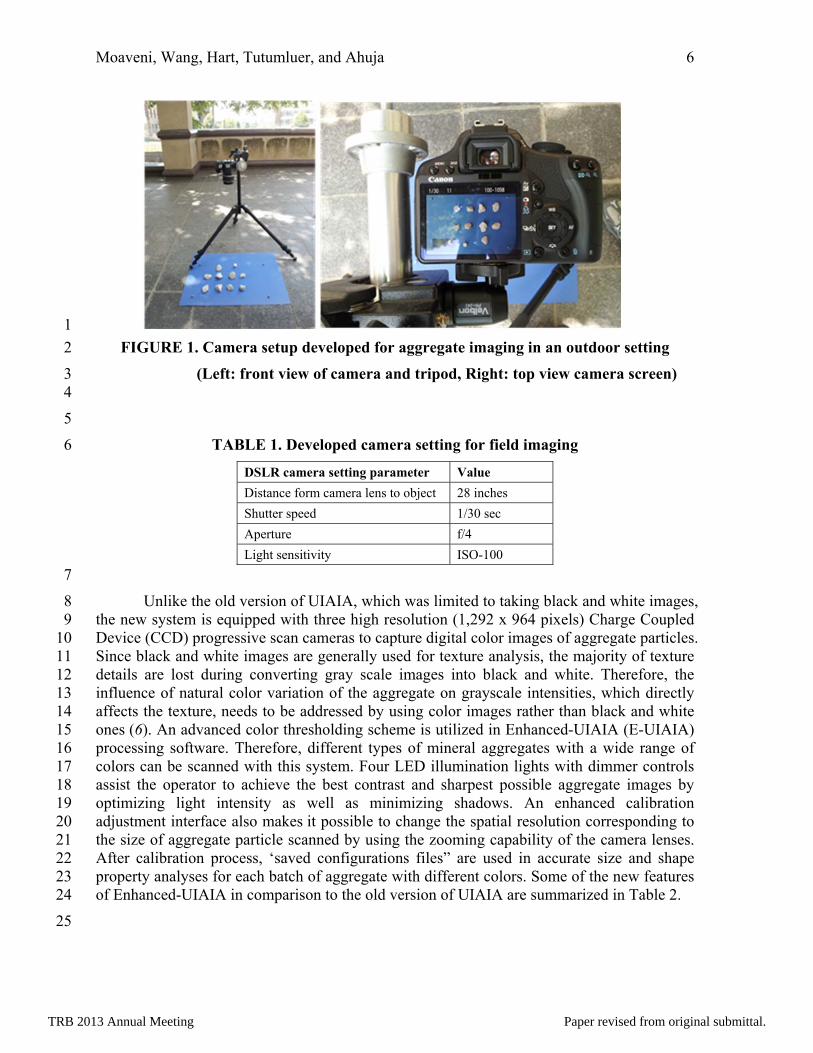
TABLE 1. Developed camera setting for field imaging 6
DSLR camera setting parameter Value
Distance form camera lens to object 28 inches
Shutter speed 1/30 sec
Aperture f/4
Light sensitivity ISO-100
7
Unlike the old version of UIAIA, which was limited to taking black and white images, 8 the new system is equipped with three high resolution (1,292 x 964 pixels) Charge Coupled 9 Device (CCD) progressive scan cameras to capture digital color images of aggregate particles. 10 Since black and white images are generally used for texture analysis, the majority of texture 11 details are lost during converting gray scale images into black and white. Therefore, the 12 influence of natural color variation of the aggregate on grayscale intensities, which directly 13 affects the texture, needs to be addressed by using color images rather than black and white 14 ones (6). An advanced color thresholding scheme is utilized in Enhanced-UIAIA (E-UIAIA) 15 processing software. Therefore, different types of mineral aggregates with a wide range of 16 colors can be scanned with this system. Four LED illumination lights with dimmer controls 17 assist the operator to achieve the best contrast and sharpest possible aggregate images by 18 optimizing light intensity as well as minimizing shadows. An enhanced calibration 19 adjustment interface also makes it possible to change the spatial resolution corresponding to 20 the size of aggregate particle scanned by using the zooming capability of the camera lenses. 21 After calibration process, ‘saved configurations files” are used in accurate size and shape 22 property analyses for each batch of aggregate with different colors. Some of the new features 23 of Enhanced-UIAIA in comparison to the old version of UIAIA are summarized in Table 2. 24
25
TRB 2013 Annual Meeting Paper revised from original submittal.
Moaveni, Wang, Hart, Tutumluer, and Ahuja
7
1
2 FIGURE 2. Enhanced-UIAIA with the improved LED lighting arrangements and 3
advanced color thresholding scheme 4 5
6
TABLE 2. Comparison of the old and enhanced versions of UIAIA 7
Feature description Old-UIAIA Enhanced-UIAIA
Thresholding scheme Black and white Color
Image processing speed 1 particle/second 20 particles/second
Camera resolution 640 x 480 1292 x 964
Image format bmp / monochrome png / color
Light intensity control Constant Dimmer control
Magnification level Constant Variable
Spatial resolution 160 pixels/inch (0.1875 pixels/mm)
450 pixels/inch (0.0564 pixels/mm)
Calibration method Constant Variable for each aggregate batch
Camera triggering method Laser sensor Live video (30 frames/second)
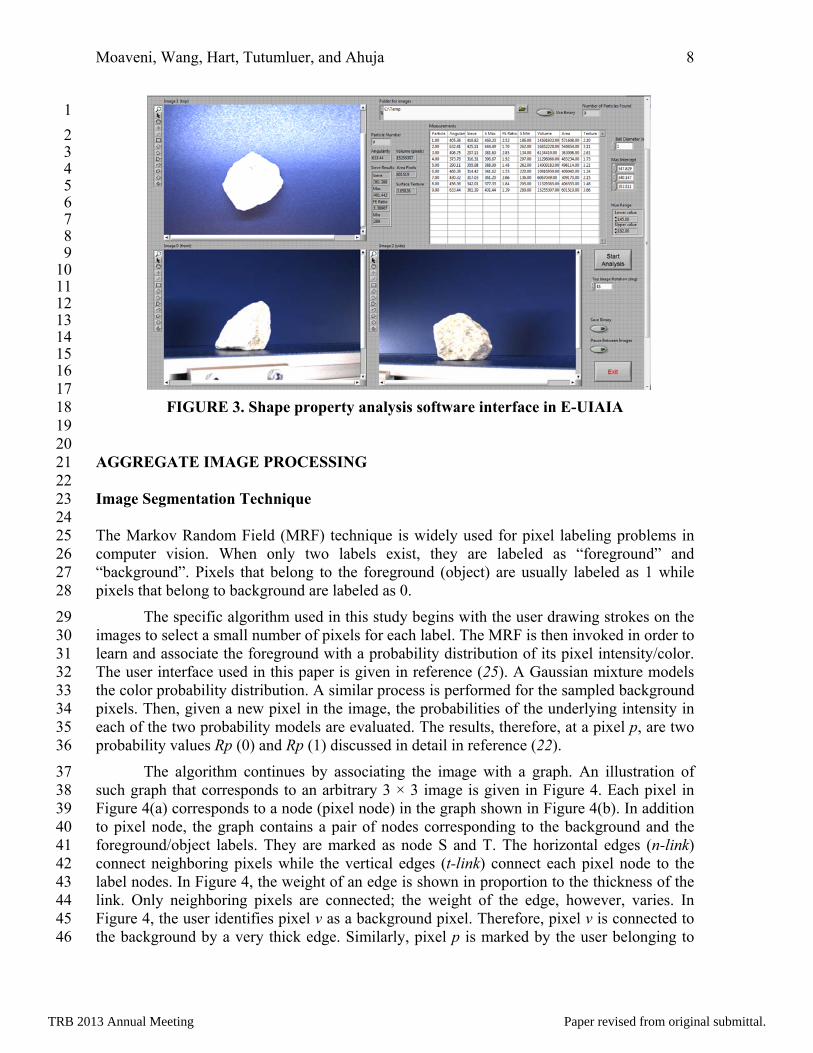
8 Associated with color captured images, user friendly shape property analysis software 9
application has been developed for the Enhanced-UIAIA. Figure 3 shows a screenshot of this 10 user interface, which exports all the computed shape indices in a MS Excel file for further 11 post processing and statistical analysis. 12
13
TRB 2013 Annual Meeting Paper revised from original submittal.
Moaveni, Wang, Hart, Tutumluer, and Ahuja
8
1
2 3 4 5 6 7 8 9 10 11 12 13 14 15 16
17 FIGURE 3. Shape property analysis software interface in E-UIAIA 18
19 20 AGGREGATE IMAGE PROCESSING 21 22 Image Segmentation Technique 23 24 The Markov Random Field (MRF) technique is widely used for pixel labeling problems in 25 computer vision. When only two labels exist, they are labeled as “foreground” and 26 “background”. Pixels that belong to the foreground (object) are usually labeled as 1 while 27 pixels that belong to background are labeled as 0. 28
The specific algorithm used in this study begins with the user drawing strokes on the 29 images to select a small number of pixels for each label. The MRF is then invoked in order to 30 learn and associate the foreground with a probability distribution of its pixel intensity/color. 31 The user interface used in this paper is given in reference (25). A Gaussian mixture models 32 the color probability distribution. A similar process is performed for the sampled background 33 pixels. Then, given a new pixel in the image, the probabilities of the underlying intensity in 34 each of the two probability models are evaluated. The results, therefore, at a pixel p, are two 35 probability values Rp (0) and Rp (1) discussed in detail in reference (22). 36
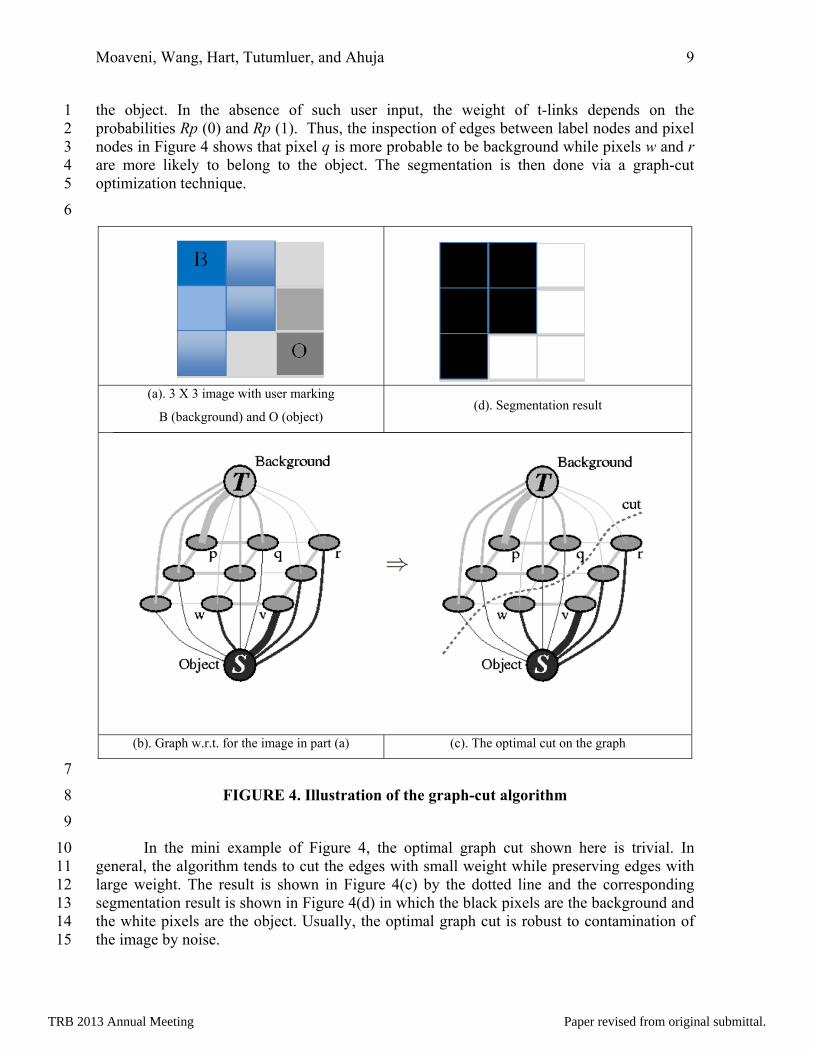
The algorithm continues by associating the image with a graph. An illustration of 37 such graph that corresponds to an arbitrary 3 × 3 image is given in Figure 4. Each pixel in 38 Figure 4(a) corresponds to a node (pixel node) in the graph shown in Figure 4(b). In addition 39 to pixel node, the graph contains a pair of nodes corresponding to the background and the 40 foreground/object labels. They are marked as node S and T. The horizontal edges (n-link) 41 connect neighboring pixels while the vertical edges (t-link) connect each pixel node to the 42 label nodes. In Figure 4, the weight of an edge is shown in proportion to the thickness of the 43 link. Only neighboring pixels are connected; the weight of the edge, however, varies. In 44 Figure 4, the user identifies pixel v as a background pixel. Therefore, pixel v is connected to 45 the background by a very thick edge. Similarly, pixel p is marked by the user belonging to 46
TRB 2013 Annual Meeting Paper revised from original submittal.
Moaveni, Wang, Hart, Tutumluer, and Ahuja
9
the object. In the absence of such user input, the weight of t-links depends on the 1 probabilities Rp (0) and Rp (1). Thus, the inspection of edges between label nodes and pixel 2 nodes in Figure 4 shows that pixel q is more probable to be background while pixels w and r 3 are more likely to belong to the object. The segmentation is then done via a graph-cut 4 optimization technique. 5
6
(a). 3 X 3 image with user marking
B (background) and O (object) (d). Segmentation result
(b). Graph w.r.t. for the image in part (a) (c). The optimal cut on the graph
7
FIGURE 4. Illustration of the graph-cut algorithm 8
9
In the mini example of Figure 4, the optimal graph cut shown here is trivial. In 10 general, the algorithm tends to cut the edges with small weight while preserving edges with 11 large weight. The result is shown in Figure 4(c) by the dotted line and the corresponding 12 segmentation result is shown in Figure 4(d) in which the black pixels are the background and 13 the white pixels are the object. Usually, the optimal graph cut is robust to contamination of 14 the image by noise. 15
O
B
TRB 2013 Annual Meeting Paper revised from original submittal.

Moaveni, Wang, Hart, Tutumluer, and Ahuja
10
Naturally, the selection of this algorithm is guided by considering several factors, 1 such as the color of the pixels in the aggregate images, to distinguish between foreground 2 (particles) and background. The color of the foreground is to some extent uniform and at the 3 same time distinct from the background. Additionally, enforcing neighborhood constraints 4 makes sure that the foreground particles are solid and their shape is not sensitive to 5 acquisition noise. 6
Once the image is segmented into foreground and background regions, the connected 7 components of the foreground need to be determined. Each such connected component is a 8 single particle or a small cluster of particles. The algorithm examines each row in the image 9 and finds the intervals of foreground pixels and cluster intervals from adjacent rows. Each 10 cluster is hence a connected component thus corresponds to a single particle. An illustration 11 of the process is depicted in Figure 5 for different color coarse aggregate particles segmented 12 individually into smaller single-particle images. 13 14
Aggregate image
capturing
Background and particle
detection
Gray scale image
Thresholding
Particle segmentation & extraction
15
FIGURE 5. Illustration of segmentation technique for particle detection and 16
binary image generation 17
TRB 2013 Annual Meeting Paper revised from original submittal.
Moaveni, Wang, Hart, Tutumluer, and Ahuja
11
University of Illinois Aggregate Image Processing Algorithms 1 2
The newly Enhanced-UIAIA system uses the binary images of aggregates to measure 3 imaging indices including Flat and Elongated Ratio (FER), Angularity Index (AI), and 4 Surface Textures Index (STI). This section gives details about the algorithms involved in 5 computing these indices. 6 7
Flat and Elongated Ratio (FER) 8
According to ASTM D 4791 (26), the FER of an aggregate particle is defined as the ratio of 9 the maximum dimension of the particle to the minimum dimension. Using the three views, 10 the longest dimension and shortest dimension are determined for each particle tested. After a 11 suitable number of particles are tested, the FER values are averaged for a certain aggregate 12 sample (7). 13 14
Angularity Index (AI) 15
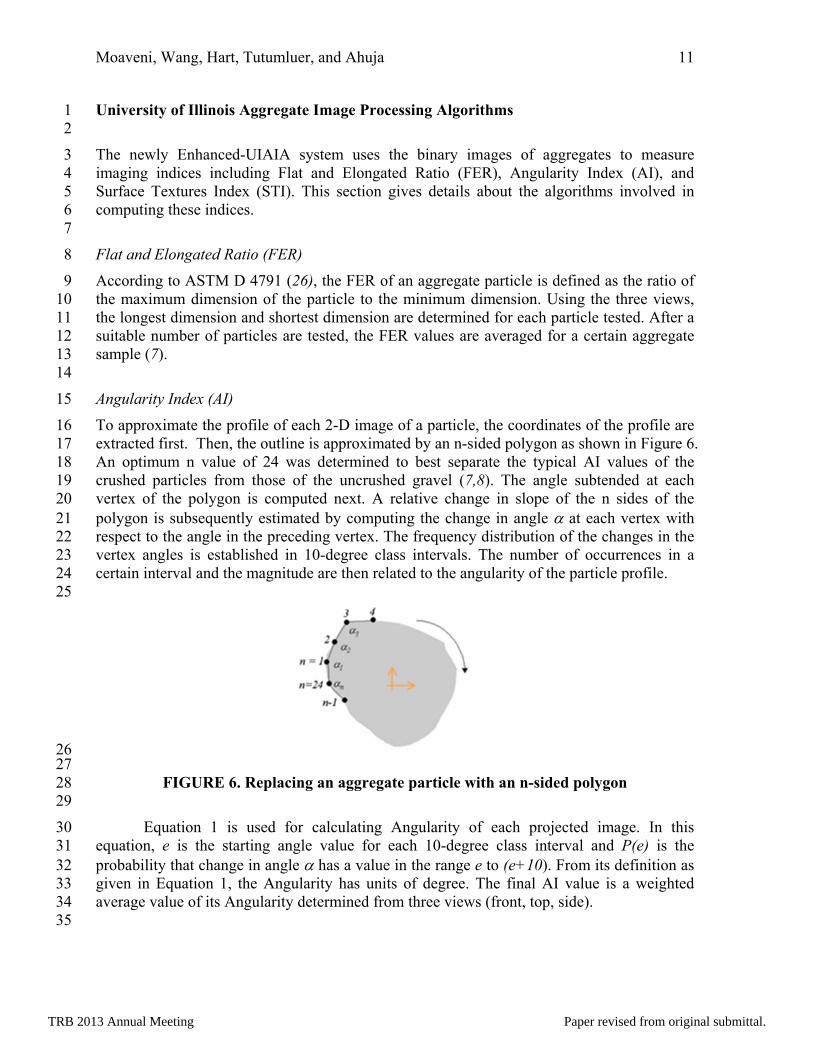
To approximate the profile of each 2-D image of a particle, the coordinates of the profile are 16 extracted first. Then, the outline is approximated by an n-sided polygon as shown in Figure 6. 17 An optimum n value of 24 was determined to best separate the typical AI values of the 18 crushed particles from those of the uncrushed gravel (7,8). The angle subtended at each 19 vertex of the polygon is computed next. A relative change in slope of the n sides of the 20 polygon is subsequently estimated by computing the change in angle at each vertex with 21 respect to the angle in the preceding vertex. The frequency distribution of the changes in the 22 vertex angles is established in 10-degree class intervals. The number of occurrences in a 23 certain interval and the magnitude are then related to the angularity of the particle profile. 24 25
26 27
FIGURE 6. Replacing an aggregate particle with an n-sided polygon 28 29
Equation 1 is used for calculating Angularity of each projected image. In this 30 equation, e is the starting angle value for each 10-degree class interval and P(e) is the 31 probability that change in angle has a value in the range e to (e+10). From its definition as 32 given in Equation 1, the Angularity has units of degree. The final AI value is a weighted 33 average value of its Angularity determined from three views (front, top, side). 34 35
TRB 2013 Annual Meeting Paper revised from original submittal.

Moaveni, Wang, Hart, Tutumluer, and Ahuja
12
(1) 1
2
Surface Texture Index (STI) 3
The STI is defined based on the image analysis technique “erosion and dilation.” One erosion 4 cycle processes each 2-D image by removing boundary pixels off an object surface to leave 5 the object less dense along its outer boundary. However, dilation is the reverse process of 6 erosion and a single dilation cycle increases the particle shape or image dimension by the 7 same pixels around its boundary. Erosion cycles followed by the same number of dilation 8 cycles tend to smooth the surface of a particle by trimming the peaks and corners and 9 patching the sharp dents on the boundary. The imaging pixel count based area difference of 10 the 2-D image before and after the erosion and dilation cycles of the same number of cycles 11 is directly related to the surface micro-irregularities (9). Equation 2 defines the STI for each 12 particle image. 13
(2) 14
where 15
STI = Surface texture parameter of the 2-D image of particle; 16
A1 =Area (in pixels) of the 2-D image of particle; 17
A2 = Area (in pixels) of the particle after performing a sequence of “n” cycles of 18 erosion followed by “n” cycles of dilation. 19
20
To set up an STI index independent of particle size, the optimum number of cycles of 21 erosion and dilation, n, to be applied can be obtained as follows: 22
23
(3) 24
where 25
L = Longest or maximum intercept of a particle in image; 26
= Scaling factor for erosion and dilation operations. 27
28
The optimal n value is determined as 20 at which STI of a set of smooth surface 29 coarse aggregate is recognized as significantly separated from the STI of a set of rough 30 surface coarse aggregate (9). The final STI value is a weighted average value of its individual 31 image STI values determined from three views (front, top, side images). 32
33
170
0
)(,e
ePeAAngularity
STI A1 A2
A1
100
Ln
TRB 2013 Annual Meeting Paper revised from original submittal.

Moaveni, Wang, Hart, Tutumluer, and Ahuja
13
Performance of Color Thresholding Feature in Enhanced-UIAIA 1
In the new Enhanced-UAIAI, 24 bits/pixel color images of aggregates are used as an input 2 for the color thresholding algorithm. The performance of Enhanced-UIAIA in determining 3 the size and shape property indices, i.e., FER, AI and STI, is demonstrated by the image 4 processing and analysis stages applied on different colored aggregates in Table 3. For 5 example, the black and gray colored aggregates with much higher AI and STI values in Table 6 3 were successfully analyzed using the E-UIAIA system. 7
8
TABLE 3. Shape property analyses for aggregates with different colors using E-UIAIA 9
Aggregate Image
Aggregate color
Pink Gray Light brown White Black
Binary Image
AI 350 620 380 510 690
FER 1.51 1.2 1.56 1.18 1.2
STI 1.29 2.08 1.67 1.2 2.4
10
CASE STUDY AND DISCUSSION 11 12
Each year, a large portion of the US freight railroad operating budget, to sustain the railway 13 track system, goes into maintenance and renewal of mineral aggregates used as track ballast. 14 These large sized aggregates; with a maximum size of 3 in., are used as the ballast layer in 15 the track substructure, which distributes the train load to the subgrade soil and also provides 16 drainage for the track with its uniform gradation. Unlike subbase/base layers in pavement 17 structures, ballast aggregates tend to break down, powder and deteriorate under many 18 repeated wheel loadings from heavy freight trains. This ballast degradation not only reduces 19 particle sizes but also changes the physical shape properties of aggregate particles, resulting 20 in accumulation of finer material causing ballast fouling. The intensity of the ballast 21 degradation is a function of aggregate source properties, load levels, as well as track 22 geometry and environmental conditions. Fast and reliable field ballast assessment methods 23 using machine vision and image processing techniques are needed to monitor changes in 24 ballast properties. 25
To evaluate the performance of the field imaging and segmentation methods 26 developed in this study, aggregate samples were collected at different ballast depths from a 27 mainline freight railroad in Mississippi. Figure 7(a) shows the aggregate samples collected at 28
TRB 2013 Annual Meeting Paper revised from original submittal.
Moaveni, Wang, Hart, Tutumluer, and Ahuja
14
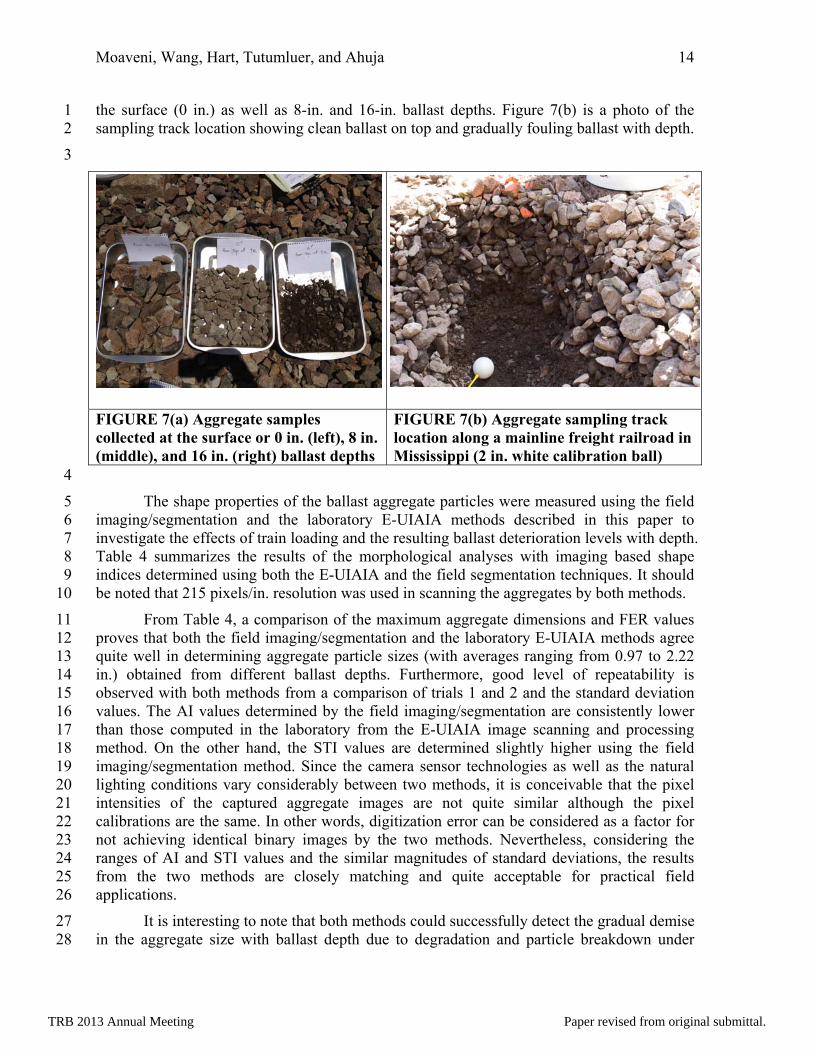
the surface (0 in.) as well as 8-in. and 16-in. ballast depths. Figure 7(b) is a photo of the 1 sampling track location showing clean ballast on top and gradually fouling ballast with depth. 2
3
FIGURE 7(a) Aggregate samples collected at the surface or 0 in. (left), 8 in. (middle), and 16 in. (right) ballast depths
FIGURE 7(b) Aggregate sampling track location along a mainline freight railroad in Mississippi (2 in. white calibration ball)
4
The shape properties of the ballast aggregate particles were measured using the field 5 imaging/segmentation and the laboratory E-UIAIA methods described in this paper to 6 investigate the effects of train loading and the resulting ballast deterioration levels with depth. 7 Table 4 summarizes the results of the morphological analyses with imaging based shape 8 indices determined using both the E-UIAIA and the field segmentation techniques. It should 9 be noted that 215 pixels/in. resolution was used in scanning the aggregates by both methods. 10
From Table 4, a comparison of the maximum aggregate dimensions and FER values 11 proves that both the field imaging/segmentation and the laboratory E-UIAIA methods agree 12 quite well in determining aggregate particle sizes (with averages ranging from 0.97 to 2.22 13 in.) obtained from different ballast depths. Furthermore, good level of repeatability is 14 observed with both methods from a comparison of trials 1 and 2 and the standard deviation 15 values. The AI values determined by the field imaging/segmentation are consistently lower 16 than those computed in the laboratory from the E-UIAIA image scanning and processing 17 method. On the other hand, the STI values are determined slightly higher using the field 18 imaging/segmentation method. Since the camera sensor technologies as well as the natural 19 lighting conditions vary considerably between two methods, it is conceivable that the pixel 20 intensities of the captured aggregate images are not quite similar although the pixel 21 calibrations are the same. In other words, digitization error can be considered as a factor for 22 not achieving identical binary images by the two methods. Nevertheless, considering the 23 ranges of AI and STI values and the similar magnitudes of standard deviations, the results 24 from the two methods are closely matching and quite acceptable for practical field 25 applications. 26
It is interesting to note that both methods could successfully detect the gradual demise 27 in the aggregate size with ballast depth due to degradation and particle breakdown under 28
TRB 2013 Annual Meeting Paper revised from original submittal.

Moaveni, Wang, Hart, Tutumluer, and Ahuja
15
repeated train loading. This is with the understanding that old ballast, which is more 1 degraded and broken down, is found in deeper sublayers. The particles sampled from the 8 in. 2 depth have slightly higher FER values as determined by the two methods. The FER values 3 also match closely between the two methods due to the same pixel resolution used. For both 4 methods, the measured AI and STI values indicate somewhat increasing trends with ballast 5 depth, which can be explained with the size reduction and breakage of older ballast under 6 train loading. Interestingly, as the aggregate size gets smaller with depth, these more recently 7 crushed particles at greater depths possess higher angularities and rougher surfaces. 8
9 TABLE 4. Ballast aggregate shape indices computed from E-UIAIA in the laboratory 10
and field imaging/segmentation 11
E-UIAIA
Trial 1
AI (degrees) Max dimension (in.) FER STI Depth (in.)
No. of particles
Average Std. Dev.
Average Std. Dev.
Average Std. Dev.
Average Std. Dev.
0 34 420 112 2.19 0.55 1.37 0.16 1.44 0.63
8 54 438 116 1.29 0.37 1.42 0.2 1.8 0.64
16 42 432 108 0.96 0.33 1.38 0.24 1.91 0.56
E-UIAIA
Trial 2
AI (degrees) Max dimension (in.) FER STI Depth (in.)
No. of particles
Average Std. Dev.
Average Std. Dev.
Average Std. Dev.
Average Std. Dev.
0 34 421 125 2.2 0.54 1.3 0.15 1.43 0.55
8 54 459 120 1.28 0.35 1.43 0.18 1.79 0.66
16 42 468 114 0.97 0.32 1.39 0.25 2.05 0.68
DSLR Camera and Segmentation
Trial 1
AI (degrees) Max dimension (in.) FER STI Depth (in.)
No. of particles
Average Std. Dev.
Average Std. Dev.
Average Std. Dev.
Average Std. Dev.
0 34 385 77 2.22 0.6 1.32 0.16 2.03 0.39
8 54 417 108 1.41 0.38 1.4 0.27 2.88 0.82
16 42 435 119 1.07 0.39 1.35 0.19 3.54 1.06
DSLR Camera and Segmentation
Trial 2
AI (degrees) Max dimension (in.) FER STI Depth (in.)
No. of particles
Average Std. Dev.
Average Std. Dev.
Average Std. Dev.
Average Std. Dev.
0 34 379 81.4 2.21 0.56 1.31 0.13 2.06 0.4
8 54 402 105 1.4 0.39 1.44 0.3 2.9 0.9
16 42 441 97 1.03 0.36 1.32 0.19 3.63 1.09
12
TRB 2013 Annual Meeting Paper revised from original submittal.
Moaveni, Wang, Hart, Tutumluer, and Ahuja
16
SUMMARY AND CONCLUSIONS 1 2 Aggregate image processing/segmentation techniques have been developed and used in this 3 study to analyze the 2-D images of aggregate samples captured by a commonly used DSLR 4 camera in the field for extraction and analyses of individual aggregate particle size and shape 5 properties. The segmented individual particle images were fed into the validated University 6 of Illinois Aggregate Image Analyzer (UIAIA) processing algorithms to compute particle 7 size and shape properties using the imaging based indices of Flat and Elongated Ratio (FER), 8 Angularity Index (AI), and Surface Texture Index (STI). An enhanced, second generation 9 UIAIA was also introduced in this paper with many improvements over the old system. The 10 Enhanced-UIAIA uses high resolution aggregate color images, similar high resolution to 11 those obtained from the DSLR camera, captured from three orthogonal views using 12 progressive scan digital color cameras with improved lighting conditions and advanced color 13 thresholding schemes to quantify imaging based aggregate size and FER, AI, and STI 14 morphological indices. 15
The performance of field imaging and segmentation methodology was evaluated by 16 means of a case study involving field images of railroad aggregate samples collected from 17 various ballast depths in a mainline freight railroad track. The results of ballast aggregate size 18 and morphological analyses, i.e., the computed imaging based size and shape indices, using 19 both the laboratory Enhanced-UIAIA and the field imaging/segmentation methods matched 20 quite closely. Further, both methods could successfully detect the gradual decrease in the 21 aggregate size due to higher degradation and particle breakdown with ballast depth as 22 evidenced by higher AI and STI values measured at greater depths. These promising 23 preliminary results therefore indicate that these imaging and segmentation techniques can be 24 considered in the field to rapidly and reliably capture several aggregate particles in a single 25 image so that individual particle size and shape properties can be analyzed and further, both 26 spatial property variability and property changes with layer depth and usage, i.e., property 27 degradation in time, can be evaluated under service loading. 28
Future research will be directed towards establishing more validation cases involving 29 statistical analyses with different ranges of size and shape property indices for different types 30 of aggregate using both the field imaging/segmentation and laboratory E-UIAIA methods. 31 Future successful applications of the developed field imaging/segmentation methodology 32 hold the potential to provide optimized aggregate resource selection/utilization, better 33 aggregate quality control/quality assurance, improved material specifications, and associated 34 significant economic benefits for a sustainable construction and renewal of transportation 35 infrastructure. 36
37 38
ACKNOWLEDGEMENT 39 40 The support for this research study was provided partially by the Association of American 41 Railroads (AAR) and the BNSF Railway Company. The authors would like to acknowledge 42 the help and advice of David Davis with Transportation Technology Center, Inc. (TTCI) and 43 Henry Lees with BNSF Railway. The authors would like to thank Dr. Bruce Ammons from 44 Ammons Engineering for his assistance in LabView programing. Special thanks go to 45
TRB 2013 Annual Meeting Paper revised from original submittal.
Moaveni, Wang, Hart, Tutumluer, and Ahuja
17
Mr. Dong Zhang, a visiting PhD student from Southeast University in China, for his help 1 during the railroad field trip for aggregate sampling in Mississippi. 2
3
REFERENCES 4 5
1. Kandhal, P.S. and Parker, J.F. Aggregate Tests Related to Asphalt Concrete Performance 6 in Pavements. National Cooperative Highway Research Program Report 405, TRB, 7 National Research Council, Washington, D.C., 1998. 8
2. Meininger, R.C. Aggregate Tests Related to Performance of Portland Cement Concrete 9 Pavement. National Cooperative Highway Research Program Project 4-20, TRB, 10 National Research Council, Washington, D.C. 1998. 11
3. Tutumluer, E. and Pan, T. Aggregate Morphology Affecting Strength and Permanent 12 Deformation Behavior of Unbound Aggregate Materials. Journal of Materials in Civil 13 Engineering, Vol. 20, No. 9, pp. 617-627, September 2008. 14
4. Selig, E.T. and Waters J.M. Track Geotechnology and Substructure Management. 15 Thomas Telford Publications, London, pp. 7.19, 2000. 16
5. Tutumluer, E., Pan, T., and Carpenter, S.H. Investigation of Aggregate Shape Effects on 17 Hot Mix Asphalt Performance Using an Image Analysis Approach. Transportation 18 Pooled Fund Study TPF-5 (023), Federal Highway Administration, University of Illinois, 19 Urbana, Illinois, February 2005. 20
6. Al-Rousan, T., Masad, E., Tutumluer, E., and Pan, T. Evaluation of Image Analysis 21 Techniques for Quantifying Aggregate Shape Characteristics. Journal of Construction 22 and Building Materials, Vol. 21, pp. 978-990, 2007. 23
7. Tutumluer, E., Rao, C., and Stefanski, J.A. Video Image Analysis of Aggregates. Final 24 Project Report, FHWA-IL-UI-278, Civil Engineering Studies UILU-ENG-2000-2015, 25 University of Illinois Urbana-Champaign, Urbana, Illinois, 2000. 26
8. Rao, C., Tutumluer, E., and Kim, I.T. Quantification of Coarse Aggregate Angularity 27 based on Image Analysis. Transportation Research Record 1787, TRB, National 28 Research Council, Washington, D.C., pp. 117-124, 2002. 29
9. Pan, T., Tutumluer, E., and Anochie-Boateng, J. Aggregate Morphology Affecting 30 Resilient Behavior of Unbound Granular Materials. Transportation Research Record 31 1952, TRB, National Research Council, Washington, D.C., pp. 12-20, 2006. 32
10. Xiao, Y., Tutumluer, E., and Siekmeier, J. Resilient Modulus Behavior Estimated from 33 Aggregate Source Properties. In Proceedings of the Geo-Frontiers 2011 Conference, 34 Dallas, Texas March 13-16, 2011. 35
11. Huang, H. Discrete Element Modeling of Railroad Ballast Using Imaging Based 36 Aggregate Morphology Characterization. PhD Dissertation, University of Illinois at 37 Urbana Champaign, pp 3-5, 2009. 38
12. Shapiro, L.G., Stockman, G.C. Computer Vision. Prentice Hall, New Jersey, pp. 279-281, 39 2001. 40
13. Akbas, E., Generation and Analysis of Segmentation Trees for Natural Images. PhD 41 Dissertation, University of Illinois at Urbana Champaign, pp 9-11, 2011. 42
14. Sahoo, P.K., Soltani, S and Wong, A.K.C, A Survey of Thresholding Techniques, 43 Computer Vision, Graphics, and Image Processing, Vol. 41, pp 233-260, 1988. 44
TRB 2013 Annual Meeting Paper revised from original submittal.

Moaveni, Wang, Hart, Tutumluer, and Ahuja
18
15. Carson, C., Belongie, S., Greenspan, H., Malik and J., Blobword: Image Segmentation 1 using Expectation-miximization and Its Application to Image Querying. IEEE Trans. 2 Pattern Analysis and Machine Intelligence, Vol. 24, No. 8, pp. 1026-1038, 2002. 3
16. Comaniciu, D., Meer, P., Mean Shift: A Robust Approach toward Feature Space 4 Analysis. IEEE Trans. Pattern Analysis and Machine Intelligence, Vol. 24, No. 5, pp. 5 603-619, 2002. 6
17. Forsyth, D.A., Ponce, J. Computer Vision: A modern Approach. Prentice Hall, New 7 Jersey, 2002. 8
18. Adams, R., Bischof, L. Seeded Region Growing. IEEE Trans. Pattern Analysis and 9 Machine Intelligence, Vol. 16, No. 6, pp. 641-647, 1994. 10
19. Zabih. R, Kolmogorov, V. Spatially Coherent Clustering Using Graph Cuts. In 11 Proceedings of Computer Vision and Pattern Recognition (CVPR), Washington D.C., 12 June 2004. 13
20. Shi, J, Malik, J. Normalized Cuts and Image Segmentation. IEEE Trans. Pattern Analysis 14 and Machine Intelligence, Vol. 22, No. 8, pp. 888-905, 2000. 15
21. Li, S.Z. Markov Random Field Models in Computer Vision. In Proceedings of the 16 European Conference on Computer Vision, Vol. B, pp. 361-370, Stockholm, Sweden, 17 May, 1994. 18
22. Boykov, Y.Y, Jolly, M.P. Interactive Graph Cuts for Optimal Boundary & Region 19 Segmentation of Objects in N-D Images. In Proceedings of International Conference on 20 Computer Vision, Vancouver, Canada, July, 2001. 21
23. Ahuja, N. A Transform for Multi-scale Image Segmentation by Integrated Edge and 22 Region Detection. IEEE Trans. Pattern Analysis and Machine Intelligence, Vol. 18, No. 23 12, pp. 1211-1235, 1996. 24
24. Akbas, E., Ahuja, N. From Ramp Discontinuities to Segmentation Tree. In Proceedings 25 of the 9th Asian Conference on Computer Vision (ACCV), Xi’an, China, September 26 2009. 27
25. Neo imaging. www.neoimaging.cn 28 26. ASTM D 4791-10. Standard Test Method For Flat Particles, Elongated Particles, or Flat 29
and Elongated Particles in Coarse Aggregate. Annual Book of ASTM Standards, 2010. 30 31
TRB 2013 Annual Meeting Paper revised from original submittal.