Embed Size (px)
Citation preview
S1
Electronic Supplementary Information (ESI)
Aggregation-induced emission enhancement based on
11,11,12,12,-tetracyano-9,10-anthraquinodimethane
Jie Liu,ab Qing Meng,a Xiaotao Zhang,a Xiuqiang Lu,a Ping He,ab Lang Jiang,a Huanli Dong*a and
Wenping Hu*a
a. Beijing National Laboratory for Molecular Science, Key Laboratory of Organic Solids, Institute of
Chemistry, Chinese Academy of Sciences, Beijing 100190, China.
b. Graduate School of the Chinese Academy of Sciences, Beijing 100190, China.
*Correspondence: [email protected]; [email protected]
Table of Contents
Experimental Section. (S2-4)
Figure S1.1H and 13C NMR spectra of the compounds in CDCl3. (S5-7)
Figure S2. Photoluminescence spectra of TCAQ upon increasing water content. (S8)
Figure S3. Photoluminescence spectra of dP-TCAQ in different water/solvent (v/v) mixtures. (S8)
Figure S4. SEM captures of dP-TCAQ aggregates in different aqueous solutions. (S9)
Figure S5. Photos of the spot of dP-TCAQ on the TLC plate toward solvent fumigation. (S9)
Table S1. Crystal data and structure refinement for dP-TCAQ (CCDC905986) (S10)
Figure S6. (A) packing mode and short contacts in TCAQ and (B) packing mode and short contacts
in dP-TCAQ. (S11)
Reference (S11)
Electronic Supplementary Material (ESI) for Chemical CommunicationsThis journal is © The Royal Society of Chemistry 2013
S2
Experimental Section
Materials and Instrumentations
All reagents were used as received from commercial resources unless otherwise specified.
1H and 13C NMR spectra were recorded using a Bruker ADVANCE 400 NMR Spectrometer. 1H
NMR spectra were referenced to CDCl3 (7.26 ppm) and 13C NMR spectra were referenced to CDCl3
solvent (77.36 ppm). UV-vis absorption spectra were measured with Hitachi (model U-3010) UV-Vis
spectrophotometer in a 1-cm quartz cell. Photoluminescence (PL) spectra were recorded on a
Perkin-Elmer LS 55 spectrofluorometer. Absolute quantum yield measurement (LabSphere®,
FluoroMax-4, HORIBA Jobin Yvon, PLQY software package) was used for powder sample. In this
experimental setup, it is possible to measure the Photoluminescence Quantum Yields (PLQY) via
using the integrating sphere in combination with a commercial fluorimeter. Emission spectrum
including the scattering region of excitation light were measured for both blank and test samples, and
these spectra were corrected with instrumental factors to calculate the quantum yield.1
High-quality single crystals of dP-TCAQ were grown from a CH2Cl2/ethanol (1:1) mixture at room
temperature. X-ray diffraction intensity data were collected at 173 K on a Saturn724 + CCD
diffractometer with graphite monochromated Mo K\α radiation. And the structure and refinement
were carried out using the Crystal Clear (Rigaku Inc., 2008).
SEM images were taken by using SEM (Hitachi S-4300 SE).
Synthesis of dP-TCAQ
The dP-TCAQ was prepared according to the synthetic route shown in Scheme 1.
The synthesis of 2,6-diiodoanthracene-9,10-dione was carried out according to a modified
procedure from a previously reported synthesis.2 To a 100 mL flask was added 1.005g start material
(4.22 mmol), actonitrile (30 mL) and hydrochloric acid (10 mL 2.4 M), the suspension was cooled to
0 �. Sodium nitrite (10.1 mmol, 694 mg ) was dissolved in 2 mL water, then slowing dropped into
the former suspension. The whole process was taken at 0 � in an ice bath. After 30 min stirring, KI
(21.4mmol, dissolved in 5 mL water) was added. Then it was allowed to warm up to room
temperature, stirring for an hour and then heat to 60 � for another hour. The crude product was get by
filtration, then washed with water and methanol. The filtrate was collected to suspend in CH2Cl2(40
mL), filtrated again, washed with CH2Cl2, dried in vacuum afford a light brown compound 1.224 g
(63% yield). 1H-NMR (400 MHz, 298 K) δ (CDCl3, ppm): 8.64 (s, 2H), 8.17 (d, J = 8 Hz, 2H), 7.98
Electronic Supplementary Material (ESI) for Chemical CommunicationsThis journal is © The Royal Society of Chemistry 2013

S3
(d, J = 8 Hz, 2H). MS (EI) m/z: 459 (M+).
2,6-diphenylanthracene-9,10-dione was synthesized by Suzuki coupling reaction. To a 100 mL
flask, 460 mg (1 mmol) 2,6-diiodoanthracene-9,10-dione, 268 mg (2.2 mmol) phenylo boric acid and
Pd(PPh3)4 63 mg (0.05 mmol) was added under argon. Then 8 mL ethanol, 40 mL toluene and 8mL
2M Na2CO3aqueous solution was added. The whole system was heated to 90 � and kept for 3 h. The
mixture was separated, and the water layer was extracted with CH2Cl2 (20 mL × 3), the combined
organic layer was dried over anhydrous Na2SO4. Solvent was removed under vacuum. Further
purification by column chromatography on silica gel using petroleum ether: CH2Cl2 (3 : 1) as eluent
afforded the product as a yellow solid (260 mg, 72% yield). 1H NMR (400 MHz, 298 K) δ (CDCl3,
ppm) 8.58 (d, J = 1.7 Hz, 1H), 8.42 (d, J = 8.1 Hz, 1H), 8.04 (dd, J = 8.1, 1.8 Hz, 1H), 7.76 (d, J = 7.5
Hz, 2H), 7.53 (t, J = 7.4 Hz, 2H), 7.47 (t, J = 7.3 Hz, 1H). MS (EI) m/z: 360 (M+).
DP-TCAQ was synthesized by TiCl4-mediated Knoevenagel condensation.3To a 100 mL flask, 0.5
mmol 2,6-diphenylanthracene-9,10-dione (180 mg), malononitrile (4 mmol, 265 mg) was added
under argon , 50 mL chloroform was added as solvent, and it was allowed to reflux at 65 �. After the
addition of TiCl4 (4 mmol) and pyridine (8 mmol), the whole system was kept at refluxing overnight.
Then 50 mL water was added, and separated. The water layer was extracted with CH2Cl2 (10 mL × 3).
The combined organic layer was dried over anhydrous Na2SO4. Solvent was removed under vacuum.
Further purification by column chromatography on silica gel using petroleum ether: CH2Cl2 (2 : 1) as
eluent afforded dP-TCAQ as a bright yellow solid (150 mg, 66% yield). 1H-NMR (400 MHz, 298 K)
δ (CDCl3, ppm): 8.48 (d, J = 1.6 Hz, 2H), 8.35 (d, J = 8.2 Hz, 2H), 7.95 (dd, J = 8.2, 1.8 Hz, 2H),
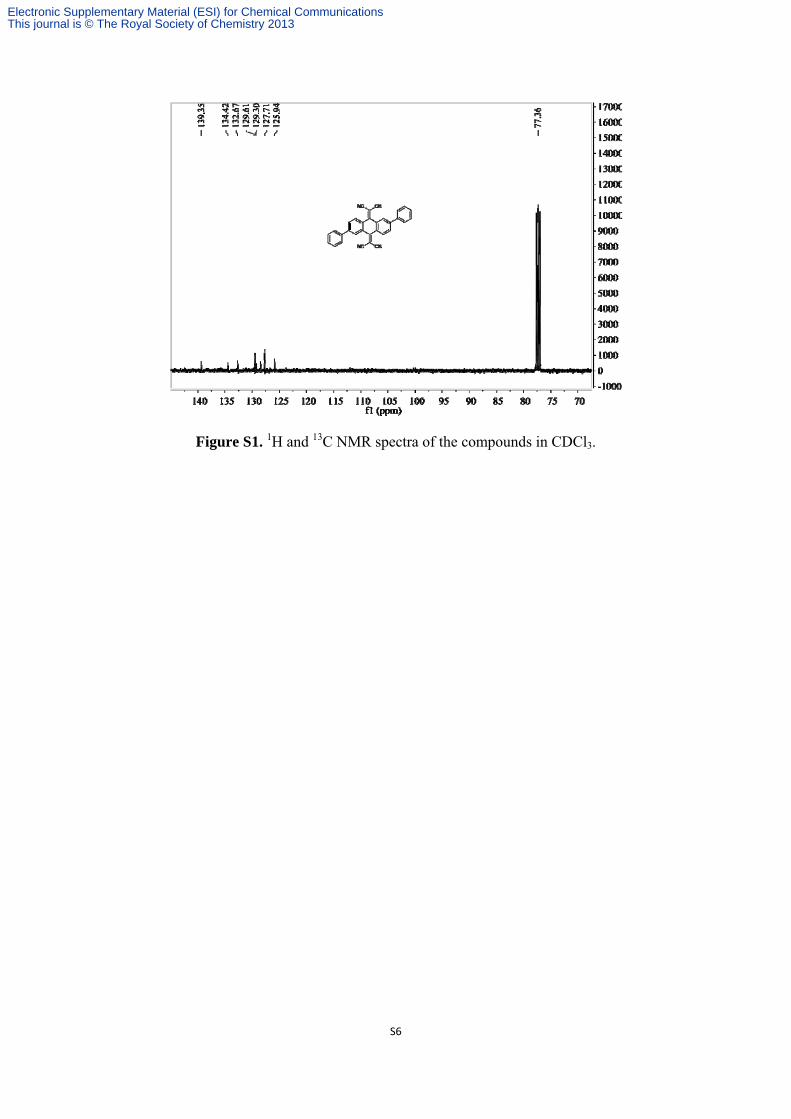
7.71-7.66 (m, 4H), 7.58-7.51 (m, 4H), 7.51-7.45 (m, 2H). 13CNMR (100 MHz, 298K): δ (CDCl3,
ppm): 13C NMR (101 MHz, CDCl3) δ 139.35, 134.42, 132.67, 129.61, 129.30, 127.71, 125.94. MS
(EI) m/z: 456 (M+). Anal. calcd for C32H16N4 (%): C: 84.19, H: 3.53, N: 12.27. Found: C: 84.25, H:
3.56, N: 12.37.
TCAQ was synthesized the same way as dP-TCAQ with a yield of 63%. MS (EI) m/z: 304 (M+).
1H-NMR (400 MHz, 298 K) δ (CDCl3, ppm): 8.31-8.17 (m, 4H), 7.82-7.65 (m, 4H).
Preparation of aqueous solutions
First a solution of dP-TCAQ and TCAQ (10-3 M) in acetonitrile was prepared. Then different
amount of the solution, acetonitrile and water was mixed to form 2 mL 50 μM solution, and the
solution was used for the UV-vis and florescent test.
Electronic Supplementary Material (ESI) for Chemical CommunicationsThis journal is © The Royal Society of Chemistry 2013

S4
Preparation of SEM sample
Solutions with certain content of water was first prepared, then a cleaned SiO2/Si substrate was
dipped into the solution and pulled out, the solvent was absorbed away by filtrate paper to avoid
further aggregation caused by solvent evaporation.
Electronic Supplementary Material (ESI) for Chemical CommunicationsThis journal is © The Royal Society of Chemistry 2013
S5
Electronic Supplementary Material (ESI) for Chemical CommunicationsThis journal is © The Royal Society of Chemistry 2013
S6
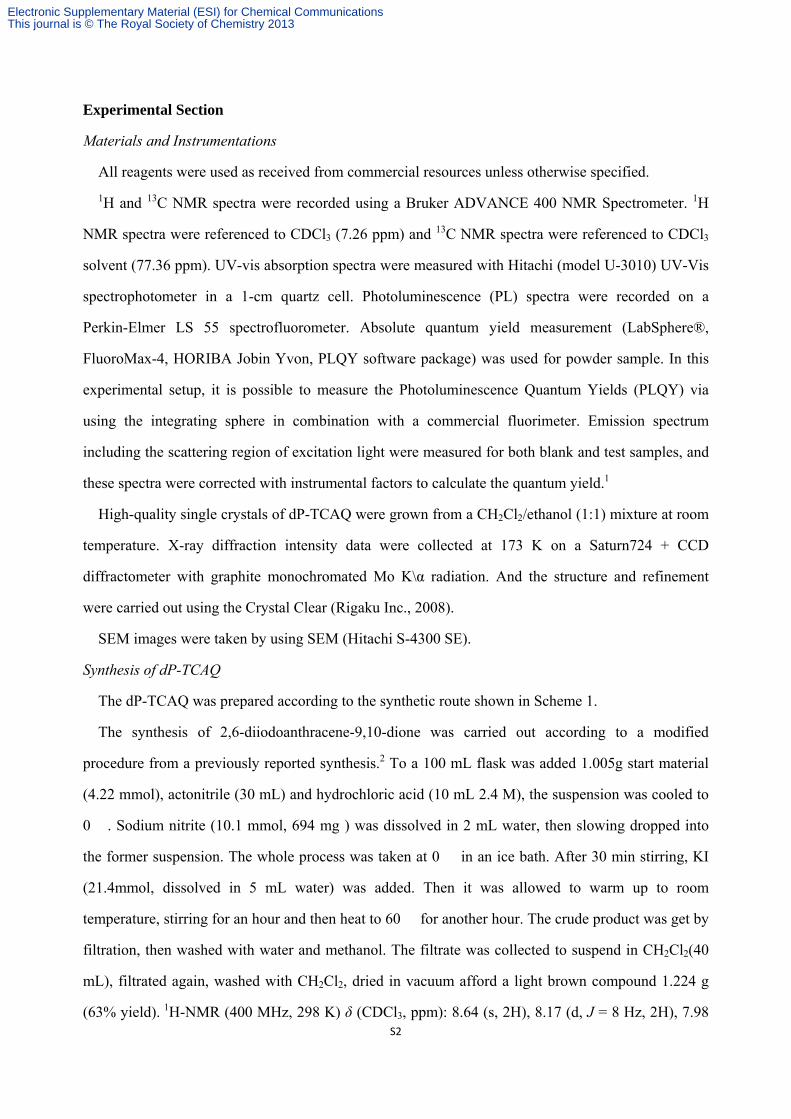
Figure S1. 1H and 13C NMR spectra of the compounds in CDCl3.
Electronic Supplementary Material (ESI) for Chemical CommunicationsThis journal is © The Royal Society of Chemistry 2013

S7
350 400 450 500 550 600 650
0
50
100
150
200
250
300
Inte
nsi
ty (
a.u
)
Wavelength (nm)
0% 20% 40% 60% 80% 95%
Figure S2. Photoluminescence spectra of TCAQ upon increasing water content, the concentration
was kept at 50 μM and excitation wavelength was kept at 340 nm.
Figure S3. Photoluminescence spectra of dP-TCAQ in different water/solvent (v/v) mixtures. (A)
Acetone was used as solvent (concentration: 75 μM), (B) THF was used as solvent (concentration:
100 μM). Excitation wavelength: 380 nm.
Electronic Supplementary Material (ESI) for Chemical CommunicationsThis journal is © The Royal Society of Chemistry 2013
S8
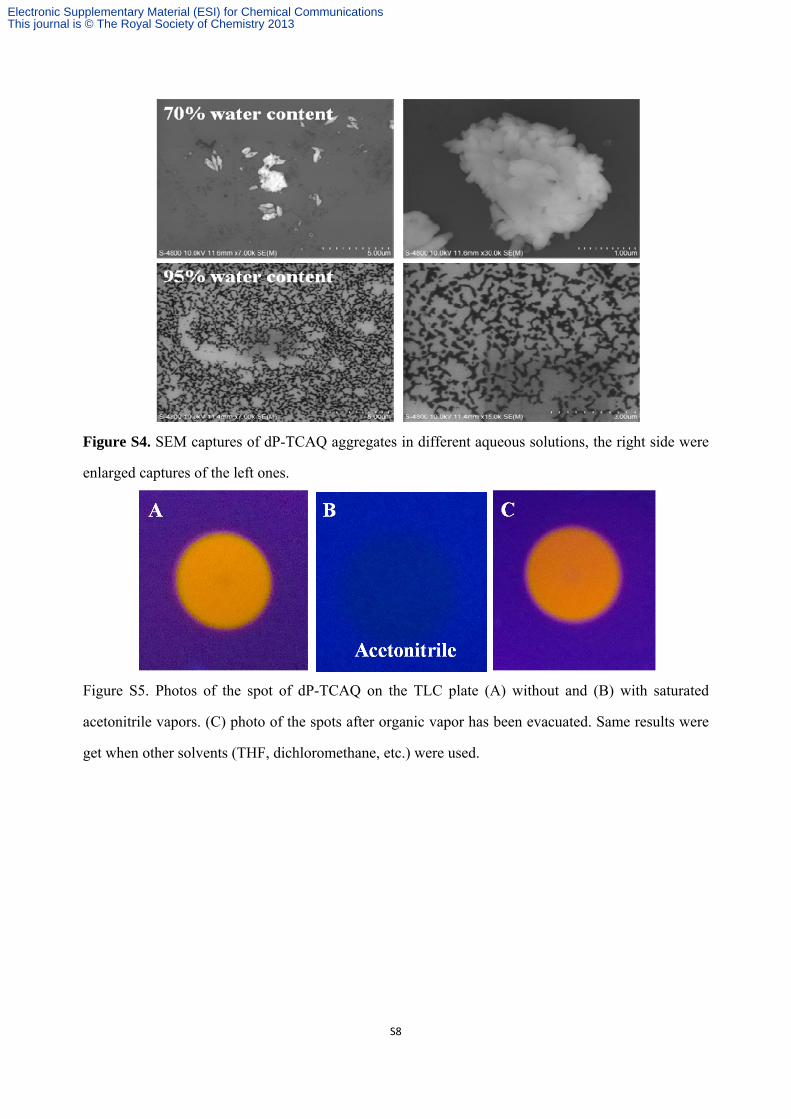
Figure S4. SEM captures of dP-TCAQ aggregates in different aqueous solutions, the right side were
enlarged captures of the left ones.
Figure S5. Photos of the spot of dP-TCAQ on the TLC plate (A) without and (B) with saturated
acetonitrile vapors. (C) photo of the spots after organic vapor has been evacuated. Same results were
get when other solvents (THF, dichloromethane, etc.) were used.
Electronic Supplementary Material (ESI) for Chemical CommunicationsThis journal is © The Royal Society of Chemistry 2013
S9
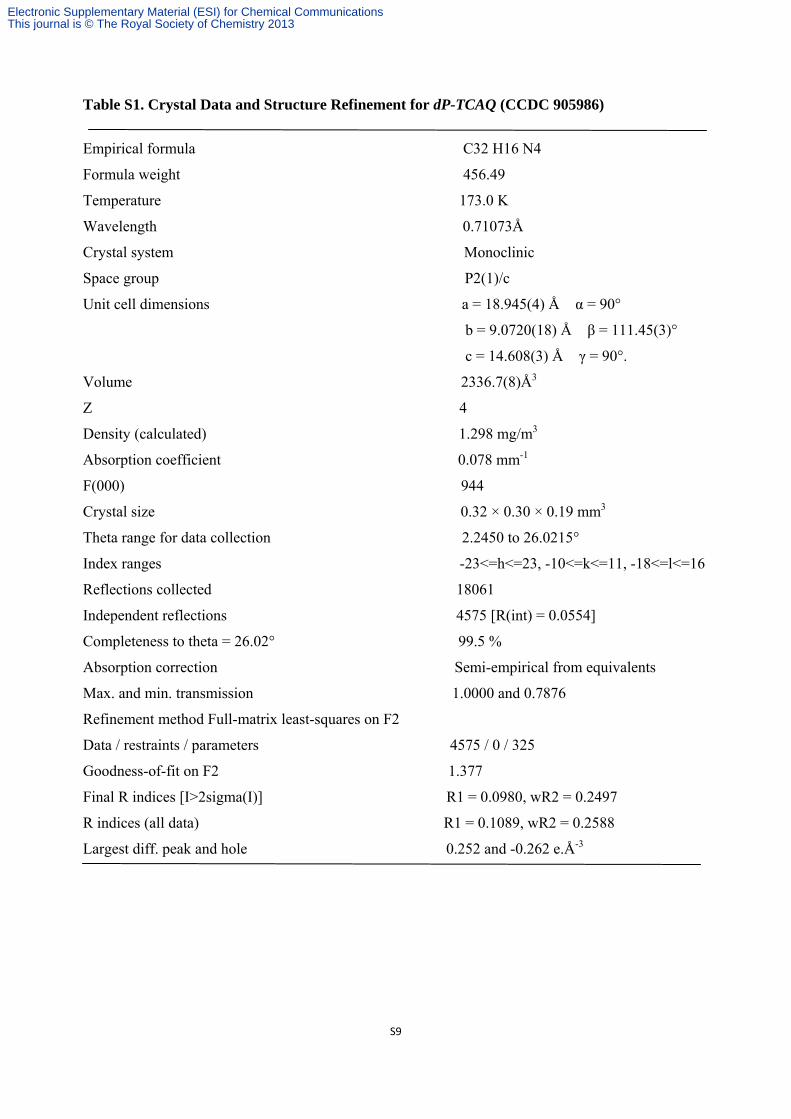
Table S1. Crystal Data and Structure Refinement for dP-TCAQ (CCDC 905986)
Empirical formula C32 H16 N4
Formula weight 456.49
Temperature 173.0 K
Wavelength 0.71073Å
Crystal system Monoclinic
Space group P2(1)/c
Unit cell dimensions a = 18.945(4) Å �α = 90°
b = 9.0720(18) Å �β = 111.45(3)°
c = 14.608(3) Å �γ = 90°.
Volume 2336.7(8)Å3
Z 4
Density (calculated) 1.298 mg/m3
Absorption coefficient 0.078 mm-1
F(000) 944
Crystal size 0.32 × 0.30 × 0.19 mm3
Theta range for data collection 2.2450 to 26.0215°
Index ranges -23<=h<=23, -10<=k<=11, -18<=l<=16
Reflections collected 18061
Independent reflections 4575 [R(int) = 0.0554]
Completeness to theta = 26.02° 99.5 %
Absorption correction Semi-empirical from equivalents
Max. and min. transmission 1.0000 and 0.7876
Refinement method Full-matrix least-squares on F2
Data / restraints / parameters 4575 / 0 / 325
Goodness-of-fit on F2 1.377
Final R indices [I>2sigma(I)] R1 = 0.0980, wR2 = 0.2497
R indices (all data) R1 = 0.1089, wR2 = 0.2588
Largest diff. peak and hole 0.252 and -0.262 e.Å-3
Electronic Supplementary Material (ESI) for Chemical CommunicationsThis journal is © The Royal Society of Chemistry 2013
S10
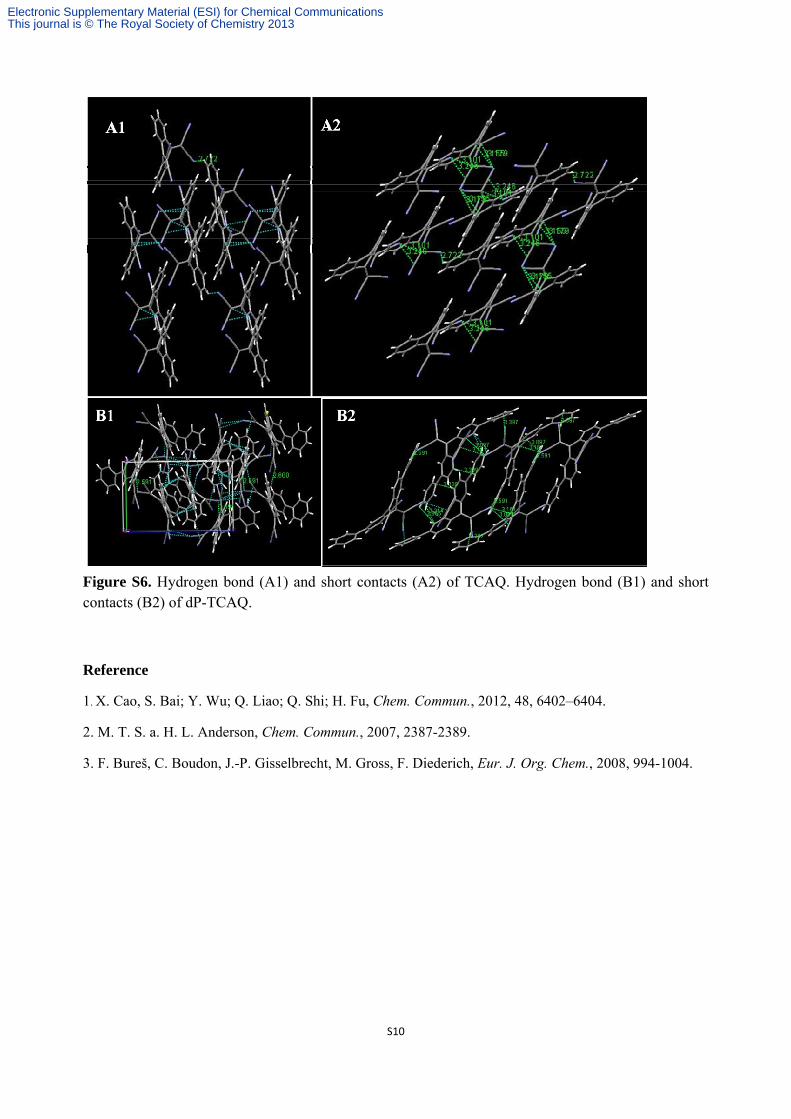
Figure S6. Hydrogen bond (A1) and short contacts (A2) of TCAQ. Hydrogen bond (B1) and short contacts (B2) of dP-TCAQ.
Reference
1. X. Cao, S. Bai; Y. Wu; Q. Liao; Q. Shi; H. Fu, Chem. Commun., 2012, 48, 6402–6404.
2. M. T. S. a. H. L. Anderson, Chem. Commun., 2007, 2387-2389.
3. F. Bureš, C. Boudon, J.-P. Gisselbrecht, M. Gross, F. Diederich, Eur. J. Org. Chem., 2008, 994-1004.
Electronic Supplementary Material (ESI) for Chemical CommunicationsThis journal is © The Royal Society of Chemistry 2013


![Self-Assembly of Aggregation-Induced-Emission Molecules€¦ · Self-Assembly of Aggregation-Induced-Emission Molecules Tongyue Wu, Jianbin Huang, and Yun Yan*[a] Chem.Asian J. 2019,](https://img.pdfslide.net/doc/110x75/5ff38cc82527cc11460975f2/self-assembly-of-aggregation-induced-emission-molecules-self-assembly-of-aggregation-induced-emission.jpg)