Embed Size (px)
Citation preview
1 DHS 0197 (02/15)
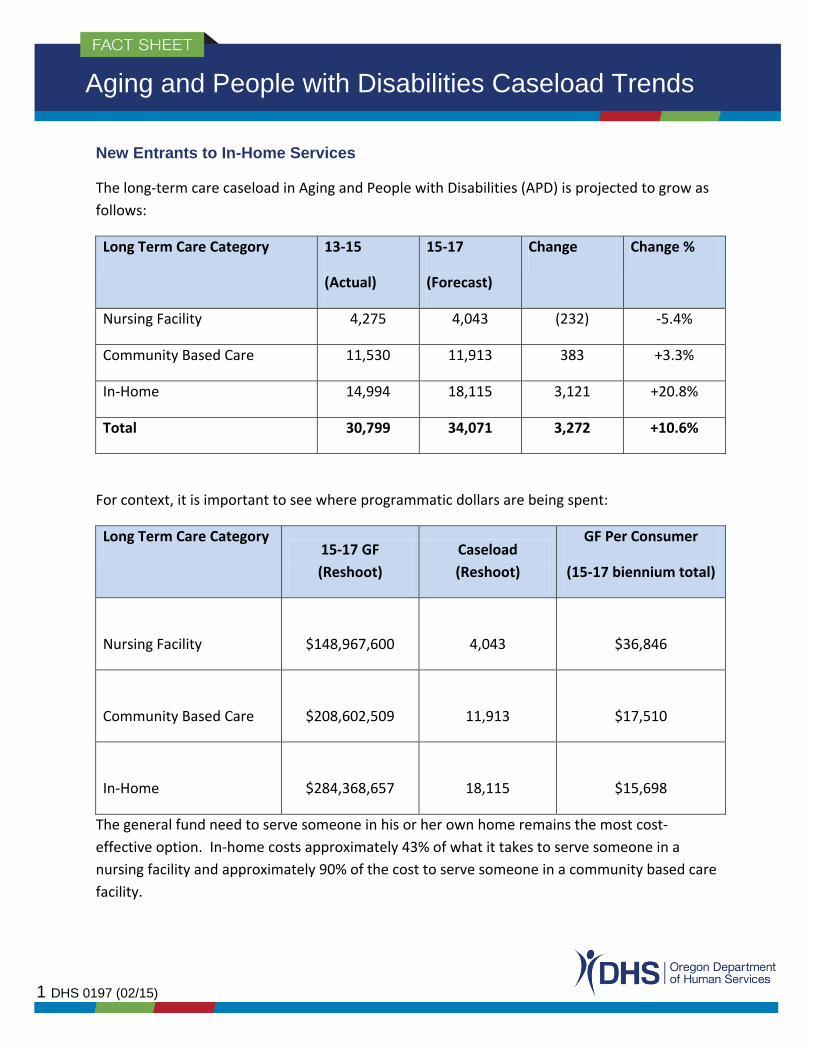
New Entrants to In-Home Services
The long-term care caseload in Aging and People with Disabilities (APD) is projected to grow as
follows:
Long Term Care Category 13-15
(Actual)
15-17
(Forecast)
Change Change %
Nursing Facility 4,275 4,043 (232) -5.4%
Community Based Care 11,530 11,913 383 +3.3%
In-Home 14,994 18,115 3,121 +20.8%
Total 30,799 34,071 3,272 +10.6%
For context, it is important to see where programmatic dollars are being spent:
Long Term Care Category 15-17 GF
(Reshoot)
Caseload
(Reshoot)
GF Per Consumer
(15-17 biennium total)
Nursing Facility $148,967,600 4,043 $36,846
Community Based Care $208,602,509 11,913 $17,510
In-Home $284,368,657 18,115 $15,698
The general fund need to serve someone in his or her own home remains the most cost-
effective option. In-home costs approximately 43% of what it takes to serve someone in a
nursing facility and approximately 90% of the cost to serve someone in a community based care
facility.
Aging and People with Disabilities Caseload Trends

2
Additionally, according to a recent AARP study, 89% of individuals aged 50+ want to live in their
own homes indefinitely. APD has been meeting that preference by steadily increasing the
percentage of individuals receiving services in their own homes. This has been possible through
the implementation of new policies in the 13-15 biennium. A partial listing of those changes
follows:
Restoration of Instrumental Activities of Daily Living reductions.
Workforce recruitment and development through better compensation policies and
training opportunities.
Supporting people’s ability to live in their own homes by reducing the amount of income
in-home consumers must contribute towards the cost of their services from all income
over SSI ($733) to only income over $500 of SSI ($1,233).
Increased case management staffing to serve more time-intensive in-home consumers.
New tools under the K Plan (technology/ durable medical equipment/ environmental
modifications) allow people to maintain successful in-home placements.
To gain an accurate picture of the new entrants, we performed an extensive analysis of new
entrants to in-home services for the period September 2014 - January 2015.
The analysis is broken out into two sections:
Characteristics of the entire new in-home population and;
A deeper examination of a random sample of new entrants in this population.
Characteristics of the new in-home population
The Department identified all new entrants to in-home services who utilized Home Care
Workers for the period September 2014-January 2015. During that time, 2,148 unique
individuals entered these services new. For the purposes of this paper, a new in-home
consumer is defined as someone receiving in-home services from a Home Care Worker that was
not receiving services from a Home Care Worker in the previous month.

3
The following table illustrates the service priority levels upon which individuals qualified:
SPL Service Priority Level Description Consumers Percent
01
Requires Full Assistance in Mobility, Eating,
Elimination, and Cognition. 41 1.91%
02
Requires Full Assistance in Mobility, Eating, and
Cognition. 3 0.14%
03
Requires Full Assistance in Mobility, or Cognition,
or Eating. 643 29.93%
04 Requires Full Assistance in Elimination. 93 4.33%
05
Requires Substantial Assistance with Mobility,
Assistance with Elimination and Assistance with
Eating. 85 3.96%
06
Requires Substantial Assistance with Mobility and
Assistance with Eating. 16 0.74%
07
Requires Substantial Assistance with Mobility and
Assistance with Elimination. 726 33.80%
08
Requires Minimal Assistance with Mobility and
Assistance with Eating and Elimination. 5 0.23%
09 Requires Assistance with Eating and Elimination. 5 0.23%
10 Requires Substantial Assistance with Mobility. 325 15.13%
11
Requires Minimal Assistance with Mobility and
Assistance with Elimination. 101 4.70%
12
Requires Minimal Assistance with Mobility and
Assistance with Eating. 6 0.28%
13 Requires Assistance with Elimination. 95 4.42%
Total (Does not include individuals not found eligible) 2,148 100.00%
4
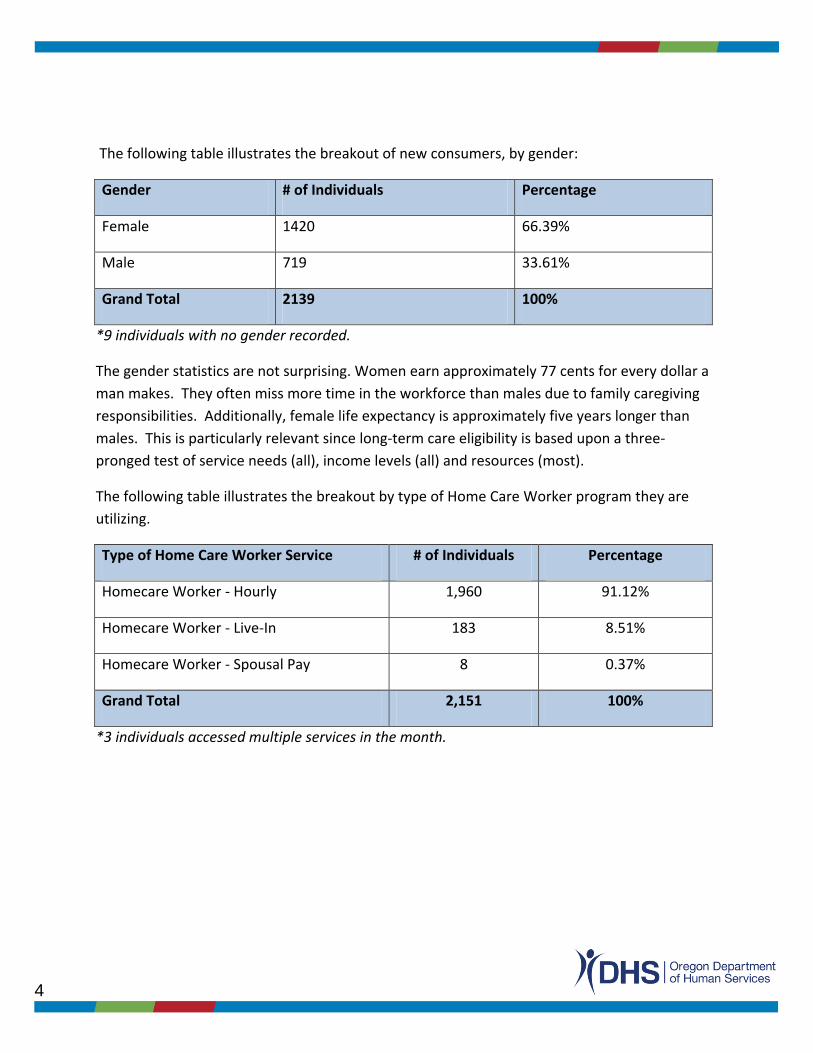
The following table illustrates the breakout of new consumers, by gender:
Gender # of Individuals Percentage
Female 1420 66.39%
Male 719 33.61%
Grand Total 2139 100%
*9 individuals with no gender recorded.
The gender statistics are not surprising. Women earn approximately 77 cents for every dollar a
man makes. They often miss more time in the workforce than males due to family caregiving
responsibilities. Additionally, female life expectancy is approximately five years longer than
males. This is particularly relevant since long-term care eligibility is based upon a three-
pronged test of service needs (all), income levels (all) and resources (most).
The following table illustrates the breakout by type of Home Care Worker program they are
utilizing.
Type of Home Care Worker Service # of Individuals Percentage
Homecare Worker - Hourly 1,960 91.12%
Homecare Worker - Live-In 183 8.51%
Homecare Worker - Spousal Pay 8 0.37%
Grand Total 2,151 100%
*3 individuals accessed multiple services in the month.

5
The following table illustrates the number of hours being utilized by the new consumers.
Hours Per Month # of Individuals Percentage of Total
0-40 845 39.52%
41-80 682 31.90%
81-120 336 15.72%
121-160 129 6.03%
160-240 93 4.35%
240+ 53 2.48%
Grand Total 2,138 100.00%
As shown, over 71% of new entrants are utilizing less than 80 hours per month.
The following table illustrates the breakout by age group of the new in-home entrants.
Age Grouping # of Individuals Percent
18-40 134 6.21%
41-50 213 9.87%
51-64 733 33.95%
65-74 468 21.68%
75-84 416 19.27%
85+ 195 9.03%
Grand Total 2,159 100.00%
*11 individuals had age changes mid-month.

6
In the year 2015, the baby boomer demographic represented individuals aged 51-69.
Therefore, we took a deeper dive to see how much growth this age cohort represented.
Age Grouping # of Individuals Percent
18-50 347 16.07%
51-69 961 44.51%
70+ 851 39.42%
Grand Total 2,159 100%
This is a telling statistic. If baby boomers are accounting for 44.5% of the growth now, we can
expect that the impact will only grow over time, as individual’s needs increase. This table
illustrates the age of baby boomers at different points in time.
Year Lowest Age in Range Highest Age in Range
2010 46 64
2015 51 69
2020 56 74
2025 61 79
2030 66 84
This illustrates that a subset of the baby boomers will be accounting for a greater share of
resources of publicly funded long-term care in the future. Oregon’s system must be ready.
Of particular relevance to this growth is Oregon’s expansion of Medicaid eligibility under the
Affordable Care Act. Below are two tables that illustrate the new trends and dynamics that are
occurring. The first table illustrates the total number of Oregonians gaining health insurance
through Medicaid:

7
In January of 2014, the
Oregon Health
Authority began
serving over 400K
more individuals than
it was serving
previously, due to the
newly eligible
Medicaid population.
The table to
the right
illustrates the
number of
people
qualifying
under
Medicaid’s
Aid to the
Blind and
Disabled
program.
Interestingly,
the trend is
no longer increasing, which at first seems counterintuitive with all of the media coverage
around the growth in people qualifying for disability determinations. What it illustrates is that
many individuals sought disability determinations in order to gain needed access to medical
services. With the Affordable Care Act expansion, this need is no longer necessary for many
individuals.
8
All of this information is relevant because Oregon adopted the Community First Choice Option
(K Plan) in July 2013. Prior to July 2013, APD only served individuals in home and community
based services who gained access through a 1915(c) waiver. In order to gain entry, they
needed to be 65 or older OR be aged 18-64 with a disability. Now, K Plan services are
potentially available to all 1.1M participants in the Oregon Health Plan.
Under the K Plan, long-term services and supports are a part of the overall medical benefit plan,
which includes services such as physician services, lab services, pharmacy services,
transportation services and durable medical equipment. What this means is that the entire
caseload in the Oregon Health Plan (approx. 1.1 million) have access to long term services and
supports through the K Plan, provided that they meet level of care criteria (service priority
levels 1-13). Further, the Medicaid expansion population does not need to exhaust resources
to the $2,000 limit. However, if a consumer has a disability determination, they need to qualify
under the Oregon Supplemental Income Program-Medical (OSIPM). This program requires
individuals to exhaust assets to the $2,000 limit before being able to access long-term services
and supports.
Currently, DHS does not have good data on the number of individuals accessing K Plan services
because of ACA expansion. DHS recently implemented technology modifications, which will
allow better tracking and federal claiming of this caseload. Estimates of the impact of this
caseload vary from 2%-10%. APD expects to have quality data on this population in the fall of
2015.
Deeper examination of new entrants
We selected a random sample of 100 new entrants to in-home services utilizing home care
workers. For this population, we performed a deeper analysis of their situations to gain a
better understanding of their reasons for entry.
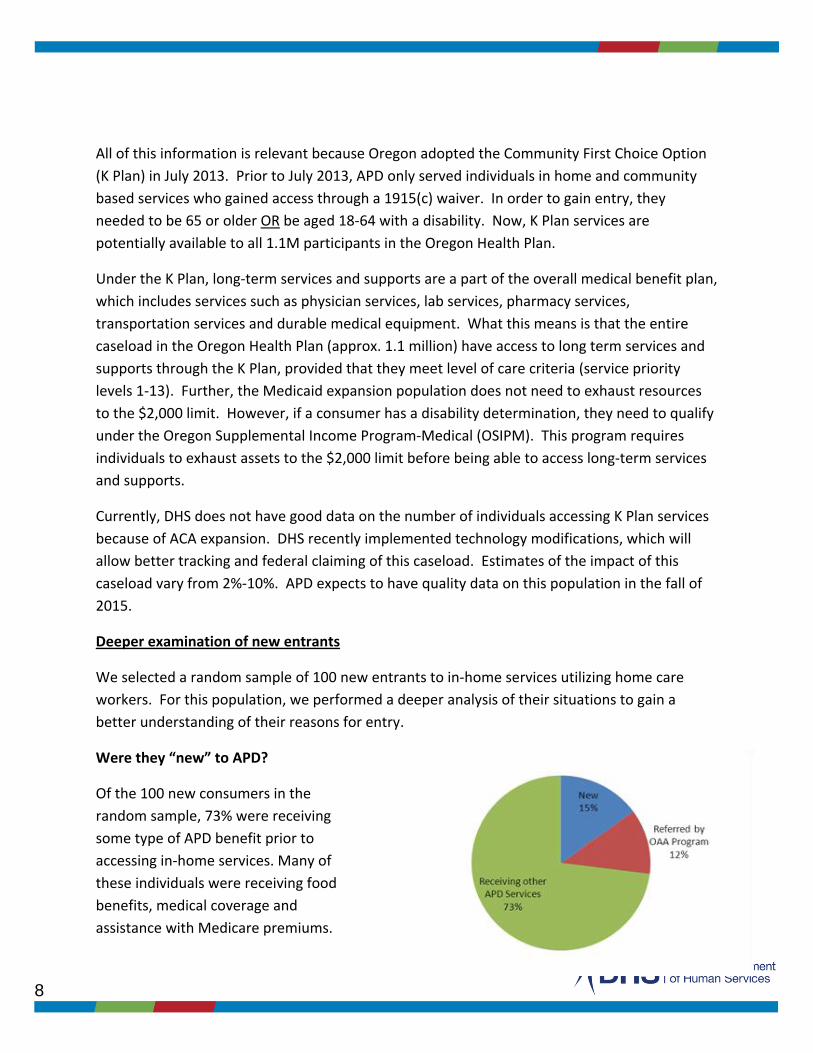
Were they “new” to APD?
Of the 100 new consumers in the
random sample, 73% were receiving
some type of APD benefit prior to
accessing in-home services. Many of
these individuals were receiving food
benefits, medical coverage and
assistance with Medicare premiums.

9
Reason for Entry Number of Individuals Percent
Declining Health 31 31%
Acute Event 18 18%
Break in Service 13 13%
Transition 12 12%
Progressive Disease 11 11%
Agency to HCW 7 7%
Moved from other state 3 3%
Referral from APS 3 3%
Other 2 2%
Five individuals were receiving medical benefits through the Modified Adjusted Gross Income
(MAGI) Medicaid program. The local Older American’s Act programs referred 12% of the new
individuals. They usually occurs once the program can no longer meet their needs. Of the new
individuals, some had moved from other states and some had been cared for by family
members who were no longer able to provide the needed services.
Causes of Entry
This table illustrates, at
a high level, the reason
why individuals
accessed services.
The majority of new
entrants had a marked
decline in health or an
acute medical event.
Over half with a decline
in health were above
70 years old. The acute events included many newly diagnosed diseases, such as congestive
heart failure, cardio-vascular accident (stroke) and cancer. Twelve consumers transitioned
from a higher level of care, including eight that left a nursing home. Approximately 11% entered
the In-Home Program due to the progression of a disease, such as polio, multiple scleroses,
end-stage renal disease, dementia, or Parkinson’s. Of the other category, one was over-
resources post eligibility and one that had been unable in the past to pay the service
contribution, or pay-in.
Service Contribution (Pay-In) Requirements
Prior to a
February 2014
policy change
authorized by the
Legislature,
individuals
contributed any
income above the
Supplemental Security Income (SSI) amount of $733 towards their in-home services; also
Income Individuals
Pay-In Pre-
change
Pay-In Post-
change
$733 and under 29 $0.00 $0.00
$734 to $1233 46 $263.56 $0.00
Above $1233 25 $263.56 $62.88

10
known as a person’s “pay-in”. The policy change allowed them to maintain any income, up to
an additional $500, to cover expenses associated with maintaining a household (rent/
mortgage/ taxes/utilities/nutrition, etc.). This policy change did not result in any eligibility
change nor does it issue cash benefits to individuals with income less than $1,233.
From the random sample of 100 individuals, 43 had income at or below $733 and would not
have had a pay-in pre- or post- implementation of the policy change. Thirty-two individuals,
with income between $733 and $1,233, would have had a pay-in prior to the policy change. Of
the remaining individuals, 26 individuals entered long-term care services and supports (LTSS)
with income above $1,233, with an average pay-in liability of approximately $252.00. Their pay-
in would have been higher pre implementation of this policy change.
Individual Characteristics of New Entrants
The following highlights some of the stories of new entrants to in-home services. These stories
illustrate the types of needs, services and diverse situations experienced by new entrants.
Consumer 1
After many years of independent living, Consumer 1 found herself forgetting things. At 79, she
was not too concerned as she had a great network of friends through her congregation that
would help her. It was not until the doctor revoked her driver’s license did her family
understand the advancement of her dementia. Her friends had also become increasingly
concerned about her lack of eating. In May 2014, she met with the local Options Counselor and
started receiving home-delivered meals and nutritional information. In the fall of 2014, her son,
who lives on the east coast, came to visit. He and his wife noticed that her memory was getting
worse and the myriad of sticky notes throughout the house were not helping any longer. She
could not find her medications, did not know the date and was still not eating well. They called
the local APD office to enquire about in-home services. Consumer 1’s 48 hour per month
service plan is now meeting her needs; homecare workers set up and monitor her medications,
make sure she is bathing regularly and monitor her nutrition.
Consumer 2
Consumer 2 is a 63-year-old man with a history of homelessness. He was doing fine living in an
apartment until he received an eviction notice. His eviction was caused due to the condition of
his apartment and his lack of personal care. Adult Protective Services was contacted to assist
and they made a referral to the case manager. He now has a homecare worker that is keeping
the apartment clean and ensuring that he is bathing and wearing clean clothing. Consumer 2

11
was offered the opportunity to reside in an assisted living facility or an adult foster home and
his response was that he would be “on the street before I go to one of those places”. He
currently receives 50 hours of in-home care per month and is no longer facing eviction.
Consumer 3
Consumer 3 is a 72-year-old woman living alone in a mobile home. She has COPD and suffers
from rheumatoid arthritis. She had managed to care for herself with some assistance from
nearby family but her needs progressed to more than they could meet. She was no longer
leaving her home because of multiple falls that had occurred. Because of her arthritis, she was
finding it more difficult to bath, get out of her chair, and prepare her meals. She had been
receiving food benefits and medical coverage assistance since 2003. She receives 86 hours of in-
home services each month and is able to leave her home to shop, is eating better and has
assistance getting up from her chair.
Consumer 4
As a Marine in the Vietnam War, Consumer 4 was used to jumping out of choppers with his full
gear. Over time, that action has caused James, now 65 years old, great back pain and spinal
stenosis. He receives a small military benefit and Social Security Disability. He was able to meet
his care needs with assistance from his son until he had a stroke in June 2014. At the time of
the stroke, he fell hitting his head causing a brain bleed. The brain bleed was resolved but
while in a rehabilitation facility, he fell again and had brain surgery. He is now in a wheelchair
and has left-side paralysis. His son quit his part-time job and is now his full-time caregiver.
12
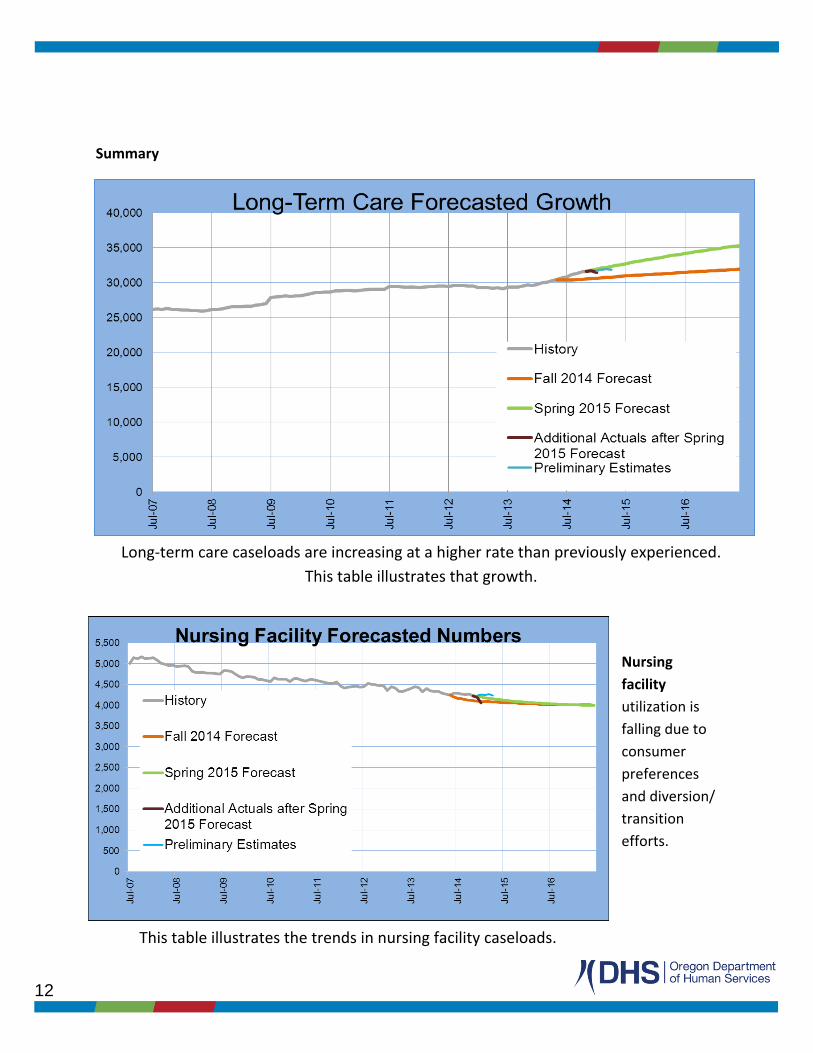
This table illustrates the trends in nursing facility caseloads.
Long-term care caseloads are increasing at a higher rate than previously experienced.
This table illustrates that growth.
Summary
Nursing
facility
utilization is
falling due to
consumer
preferences
and diversion/
transition
efforts.

13
This table illustrates the overall changes in community-based care.
This table illustrates the changes in the In-Home Services
Programs.
Community-based
care includes services
offered through
assisted living,
residential care, adult
foster homes,
memory care and
Providence Elder
Place’s Program of All
Inclusive Care for the
Elderly (PACE). In July
2013, the Department
eliminated relative
foster care as an
option and
transitioned
approximately 1,300 individuals to the in-home program.
Current community based care growth is dominated in the category of memory care.
In-Home services
are increasing
because of
consumer
preferences,
policy changes,
enhanced
infrastructure and
the elimination of
relative foster
homes.