Embed Size (px)
Citation preview
This fascinating look at the diverse characteristics and lifestyles of older Americans offers surprising details. BY LISA R ILL , PH .D.
Aging in America: A Profile of Older Adults
Aging in America:
Individuals who are sixty-five and older are a hetero-geneous group. They differ in terms of gender, race/ethnicity, marital status, education, health, social
class, and living arrangements. This article illustrates these differences by providing a detailed look at the diverse characteristics of older Americans.
Population Aging: The Growth of the Sixty-Five Plus Age Group Population aging occurs when there is an increase in the proportion of older people in a society. In 1900, there were 3.1 million people aged sixty-five and older
in America, which was only 4.1 percent of the to-tal population (Werner et al. 2011). Since then, this population has been steadily increasing. According to the 2010 Census, there were 40.3 million people aged sixty-five and older, accounting for 13.1 percent of the total population.
The baby boomer generation started turning sixty-five in 2011. As they move into the older age groups, this population is projected to grow rapidly over the next four decades. By 2030, all of the boomers will populate the older age groups, which will result in a shift in the age structure. Between 2010 and 2050,
A Profile of Older Adults
[ e m e r g i n g t r e n d s ]
CSA JOURNAL 65 / VOL. 1, 2016 / SOCIETY OF CERTIFIED SENIOR ADVISORS / WWW.CSA.US PAGE 5
the number of Americans age sixty-five and older is projected to more than double from 40.3 million to 88.5 million (Vincent et al. 2010).
The population aging trend of the oldest-old is par-ticularly important, as people in this age group often require additional caregiving and support. This will, therefore, have an impact on families, policy makers, businesses, and health care providers in the future. Acknowledging these trends can provide many oppor-tunities for professionals in the field of aging, if they apply their skills to meeting the needs of this growing segment of the population.
Gender: A Rise in Men’s Life Expectancy In 2010, the U.S. population reached 308.7 million people (Howden et al. 2011). From the total popula-tion, 50.8 percent were female and 49.2 percent were male. The sex ratio is a common measure used to reveal the balance of males and females in a population. Nor-mally, the sex ratio at birth is about 105 males to every hundred females. However, males tend to experience higher rates of mortality than females at almost every age, which leads to a decline in the sex ratio as age increases, and results in more women than men in the older populations.
While females continue to outnumber males in the older age groups, males are beginning to close the gap because they have been increasing at a faster rate than females over the past decade. The largest growth rate was 46.5 percent for males eighty-five to ninety-four years old (Howden et al. 2011). The increase in the number of males occurring in the older age groups is evidence of an increase in life expectancy for them.
This trend is expected to continue over the next four decades. For instance, it is projected that there will be a decrease in the female population among those aged sixty-five and older from 57 percent in 2010 to 55 percent in 2050 (Vincent et al. 2010). These changes are occurring not only because of the increasing life expectancy for men, but also because the smaller birth cohort who were born in the late 1970s will be moving into these age groups.
Even though the gap is narrowing, women will still dominate the older age groups. However, be aware that the changing sex ratios will have an impact on the so-cial and economic well-being of the older population, such as living arrangements and the type of care that will be available to them.
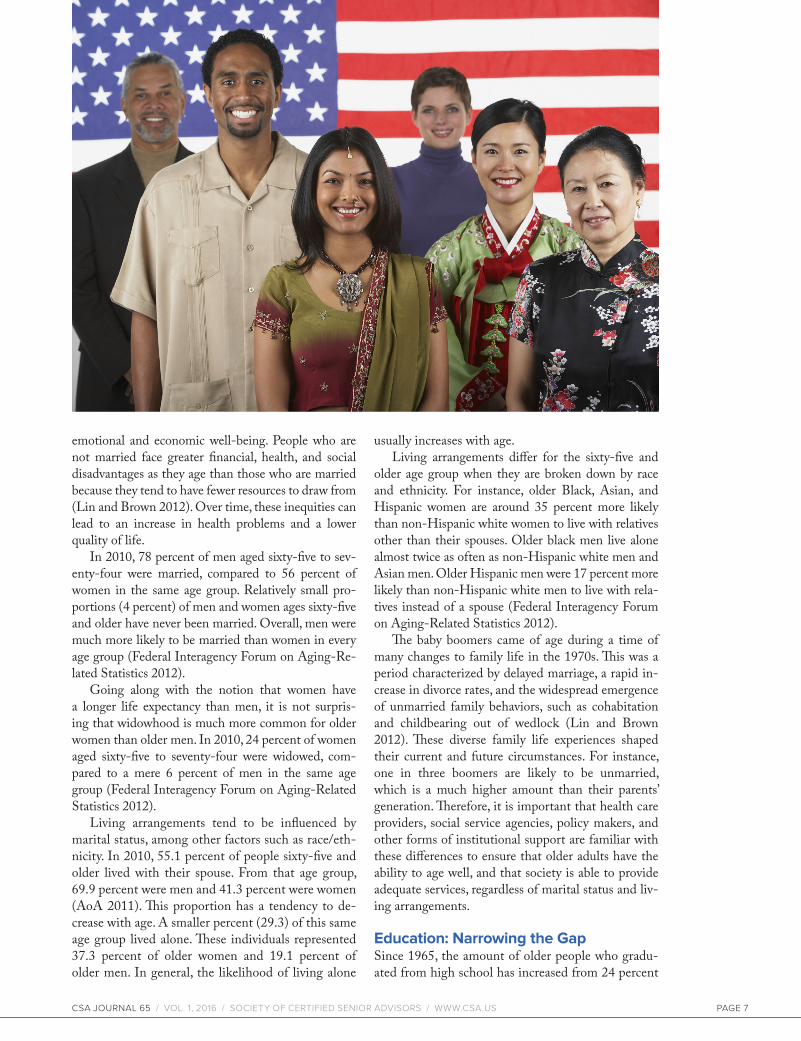
Race and Ethnicity: A Growing Diversity As the older population increases, it will also grow more diverse. Currently, 20 percent of older adults are minorities. However, this number is expected
to increase to 42 percent by 2050. More specifically, among those aged sixty-five and older, the percent of the White population is projected to decrease from 87 percent in 2010 to 77 percent in 2050. Within the same age group, the Black and Asian populations are expected to increase. The Black population should grow to 12 percent in 2050 from 9 percent in 2010, and the Asian population should rise from 3 percent in 2010 to 9 percent in 2050 (Vincent et al. 2010).
The projected increase in the proportion of older Hispanics over the next four decades is much more impressive. The Hispanic population aged sixty-five and older is expected to have more than a six-fold increase (2.9 million to 17.5 million) by 2050. Even more, the eighty-five and older Hispanic population is projected to increase nine-fold (305,000 to 2.9 million) during the same time (Vincent et al. 2010).
Despite the fact that the Hispanic population will represent the largest ethnic minority population among the next generation of older persons, relatively little is known about their social and health status. Contrary to the belief that the majority of the baby boom popu-lation is well educated, healthy, and economically se-cure, it is unlikely to represent the situation of the older Hispanic population. Evidence from over two decades of research on the Hispanic population found that, although they are living longer and have experienced gains in life expectancy that outpace the non-Hispanic Whites and other minority populations, they still have a higher prevalence and mortality for certain chronic conditions including diabetes, infectious and parasitic diseases, hypertension, and obesity (Villa et al. 2012). They are also less likely, at all ages, to have insurance coverage or a usual source of care, and lower than av-erage levels of income. These ongoing challenges that Hispanics face suggest that their health status is likely to be worse than the U.S. average in the future.
As this cohort moves into old age, their cumulative disadvantage is likely to result in continued or worse health disparities, and reductions in federal entitle-ment programs for aging adults, scaling back on pro-grams and services, or increases in the costs to consum-ers may exacerbate those inequities (Villa et al. 2012). Therefore, as we witness this unprecedented growth in racial and ethnic diversity among the aging population, programs and services for older people will require greater flexibility, and advisors will need to be sensitive to the needs of a more diverse older population.
Marital Status and Living Arrangements: Variation by Gender and Race/EthnicityMarital status is a major factor that influences how an individual ages and can have a lasting effect on their
PAGE 6
emotional and economic well-being. People who are not married face greater financial, health, and social disadvantages as they age than those who are married because they tend to have fewer resources to draw from (Lin and Brown 2012). Over time, these inequities can lead to an increase in health problems and a lower quality of life.
In 2010, 78 percent of men aged sixty-five to sev-enty-four were married, compared to 56 percent of women in the same age group. Relatively small pro-portions (4 percent) of men and women ages sixty-five and older have never been married. Overall, men were much more likely to be married than women in every age group (Federal Interagency Forum on Aging-Re-lated Statistics 2012).
Going along with the notion that women have a longer life expectancy than men, it is not surpris-ing that widowhood is much more common for older women than older men. In 2010, 24 percent of women aged sixty-five to seventy-four were widowed, com-pared to a mere 6 percent of men in the same age group (Federal Interagency Forum on Aging-Related Statistics 2012).
Living arrangements tend to be influenced by marital status, among other factors such as race/eth-nicity. In 2010, 55.1 percent of people sixty-five and older lived with their spouse. From that age group, 69.9 percent were men and 41.3 percent were women (AoA 2011). This proportion has a tendency to de-crease with age. A smaller percent (29.3) of this same age group lived alone. These individuals represented 37.3 percent of older women and 19.1 percent of older men. In general, the likelihood of living alone
usually increases with age. Living arrangements differ for the sixty-five and
older age group when they are broken down by race and ethnicity. For instance, older Black, Asian, and Hispanic women are around 35 percent more likely than non-Hispanic white women to live with relatives other than their spouses. Older black men live alone almost twice as often as non-Hispanic white men and Asian men. Older Hispanic men were 17 percent more likely than non-Hispanic white men to live with rela-tives instead of a spouse (Federal Interagency Forum on Aging-Related Statistics 2012).
The baby boomers came of age during a time of many changes to family life in the 1970s. This was a period characterized by delayed marriage, a rapid in-crease in divorce rates, and the widespread emergence of unmarried family behaviors, such as cohabitation and childbearing out of wedlock (Lin and Brown 2012). These diverse family life experiences shaped their current and future circumstances. For instance, one in three boomers are likely to be unmarried, which is a much higher amount than their parents’ generation. Therefore, it is important that health care providers, social service agencies, policy makers, and other forms of institutional support are familiar with these differences to ensure that older adults have the ability to age well, and that society is able to provide adequate services, regardless of marital status and liv-ing arrangements.
Education: Narrowing the Gap Since 1965, the amount of older people who gradu-ated from high school has increased from 24 percent
CSA JOURNAL 65 / VOL. 1, 2016 / SOCIETY OF CERTIFIED SENIOR ADVISORS / WWW.CSA.US PAGE 7
to 80 percent in 2010, and those with a bachelor’s degree rose from 5 percent to 23 percent during the same time (Federal Interagency Forum on Aging-Related Statistics 2012). This growth in educational attainment from each successive cohort is one of the most positive social trends occurring in this country. Higher levels of education often lead to better jobs, a greater lifetime income, and above average health (Quadagno 2014).
In 2010, 80 percent of men and 79 percent of women had a high school diploma. The percent differ-ence for a bachelor’s degree is considerably higher (28 percent for men and 18 percent for women). There are also substantial educational differences among race/ethnicity for individuals ages sixty-five and older. Of those who completed high school, 84 percent were Whites, 74 percent were Asians, 65 percent were Blacks, and 47 percent were Hispanics. Similar dis-parities were evident for those obtaining a bachelor’s degree. Asians were most likely to have a bachelor’s degree (35 percent), followed by 24 percent of Whites, 15 percent of Blacks, and only 10 percent of Hispanics (Federal Interagency Forum on Aging-Related Sta-tistics 2012).
Although educational attainment varies by age groups, gender, and race/ethnicity, the gap continues to narrow. This trend of increasing education means that older clients in the future will have more questions and be more open to discussion and planning in complex ways that might not be as common with clients today. Therefore, the role of professional advisors will become less a matter of giving answers and more of suggesting resources to help people find their own solutions.
Health: A Less Disabled Older Population Today’s older population is healthier, has fewer dis-abilities, and is more active than older adults in the past. Because of this trend, predictions about the ag-ing population in the future cannot be made from past populations. In addition, caution must be taken when using attributes of only one part of the aging popula-tion to create generalizations about all older adults—the likelihood of frailty increases with each age group. This means that, with advancing years, older adults spend more time and money on health care.
Limitations in activities of daily living (ADL) and instrumental activities of daily living (IADL) are the most commonly studied outcomes in the literature on health trends among the older population. The ability to perform specific ADLs and IADLs tend to decline with age. Such limitations cause people to require as-sistance in order to meet important personal needs.
Older adults will continue to be the heaviest us-ers of health services. As health care costs continue to increase, businesses and government attempt to curtail the costs. The result is a health service delivery system that has become increasingly more complicated—a patchwork of private insurance and government pro-grams, including Medicare and Medicaid. All these trends make health care decision-making a major chal-lenge for the older population. Older adults and their families will need a lot of help navigating the complex system. Therefore, professionals will need to be skilled in responding to older adults’ health problems and di-minished mental capacity if they occur, as well as issues surrounding end-of-life care.
Class: Income and Poverty Rates Income and poverty rates are used to evaluate eco-nomic well-being. People living in poverty are at risk of having inadequate resources for food, housing, health care, and other needs (Federal Interagency Forum on Aging-Related Statistics 2012). Since the late 1950s, economic conditions have improved con-siderably for the older population. There has been a steady decline in the poverty rates and an increase in the median household income among the sixty-five and older age group.
The proportion of the older population living in poverty decreased dramatically from 35 percent in 1959 to 9 percent for those aged sixty-five to seventy-four, and 10 percent for the seventy-five and older age group in 2010 (AoA 2011, Gabe 2012). The median household income for people age sixty-five and over has increased since 1974, from $21,100 (when ex-pressed in 2010 dollars) to $31,410 in 2010 (Federal Interagency Forum on Aging-Related Statistics 2012). Eighty percent of this population has also seen im-provements in their net worth due to home ownership (Quadagno 2014).
Although there has been an overall improvement in the economic well-being of the aging population, there are considerable differences by gender, race and ethnicity, and marital status and living arrangements. White and Asian married couples were the most af-fluent (Quadagno 2014). Overall, the highest poverty rates were experienced among Hispanic women (40.8 percent) who lived alone, with Black women following closely behind at 30.7 percent (AoA 2011).
There is considerable diversity in income and pov-erty levels among the older population. Therefore, it’s important for professionals to understand and respond to these differences by learning about the various pro-grams that are available to this population, especially in the financial area.
PAGE 8
Religion and Spirituality: Unequal Distribution in the U.S.Religiousness and spirituality are separate but related concepts, both of which are notably related to well-being and health in the aging population (Quadagno 2014). For many, religion is a route to spirituality. Re-gardless if someone considers himself or herself reli-gious or spiritual, it is important to understand that both can bring meaning to an older adult’s life.
Spirituality and participation in a religious organi-zation may overlap for many older adults. For example, occasionally older adults do not participate in orga-nized religious activities due to physical limitations, yet they maintain a rich, private spiritual life through activities such as prayer and personal devotions. This is particularly true of those eighty-five and older.
In Frank Newport’s book, God is Alive and Well, he found that religiousness is distributed unequally across various subgroups and segments of the U.S. population (2012). His specific findings are as follows:
• Religiousness tends to increase with age (the least religious at twenty-three and the most at eighty).
• Women are more religious than men.
• Blacks are more religious than other racial/ethnic groups.
• Religiousness is highest in the southern states.
• Upper class Americans are less religious than other social classes.
• Republicans are more likely to be religious than Democrats or Independents.
Religion and spirituality will most likely continue to be an important part of older adults’ lives, even as the ways in which religiousness is expressed and the ways in which people worship may undergo change. We might even see an increase in its importance as the baby boomers age and take more time to reflect on the meaning of life. Therefore, it is important that when assisting your client, you consider their religious and spiritual needs and include them in their life plans.
By now it should be clear that the aging population varies by many social factors. Advisors need to become familiar with this diversity in order to adequately ad-dress all of their clients’ needs. Knowing the key trends that will shape the next decades is a first step to help-ing them create optimal futures. As a navigational con-sultant, you can provide tools—facts, resources, and
experience—that help your clients and their loved ones chart their paths in life. •CSA
Dr. Lisa Rill received her Ph.D. in Sociology at Florida State University with a specialization in health and aging. She currently lives in Hong Kong, and works remotely as Research Faculty at the Claude Pepper
Center on Aging at Florida State University. Her research includes long-term care, cross-cultural examination of aging in place in Hong Kong and the U.S., and other aging-related research projects. She is a member of the CSA Journal Editorial Board. Contact her at [email protected].
■ REFERENCES
Administration on Aging. 2012. “A profile of older Americans: 2011.” U.S. Department of Health and Human Services. http://www.aoa.gov/Aging_Statistics/Profile/2012/2.aspx.
Federal Interagency Forum on Aging-Related Statistics. 2012. “Older Americans 2012: Key indicators of well-being.” Federal Interagency Forum on Aging-Related Statistics. Washington DC: U.S. Government Printing Office.
Gabe, T. 2012. “Poverty in the United States: 2011.” Congressional Research Service, 7-5700 RL33069. http://digitalcommons.ilr.cornell.edu/key_workplace.
Howden, L., and J. Meyer. 2011. “Age and Sex Composition: 2010.” Current Population Reports, C2010BR-03, U..S Census Bureau 2010 Census Briefs, Washington DC.
Lin, I., and L. Brown. 2012. “Unmarried boomers confront old age: A national portrait.” The Gerontologist, 52(2):153-165.
Newport, F. 2012. God is Alive and Well: The future of religion in America. Omaha, NE: Gallup Press.
Quadagno, J. 2014. Aging and the Life Course: An Introduction to Social Gerontology. New York: McGraw-Hill, 6th ed.
Villa, V., S. Wallace, S. Bagdasaryan, and N. Aranda . 2012 . “Hispanic baby boomers: Health inequities likely to persist in old age.” The Gerontologist 52(2):166-176.
Vincent, G., and V. Velkoff. 2010. “The Next Four Decades: The older population in the United States: 2010 to 2050.” Current Population Reports, P25-1138, U.S. Census Bureau, Washington DC.
Werner, C. 2011. “The older population: 2010.” Current Population Reports, C2010BR-09, U.S. Census Bureau 2010 Census Briefs, Washington DC.
CSA JOURNAL 65 / VOL. 1, 2016 / SOCIETY OF CERTIFIED SENIOR ADVISORS / WWW.CSA.US PAGE 9