Embed Size (px)
Citation preview
AGING WITH LONG-TERM PHYSICAL DISABILTY:
THE ROLE OF SECONDARY CONDITIONS
Heather J. Moulton
Submitted in partial fulfillment of the requirements for the degree of
Doctor of Public Health in the Mailman School of Public Health
COLUMBIA UNIVERSITY
2014

© 2014
Heather J. Moulton All rights reserved

ABSTRACT
Aging with Long-Term Physical Disability:
The Role of Secondary Conditions
Heather J. Moulton
Objectives: The purpose of this study is to advance the understanding of secondary
conditions experienced by persons aging with the long-term disabilities of polio and rheumatoid
arthritis and the consequences of these declines in health and function on disability bed days.
Additionally, it explores the effects of the timing and severity of onset of disability
characteristics on the frequency and consequences of secondary conditions. A life course
conceptual framework with the Institute of Medicine’s model of disablement is used to frame
and anchor disability and life events.
Methods: In-depth structured in-home interviews were conducted on 216 individuals
with polio and 186 individuals with rheumatoid arthritis. They consisted of objective and
subjective self-reports of current status and prior condition. The survey was a regional cross-
sectional, group comparison design with a cross-sequential sampling and data analytic
framework. Scale development for data reduction was utilized to obtain parsimonious measures
for the models. Linear regression was then performed to test the models for three outcome
variables (number of chronic secondary conditions, increases in functional limitations and
number of disability bed days in six months) in a theorized order for the polio and RA samples
individually.
Results: There was partial support for within-sample hypotheses for both polio and
rheumatoid arthritis regarding interrelationships and disability bed days in past six months. No
significant differences were found across subsamples for the effects of timing and severity of
onset of disability characteristics, predicting chronic secondary conditions, predicting increase in
functional limitations, and the number of disability bed days in six months. Similarities were
found between the two samples when examining subgroup predictors on the three outcomes
above. Chronic secondary conditions predicted (p<.05 for both subsamples) increase in
functional limitations and increase in mobility was a significant predictor (p<.001 for both
subsamples) of increase in functional limitations.
Discussion: There were limited findings for these data. Judgment must be withheld with
respect to the hypotheses. The analyses did not yield enough predictive strength to make
comparisons possible across subsamples. Likewise, in examining similarities, only general,
descriptive statements could be made. The subjective nature of disability is an immense
challenge in cross disability research for comparability within disabilities and across disabilities.
i
TABLE OF CONTENTS
LIST OF TABLES ...........................................................................................................................v
LIST OF FIGURES ...................................................................................................................... vii
ACKNOWLEDGEMENTS ......................................................................................................... viii
DEDICATION .................................................................................................................................x
I. INTRODUCTION ................................................................................................................1
A. Statement of the Problem .........................................................................................5
B. Study Goals ..............................................................................................................6
II. LITERATURE REVIEW .....................................................................................................8
A. Disablement .............................................................................................................8
1. The Nagi Model & The Institute of Medicine .........................................................8
2. International Classification of Impairments, Disease, and Handicap ......................9
3. The Disablement Process .......................................................................................10
4. The International Classification of Function, Disease, and Health .......................10
B. Aging with Disability .............................................................................................12
C. Secondary Conditions ............................................................................................13
1. Symptoms ..........................................................................................................15
2. Chronic Conditions ................................................................................................16
3. Functional Limitations and Functional Disability .................................................21
D. Public Health’s Role in Disability .........................................................................23
E. Disability Groups: Polio and Rheumatoid Arthritis ...............................................25
1. Poliomyelitis and Post-Polio Syndrome ................................................................26
ii
2. Rheumatoid Arthritis .............................................................................................31
III. CONCEPTUAL FRAMEWORK AND HYPOTHESES ...................................................37
A. Life Course, Disability Trajectory and Disablement .............................................37
B. Models....................................................................................................................42
C. Conceptual Models and Hypotheses ......................................................................46
1. Polio Hypotheses ...................................................................................................46
a. Interrelationships Among Components ........................................................ 46
b. Unique Disability Characteristics ................................................................. 47
c. Disability Bed Days ...................................................................................... 47
2. Rheumatoid Arthritis Hypotheses ..........................................................................48
a. Interrelationships Among Components ........................................................ 48
b. Unique Disability Characteristics ................................................................. 48
c. Disability Bed Days ...................................................................................... 49
3. Comparison of Disability Group Differences........................................................49
IV. METHODS .........................................................................................................................51
A. Study Design For Secondary Data .........................................................................51
1. Instrumentation ......................................................................................................51
2. Study Sample .........................................................................................................55
3. Sample Demographics ...........................................................................................58
4. Data Collection ......................................................................................................60
B. Model Development for Present Analyses ............................................................60
1. Scale Development ................................................................................................60
2. Predictive Model ....................................................................................................63
iii
3. Final Analysis ........................................................................................................63
V. RESULTS: SCALE DEVELOPMENT .............................................................................65
A. Increases (Change) in Symptoms ...........................................................................65
B. Increases (Change) in Functional Limitations .......................................................66
1. Basic Activities of Daily Living ............................................................................66
2. Instrumental Activities of Daily Living .................................................................68
3. Mobility ..........................................................................................................69
C. Number of Chronic Secondary Health Conditions ................................................72
D. Changes in Model Based on Scale Development Results .....................................73
1. Increase in Functional Limitations .........................................................................73
2. Chronic Secondary Conditions ..............................................................................74
3. Summary ..........................................................................................................75
VI. RESULTS: MODEL TESTING ........................................................................................76
A. Interrelationships Among Components .................................................................77
1. Polio ..........................................................................................................77
2. Rheumatoid Arthritis .............................................................................................78
B. Unique Disability Characteristics ..........................................................................79
1. Polio ..........................................................................................................79
2. Rheumatoid Arthritis .............................................................................................79
C. Disability Bed Days ...............................................................................................80
1. Polio ..........................................................................................................80
2. Rheumatoid Arthritis .............................................................................................80
D. Compare Disability Group Differences: Pooled Sample Hypothesis ...................81
iv
1. Interactions Between Disability Group and The Number Of Chronic Secondary
Health Conditions ..........................................................................................................82
2. Interactions Between Disability Group and Functional Limitations .....................86
3. Interactions Between Disability Group and Disability Bed Days in Last Six
Months ..........................................................................................................89
VII. DISCUSSION .....................................................................................................................94
A. Within-Sample Hypotheses ...................................................................................94
1. Polio ..........................................................................................................94
2. Rheumatoid Arthritis .............................................................................................95
B. Between-Sample Hypothesis: Strength of Predictor-Outcome Relationships .......97
1. Differences ..........................................................................................................98
2. Similarities ........................................................................................................100
C. Policy Implications ..............................................................................................104
D. Limitations ...........................................................................................................105
E. Contributions .......................................................................................................106
F. Recommendations ................................................................................................107
1. Research Methods ................................................................................................107
2. Further Model Development ................................................................................108
F. Conclusion ...........................................................................................................111
REFERENCES ............................................................................................................................113
APPENDICES .............................................................................................................................127
APPENDIX I. Participant Reminder Cards for Polio and RA ....................................................128
v
APPENDIX II. DESCRIPTION OF VARIABLES USED OR DERIVED FROM .......................................129
APPENDIX III. Correlations for Morbidity and Mortality Diagnoses .......................................135
v
LIST OF TABLES
Table 1. Establishment of Reference Period for Rheumatoid Arthritis Sample ..........................54
Table 2. Eligibility Criteria for AwD Survey Study by Impairment Group ................................56
Table 3. Overview of Sampling Framework and Achieved Sample ............................................57
Table 4. Cross-sequential Sampling Design for Achieved Study Sample ...................................58
Table 5. Demographic Differences for Persons Aging with Polio or Rheumatoid Arthritis .......................................................................................................................58 Table 6. Correlation Matrix for Change in Symptoms Variables For Polio Sample (n=218) ..........................................................................................................................65 Table 7. Correlation Matrix for Change in Symptoms Variables For Rheumatoid Arthritis (n=186) ............................................................................................................66 Table 8. Polio Sample Factor Loadings for BADLs ....................................................................67
Table 9. RA Sample Factor Loadings for BADLs .......................................................................67
Table 10. Polio Sample Factor Loadings for IADLs ...................................................................68
Table 11. Polio Sample One Factor Solution for IADLs .............................................................68
Table 12. RA Sample Factor Loadings for IADLs ......................................................................69
Table 13. Polio Sample Factor Loadings for Mobility ..................................................................71
Table 14. Polio Sample One Factor Solution for Mobility ...........................................................71
Table 15. RA Factor Loadings for Sample Mobility ...................................................................72 Table 16. Frequencies for Change in Basic Activities of Daily Living Items for Polio and Rheumatoid Arthritis ...................................................................................73
Table 17. Comparisons of Frequencies of Selected Chronic Health Conditions between Aging with Disability (AwD) Samples of Polio and Rheumatoid Arthritis and Age-Matched 45 – 64 year old and 65+ year old Cohorts from the 1994 National Health Interview Survey (NHIS) ...........................................77 Table 18. Summary of Predictor Interaction Tests for Three Outcome Measures for the Pooled Sample (N=404) .........................................................................................82
vi
Table 19. Summary of Regression Analysis for Variables Predicting Number of Chronic Secondary Health Conditions for Polio (N=218) ............................................83 Table 20. Summary of Regression Analysis for Variables Predicting Chronic Secondary Health Conditions for Rheumatoid Arthritis (N=186) ...............................84 Table 21. Summary of Regression Analysis for Variables Predicting Increases in Functional Limitations for Polio (N=218) ...................................................................86 Table 22. Summary of Regression Analysis for Variables Predicting Increases in Functional Limitations for Rheumatoid Arthritis (N=186) .........................................87
Table 23. Summary of Regression Analysis for Variables Predicting the Number of Disability Bed Days in Six Months for Polio (N=218) ..........................................89,90
Table 24. Summary of Hierarchical Regression Analysis for Variables Predicting the Number of Disability Bed Days in Six Months for Rheumatoid Arthritis (N=186) ...................................................................................................................91,92
vii
LIST OF FIGURES Figure 1. The Aging with Disability Study Conceptual Model ..................................................39 Figure 2. Institute of Medicine (IOM) Model of the Disablement Process and Corresponding Domains Being Utilized ....................................................................41 Figure 3. Conceptual Model for Predicting Disability Bed Days: Polio ....................................48 Figure 4. Conceptual Model for Predicting Disability Bed Days: Rheumatoid Arthritis ..........49
viii
ACKNOWLEDGEMENTS
I have many people to thank. First and foremost, I am indebted to my sponsor, Peter
Messeri, not only for what I have learned from him, but also for his continued support. I will be
forever grateful. Secondly, Margaret Campbell, a mentor and committee member, has always
been so generous and wise with her counsel. I would never have considered including life course
disability in my aging research if it were not for her strong conviction that this research paradigm
was so very important. She is an exceptional woman of great integrity. I am forever indebted to
her for her support. Ana Abraido Lanza (Chair), Victoria Raveis, and Joyce Moon-Howard and
graciously agreed to sit on my committee. Jennifer Hirsch reached out with encouragement and
offers of assistance. Brian Kemp, former Director of the Aging with Disability RRTC at Rancho
Los Amigos, who along with principal investigator Margaret Campbell, allowed me to use these
data. Debra Sheets, a colleague and dear friend with vast amounts of energy, has given me
support, encouragement, and honest advice through the years. I have always appreciated Phoebe
Liebig’s kind interest in my work and life. Her policy expertise is remarkable and she is inspiring.
Kathryn Hyer gave me the crucial “aha” moment. Finally, Laurie Olson has been a friend and
colleague with a sense of humor that has helped me cope.
My family’s support has been amazing, especially these past several months. I appreciate
that my mother, Nancy Proctor, has been so patient with the vicissitudes of my life and this
process despite her own stresses of being a caregiver. I am looking forward to spending the time
with her that she deserves. My sister Holly Moulton and her partner, Kizito Muliro, and my
brother William Moulton took care of me along with my twin sons over this past summer so I
could finish. I could not have managed the home stretch without them. My aunt and uncle,
Rosalyn and Fred Smith, have always provided encouragement, support and have never judged
ix
me (most likely because I wasn’t theirs!). Kasia Dobisz, dubbed “Mommy the Sequel,” has
helped care for and love my boys for approximately the first 7 years of their lives. She helped me
juggle it all. James Estabrook has provided much support over many years for which I will
always be grateful. Anne Evans Estabrook has always given me unwavering support. Jennifer
Estabrook has offered valuable advice throughout difficult periods. Virginia Estabrook, has
inspired me for how she has aged with determination and a sense of humor despite her health.
Finally, thank you to my many, many friends throughout the years who have provided me
with emotional support and to all those who took my kids so I could work. You know who you
are....there are too many to name! A special thanks, in no particular order, to Patti Steckler, Kent
Ozman, Andrea Brock, Jane Dobisz, Lee Keough, Martha Bergh, Julie Holzer, Diane and Lou
DiGiovanni, Pamela Braverman Schmidt, Jennifer, Graham Staines, Julia Dell’Aquila, and Anne
Burris.
One last thank you to Bose, who makes the best noise cancelling headphones in the world.
I couldn’t have concentrated without them!
x
DEDICATION
In memory of Katherine E. Hurd Winchester, my maternal grandmother, who was still
sharp as a tack when she passed away at the age of 95 in Kennebunk, Maine. I will always
remember laughing so hard that I would cry at her stories of the (mis)adventures of picking
“those damn blueberries” after church in the summer when she was a young girl. Her spirit
instilled in me a deep respect for aging and what it has to offer, not what it has to take away.
To my twin sons, Thomson and Kelton, who despite feeling overlooked at times towards
this dissertation’s completion, gave me hugs, love and encouragement. I cherish you.
1
I. INTRODUCTION
Advancements in medicine, health care, rehabilitation and public health in our society
have contributed to an increase in average life expectancy. People are aging with long-term
physical disability acquired earlier in life, and older persons who develop disability are living
longer with their disabilities and are aging into disability. Life expectancy has increased. Those
who live to age 65 have an average life expectancy of an additional 19.2 years (20.4 years for
females; 17.8 years for males) (Administration on Aging, 2011). Additionally, the number of
persons aged 45-64 who will reach 65 within the next 20 years increased by 33%
(Administration on Aging, 2011). In 2010, of the 303.9 million of the non-institutionalized
population, approximately 56.7 million (18.7%) people had a disability and approximately 38.3
million (12.6%) had a severe disability (Brault, 2012). The number of those disabled increased
by 2.2 million from 54.4 million. Approximately 12.3 million people (4.4%) aged 6 years and
older required assistance with at least one basic activity of daily living (BADL) or instrumental
activity of daily living (IADL) (Brault, 2012).
In previous eras, individuals with long-term moderate to severe disability did not survive
long enough to be candidates for aging. Now they are experiencing similar benefits in longevity
as the rest of the population, yet their medical, psychological and social needs are less
understood. With this comes the paradox of longevity. There are increased risks of new health-
related problems that come with longer life. For these persons, the timing of these increased
risks occurs earlier than is seen in the general population. This premature onset has several
implications: health care resource implications, but also psychological and social implications.
A population level (N=10,898) analysis (McColl, 2005) utilizing the Canadian National
Population Health Survey compared disabled and non-disabled adults, aged 20 - 64, on health
2
and disability variables. The health and disability variables were not reported by age groupings,
however, disability status by age was. When four categories comprising persons 45 – 64 years
old are combined, the percentage of those nondisabled in the sample is the 34% compared to
54% of those disabled. With respect to chronic conditions, 49% of the non-disabled had no
chronic condition while 100% of the disabled population had at least one chronic condition. Ten
percent of those who were nondisabled had three or more chronic conditions as compared to
47% of those with a disability. Chronic conditions were not reported by age, but for the entire
sample. Despite the fact that these data were from Canada, it nonetheless highlights the
differences in the timing of the onset of increased disability conditions.
Health for any given person is not static (Rimmer, 1999). A person may be found on
either end of the health spectrum (from low to high) at any given time depending upon any
number of factors. Rimmer (1999) uses the example of a person who at 40 has good health
promotion practices and is at the high end of health but is then diagnosed with cancer. During
chemotherapy this person would be considered at the low end of the health spectrum. Once
treatment is finished, however, and healthy practices resume, health can shift back to the higher
end of the spectrum. Just as persons without long-term disability move in and out of health
during their lives, so do persons with disability (Marge, 1999; Rimmer, 1999).
However, individuals aging with long-term physical disabilities differ from the
population at large in that their shifts in health status typically occur at younger ages and are
preceded by or co-occur with significant increases in impairment related to the underlying
disability and with declines in functioning. Post-polio syndrome provides a perfect example of
moving in and out of health. Many persons who experienced polio “recovered” to move on to
lead healthy productive lives only to start experiencing a decline in their health later in their lives
3
that is due to their primary disability. If the post-polio syndrome is managed well, health may be
maximized within the context of their disability. Rimmer, however, discusses disability only
within the context of health promotion and does not make the distinction between health,
impairment and function. Simply stated, disability is the result of impairment and functional
limitations originating from a primary disease or pathological process (Nagi, 1965) and these are
not static. For instance, an individual with Rheumatoid Arthritis (RA) has periods of disease
fluctuation that can result in an increase in impairment and often a decline in function, but can
also experience a period of recovery where impairment declines and function improves. Yet,
despite this improvement, the overall trend of these individuals’ health declines. This decline
happens earlier thus putting them at risk earlier for the leading causes of death. Rimmer (1999)
also notes that the difference in the health shifts between those who have a long-term disability
and others is that those with disability start at a lower position on the health spectrum and adds
that secondary conditions intersecting with the primary disability is a primary reason for this.
Additionally, those with disability are at higher risk for secondary conditions precisely because
of their primary disability (Marge, 1999).
Campbell and Sheets (1998) compared a sample (N=555) of three age-matched cohorts
who were aging with disability (post-polio, rheumatoid arthritis and stroke) to a national sample
(Adams and Marano, 1995) and found that persons with long-term disabilities reported higher
rates of almost all chronic conditions compared to same-age cohorts from the general population.
Their data suggest that persons with early-onset of physical disabilities experience secondary
health conditions which may put them at risk for “accelerated aging.” They show that compared
to same-age cohorts from the general population, persons with long-term disabilities report
higher rates of almost all chronic conditions. This pattern is most pronounced in the 45 - 64 year
4
old cohort, where rates are two to ten times greater. They conclude that public health
implications include providing health care professionals and disability advocates with
information that can be useful in identifying low and high-risk groups, and in targeting
prevention efforts more effectively. The inclusion of “Disability and Secondary Conditions” as
a Focus Area in Healthy People 2010 (U.S. Department of Health and Human Services, 2000)
indicated the emerging importance of preventing secondary conditions among persons with
disabilities of all ages. However, in Healthy People 2020 (NCHS, 2012), the Disability and
Secondary Conditions Focus Area was expanded to increase the emphasis on health determinants
and address a broader range of objectives. The Focus Area’s name was changed to “Disability
and Health,” thus diminishing the importance secondary conditions.
Policy initiatives such as the New Freedom Initiative (NFI) (2001) and the
implementation of the Olmstead Decision (Olmstead v. L.C., 527 U.S. 581 [1999]) by the
Olmstead Executive Order (13217, June 18, 2001) have increased attention to disability. These
two initiatives have placed tremendous emphasis on independent living and community
integration, both public health related themes. The American with Disabilities Act (ADA, 1990)
was referenced in both the NFI and the Olmstead Decision. The NFI’s key components are:
increasing access to assistive and universally designed technology; expanding opportunities for
those with disability to access to education; promoting full access to community life; increasing
integration into the workforce; increasing access to transportation; and promoting
homeownership. The Olmstead Decision by the U.S. Supreme Court compelled the federal
government to fully enforce Title II of the ADA (U.S. Department of Justice, 1990; U.S.
Department of Justice, http://www.ada.gov/olmstead/q&a_olmstead.pdf). This meant that public
5
entities must avoid disability-based discrimination and provide to persons with disabilities
community-based services if the services are appropriate and can be reasonably accommodated.
The most recent legislation to positively impact individuals with disabilities is the Patient
Protection and Affordable Care Act (PPACA) signed into office on March 23rd of 2010 by
President Obama (PPACA, 2010). It mandates and provides incentives to: 1) expand home or
community-based care and directly cites the Olmstead Decision; 2) remove barriers and improve
access to wellness for persons with disabilities; 3) eliminate discrimination against individuals
because of age, disabilities or life expectancy with regard to coverage or reimbursement; and
develop a healthcare workforce versed in cultural competency, prevention and public health. On
a more macro level, the PPACA includes programs that balances types of care, establishes a
single point of entry, and improves coordination and transitions between care settings, all of
which greatly benefit individuals with disabilities, as well as all users (Reinhard, Kassner and
Houser, 2011).
A. Statement of the Problem
Because persons with disability have been under represented in national surveys and the
data that have been collected across surveys are not comparable, it has been difficult estimating
the number of persons aging with long-term disability (Campbell, Sheets and Strong, 1999).
Additionally, better questions, such as age at onset and duration of primary disability, need to be
asked. It is therefore difficult to estimate the costs to individuals and to society that are
associated with secondary health conditions. There are direct and indirect economic costs such
as medical dollars associated with the need for increased health care services, the inability for
persons to engage in gainful employment, and the need for increased level of assistance. There
are also social costs such as the decrease of quality of life for individuals and their families.
6
Identifying risk factors for secondary health conditions will assist in determining how best to
reduce the overall risk for age-related chronic conditions and thus reduce economic costs and
increase quality of life for individuals aging with long-term disability.
Before risk factors can be adequately assessed, secondary conditions have to be better
defined and understood. Verbrugge, Merrill and Liu (1999) discuss the continually expanding
survey questions used to measure disability and call for a global disability item similar to
morbidity’s self-rated health in an effort to be parsimonious in measuring disability. Not having
a widely accepted definition limits the ability of researchers to compare results and compile data
sets for techniques such as meta-analysis. Determining key indicators of the components that
comprise secondary conditions will also assist in creating more parsimonious models even if one
global measure cannot be defined.
Past analyses using disability populations have utilized univariate and bivariate
approaches. The literature has largely focused on conceptual refinement. Interrelationships of
secondary conditions have not been examined with respect to how they work together to effect
some policy related variable or health outcome.
B. Study Goals
This study is a methodological investigation to advance the understanding of
interrelationships among hypothesized declines in health and function experienced by persons
aging with the long-term disabilities of polio and rheumatoid arthritis. It will explore the effects
of the trajectory of unique disability characteristics on the frequency and consequences of
declines in health and function, examine the consequences of these declines in health and
function on a health policy outcome, and finally compare distinctive disability characteristics
between polio and rheumatoid arthritis on the trajectories of health and decline in function.
7
Independent of any hypotheses is another objective, which is to develop and test
measurement models. Multiple indicator latent variables are constructed the major components
of the chronic secondary conditions construct for persons aging with disability: 1) onset of new
or increased disability-related symptoms; 2) onset of new declines in functional status; and 3)
onset of chronic secondary conditions. The interrelationships among these measures are then
examined.
Four goals are presented to address the measurement and understanding of secondary
conditions across polio and rheumatoid arthritis.
1. Advance the understanding of interrelationships among the components of secondary
conditions for polio and rheumatoid arthritis;
2. Explore how the unique disability characteristics of polio and rheumatoid arthritis
with respect to severity at onset and temporal disability may be linked to differences
in secondary conditions;
3. Advance the understanding of the consequences of secondary conditions on disability
bed days for individuals aging with long-term disabilities of polio and rheumatoid
arthritis; and
4. Compare potential subgroup differences between individuals aging with polio and
rheumatoid arthritis in central indicators of each secondary condition component.
8
II. LITERATURE REVIEW
A. Disablement Disablement is a process of change. Understanding disability, its complexities, and its
impact at the individual and societal levels is a challenge. Since Nagi (1965) first proposed his
framework of disability in an effort to define and conceptualize disability, it has endured several
decades and is the basis for the models described below. The concept of disablement describes a
pathway with several domains from pathology to disability. Although these labels have evolved
and in some cases, have been changed considerably, Nagi’s basic model has endured. This
pathway is the result of a process that involves biological, environmental (social and physical),
and lifestyle and behavior risk factors. Each point in the progression along the pathway can be
influenced by these risk factors. The extent of disability and how it is experienced is the result of
susceptibility due to these risk factors.
The basis for the model presented in this dissertation is that of Nagi’s (1965) and the
IOM’s (1991). However, a review of the history of other primary models is useful as it illustrates
the difficulties of developing a model that meets, at times, competing needs.
1. The Nagi Model & The Institute of Medicine
The concepts in Nagi’s (1965) scheme, active pathology, impairment, functional
limitation, and disability were similar to the ICIDH, however, there was no parallel to the ICIDH
“handicap” concept because of Nagi’s sociomedical framework (Verbrugge and Jette, 1994).
Verbrugge and Jette (1994) emphasize the intellectual scope and adaptability of Nagi’s scheme.
This scheme consisted of 1) active pathology, the origin and defined as an interference of normal
processes resulting from infection, trauma, metabolic imbalance, degenerative disease or other
etiology and the concomitant efforts to normalize; 2) impairment defined as anatomical,

9
physiological, mental, or emotional abnormalities or loss; 3) functional limitation defined as
limitation in performance of the individual due to the effects of impairment; and 4) disability
defined as limitation in performance of socially defined roles and tasks within a sociocultural and
physical environment. The IOM (1991) adopted the Nagi model with revisions by Nagi himself
(1991), adding risk factors that occur both within the individual, and in the physical and social
environment. It was again revised (IOM, 1997) in 1997 to expand on environmental factors and
add quality of life.
2. International Classification of Impairments, Disease, and Handicaps
The International Classification if Impairments, Disease, and Handicaps (ICIDH, 1980)
was a taxonomy of disease impacts with three central concepts, impairment, disability, and
handicap, that were tied to the International Classification of Diseases (ICD, 1986) used in
medicine and health statistics. Disease was the origin of the model. Three levels of performance
were then described that were conceptually distinct. Impairment corresponded to organ-level
performance and defined as loss or abnormality of psychological, physiological, or anatomical
structure or function. Disability corresponded to person-level performance and was defined as a
restriction of lack of ability to perform an activity in a normal manner. Handicap was defined as
disadvantage due to impairment or disability that limits or prevents fulfillment of a person’s
normal role (depending upon age, sex, sociocultural factors) and corresponded to societal level
performance. Controversy arose with the use of “handicap” and also neglecting to consider
environmental factors (Whiteneck, 2007). As a result, a modified model, International
Classification of Functioning, Disability, and Health (ICF) (WHO, 2001) was introduced and is
discussed below.
10
3. The Disablement Process
Verbrugge and Jette, (1994) described “The Disablement Process,” a sociomedical model
of disability built on Nagi’s (1965) conceptual scheme of disability and to a lesser extent, the
International Classification if Impairments, Disease, and Handicaps (ICIDH, 1980). The
components of Verbrugge and Jette ‘s disablement process expanded upon Nagi’s model by
accounting for behaviors that increase risk factors or buffers to functional limitations and
disability. These factors are extra-individual and intra-individual. Extra-individual factors
include medical care and rehabilitation; medications and other therapeutic regimens
(biofeedback/meditation, etc.); external supports; and built, physical, and social environment.
The intra-individual factors include lifestyle and behavior changes (overt changes to alter disease
activity); psychosocial attributes and coping (prayer, peer support groups, locus of control, etc.);
and activity accommodations.
An important aspect of this model is the recognition that these factors may operate along
the disablement trajectory at any point. Additionally, it allows for other outcomes such as quality
of life (placed after disability), and “feedback loops” for secondary conditions and dysfunctions
within a disablement process or new disablement processes. Verbrugge and Jette (1994) discuss
the actuality that disability is a gap between person and environment. Furthermore, a key
element of the disablement process is the malleability of demand and reducing that demand by
activity accommodations, environmental modifications, psychosocial coping, and external
supports.
4. The International Classification of Function, Disease, and Health
Verbrugge and Jette, (1994) described “The Disablement Process,” a sociomedical model
of disability built on Nagi’s (1965) conceptual scheme of disability and to a lesser extent, the
11
International Classification if Impairments, Disease, and Handicaps (ICIDH, 1980). The
components of Verbrugge and Jette ‘s disablement process expanded upon Nagi’s model by
accounting for behaviors that increase risk factors or buffers to functional limitations and
disability. These factors are extra-individual and intra-individual. Extra-individual factors
include medical care and rehabilitation; medications and other therapeutic regimens
(biofeedback/meditation, etc.); external supports; and built, physical, and social environment.
The intra-individual factors include lifestyle and behavior changes (overt changes to alter disease
activity); psychosocial attributes and coping (prayer, peer support groups, locus of control, etc.);
and activity accommodations.
An important aspect of this model is the recognition that these factors may operate along
the disablement trajectory at any point. Additionally, it allows for other outcomes such as quality
of life (placed after disability), and “feedback loops” for secondary conditions and dysfunctions
within a disablement process or new disablement processes. Verbrugge and Jette (1994) discuss
the actuality that disability is a gap between person and environment. Furthermore, a key
element of the disablement process is the malleability of demand and reducing that demand by
activity accommodations, environmental modifications, psychosocial coping, and external
supports.

12
B. Aging with Disability Aging is a lifelong developmental process that starts at birth. For most aspects of aging,
chronological age is a poor measure (Sheets, 2010). Disability may occur at any point along the
developmental aging process. Those who are disabled experience aging with disability, while
those who are aging experience disability with aging. Aging with disability is increasingly
recognized as an important and challenging area to study. Until recently, individuals aging with a
disability have not enjoyed the same life expectancy as their non-disabled peers. Advances in
medicine and rehabilitation have made it possible for many with long-term disabilities to live
into later life. As a result, the onset of secondary conditions (complications to the primary
disability) is experienced earlier than those who are aging into disability and contributes to an
accelerated aging (Campbell, 1997).
Persons with lifelong disability do not always have the same opportunities with respect to
skills, activities and life experiences (Verbrugge and Jette, 1994) as those who are experiencing
disability with aging. The disability with aging cohort experience disablement gradually and can
work to restore capabilities they once had (Verbrugge and Jette, 1994). Thus, the individual
aging with a life-long disability “looks” very different from the person who has developed
disability with aging.
While there is some overlap between these two disability groups, they are very different.
Their languages and behaviors differ. Age composition, professional background of its members
and the type of services utilized characterizes the disability community (Campbell, 1997). Those
who are in the disability with aging cohort are 65 years old and older, are in the aging network
and have a more recent onset of disability. Age at onset (birth to young middle-age vs. mid to
later life), cause of disability (congenital & acute disease/injury vs. chronic health conditions),
13
group identification (disability culture vs. ill-health), consumer role (advocates vs.
patients/recipients) and professionals involved in service delivery all differ (Campbell, 1997).
Some collaboration between the two groups has existed in the scientific community,
however, in the discipline of social service, disability and aging have been distinct (Verbrugge
and Yang, 2002). The two groups have been shaped historically by policy. Even as far back as
the revolutionary war the government paid soldiers disability-related and old-age pensions
(Putnam, 2007). Restricted perceptions have existed since this time. Disability programs are
focused on education, employment and housing, where aging programs focus on social well-
being and disease management (Verbrugge and Yang, 2002). Campbell (1997) contrasts the
policies that helped to shape these two groups. The efforts of the disability community’s political
activism resulted in the amendment to the Rehabilitation Act in 1978 and passage of the
Americans with Disabilities Act of 1990, which set standards for public and workplace
accessibility, but no way to implement them. In the aging network, legislative action created the
area agencies on aging to expand the social service programs under the Older American’s Act of
1965.
C. Secondary Conditions Secondary conditions in persons aging with long-term disability constitute negative and
costly consequences of the disablement process, which through interventions and treatment, can
be prevented or reduced (Campbell, Sheets, Rhaney and Moulton, 1999). They can compromise
function that can lead to a loss of independence, undermine economic self-sufficiency, contribute
to “accelerated aging,” and increase utilization of health and long-term care services. What
defines a primary condition or a secondary condition or a chronic condition or a comorbid
condition can depend upon one’s disciplinary perspective.
14
The concept of secondary conditions is a complex multidimensional construct. Marge
(1988) was the first to name and define “secondary disabilities.” The Institute of Medicine (Pope
and Tarlov, 1991) cited Marge’s work, however, it was reframed as “secondary conditions.”
Currently, the term “secondary conditions” has no operational definition which functions as a
gold standard (Campbell, Sheets and Strong, 1999; Wilber, Mitra, Walker, Allen, Meyers and
Tupper, 2002; Nosek, Hughes, Petersen et al, 2006). In the Institute of Medicine’s (Pope and
Tarlov, 1991) model, secondary conditions are defined as “a condition that is causally related to
a disabling condition (i.e., occurs as a result of the primary disabling condition) and that can be
either a pathology, an impairment, a functional limitation, or an additional disability”....and
“would not occur in the absence of the primary condition (p.214).” This causal relationship that
is discussed can be either direct or indirect. In Healthy People 2010 (U.S. Department of Health
and Human Services, 2000) secondary conditions is defined more broadly as “medical, social,
emotional, family, or community problems that a person with a primary disabling condition
likely experiences (p. 6-3). ”
The above definitions represent just two of the various definitions for secondary
conditions that can be found in the disability and public health literature. Other definitions
include factors such as complications and injuries that occur after the onset of the primary
disability, new and/or increased symptoms, impairments, functional limitations, limitations in
ADLs and IADLs, and limitations in social roles (Campbell, 1999). Wilber et al. (2002) cite the
use of even broader definitions such as health-related economic consequences for the individuals
and members of their families. Campbell, Sheets, and Strong (1999) discuss, as a definition of
secondary conditions found in the literature, the inclusion of age-related chronic conditions (also
known as co-morbidities) that affect the general aging population, but may occur earlier and

15
more frequently for persons with physical disabilities because of a narrower margin of health
(DeJong and Hughes, 1982). Presently, the term secondary condition lacks clarity. More research
is needed to elucidate the causes and consequences of secondary conditions with respect to
disablement (Jette, 2006). Secondary conditions for this present analysis will include symptoms,
chronic conditions and functional limitations.
1. Symptoms
Different disabilities have different symptoms; however, pain, fatigue and muscle
weakness cuts across almost all disabilities. They are three of the most common symptoms
experienced by persons aging with disability and should not be confused with normal aging.
These symptoms, if not addressed, can result in further disability. Further and specific discussion
with regard to these three universal symptoms can be found in the polio and rheumatoid arthritis
sections.
Disability has been found to be a strong predictor of chronic pain (Kinne, 2004) and
requires examination to identify its cause in an effort to preserve function and to prevent or delay
further decline. Fatigue is characterized by tiredness, loss of energy and inability to carryout
everyday activities. It is three times more frequent in persons aging with disability than with the
general population (Thompson, 2004). Extreme fatigue and pain have been found to have an
independent relationship to fair to poor health (Kinne, 2004). Cook, Molten and Jensen (2011)
found in their study of persons aging with spinal cord injury, post-polio syndrome, multiple
sclerosis, and muscular dystrophy, that the risk of fatigue is greater than those without a
disability and it also increases with age compared to normative values. Fatigue can impact all
aspects of one’s life. It can interfere in functional activities, sleep, and contribute to depression
for example. It is often not given credence by health care professionals because of confounding
16
variables such as lack of sleep and depression. Work simplification and energy conservation
techniques can help to ameliorate fatigue.
Muscle weakness is characterized by diminished physical or muscle strength. It can be
associated with muscle and joint pain, general deconditioning and sarcopenia. There is a feeling
that extra effort is required to perform activities. Depending upon where the muscle weakness is,
throughout the body or isolated to specific muscles, there are implications for limitations. Upper
extremity weakness can result in the loss of one’s ability to propel a wheelchair or perform
activities of daily living such as dressing, bathing, and meal preparation. Lower extremity
weakness can interfere in ambulatory activities. Exercise is valuable in promoting and
maximizing overall health, but must be approached conservatively as too much exercise can be
counterproductive and cause injury.
2. Chronic Conditions
Turk (2006) outlines the history of secondary conditions from concept to practice. She
identifies the key dimensions of secondary conditions and then places secondary conditions
using the taxonomies of disabilities from rehabilitation science and clinical practice. These are
“primary conditions,” “associated conditions,” “comorbidities,” “aging” and “health.”
“Treatment complications” is another category added (Field and Jette, 2007) to this list. Primary
conditions are the fundamental sources of disability. Associated conditions are aspects of the
pathology of the primary condition that are expected to occur. Turk (2006) uses as example the
primary condition of cerebral palsy that has several expected (associated) conditions that may or
may not occur and to varying degrees: seizures, spasticity (an aspect of upper motor neuron
impairment) and cognitive impairment. Comorbidities are health conditions that are independent
of the primary condition. Aging occurs whether there is a primary condition or not, however,

17
problems associated with accelerated aging, such as early-onset deconditioning, can be
considered secondary conditions (Turk, 2006). Similar to Rimmer (1999), Turk defines health as
a continuum that is not the absence of impairment or disease, but is dependent upon management
of chronic disease, maintaining function and preventing secondary conditions. Treatment
complications result from treatment of the condition and not the condition itself and can be
preventable (Field and Jette, 2007). An example would be a side effect of a medication used to
treat the primary condition.
In the medical literature, treatment complications have been identified as comorbidites
(NRAS, 2012). With respect to rheumatoid arthritis, two types of comorbidity are defined: those
resulting directly from the disease and those resulting indirectly from treatments (NRAS, 2012).
In a review of comorbidity measurement, de Groot, Beckerman, Lankhorst and Bouter (2003)
acknowledge that there is no consensus with regard to the definition of comorbidity, but stipulate
when an index (or primary) disease is required for conducting research. In research on
multimorbidity no index disease is used, however, comorbidity research requires that an index
disease be used. They note that comorbidity can be either the consequence or cause of a primary
disease and they may also share the same risk factors.
There is a general agreement that the common denominator across definitions is that
secondary conditions occur after the onset of the primary disability and are directly or indirectly
related to it (Ravesloot, Seekins & Walsh, 1997; Campbell, Sheets and Strong, 1999; Kinne,
Patrick and Lochner Doyle, 2004; Turk, 2006; Rasch, Magder, Hochberg et al., 2008).
Additionally, agreement exists with regard to factors that cause secondary conditions: overuse of
a neuromuscular system weakened from the primary condition (Turk, Overeynder and Janicki,
1995); under or misuse of the neuromuscular system due to problems with gait, immobility or
18
deconditioning for example (Krause, 1996); complications from the primary condition
(Treischmann, 1987); poor coping strategies and lifestyle behaviors such as alcohol abuse, poor
nutrition, smoking, etc.; and environmental and attitudinal barriers that result in limiting access
to health promotion and social participation (Brandt and Pope, 1997). Research by Kinne (2008)
and Nosek, Hughes, Petersen et al (2006) illustrates the differences in how secondary conditions
are defined, nonetheless, they each provide evidence of the magnitude of these conditions. Kinne
follows the International Classification of Functioning, Disability and Health (ICF) (WHO,
2001) model and delineates between types of secondary conditions: secondary medical problems,
secondary impairments and secondary participation limitations. Nosek, Hughes, Peterson et al
eliminated conditions that resulted from or reflected their subjects’ interaction with their
environment and focused on health outcomes.
A conceptual model of secondary conditions that incorporates the ICF is proposed by
Rimmer, Chen and Hsieh (2011) for the purposes of promoting higher-quality research in
secondary condition prevention among rehabilitation and public health researchers. Before
addressing their conceptual model, they propose a hierarchical set of criteria for defining a
secondary condition and created a decision-making algorithm for identifying them. They then
present a conceptual model of the onset, course, and outcomes of secondary conditions in people
with disabilities. As complex as their overall model is, their algorithm for identifying secondary
conditions and corresponding management spectrum (p. 1732), if adopted by enough researchers,
would go a long way in uniformly identifying secondary conditions.
Ravesloot, Seekins and Walsh (1997) performed a structural analysis to determine how
secondary conditions might group and if factors are related to various primary impairments.
They found that primary impairments did not predicted specific factors of secondary conditions,
19
however, certain secondary conditions were evident across a variety of impairments. Kinne
(2004), in a population based cross-sectional study, found that secondary conditions were
common among adults with disabilities, and that disability was the strongest predictor of pain,
weight problems, fatigue, problems getting around, falls and other injuries, sleep problems,
muscle spasms, and bowel and bladder problems. Nosek, Hughes, Peterson, Taylor et al (2006)
found in a cross-sectional study of women who were primarily ethnic minorities, that secondary
conditions in women with physical disabilities were more problematic than previously reported
in the literature.
Chronic conditions is a term used primarily in medicine and health services research for
the purposes of describing trends (Martin, Freedman, Schoeni and Andreski, 2010), patterns of
utilization (Schneider, O’Donnell and Dean, 2009) and estimating chronic conditions (Freid,
Bernstein and Bush, 2012), managing and preventing chronic disease (Martin, Freedman,
Schoeni and Andreski, 2010), predicting health care needs (Wolff, Starfield and Anderson, 2002)
and costs (Wolff, Starfield and Anderson, 2002; Schneider, O’Donnell and Dean, 2009; Lewin
Group, 2010), and measuring quality of care (Iezzoni, 2010). Chronic conditions are often
analyzed with functional limitations for the impact it has at an individual as well as a societal
level. It can be defined as comorbidity based on diagnostic codes (Wolff, Starfield and Anderson,
2002). It can also be defined simply as a condition that lasts more than12 months and results in
functional limitations or requires ongoing care (Lewin Group, 2010) or as health problem that
persists over time without cure and caused by an underlying disease (Iezzoni, 2010). Iezzoni
(2010) provides a thorough discussion of the definitions of chronic conditions and disability. She
identifies disease and disability as distinct concepts that often coexist. Disease frequently
contributes to disability and disability can cause secondary conditions or new diseases. This is

20
illustrated by her example of osteoarthritis impairing ambulation as a disease contributing to
disability and spinal cord injury contributing to pressure ulcers as a disability causing secondary
conditions or new diseases.
The term multiple chronic conditions (MCCs) is gaining traction among health care
professionals and researchers as it recognizes that increasing numbers of the U.S. population
have two or more chronic conditions (Iezzoni, 2010; Freid, Bernstein and Bush, 2012). From
2000 – 2010, Freid, Bernstein and Bush (2012) found an increase in the percentage of adults who
had two or more of nine selected chronic conditions in both the 45 – 64 and 65+ cohorts. These
findings held across gender, all racial and ethnic groups studied and most income groups. There
has not been an explicit recognition that multiple chronic conditions pose an important additional
complexity to our healthcare system (Parekh, Goodman, Gordon, Koh et al., 2011). The National
Quality Forum’s final report (2012) for the MCCs Measurement Framework considered the
difficulties of how MCCs are defined. A broad definition cited is the presence of two or more
conditions. The difficulty with this is that it potentially captures too large a population and does
not consider complexity and interactions of MCCs, e.g., having chronic sinusitis and
osteoarthritis of the knee versus rheumatoid arthritis and diabetes. The report also cites the
Agency for Healthcare Research and Quality’s (AHRQ) definition as addressing the
complexities and interactions, yet it leaves out health status considerations such as function and
quality of life. As a result of these incomplete definitions, the MCCs Steering Committee has
defined MCCs as “having two or more concurrent chronic conditions that collectively have an
adverse effect on health status, function, or quality of life and that require complex healthcare
management, decision-making, or coordination (p. 7-8).” This definition, gives substance to the
complexity that MCCs bring to healthcare.
21
The move from a single disease focus to a multiple disease focus is an inevitable one.
Treating illnesses individually ignores the synergistic impact (Vogeli, Shields, Lee, Gibson et al.,
2007) of MCCs. Furthermore, treatment guideline conflicts can easily arise resulting in potential
harm (PFCD, 2013). Patients are managed with MCCs in an acute care delivery and financing
system (Thorpe, 2013), yet there is little health policy research with regard to the complex
challenges that these patients present (PFCD, 2013; NQF, 2012; PCORI, 2013). These
challenges exist across the spectrum of health care and involve (Thorpe, 2013): patient
empowerment; evidence-based management including pay-for-performance; and effective
models of care that encompass prevention, self-management, caregiving and care coordination,
and workforce training. A further challenge is to recognize that whether they are named
secondary conditions, chronic conditions, comorbidities or secondary chronic conditions, on a
practical level, secondary chronic conditions are becoming more common across the entire
lifespan. It is important not to lose sight that there is an increasingly younger population that has
a long-term primary disability that they will be aging with. Not only will they have secondary
chronic conditions, they will develop additional conditions that they will have to live with earlier
than they would have to without their primary disability. Thus as younger populations are living
longer with disabilities that were once not survivable into an advanced age. The healthcare
system needs to treat people with long-term chronic disability at all ages with the same basic
framework that will take into consideration variations in age and disability.
3. Functional Limitations and Functional Disability
Functional limitations are restrictions in an individual’s ability to perform tasks or
activities. Following the IOM/Nagi disablement model, functional limitations are the results of
impairment and in turn are a measure of disability. It is important to note that not all impairment

22
leads to functional limitations and mild functional limitations may not lead to disability. In
research, functional limitations have traditionally been measured by three components: basic
activities of daily living (BADL), instrumental activities of daily living (IADL), and mobility.
Items included in each component can vary, but are generally similar from study to study. There
is disagreement in the literature as to whether these measures are hierarchically related (Spector
and Fleishman, 1998; Thomas, Rockwood and McDowell, 1998).
BADL items are eating, dressing, bathing, transferring (from bed to chair), toileting, and
grooming. IADL items can include meal preparation, shopping, chores/light housework, money
management, medication management, and telephone use. Mobility, the ability to move from one
point to another independently, is used as a component or can be placed under the BADL
component. Examples (Guralnik, 2011) of items that can assess mobility are unable to walk ½
mile or climb stairs (higher mobility disability), or unable to walk across a small room without
help (severe mobility disability). Other mobility items found are getting around in the
community, wheelchair use.
Measuring functional disability varies in approach depending upon the how BADLs and
IADLs are combined (Spector and Fleishman, 1998). One very common approach is to use them
as separate constructs. A second approach is to only use the IADL measure for those without
BADL disability thus creating one construct with a summary score from the two measures. A
third approach, taken by Spector and Fleishman (1998), was to develop a functional disability
score from both measures using factor analysis and item response theory (IRT). Their findings
demonstrated that the two measures are not hierarchically related and a simple sum could be
used to derive a measure of functional disability. Using Guttman scaling and IRT, LaPlante
23
(2010) found that an IADL/ADL scale measuring “need for help” is hierarchical, unidimensional,
and unbiased for age as compared to the classic ADL measure.
There is also no agreement as to which items to include and in which measures if BADLs,
IADLs, and mobility are used separately. Often a respondent is asked for each component item
if they have had difficulty performing the task in question and if so, how much difficulty. The
items can then be used as a scale. Items have been asked dichotomously. Mobility items also
lend themselves well to being used as performance measures (Guralnik, 2011).
D. Public Health’s Role in Disability
Public health grew out of an effort to reduce mortality and later to reduce morbidity, but
has responded slowly to the health needs of the disabled population in part because disability
outcomes are not as clearly defined as mortality and morbidity (Lollar and Crews, 2003).
Furthermore, public health perspectives regarding disability have viewed disability as a “burden
of disease” and a disparity in access to the environment Krahn, Putnam, Drum and Powers,
2006). Research and interventions are population based with measures focusing on morbidity,
mortality, and quality of life. Intervention focuses on primary prevention and prevention of
secondary conditions. The contemporary perspective (Krahn and Campbell, 2011) is that
persons with disability are a minority group at increased risk for poor health with the primary
outcomes being health status and health related quality of life (HRQOL) that are influenced by
disease that results in disability. Disability is a negative outcome and represents a failure to
prevent an undesirable state (Crews and Lollar, 2006). The emerging perspective (Krahn and
Campbell, 2011) is where disability is viewed as one multiple determinants of health. Persons
with disabilities are part of the general population and disability is just one of multiple risk
factors for poor health.

24
Pope and Tarlov (1991) pointed to a first revolution in public health occurring with
sanitation, basic nutritional needs, and immunization which resulted in 1) longer life expectancy,
and 2) acute disease being joined with chronic disease as a focus of public health attention. They
emphasize the challenge of creating a second revolution that centers on lifestyle and behavior as
primary components in health promotion and disease prevention. They stress that traditional
public health interventions have not had the same impact on chronic disease and its related
disabling conditions.
Just over ten years after Pope and Tarlov (1991) conclude that public health has fallen
short of impacting chronic disease, Albert, Im and Raveis (2002) discuss, in their American
Journal of Public Health (AJPH) editorial, “Public Health and the Second 50 Years of Life,” how
little the discipline has promoted public health in people 65 years and older. To illustrate this
they randomly sampled nine of twelve issues of AJPH published in 2001 and counted original
research articles that included people over 50 years of age. Twenty-two percent of the articles
addressed persons 50 years or older and many of those studies did not have study populations
over 65 years of age.
In the same editorial, Albert, Im and Raveis discuss three pathways to disability in aging
and identify public health strategies to modifying those pathways. In their model, a distinction is
made between the physiological changes of aging that are not disease-based and lead to frailty
and subsequent disability, comorbid conditions added to senescent changes that lead to disability,
and the social and psychological environmental factors that result in disability. They reference a
study by Freid, Tangen, Walston, et al (2001) where 18% of the study population of 363 older
adults had a disability that was likely the result of complex environmental, psychological and
social factors. Albert, Im and Raveis recommend that the public health research community
25
direct more attention to the second 50 years of life and conclude that the AJPH is a good place to
start. Although not explicitly stated, there is an implication that people aging with a disability
might be included in the category of requiring more direct attention in the next 50 years.
Responding to this editorial, Crews and Smith (2003) specifically highlight the concept
of aging with a disability. They suggest that persons aging with a disability need to be included
in the “second 50 years” and recommend that aging and disability need to be modeled together.
They conclude that consideration should be given to specific disabilities when designing public
health interventions directed at aspects of health such as secondary conditions.
Illustrating how the disability and public health communities can build a future together,
Rimmer (2011) explains how disability can be a component of each Section of the American
Public Health Association. Because disability cuts across every area of public health, having
Disability Section members who are knowledgeable in a second content area belong to both
Sections would facilitate communication between all the stakeholders. Rimmer uses the
Gerontological Health Section as an example and cites modern medicines advances leading to
millions of adults who are aging with disabilities and facing secondary conditions as just one of
risk factors that challenges successful aging. Taking secondary conditions, he uses prevention
and health management strategies to tie public health, aging with a disability and aging into
disability together and thus the communities of each.
E. Disability Groups: Polio and Rheumatoid Arthritis
The two disability groups used in this analysis represent two very different disease
courses as well as distinct ages at onset. Poliomyelitis is caused by a viral infection and has an
acute onset with paralysis. Rheumatoid arthritis is a progressive systemic inflammatory disease
that affects the joints of the body and can have a fluctuating disease process.

26
1. Poliomyelitis and Post-Polio Syndrome
Poliomyelitis has been eradicated in much of the world. According to the Polio Global
Eradication Initiative (http://www.polioeradication.org/), the last case of the wildpolio virus type
3 (WPV3) strain of polio was reported in Asia occurred on the 18th of April 2012 in Pakistan.
Nigeria, until very recently, was the only country worldwide that has reported a new case of
WPV3 and that was on the 10th of November 2012. The wildpolio virus type 2 (WPV2) strain
was eradicated in 1999. If there are no new cases of WPV3, it will be the second strain
eradicated. Wildpolio virus type 1 (WPV1) remains with these cases located in third world
countries. This strain had not been detected in the Syrian Arab Republic since 1999, however,
due to civil conflict in the country, vaccination rates have fallen dramatically form 91% in 2010
to 68% in 2012 resulting in ten confirmed cases on October 17 of this year. These cases are of
mostly children under two years old and there are more cases yet to be confirmed (World Health
Organization, 2013).
The development of the polio vaccine has lead to near eradication worldwide and is a
remarkable achievement. However, there are an estimated 2.1 million Syrian refugees in five
neighboring countries: Lebanon, Jordan, Turkey, Iraq, and to a lesser extent, Egypt (Hummer,
2013). The risk is considered to be high for the infection to spread to these neighboring countries
and beyond (World Health Organization, 2013). With the refugee situation and an increasingly
global mobile society, the success of near eradication is potentially jeopardized.
The last case of polio was in 1979 (Centers for Disease Control, 2013). Halstead (1987)
estimated that there are 250,000 persons still alive in the United States who contracted paralytic
polio before the vaccines were introduced in 1955. If one includes both paralytic and non-
paralytic cases, there may be as many as 1.6 million survivors (National Center for Health
27
Statistics, 1989). The National Institute of Neurological Disorders and Stroke (2012) has slightly
different figure and acknowledges that the incidence and prevalence of those with post-polio
syndrome is not known as no survey has been conducted since the U.S. National Health
Interview Survey in 1987. They estimate that there are 443,000 paralytic polio survivors out of
one million with about 25 – 40% having developed post-polio syndrome.
A phenomenon began emerging among polio survivors that was first identified in 1875
by Raymond and Charcot (Dalakas, 1995) as “overuse.” This theory is still discussed today as
the primary cause of post-polio syndrome (PPS). Halstead (1992) established the term “post-
polio syndrome” and defined it as those persons who were symptomatic in regard to both new
health problems and functional limitations. PPS is characterized by new muscle weakness,
muscle wasting, fatigue, and muscle or joint pain that result from an earlier episode of
poliomyelitis (Halstead, 1988; Mulder, 1995; Dinsmore, 1998). A diagnosis of PPS requires that
an individual must report two or more of these symptoms and have a least one new activity of
daily living (ADL) limitation. These new symptoms typically appear about 25 to 40 years after
infection (Grimby and Jonsson, 1994), however, the PPS diagnosis only requires a period of at
least 15 years of neurologic and functional stability (Halstead and Rossi, 1987). Additionally, no
other medical diagnosis should explain the new health problems in order for the diagnosis of PPS
to be used (Halstead and Rossi, 1987). The diagnosis of PPS is one of exclusion where all other
possible causes must be ruled out, thus making a diagnosis more challenging with possible
coexisting conditions attributable to aging (Farbu, 2009). Late-onset sequelae of poliomyelitis
(LOSP) is a term used to refer to new symptoms in a person who has polio, but does not meet the
criteria for post-polio syndrome. These symptoms may be secondary conditions related to prior
polio.
28
Wiechers, and Rossi (1985), and Halstead and Rossi (1988) found significant
relationships between historical period and age at acute onset, and between age of onset and
severity of initial impairment. Fewer limbs were affected by weakness or paralysis if the polio
was contracted before the age of 10 compared to those whose onset of polio was during
adolescence or young adulthood. Campbell (1994) found significant effects between age and
historical period of acute onset in predicting both the severity of initial impairment and the
presence of PPS. Their data are consistent with prior studies (Dauer, 1955; Weinstein, Aycock,
and Feemster, 1951; and Weinstein, 1957; Halstead, Wiechers and Rossi, 1985; Halstead and
Rossi, 1988) and provides evidence that stage in the life cycle when polio was contracted and
historical context impacts how impaired an individual was by the virus. Their results show that
as both the age at acute onset and the decade in which polio occurred increases, so does the
percentage of the sample with 3 and 4 limbs affected (as opposed to 1 or 2 limbs). Significant
increases occurred for those who had polio at 10 years or older and who contracted it after 1940.
There are three major symptoms associated with post-polio syndrome: new muscle
weakness, fatigue and pain. The hallmark symptom of post-polio syndrome is new muscle
weakness (Gawne and Halstead, 1995). The pattern of new weakness, sometimes accompanied
by atrophy, presents as slowly progressive, asymmetrical and scattered, occurring in either
previously affected or muscles that were not affected during the acute episode (Jubelt and Agre,
2000; Silver and Aiello, 2002; and Farbu, 2009), as well as those affected subclinically (Farbu,
2009). Additionally, increased activity results in exacerbation of the weakness by the end of the
day (Silver and Aiello, 2002). Related to new weakness is the overuse of these abnormally
fatigued muscles that require extensive rest to recover (Jubelt and Agre, 2000). Research with
regard to functional muscle strength/new weakness is limited. Nollet, Belen, Prins et al (1999)

29
looked at persons with and without PPS in a study of polio survivors with late-onset sequelae of
poliomyelitis (LOSP) and found no difference between the two groups in manually tested
strength, however, the PPS group required more time for performance testing and their perceived
exertion was higher. Stolwijk-Swuste, Beelen, Lankorst, et al (2005), in a systematic review of
the literature to identify prognostic factors associated with change in functional status and
muscle strength, identified 19 studies related to these factors and found either insufficient quality
or inconsistent results.
Fatigue is the most frequent and debilitating symptom reported by people with PPS
(Packer, Sauriol, and Brouwer, 1994; Nollet, Beelen, Prins et al, 1999; Jublet and Agre, 2000;
Schanke and Stanghelle, 2001; Nollet, Beelen, Twisk et al, 2003; and Trojan and Cashman,
2005). It can lead to limitations in activities of daily living (ADL), social participation, and work
duties (Packer, Sauriol, and Brouwer, 1994). Associations between fatigue and physical and
psychological variables have been found by several investigators (Ostlund, Wahlin, Sunnerhagen
et al, 2008; Trojan, Arnold, Shapiro et al, 2009; and Tersteeg, Koopman, Stolwijk-Swuste et al,
2011). In their study, Trojan, Arnold, Shapiro et al (2009) conclude that PPS fatigue is complex
and multidimensional, having three parts: general, physical and mental. Each of these parts is
determined by different variables, some fixed (maximum inspiratory pressure, fibromyalgia,
muscle strength, maximum expiratory pressure, age, time since acute polio) and others that are
modifiable (stress, depression, physical activity, pain).
Pain is a common primary symptom of PPS. The prevalence of muscle pain has been
estimated to be 38% to 86% of patients and joint pain between 42% to 80% of patients. Jubelt
and Agre (2000) aggregated data from three states. Muscle and joint pain were reported
separately and were found to be similar. This held true for three of the four sites where the
30
percentages of those with muscle/joint pain were 94/94%, 74/72% and 73/73%. The percentages
at the fourth site were 68/61%.
Researchers have shown an association between pain and fatigue (Vasiliadis, Collet,
Shapiro et al, 2002; Trojan and Cashman, 2005; Stoelb, Carter, Abresch et al, 2008; Trojan,
Arnold, Shapiro et al, 2009; Jensen, Alschuler, Smith et al, 2011; and Tersteeg, Koopman,
Stolwijk-Swuste et al, 2011) and joint pain and muscle weakness (Vasiliadis, Collet, Shapiro et
al, 2002). Pain can involve either muscles and/or joints (Jubelt and Agre, 2000; Trojan and
Cashman, 2005; and Farbu, 2009). Stoelb, Carter, Aresch et al (2008) investigated pain with
respect to frequency, intensity and impact. Ninety-one percent of their sample reported pain.
Shoulders, lower back, legs and hips were where the most frequently reported sites. Participants
reported an average of 10 areas of pain, the most intense being found in the knees, legs, wrists,
lower back and head. Sleep and activities involving a high level of musculoskeletal effort were
affected most by pain. Finally, respondents’ pain problems were more severe compared with the
general population.
There is no single basis for muscle or joint pain (Halstead, 1987). It can be the result of
overuse (Halstead, 1987 and Farbu, 2009), disuse (Halstead, 1987) or compensatory use of
unaffected muscles (Farbu, 2009). Vasiliadis, Collet, Shapiro et al, (2002) suggest that greater
initial motor unit involvement and lower-extremity weakness may be important factors for
determining joint pain. They investigated muscle and joint pain independently and found
significant predictive factors for muscle pain were being female gender, longer duration of
general fatigue and a lower score on the general health scale of the SF-36. Joint pain factors
were female gender, longer duration of stability after the acute onset, younger age at interview,
greater weakness at acute polio, weaker lower-extremity muscle strength, and a lower general
31
score on the SF-36. Willen and Grimby (1998) reported physical activity in daily life as a
correlate of pain. Contradicting Willen and Grimby’s findings, Östlund, Wahlin, Sunnerhagen,
and Borg (2008) found that low levels of activity and psychological functioning were correlates
of pain.
With respect to how those with PPS symptoms are aging, Stolwijk-Swiiste, Tersteeg,
Beelen et al (2010), in a prospective study, examined the impact of age and comorbidity on late-
onset sequelae of poliomyelitis in a cohort of patients consisting of varying ages and levels of
comorbidity. They found that disability increased little despite a sizable reduction in muscle
strength. Interestingly, comorbidity and the extent of paresis negatively influence functional
independence only, not perceived physical functioning. They hypothesize that persons with
LOSP may be able to maintain their physical functioning at the cost of their progressively
weakening muscles, thus causing the symptoms of pain, fatigue and muscle weakness associated
with post-polio syndrome.
2. Rheumatoid Arthritis
Rheumatoid arthritis (RA) is a chronic syndrome that is a progressive, usually
symmetrical, inflammatory disease resulting in peripheral joint and connective tissue damage
(Berkow, 1991). It can also affect multiple organ systems such as cardiovascular, renal and
respiratory systems, and has an autoimmune component (Hootman, Helmick and Brady, 2012).
Symptoms include joint pain and swelling, stiffness, fatigue, and deformity, and can lead to
severe disability. Treatment includes medications, rest and exercise, and surgical procedures
such as joint replacements and tendon transfers to correct joint damage. RA affects individuals
differently. Symptoms vary considerably with three major disease progressions (CDC, 2012;
Pincus and Callahan, 1993): monocyclic (one major episode that lasts 2 – 5 years and does not
32
reoccur); polycyclic (fluctuating disease levels); and progressive RA (increases in severity and is
unrelenting). Overall, the course of RA is highly unpredictable with exacerbations and
remissions varying in length (Strating, Van Schuur and Suurmeijer, 2007).
Gender and age are the epidemiological characteristics of RA (Mongan, 1990). Although
RA can occur at any age, including in children, onset is most frequently between the ages of 20
and 40 with women being three times more likely to develop it as compared to men (CDC, 2012).
Data from the Rochester Epidemiology Project (Myasoedova, Crowson, Kremers et al (2010)
placed the incidence of diagnosed cases of RA at 41 per 100,000 each year from 1995-2007 with
incidence rising with age (8.7 per 100,000 in the 18-34 age group versus 54 per 100,000 in the
85 and older category). Incidence peaked in the 65-74 age group.
Prevalence is estimated to be 1.5 million persons 18 and older (Helmick, Felson,
Lawrence, 2008). The Rochester Epidemiology Project (Myasoedova, Crowson, Kremers et al,
2010) calculated the overall age-adjusted prevalence for women in 1995 to be 7.7 per 1000
versus 4.4 per 1000 for men. In 2005, overall prevalence had risen for women to 9.8 per 1000,
while it decreased slightly for men (4.1 per 1000 for men).
Although the incidence of RA increases with age, the sex-ratio decreases in age. The ≥
60 group with RA has a different sex-ratio. The female-male ratio decreases with greater age
(Kvien, Uhlig, Odegard, Heiberg, 2006). Deal, Meenan, Goldenberg, Anderson et al (1985)
compared clinical features of elderly-onset rheumatoid arthritis with younger-onset disease and
found that age at onset was an important determinant of the disease course, adjusting for joint
scores, disease duration, abrupt onset and polymyalgia rheumatica (often misdiagnosed as RA in
those older than 60).
33
The etiology of RA is not known and it is believed that in many cases there is an
interaction between genetic factors and environmental exposures (CDC, 2012). Risk factors for
RA fall into several categories: socio-demographic, genetic, modifiable, and reproductive and
breastfeeding history (CDC, 2012). As previously indicated, women are three times more likely
than men to develop RA, and onset is highest for men and women in their sixties. Genetically,
human leukocyte antigen (HLA) class II genotypes are associated with increased risk of RA
(Scott, Wolfe and Huizinga, 2010). Conditions that are considered risk factors are: smoking, diet,
reproductive hormonal exposures, and microbial exposures (CDC, 2012). Research investigating
the relationship between RA and smoking has demonstrated a strong, consistent link between the
two, especially when have a marker of autoimmune activity (CDC, 2012).
With respect to reproductive and breastfeeding history, recent study results contradict
earlier results and have found a lack of association between RA and oral contraceptives. There
are mixed results for an association between RA and hormone replacement therapy and a slight
to moderate increase in risk if a woman has never given birth (CDC, 2012). Breastfeeding has
been found to be protective (Piker, Nilsson, Bergstrom et al, 2012). Finally, there have been
mixed results concerning menstrual history. A study by Pikwer, Bergstrom, Nilsson et al., (2012)
found an increased risk for RA in women who had early menopause (≤45 years of age). The
same authors (Pikwer, Nilsson, Bergstrom et al, 2012) subsequently investigated severity of RA
in association with menopause and found a milder form of RA in women who had early
menopause (≤45 years of age) and whose disease onset was after the age of 45.
In an editorial, Sokka (2009) considers gender differences in persons with RA. She
discusses the results (Sokka, Kautiainen et al, 2007) of a large multinational dataset that utilized
standardized quantitative instruments. This study found that women had poorer scores than men
34
in variables such as, but not limited to, number of tender joints, functional status, pain and
fatigue. Effect sizes between genders were small to medium despite statistical significance. With
respect to swollen joints, those who had none or one, women had higher mean values than men
in all disease activity measures and experienced remission less often. Women and men had
similar disease severity however, leading the authors to suggest that the measures of disease
activity resulted in the gender differences instead of the disease activity itself (Sokka, Hetland,
Makinen et al, 2008; Sokka, Toloza, Cutolo, et al, 2009). A two year prospective study (Hallert,
Thyberg, Hass, Skargren and Skogh, 2003) found women had more decline in functional ability,
despite having similar scores as men on the disease variables. The men were, on average, older
than the women.
The major symptoms associated with RA are pain, fatigue and joint stiffness, resulting in
functional limitations. The most acute of which is pain (Kazis, Meenan and Anderson, 1983;
McKenna and Wright, 1985; Heiberg and Kvien, 2002; Minnock, FitzGerald and Bresnihan,
2003). Pain is subjective. As Sokka (2005) observes, it is a personal experience that is
underestimated by the traditional biomedical model. Additionally, response to pain varies vastly,
adding complexity for health care professionals in the treatment of pain (Kazis, Meenan and
Anderson, 1983). A qualitative study (Ahlstrand, Bjork, Thyberg et al., 2012) utilizing focus
groups recommends that “pain in RA needs to be comprehensively analyzed and treated in the
context of the patients’ perspective and needs” (p. 1245). Pain is associated with health status
(Kazis, Meenan and Anderson, 1983; James, Miller, Brown and Weaver, 2005), health behavior
(Kazis, Meenan and Anderson, 1983), increased functional disability (Sokka, T., 2005; Strating,
Van Schuur and Suurmeijer, 2007; Ahlstrand, Bjork, Thyberg, et al., 2012), psychological
variables (James, Miller, Brown and Weaver, 2005; Sokka, T., 2005; Morris, Yelin, Wong and

35
Katz, 2008), longer disease duration (James, Miller, Brown and Weaver, 2005; Morris, Yelin,
Wong and Katz, 2008), morning stiffness (Morris, Yelin, Wong and Katz, 2008); low self-
efficacy (James, Miller, Brown and Weaver, 2005; Sokka, 2005; Morris, Yelin, Wong and Katz,
2008), and fatigue (Huyser, Parker, Thoreson, et al., 1998).
Although fatigue is one of the main complaints of rheumatoid arthritis, physicians do not
show as much interest in treating it compared to other symptoms such as pain (Dupond, 2011).
There is no clear definition because of its multidimensional nature. Piper (1989) developed an
integrative model that took into account many factors, both biologic and psychosocial, when
considering subjective fatigue. Generally, fatigue is considered to have two components:
physical and psychological (Huyser, Parker, Thoreson, et al., 1998). Physical fatigue can involve
muscle weakness, tiredness, excessive energy expenditure, inadequate energy production, and
sleep disorders (Dupond, 2011). In his review paper, Dupond, (2011) classifies psychological
fatigue as weariness associated with depression and stress. Huyser, Parker, Thoreson, et al
(1998) characterize subjective fatigue as a sense of extreme tiredness or exhaustion which
encompasses psychosocial (e.g., depression, anxiety), behavioral (e.g., activity levels), and
environmental (e.g., social supports) factors. In their study, fatigue was strongly associated with
pain, depression, and other psychosocial variables. In an effort to determine whether
conventional RA drug therapies reduce fatigue, Pollard, Choy, Gonzalez, et al (2006)
investigated the relationship of fatigue to pain and other clinical features, and whether two types
of drug therapies improved fatigue. They concluded that fatigue was linked to pain and
depression, disease activity was secondary, and the success of drug therapies was the result of
improvement in pain. Droegemuller, Brauer and Van Buskirk (2008), looked at the influence that
temperament (positive affectivity, negative affectivity, constraint) has on fatigue and symptom
36
management strategies. They found that temperament was a significant factor in managing
fatigue and additionally, older individuals were more successful in symptom management
strategies.
While morning/joint stiffness is a major symptom of RA, studies taking into account
symptoms have reported morning stiffness to be either not significant or less of a concern than
pain and fatigue (McKenna and Wright, 1985; Hallet, Thyberg, Hass et al., 2003). There is little
discussion about how morning stiffness fits into the scheme of the disease with regard to those
quantitative studies that measure morning/joint stiffness. In a qualitative study, Lutze and
Archenholtz (2007) were able to contextualize the impact morning stiffness has on daily routines
using focus groups. Even though morning stiffness may not be statistically significant (Hallet,
Thyberg, Hass et al., 2003) or ranked lower in priority (McKenna and Wright, 1985) by subjects
in quantitative studies, the authors show how impactful it can be in the daily lives of persons
with RA. The American College of Rheumatology’s (ACR) 1987 criteria have been revised as
they have poor sensitivity and specificity in diagnosing early inflammatory disease that goes on
to become rheumatoid arthritis (Banal, Dougados, Combescure and Gossec, 2009). The revisions
were made in conjunction with the European League Against Rheumatism (EULAR). A criterion
in 1987 was “morning stiffness (at least 1 hour).” The new 2010 ACR/EULAR criteria (Aletaha,
Neogi, Silman, Funovits et al, 2010) do not use morning stiffness as a criterion; instead the
criterion is “duration of symptoms” and refers to pain, swelling or tenderness of joints. Morning
stiffness has been removed.

37
III. CONCEPTUAL FRAMEWORK AND HYPOTHESES
A. Life Course, Disability Trajectory and Disablement
A life course perspective helps to frame and anchor disability and life events. It illustrates
the timing of age-related transitions and the timing and changes due to disability. Conceptually,
studying aging with disability requires integrating several theoretical approaches with measures
of impairment and function from the fields of adult development, social gerontology, disability
and rehabilitation (Campbell, 1994). Campbell (1994) adapted Scheer and Luborky’s (1991)
framework of the “disability trajectory” and incorporated the biopsychosocial model of
rehabilitation (Kemp, Brummel-Smith and Ramsdell, 1990) with the life course perspective. The
conceptual framework for this dissertation applies this integrative approach to aging with
disability utilizing the foundation of a life course perspective. Aging is viewed as a lifetime
process where events that occur during one’s “younger” years can dramatically effect how one
ages.
The polio experience of the disability trajectory is used in Figure 1 to illustrate the
conceptual life course framework of Campbell (1994). This conceptualization can be adapted for
any disability where the “disability trajectory,” or timeline, and historical period will vary. It
highlights the complexities of aging with a disability by depicting the multiple variables that
must be considered to clearly understand each disability’s unique characteristics, each
individual’s unique situation in life, and how the two interact.
There are two components of the horizontal axis. The bottom represents the disability
trajectory (Scheer and Luborsky, 1991), or timeline, from birth to death. This is the temporal
structure of disability-related events and takes into account onset of primary and secondary
disability (Campbell, 1994). The upper component of this axis represents chronological age
38
within the life span and is the most closely associated with physiological aspects of aging
(Scheer and Luborsky, 1991). The vertical axis represents the historical period in which an
individual is born, acquires the disability, and ages (Scheer and Luborsky, 1991). This axis is
influenced by macro-level changes in societal attitudes and policies as well as advances in
medicine and rehabilitation, all of which shape the context individual and social aging (Campbell,
1994). The diagonal axis is comprised of social aging and put into context within the life course
stages or transitions from childhood to old age (Scheer and Luborsky, 1991). Social aging
corresponds to the developmental stages of an individual that are culturally defined and
normative.
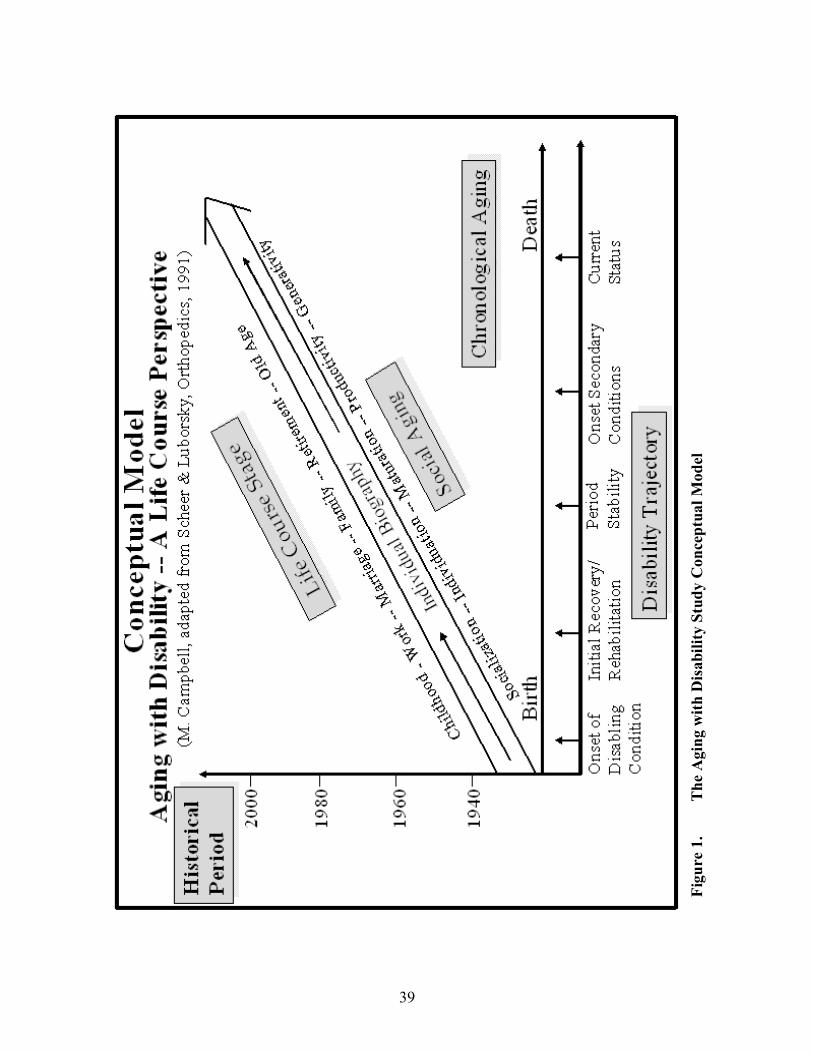
39
Figu
re 1
. Th
e A
ging
with
Dis
abili
ty S
tudy
Con
cept
ual M
odel
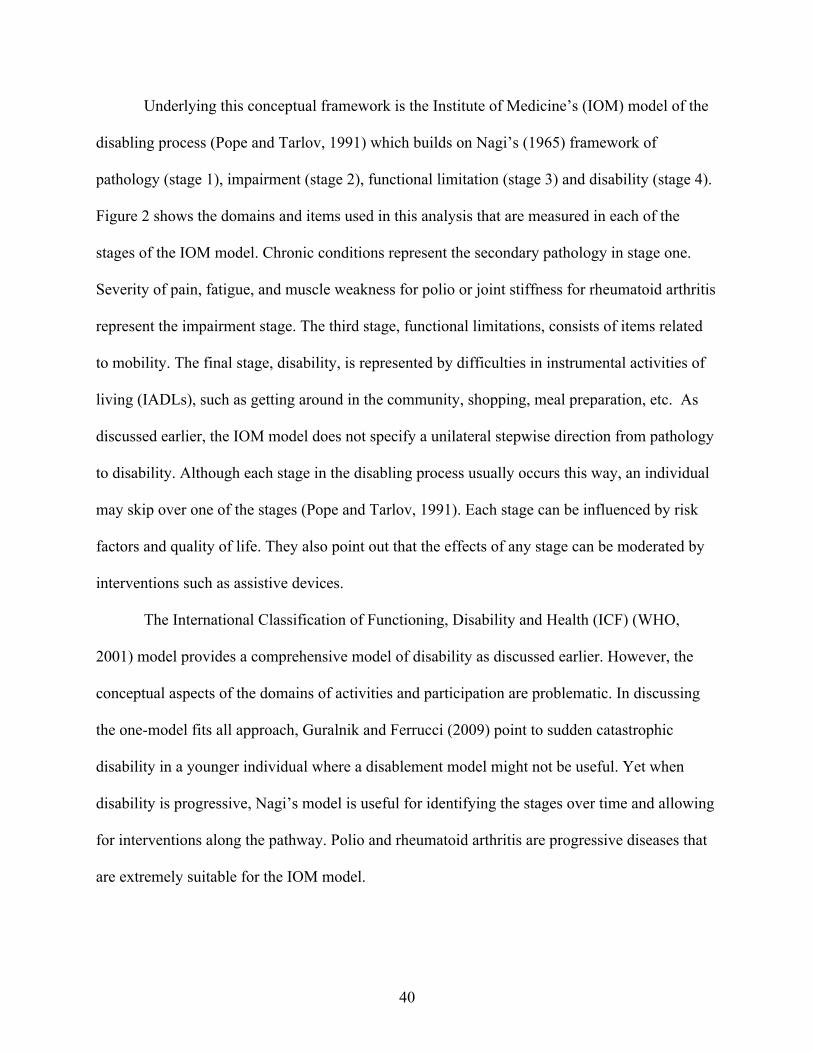
40
Underlying this conceptual framework is the Institute of Medicine’s (IOM) model of the
disabling process (Pope and Tarlov, 1991) which builds on Nagi’s (1965) framework of
pathology (stage 1), impairment (stage 2), functional limitation (stage 3) and disability (stage 4).
Figure 2 shows the domains and items used in this analysis that are measured in each of the
stages of the IOM model. Chronic conditions represent the secondary pathology in stage one.
Severity of pain, fatigue, and muscle weakness for polio or joint stiffness for rheumatoid arthritis
represent the impairment stage. The third stage, functional limitations, consists of items related
to mobility. The final stage, disability, is represented by difficulties in instrumental activities of
living (IADLs), such as getting around in the community, shopping, meal preparation, etc. As
discussed earlier, the IOM model does not specify a unilateral stepwise direction from pathology
to disability. Although each stage in the disabling process usually occurs this way, an individual
may skip over one of the stages (Pope and Tarlov, 1991). Each stage can be influenced by risk
factors and quality of life. They also point out that the effects of any stage can be moderated by
interventions such as assistive devices.
The International Classification of Functioning, Disability and Health (ICF) (WHO,
2001) model provides a comprehensive model of disability as discussed earlier. However, the
conceptual aspects of the domains of activities and participation are problematic. In discussing
the one-model fits all approach, Guralnik and Ferrucci (2009) point to sudden catastrophic
disability in a younger individual where a disablement model might not be useful. Yet when
disability is progressive, Nagi’s model is useful for identifying the stages over time and allowing
for interventions along the pathway. Polio and rheumatoid arthritis are progressive diseases that
are extremely suitable for the IOM model.
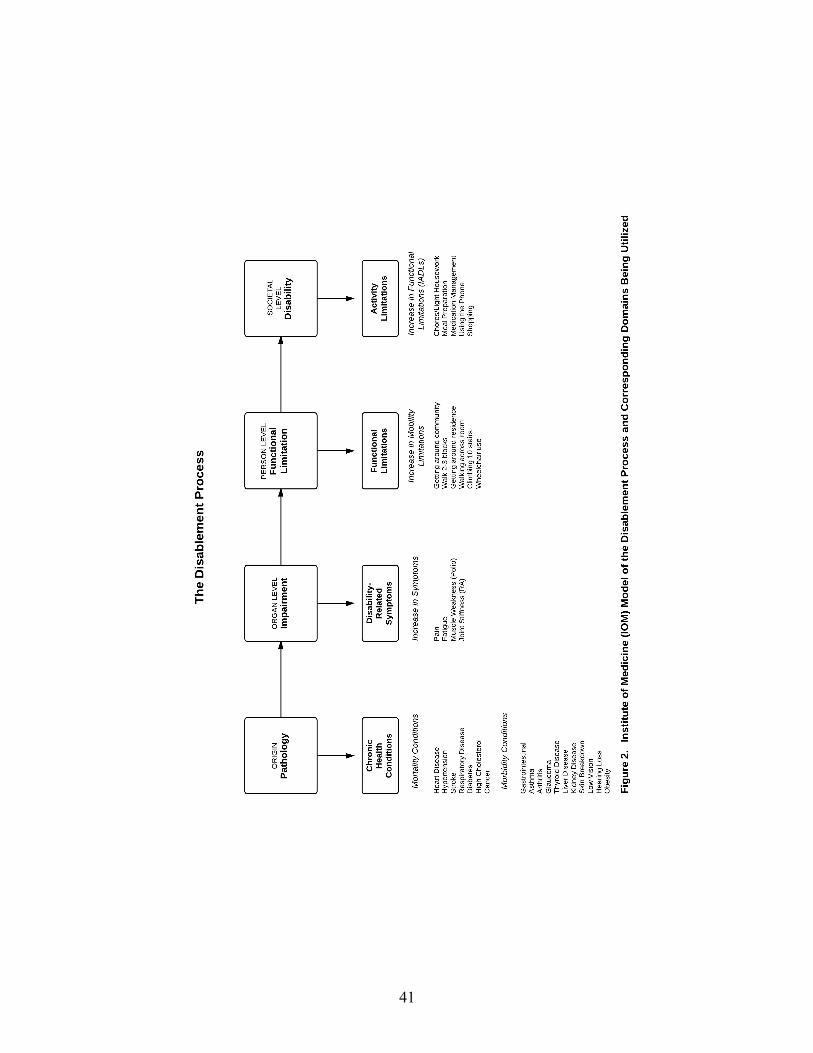
41

42
B. Models
Aging with disability models correspond to both conceptual frameworks of life course
perspective (processes of time that influence aging) and disablement (processes of change that
contribute to secondary conditions and disability). The disability trajectory variables are the
temporal anchors. They place the disability onset on the aging timeline. The increases in
symptoms variables are disability-related secondary conditions and in effect, begin the active
disablement process. Increase in mobility limitations, chronic secondary health conditions (due
to aging and/or the primary disability), and increase in functional limitations (IADL) are all
different components of secondary conditions. As discussed earlier, these pathways do not
necessarily follow a prescribed course.
The concepts of the disability trajectory paired with chronological aging, historical period
and life course framework are illustrated in Figure 1. Figure 2 places the components of the
models into the framework of the disablement process. Figures 3 and 4 operationalize the
relationships among the components for post-polio syndrome and rheumatoid arthritis
respectively. Although the two models are very similar in structure, they differ in one very
crucial respect. Polio and rheumatoid arthritis have profoundly different disability trajectories
that are reflected in the different variables in Figures 3 and 4. The trajectory variables anchor the
disability at different life courses and are hypothesized to result in differences between polio and
RA with respect to their disease courses. Polio has an average age of childhood as an onset
while RA has an onset of young middle age. Both onset variables and status at physical best for
polio and status at reference period are related to disease, but where RA is an intermittent
autoimmune disease, polio is an acute onset disease that leaves one with paralysis.
43
Number of disability bed days (in six months) is the outcome for the fully specified
models for polio and RA. Disability bed days is generally used in health care utilization research.
Its utility is that it captures disability burden for both employed and unemployed individuals as
opposed to work loss days that only capture disability burden for the employed (Egede, 2004).
Disability bed days is a strong outcome measure in these data. An earlier analysis (Campbell,
Sheets, Rhaney and Moulton, 1999), analyzed data on a combined AwD sample of polio, RA and
stroke. It focused on four quality of life indicators: depressive symptoms, self-assessed health,
number of physician visits in past year, and unmet need for services. The analysis found that
number of disability bed days was associated with lower quality of life of life across all four
indicators (p<.001 each).
Work status is included in the final model as a control for disability bed days. Table 5 in
Methods contains the demographic differences between the polio and rheumatoid arthritis
samples. Thirty-one percent of individuals with rheumatoid arthritis had never worked since
disease onset as opposed to only nine percent for individuals with polio.
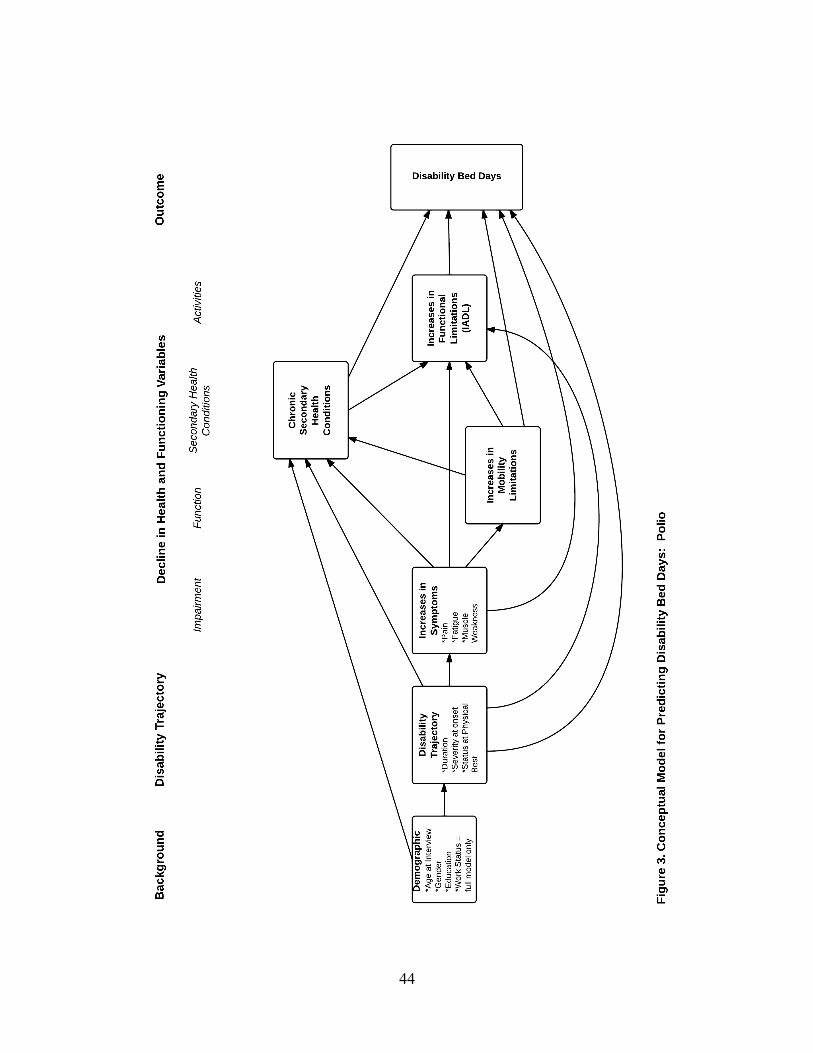
44
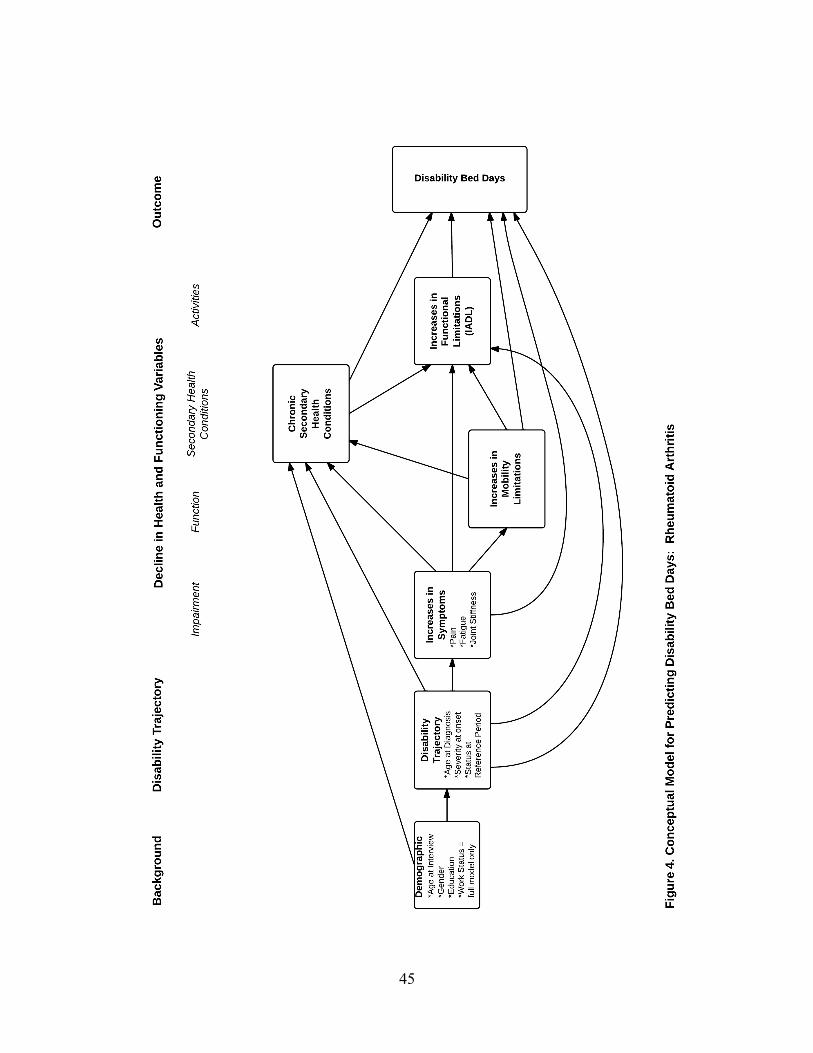
45
46
C. Conceptual Models and Hypotheses
Utilizing the integrated conceptual life course and disablement framework conceptualized
in Figures 3 and 4, three hypotheses for each disability group were deduced which address
interrelationships among the components of secondary conditions, explore the disability
characteristics, and examine the effects of secondary conditions on disability bed days. An
overall hypothesis compares secondary conditions between disability groups. The same general
empirical pattern is deduced for the first three hypothesis, but disease-specific mechanisms are
discussed that may give rise to secondary but important differences between the two. The overall
hypothesized pathway examines predictors and outcome variable between the two disability
groups.
1. Polio Hypotheses
a. Interrelationships Among Components
For those aging with polio, increases in mobility limitations will be more strongly related
to increases in functional limitations than to the number of chronic secondary health
conditions, controlling for demographic and disability characteristics.
Mobility limitations in polio are associated with severity of the initial onset of polio and
the duration of the disease. Severity of initial onset increases risk for post-polio syndrome.
Because of the neurodegenerative nature of post-polio syndrome, its characteristic new muscle
weakness contributes to mobility and functional limitations.
47
b. Unique Disability Characteristics
For those aging with polio, disability trajectory indicators (severity of initial onset,
duration of disability and status at physical best) will be more strongly related to
increases in functional limitations than to the number of chronic secondary health
conditions controlling for demographic characteristics for individuals aging with polio.
For individuals with polio, a more severe initial impairment at onset and longer disability
duration contributes to mobility limitations that lead to faster deterioration in mid-life and in
functional abilities. The initial impact of polio varied significantly for individuals and that has an
impact on their longer-term functional outcomes.
c. Disability Bed Days
For individuals with aging with polio, increases in symptoms (pain, fatigue, muscle
weakness), increases in mobility limitations and increases in functional limitations will
be stronger predictors of the number of disability bed days in the last six months than will
the number of chronic secondary health conditions, controlling for demographic and
disability characteristics.
Because of the neurodegenerative nature of post-polio syndrome, its characteristic new
muscle weakness contributes to mobility and functional limitations. It is also characterized by
paralysis and musculoskeletal involvement, hence, increases in mobility and functional
limitations.
48
2. Rheumatoid Arthritis Hypotheses a. Interrelationships Among Components For those aging with rheumatoid arthritis, increases in symptoms (fatigue, pain and joint
stiffness) will be more strongly related to increases in functional limitations than to the
number of chronic secondary health conditions, controlling for demographic and
disability characteristics.
RA involves an autoimmune disease process that typically has a fluctuating disease
course and variability in severity. It typically affects upper body joints (e.g. hands), causes pain,
fatigue and joint stiffness. Increases in symptoms indicate that a more unstable disease process is
occurring and therefore functional decline is related to activities that involve more upper body
use.
b. Unique Disability Characteristics For those aging with rheumatoid arthritis, disability trajectory indicators (severity of
initial onset, age at diagnosis and status at reference period) will be more strongly
related to the number of chronic secondary health conditions than to increases in
functional limitations controlling for demographic characteristics for individuals aging
with rheumatoid arthritis.
Individuals with rheumatoid arthritis have a more a fluctuating disease course with
variability in severity, which can depend upon severity of initial onset. Those who are older
when they develop it can have a more severe form. The rheumatoid arthritis disease process
progresses over time with deteriorating functioning, however, with treatments such as surgical
49
joint replacement, the disability trajectory can be changed with restoration of function. A
compromised immune system from the disease and pharmaceutical treatments will increase the
risk of acquiring chronic secondary health conditions.
c. Disability Bed Days
For individuals aging with rheumatoid arthritis, the number of chronic secondary health
conditions will be a stronger predictor of the number of disability bed days in the last six
months than will increases in symptoms (pain, fatigue, joint stiffness), increases in
mobility limitations and increases in functional limitations, controlling for demographic
and disability characteristics.
Rheumatoid arthritis can affect multiple organ systems such as cardiovascular, renal and
respiratory systems, and has an autoimmune component. Individuals with rheumatoid arthritis
tend to have more treatment options available to them, including drug therapies and joint and
tendon surgeries, thus, increases in symptoms, increases in mobility limitations and changes in
functional limitations would not be as strong of a predictor of disability bed days as chronic
secondary health conditions. Drug therapies for rheumatoid arthritis are a double-edged sword.
They can slow the disease progression, thus limiting declines in mobility and function, however
they can have serious side effects that can contribute to chronic secondary health conditions.
3. Comparison of Disability Group Differences
Based on measures available for those aging with polio rheumatoid arthritis,
relationships between predictors and outcomes (controlling for demographic variables)
will not consistently be stronger for either disability group. This hypothesis applies to
the common predictors of increases in chronic secondary health conditions (three
50
predictors), increases in functional limitations (four predictors), and the number of
disability bed days in six months (five predictors).

51
IV. METHODS
A. Study Design For Secondary Data
Data for this secondary analysis are taken from the Aging with Disability (AwD) Study
(Campbell and Sheets, 1996) conducted between 1996 and 1997 at the Rehabilitation Research
and Training Center (RRTC) on Aging with Disability located at Rancho Los Amigos Medical
Center in Downey, California. The RRTC is also an affiliate of the University of Southern
California. The study was funded by the National Institute of Disability and Rehabilitation
Research in the U.S. Department of Education. It involved in-depth structured in-home
interviews consisting of objective and subjective self-reports of current status and prior condition.
The survey was a regional cross-sectional, group comparison design with a cross-sequential
sampling and data analytic framework.
The AwD Study compared age-matched persons aging with early and later-life onset of
disability in the areas of physical, psychological, and social status. Data were collected from 555
persons aging with polio, rheumatoid arthritis (RA) and stroke. Research objectives were to
determine if there were significant differences within and between disability groups with respect
to health status; and to investigate how age, duration of disability, and other factors related to
aging and disability influence these differences. For the purposes of this dissertation the stroke
sample was not utilized. Stroke often results in residual neurological impairment thus there were
differences in how some of the questions for this analysis had to be asked. A total of 404 cases
(n=218 for polio and n=186 for rheumatoid arthritis) were used for this dissertation.
1. Instrumentation
Data for the AwD study were collected using a comprehensive survey entitled “The
Changing Needs and Life Circumstances of People Aging with Physical Disability” (Campbell
52
and Sheets, 1996). It was developed over a two-year period with considerable input from a ten
member Consumer-Oriented Research Advisory Committee (CORAC) composed of persons
with disability who were experts in their respective impairments.
The same survey instrument was administered to both the polio and RA groups to allow
for comparisons across samples with the exception of a section that was specifically designed to
address each particular disability. The history of the disability component was adapted for each
disability group to reflect the unique characteristics of the different disabilities. Items in this
section were carefully constructed to be able to make meaningful comparisons on similar items
between disabilities. Six major content areas were addressed: history of disability; demographic
characteristics; physical health status and services; functional ability, technology and
accessibility; social issues; and psychological well-being/lifestyle practices.
It was anticipated that the survey would be comprised primarily of existing measures
rather than having to develop a new instrument. After systematically evaluating over one
hundred scales and instruments from both the fields of gerontology and rehabilitation, Campbell
and Sheets (1996) found that using existing measures was problematic due to the limited scope
of cross-disability research. Studies of change in the health and function of persons aging with
disability are rare. Ultimately, many of the questions in the AwD Survey were borrowed or
modified from other studies. The final survey was a combination of objective and subjective
self-reports regarding prior and current health status that included selected scales and items from:
1. Basic and Instrumental Activities of Daily Living (National Health Interview
Survey, 1994);
2. Diagnoses/Chronic Health Conditions (National Health Interview Survey, 1994;
Surveillance Instrument of Secondary Conditions, Seekins et al., 1990);

53
3. Functional Limitations (National Health Interview Survey, 1994);
4. Pain (Quantitative Pain Scale, SF-36 Medical Outcomes Study (Ware, 1992);
5. Fatigue (National Health Interview Survey, 1994; SF-36 Medical Outcomes Study
- Ware, 1992);
6. Joint Stiffness (RADAR Scale, Mason et al., 1992); and
7. Severity of Impairment (National Health Interview Survey, 1994; Later Life
Effects of Earlier Life-Disability Study, Campbell, 1994; Late Effects of Polio
Study, Maynard et al., 1991)
One unique aspect to the AwD survey instrument is that it incorporates a disability
perspective within a life course framework, thus taking into account temporal characteristics of
the disability trajectory.
Cross-disability research faces many challenges in constructing variables that can
compare over time changes in health status across disability (Campbell, Sheets, and Strong,
1999). To address some of these concerns, temporal indicators were established for each
disability to reflect the varying nature of the disease course (Campbell & Sheets, 1996). These
temporal indicators illustrate the disability trajectory. With respect to the polio population, five
reference points were established: onset of disabling condition; initial recovery/rehabilitation
period; period of stability (“physical best”); onset of decline (beginning of changes in health and
function); and current status as of time of interview. For those who reported no “physical best,”
“five years ago” was used as the reference point. The conditions that occurred between the onset
of decline and time of interview were considered secondary conditions. The other temporal
indicators, such as age at onset of the disease, the length of time between onset of disability and

54
time of interview (duration of disability), and length of time between onset of decline and time of
interview (duration of decline) were conceptualized as risk factors for secondary conditions.
Rheumatoid Arthritis required a different set of temporal indicators due to the fluctuating
nature of the disease. Three reference points were established: age at diagnosis, an intermediate
reference period, and time of interview. With respect to the intermediate reference period,
subjects were asked if they were in either a “good period,” remission, or a “bad period.” A good
period was defined as a stable period with mild disease activity. Remission was defined as no
disease activity, that is, an absence of arthritis pain and swelling. A time of active exacerbated
disease defined a bad period. The reference period was considered the most recent change in
disease activity. Thus, if a subject were in a good period at time of interview, their reference
period would be their most recent bad period. If the subject were in a bad period, then their
reference period would be their most recent remission or good period. “Five years ago” was
used if subjects did not feel that these reference periods were applicable. (See Table 1.)
Secondary conditions for the RA sample were defined as declines in health and function
occurring between the reference period and time of interview. Following the polio sample, the
other temporal indicators were conceptualized as risk factors for secondary conditions, e.g., age
at diagnosis and duration of disability.
Table 1. Establishment of Reference Period for Rheumatoid Arthritis Sample Rheumatoid Arthritis
Intermediate Reference Period Time of Interview Bad Period Good Period
Good Period Bad Period
Good or Bad Period Remission
5 years ago Good Period, Remission, Bad Period
55
2. Study Sample
The sample for the present secondary analysis consists of working-age and older adults
living with the long-term effects of two disabling conditions: polio and rheumatoid arthritis
(RA). These two groups represent a natural examination in the life course differences between
disabilities in which onset primarily occurs in childhood (i.e., polio; n=218) versus young to
middle adulthood (i.e., rheumatoid arthritis; n=186). Subjects were randomly selected via a
cross-sequential design from two subject pools: a county clinic-based outpatient population
(from medical records); and a community-based pool (from disability organizations and support
groups, and general solicitation). A telephone screening was performed to confirm study
eligibility and to collect personal background data.
Inclusion criteria for the subject pools varied by impairment group so as to capture
epidemiological differences in disability trajectories. For polio, these criteria included a credible
history of paralytic polio contracted in the United States, a minimum age of 37, and a duration of
disability of 20 years. Rheumatoid arthritis criteria included a confirmed diagnosis, adult onset
at 18 years or older, a minimum age of 30, and a post-diagnosis of 5 years. All potential subjects
had to be living in the United States at time of onset, have some residual physical impairment at
time of measurement and live within one hour of the medical center. See Table 2.
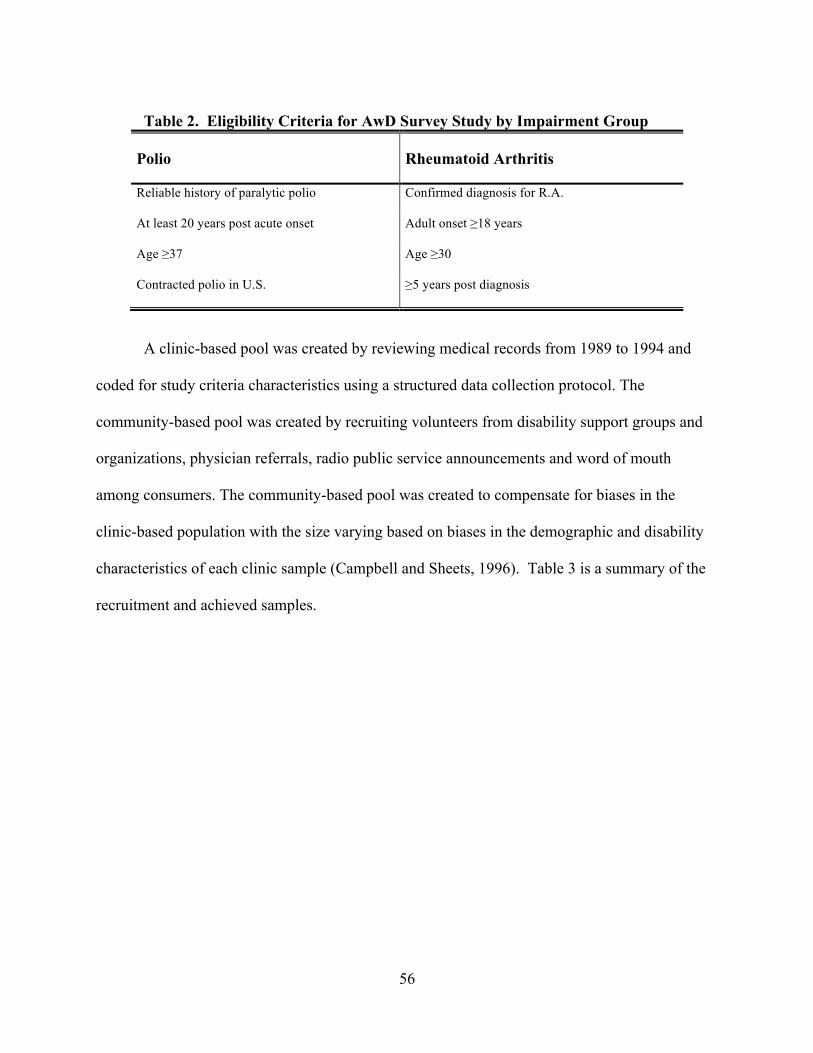
56
Table 2. Eligibility Criteria for AwD Survey Study by Impairment Group
Polio
Rheumatoid Arthritis
Reliable history of paralytic polio
Confirmed diagnosis for R.A.
At least 20 years post acute onset
Adult onset ≥18 years
Age ≥37
Age ≥30
Contracted polio in U.S.
≥5 years post diagnosis
A clinic-based pool was created by reviewing medical records from 1989 to 1994 and
coded for study criteria characteristics using a structured data collection protocol. The
community-based pool was created by recruiting volunteers from disability support groups and
organizations, physician referrals, radio public service announcements and word of mouth
among consumers. The community-based pool was created to compensate for biases in the
clinic-based population with the size varying based on biases in the demographic and disability
characteristics of each clinic sample (Campbell and Sheets, 1996). Table 3 is a summary of the
recruitment and achieved samples.

57
Table 3. Overview of Sampling Framework and Achieved Sample
Phase 1 Subject Recruitment
Phase 2 Sample Selection & Data Collection
Sample
Clinic-based Subject Pool
# eligible (# reviewed)
Community
Subject Pool
# eligible
Invited to Participate (By waves)
Achieved Sample
Post-Polio
632
(1,274)
325
348 (Clinic=177)
(Community=171) 218
Rheumatoid Arthritis
375 (1,450) 130
388 (Clinic=277)
(Community=111) 186
Totals 1007
(2,724) 455 736 404
1Number of waves sent out varied by sample: Polio = 11 waves; RA = 12 waves (Source: M. Campbell, Aging with Disability Survey Study)
Each disability has unique epidemiological characteristics, thus stratification was used in
this cross-sequential sampling framework. Both samples were stratified by chronological age to
permit age comparisons. The unique Polio sample stratifying factors were gender and age of
initial onset. The Rheumatoid Arthritis sample was stratified by race/ethnicity and duration of
disability. As noted below in Table 4, RA has a disproportionate proportion of women because
they develop RA three times more commonly than men.

58
Table 4. Cross-sequential Sampling Design for Achieved Study Sample Achieved Sample
Polio Females Males <64 years, early onset ≤10 years
20 36
<64 years, later onset ≥11 years
26 19
≥65 years, early onset ≤10 years
19 17
≥65 years, early onset ≥11 years
27 24
TOTAL 122 96 Rheumatoid Arthritis White Non-White <64 years, duration 5-19 years
30 47
<64 years, duration ≥20 years
18 32
≥65 years, duration 5-19 years
10 8
≥65 years, duration ≥20 years
17 22
TOTAL 75 109
3. Sample Demographics
A summary of demographic characteristics appears in Table 5. Significant differences
are found between the Polio and Rheumatoid Arthritis samples in age, gender, ethnicity,
education, household income and current work status. Marital status had no significant
differences. The Polio sample was predominantly white (87%), was more likely to have at least
a high school diploma (83% vs. 55% for RA), reported a higher income level (51% had an
income level of greater than $35,000 vs. 39% for RA). The Rheumatoid Arthritis sample was
predominantly female (88% vs. 56% of Polio), Hispanic (47% vs. 5% of Polio), had less
education (45% had less than a high school diploma), made less than $15,000 (34% for
household income), and had never worked since disease onset (31% vs. 9% for Polio). The
larger percentage of Hispanic subjects is reflects the race and ethnicity of the geographic location.
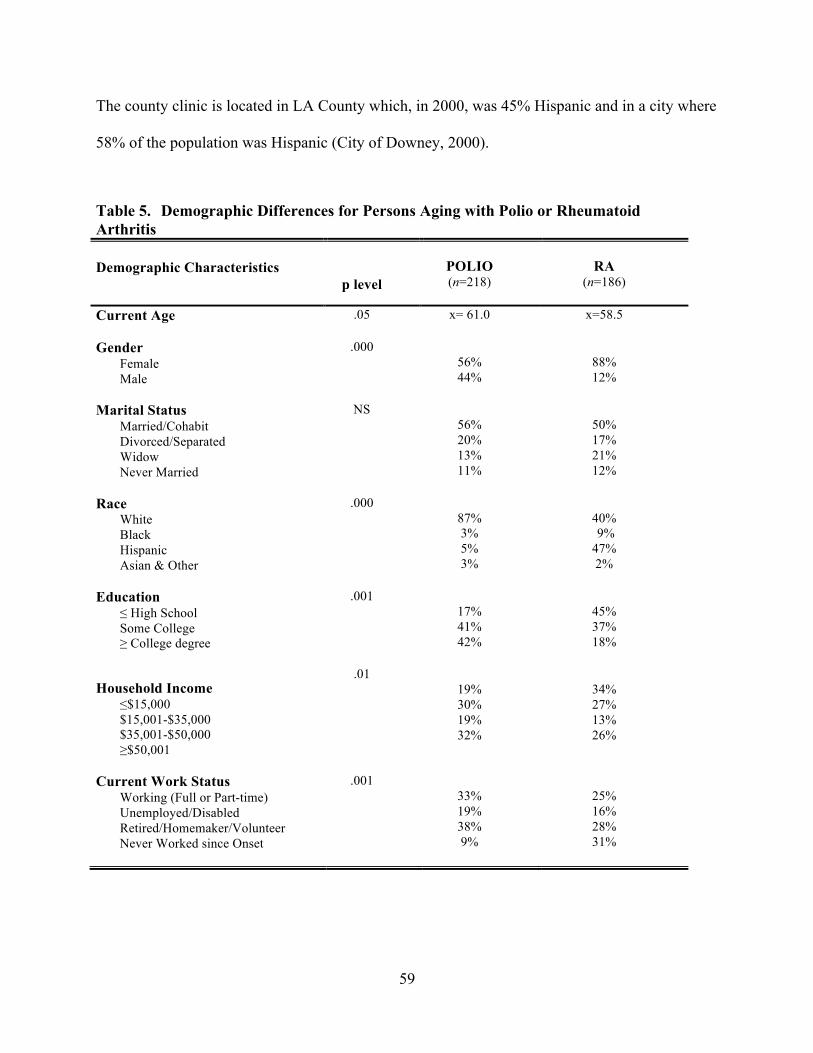
59
The county clinic is located in LA County which, in 2000, was 45% Hispanic and in a city where
58% of the population was Hispanic (City of Downey, 2000).
Table 5. Demographic Differences for Persons Aging with Polio or Rheumatoid Arthritis
Demographic Characteristics
p level
POLIO (n=218)
RA
(n=186)
Current Age
.05 x= 61.0
x=58.5
Gender Female Male
.000 56% 44%
88% 12%
Marital Status Married/Cohabit Divorced/Separated Widow Never Married
NS 56% 20% 13% 11%
50% 17% 21% 12%
Race White Black Hispanic Asian & Other
.000 87% 3% 5% 3%
40% 9% 47% 2%
Education ≤ High School Some College ≥ College degree
.001 17% 41% 42%
45% 37% 18%
Household Income ≤$15,000 $15,001-$35,000 $35,001-$50,000 ≥$50,001
.01 19% 30% 19% 32%
34% 27% 13% 26%
Current Work Status Working (Full or Part-time) Unemployed/Disabled Retired/Homemaker/Volunteer Never Worked since Onset
.001 33% 19% 38% 9%
25% 16% 28% 31%
60
4. Data Collection
The interviews lasted from two to five hours, with most taking between two to three
hours to conduct. Because the RA sample was 48% Hispanic, two of the interviewers were
bilingual in English and Spanish. In the beginning of the interview, a “Participant Reminder
Card” with important markers in the Polio and RA timelines was used so the respondent could
refer to it during the interview. These were used in part to improve the quality of the
retrospective information. Participant reminder card can be found in Appendix I.
B. Model Development for Present Analyses
Model development consisted of two parts: scale development and model testing.
The first step was to develop measurement models using factor analysis to test a parsimonious
set of latent variables for the three constructs of secondary conditions that have been discussed in
the literature for persons aging with disability: 1) increases in disability-related symptoms; 2)
increases in functional limitations; and 3) onset of chronic secondary conditions. The second step
was to use the latent variables estimated from step 1 in an overall theoretical model exploring the
predictive relationships in the disability trajectory. These can be found in Chapter III (Figures 3
& 4) polio and rheumatoid arthritis models respectively.) A detailed description of each variable
included from the AwD Survey Study can be found in Appendix II.
1. Scale Development
Variables for increase in symptoms and increase in functional limitations were derived
using change scores. Change, or difference, scores were calculated using variables measured by
having subjects refer to a specific point in time in their disability history that was consistent with
the underlying nature of their impairment (Campbell et al, 1999). This point in time is labeled
“physical best” for polio and “reference period” for RA. The prior reference periods were
61
subtracted from companion variables measured at time of interview. These change variables
were then used to derive three-level variables, mainly based on quantiles, for pain, fatigue,
muscle weakness, joint stiffness, five basic activities of daily living (BADLs), five instrumental
activities of daily living (IADLs), and six mobility variables. Scales were then constructed from
the change variables in each category. This approach is utilized because the measures do not
operate the same across the polio and RA groups (Campbell, 2012, email communication).
Because of the nature of the disease, the RA group scores operate bi-directionally. Some
subjects improved, while others declined. To use the traditional method of creating change
scores after scales are constructed would eliminate the ability to compare the two populations as
polio operates in one direction, showing decline (or as measured in these analyses, increase in
symptoms and limitations). A mathematical difference score would potentially not capture the
fluctuating aspects of RA in a single variable that is comparable across two populations
(Campbell, 2012, email communication). Campbell et al (1999) have demonstrated the benefits
in using change scores calculated in this way from these data.
Another issue is the significant variations in points in time which change was assessed.
These varied significantly across the two impairment groups due to the differences in duration of
disability and pace of change. Maynard et al. (1991), have demonstrated the utility of using
objective self-reports that are tied to well-recognized benchmarks, such as an established
reference period. Verbrugge and Yang (2002) note that the dynamic processes of disability and
aging are best studied with longitudinal data whereas cross-sectional data creates a disability
profile that is the “residue of prior dynamics (p.254).” However, she does support the use of
cross-sectional data to study some aspects of the dynamic processes where questions have been
incorporated regarding disability history.

62
Analyses conducted by Campbell (2012, personal correspondence) using this AwD
data have found that the greater the amount of change people experience in areas such as
function and symptoms, the more psychological adjustment is required to incorporate disability
into their identify. Significant change in physical functioning and symptoms also has major
implications for participation in social roles such as employment, family, and valued activities.
Increases in symptoms represent secondary conditions that occur as a direct result of
the primary disabilities of polio and RA. Increases (change) in symptoms was measured on
several three-level variables, calculated for pain, fatigue, muscle weakness (polio), and joint
stiffness (rheumatoid arthritis).
Increases (change) in functional limitations originally had three domains with multiple
variables in each. The first, increases in basic activities of daily living (BADL) limitations,
included five items that address self-care and include toileting, bathing, dressing, transferring
and eating. This domain was eliminated as the models were developed and will be discussed
later in the paper. Increases in instrumental activities of daily living (IADL) limitations is the
second domain. This consists of five variables that address more complex tasks such as
shopping, meal preparation, medication management, etc. The third and final domain, increases
in mobility limitations, consists of six variables that represent aspects of community and
residential ambulation, climbing stairs and wheelchair use.
Chronic secondary conditions was originally called age-related chronic conditions and
initially had two domains: mortality risk and morbidity. Modification of this construct will be
addressed later in the paper. Mortality risk included nine diagnoses (cancer, COPD, kidney
disease, liver disease, heart disease, hypertension, high cholesterol, diabetes, and stroke) of the
most common mortality risk factors found in the National Health Interview Survey (NHIS)
63
(1994). Eleven morbidity diagnoses (amputation, asthma, dental, fracture, glaucoma, low vision,
obesity, osteoporosis, skin breakdown, stomach problems and thyroid disease), also selected
from the NHIS as well as the Surveillance Instrument of Secondary Conditions (Seekins et al.,
1990), were included in the morbidity component of age-related chronic conditions. Mortality
risk diagnoses represented those diagnoses that were the leading indicators of mortality at the
time of the survey. Morbidity diagnoses were associated with chronic medical and physical
conditions that represented complications of the primary disability and new onset of age-related
diseases.
2. Predictive Model
The model for polio and rheumatoid arthritis is presented in Chapter 3 (Figure 3). There
are three outcome variables: number of chronic secondary conditions, increases in functional
limitations (IADL), and number of disability bed days in six months. The demographic/control
variables consist of age, gender and education. Current work status is added to the demographic
variables for the fully saturated model predicting number of disability bed days. The disability
trajectory variables consist of duration, severity at onset and status at physical best for the polio
sample. The RA sample trajectory variables are age at diagnosis, severity of onset and status at
reference period. Increases in symptoms dimension consists of pain, fatigue, muscle weakness
(polio) and joint stiffness (RA).
3. Final Analysis
Linear regression was performed to test the models for three outcome variables (number
of chronic secondary conditions, increases in functional limitations and number of disability bed
days in six months) in a theorized order for the polio and RA samples individually.

64
Regression analysis tests theoretically driven hypotheses by entering several predictor
variables in an ordered sequence to determine the relative importance of a predictor by
examining the unique contribution a predictor adds to the model above and beyond what can be
accounted for by the other predictors (Petrocelli, 2003). The relationship between the predictor
(or independent) variables on the dependent variable is evaluated by first entering control
variables, followed by sets (or blocks) of predictor variables in a specified a priori order. Taken
into account is the impact of a different set of predictor variables on the dependent variable while
controlling for all the other predictors in the equation. At each stage, an additional predictor
variable or variables are added to the model and ∆R2 is calculated. A null-hypothesis test is
undertaken to test whether the ∆R2 is significantly different from zero. Of interest is the change
in predictability associated with the predictor variables as they are entered in subsequent stages
(Petrocelli, 2003).
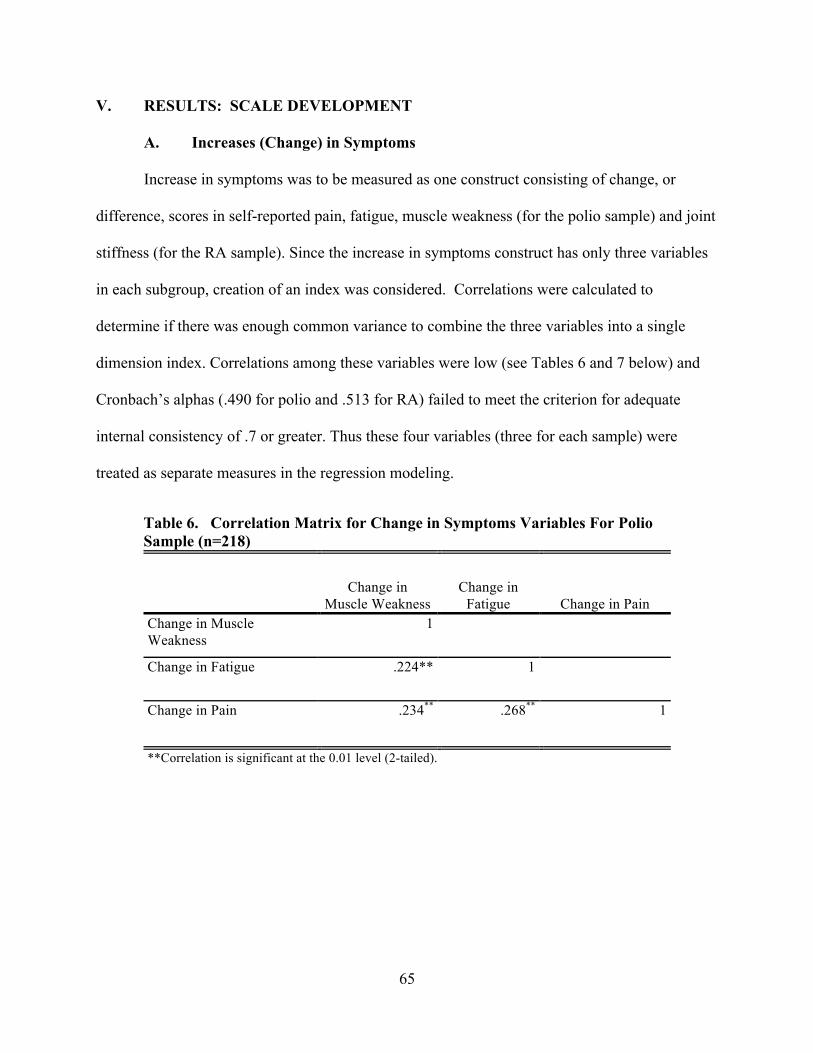
65
V. RESULTS: SCALE DEVELOPMENT
A. Increases (Change) in Symptoms
Increase in symptoms was to be measured as one construct consisting of change, or
difference, scores in self-reported pain, fatigue, muscle weakness (for the polio sample) and joint
stiffness (for the RA sample). Since the increase in symptoms construct has only three variables
in each subgroup, creation of an index was considered. Correlations were calculated to
determine if there was enough common variance to combine the three variables into a single
dimension index. Correlations among these variables were low (see Tables 6 and 7 below) and
Cronbach’s alphas (.490 for polio and .513 for RA) failed to meet the criterion for adequate
internal consistency of .7 or greater. Thus these four variables (three for each sample) were
treated as separate measures in the regression modeling.
Table 6. Correlation Matrix for Change in Symptoms Variables For Polio Sample (n=218)
Change in Muscle Weakness
Change in Fatigue Change in Pain
Change in Muscle Weakness
1
Change in Fatigue .224** 1
Change in Pain .234** .268** 1
**Correlation is significant at the 0.01 level (2-tailed).
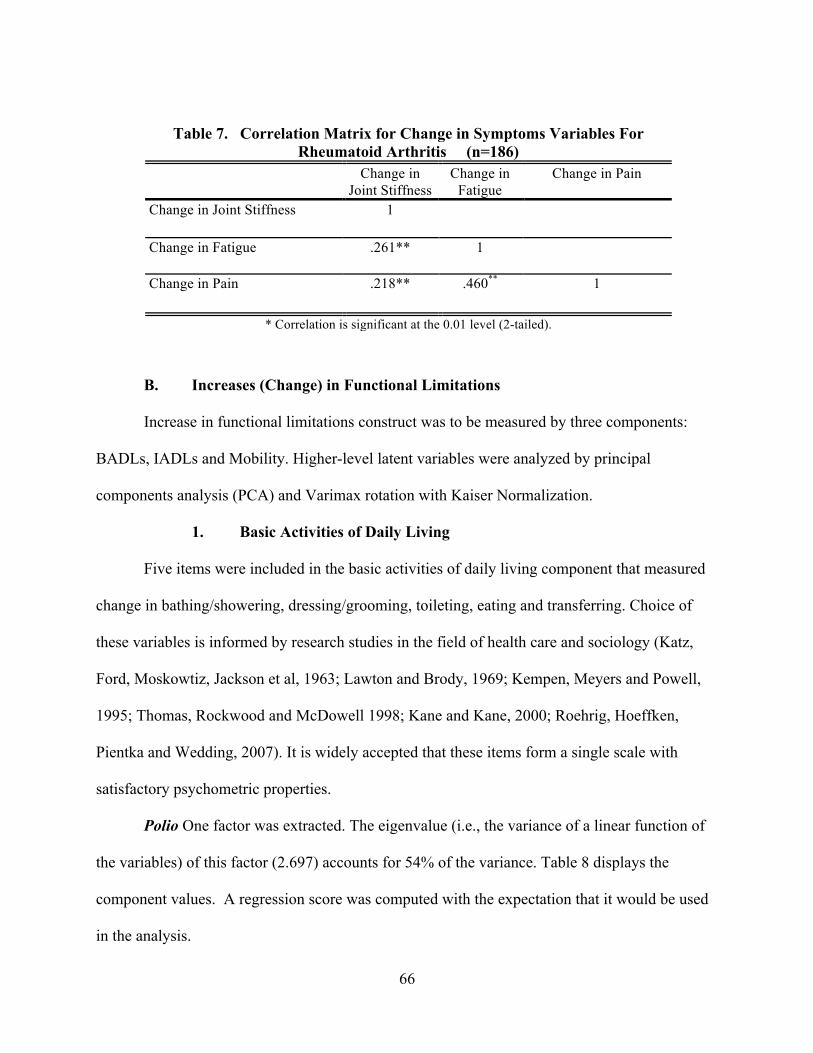
66
B. Increases (Change) in Functional Limitations
Increase in functional limitations construct was to be measured by three components:
BADLs, IADLs and Mobility. Higher-level latent variables were analyzed by principal
components analysis (PCA) and Varimax rotation with Kaiser Normalization.
1. Basic Activities of Daily Living
Five items were included in the basic activities of daily living component that measured
change in bathing/showering, dressing/grooming, toileting, eating and transferring. Choice of
these variables is informed by research studies in the field of health care and sociology (Katz,
Ford, Moskowtiz, Jackson et al, 1963; Lawton and Brody, 1969; Kempen, Meyers and Powell,
1995; Thomas, Rockwood and McDowell 1998; Kane and Kane, 2000; Roehrig, Hoeffken,
Pientka and Wedding, 2007). It is widely accepted that these items form a single scale with
satisfactory psychometric properties.
Polio One factor was extracted. The eigenvalue (i.e., the variance of a linear function of
the variables) of this factor (2.697) accounts for 54% of the variance. Table 8 displays the
component values. A regression score was computed with the expectation that it would be used
in the analysis.
Table 7. Correlation Matrix for Change in Symptoms Variables For Rheumatoid Arthritis (n=186)
Change in Joint Stiffness
Change in Fatigue
Change in Pain
Change in Joint Stiffness 1
Change in Fatigue .261** 1
Change in Pain .218** .460** 1
* Correlation is significant at the 0.01 level (2-tailed).
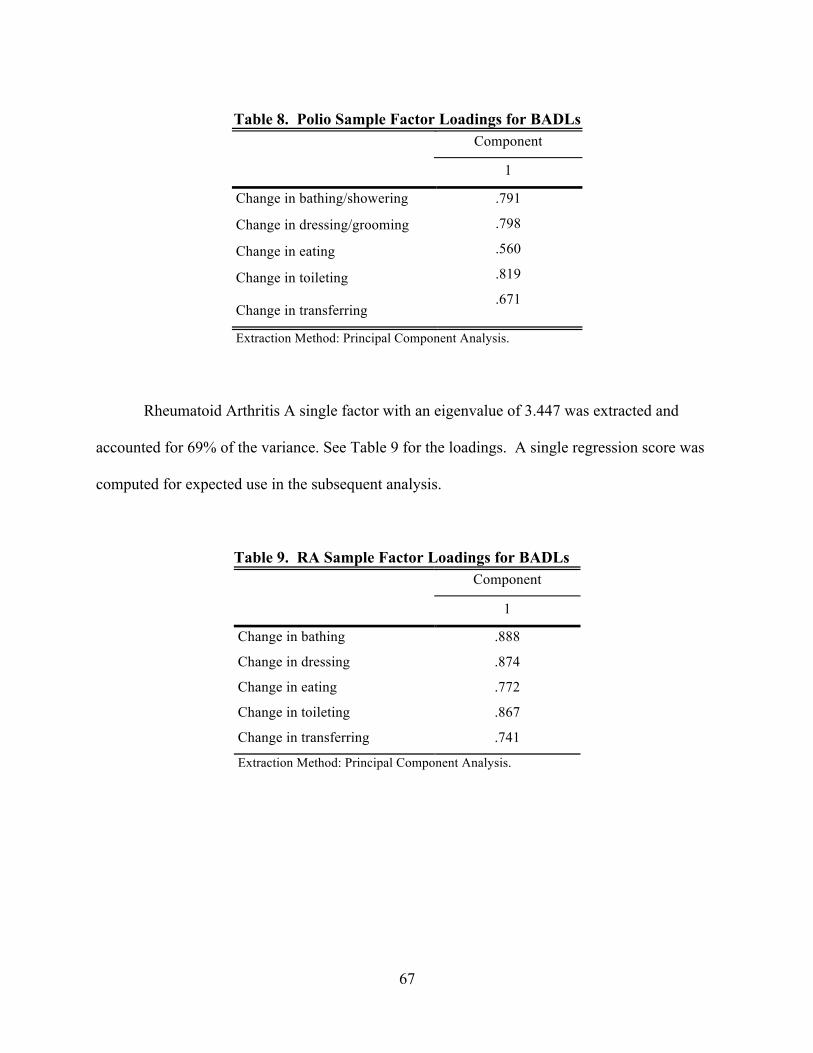
67
Table 8. Polio Sample Factor Loadings for BADLs
Component
1
Change in bathing/showering .791
.798
.560
.819
.671
Change in dressing/grooming
Change in eating
Change in toileting
Change in transferring
Extraction Method: Principal Component Analysis.
Rheumatoid Arthritis A single factor with an eigenvalue of 3.447 was extracted and
accounted for 69% of the variance. See Table 9 for the loadings. A single regression score was
computed for expected use in the subsequent analysis.
Table 9. RA Sample Factor Loadings for BADLs
Component
1
Change in bathing .888
Change in dressing .874
Change in eating .772
Change in toileting .867
Change in transferring .741
Extraction Method: Principal Component Analysis.
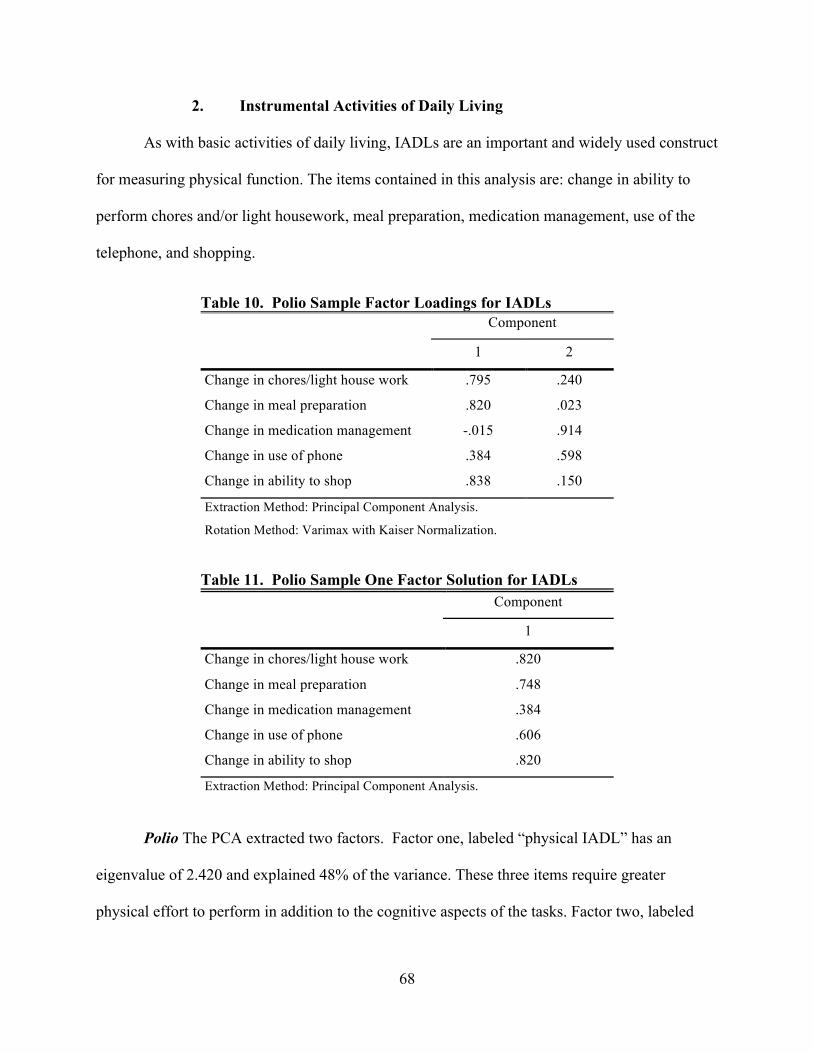
68
2. Instrumental Activities of Daily Living
As with basic activities of daily living, IADLs are an important and widely used construct
for measuring physical function. The items contained in this analysis are: change in ability to
perform chores and/or light housework, meal preparation, medication management, use of the
telephone, and shopping.
Table 10. Polio Sample Factor Loadings for IADLs Component
1 2
Change in chores/light house work .795 .240
Change in meal preparation .820 .023
Change in medication management -.015 .914
Change in use of phone .384 .598
Change in ability to shop .838 .150
Extraction Method: Principal Component Analysis.
Rotation Method: Varimax with Kaiser Normalization.
Table 11. Polio Sample One Factor Solution for IADLs Component
1
Change in chores/light house work .820
Change in meal preparation .748
Change in medication management .384
Change in use of phone .606
Change in ability to shop .820
Extraction Method: Principal Component Analysis.
Polio The PCA extracted two factors. Factor one, labeled “physical IADL” has an
eigenvalue of 2.420 and explained 48% of the variance. These three items require greater
physical effort to perform in addition to the cognitive aspects of the tasks. Factor two, labeled
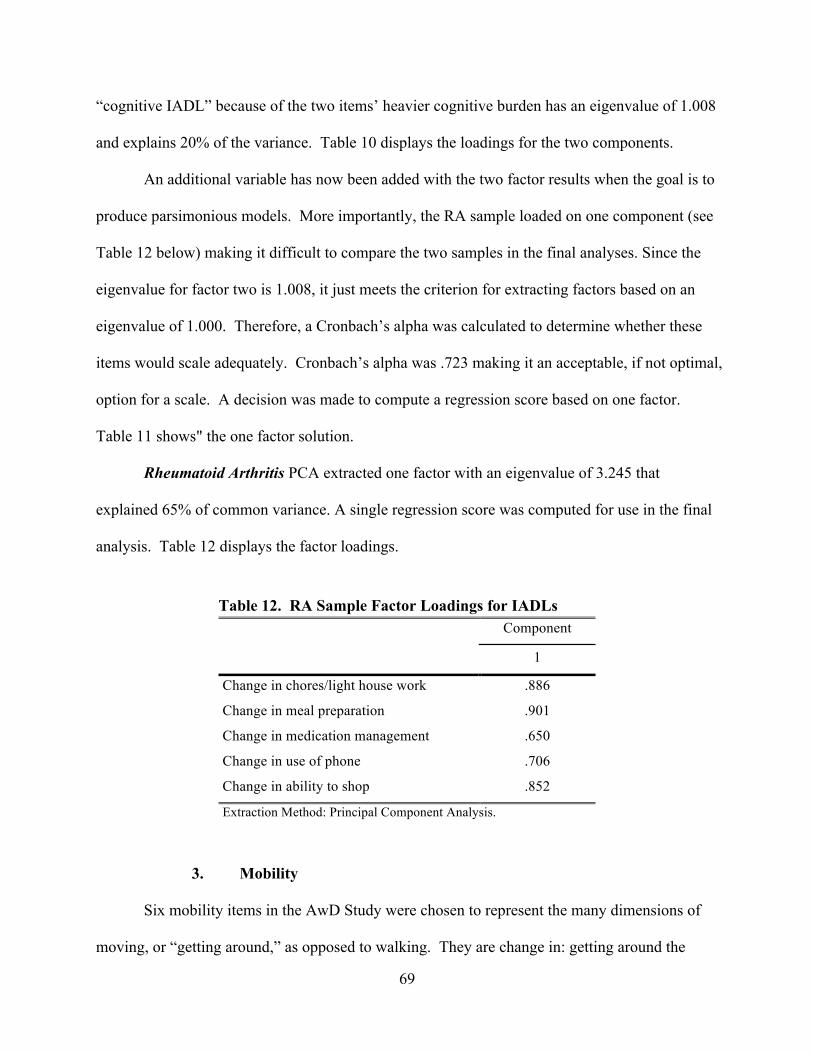
69
“cognitive IADL” because of the two items’ heavier cognitive burden has an eigenvalue of 1.008
and explains 20% of the variance. Table 10 displays the loadings for the two components.
An additional variable has now been added with the two factor results when the goal is to
produce parsimonious models. More importantly, the RA sample loaded on one component (see
Table 12 below) making it difficult to compare the two samples in the final analyses. Since the
eigenvalue for factor two is 1.008, it just meets the criterion for extracting factors based on an
eigenvalue of 1.000. Therefore, a Cronbach’s alpha was calculated to determine whether these
items would scale adequately. Cronbach’s alpha was .723 making it an acceptable, if not optimal,
option for a scale. A decision was made to compute a regression score based on one factor.
Table 11 shows" the one factor solution.
Rheumatoid Arthritis PCA extracted one factor with an eigenvalue of 3.245 that
explained 65% of common variance. A single regression score was computed for use in the final
analysis. Table 12 displays the factor loadings.
3. Mobility
Six mobility items in the AwD Study were chosen to represent the many dimensions of
moving, or “getting around,” as opposed to walking. They are change in: getting around the
Table 12. RA Sample Factor Loadings for IADLs Component
1
Change in chores/light house work .886
Change in meal preparation .901
Change in medication management .650
Change in use of phone .706
Change in ability to shop .852
Extraction Method: Principal Component Analysis.
70
community; walking 2-3 blocks, getting around residence, walking across the room, climbing 10
stairs, and wheelchair use. Walking refers to the physical ability of moving one’s lower
extremities in a purposeful way. Walking is often used as a proxy for overall mobility (and thus
for participation). In fact, one does not have to physically walk to be mobile. A person who does
not have the ability to adequately use his/her legs may be able to fully participate in desired
activities by using a wheelchair or scooter. Further, one may have the ability to walk, but may be
fearful of falling for instance, and thus limit walking and the ability to fully participate in
activities.
Polio Using PCA, two factors were extracted. Factor one, labeled “residential mobility,”
had an eigenvalue of 3.393 and accounted for 55% of variance. The second factor, labeled
“community mobility,” had an eigenvalue of 1.155 and accounts for 19% of the variance. See
Table 13. As with the IADL items, the rheumatoid arthritis sample yielded one factor (see Table
15 below). Again, to reduce the number of variables, keep uniformity across samples and for
conceptual reasons, a one-factor solution was desirable. The mobility dimension was not
conceived strictly as ambulation. It is a continuum of mobility from residence to community and
includes wheelchair as a mobility option. Therefore, a Cronbach’s alpha was computed to
determine if these items could be scaled together. Cronbach’s alpha was .841, which places the
items as a scale in the good range. A regression score was computed for inclusion in the final
analysis. Table 14 details the one factor solution.
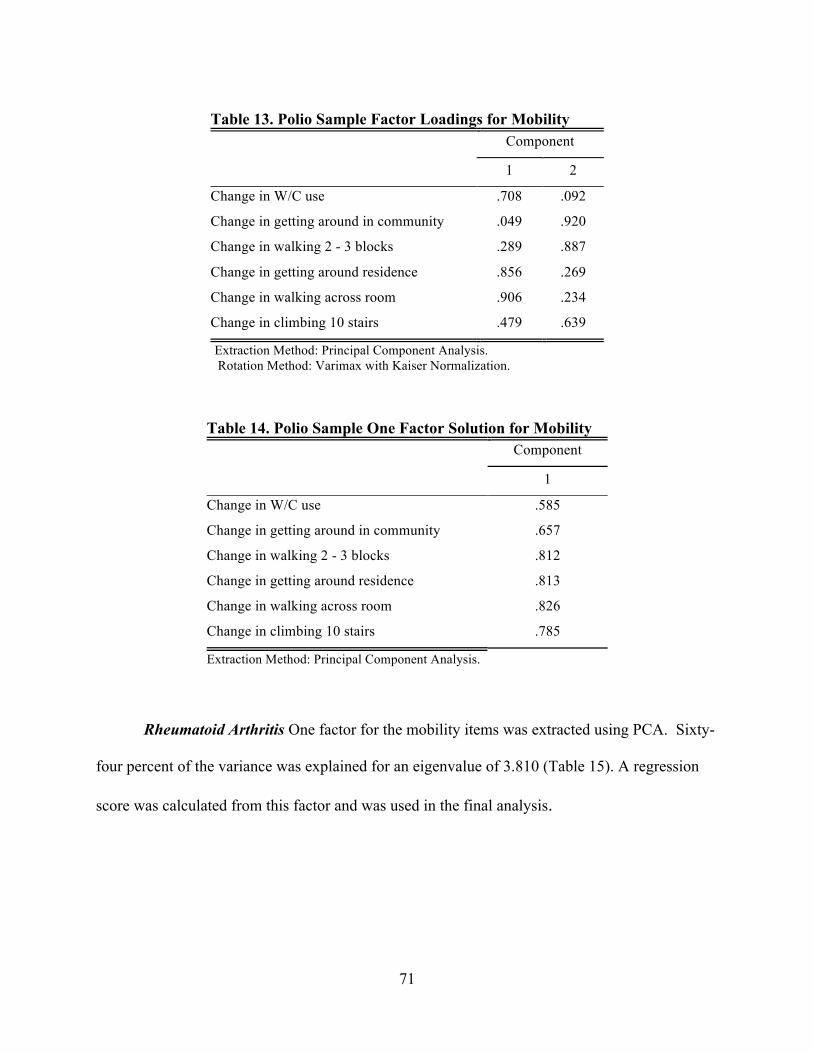
71
Table 13. Polio Sample Factor Loadings for Mobility
Component
1 2
Change in W/C use .708 .092
Change in getting around in community .049 .920
Change in walking 2 - 3 blocks .289 .887
Change in getting around residence .856 .269
Change in walking across room .906 .234
Change in climbing 10 stairs .479 .639
Extraction Method: Principal Component Analysis. Rotation Method: Varimax with Kaiser Normalization.
Table 14. Polio Sample One Factor Solution for Mobility
Component
1
Change in W/C use .585
Change in getting around in community .657
Change in walking 2 - 3 blocks .812
Change in getting around residence .813
Change in walking across room .826
Change in climbing 10 stairs .785
Extraction Method: Principal Component Analysis.
Rheumatoid Arthritis One factor for the mobility items was extracted using PCA. Sixty-
four percent of the variance was explained for an eigenvalue of 3.810 (Table 15). A regression
score was calculated from this factor and was used in the final analysis.

72
Table 15. RA Factor Loadings for Sample Mobility
Component
1
Change in W/C use .503
Change in getting around in community .836
Change in walking 2-3 blocks .900
Change in getting around residence .800
Change in walking across room .823
Change in climbing 10 stairs .855
Extraction Method: Principal Component Analysis.
C. Number of Chronic Secondary Health Conditions
Originally, the construct of chronic secondary health conditions was conceptualized as a
two-dimension construct, age-related chronic conditions. As discussed previously, these
dimensions were mortality and morbidity diagnoses. The items included in each construct were
collected at time of interview and are not change variables. Respondents were asked for each
condition whether they had been diagnosed or treated for the condition by a doctor or other
health care professional since the onset of their disability. The variables are dichotomous: yes
or no.
For both mortality risk and morbidity, the combined samples of polio and rheumatoid
arthritis were used to perform an exploratory factor analysis and derive scores for the purpose of
data reduction. The samples were combined because subgroup analyses revealed that there was
not enough statistical power to be confident in the findings if they were to be analyzed and used
separately. Correlations were conducted on the nine mortality risk and eleven morbidity
diagnoses using the whole sample. Low correlations prevented further analysis, specifically,
exploratory factor analysis. Correlation coefficients for each are reported in Appendix III Tables
73
25 & 26. As a result, mortality risk and morbidity diagnoses were combined and a summing
strategy was employed.
The chronic secondary conditions variable was constructed by identifying dichotomous
(yes/no) items from both the mortality risk and morbidity categories previously identified from
the NHIS. Three conditional items were constructed: respiratory, arthritis, and gastrointestinal
(GI). The respiratory item was given a “yes” score of 1 if a subject had emphysema/COPD
and/or respiratory insufficiency. Likewise, arthritis was given a “yes” score of 1 if the subject
had osteoarthritis and/or osteoporosis. Finally, the GI item was given a “yes” score of 1 if the
subject had one or more of the following: ulcer, gastritis, colitis, irritable bowel syndrome or
“other GI diagnosis.” Other items in the chronic secondary conditions variable are: heart
diagnosis, hypertension, stroke, high cholesterol, diabetes, cancer, skin breakdown, glaucoma,
low vision, hearing loss, thyroid disease, kidney disease, liver disease, asthma and obesity. The
above items were then summed.
D. Changes in Model Based on Scale Development Results
1. Increase in Functional Limitations
The construct of increase in functional limitations was broken apart. A decision was
made to eliminate the BADL component. First, difficulty with BADLs generally occurs after
difficulties in IADLs are seen and represent a lower level of functioning (Kempen, 1995). Both
Polio and Rheumatoid Arthritis samples were community-based and this population typically
represents a higher level of functioning. Secondly, the variability in the items could have been
more favorable. Table 16 provides the frequencies for the BADL items. Thirdly, eliminating a
variable contributed to a more parsimonious model.
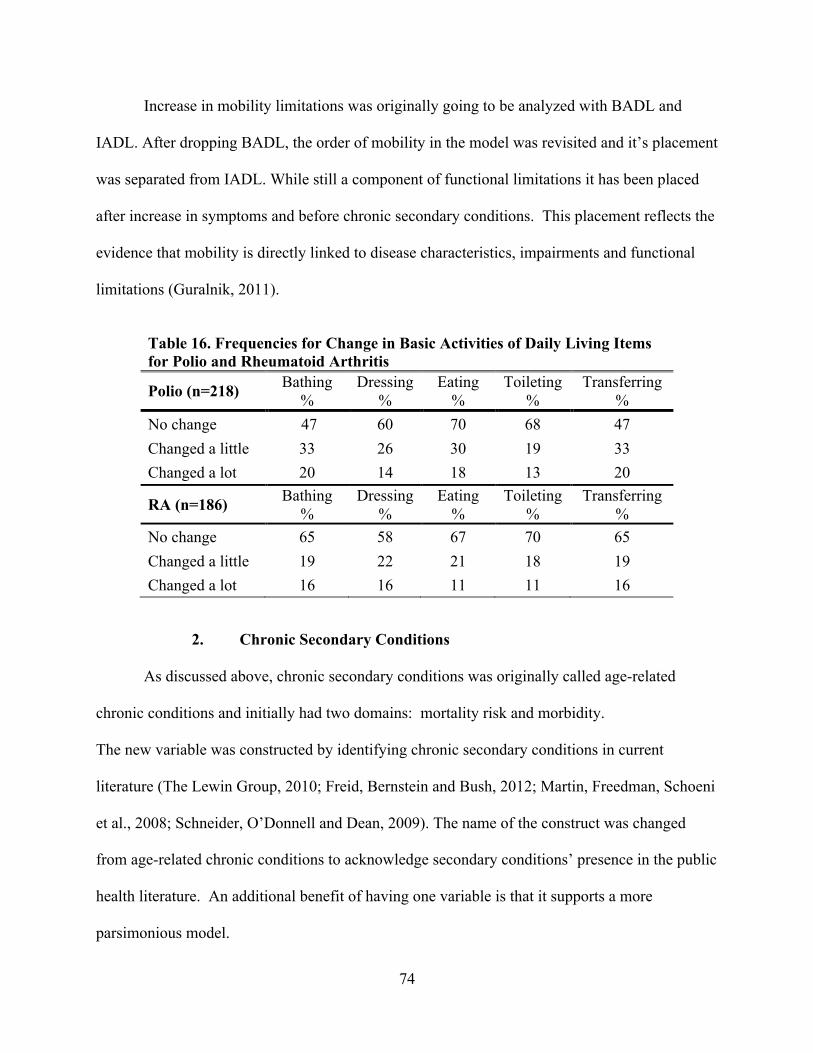
74
Increase in mobility limitations was originally going to be analyzed with BADL and
IADL. After dropping BADL, the order of mobility in the model was revisited and it’s placement
was separated from IADL. While still a component of functional limitations it has been placed
after increase in symptoms and before chronic secondary conditions. This placement reflects the
evidence that mobility is directly linked to disease characteristics, impairments and functional
limitations (Guralnik, 2011).
2. Chronic Secondary Conditions
As discussed above, chronic secondary conditions was originally called age-related
chronic conditions and initially had two domains: mortality risk and morbidity.
The new variable was constructed by identifying chronic secondary conditions in current
literature (The Lewin Group, 2010; Freid, Bernstein and Bush, 2012; Martin, Freedman, Schoeni
et al., 2008; Schneider, O’Donnell and Dean, 2009). The name of the construct was changed
from age-related chronic conditions to acknowledge secondary conditions’ presence in the public
health literature. An additional benefit of having one variable is that it supports a more
parsimonious model.
Table 16. Frequencies for Change in Basic Activities of Daily Living Items for Polio and Rheumatoid Arthritis
Polio (n=218) Bathing %
Dressing %
Eating %
Toileting %
Transferring %
No change 47 60 70 68 47 Changed a little 33 26 30 19 33 Changed a lot 20 14 18 13 20
RA (n=186) Bathing %
Dressing %
Eating %
Toileting %
Transferring %
No change 65 58 67 70 65 Changed a little 19 22 21 18 19 Changed a lot 16 16 11 11 16
75
3. Summary
A review of the factor scales for increase in functional limitations found both similarities
and differences between polio and RA. The BADL scales were similar for the two subgroups.
The loadings of the IADL one factor scales were similar to RA except for change in medication
management (.384 compared to .650). This lower value may be related to the number of
medications that required management and the fluctuating character of RA. The RA sample took
15% more prescription medications than the polio sample. Comparing mobility, the one factor
solutions are extremely close. This speaks to the essential features of mobility. There is more
consistency in performance of all the items as opposed to how one dresses oneself or prepares
meals.

76
VI. RESULTS: MODEL TESTING Higher rates of most health problems compared to same-age cohorts in the general
population are reported by persons aging with physical disability. Using these AwD data,
Campbell, Sheets and Strong (1999) compared frequencies of chronic conditions in a combined
sample of individuals aging with polio, RA and stroke to population estimates of age-matched
cohorts (45 – 64 year olds) from the 1994 National Health Interview Survey. Out of 17
comparable chronic conditions, higher significant rates of chronic conditions were reported for
all but two conditions, hearing loss and heart disease.
To examine frequencies between NHIS population estimates and these AwD subsamples
of polio and RA, Fisher’s exact test was used to test whether there were differences in the
frequencies of chronic secondary conditions between the AwD polio subsample and NHIS
estimates, and AwD RA subsample and NHIS estimates for the same cohorts in the population at
large using the 1994 National Health Interview Survey (NHIS). Chronic secondary conditions
were used where there were comparable data in the NHIS. Two age cohorts were examined: 45 –
64 year olds, and 65 years old and greater. Table 17 shows results of the frequencies between
each subsample and NHIS estimate.
The younger middle-aged cohort of persons aging with physical disabilities reported
higher rates of chronic secondary conditions. Those with RA in the younger cohort reported
higher rates than those with polio in all categories but three, hearing loss, heart disease and
stroke. The older 65+ cohort aging with physical disability reported higher rates as well, but not
in as many conditions. Those with RA reported higher rates in three chronic secondary
conditions. Polio reported two conditions. There is evidence of “accelerated aging” in these data
when compared with the NHIS estimates of the general population.
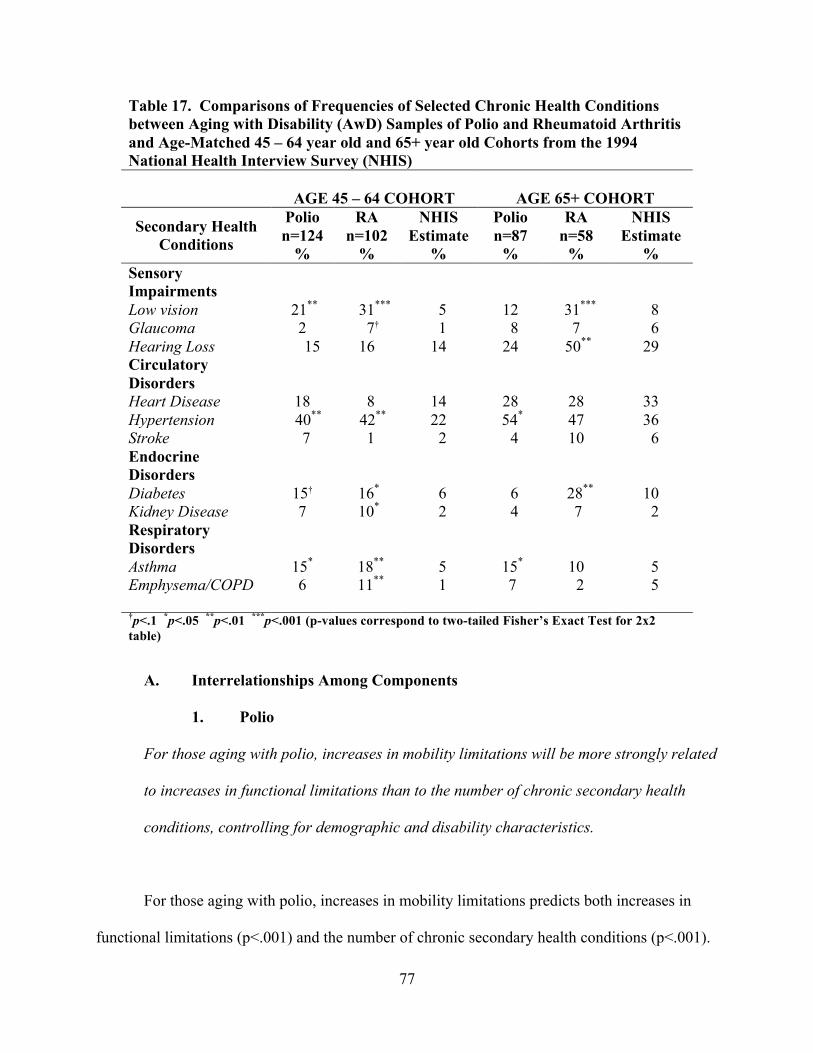
77
Table 17. Comparisons of Frequencies of Selected Chronic Health Conditions between Aging with Disability (AwD) Samples of Polio and Rheumatoid Arthritis and Age-Matched 45 – 64 year old and 65+ year old Cohorts from the 1994 National Health Interview Survey (NHIS)
AGE 45 – 64 COHORT
AGE 65+ COHORT
Secondary Health Conditions
Polio n=124
%
RA n=102
%
NHIS Estimate
%
Polio n=87
%
RA n=58
%
NHIS Estimate
% Sensory Impairments
Low vision 21** 31*** 5 12 31*** 8 Glaucoma 2 7† 1 8 7 6 Hearing Loss 15 16 14 24 50** 29 Circulatory Disorders
Heart Disease 18 8 14 28 28 33 Hypertension 40** 42** 22 54* 47 36 Stroke 7 1 2 4 10 6 Endocrine Disorders
Diabetes 15† 16* 6 6 28** 10 Kidney Disease 7 10* 2 4 7 2 Respiratory Disorders
Asthma 15* 18** 5 15* 10 5 Emphysema/COPD 6 11** 1 7 2 5
†p<.1 *p<.05 **p<.01 ***p<.001 (p-values correspond to two-tailed Fisher’s Exact Test for 2x2 table)
A. Interrelationships Among Components 1. Polio
For those aging with polio, increases in mobility limitations will be more strongly related
to increases in functional limitations than to the number of chronic secondary health
conditions, controlling for demographic and disability characteristics.
For those aging with polio, increases in mobility limitations predicts both increases in
functional limitations (p<.001) and the number of chronic secondary health conditions (p<.001).
78
Consistent with this hypothesis, increases in mobility limitations, is a stronger predictor of
increases in functional limitations (beta = .537) than of the number of chronic secondary health
conditions (beta = .282). Results are contained in the final models in Table 19 (model 4) and
Table 21 (model 5).
2. Rheumatoid Arthritis
For those aging with rheumatoid arthritis, increases in symptoms (fatigue, pain and joint
stiffness) will be more strongly related to increases in functional limitations than to the
number of chronic secondary health conditions, controlling for demographic and
disability characteristics.
The empirical evidence provides mixed support for this hypothesis. For those aging with
rheumatoid arthritis, increases in fatigue (p<.05) and increases in pain (p<.05) predicted increase
functional limitations, but joint stiffness did not. Neither increases in pain, fatigue or joint
stiffness predicted number of chronic secondary health conditions. Thus two of the three
hypothesized predictors, increases in fatigue and pain, are more strongly related to increases in
functional limitations than to the number of chronic secondary health conditions for persons
aging with rheumatoid arthritis. Results are contained in the final models in Table 20 (model 4)
and Table 22 (model 5).
79
B. Unique Disability Characteristics
1. Polio
For those aging with polio, disability trajectory indicators (severity of initial onset,
duration of disability and status at physical best) will be more strongly related to
increases in functional limitations than to the number of chronic secondary health
conditions controlling for demographic characteristics for individuals aging with polio.
None of the three trajectory indicators for polio, severity at onset, duration, and status at
physical best, predicted functional limitations or number of chronic secondary health conditions.
Thus, this hypothesis for polio was not supported. Results can be found in the final models in
Table 19 (model 4) and Table 21 (model 5).
2. Rheumatoid Arthritis
For those aging with rheumatoid arthritis, disability trajectory indicators (severity of
initial onset, age at diagnosis and status at reference period) will be more strongly
related to the number of chronic secondary health conditions than to increases in
functional limitations controlling for demographic characteristics for individuals aging
with rheumatoid arthritis.
None of the three trajectory variables for rheumatoid arthritis (severity of onset, age at
diagnosis, and status at reference period) predicting the number of chronic secondary health
conditions were significant. Of the three predictors, only status at reference period (p<.05)
predicted increases in functional limitations. Thus hypothesis was not supported for rheumatoid
80
arthritis. Detailed results appear in the final models in Table 20 (model 4) and Table 22 (model
5).
C. Disability Bed Days
1. Polio
For individuals aging with polio, increases in symptoms (pain, fatigue, muscle weakness),
increases in mobility limitations and increases in functional limitations will be stronger
predictors of the number of disability bed days in the last six months than will the number
of chronic secondary health conditions, controlling for demographic and disability
characteristics.
For those aging with polio, increase in fatigue (p<.05) and increases in functional
limitations (p<.001) predicted the number disability bed days in the last six months whereas
mobility limitations did not. The number of chronic secondary health conditions did not predict
the number of disability bed days. Hence there was partial support for the polio subsample for
this hypothesis. See the final model (model 6) in Table 23 for details.
2. Rheumatoid Arthritis
For individuals aging with rheumatoid arthritis, the number of chronic secondary health
conditions will be a stronger predictor of the number of disability bed days in the last six
months than will increases in symptoms (pain, fatigue, joint stiffness) increases in
mobility limitations and increases in functional limitations, controlling for demographic
and disability characteristics.
81
For individuals aging with rheumatoid arthritis, the number of chronic secondary health
conditions (p<.001) predicted the number of disability bed days in the last six months. Increases
in symptoms and increases in mobility limitations did not predict the number of disability bed
days in the last six months, but increases in functional limitations (p<.05) did. For individuals
with rheumatoid arthritis, partial support is found for this hypothesis. See the final model (model
6) in Table 24 for detailed results.
D. Compare Disability Group Differences: Pooled Sample Hypothesis
Based on measures available for those aging with polio and also those aging with
rheumatoid arthritis, relationships between predictors and outcomes (controlling for
demographic variables) will not consistently be stronger for either disability group. This
hypothesis applies to the common predictors of increases in chronic secondary health
conditions (three predictors), increases in functional limitations (four predictors), and
the number of disability bed days in six months (five predictors).
The prior six within-sample hypotheses addressed three domains (one in each domain for
each subsample). As a follow-up to the polio and RA hypotheses, a hypothesis is presented
involving tests of interaction to determine the significance of differences between the models for
the two disability groups. This hypothesis offers a partial test of whether data on the two
disability subsamples could be pooled. There were, however, certain differences between the
measures used to assess the relationships tested in the within-sample polio and RA hypotheses
and the measures used in testing this between-sample hypothesis: the variables measuring the
disability trajectory differed for the two samples and were omitted; and the between-sample
82
hypothesis tested outcomes one at a time, whereas the within-sample hypotheses included
comparisons involving more than one outcome.
1. Interactions Between Disability Group and The Number Of Chronic Secondary Health Conditions
An analysis examined differences between the two disability groups in the strength of
predictors. Comparisons between the polio and RA subsamples were conducted by pooling the
subsamples and testing for interaction. In separate regressions for each predictor, that is, the
interaction between the predictor and a dichotomous measure of disability type (i.e., subsample)
was tested. Also included in the regressions for this analysis were three control variables (age at
interview, gender and education). The three disability trajectory variables for each sample
(polio: duration, severity of initial onset and status at physical best; RA: age at diagnosis,
severity of initial onset and status at reference period) were omitted because they were not
equivalent across samples.
In testing for group differences for predictors of the number of chronic secondary health
conditions, the samples had three predictors common to both samples: increases in pain,
increases in fatigue, and increases in mobility. None of the three predictors generated a
significant interaction with disability group. The analyses produced no evidence that pain,
fatigue or mobility was a stronger predictor of chronic secondary health conditions for one
disability group or the other. Detailed results on interaction are summarized in Table 18.
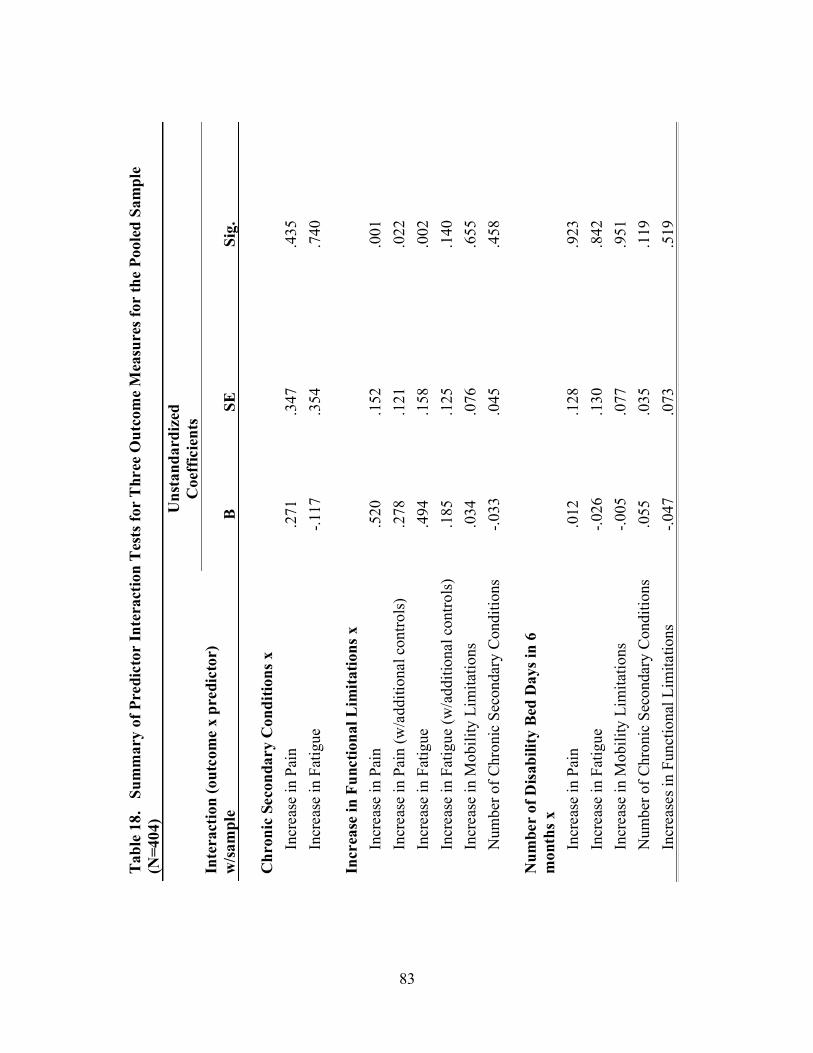
83
Tabl
e 18
. S
umm
ary
of P
redi
ctor
Inte
ract
ion
Tes
ts fo
r T
hree
Out
com
e M
easu
res f
or th
e Po
oled
Sam
ple
(N=4
04)
U
nsta
ndar
dize
d C
oeff
icie
nts
Inte
ract
ion
(out
com
e x
pred
icto
r)
w/sa
mpl
e B
SE
Sig.
C
hron
ic S
econ
dary
Con
ditio
ns x
Incr
ease
in P
ain
.271
.3
47
.435
In
crea
se in
Fat
igue
-.1
17
.354
.7
40
Incr
ease
in F
unct
iona
l Lim
itatio
ns x
Incr
ease
in P
ain
.520
.1
52
.001
In
crea
se in
Pai
n (w
/add
ition
al c
ontro
ls)
.278
.1
21
.022
In
crea
se in
Fat
igue
.4
94
.158
.0
02
Incr
ease
in F
atig
ue (w
/add
ition
al c
ontro
ls)
.185
.1
25
.140
In
crea
se in
Mob
ility
Lim
itatio
ns
.034
.0
76
.655
N
umbe
r of C
hron
ic S
econ
dary
Con
ditio
ns
-.033
.0
45
.458
N
umbe
r of
Disa
bilit
y Be
d D
ays i
n 6
mon
ths x
Incr
ease
in P
ain
.012
.1
28
.923
In
crea
se in
Fat
igue
-.0
26
.130
.8
42
Incr
ease
in M
obili
ty L
imita
tions
-.0
05
.077
.9
51
Num
ber o
f Chr
onic
Sec
onda
ry C
ondi
tions
.0
55
.035
.1
19
Incr
ease
s in
Func
tiona
l Lim
itatio
ns
-.047
.0
73
.519
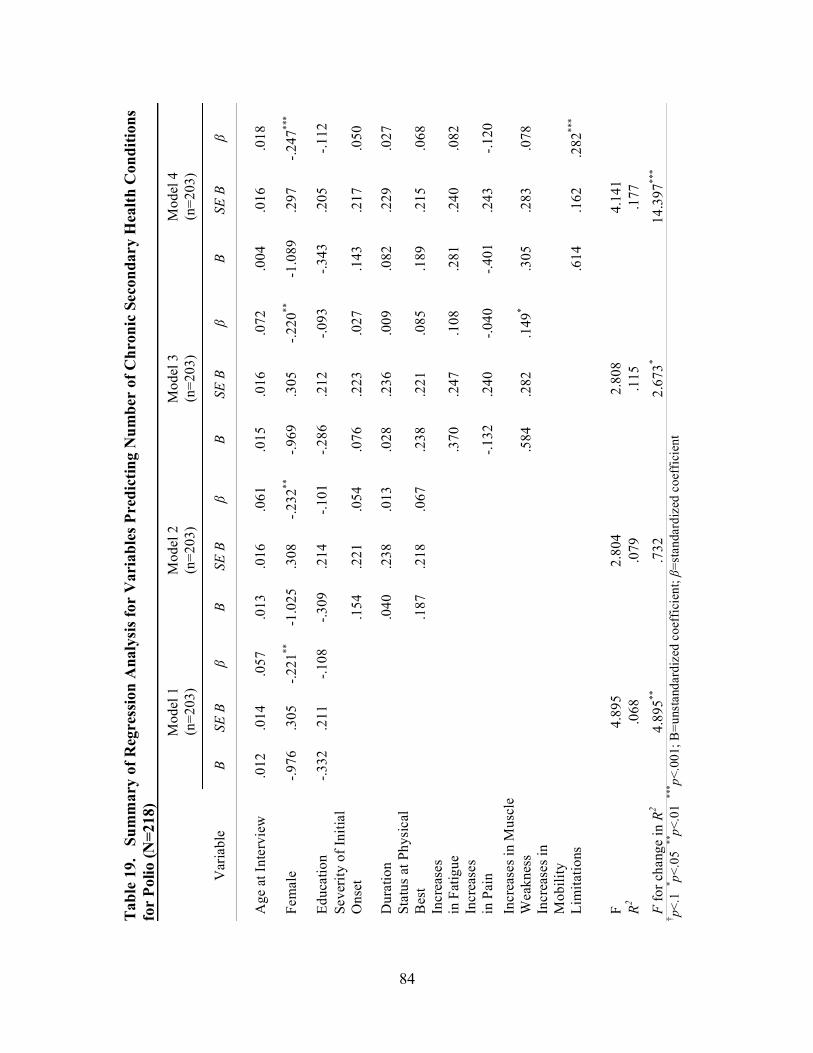
84
Tabl
e 19
. S
umm
ary
of R
egre
ssio
n A
naly
sis f
or V
aria
bles
Pre
dict
ing
Num
ber
of C
hron
ic S
econ
dary
Hea
lth C
ondi
tions
fo
r Po
lio (N
=218
)
Mod
el 1
(n
=203
) M
odel
2
(n=2
03)
Mod
el 3
(n
=203
) M
odel
4
(n=2
03)
Var
iabl
e B
SE B
β
B SE
B
β B
SE B
β
B SE
B
β
Age
at I
nter
view
.0
12
.014
.0
57
.013
.0
16
.061
.0
15
.016
.0
72
.004
.0
16
.018
Fem
ale
-.976
.3
05
-.221
**
-1.0
25
.308
-.2
32**
-.9
69
.305
-.2
20**
-1
.089
.2
97
-.247
***
Educ
atio
n -.3
32
.211
-.1
08
-.309
.2
14
-.101
-.2
86
.212
-.0
93
-.343
.2
05
-.112
Se
verit
y of
Initi
al
Ons
et
.1
54
.221
.0
54
.076
.2
23
.027
.1
43
.217
.0
50
Dur
atio
n
.040
.2
38
.013
.0
28
.236
.0
09
.082
.2
29
.027
St
atus
at P
hysi
cal
Bes
t
.187
.2
18
.067
.2
38
.221
.0
85
.189
.2
15
.068
In
crea
ses
in F
atig
ue
.370
.2
47
.108
.2
81
.240
.0
82
Incr
ease
s in
Pai
n
-.1
32
.240
-.0
40
-.401
.2
43
-.120
In
crea
ses i
n M
uscl
e W
eakn
ess
.584
.2
82
.149
* .3
05
.283
.0
78
Incr
ease
s in
M
obili
ty
Lim
itatio
ns
.6
14
.162
.2
82**
*
F 4.
895
2.80
4 2.
808
4.14
1 R2
.068
.0
79
.115
.1
77
F fo
r cha
nge
in R
2 4.
895**
.7
32
2.67
3* 14
.397
***
† p<.1
* p<.0
5 **
p<.0
1 **
* p<.0
01; B
=uns
tand
ardi
zed
coef
ficie
nt; β
=sta
ndar
dize
d co
effic
ient
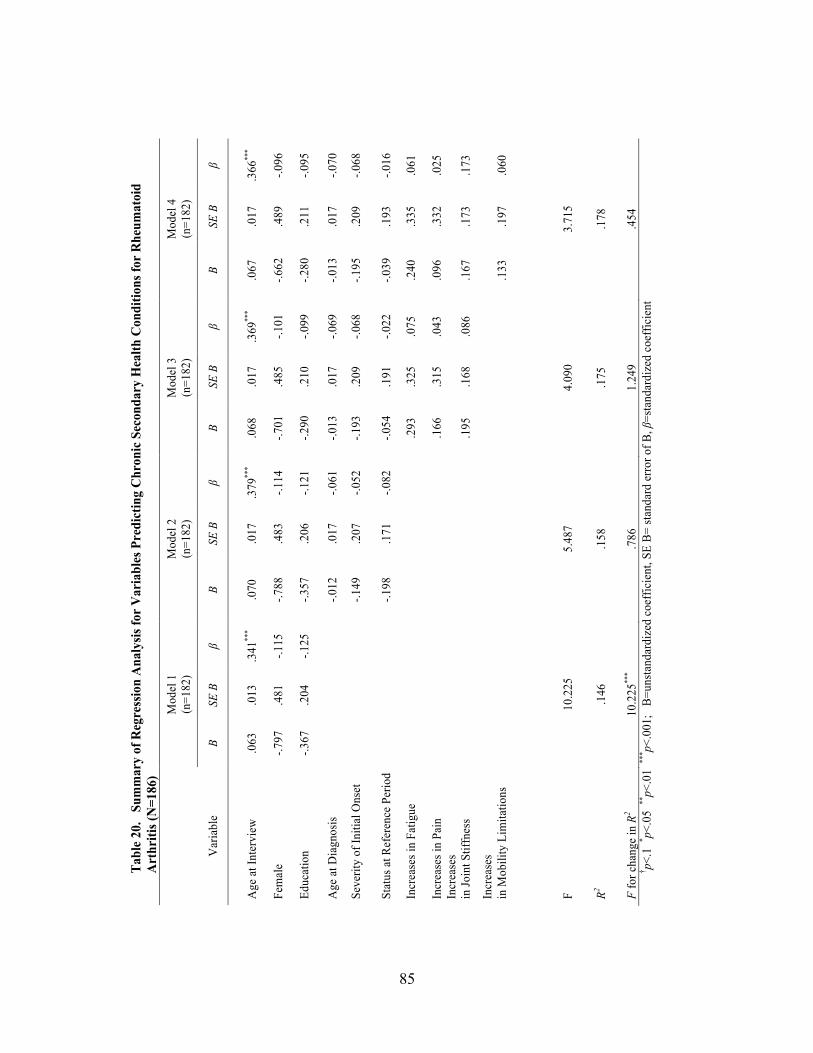
85
Tabl
e 20
. S
umm
ary
of R
egre
ssio
n A
naly
sis fo
r V
aria
bles
Pre
dict
ing
Chr
onic
Sec
onda
ry H
ealth
Con
ditio
ns fo
r R
heum
atoi
d A
rthr
itis (
N=1
86)
M
odel
1
(n=1
82)
Mod
el 2
(n
=182
) M
odel
3
(n=1
82)
Mod
el 4
(n
=182
)
Var
iabl
e B
SE B
β
B SE
B
β B
SE B
β
B SE
B
β
Age
at I
nter
view
.0
63
.013
.3
41**
* .0
70
.017
.3
79**
* .0
68
.017
.3
69**
* .0
67
.017
.3
66**
*
Fem
ale
-.797
.4
81
-.115
-.7
88
.483
-.1
14
-.701
.4
85
-.101
-.6
62
.489
-.0
96
Educ
atio
n -.3
67
.204
-.1
25
-.357
.2
06
-.121
-.2
90
.210
-.0
99
-.280
.2
11
-.095
Age
at D
iagn
osis
-.0
12
.017
-.0
61
-.013
.0
17
-.069
-.0
13
.017
-.0
70
Seve
rity
of In
itial
Ons
et
-.1
49
.207
-.0
52
-.193
.2
09
-.068
-.1
95
.209
-.0
68
Stat
us a
t Ref
eren
ce P
erio
d
-.198
.1
71
-.082
-.0
54
.191
-.0
22
-.039
.1
93
-.016
Incr
ease
s in
Fatig
ue
.293
.3
25
.075
.2
40
.335
.0
61
Incr
ease
s in
Pain
.1
66
.315
.0
43
.096
.3
32
.025
In
crea
ses
in Jo
int S
tiffn
ess
.195
.1
68
.086
.1
67
.173
.1
73
Incr
ease
s in
Mob
ility
Lim
itatio
ns
.1
33
.197
.0
60
F 10
.225
5.
487
4.09
0 3.
715
R2 .1
46
.158
.1
75
.178
F fo
r cha
nge
in R
2 10
.225
***
.786
1.
249
.454
† p<
.1 * p<
.05
**p<
.01
*** p<
.001
; B
=uns
tand
ardi
zed
coef
ficie
nt, S
E B=
stan
dard
erro
r of B
, β=s
tand
ardi
zed
coef
ficie
nt

86
2. Interactions Between Disability Group and Functional Limitations
In the testing for group differences for predictors of increases in functional limitations,
there were four predictors, common to both samples: increase in pain, increase in fatigue,
increase in mobility, and the number of chronic secondary conditions. As mentioned above, in
the final subsample models of the hierarchical regressions, two of these four predictors, increases
in mobility (p<.001) and chronic secondary conditions (p<.05), were positively and significantly
related to increases in functional limitations for the polio subsample, and all four predictors,
fatigue (p<.05), pain (p<.05), increases in mobility limitations (p<.001) and number of secondary
conditions (p<.05) were positively and significantly related to increases in functional limitations
for the RA subsample.
Included in the regressions for the differential effects analysis were the three control
variables (i.e., age, gender and education), but not the three measures of disease trajectory, which
differed for the two subsamples. Two of the four predictors generated a positive significant
interaction with disability group: increases in pain (p<.01) and in fatigue (p<.01). These two
regressions were rerun. Three of four common predictors (i.e., increase in pain, increase in
fatigue, increase in mobility, number of chronic secondary conditions) were included as controls
in addition to age, gender and education. The only significant interaction that remained was
increases in pain (B for interaction term is .278; p<.05). One significant result at p<.05 among
12 tests of interaction is what would expect by chance alone, and this isolated significant result is
likely to be a Type 1 error. Refer to Table 18 for tests of interaction between disability samples
and each of the 12 predictors.
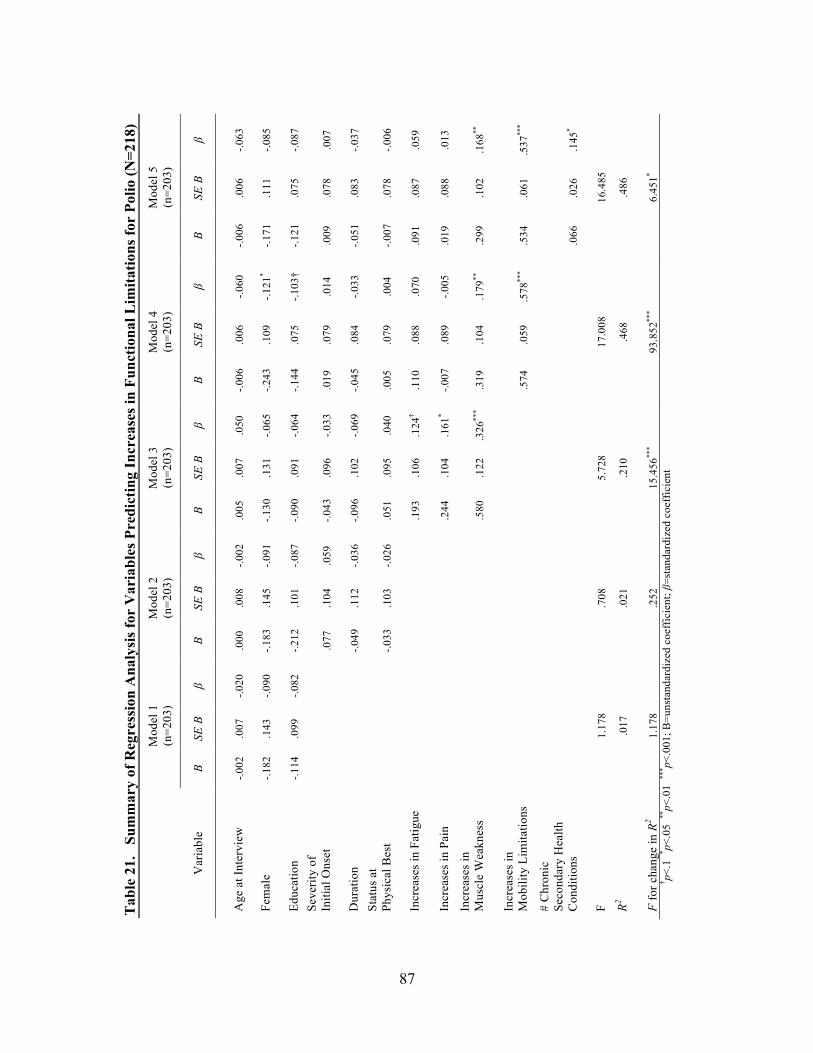
87
Tab
le 2
1.
Sum
mar
y of
Reg
ress
ion
Ana
lysi
s fo
r V
aria
bles
Pre
dict
ing
Incr
ease
s in
Fun
ctio
nal L
imita
tions
for
Polio
(N=2
18)
M
odel
1
(n=2
03)
Mod
el 2
(n
=203
) M
odel
3
(n=2
03)
Mod
el 4
(n
=203
) M
odel
5
(n=2
03)
Var
iabl
e B
SE B
β
B SE
B
β B
SE B
β
B SE
B
β B
SE B
β
Age
at I
nter
view
-.0
02
.007
-.0
20
.000
.0
08
-.002
.0
05
.007
.0
50
-.006
.0
06
-.060
-.0
06
.006
-.0
63
Fem
ale
-.182
.1
43
-.090
-.1
83
.145
-.0
91
-.130
.1
31
-.065
-.2
43
.109
-.1
21*
-.171
.1
11
-.085
Educ
atio
n -.1
14
.099
-.0
82
-.212
.1
01
-.087
-.0
90
.091
-.0
64
-.144
.0
75
-.103
† -.1
21
.075
-.0
87
Seve
rity
of
Initi
al O
nset
.077
.1
04
.059
-.0
43
.096
-.0
33
.019
.0
79
.014
.0
09
.078
.0
07
Dur
atio
n
-.049
.1
12
-.036
-.0
96
.102
-.0
69
-.045
.0
84
-.033
-.0
51
.083
-.0
37
Stat
us a
t Ph
ysic
al B
est
-.033
.1
03
-.026
.0
51
.095
.0
40
.005
.0
79
.004
-.0
07
.078
-.0
06
Incr
ease
s in
Fat
igue
.1
93
.106
.1
24†
.110
.0
88
.070
.0
91
.087
.0
59
Incr
ease
s in
Pai
n
.2
44
.104
.1
61*
-.007
.0
89
-.005
.0
19
.088
.0
13
Incr
ease
s in
M
uscl
e W
eakn
ess
.5
80
.122
.3
26**
* .3
19
.104
.1
79**
.2
99
.102
.1
68**
Incr
ease
s in
M
obili
ty L
imita
tions
.574
.0
59
.578
***
.534
.0
61
.537
***
# C
hron
ic
Seco
ndar
y H
ealth
C
ondi
tions
.0
66
.026
.1
45*
F 1.
178
.708
5.
728
17.0
08
16.4
85
R2 .0
17
.021
.2
10
.468
.4
86
F fo
r cha
nge
in R
2 1.
178
.252
15
.456
***
93.8
52**
* 6.
451*
† p<
.1 * p<
.05
**p<
.01
*** p<
.001
; B=u
nsta
ndar
dize
d co
effic
ient
; β=s
tand
ardi
zed
coef
ficie
nt
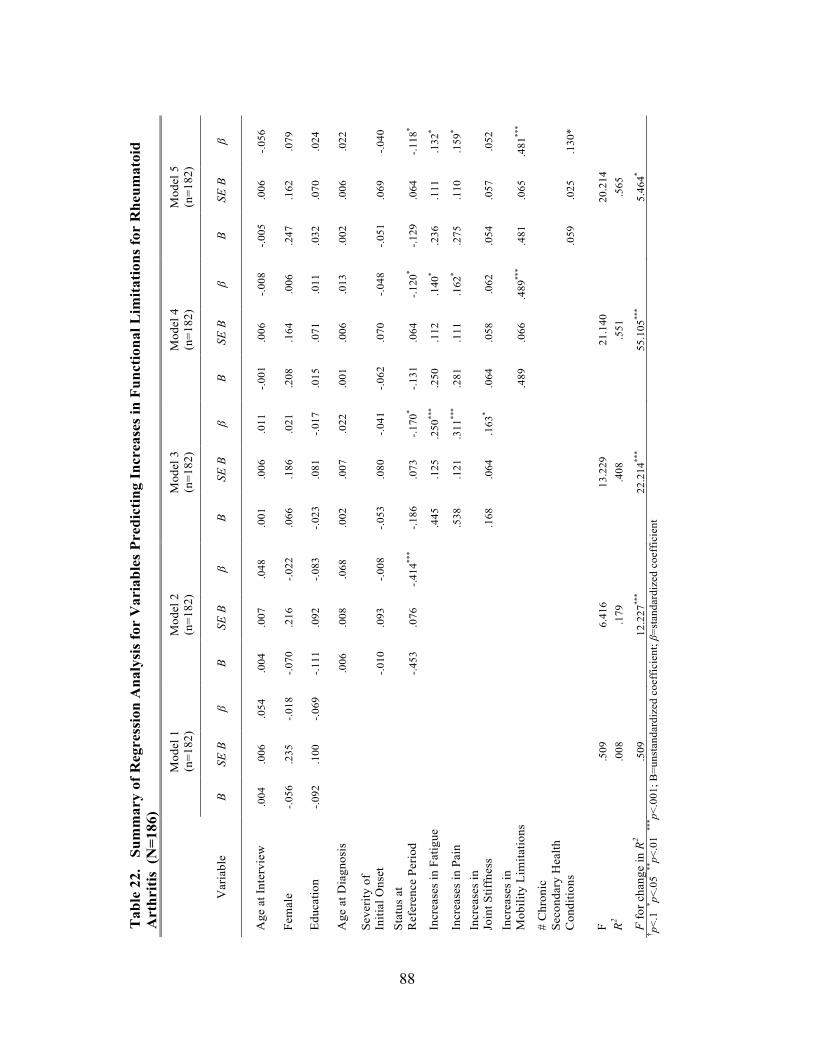
88
Tab
le 2
2.
Sum
mar
y of
Reg
ress
ion
Ana
lysi
s fo
r V
aria
bles
Pre
dict
ing
Incr
ease
s in
Fun
ctio
nal L
imit
atio
ns fo
r R
heum
atoi
d
A
rthr
itis
(N
=186
)
Mod
el 1
(n
=182
) M
odel
2
(n=1
82)
Mod
el 3
(n
=182
) M
odel
4
(n=1
82)
Mod
el 5
(n
=182
)
Var
iabl
e B
SE B
β
B SE
B
β B
SE B
β
B SE
B
β B
SE B
β
Age
at I
nter
view
.0
04
.006
.0
54
.004
.0
07
.048
.0
01
.006
.0
11
-.001
.0
06
-.008
-.0
05
.006
-.0
56
Fem
ale
-.056
.2
35
-.018
-.0
70
.216
-.0
22
.066
.1
86
.021
.2
08
.164
.0
06
.247
.1
62
.079
Educ
atio
n -.0
92
.100
-.0
69
-.111
.0
92
-.083
-.0
23
.081
-.0
17
.015
.0
71
.011
.0
32
.070
.0
24
Age
at D
iagn
osis
.006
.0
08
.068
.0
02
.007
.0
22
.001
.0
06
.013
.0
02
.006
.0
22
Seve
rity
of
Initi
al O
nset
-.010
.0
93
-.008
-.0
53
.080
-.0
41
-.062
.0
70
-.048
-.0
51
.069
-.0
40
Stat
us a
t R
efer
ence
Per
iod
-.4
53
.076
-.4
14**
* -.1
86
.073
-.1
70*
-.131
.0
64
-.120
* -.1
29
.064
-.1
18*
Incr
ease
s in
Fat
igue
.4
45
.125
.2
50**
* .2
50
.112
.1
40*
.236
.1
11
.132
*
Incr
ease
s in
Pai
n
.5
38
.121
.3
11**
* .2
81
.111
.1
62*
.275
.1
10
.159
*
Incr
ease
s in
Jo
int S
tiffn
ess
.168
.0
64
.163
* .0
64
.058
.0
62
.054
.0
57
.052
Incr
ease
s in
M
obili
ty L
imita
tions
.489
.0
66
.489
***
.481
.0
65
.481
***
# C
hron
ic
Seco
ndar
y H
ealth
C
ondi
tions
.0
59
.025
.1
30*
F .5
09
6.41
6 13
.229
21
.140
20
.214
R2
.008
.1
79
.408
.5
51
.565
F fo
r cha
nge
in R
2 .5
09
12.2
27**
* 22
.214
***
55.1
05**
* 5.
464*
† p<.1
* p<.0
5 **
p<.0
1 **
* p<.0
01; B
=uns
tand
ardi
zed
coef
ficie
nt; β
=sta
ndar
dize
d co
effic
ient
89
3. Interactions Between Disability Group and Disability Bed Days in Last Six Months
In the testing for group differences for predictors of the number of disability bed
days in the last six months, there were five common predictors for both groups: increases in pain,
increases in fatigue, increases in mobility limitations, number of secondary conditions, and
increase in functional limitations. In the final subsample models of the hierarchical regressions,
three of these five predictors were significantly related to number of disability bed days in the
last six months for the polio subsample: increase in fatigue (p<.05), increase in mobility
limitations (inverse relationship; p<.1) increase in functional limitations (p<.001). Two
predictors were significant for the RA subsample: number of chronic secondary conditions
(p<.001) and increase in functional limitations (p<.05).
Included in the regressions for the effect analysis were the three control variables (i.e.,
age, sex and education), but not the three measures of disease trajectory, which differed for the
two polio and RA. None of the five predictors generated a significant interaction with disability
group. Details can be found in Table 18.
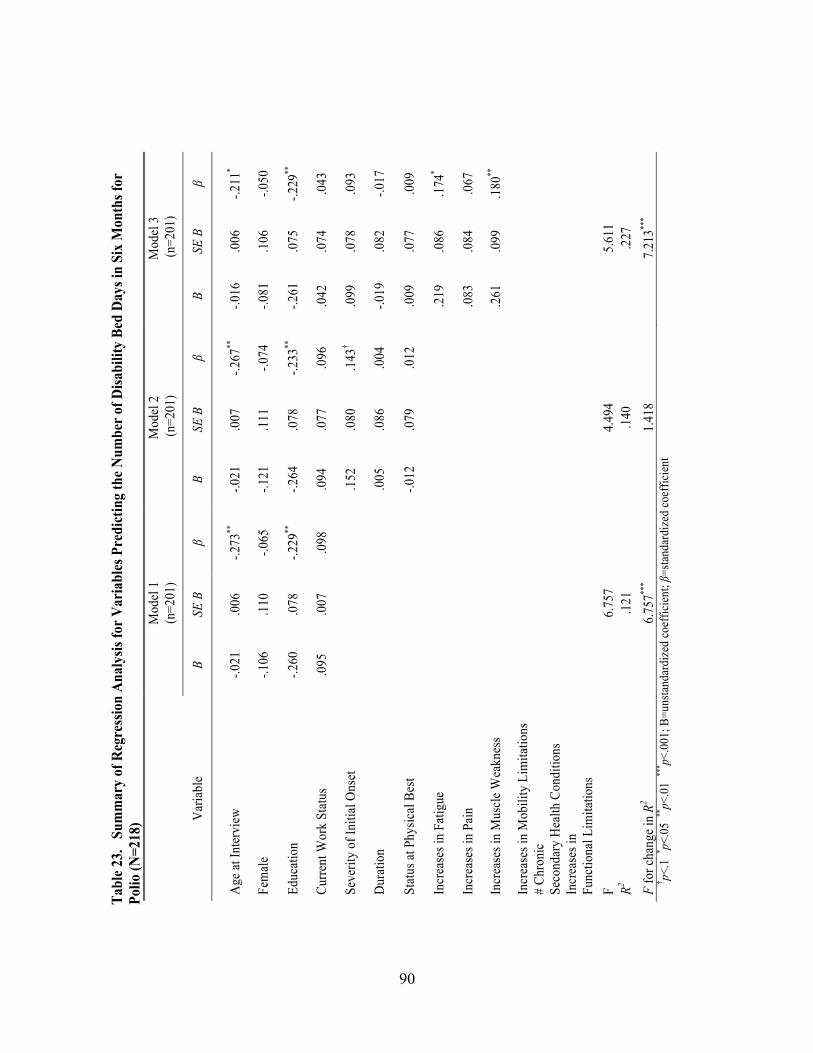
90
Tabl
e 23
. S
umm
ary
of R
egre
ssio
n A
naly
sis fo
r V
aria
bles
Pre
dict
ing
the
Num
ber
of D
isabi
lity
Bed
Day
s in
Six
Mon
ths f
or
Polio
(N=2
18)
M
odel
1
(n=2
01)
Mod
el 2
(n
=201
) M
odel
3
(n=2
01)
Var
iabl
e B
SE B
β
B SE
B
β B
SE B
β
Age
at In
terv
iew
-.0
21
.006
-.2
73**
-.0
21
.007
-.2
67**
-.0
16
.006
-.2
11*
Fem
ale
-.106
.1
10
-.065
-.1
21
.111
-.0
74
-.081
.1
06
-.050
Educ
atio
n -.2
60
.078
-.2
29**
-.2
64
.078
-.2
33**
-.2
61
.075
-.2
29**
Curre
nt W
ork
Stat
us
.095
.0
07
.098
.0
94
.077
.0
96
.042
.0
74
.043
Seve
rity
of In
itial
Ons
et
.1
52
.080
.1
43†
.099
.0
78
.093
Dur
atio
n
.005
.0
86
.004
-.0
19
.082
-.0
17
Stat
us at
Phy
sical
Bes
t
-.012
.0
79
.012
.0
09
.077
.0
09
Incr
ease
s in
Fatig
ue
.219
.0
86
.174
*
Incr
ease
s in
Pain
.0
83
.084
.0
67
Incr
ease
s in
Mus
cle W
eakn
ess
.261
.0
99
.180
**
Incr
ease
s in
Mob
ility
Lim
itatio
ns
#
Chro
nic
Seco
ndar
y H
ealth
Con
ditio
ns
In
crea
ses i
n
Func
tiona
l Lim
itatio
ns
F
6.75
7 4.
494
5.61
1 R2
.121
.1
40
.227
F
for c
hang
e in
R2 6.
757**
* 1.
418
7.21
3***
† p<.1
* p<.0
5 **
p<.0
1 **
* p<.0
01; B
=uns
tand
ardi
zed
coef
ficie
nt; β
=sta
ndar
dize
d co
effic
ient

91
Tab
le 2
3. c
ont’
d S
umm
ary
of R
egre
ssio
n A
naly
sis
for
Var
iabl
es P
redi
ctin
g th
e N
umbe
r of
Dis
abili
ty B
ed D
ays
in S
ix M
onth
s
for
Polio
(N=2
18)
Mod
el 4
(n
=201
) M
odel
5
(n=2
01)
Mod
el 6
(n
=201
)
Var
iabl
e B
SE B
β
B SE
B
β B
SE B
β
Age
at I
nter
view
-.0
17
.006
-.2
16*
-.016
.0
06
-.211
* -.0
14
.006
-.1
86*
Fem
ale
-.088
.1
07
-.054
-.0
43
.110
-.0
21
.013
.1
07
.008
Educ
atio
n -.2
67
.076
-.2
35**
-.2
58
.075
-.2
27**
-.2
30
.073
-.2
02**
Cur
rent
Wor
k St
atus
.0
34
.075
.0
34
.010
.0
76
.010
-.0
03
.073
-.0
03
Seve
rity
of In
itial
Ons
et
.104
.0
78
.097
.0
96
.078
.0
90
.093
.0
75
.087
Dur
atio
n -.0
16
.083
-.0
14
-.021
.0
82
-.019
-.0
09
.079
-.0
08
Stat
us a
t Phy
sica
l Bes
t .0
06
.077
.0
05
-.004
.0
77
-.004
-.0
03
.074
-.0
03
Incr
ease
s in
Fatig
ue
.214
.0
86
.170
* .2
02
.086
.1
60*
.178
.0
83
.142
*
Incr
ease
s in
Pain
.0
66
.088
.0
54
.085
.0
88
.069
.0
78
.085
.0
64
Incr
ease
s in
Mus
cle
Wea
knes
s .2
43
.103
.1
68*
.229
.1
02
.158
* .1
51
.101
.1
04
Incr
ease
s in
Mob
ility
Lim
itatio
ns
.040
.0
60
.049
.0
16
.060
.0
19
-.124
.0
69
-.153
† #
Chr
onic
Se
cond
ary
Hea
lth C
ondi
tions
.052
.0
27
.134
.0
37
.026
.0
96
Incr
ease
s in
Fu
nctio
nal L
imita
tions
.2
66
.069
.3
23**
*
F 5.
128
5.07
8 6.
174
R2 .2
29
.244
.2
99
F fo
r cha
nge
in R
2 .4
50
3.72
9† 14
.853
***
† p<.1
* p<.0
5 **
p<.0
1*** p<
.001
; B=u
nsta
ndar
dize
d co
effic
ient
; β=s
tand
ardi
zed
coef
ficie
nt
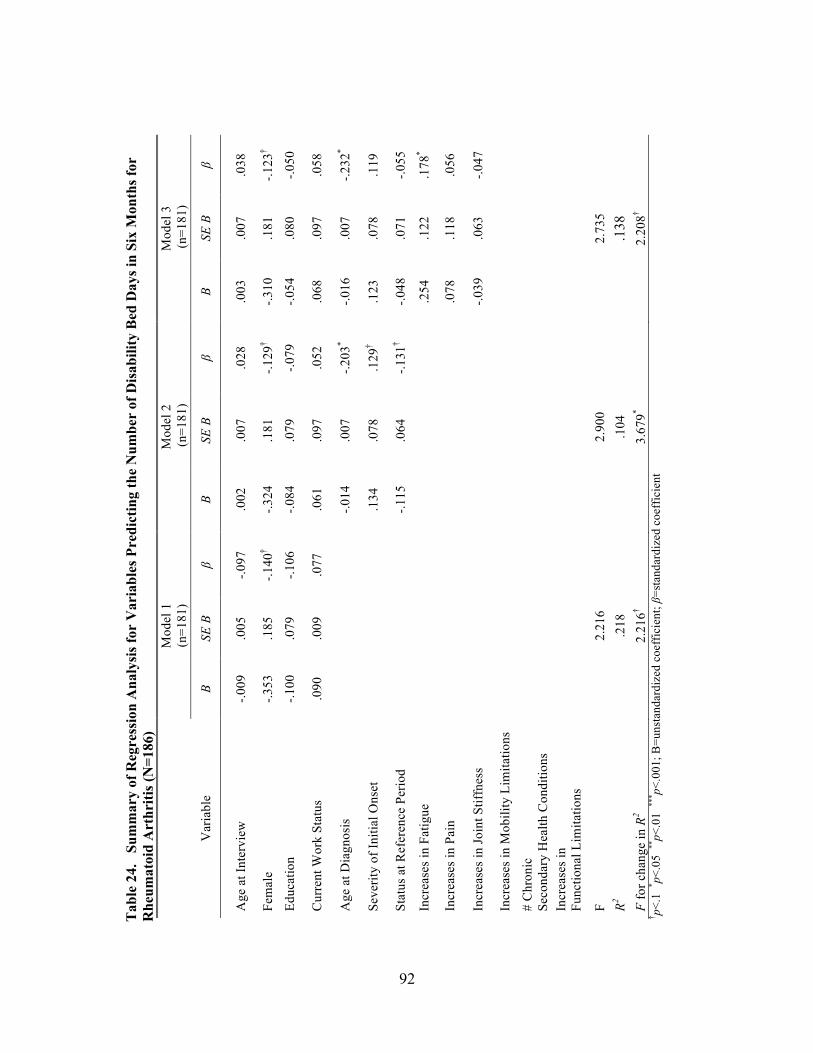
92
Tab
le 2
4.
Sum
mar
y of
Reg
ress
ion
Ana
lysi
s fo
r V
aria
bles
Pre
dict
ing
the
Num
ber
of D
isab
ility
Bed
Day
s in
Six
Mon
ths
for
Rhe
umat
oid
Art
hriti
s (N
=186
)
Mod
el 1
(n
=181
) M
odel
2
(n=1
81)
Mod
el 3
(n
=181
)
Var
iabl
e B
SE B
β
B SE
B
β B
SE B
β
Age
at I
nter
view
-.0
09
.005
-.0
97
.002
.0
07
.028
.0
03
.007
.0
38
Fem
ale
-.353
.1
85
-.140
† -.3
24
.181
-.1
29†
-.310
.1
81
-.123
†
Educ
atio
n -.1
00
.079
-.1
06
-.084
.0
79
-.079
-.0
54
.080
-.0
50
Cur
rent
Wor
k St
atus
.0
90
.009
.0
77
.061
.0
97
.052
.0
68
.097
.0
58
Age
at D
iagn
osis
-.014
.0
07
-.203
* -.0
16
.007
-.2
32*
Seve
rity
of In
itial
Ons
et
.1
34
.078
.1
29†
.123
.0
78
.119
Stat
us a
t Ref
eren
ce P
erio
d
-.115
.0
64
-.131
† -.0
48
.071
-.0
55
Incr
ease
s in
Fatig
ue
.254
.1
22
.178
*
Incr
ease
s in
Pain
.0
78
.118
.0
56
Incr
ease
s in
Join
t Stif
fnes
s
-.0
39
.063
-.0
47
Incr
ease
s in
Mob
ility
Lim
itatio
ns
# C
hron
ic
Seco
ndar
y H
ealth
Con
ditio
ns
In
crea
ses i
n
Func
tiona
l Lim
itatio
ns
F 2.
216
2.90
0 2.
735
R2 .2
18
.104
.1
38
F fo
r cha
nge
in R
2 2.
216†
3.67
9* 2.
208†
†p<
.1 * p<
.05
**p<
.01
*** p<
.001
; B=u
nsta
ndar
dize
d co
effic
ient
; β=s
tand
ardi
zed
coef
ficie
nt

93
Tab
le 2
4. c
ont’
d S
umm
ary
of R
egre
ssio
n A
naly
sis
for
Var
iabl
es P
redi
ctin
g th
e N
umbe
r of
Dis
abili
ty B
ed D
ays
in S
ix
M
onth
s fo
r R
heum
atoi
d A
rthr
itis
(N=1
86)
M
odel
4
(n=1
81)
Mod
el 5
(n
=181
) M
odel
6
(n=1
81)
Var
iabl
e B
SE B
β
B SE
B
β B
SE B
β
Age
at I
nter
view
.0
02
.007
.0
35
-.006
.0
07
-.091
-.0
05
.007
-.0
76
Fem
ale
-.284
.1
82
-.113
-.2
09
.174
-.0
83
-.260
.1
74
-.104
Educ
atio
n -.0
47
.080
-.0
44
-.015
.0
77
-.014
-.0
21
.075
-.0
20
Cur
rent
Wor
k St
atus
.0
65
.097
.0
56
.078
.0
92
.067
.0
76
.091
.0
65
Age
at D
iagn
osis
-.0
17
.007
-.2
34*
-.014
.0
06
-.208
* -.0
15
.006
-.2
14*
Seve
rity
of In
itial
Ons
et
.121
.0
78
.118
.1
44
.074
.1
39†
.154
.0
73
.150
*
Stat
us a
t Ref
eren
ce P
erio
d -.0
39
.072
-.0
44
-.034
.0
68
-.039
-.0
09
.068
-.0
09
Incr
ease
s in
Fatig
ue
.219
.1
25
.156
† .1
91
.119
.1
34
.142
.1
19
.100
Incr
ease
s in
Pain
.0
33
.124
.0
24
.019
.1
18
.014
-.0
38
.118
-.0
27
Incr
ease
s in
Join
t Stif
fnes
s -.0
57
.064
-.0
69
-.076
.0
61
-.092
-.0
87
.061
-.1
05
Incr
ease
s in
Mob
ility
Lim
itatio
ns
.087
.0
73
.109
.0
71
.070
.0
88
-.028
.0
79
-.035
#
Chr
onic
Se
cond
ary
Hea
lth C
ondi
tions
.117
.0
27
.322
***
.104
.0
27
.288
***
Incr
ease
s in
Fu
nctio
nal L
imita
tions
.2
06
.081
.2
58*
F 2.
622
4.19
9 4.
509
R2 .1
45
.230
.2
59
F fo
r cha
nge
in R
2 1.
423
18.5
69**
* 6.
563*
† p<
.1 * p<
.05
**p<
.01
*** p<
.001
; B=u
nsta
ndar
dize
d co
effic
ient
; β=s
tand
ardi
zed
coef
ficie
nt
94
VII. DISCUSSION
This study investigated samples from two disability groups, individuals aging with post-
polio syndrome and rheumatoid arthritis. Six within-disability hypotheses and one between-
disability hypothesis were tested using a framework that conceptualizes disability trajectories
within a life course perspective. Exploratory factor analysis was used in scale development for
three constructs of secondary conditions found in the hypotheses: increase in symptoms, number
of chronic secondary health conditions and increase in functional limitations. Regression analysis
was then conducted to test the six within-sample and one between-sample hypothesis using
number of chronic secondary health conditions, increase in functional limitations and number of
disability bed days in six months. The final models for polio and rheumatoid arthritis can be
found in Figures 5 and 6 respectively.
A. Within-Sample Hypotheses
1. Polio
In the first hypothesis, increases in mobility predicted both functional limitations and the
number of chronic secondary health conditions. The stronger predictor was increases in
functional limitations as opposed to the number of chronic secondary health conditions thus
providing support for the hypothesis. Clinical literature is considerable with respect to the
disease course of post-polio syndrome. Individuals who had recovered from polio have found in
mid-life that they are having difficulty with new muscle weakness, pain and fatigue. These
symptoms result in difficulty with balance and ambulation, and can result in wheelchair use.
Wheelchair use can affect functional activities. Research regarding mobility is repeatedly found
in the literature, however, how pain, fatigue and new muscle weakness relates to mobility and
95
functional decline is inconsistent (Nollet, Beelen, Prins, de Visser et al., 1999; Stolwijk, Beelen,
Lankhorst and Nollet, 2005).
The second hypothesis that the three trajectory variables (severity at onset, duration and
status at physical best) would be more strongly related to increases in functional limitations than
to the number of chronic secondary health conditions was not supported. Using the same dataset
as this study, Sheets (1999) found similar results using disability trajectory variables for polio
when looking at risk factors for decline in ADLs. The findings may be related to the way the
disability trajectory component was constructed. A possibility would be to break apart the
trajectory variables. Duration and severity of onset would stay together because the better
represent the trajectory. The status at physical best would then follow in the model.
The findings of the third hypothesis were partially supported. Increases in mobility
limitations did not predict the number of disability bed days in the last six months, but fatigue
and increases in functional limitations did. The number of chronic secondary conditions was not
significant as hypothesized. The finding that increases in mobility limitations did not predict the
number of disability bed days might indicate that individuals who have mobility limitations have
adapted to them. For example, mobility with an assistive device from a cane to a walker to a
wheelchair accomplishes the goal of getting around. However basic mobility may be to overall
function, it is sometimes the easier to solve. Functional activities such as preparing food or
performing light housework can be complex, require many tasks/steps to complete, and can
prove more difficult to ameliorate. If one is having more difficulty performing tasks such as
these, it is likely that they are experiencing more secondary symptoms that require bed days.
2. Rheumatoid Arthritis
Two of the three hypotheses proposed for individuals aging with RA were partially
96
supported. The first hypothesis predicting that increases in symptoms would be more strongly
related to increases in functional limitations than to the number of chronic secondary health
conditions was partially supported. Increases in pain and increases in fatigue were significant,
but not increases in joint stiffness, a characteristic symptom of rheumatoid arthritis. When
increases in symptoms were first introduced in model 3 (Table 22), joint stiffness (p<.05) was
significant. When increase in mobility limitations was added in model 4, the significance of
increases in joint stiffness disappeared. Despite joints stiffness’ importance as a symptom to
RA’s disease process, it has not shown up as a significant predictor, unlike pain and fatigue, in
quantitative studies that have included symptoms. However, Lutze and Archenholtz’s (2007)
findings in a qualitative study demonstrate the impact joint stiffness has on individuals aging
with rheumatoid arthritis. The fact that increases in pain and increases in fatigue and not
increases in joint stiffness were found to be significant for increases in functional limitations has
support in the literature (McKenna and Wright, 1985; Hallet, Thyberg, Hass et al., 2003; Strating,
Van Schuur and Suurmeijer, 2007) taking into account differences in study design.
The hypothesis predicting that the trajectory variables (severity of initial onset, age at
diagnosis, status at reference period) would be more strongly related to number of chronic
secondary health conditions than to increases in functional limitations. There was no support for
this hypothesis as there were no significant variables for either outcome of number of chronic
secondary health conditions or increases in functional limitations. In a prospective study,
Navarro-Cano, del Rincon, Pogosian et al. (2003) found that disease severity in individuals with
RA was significantly related to mortality, independently of comorbid disease. Furthermore,
severity, disease duration, age, sex and comorbidity predicted mortality. One explanation is that
the chronic secondary health conditions variable was constructed of both mortality and morbidity
97
conditions. One reason for this was that combined subgroup analyses determined that there was
not enough power to be analyzed separately. Secondly, it provided parsimony for causal
modeling. This construct should be revisited with further analysis of individual mortality and
morbidity secondary conditions.
The number of chronic secondary health conditions predicted disability bed days was
partially supported. As hypothesized, however, increases in functional limitations also predicted
disability bed day, when that wasn’t the expectation. Increases in symptoms and increases in
mobility did not predict disability bed days. One could reason that the significant finding of
increases in functional limitations was the result of increases in symptoms. Pain and fatigue
were found to predict functional limitations in the first hypothesis for RA and increases in those
symptoms could be are contributing to the fluctuating nature of the disease process. However, as
hypothesized, none of the symptoms of pain, fatigue or joint stiffness were significant. Fatigue
(p<.05) was significant when it was first introduced in model 3 (Table 24). It’s significance,
however, attenuated in model 4 and disappeared in model 5.
B. Between-Sample Hypothesis: Strength of Predictor-Outcome Relationships Similarities are examined across samples in predictor-outcome relationships when
interactions are not present. The general pattern of positive relationships between predictor
components (increase in symptoms, increase in mobility limitations, number of chronic
secondary health conditions, and increase in functional limitations) and outcome (number of s,
increase in functional limitations, and number of disability bed days) for both samples provided
some evidence of the generality of the findings.
One hypothesis regarding sample differences in strength of predictors was tested with
low-power tests of interaction to allow for statements of strength of effects. To avoid noise from
98
chance-based fluctuations in the data, a strategy for detecting interaction based on consistent
patterns across predictors and outcomes was implemented. The absence of a credible pattern of
interactions indicates that large replicable differences in predictor-outcome relationships between
the samples are unlikely. More modest interaction effects, which may exist, could not be
detected with the level of statistical power available.
1. Differences
Although there were significant predictor-outcome relationships for both disability
groups, an analysis was required to examine the pattern of regression results for polio and RA to
evaluate differential effect sizes across samples. Such tests of interaction typically have low
power. To avoid treating chance-based fluctuations in the data as valid results, a strategy for
detecting interaction based on consistent patterns across predictors and outcomes was
implemented. Evidence of interaction is strongest under the five conditions that follow.
First, the differences between the effect sizes in the two disability samples for any given
predictor and its outcome should be large. Coefficients for increase in pain and increase in
fatigue for RA were larger than the corresponding polio coefficients. However, the increase in
mobility and chronic secondary health conditions subsample coefficients for polio and RA are
similar in size. This initial condition is not met.
Second, for any predictor, at least the larger of the coefficients in the two samples should
be significant. This second condition was met for all four common predictors.
Third, the direction of the disability sample differences in predictor effect size should be
consistent across predictors. In reviewing all four significant coefficients for RA, increases in
mobility and number of chronic secondary health conditions are not directionally consistent with
increase in pain and increase in fatigue. The RA increase in mobility and number of chronic
99
secondary health conditions coefficients are smaller than their polio counterparts while the RA
increase in pain and increase in fatigue are larger than their polio counterparts. Therefore the
third condition is not met.
Fourth, the significant predictors should have coefficients in the expected directions,
either positive or negative. Because all significant predictor coefficients are positively related to
the outcome as hypothesized, this fourth condition is met.
Fifth, the interaction term (predictor x outcome) in the regression that tests for interaction
should be significant. Both increases in pain and increases in fatigue produced significant
interactions with disability group based on increases in functional limitations as the outcome
variable. When a conservative approach is taken by adding the three other common predictors as
controls in separate regressions for increases in pain and increases in fatigue, only increase in
pain remained significant. Given the expected rate of type I errors, it is unlikely that increase in
pain would be a replicable predictor of the outcome, increase in functional limitations.
In summary, only two of the five conditions that render interaction effects credible were
met. The absence of a credible pattern of interactions indicates that large replicable differences in
predictor-outcome relationships between the disability groups are unlikely. More modest
interaction effects may exist, but could not be detected with the level of statistical power
available. Considering the pattern of results and the limited number of common predictors that
could be tested, a reasonable conclusion would be that the predictors do not operate differently
for the two disability groups. More reliable estimates of predictor effects (and generalizable
conclusions) for the pooled sample would have been possible if all predictors had been measured
in the same way for the two disability groups. This is an example of one of the challenges of
cross disability research. The disability trajectory variables were measured differently between
100
the disability groups and are key variables to the underlying conceptual framework of aging with
disability and life course perspective. The trajectory variables anchor the disability temporally
and account for the differences between polio and RA with respect to their disease courses.
2. Similarities
When interaction is not present, examination of similarities across samples in predictor-
outcome relationships is considered. The general pattern of positive relationships between
predictor categories (increase in symptoms, increase in mobility limitations, number of chronic
secondary health conditions, and increase in functional limitations) and outcome categories
(number of chronic secondary health conditions, increase in functional limitations, number of
disability bed days) for both samples provided some evidence of the generality of the findings.
Increase in mobility (p<.001 for both subsamples) is a significant predictor of increase in
functional limitations for both the polio and RA samples. This is consistent with some findings
from literature (Shimada, Sawyer, Harada, Kaneya, Nihei et al., 2010; Kingston, Collerton,
Davies, Bond et al., 2012). Loss of mobility may be one variable that can operate across
disabilities.
Chronic secondary health conditions (p<.05 for both samples) is a significant predictor of
increase in functional limitations in both subsamples. Chronic secondary health conditions’
placement in the Nagi/IOM framework is in the beginning of the model as secondary pathology.
In this framework, it is not a direct effect to functional limitations as was in this analysis.
To summarize, two observations, common to both polio and RA, emerge from these data.
First, increases in functional limitations predicts disability bed days. Second, increases in
mobility, the number of chronic secondary health conditions, and increase is symptoms (muscle
weakness for polio, and pain and fatigue for RA) predict increases in functional limitations.
101
Figures 5 and 6 contain the models for predicting chronic secondary health conditions, increases
in function, and disability bed days. The beta coefficients and 95% confidence intervals are
shown for the significant predictors.
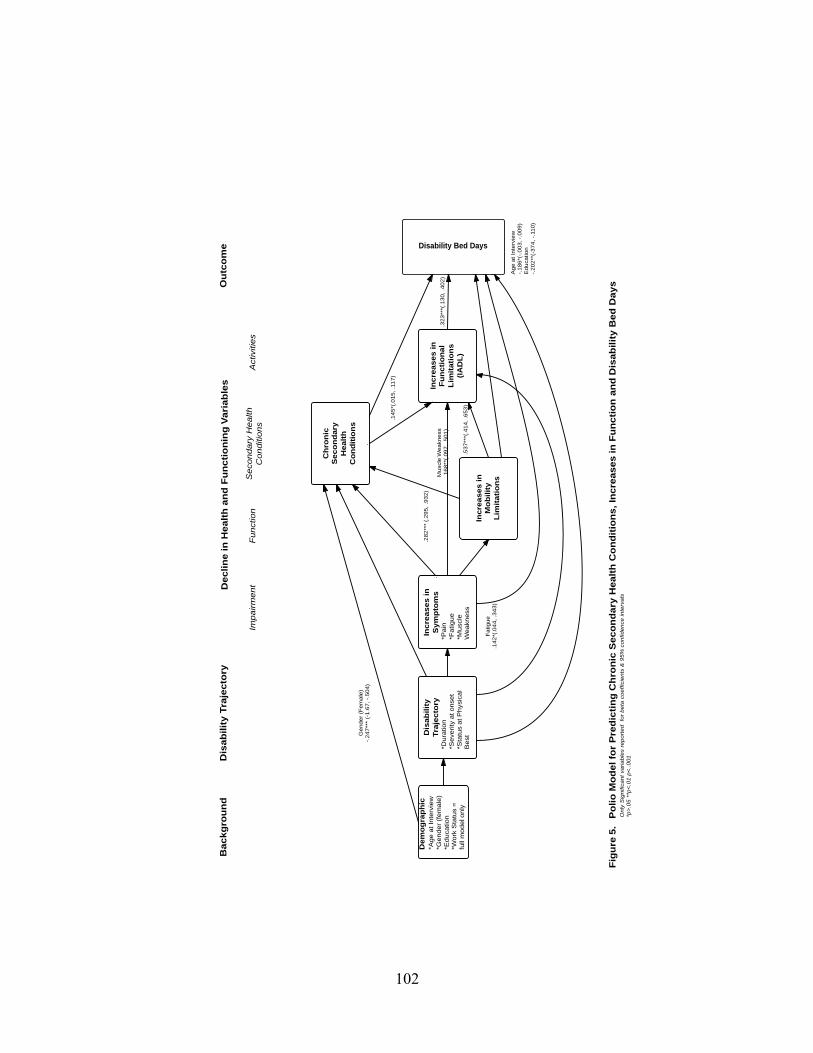
102
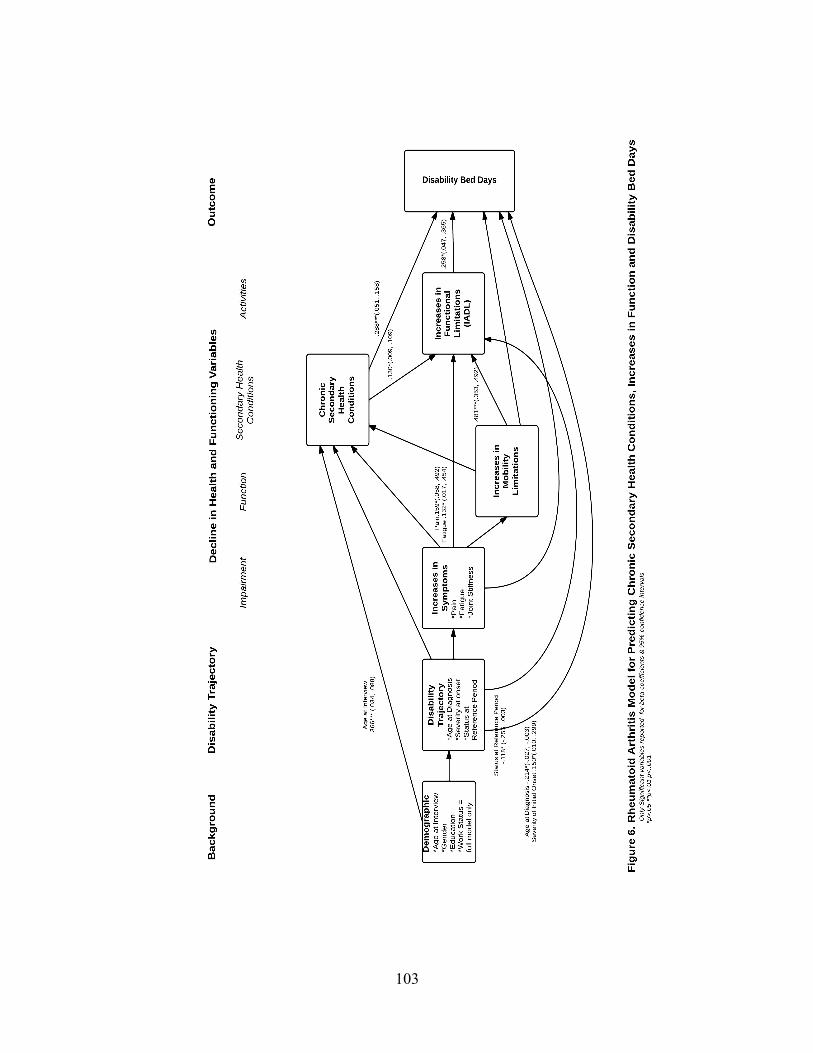
103
104
C. Policy Implications
The within-sample analyses did yield partial results. The constructs that were
significant for predicting number of disability bed days can give us some insight as to how policy
could be considered. For instance, in the RA models, increases in functional limitations, the
number of chronic secondary health conditions, and two of the three disability trajectory
variables, age at diagnosis and severity at onset. All of these variables were positively associated
with disability bed days except for age at diagnosis. Being younger when diagnosed with RA
predicted more disability bed days. Backing up, one can then look at increases in functional
limitations as the outcome. Increases in mobility limitations, number of chronic secondary health
conditions, two symptoms (pain and fatigue) of the increases in symptoms component, and status
at reference period all predict increases in functional limitations. Status at reference period
negatively predicts functional limitations, therefore the more stable the disease process was at the
last change in disease status, the more increases there were in functional limitations. Targeting
those individuals who are younger, have more severity and who are having increases in
symptoms (most likely pain and fatigue) for interventions before they are more likely to
experience increases in secondary health conditions or increases in mobility limitations.
There are several ways to approach policy with the example above. On a macro scale,
reducing the number of disability bed days has implications for the workplace (from both the
employer and employee perspective), controlling health care costs, reducing the impact of lost
income, as well as the psychological factors associated with not being able to function optimally.
Looking at the interrelationships among the predictors could inform the public health, aging and
disability communities as to where to intervene with programs on individual, community,
institutional and governmental levels. Socioeconomic status, race and ethnicity also need to be
105
examined more closely as they can intensify the impact of these interrelationships. Finally, it can
inform and educate those who are aging with, in this case, rheumatoid arthritis so that they can
make the best choices for their circumstances.
D. Limitations
The first limitation of this study is its use of self-report that is at risk for memory bias.
Self-report is easy and inexpensive, however, they risk bias and inaccuracy due to over and
under reporting in items such as functional limitations. Other items, such as symptoms, are not
subject to the same risk as they are intrinsically subjective. Only a respondent can assess severity
of his or her pain.
With respect to diagnosis, there was no independent confirmation of being diagnosed or
treated by a health care provider. Many individuals with polio were young when they were
diagnosed and have relied on what others have told them for information about onset of and
severity of their initial impairment.
There may be bias in accuracy of memory, especially when reporting changes over time,
may result in exaggerated or diminished change. Memory is impacted by medication and
individuals with disabilities are often on many medications, including those with RA. Symptoms
such as pain and fatigue impact mood and could influence accuracy of reporting. In the future,
introducing a limited number of performance measures such as pegboard test for fine motor and
speed, picking up an object, lifting 10 pounds, gait speed, chair rise, and stair climb to the
interview to supplement self-report would result in a more accurate assessment of limitations
(Guralnik, 2011) and reduce the bias of the memory issues of self-report.
There are several measurement issues that are not optimal. The retrospective
measurement of change limited to two points in time is subject to bias. It does not capture change
106
in severity of secondary conditions. The RA sample moves in and out of various levels of
disability due to the fluctuating nature of the disease, thus this element of the disability trajectory
is not illuminated. Due to the differences in disability trajectory, the measures of items across
disabilities are problematic as they cannot be directly compared thus not all variables could be
used.
Finally, subtraction-based change variables are sensitive to ceiling effects, that is, the
most severe categories were less likely to change making interpretation of analyses difficult.
These data are nearly 20 years old. As discussed earlier in the dissertation, polio has been
eradicated in much of the world. As of 1989, there was an estimated 1.6 million individuals in
the United States aging with Polio. The present population cohorts may be experiencing aging
with disability differently. Likewise, due to considerable advances in medication and surgery,
those with RA will presumably “look” healthier than they were when these data were collected.
E. Contributions
This study attempted to go beyond univariate and bivariate analyses by addressing
conceptual and analytic gaps in the secondary conditions literature using a causal model to
demonstrate how the components of secondary conditions --- increases in symptoms, increases in
mobility limitation, chronic secondary health condition and functional limitations --- work
together to affect a public health outcome. It has been established from clinical observation and
anecdotally that secondary conditions do not work in isolation; they interact with one another.
These analyses are an initial attempt to change the dialogue in the literature from conceptual to
analytical by using scale development to create measures of secondary conditions and then using
those measures in a causal model to examine their interrelationships and predict a public health

107
policy outcome while controlling for background factors and disability trajectory which takes
into account aging and the life course perspective.
F. Recommendations
1. Research Methods
Further research to examine the measurable dimensions of disability will assist in
creating comparable measures so that all predictors may be included and used across disabilities.
This holds true in investigating within-disability similarities and differences. Even within
disabilities, it is difficult to make comparisons. In spinal cord injuries, for instance, individuals
with the same level involvement may look very different in ADL limitations, for instance. An
individual may have a complete or partial severation, or compression. The implications for all
aspects of secondary conditions measured in this study are often quite striking. Scientific
development is essential to advancing the field. Three areas need to be pursued: analytic method,
study design and scale development.
Analytic methods that can establish causal relationships and investigate patterns of
change need to be explored. Linear regression analysis may not be the correct analytical method
for specification of this study’s model. Other statistical methods, such as structural equation
modeling may be more appropriate. Future research using longitudinal data, ideally panels, will
likely improve study findings.
Addressing measurement and scale development is an essential consideration for better
representing the multidimensional reality of what secondary conditions mean to aging with
disability. There is a need to focus much more on how we construct composite analytic variables
for components such as the ones in this study keeping parsimony in mind. It will be challenging
and should be the first consideration in revising the study. A direction that one might take is to
108
“standardize” the types of secondary conditions before constructing and testing measurement
models.
An additional consideration is the measurement of the outcome variable. This variable,
number of disability bed days, may not have had the ability to capture any relationships between
the constructs and outcome. Other public health policy outcome variables, such as health-related
quality of life, number of physician visits, and participation, should also be tested with the same
model.
2. Further Model Development This model is a first step in going beyond the bivariate analyses found in the literature.
The theory in the disability and secondary conditions field and how it relates to secondary
conditions is developing. Contrasting this study’s methods and model against others will be
valuable going forward for refinement.
One conceptual model (Rimmer, Chen and Hsieh, 2011) that could be used to further
develop and shape this study’s model has two parts: the first is to systemically define secondary
conditions and the second is to place secondary conditions within a clinical context that accounts
for prevention interventions and policy implications. It does not look at interrelationships of
secondary conditions as this model does. However, using Rimmer, Chen and Hsieh’s
hierarchical algorithm to define secondary conditions could prove beneficial. The algorithm
takes a medical or nonmedical condition and attempts to standardize individual secondary
conditions by considering the timing, association, prevalence, treatment complication and risk
factor in that order. As the steps progress, the potential secondary condition can be bounced from
the decision tree as a pre-existing condition, associated condition, comorbidity or treatment
complication. Unlike other approaches where secondary conditions are defined in different ways,

109
with different components, and/or depending upon one’s disciplinary perspective, Rimmer, Chen
and Hsieh’s approach attempts to be systematic and consistent.
Using the joint stiffness of rheumatoid arthritis, Rimmer, Chen and Hsieh’s algorithm
discussed above is illustrated. The temporal domain asks if the symptom occurs after the
disability. In this case it does. Because of the slow development of the disease, it is also an
indicator for diagnosing RA when two other symptoms are present: pain on movement and
tenderness in the affected joints are present. The joint stiffness continues after onset. The next
domain is association, which asks if there is a direct association with the etiology or progression
of the disability. In this case, yes. The decision tree stops as joint stiffness is identified as an
associated condition. Another potential condition of RA is poor pulmonary function. Temporally,
it occurs after the disability. The association is not direct with the etiology or the progression of
the disability. The next step asks if it is more prevalent in people with the disability. The 45 – 64
year old cohort of persons with RA were found to have significantly (p<.01) more COPD when
compared to a national age-matched cohort (see Table 16). Whether it is a treatment
complication is the fourth consideration. Although medication could result in some pulmonary
symptoms, it is not always. The final consideration is whether it is a medical or health condition
risk factor, which it is. COPD meets all of these criteria as a secondary condition to RA. There
are potentially gray areas for many secondary conditions when considering any of these steps in
the algorithm.
Within a research context, the algorithm for identifying secondary conditions has great
potential. A caveat, however, is the potential for labor intensive data collection to determine (if
needed) the entirety of each subject’s secondary conditions and categorize them. Although not

110
perfect, this is the first systematic attempt to take the art out of secondary conditions and
introduce more rigor and parsimony.
Rimmer, Chen and Hsieh’s conceptual model is comprehensive, but complex. Its purpose
is to understand the risk factors and consequences of secondary conditions in order to advance
rehabilitation and health promotion research. Although this is not a conceptual model that
addresses cross disability and aging, it does place secondary conditions within the clinical
spectrum of medicine, rehabilitation, assistive technology, health promotion and public health.
Starting with a primary disability, it identifies the onset and course of secondary conditions first
via four non-modifiable antecedents: sociodemographic, pre-existing conditions, disability-
related, and associated conditions.
Secondly, it progresses to personal and environmental modifiable risk factors. The third
and final section provides a framework for identifying the outcomes of secondary conditions on
both individual and societal levels. The model also acknowledges and provides for the range of
prevention and intervention strategies from beginning to end of the model. Rimmer, Chen and
Hsieh illustrate their conceptual model using the secondary condition of shoulder pain in an
individual with spinal cord injury (SCI). They use this illustration clinically. The challenge to
cross disability research is the adaptation their model using aggregated data in targeted areas to
develop constructs for modeling the interrelationships of secondary conditions and AwD with
respect to a policy, or societal level, outcome. What Rimmer, Chen and Hsieh do not address is
the disability trajectory and life course context. They hint at it in their non-modifiable
antecedents domain, however. The disability trajectory and life course perspective is what makes
this study unique.

111
F. Conclusion
There has been little causal modeling using cross disability and aging data. This area of
inquiry really isn’t yet at the theoretical stage. To the extent there is a theory, it rests on two
central constructs: secondary conditions and aging with disability. These constructs are linked
because of the trajectory variables, but should be built upon separately as well. Secondary
conditions are real, occur in high frequencies and result in accelerated aging. Definitions have
varied from researcher to researcher and are now emerging from a lengthy period of research
inactivity. These analyses are a first attempt at addressing this lack of analytical modeling of
secondary conditions within a semi-theoretical framework.
The limited findings do not support what is known from bivariate analyses and the few
attempts to model very limited aspects of the problem. Judgment must be withheld with respect
to the hypotheses, however. The analyses did not yield enough predictive strength to make
comparisons possible across subsamples. Likewise, in examining similarities, only general,
descriptive statements could be made. The fact that relationships between the components and
the outcome were not demonstrated could be a matter of scale development and/or statistical
techniques. Secondary analysis can be problematic as one must work with predefined measures
and limited ability to create measures tailored to the analyses. With that said, the use of
secondary analysis is not entirely culpable. Although the same measures were used for most of
the variables, the difficulty arose when comparing disability groups. The correct measures were
used for disability trajectory and symptoms variables as they are what is unique to the two
disability groups, however, this results in not being able to use identical measures throughout the
entire models.
112
The subjective nature of disability is an immense challenge in cross disability research
for comparability within disabilities, across disabilities, across national studies, and across
international studies which can present its own set of cultural problems and language barriers.
What has been learned from this study is where the science development is most needed.
113
REFERENCES
Administration on Aging. (2011). A profile of older Americans: 2011. U.S. Department of Health and Human Services. Available at: http://www.aoa.gov/AoAroot/Aging_Statistics/Profile/2011/docs/2011profile.pdf. Accessed July 17, 2013. Ahlstrand, I., Bjork, M., Thyberg, I., Borsbo, B. and Falkmer, T. (2012). Pain and daily activities in rheumatoid arthritis. Dis Rehabil, 34, 15, 1245-1253. Albert, S.M., Im, A., Raveis, V.H., (2002). Public health and the second 50 years of life. Am J Public Health, 92, 8, 1214-1216. Aletaha, D., Neogi, T., Silman, A.J., Funovits, J., et al. (2010). 2010 Rheumatoid Arthritis Classification Criteria. Arthritis & Rheumatism, 62, 9, 2569–2581. Americans with Disabilities Act of 1990, Vol. 42, U.S.C. Sec. 12101. Banal F., Dougados, M., Combescure, C. and Gossec, L. (2009). Sensitivity and specificity of the American College of Rheumatology 1987 criteria for the diagnosis of rheumatoid arthritis according to disease duration: a systematic literature review and meta-analysis. Ann Rheum Dis, 68, 1184–91. Berkow, R. and Fletcher, A.J. (Eds.) (1992). The Merk Manual, 16th Edition. Rahway, NJ: Merck Research Laboratories. Brandt, E.N. and Pope, A.M. (Eds.) (1997). Enabling America: Assessing the role of rehabilitation science and engineering. Washington, D.C.: Institute of Medicine, National Academy Press. Brault, M.W. (2012). Americans With Disabilities. Current Population Reports, P70-131, Washington, DC: U.S. Census Bureau. Callahan LF, Brooks RH, Summey JA, Pincus T. (1987). Quantitative pain assessment for routine care of rheumatoid arthritis patients, using a pain scale based on activities of daily living and a visual analog pain scale. Arthritis Rheum, 30, 6, 630-6. Campbell, M.L. (1994). Later Life Effects of Early Life Disability: Comparisons of Age-Matched Controls on Indicators of Physical, Psychological and Social Status. (Final Report to The National Institute on Disability and Rehabilitation Research) Downey, CA: Rehabilitation Research and Training Center on Aging with Disability, Rancho Los Amigos National Rehabilitation Center. Campbell, M.L. (1997). Two worlds of disability: Bridging the gaps between the aging network and the disabled community. Southwest J Aging, 13, 3-11.
114
Campbell, M.L. (1999, June). Secondary conditions experienced by persons aging with long-term physical disability: Scope and implications for assistive technology & other services. Paper presented at RESNA’s Fifth Annual Research Symposium: Medical, functional, and psychological consequences of aging with disability: The impact on future needs for assistive technology. Long Beach, California. Campbell, M.L. and Sheets, D.J. (1996). Aging with Disability Survey: Changing Needs and Life Circumstances of Persons Aging with Polio, Rheumatoid Arthritis and Spinal Cord Injury. Downey, CA: Rehabilitation Research and Training Center on Aging with Disability, Rancho Los Amigos National Rehabilitation Center. Campbell, M.L. and Sheets, D.J. (1998, October). Variations in secondary conditions and health promoting behaviors among persons aging with polio, rheumatoid arthritis and stroke. Paper presented at the CDC National Conference on Disability & Health: Building Bridges for Science and Consumers. Dallas, TX. Campbell, M.L., Sheets, D.J., and Strong, P. S. (1999). Secondary conditions among middle-aged individuals with chronic physical disabilities: Implications for unmet needs for services. Assistive Technology, 11, 105-122. Campbell, M.S., Sheets, D.J., Rhaney, P., and Moulton, H.J. (1999, March). Enhancing the “quality of life” of persons aging with multiple chronic conditions: The role of personal and social resources. Symposium presented at the 45th Annual Meeting of the American Society on Aging. Orlando, FL. Centers for Disease Control and Prevention. (Updated November 19, 2012). Rheumatoid arthritis. Available at http://www.cdc.gov/arthritis/basics/rheumatoid.htm. Accessed June 3, 2013. Centers for Disease Control and Prevention. (Updated September 3, 2013). Global Health – Polio. Available at http://www.cdc.gov/polio/about/. Accessed November 6, 2013. Chen, P. and Wilmoth, J.M. (2004). The effects of residential mobility on ADL and IADL limitations among the very old living in the community, J Geron: Soc Sci, 59B, 3, S164–S172. City of Downey. (2000). Census 2000 Summary. County of Los Angeles, CA.: Planning Division. Cook, K.F., Molten, I.R. and Jensen, M.P. (2011). Fatigue and aging with a disability. Arch Phys Med Rehabil, 92, 1126-33. Crews, J.E. and Smith, S.M. (2003). Public health and aging. Am J Public Health, 93, 5, 700-701.
115
Crews, J.E. and Lollar, D.J. (2008). The public health dimensions of disability. In K. Heggenhougen and S. Quah (Eds). International Encyclopedia of Public Health: Volume 5 (p. 422-432). San Diego: Academy Press. Dalakas, M.C. (1995). Post-polio syndrome 12 years later: How it all started. Annals of New York Academy of Sciences, 753, 11-18. Dauer, C. (1955). The changing age distribution of paralytic poliomyelitis. Annals of New York Academy of Sciences, 61, 943-955. Deal, C.I., Meenan, R.F., Goldenberg, D.L., and Anderson, J.J. (1985). The clinical features of elderly onset rheumatoid arthritis. Arthritis and Rheumatism, 28, 987-94. de Groot, V., Beckerman, H., Lankhorst, G.J. and Bouter, L.M. (2003). How to measure comorbidity: A critical review of available methods. J of Clin Epi, 56, 221-229. DeJong, G. and Hughes, J. (1982). Independent living: Methodology for measuring long-term outcomes. Archives of Physical Medicine & Rehabilitation, 6368-73. Egede, L.E. (2004). Effects of depression on work loss and disability bed days in individuals with diabetes. Diabetes Care, 27, 7, 1751-1753. Dinsmore, S.T. (1998). Aging and the postpoliomyelitis syndrome. Topics in Geriatric Rehabilitation, 13(3), 25-34. Droegemueller, C.J., Brauer, D.J. and Van Buskirk, D.J. (2008). Temperament and fatigue management in persons with chronic rheumatic disease. Clin Nurse Spec, 22, 1, 19-27. Dupond, J-L. (2011). Fatigue in patients with rheumatic diseases. Jt Spine Bone, 78, 156-160. Farbu, E. (2009). Post-Polio Syndrome. pp 803-807. Field, M.J. and Jette, A.M. (Eds.) (2007). The Future of Disability in America. Washington, D.C.: The National Academies Press. Freid, V.M., Bernstein, A.B. and Bush, M.A. (2012). Multiple chronic conditions among adults aged 45 and over: Trends over the past 10 years. NCHS Data Brief, no.100. Hyattsville, MD: National Center for Health Statistics. Fried L.P., Tangen, C.M., Walston J., et al. (2001). Frailty in older adults: evidence for a phenotype. J Gerontol A Biol Sci Med Sci., 56A, M146–157. Gawne, A.C. and Halstead, L.S. (1995). Post-polio syndrome: pathophysiology and clinical management. Crit Rev Phys Rehab Med, 7, 147-188.
116
Grimby, G. and Jonsson, A.T. (1994). Disability in poliomyelitis sequelae. Physical Therapy, 74, 5, 415–424. Guralnik, J.M. and Ferrucci, L. (2009). The challenge of understanding the disablement process in older persons: Commentary responding to Jette, A.M. ‘Toward a common language of disablement.’ J Geront A Biol Sci Med Sci, 64A, 11, 1169-1171. Guralnik, J.M. (June, 2011). Assessing disability by self-report in older populations. Unpublished paper presented at Moving Beyond Mortality: Disability as Population Based Measure Symposium Program, New York, NY. Hallert, E., Thyberg, I., Hass, U., Skargren, E. and Skogh, T. (2003). Comparison between women and men with recent onset rheumatoid arthritis of disease activity and functional ability over two years (the TIRA project). Ann Rheum Dis, 62, 667-670. Halstead, L.S., Wiechers, D.O. and Rossi, C.D. (1985). Part 2: Results of a survey of 201 polio survivors. Southern Medical Journal, 78, 1281-1287. Halstead, L.S. and Rossi, C.D. (1987). Post-polio syndrome: Clinical experience with 132 consecutive outpatients. In Research and Clinical Aspects of the Late Effects of Poliomyelitis: Birth Defects, 23, pp. 13-16. White Plains, NY: March of Dimes. Halstead, L. and Rossi, C. (1988). New problems in old polio patients: Results of a survey of 539 polio survivors. Orthopedics, 8, 845- 850. Halstead, L.S. (1988). The residual of polio in the aged. Topics in Geriatric Rehabilitation, 3(4), 9-26. Halstead, L.S. (1992). Post-polio syndrome: definition of an elusive concept. In T.L. Munsat (Ed.), Post-Polio Syndrome (pp. 23-38). Boston: Butterworth-Heinemann. Heiberg, T. and Kvien, T.K. (2002). Preferences for improved health examined in 1,024 patients with rheumatoid arthritis: Pain has the highest priority. Arthritis Rheum, 47, 4, 391-397. Helmick, C.G., Felson, D.T., Lawrence, R.C., Gabriel, S., Hirsch, R., Kwoh, C.K., et al. (2008). Estimates of the prevalence of arthritis and other rheumatic conditions in the United States. Part I. Arthritis Rheum. 581, 15-25. Hootman, J.M., Helmick, C.G. and Brady, T.J. (2012). A public health approach to addressing arthritis in older adults: The most common cause of disability. AJPH, 102, 3, 426-433. Hummer, L. (Updated October 2, 2013). Quick Facts: What you need to know about the Syrian refugee crisis. Available at http://www.mercycorps.org/articles/jordan-lebanon-syria/quick-facts-what-you-need-know-about-syrian-refugee-crisis. Accessed November 6, 2013.
117
Huyser, B.A., Parker, J.C., Thoreson, R., Smarr, K.L., Johnson, J.C. and Hoffman, R. (1998). Predictors of subjective fatigue among individuals with rheumatoid arthritis. Arthritis Rheum, 41, 12, 2230-2237. Iezzoni, L. (2010). Multiple chronic conditions and disabilities: Implications for health services research and data demand. Health Services Research, 45, 5, Part II, 1523-1540. Institute of Medicine. (1997). Enabling America: Assessing the Role of Rehabilitation Science and Engineering. Washington, D.C.: National Academy Press. James, N.T., Miller, C.W., Brown, K.C. and Weaver, M. (2005). Pain disability among older adults with arthritis. J Aging Health, 17, 56-69. Jensen, M.P., Alschuler, K., Smith, A.E., Verrall, A.M., Goetz, M.C., and Molton, I.R. (2011). Pain and fatigue in persons with postpolio syndrome: Independent effects on functioning. Arch Phys Med Rehabil, 92, 1796-1801. Jette, A.M. (2006). Toward a common language for function, disability and health. Phys Ther, 86, 726-734. Jette, A.M. (2009). Toward a common language of disablement. J Geront A Biol Sci Med Sci, 64A, 11, 1165-1167. Jublet, B. and Agre, J.C. (2000). Characteristics and management of postpolio syndrome. JAMA, 284, 4, 412-414. Kane R.A. and Kane R.L. (2000). Assessing the older persons: Measures, meaning and practical applications. Oxford: Oxford University Press. Kazis, L.E., Meenan, R.F. and Anderson, J.J. (1983). Pain in the rheumatic diseases: Investigation of a key health status component. Arthritis Rheum, 26, 1017-22. Kemp, B., Brummel-Smith, K. and Ramsdell, J. (1990). Geriatric Rehabilitation. Boston: Little, Brown and Co. Kemp BJ, Mosqueda L, editors. 2004. Aging with a Disability: What the Clinician Needs to Know. Baltimore (MD): The Johns Hopkins University Press. Kempen, G.I.J.M., Myers, A.M. and Powell, L.E. (1995). Hierarchical structure in ADL and IADL: Analytical assumptions and applications for clinicians and researchers. J of Clin Epidemiol, 48, 11, 1299–1305. Kingston A., Collerton J., Davies K., Bond J., Robinson L., et al. (2012) Losing the ability in activities of daily living in the oldest old: A hierarchic disability scale from the Newcastle 85+ Study. PLoS ONE 7(2): e31665.

118
Kinne, S., Patrick, D.L. and Lochner Doyle, D. (2004). Prevalence of secondary conditions among people with disabilities. AJPH, 94, 3, 443-445. Kinne, S. (2008). Distribution of secondary medical problems, impairments, and participation limitations among adults with disabilities and their relationship to health and other outcomes. Disabil Health J, 1, 42-50. Krahn, G.L. and Campbell, V.A. (2011). Evolving views of disability and public health: The roles of advocacy and public health. Disabil Health J, 4, 12-18. Krahn, G.L., Putnam, M., Drum, C.E. and Powers, L. (2006). Disabilities and health: Toward a national agenda for research. J Disabil Pol Stud, 17, 1, 18-27. Kvien, T.K., Uhlig, T., Odegard, S., and Heiberg, M.S. (2006). Epidemiological aspects of rheumatoid arthritis: The sex ratio. Ann NY Acad Sci, 1069, 212-222. LaPlante, M.P. (2010). The classic measure of disability in activities of daily living is biased by age but an expanded IADL/ADL measure is not. J Geron Soc Sci, 65B, 6, 720-732. Lawton, M.P. and Brody, E.M. (1969). Assessment of older people: Self-maintaining and instrumental activities of daily living. The Gerontologist, 9, 3, 179-186. The Lewin Group. (2010). Individuals living in the community with chronic conditions and functional limitations: A closer look. Report prepared under contract #HHS-100-95-0046 for the U.S. Department of Health and Human Services, Office of the Assistant Secretary for Planning and Evaluation. Available at www.lewin.com/content/publications/ChartbookChronicConditions.pdf. Accessed August 14, 2011. Lollar, D.J. and Crews, J.E. (2003). Redefining the role of public health in disability. Annu Rev Public Health, 24, 195-208. Lutze, U. and Archenholtz, B. (2007). The impact of arthritis on daily life with the patient perspective in focus. Scand J Caring Sci, 21, 64-70. Marge, M. (1988). Health promotion for persons with disabilities: Moving beyond rehabilitation. Am J Health Promotion, 2, 4, 29-44. Marge, M. (1999). Defining a prevention agenda for secondary conditions. In Issues in Disability and Health: The Role of Secondary Conditions and Quality of Life, R.J. Simeonsson and L.N. McDevitt (Eds.), 15-40. Chapel Hill: University of North Carolina Press. Martin, L.G., Freedman, V.A., Schoeni, R.F. and Adreski, P.M. (2010) Trends in disability and related chronic conditions among people ages fifty to sixty-four. Health Affairs, 29, no. 4, 725-731.
119
Masala, C. and Petretto, D.R. (2008). From disablement to enablement: Conceptual models of disability in the 20th century. Disabil Rehabil, 30, 17, 1233-1244. Mason, J.H., Anderson, J.J., Meenan, R.F., Haralson, K.M., Lewis-Stevens, D. and Kaine, J.L. (1992). The rapid assessment of disease activity in rheumatology (Radar) questionnaire. Arthritis & Rheumatism, 35: 156–162. Mathilde, M.H., Van Schuur, W.H., and Suurmeijer, T.P.B.M. (2007). Predictors of functional disability in rheumatoid arthritis: Results from a 13-year prospective study. Disabil Rehabil, 29, 10, 805-815. Maynard, F.M., Julius, M., Kiesch, N., Lampman, R., Peterson, C., Tate, D., Waring, W. And Werner, R. (1991), The Late Effects of Polio: A model for the identification and assessment of secondary disabilities, (Final Report). Springfield, VA: National Technical Information Service, U.S. Dept of Commerce. McColl, M.A. (2005). Disability studies at the population level: issues of health services utilization. AJOT, 59, 5, 516-526. McDermott, S. and Turk, M.A. (2011). The myth and reality of disability prevalence: measuring disability for research and service. Disabil Health J, 4, 1-5. McKenna, F. and Wright, V. (1985). Pain and rheumatoid arthritis (letter). Ann Rheum Dis, 44, 805. Minnock, P., FitzGerald, O. and Bresnihan, R. (2003). Women with established rheumatoic arthritis perceive pain as the predominant impairment of health status. Rheumatol, 42, 995-1000. Mongan, E. (1990). Arthritis and osteoporosis. In B. Kemp, K. Brummel-Smith and J.W. Ramsdell (Eds.), Geriatric Rehabilitation, (pp. 91-106). Boston: Little, Brown and Co. Morris, A., Yelin, E.H., Wong, B. and Katz, P.P. (2008). Patterns of psychological risk and long-term outcomes in rheumatoid arthritis. Psy Health Med, 13, 5, 529-544. Mulder, D.W. (1991). Post-polio syndrome - past, present, and future. In T.L. Munsat (Ed.), Post-polio Syndrome (pp. 1-108). Boston: Butterworth-Heinemann. Mulder, D.W. (1995). Clinical observations on acute poliomyelitis. Annals of New York Academy of Sciences, 753, 1-10. Myasoedova, E., Crowson, C.S., Kremers, H.M., Therneau, T.M., and Gabriel, S.E. (2010). Is the incidence of rheumatoid arthritis rising?: results from Olmsted County, Minnesota, 1955-2007. Arthritis and rheumatism. 62, 6, 1576-82.

120
Nagi, S.Z. (1965). Some conceptual issues in disability and rehabilitation. In M.B. Sussman (Ed.), Sociology and Rehabiliation, (pp. 100-113). Washington, D.C.: American Sociological Association. National Center for Health Statistics. (1989). National Health Interview Schedule. Vital and Health Statistics, Series 10, No. 176. Washington, D.C.: U.S. Government Printing Office. National Center for Health Statistics. (2012). Healthy People 2010 Final Review. MD: Hyattsville. National Institute of Neurological Diseases and Stroke. (Updated December 28, 2012). Post-Polio Syndrome Fact Sheet. Available at http://www.ninds.nih.gov/disorders/post_polio/detail_post_polio.htm. Accessed November 6, 2013. National Quality Forum. (2012). Multiple Chronic Conditions Measurement Framework. Available at http://www.qualityforum.org/Publications/2012/05/MCC_ Measurement_Framework_Final_Report.aspx. Accessed July 11, 2013. Navaro-Cano, G., del Rincon, I., Pogosian, S., Roldan, J.F. and Escalante, S. (2003). Association of mortality with disease severity in rheumatoid arthritis, independent of comorbidity. Arthritis and Rheumatism, 48, 9, 2425-2433. Adams, P.F. and Marano, M.A. (1995). Current estimates from the National Health Interview Survey, 1994. National Center for Health Statistics. Vital and Health Statistics, Series 10, No. 193. National Rheumatoid Arthritis Society. (2012). The impact of rheumatoid arthritis co-morbidities. Available at http://www.nras.org.uk/includes/documents/cm_docs/2012/t/ 1_the_impact_of_rheumatoid_arthritis_comorbidities_final_pdf_pdf.pdf. Accessed February 28, 2013. New Freedom Initiative. (2001). A Progress Report on Fulfilling America's Promise to Americans with Disabilities. Available at http://georgewbush-whitehouse.archives.gov/infocus/newfreedom/. Accessed September 20, 2010. Nollet, F., Beelen, A., Prins, M.H., de Visser, M., Sargeant, A.J., Lankhurst, G.J., and de Jong, B.A. (1999). Disability and functional assessment in former polio patients with and without postpolio syndrome. Arch Phys Med Rehabil, 80, 136-143 Nollet, F., Beelen, A., Twisk, J.W., Lankhorst, G.J., and De Visser, M. (2003). Perceived health and physical functioning in postpoliomyelitis syndrome: A 6-year prospective follow-up study. Arch Phys Med Rehabil, 84, 1048-56.
121
Nosek, M.A., Hughes, R.B., Peterson, N.J., Taylor, H.B., Robinson-Whelen, S., Byrne, M. and Morgan, R. (2006). Secondary conditions in a community-based sample of women with physical disabilities over a 1-year period. Arch Phys Med Rehabil, 87, 320-327. Older Americans Act of 1965. PL 89–73, 79 Stat. 218. Östlund, G., Wahlin, Å., Sunnerhagen, K.S. and Borg, K. (2008). Vitality among Swedish Patients with post-polio: A physiological phenomenon. J Rehabil Med, 40, 709-14. Packer, T.L., Sauriol, A. and Brouwer, B. (1994). Arch Phys Med Rehabil, 75, 1122-6. Parekh, A.K., Goodman, R.A., Gordon, C., Koh, H.K. and The HHS Interagency Workgroup on Multiple Chronic Conditions. (2011). Managing multiple chronic conditions: A strategic framework for improving health outcomes and quality of life. Public Health Reports, 126, 460-462. Partnership to Fight Chronic Disease. (2013). Implications of growing prevalence of multiple chronic conditions: Needs great, evidence lacking. Available at http://www.fightchronicdisease.org/media-center/recources/implications-growing-prevalence-multiple-chronic-conditions-needs-great-evide. Accessed on July 11, 2013. Patient Protection and Affordable Care Act. PL 111-148, § 2702, 124 Stat. 119, 318-319 (2010). Petrocelli, J.V. (2003). Hierarchical multiple regression in counseling research: Common problems and possible remedies. Measurement and Evaluation in Counseling and Development, 36, 1, 9-22. Pikwer, M., Nilsson, J-A., Bergstrom, U., Jacobsson, T.H., and Turesson, C. (2012). Early menopause and severity of rheumatoid arthritis in women older than 45 years. Arthritis Res Ther, 14, R190. Pikwer, M., Bergstrom, U., Nilsson, J-A., Jacobsson, T.H., and Turesson, C. (2012). Early menopause is and independent predictor of rheumatoid arthritis. Ann Rheum Dis, 71, 378-81. Piper, BF. (1989). Fatigue: Current bases for practice. In Funk, S., Tornquist, E., Champagne, M., Copp, J., and Wiese, R. (Eds.), Key Aspects of Comfort: Management of Pain, Fatigue, and Nausea (pp. 187-240). New York: Springer. Pincus, T., Callahan, L.F. (1993). What is the natural history of rheumatoid arthritis? Rheum Dis Clin North Am, 19, 1, 123-51. Pollard, L.C., Choy, E.H., Gonzalez, J., Khoshaba, B., and Scott, D.L. (2006). Fatigue in rheumatoid arthritis reflects pain, not disease activity. Rheumatol, 45, 885-889. Pope, A.M. and Tarlov, A.R., (Eds.). (1991). Disability in America: Toward a National Agenda for Prevention. Washington, D.C.: National Academy Press.
122
Putnam, M. (2007). Moving from separate to crossing aging and disability services networks. In Putman, M. (Ed.), Aging and Disability Crossing Network Lines (pp.5-7). New York: Springer Publishing Co. Rasch, E.K., Magder, L., Hochberg, M.C., Magaziner, J. and Altman, B.M. (2008). Health of community-dwelling adults with mobility limitations in the United States: Incidence of secondary health conditions. Part II. Arch Phys Med Rehabil, 89, 219-230. Ravesloot, C., Seekins, T. and Walsh, J. (1997). A structural analysis of secondary conditions experienced by people with physical disabilities. Rehabil Psych, 42,1, 3-15. Reinhard, S.C., Kassner, E., and Houser, A. (2011). How the affordable care act can help move states toward a high-performing system of long-term care services and supports. Health Affairs, 30, 3; 447-453. Rimmer, J.H. (1999). Health promotion for people with disabilities: The emerging paradigm shift from disability prevention to prevention of secondary conditions. Physical Therapy, 79, 5, 495-502. Rimmer, J.H. (2011). Building a future in disability and public health. Disability and Health Journal, 4, 6-12. Rimmer, J.H., Chen, M-D., and Hsieh, K. (2011). A conceptual model for indentifying, preventing, and managing secondary conditions in people with disabilities. Phys Ther, 91, 12, 1728-1739. Roehrig, B., Hoeffken, K, Pientka, L. and Wedding, U. (2007). How many and which items of activities of daily living (ADL) and instrumental activities of daily living (IADL) are necessary for screening. Crit Rev Oncol/Hematol, 62, 164–171. Scheer, J. and Luborsky, M.L. (1991). The cultural context of polio biographies. Orthopedics, 14, 1173-81. Schanke, A-K. and Stanghelle, J.K. (2001). Fatigue in polio survivors. Spinal Cord, 39, 243-251. Schneider, K.M., O’Donnell, B.E. and Dean, D. (2009). Prevalence of multiple chronic conditions in the United States’ Medicare population. Health and Quality of Life Outcomes, 7, 82. Scott, D.L., Wolfe, F., Huizinga, T.W. (2010). Rheumatoid arthritis. Lancet, 376, 9746, 1094-108. Seekins, T., Smith, N., McCleary, T., Clay, J., and Walsh, J. (1990). Secondary disability prevention: Involving consumers in the development of a public health surveillance instrument. Journal of Disability Policy Studies, 31, 21-36.
123
Selby, P. (2013). PCORI’s interests in patients with multiple co-morbid conditions. Patient-Centered Outcomes Research Institute. Available at http://www.scribd.com/doc/137732633/PCORI’s-Interests-in-Patients-with-Multiple-Co-morbid-Conditions. Accessed July 11, 2013. Scheer, J. and Luborsky, M. (1991). Post-polio sequelae: The cultural context of polio biographies. Orthopedics, 14, 1173-81. Sheets, D. (1999). Secondary conditions and secondary disability among persons aging with long-term disability. Ann Arbor: ProQuest. Sheets D. (2013). Aging with Physical Disability. In: J.H. Stone, M. Blouin (Eds), International Encyclopedia of Rehabilitation. Available at http://cirrie.buffalo.edu/encyclopedia/en/article/288/. Accessed July 10, 2013. Shimada, H., Sawyer, P., Harada, K, Kaneya, S., Nihei, K., Asakawa, Y., Yoshii, C., Hagiwara, A., Furuna, T. and Ihizaki, T.C. (2010). Predictive validity of the classification schema for functional mobility tests in instrumental activities of daily living, decline among older adults, Arch Phys Med Rehabil, 91, 241-246. Silver, J.K. and Aiello, D.D. (2002). What internists need to know about post-polio syndrome. Cleveland Clinic J of Med, 69, 9, 704-712. Sokka, T. (2005). Assessment of pain in rheumatic diseases. Clin Exp Rheumatol, 23 (Suppl. 39), S77-S84. Sokka, T., Kautiainen, H., Toloza, S., et al. (2007). QUEST-RA: Quantitative clinical assessment of patients with rheumatoid arthritis seen in standard rheumatology care in 15 countries. Ann Rheum Dis, 66, 1491-1496. Sokka, T., Hetland, M.L., Makinen, H., et al. (2008). Women, men, and rheumatoid arthritis: analyses of disease activity, disease characteristics, and treatments in the QUEST-RA Study. Arthritis Rheum, 58, 9, 2642-2651. Sokka, T. (2009). Influence of gender on symptoms and severity of rheumatoid arthritis: do women suffer more? Int J Clin Rheumatol, 4, 3, 245-247. Sokka, T., Toloza, S., Cutolo, M., at al. (2009). Women, men, and rheumatoid arthritis: Analyses of disease activity, disease characteristics, and treatments in the QUEST-RA study. Arthritis Res Ther, 11, 1, R7. Spector, W.D. and Fleishman, J.A. (1998). Combining activities of daily living with instrumental activities of daily living to measure functional disability. J Geron Soc Sci, 53B, 1, S46-S57. Stoelb, B.L., Carter, G.T., Abresch, R.T., Purekal, S., McDonald, C.M., and Jensen, M.P. (2008). Pain in persons with postpolio syndrome: Frequency, intensity, and impact. Arch Phys Med Rehabil, 89, 1933-1940.
124
Stolwijk-Swuste, J.M., Tersteeg, I., Beelen, A., Lankhorst, G.J., Nollet, F. and the CARPA Study Group. (2010). The impact of age and comorbidity on the progression of disability in late-onset sequelae of poliomyelitis. Arch Phys Med Rehabil, 91, 523-8. Strating, M.M.H., Van Schuur. W.H. and Suurmeijer, T.P.B.M. (2007). Predictors of functional disability in rheumatoid arthritis: Results from a 13-year prospective study. Disability and Rehabilitation, 29, 10, 805-815. Supreme Court Decision: Olmstead vs. L.C., 527 U.S. 581 (1999). Tersteeg, I.M., Koopman, F.S., Stolwijk-Swuste, J.M., Beelen, A., Nollet, F., and the CARPA Study Group. (2011). A 5-year longitudinal study of fatigue in patients with late-onset sequelae of poliomyelitis. Arch Phys Med Rehabil, 92, 899-904. Thomas, V.S., Rockwood, K. and McDowell, I. (1998). Multidimensionality in instrumental and basic activities of daily living. J Clin Epidemiol, 51, 4, 315-321. Thompson L. (2004). Functional changes affecting people aging with disabilities. In: B. Kemp and L. Mosqueda, (Eds). Aging with a Disability: What the Clinician Needs to Know. Baltimore (MD): The Johns Hopkins University Press. Thorpe, K. (2013). Multiple chronic conditions: Policy changes and patient needs. Partnership to Fight Chronic Disease. Webinar Presentation on June 13, 2013. Available at: http://www.scribd.com/doc/147815860/Multiple-Chronic-Conditions-Policy-Changes-Patient-Needs. Accessed July 11, 2013. Treischmann, R.B. (1987). Aging with a disability. New York: Demos Publications. Trojan, D.A., Arnold, D.L., Shapiro, S., Bar-Or, A., Robinson, A., Le Cruguel, J-P., Narayanan, S., Tartaglia M.C., Caramanos, Z. and Da Costa, D. (2009). Fatigue in post-poliomyelitis syndrome: Association with disease-related, behavioral, and psychosocial factors. PM&R, 1, 442-449. Trojan, D.A. and Cashman, N.R. (2005). Post-poliomyelitis syndrome. Muscle Nerve, 31, 6-19. Turk, M.A., Overeynder, J.C. and Janicki, M.P. (Eds.). (1995). Uncertain future ---Aging and cerebral palsy: Clinical concerns. Albany: New York State Developmental Disabilities Planning Council. Turk, M.A. (2006). Secondary conditions and disability. In M.J. Field, A.M. Jette and L. Martin (Eds.), Workshop on Disability in America: A New Look, (pp. 185-93). Washington, D.C.: The National Academies Press. U.S. Department of Health and Human Services. (2000). Healthy People 2010: Understanding and Improving Health, 2nd ed. Washington, D.C.: Government Printing Office.
125
U.S. Department of Justice, Civil Rights Division. Statement of the Department of Justice on Enforcement of the Integration Mandate of Title II of the Americans with Disabilities Act and Olmstead v. L.C. Accessed on 28 June 2013 at http://www.ada.gov/olmstead/ q&a_olmstead.pdf. U.S. Department of Justice. (1990). ADA Title II Regulations. Federal Register, 20 July 1991. Vasiliadis, H-M., Collet, J-P., Shapiro, S., Venturini, A., and Trojan, D.A. (2002). Arch Phys Med Rehabil, 83, 1109-1115.
Verbrugge, L.M. and Jette, A.M. (1994). The disablement process. Soc Sci Med, 38, 1, 1-14. Verbrugge, L.M., Merrill, S.S. and Liu, X. (1999). Measuring disability with parsimony. Dis and Rehabil, 21, 5/6, 297-306. Verbrugge, L.M. and Yang, L. (2002). Aging with disability and disability with aging. J of Disability Policy Studies, 12, 4, 253-267. Vogeli, C., Shields, A.E., Lee, T.A., Gibson, T.B., Marder, W.D., Weiss, K.B. and Blumenthal, D. (2007). Multiple chronic conditions: Prevalence, health consequences, and implications for quality, care management, and costs. J Gen Intern Med, 22, Suppl 3, 391-5. Ware, J.E. and Sherbourne, C.D. (1992). The MOS 36-item Short Form Health Survey (SF-36). I. Conceptual framework and item selection. Medical Care, 30, 473-483. Weinstein, L., Aycock, W.L. and Feemster, R.F. (1951). Relation of sex, pregnancy and menstruation to susceptibility in poliomyelitis. New England Journal of Medicine, 245, 54-58. Weinstein, L. (1957). Influence of age and sex on susceptibility and clinical manifestations in poliomyelitis. New England Journal of Medicine, 257, 47-52. Whiteneck, G. (2006). Conceptual Models of Disability: Past, Present, and Future. In M.J. Field, A.M. Jette and L. Martin (Eds.), Workshop on Disability in America: A New Look, (pp. 50-66). Washington, D.C.: The National Academies Press. Wilbur, N., Mitra, M., Klein Walker, D., Allen, D., Meyers, A. R., and Tupper, P. (2002). Disability as a public health issue: Findings and reflections from the Massachusetts survey of secondary conditions. Milbank Quarterly, 80, 2, 393-421. Willen, C. and Grimby, G. (1998). Pain, physical activity, and disability in individuals with late effects of polio. Arch Phys Med Rehabil, 79, 915-919. Wolff, J.L., Starfield, B. and Anderson, G. (2002). Prevalence, expenditures, and complications of multiple chronic conditions in the elderly. Arch Intern Med, 162, 2269-2276. World Health Organization. (2013). Polio in the Syrian Arab Republic. Available at http://www.who.int/csr/don/2013_10_29/en/index.html. Accessed November 6, 2013.
126
World Health Organization. (1980). International Classification of Impairments, Disabilities, and Handicaps: A Manual of Classification Relating to the Consequences of Disease. Geneva, Switzerland: World Health Organization. World Health Organization. (1986). International Classification of Disease, 9th Revision. Clinical Modifications. Ann Arbor, MI: Commission of Professional and Hospital Activities. World Health Organization. (2001). International Classification of Functioning, Disability, and Health. Geneva, Switzerland: World Health Organization.

127
APPENDICES

128
APPENDIX I. PARTICIPANT REMINDER CARDS FOR POLIO AND RA
PARTICIPANT’S REMINDER CARD “Important Markers in Polio Timeline”
Time of Initial Onset: AGE:__________ YEAR:__________ _____DK Time of Initial Diagnosis: AGE:__________ YEAR:__________ _____DK (if different) Period of “Physical Best” AGES: _________ to _________ _____DK _____N/A YEARS: _________ to _________ _____DK _____N/A Other Important Dates (Optional): Event: ____________________ AGE:________ YEAR:________ Event: ____________________ AGE:________ YEAR:________
PARTICIPANT’S REMINDER CARD “Important Markers in Rheumatoid Arthritis Timeline”
When Diagnosed: AGE:__________ YEAR:__________ _____DK Current Status: (check one) _____Remission ______Good Period ______Bad Period _____DK Timing of Most Recent “Remission” or “Good Period”: ______DK _____N/A AGE: _________ to _________ MONTH: _________ to _________ YEARS: _________ to _________ Timing of Most Recent “Remission” or “Good Period”: ______DK _____N/A AGE: _________ to _________ MONTH: _________ to _________ YEARS: _________ to _________ Other Important Dates (Optional): Event: ____________________ AGE:________ YEAR:________ Event: ____________________ AGE:________ YEAR:________
129
APPENDIX II. DESCRIPTION OF VARIABLES USED OR DERIVED FROM AWD SURVEY INTERVIEWS
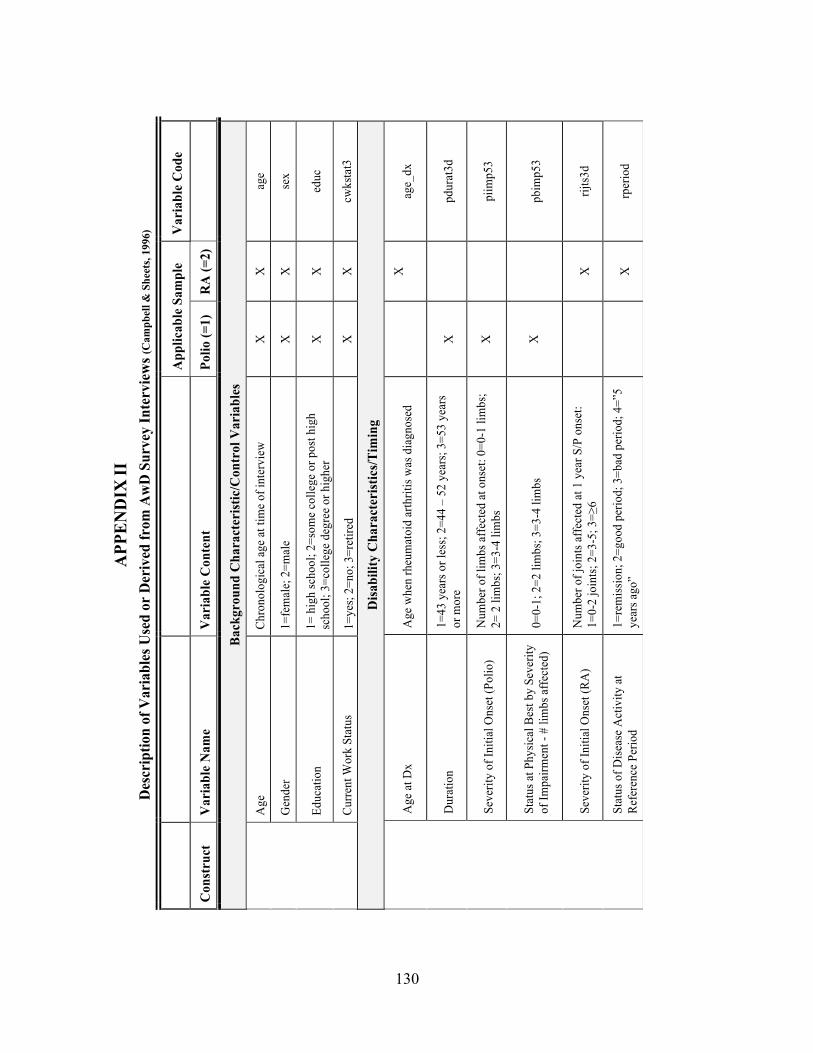
130
APP
EN
DIX
II
Des
crip
tion
of V
aria
bles
Use
d or
Der
ived
from
Aw
D S
urve
y In
terv
iew
s (C
ampb
ell &
She
ets,
1996
)
A
pplic
able
Sam
ple
Var
iabl
e C
ode
Con
stru
ct
Var
iabl
e N
ame
Var
iabl
e C
onte
nt
Polio
(=1)
R
A (=
2)
Bac
kgro
und
Cha
ract
eris
tic/C
ontr
ol V
aria
bles
A
ge
Chro
nolo
gica
l age
at t
ime
of in
terv
iew
X
X
ag
e
G
ende
r 1=
fem
ale;
2=m
ale
X
X
sex
Ed
ucat
ion
1= h
igh
scho
ol; 2
=som
e co
llege
or p
ost h
igh
scho
ol; 3
=col
lege
deg
ree
or h
ighe
r X
X
ed
uc
Cu
rrent
Wor
k St
atus
1=
yes;
2=no
; 3=r
etire
d X
X
cw
ksta
t3
Dis
abili
ty C
hara
cter
istic
s/T
imin
g
A
ge a
t Dx
Age
whe
n rh
eum
atoi
d ar
thrit
is w
as d
iagn
osed
X
age_
dx
D
urat
ion
1=43
yea
rs o
r les
s; 2=
44 –
52
year
s; 3=
53 y
ears
or
mor
e X
pdur
at3d
Se
verit
y of
Initi
al O
nset
(Pol
io)
Num
ber o
f lim
bs a
ffect
ed a
t ons
et: 0
=0-1
lim
bs;
2= 2
lim
bs; 3
=3-4
lim
bs
X
pi
imp5
3
St
atus
at P
hysic
al B
est b
y Se
verit
y of
Impa
irmen
t - #
lim
bs a
ffect
ed)
0=0-
1; 2
=2 li
mbs
; 3=3
-4 li
mbs
X
pbim
p53
Se
verit
y of
Initi
al O
nset
(RA
) N
umbe
r of j
oint
s affe
cted
at 1
yea
r S/P
ons
et:
1=0-
2 jo
ints;
2=3
-5; 3
=≥6
X
rij
ts3d
St
atus
of D
iseas
e A
ctiv
ity a
t Re
fere
nce
Perio
d 1=
rem
issio
n; 2
=goo
d pe
riod;
3=b
ad p
erio
d; 4
=”5
year
s ago
”
X
rper
iod

131
A
pplic
able
Sam
ple
Var
iabl
e C
ode
Con
stru
ct
Var
iabl
e N
ame
Var
iabl
e C
onte
nt
Polio
(=1)
R
A (=
2)
Incr
ease
(Cha
nge)
in S
ympt
oms
sinc
e Ph
ysic
al B
est (
Polio
) or
Ref
eren
ce P
erio
d (R
A)
C
hang
in s
ever
ity o
f bod
ily p
ain:
as
ked
curr
ent s
tatu
s an
d re
fere
nce
perio
d 1=
non
e; 2
= m
ild to
mod
erat
e; 3
= se
vere
X
X
C
_Pai
n3L
C
hang
e in
sev
erity
of r
ecur
ring
fatig
ue:
aske
d cu
rren
t sta
tus
and
refe
renc
e pe
riod
1= n
one;
2 =
mild
to m
oder
ate;
3 =
sev
ere
X
X
C_T
ired3
L
C
hang
e in
sev
erity
of m
uscl
e w
eakn
ess:
ask
ed c
urre
nt s
tatu
s an
d re
fere
nce
perio
d
1= n
one;
2=
a lit
tle to
a fa
ir am
ount
; 3=
a gr
eat
deal
X
C_M
wea
k3L
C
hang
e in
Len
gth
of J
oint
St
iffne
ss: a
sked
cur
rent
sta
tus
and
refe
renc
e pe
riod
1= n
one;
2=
a lit
tle to
a fa
ir am
ount
; 3=
a gr
eat
deal
X
C_J
stiff
3L
Incr
ease
(cha
nge)
in F
unct
iona
l Lim
itatio
ns
Func
tion:
M
obili
ty
Cha
nge
in w
alk
2-3
bloc
ks in
co
mm
unity
: ask
ed c
urre
nt s
tatu
s an
d re
fere
nce
perio
d 1=
none
; 2=a
littl
e to
a fa
ir am
ount
; 3=a
gre
at d
eal.
X
X
C_C
wal
k3L
C
hang
e in
wal
k ac
ross
room
: ask
ed
curr
ent s
tatu
s an
d re
fere
nce
perio
d 1=
none
; 2=a
littl
e to
a fa
ir am
ount
; 3=a
gre
at d
eal
X
X
C_R
wal
k3L
C
hang
e in
clim
b on
e fli
ght o
f 10
stai
rs: a
sked
cur
rent
sta
tus
and
refe
renc
e pe
riod
1=no
ne; 2
=a li
ttle
to a
fair
amou
nt; 3
=a g
reat
dea
l X
X
C
_Sta
irs3L
Cha
nge
in g
et a
roun
d co
mm
unity
(b
y w
alki
ng, u
sing
a s
coot
er o
r w
heel
chai
r): a
sked
cur
rent
sta
tus
and
refe
renc
e pe
riod
1=no
ne; 2
=a li
ttle
to a
fair
amou
nt; 3
=a g
reat
dea
l X
X
C
_Cm
obe3
L
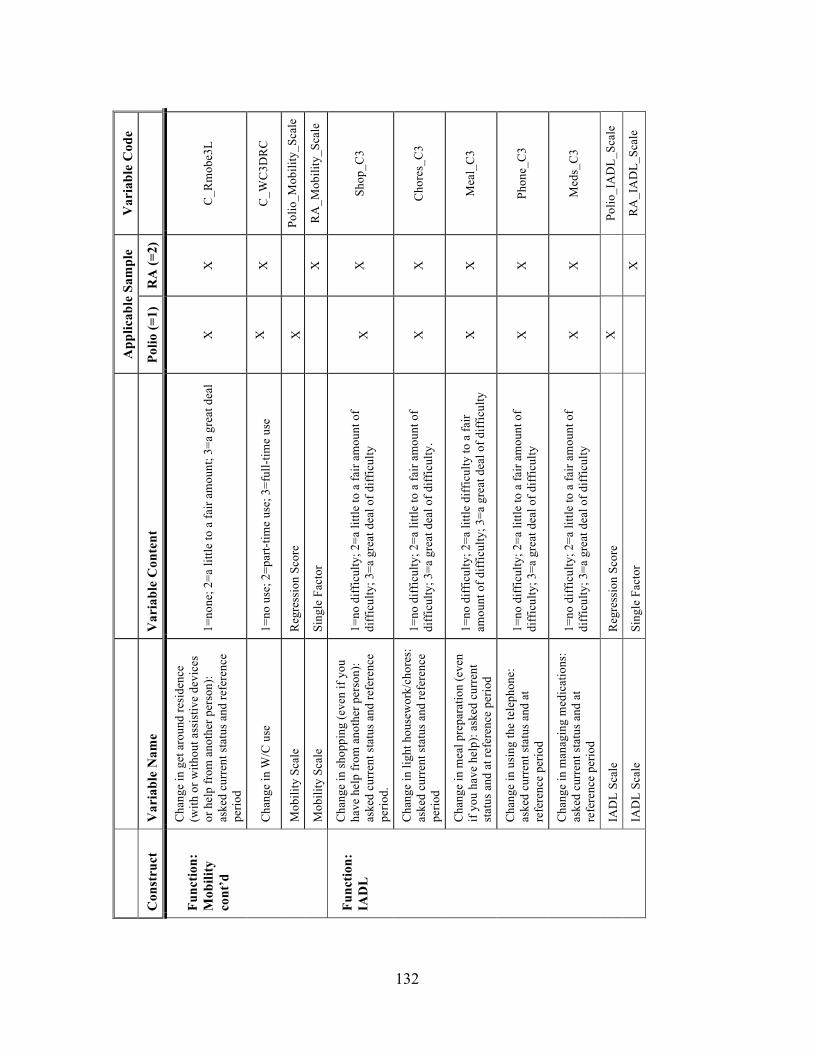
132
A
pplic
able
Sam
ple
Var
iabl
e C
ode
Con
stru
ct
Var
iabl
e N
ame
Var
iabl
e C
onte
nt
Polio
(=1)
R
A (=
2)
Func
tion:
M
obili
ty
cont
’d
Cha
nge
in g
et a
roun
d re
side
nce
(with
or w
ithou
t ass
istiv
e de
vice
s or
hel
p fr
om a
noth
er p
erso
n):
aske
d cu
rren
t sta
tus
and
refe
renc
e pe
riod
1=no
ne; 2
=a li
ttle
to a
fair
amou
nt; 3
=a g
reat
dea
l X
X
C
_Rm
obe3
L
C
hang
e in
W/C
use
1=
no u
se; 2
=par
t-tim
e us
e; 3
=ful
l-tim
e us
e X
X
C
_WC
3DR
C
M
obili
ty S
cale
R
egre
ssio
n Sc
ore
X
Po
lio_M
obili
ty_S
cale
M
obili
ty S
cale
Si
ngle
Fac
tor
X
R
A_M
obili
ty_S
cale
Func
tion:
IA
DL
Cha
nge
in s
hopp
ing
(eve
n if
you
have
hel
p fr
om a
noth
er p
erso
n):
aske
d cu
rren
t sta
tus
and
refe
renc
e pe
riod.
1=no
diff
icul
ty; 2
=a li
ttle
to a
fair
amou
nt o
f di
ffic
ulty
; 3=a
gre
at d
eal o
f diff
icul
ty
X
X
Shop
_C3
C
hang
e in
ligh
t hou
sew
ork/
chor
es:
aske
d cu
rren
t sta
tus
and
refe
renc
e pe
riod
1=no
diff
icul
ty; 2
=a li
ttle
to a
fair
amou
nt o
f di
ffic
ulty
; 3=a
gre
at d
eal o
f diff
icul
ty.
X
X
Cho
res_
C3
C
hang
e in
mea
l pre
para
tion
(eve
n if
you
have
hel
p): a
sked
cur
rent
st
atus
and
at r
efer
ence
per
iod
1=no
diff
icul
ty; 2
=a li
ttle
diff
icul
ty to
a fa
ir am
ount
of d
iffic
ulty
; 3=a
gre
at d
eal o
f diff
icul
ty
X
X
Mea
l_C
3
C
hang
e in
usi
ng th
e te
leph
one:
as
ked
curr
ent s
tatu
s an
d at
re
fere
nce
perio
d
1=no
diff
icul
ty; 2
=a li
ttle
to a
fair
amou
nt o
f di
ffic
ulty
; 3=a
gre
at d
eal o
f diff
icul
ty
X
X
Phon
e_C
3
C
hang
e in
man
agin
g m
edic
atio
ns:
aske
d cu
rren
t sta
tus
and
at
refe
renc
e pe
riod
1=no
diff
icul
ty; 2
=a li
ttle
to a
fair
amou
nt o
f di
ffic
ulty
; 3=a
gre
at d
eal o
f diff
icul
ty
X
X
Med
s_C
3
IA
DL
Scal
e R
egre
ssio
n Sc
ore
X
Po
lio_I
AD
L_Sc
ale
IA
DL
Scal
e Si
ngle
Fac
tor
X
R
A_I
AD
L_Sc
ale
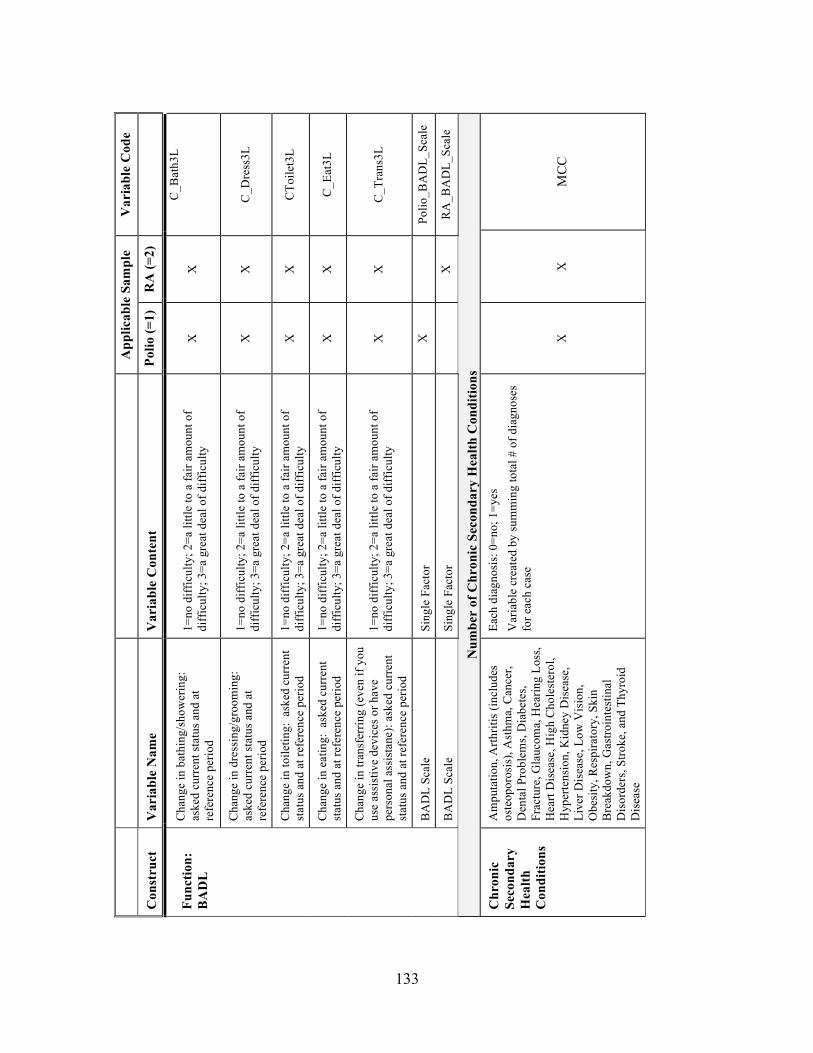
133
A
pplic
able
Sam
ple
Var
iabl
e C
ode
Con
stru
ct
Var
iabl
e N
ame
Var
iabl
e C
onte
nt
Polio
(=1)
R
A (=
2)
Func
tion:
B
AD
L
Cha
nge
in b
athi
ng/s
how
erin
g:
aske
d cu
rren
t sta
tus a
nd a
t re
fere
nce
perio
d
1=no
diff
icul
ty; 2
=a li
ttle
to a
fair
amou
nt o
f di
ffic
ulty
; 3=a
gre
at d
eal o
f diff
icul
ty
X
X
C_B
ath3
L
C
hang
e in
dre
ssin
g/gr
oom
ing:
as
ked
curr
ent s
tatu
s and
at
refe
renc
e pe
riod
1=no
diff
icul
ty; 2
=a li
ttle
to a
fair
amou
nt o
f di
ffic
ulty
; 3=a
gre
at d
eal o
f diff
icul
ty
X
X
C_D
ress
3L
C
hang
e in
toile
ting:
ask
ed c
urre
nt
stat
us a
nd a
t ref
eren
ce p
erio
d 1=
no d
iffic
ulty
; 2=a
littl
e to
a fa
ir am
ount
of
diff
icul
ty; 3
=a g
reat
dea
l of d
iffic
ulty
X
X
C
Toile
t3L
C
hang
e in
eat
ing:
ask
ed c
urre
nt
stat
us a
nd a
t ref
eren
ce p
erio
d 1=
no d
iffic
ulty
; 2=a
littl
e to
a fa
ir am
ount
of
diff
icul
ty; 3
=a g
reat
dea
l of d
iffic
ulty
X
X
C
_Eat
3L
Cha
nge
in tr
ansf
errin
g (e
ven
if yo
u us
e as
sist
ive
devi
ces o
r hav
e pe
rson
al a
ssis
tane
): as
ked
curr
ent
stat
us a
nd a
t ref
eren
ce p
erio
d
1=no
diff
icul
ty; 2
=a li
ttle
to a
fair
amou
nt o
f di
ffic
ulty
; 3=a
gre
at d
eal o
f diff
icul
ty
X
X
C_T
rans
3L
B
AD
L Sc
ale
Sing
le F
acto
r X
Polio
_BA
DL_
Scal
e
B
AD
L Sc
ale
Sing
le F
acto
r
X
RA
_BA
DL_
Scal
e
Num
ber
of C
hron
ic S
econ
dary
Hea
lth C
ondi
tions
C
hron
ic
Seco
ndar
y H
ealth
C
ondi
tions
Am
puta
tion,
Arth
ritis
(inc
lude
s os
teop
oros
is),
Ast
hma,
Can
cer,
Den
tal P
robl
ems,
Dia
bete
s, Fr
actu
re, G
lauc
oma,
Hea
ring
Loss
, H
eart
Dis
ease
, Hig
h C
hole
ster
ol,
Hyp
erte
nsio
n, K
idne
y D
isea
se,
Live
r Dis
ease
, Low
Vis
ion,
O
besi
ty, R
espi
rato
ry, S
kin
Bre
akdo
wn,
Gas
troin
test
inal
D
isor
ders
, Stro
ke, a
nd T
hyro
id
Dis
ease
Each
dia
gnos
is: 0
=no;
1=y
es
Var
iabl
e cr
eate
d by
sum
min
g to
tal #
of d
iagn
oses
fo
r eac
h ca
se
X
X
MC
C
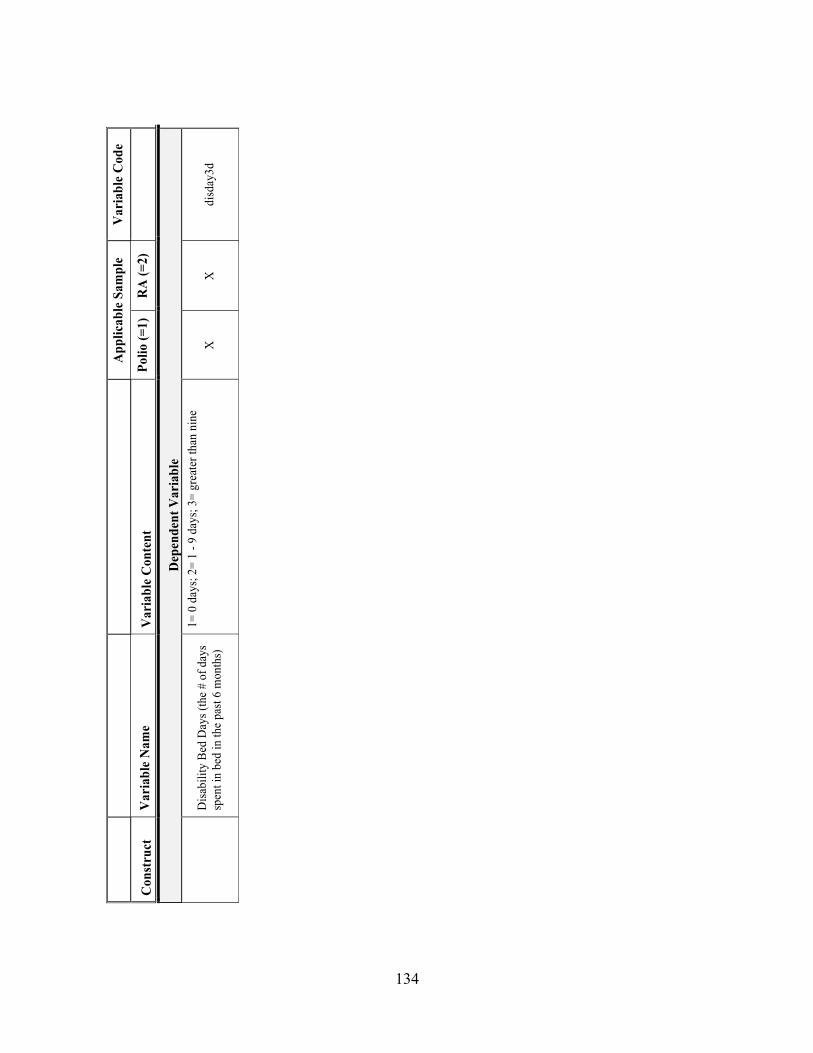
134
A
pplic
able
Sam
ple
Var
iabl
e C
ode
Con
stru
ct
Var
iabl
e N
ame
Var
iabl
e C
onte
nt
Polio
(=1)
R
A (=
2)
Dep
ende
nt V
aria
ble
D
isab
ility
Bed
Day
s (th
e #
of d
ays
spen
t in
bed
in th
e pa
st 6
mon
ths)
1= 0
day
s; 2
= 1
- 9 d
ays;
3=
grea
ter t
han
nine
da
ys
X
X
di
sday
3d

135
APPENDIX III. CORRELATIONS FOR MORBIDITY AND MORTALITY DIAGNOSES
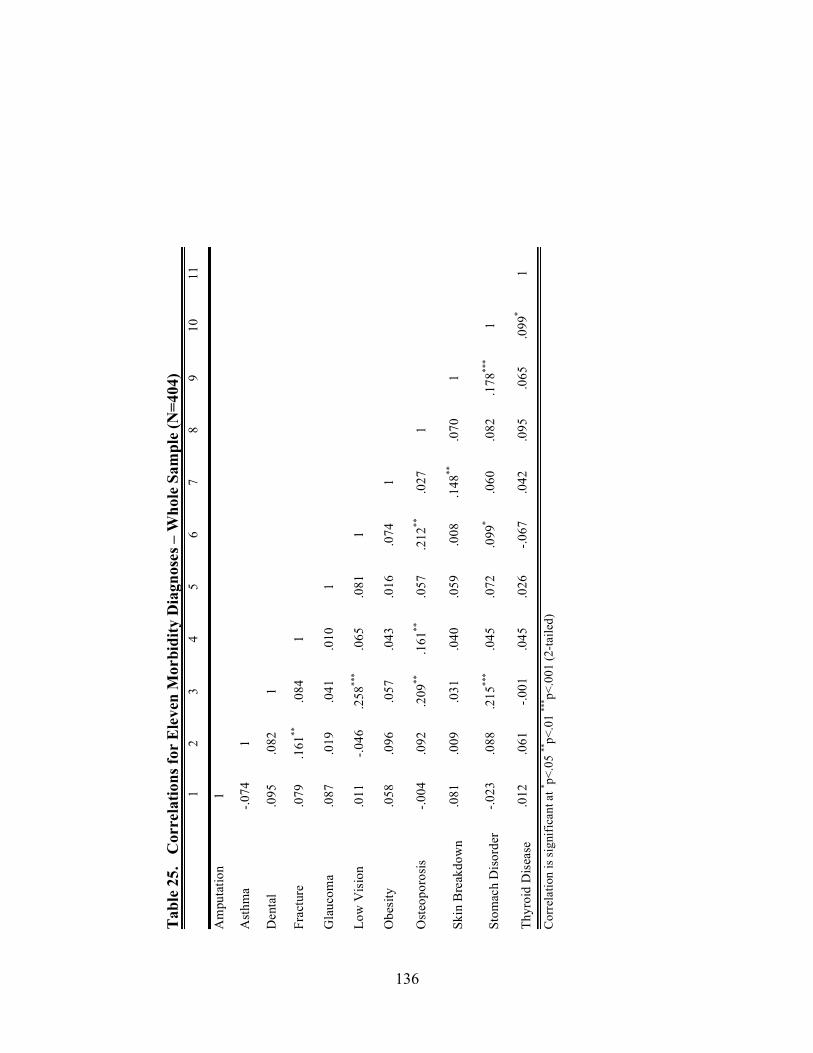
136
Tabl
e 25
. C
orre
latio
ns fo
r E
leve
n M
orbi
dity
Dia
gnos
es –
Who
le S
ampl
e (N
=404
)
1
2 3
4 5
6 7
8 9
10
11
Am
puta
tion
1
Ast
hma
-.074
1
Den
tal
.095
.0
82
1
Frac
ture
.0
79
.161
**
.084
1
Gla
ucom
a .0
87
.019
.0
41
.010
1
Low
Vis
ion
.011
-.0
46
.258
***
.065
.0
81
1
Obe
sity
.0
58
.096
.0
57
.043
.0
16
.074
1
Ost
eopo
rosi
s -.0
04
.092
.2
09**
.1
61**
.0
57
.212
**
.027
1
Skin
Bre
akdo
wn
.081
.0
09
.031
.0
40
.059
.0
08
.148
**
.070
1
Stom
ach
Dis
orde
r -.0
23
.088
.2
15**
* .0
45
.072
.0
99*
.060
.0
82
.178
***
1
Thyr
oid
Dis
ease
.0
12
.061
-.0
01
.045
.0
26
-.067
.0
42
.095
.0
65
.099
* 1
Cor
rela
tion
is si
gnifi
cant
at * p<
.05
**p<
.01
*** p<
.001
(2-ta
iled)
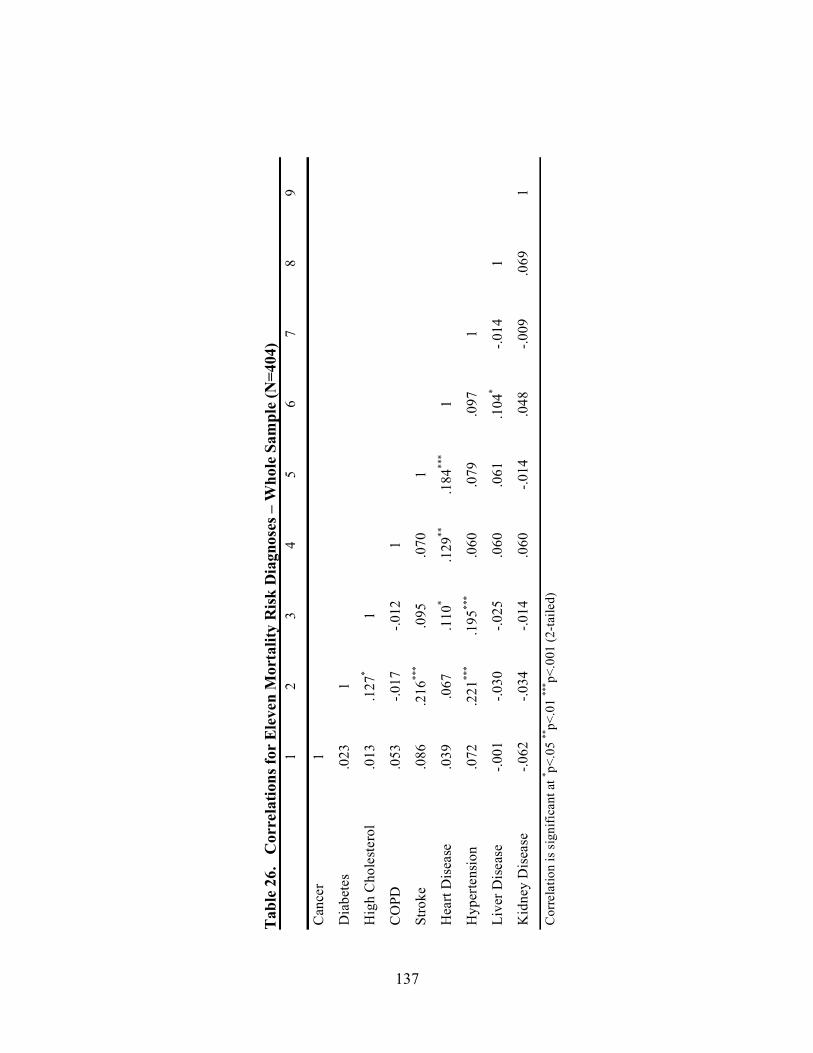
137
Tabl
e 26
. C
orre
latio
ns fo
r El
even
Mor
talit
y R
isk D
iagn
oses
– W
hole
Sam
ple
(N=4
04)
1
2 3
4 5
6 7
8 9
Can
cer
1
Dia
bete
s .0
23
1
Hig
h C
hole
ster
ol
.013
.1
27*
1
CO
PD
.053
-.0
17
-.012
1
Stro
ke
.086
.2
16**
* .0
95
.070
1
Hea
rt D
isea
se
.039
.0
67
.110
* .1
29**
.1
84**
* 1
Hyp
erte
nsio
n .0
72
.221
***
.195
***
.060
.0
79
.097
1
Live
r Dis
ease
-.0
01
-.030
-.0
25
.060
.0
61
.104
* -.0
14
1
Kid
ney
Dis
ease
-.0
62
-.034
-.0
14
.060
-.0
14
.048
-.0
09
.069
1
Cor
rela
tion
is s
igni
fican
t at * p<
.05
**p<
.01
*** p<
.001
(2-ta
iled)