Embed Size (px)
Citation preview

1
AGM Presentation
February 2019
www.aspermont.comFor
per
sona
l use
onl
y
2The leading media services provider to the global resources industry
Aspermont is ASX listed with offices in Australia, UK, Brazil, North America
and the Philippines
The Company’s focus is on global media leadership in the Mining,
Agriculture, Energy and Technology sectors
The company has invested 20 years in building a commercial model for
B2B digital media distribution that is founded on providing high value
content to a global subscriber base. The B2B model is scalable as to new
countries, new commodity sectors and in new languages
Aspermont is now the dominant player in B2B media for the resources
sector
For
per
sona
l use
onl
y
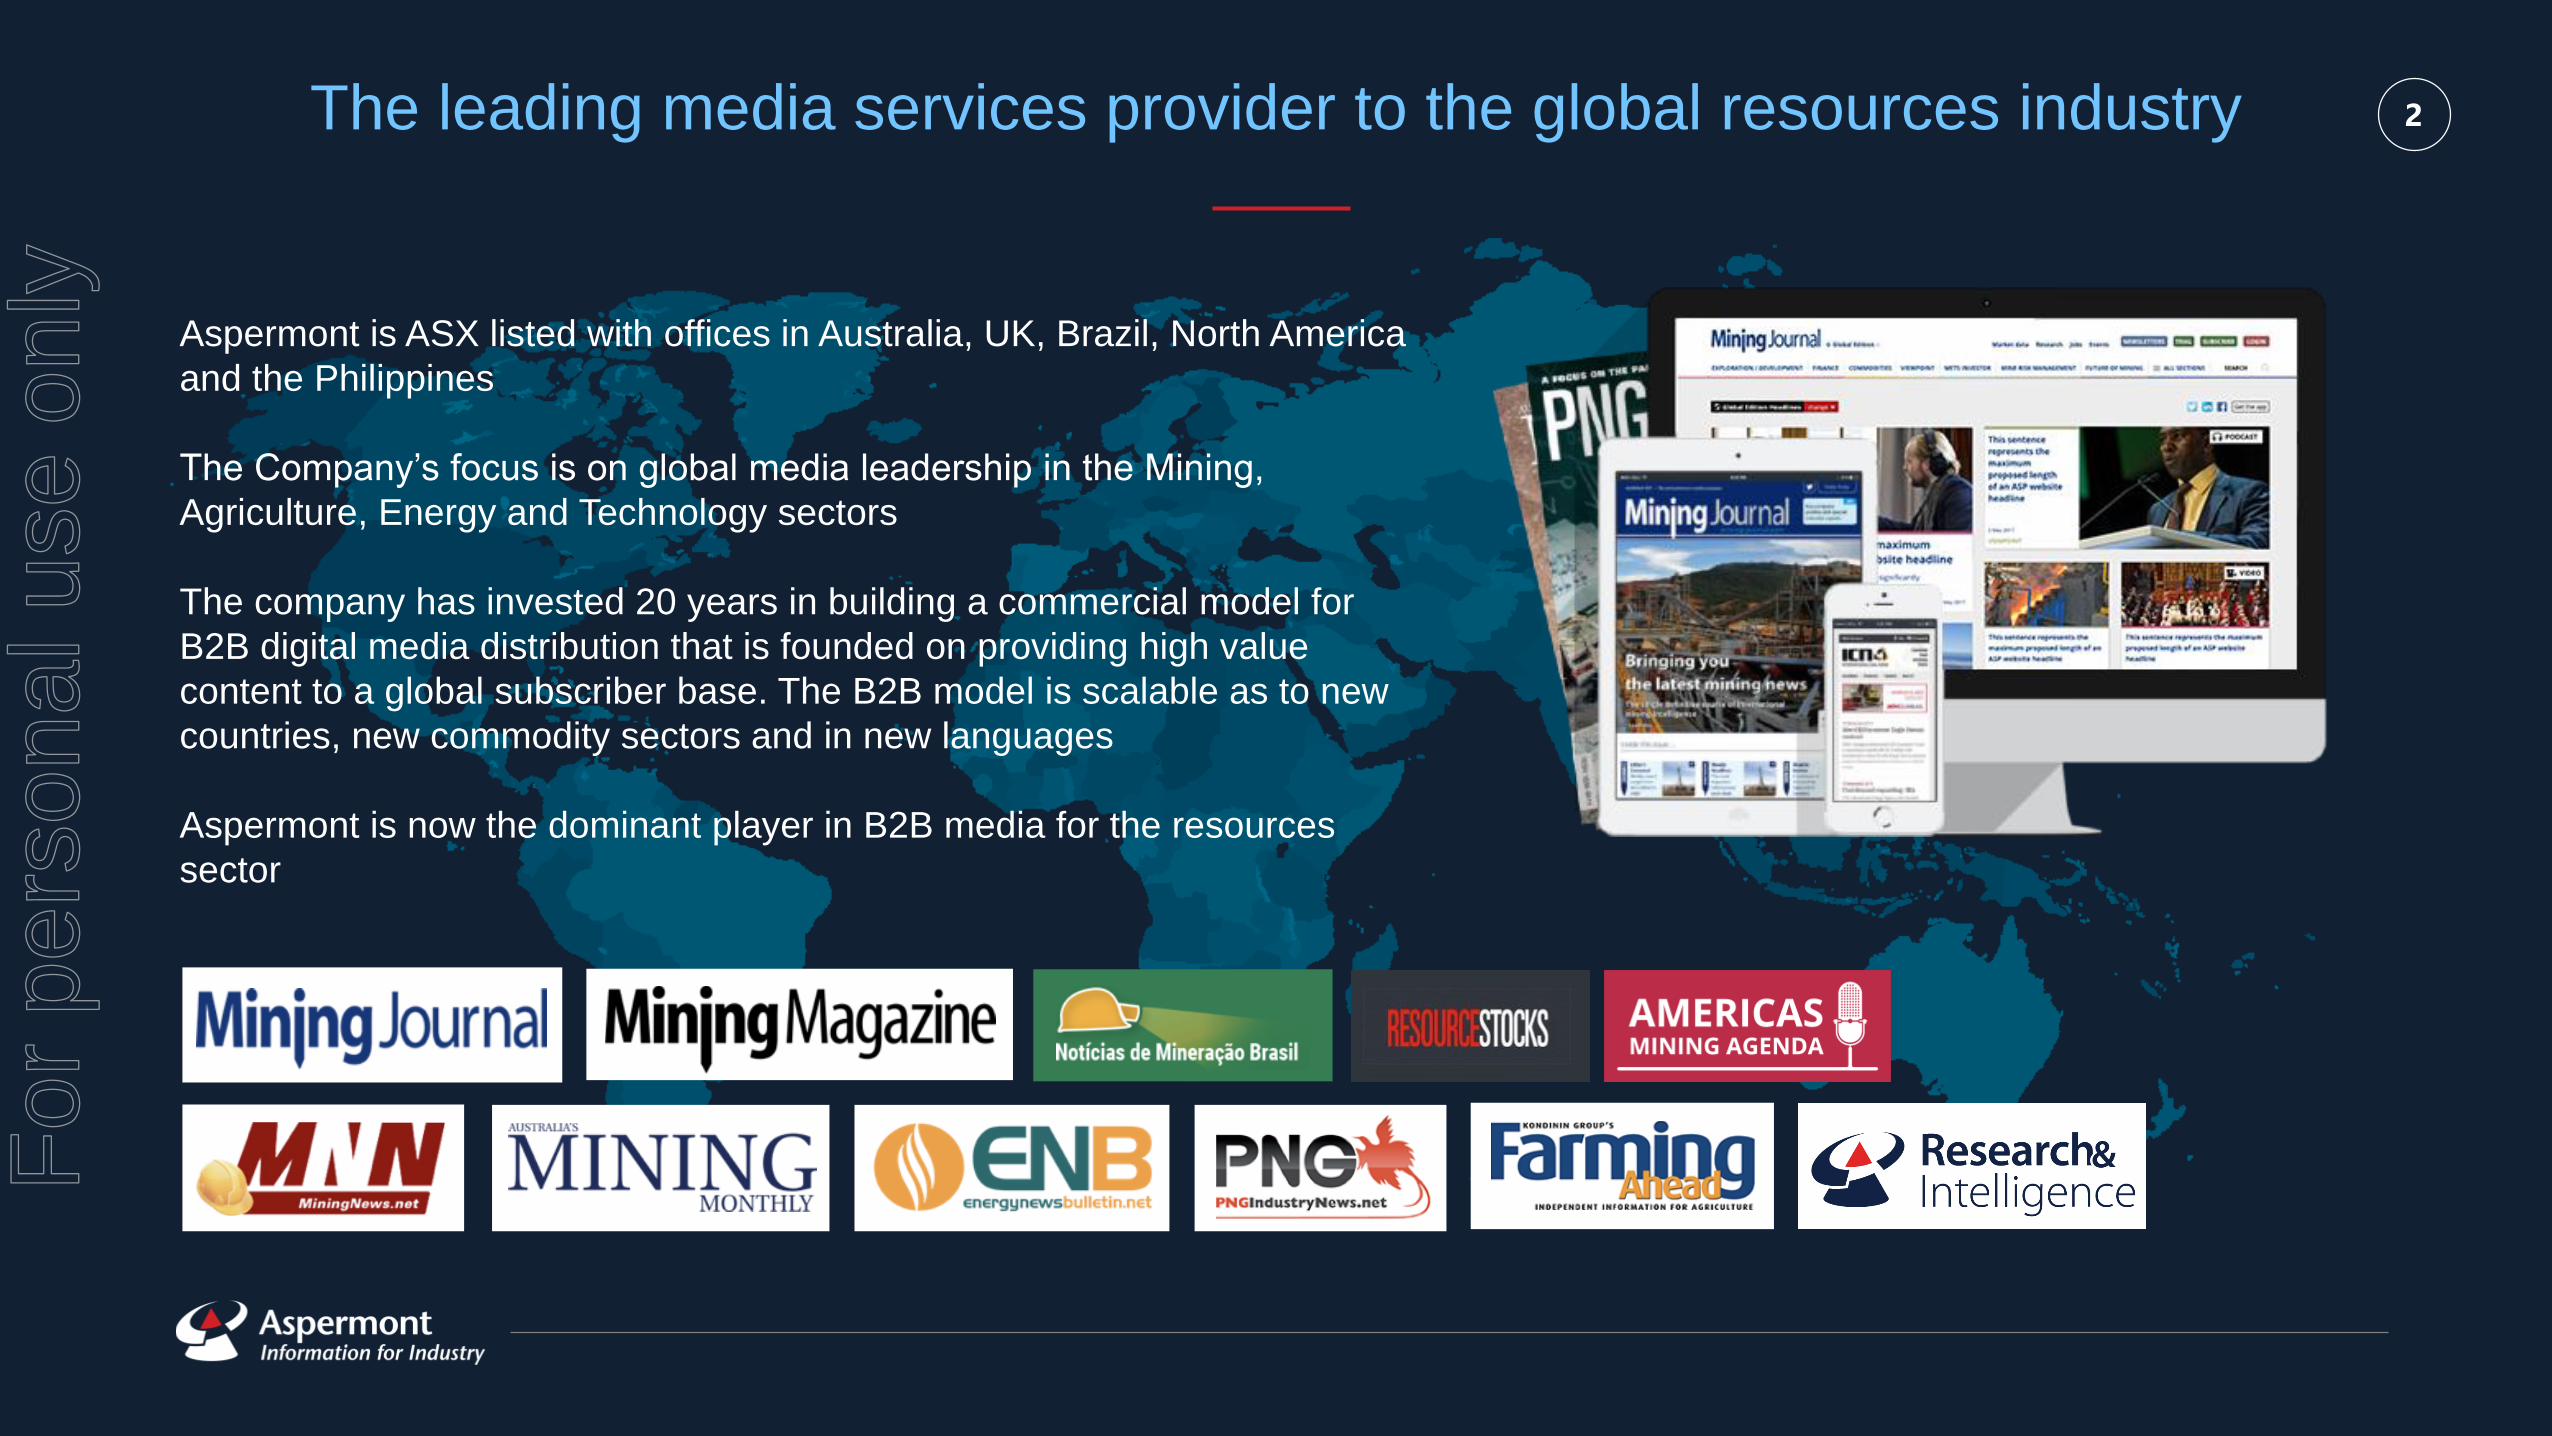
3Q2-19 (forecast)
Strong growth in revenue, profit and cash flow
Positive Q1 trading performance continues into Q2 and looks set to maintain in future quarters as total revenue grows robustly. Core business continues to make strong improvements alongside emerging new businesses
• Q2 revenue: 47% growth on prior year
• Strong cash flow improves gross margins and drives bottom line profitability
• Future of Mining Sydney (FOMS) sold out 1 month prior to event and twice the size of launch event last year’s launch event
PCP Comparisons:Subscriptions
Revenue
Events
Revenue
Digital Ad
Revenue
Print Ad
Revenue
Res’ch/Data
Revenue
Total
RevenueGross Profit EBITDA
Operating
Cash flow
Q2’19 Vs Q2’18 +9% NEW +9% +8% +166% +47% +58% +140% +43%
Q2’19 Actual ($’K) 1,589 1,105 760 911 93 4,458 2,630 70 395
* All figures for Q2 are forecast and based on unaudited management accounts. Earnings and operating cash flow figures are pres ented on a normalised basis
2,300
2,800
3,300
3,800
4,300
4,800
Q1-16 Q2-16 Q3-16 Q4-16 Q1-17 Q2-17 Q3-17 Q4-17 Q1-18 Q2-18 Q3-18 Q4-18 Q1-19 Q2-19
Quarterly Revenues ($’K)
(continuing business)
Revenue growth
momentum change
Q2-18
For
per
sona
l use
onl
y
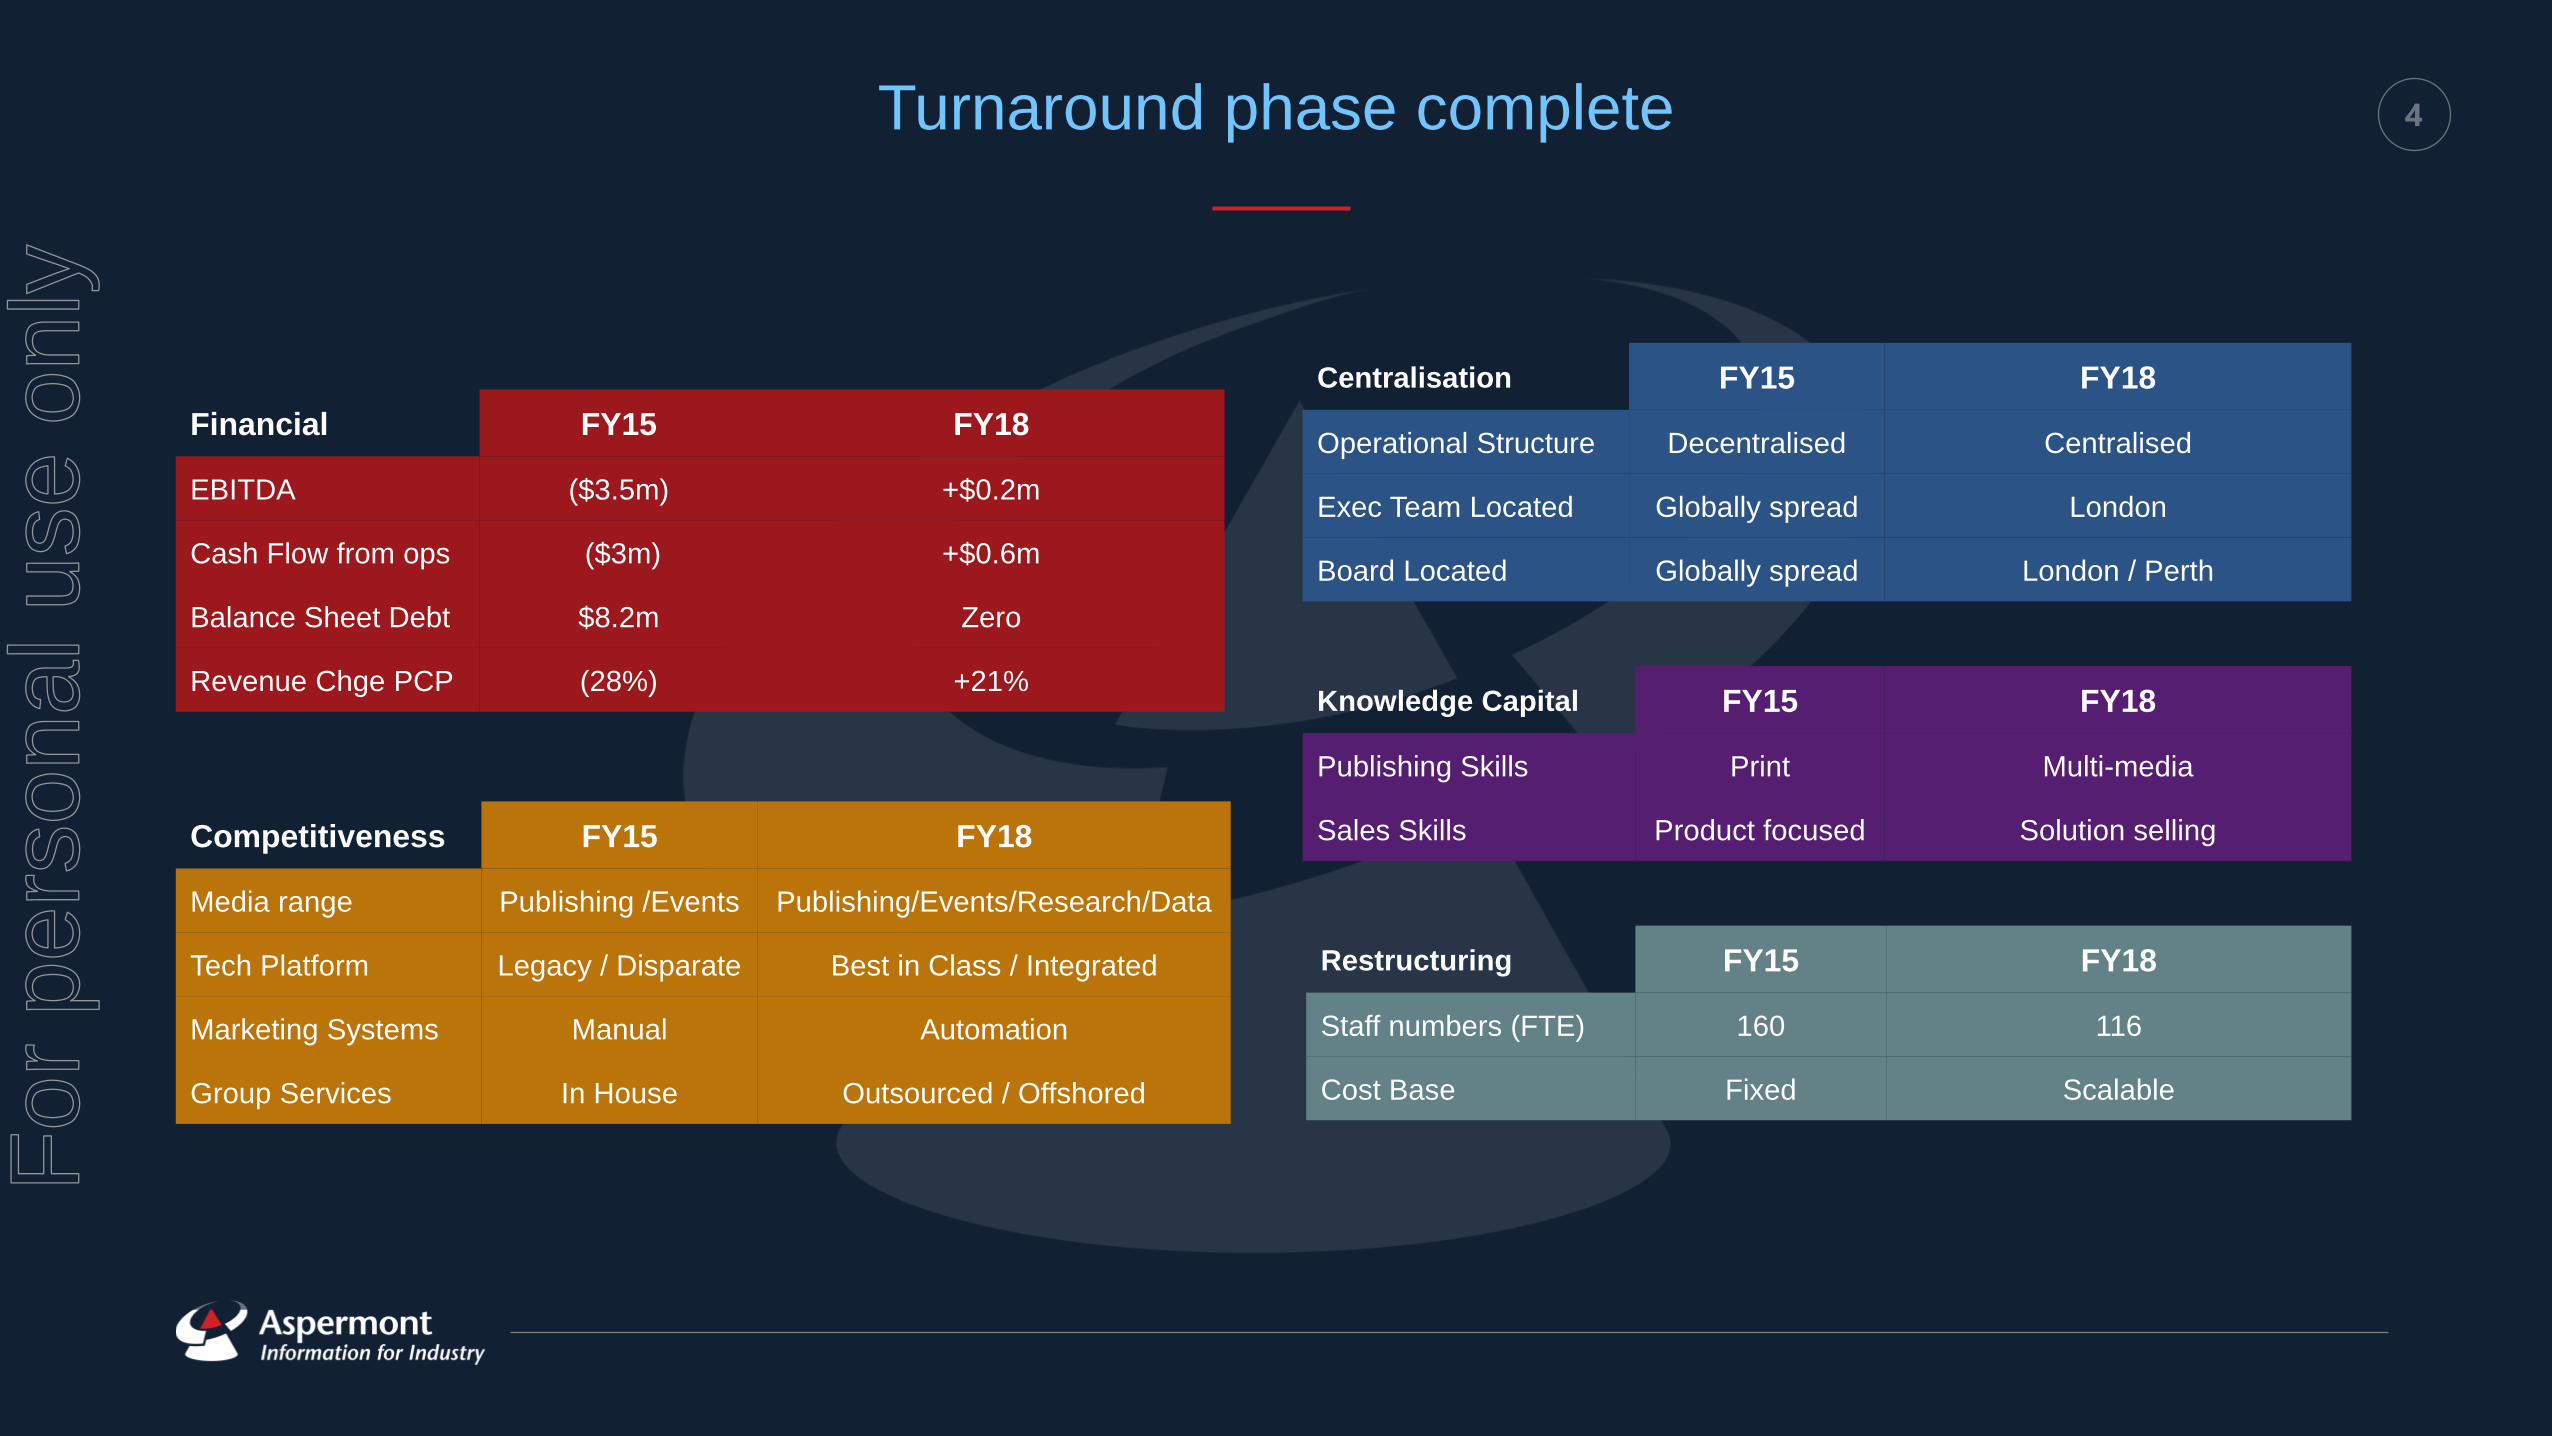
4Turnaround phase complete
Financial FY15 FY18
EBITDA ($3.5m) +$0.2m
Cash Flow from ops ($3m) +$0.6m
Balance Sheet Debt $8.2m Zero
Revenue Chge PCP (28%) +21%
Competitiveness FY15 FY18
Media range Publishing /Events Publishing/Events/Research/Data
Tech Platform Legacy / Disparate Best in Class / Integrated
Marketing Systems Manual Automation
Group Services In House Outsourced / Offshored
Centralisation FY15 FY18
Operational Structure Decentralised Centralised
Exec Team Located Globally spread London
Board Located Globally spread London / Perth
Knowledge Capital FY15 FY18
Publishing Skills Print Multi-media
Sales Skills Product focused Solution selling
Restructuring FY15 FY18
Staff numbers (FTE) 160 116
Cost Base Fixed Scalable
For
per
sona
l use
onl
y
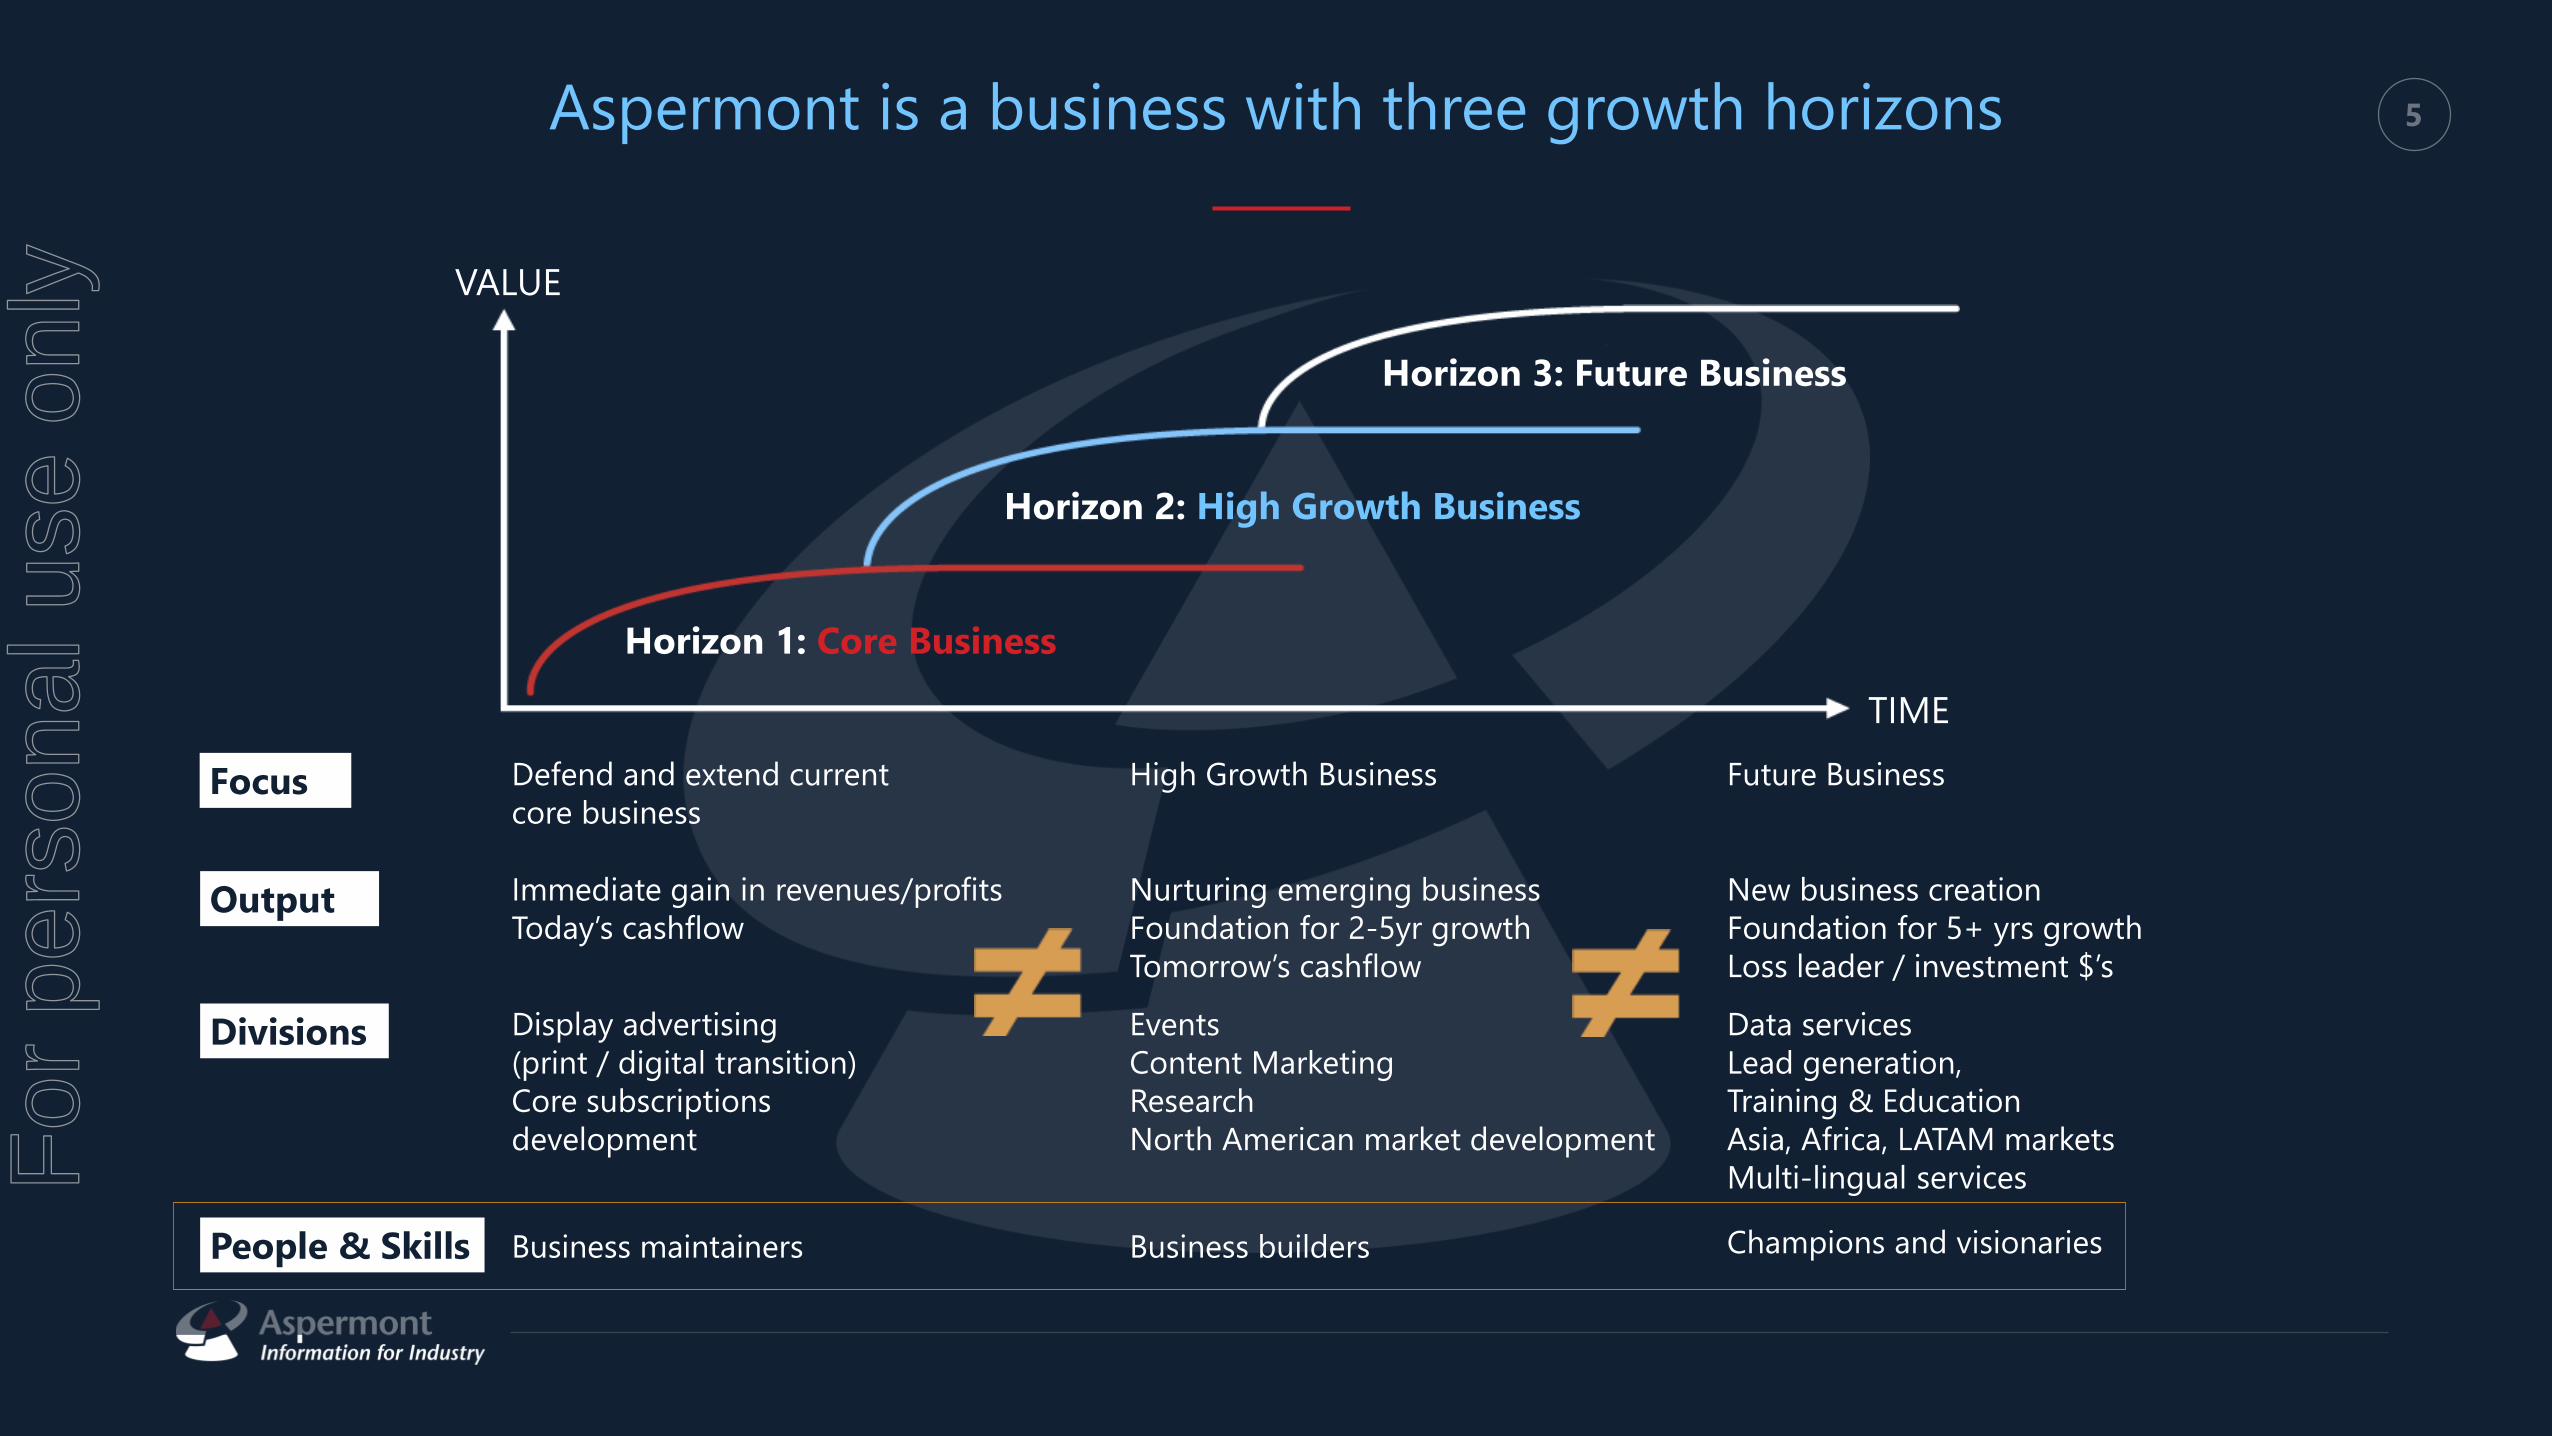
5Aspermont is a business with three growth horizons
Horizon 1: Core Business
Horizon 2: High Growth Business
Horizon 3: Future Business
TIME
VALUE
Focus
Output
Divisions
People & Skills
Defend and extend current
core business
Immediate gain in revenues/profits
Today’s cashflow
Display advertising
(print / digital transition)
Core subscriptions
development
Business maintainers
High Growth Business
Nurturing emerging business
Foundation for 2-5yr growth
Tomorrow’s cashflow
Events
Content Marketing
Research
North American market development
Business builders
Future Business
New business creation
Foundation for 5+ yrs growth
Loss leader / investment $’s
Data services
Lead generation,
Training & Education
Asia, Africa, LATAM markets
Multi-lingual services
Champions and visionaries
For
per
sona
l use
onl
y
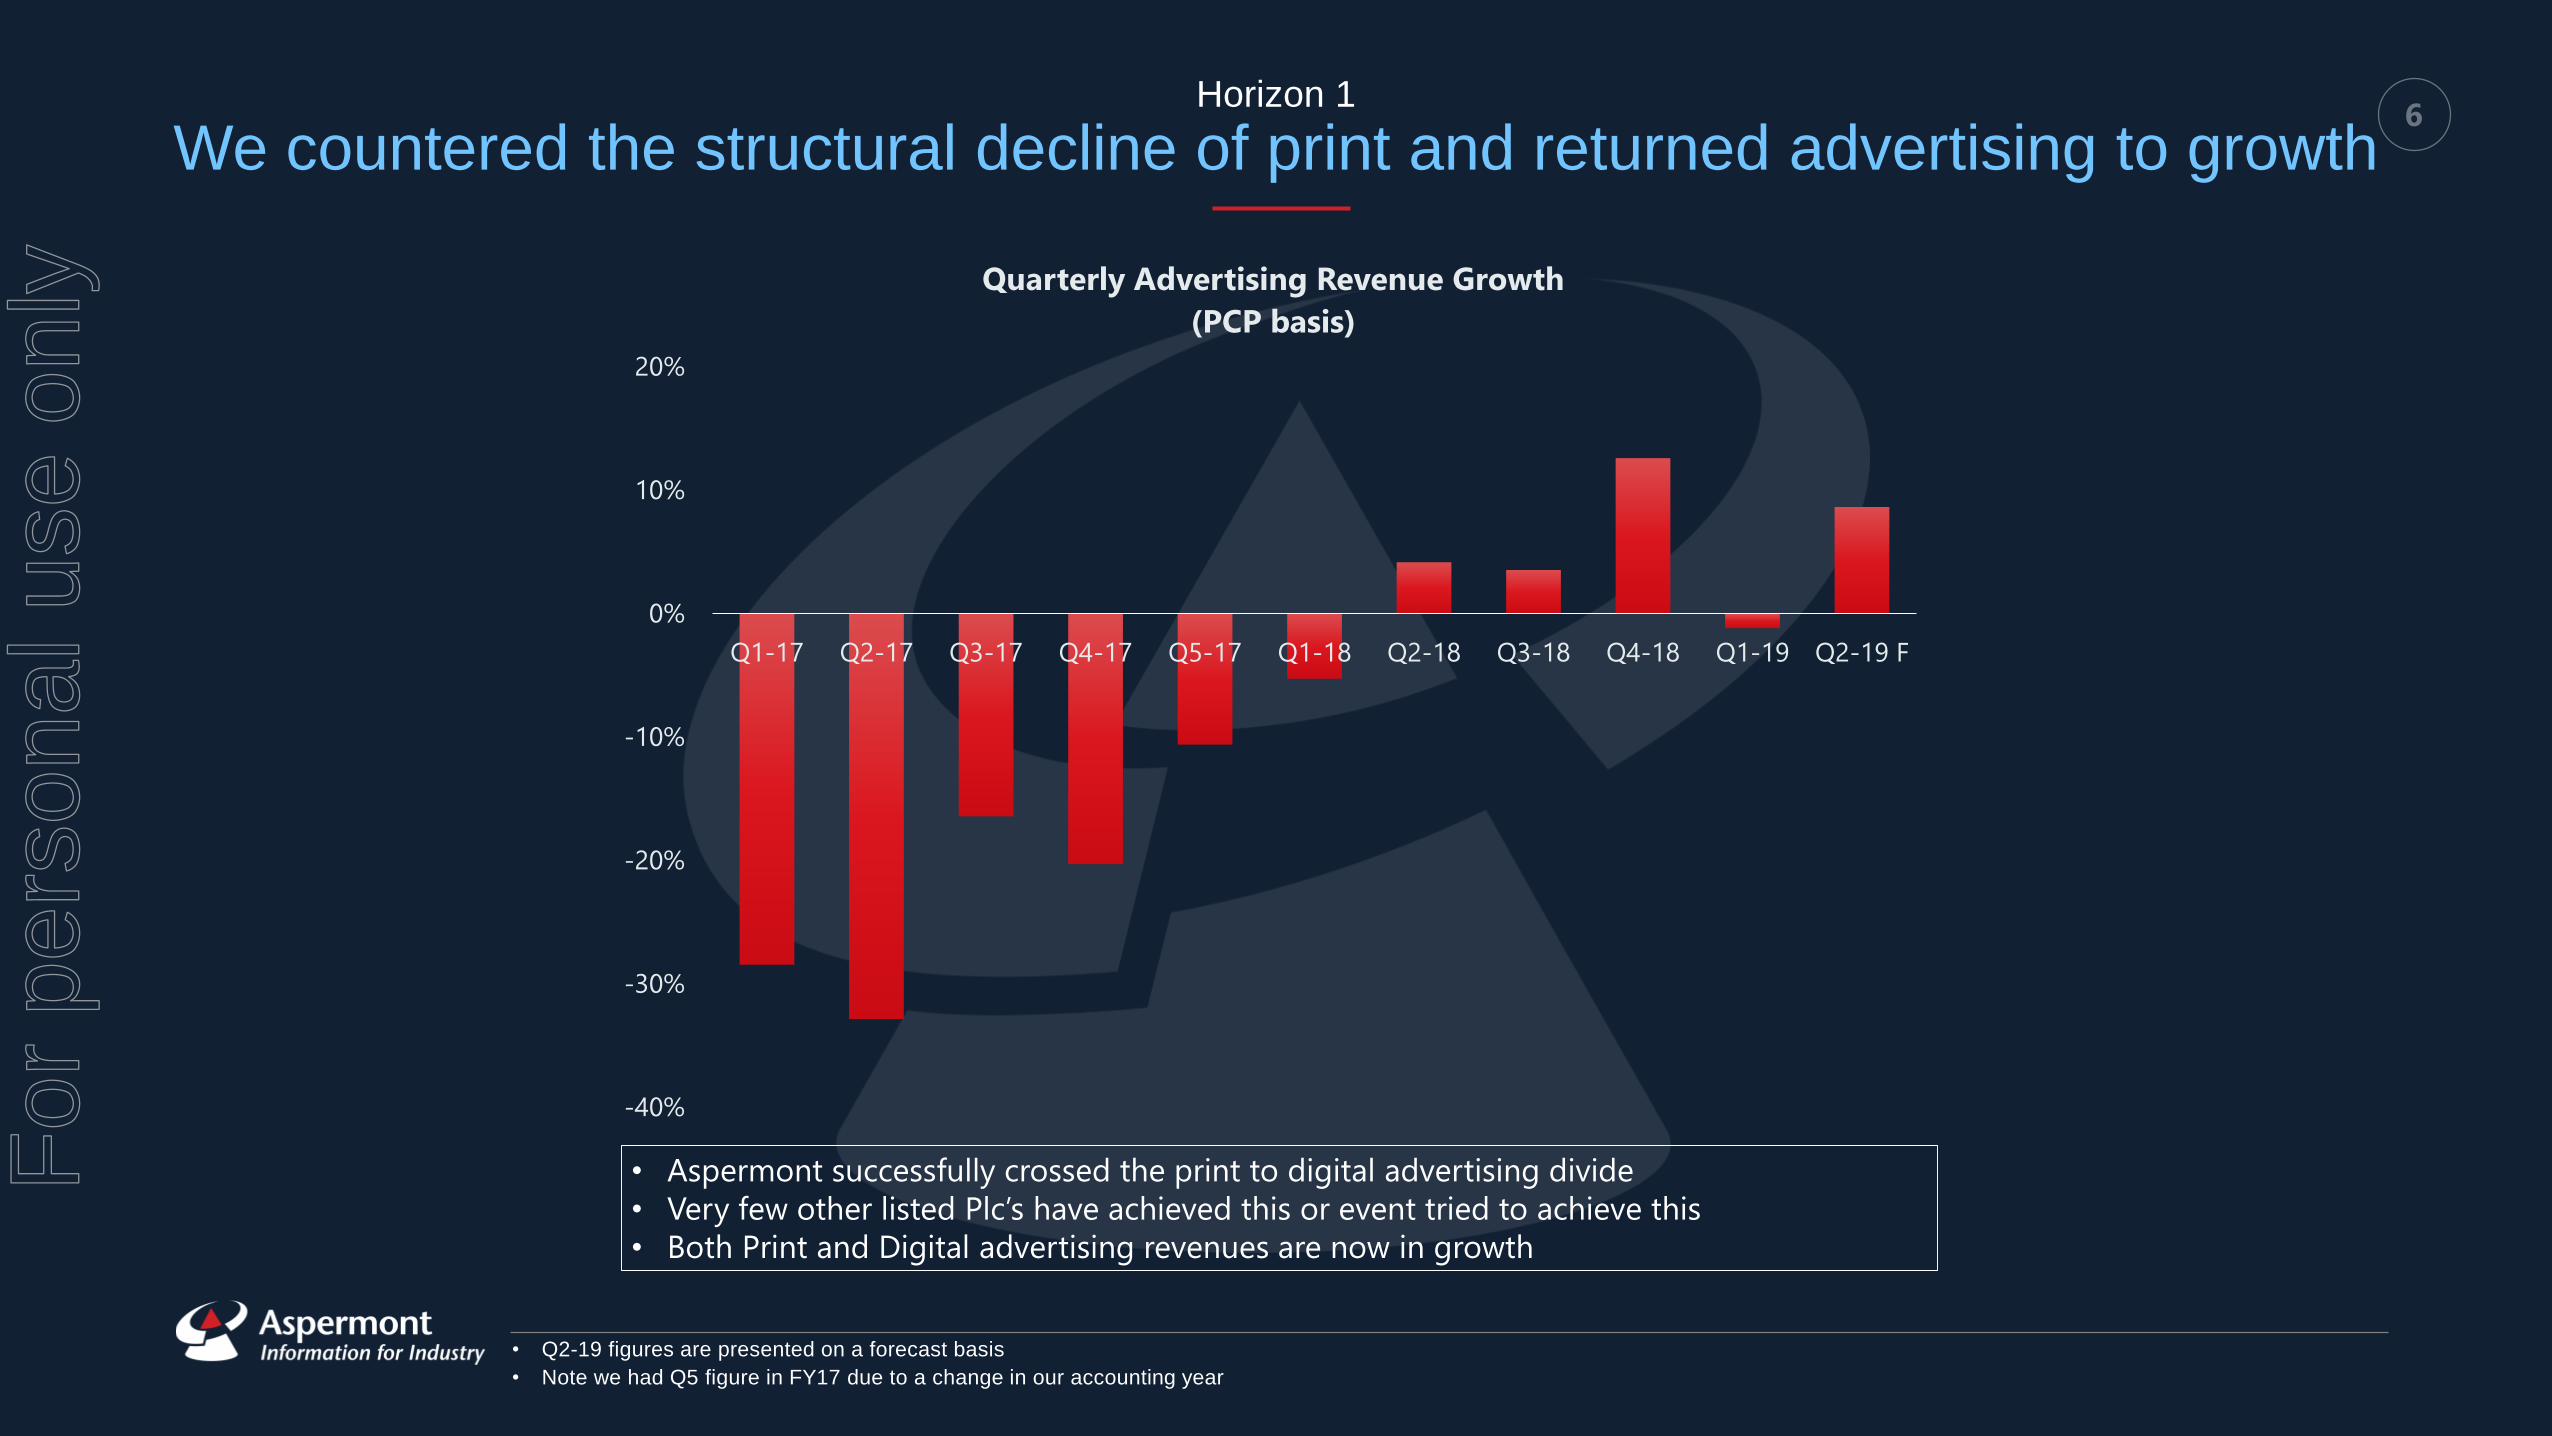
6Horizon 1
We countered the structural decline of print and returned advertising to growth
• Q2-19 figures are presented on a forecast basis
• Note we had Q5 figure in FY17 due to a change in our accounting year
• Aspermont successfully crossed the print to digital advertising divide
• Very few other listed Plc’s have achieved this or event tried to achieve this
• Both Print and Digital advertising revenues are now in growth
-40%
-30%
-20%
-10%
0%
10%
20%
Q1-17 Q2-17 Q3-17 Q4-17 Q5-17 Q1-18 Q2-18 Q3-18 Q4-18 Q1-19 Q2-19 F
Quarterly Advertising Revenue Growth
(PCP basis)
For
per
sona
l use
onl
y
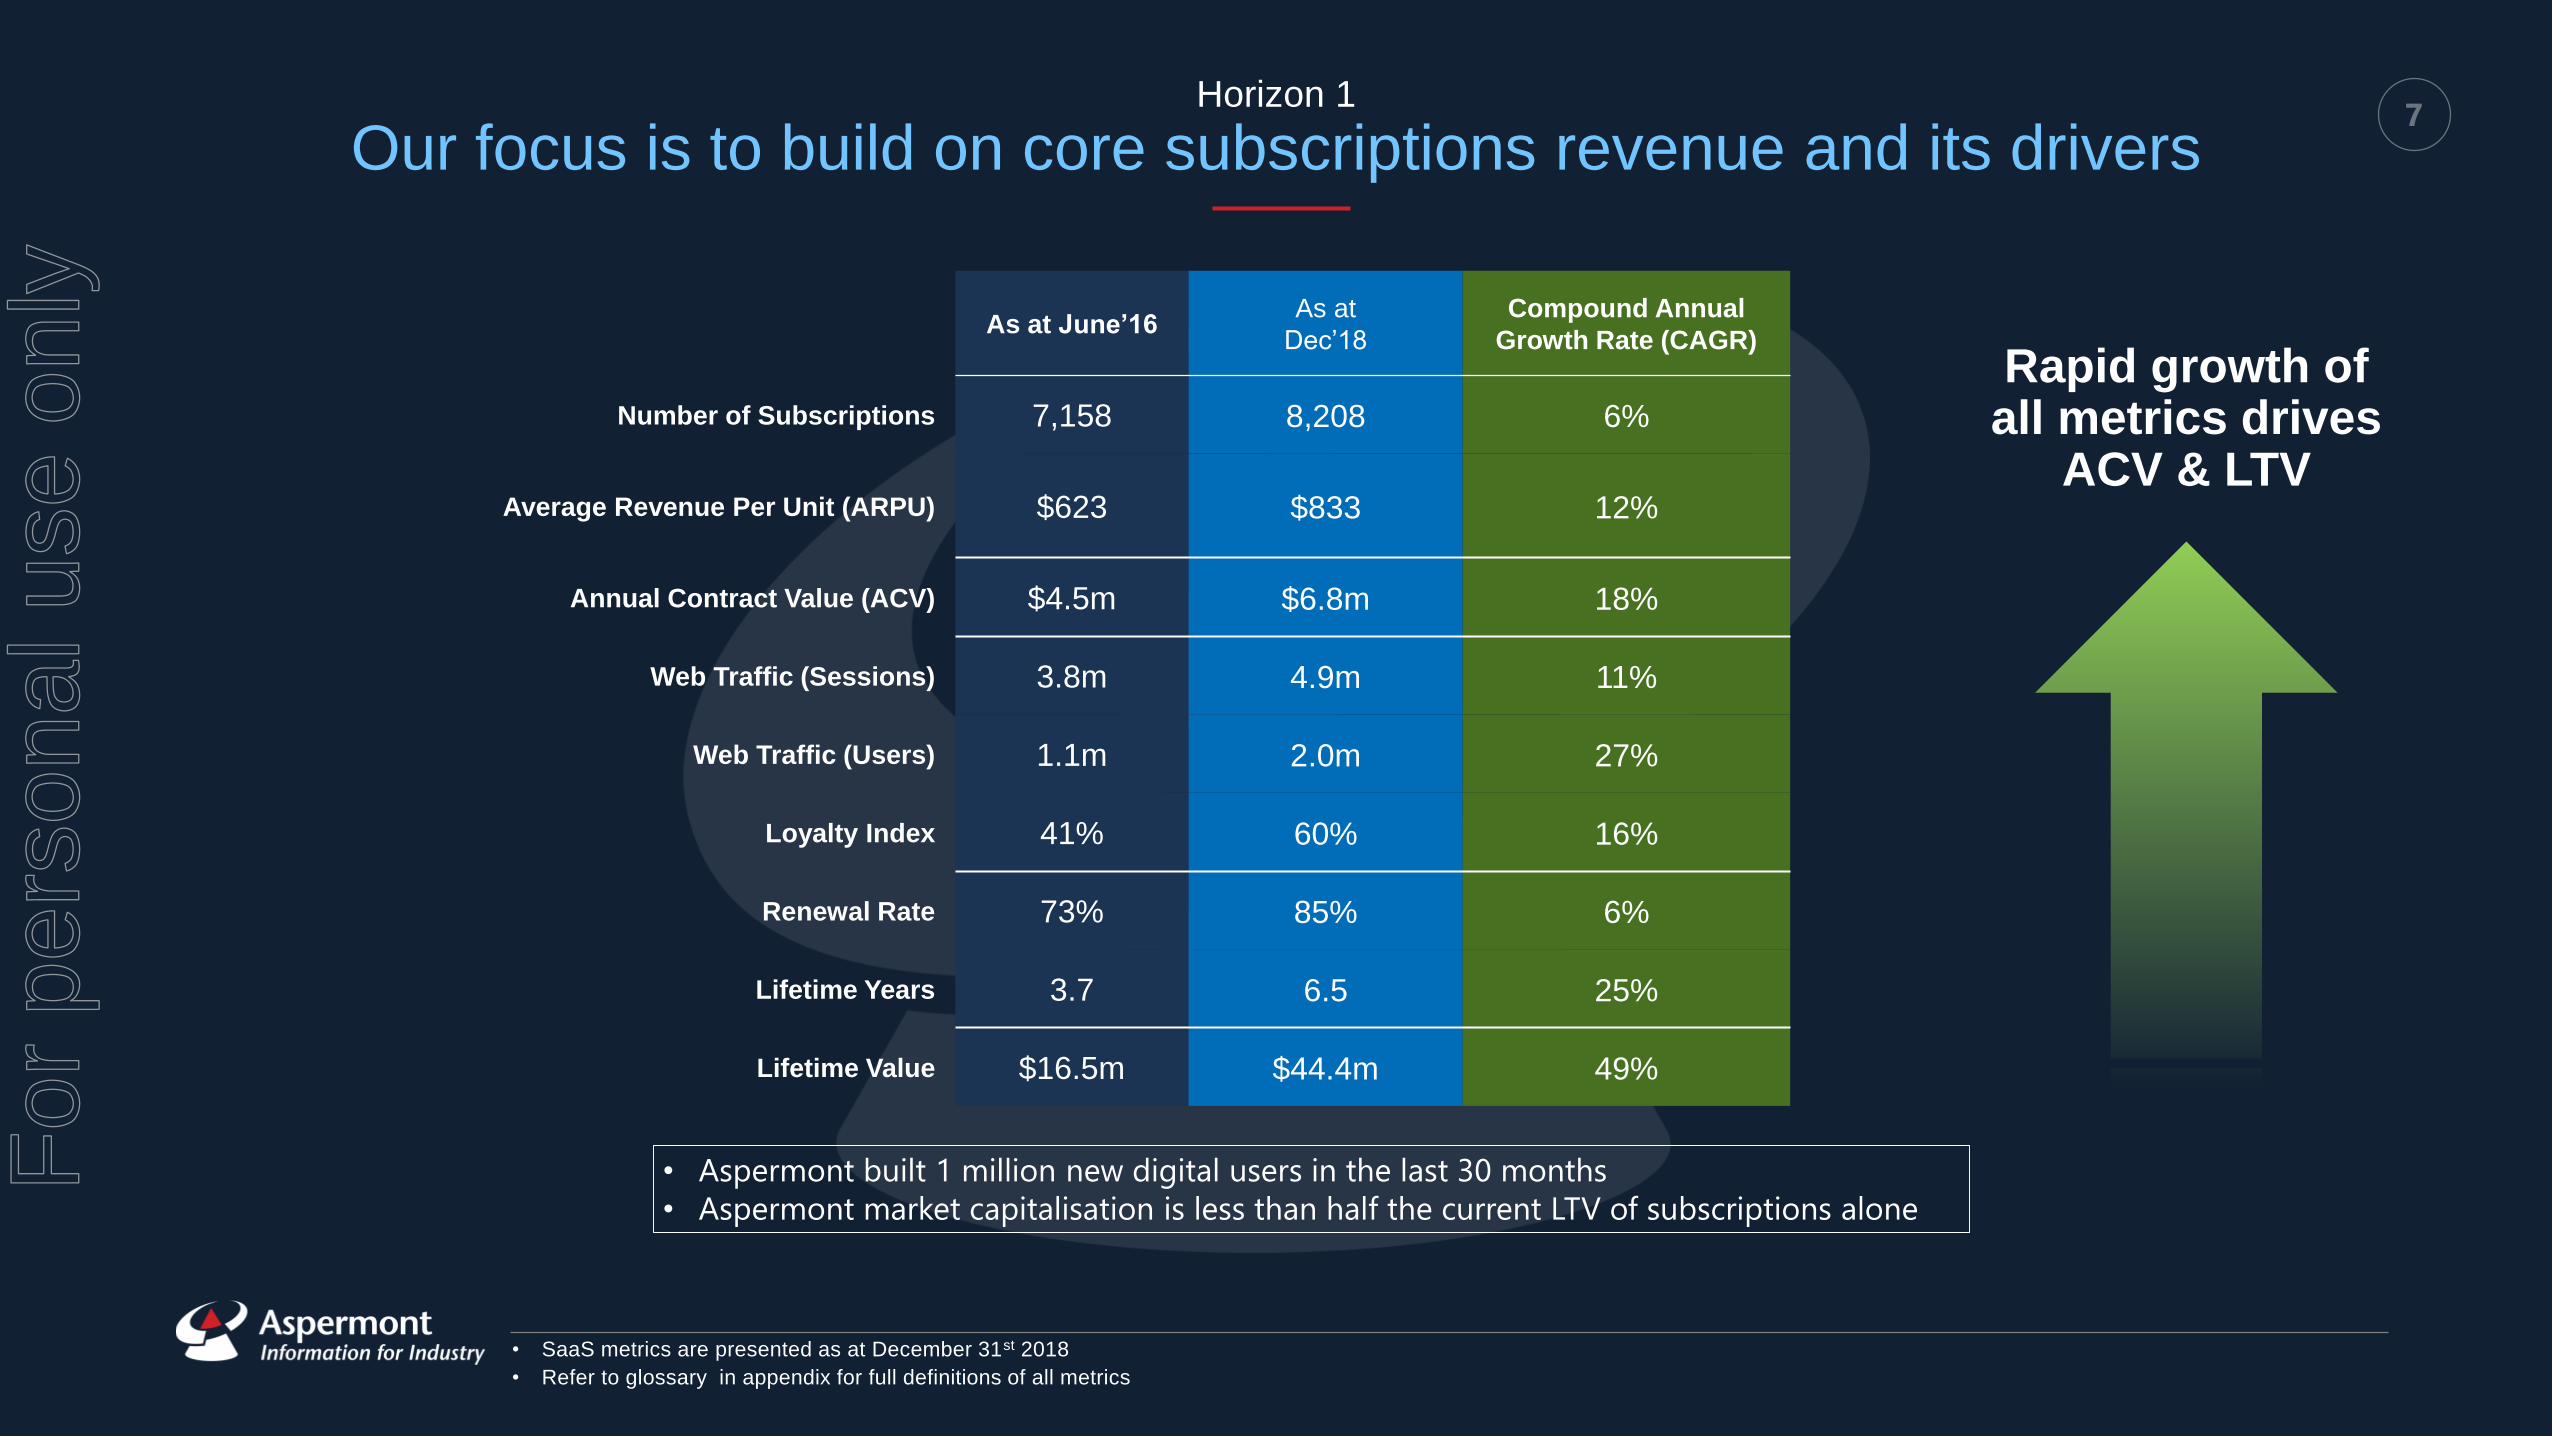
7Horizon 1
Our focus is to build on core subscriptions revenue and its drivers
As at June’16As at
Dec’18
Compound Annual
Growth Rate (CAGR)
Number of Subscriptions 7,158 8,208 6%
Average Revenue Per Unit (ARPU) $623 $833 12%
Annual Contract Value (ACV) $4.5m $6.8m 18%
Web Traffic (Sessions) 3.8m 4.9m 11%
Web Traffic (Users) 1.1m 2.0m 27%
Loyalty Index 41% 60% 16%
Renewal Rate 73% 85% 6%
Lifetime Years 3.7 6.5 25%
Lifetime Value $16.5m $44.4m 49%
Rapid growth of all metrics drives
ACV & LTV
• SaaS metrics are presented as at December 31st 2018
• Refer to glossary in appendix for full definitions of all metrics
• Aspermont built 1 million new digital users in the last 30 months
• Aspermont market capitalisation is less than half the current LTV of subscriptions alone
For
per
sona
l use
onl
y
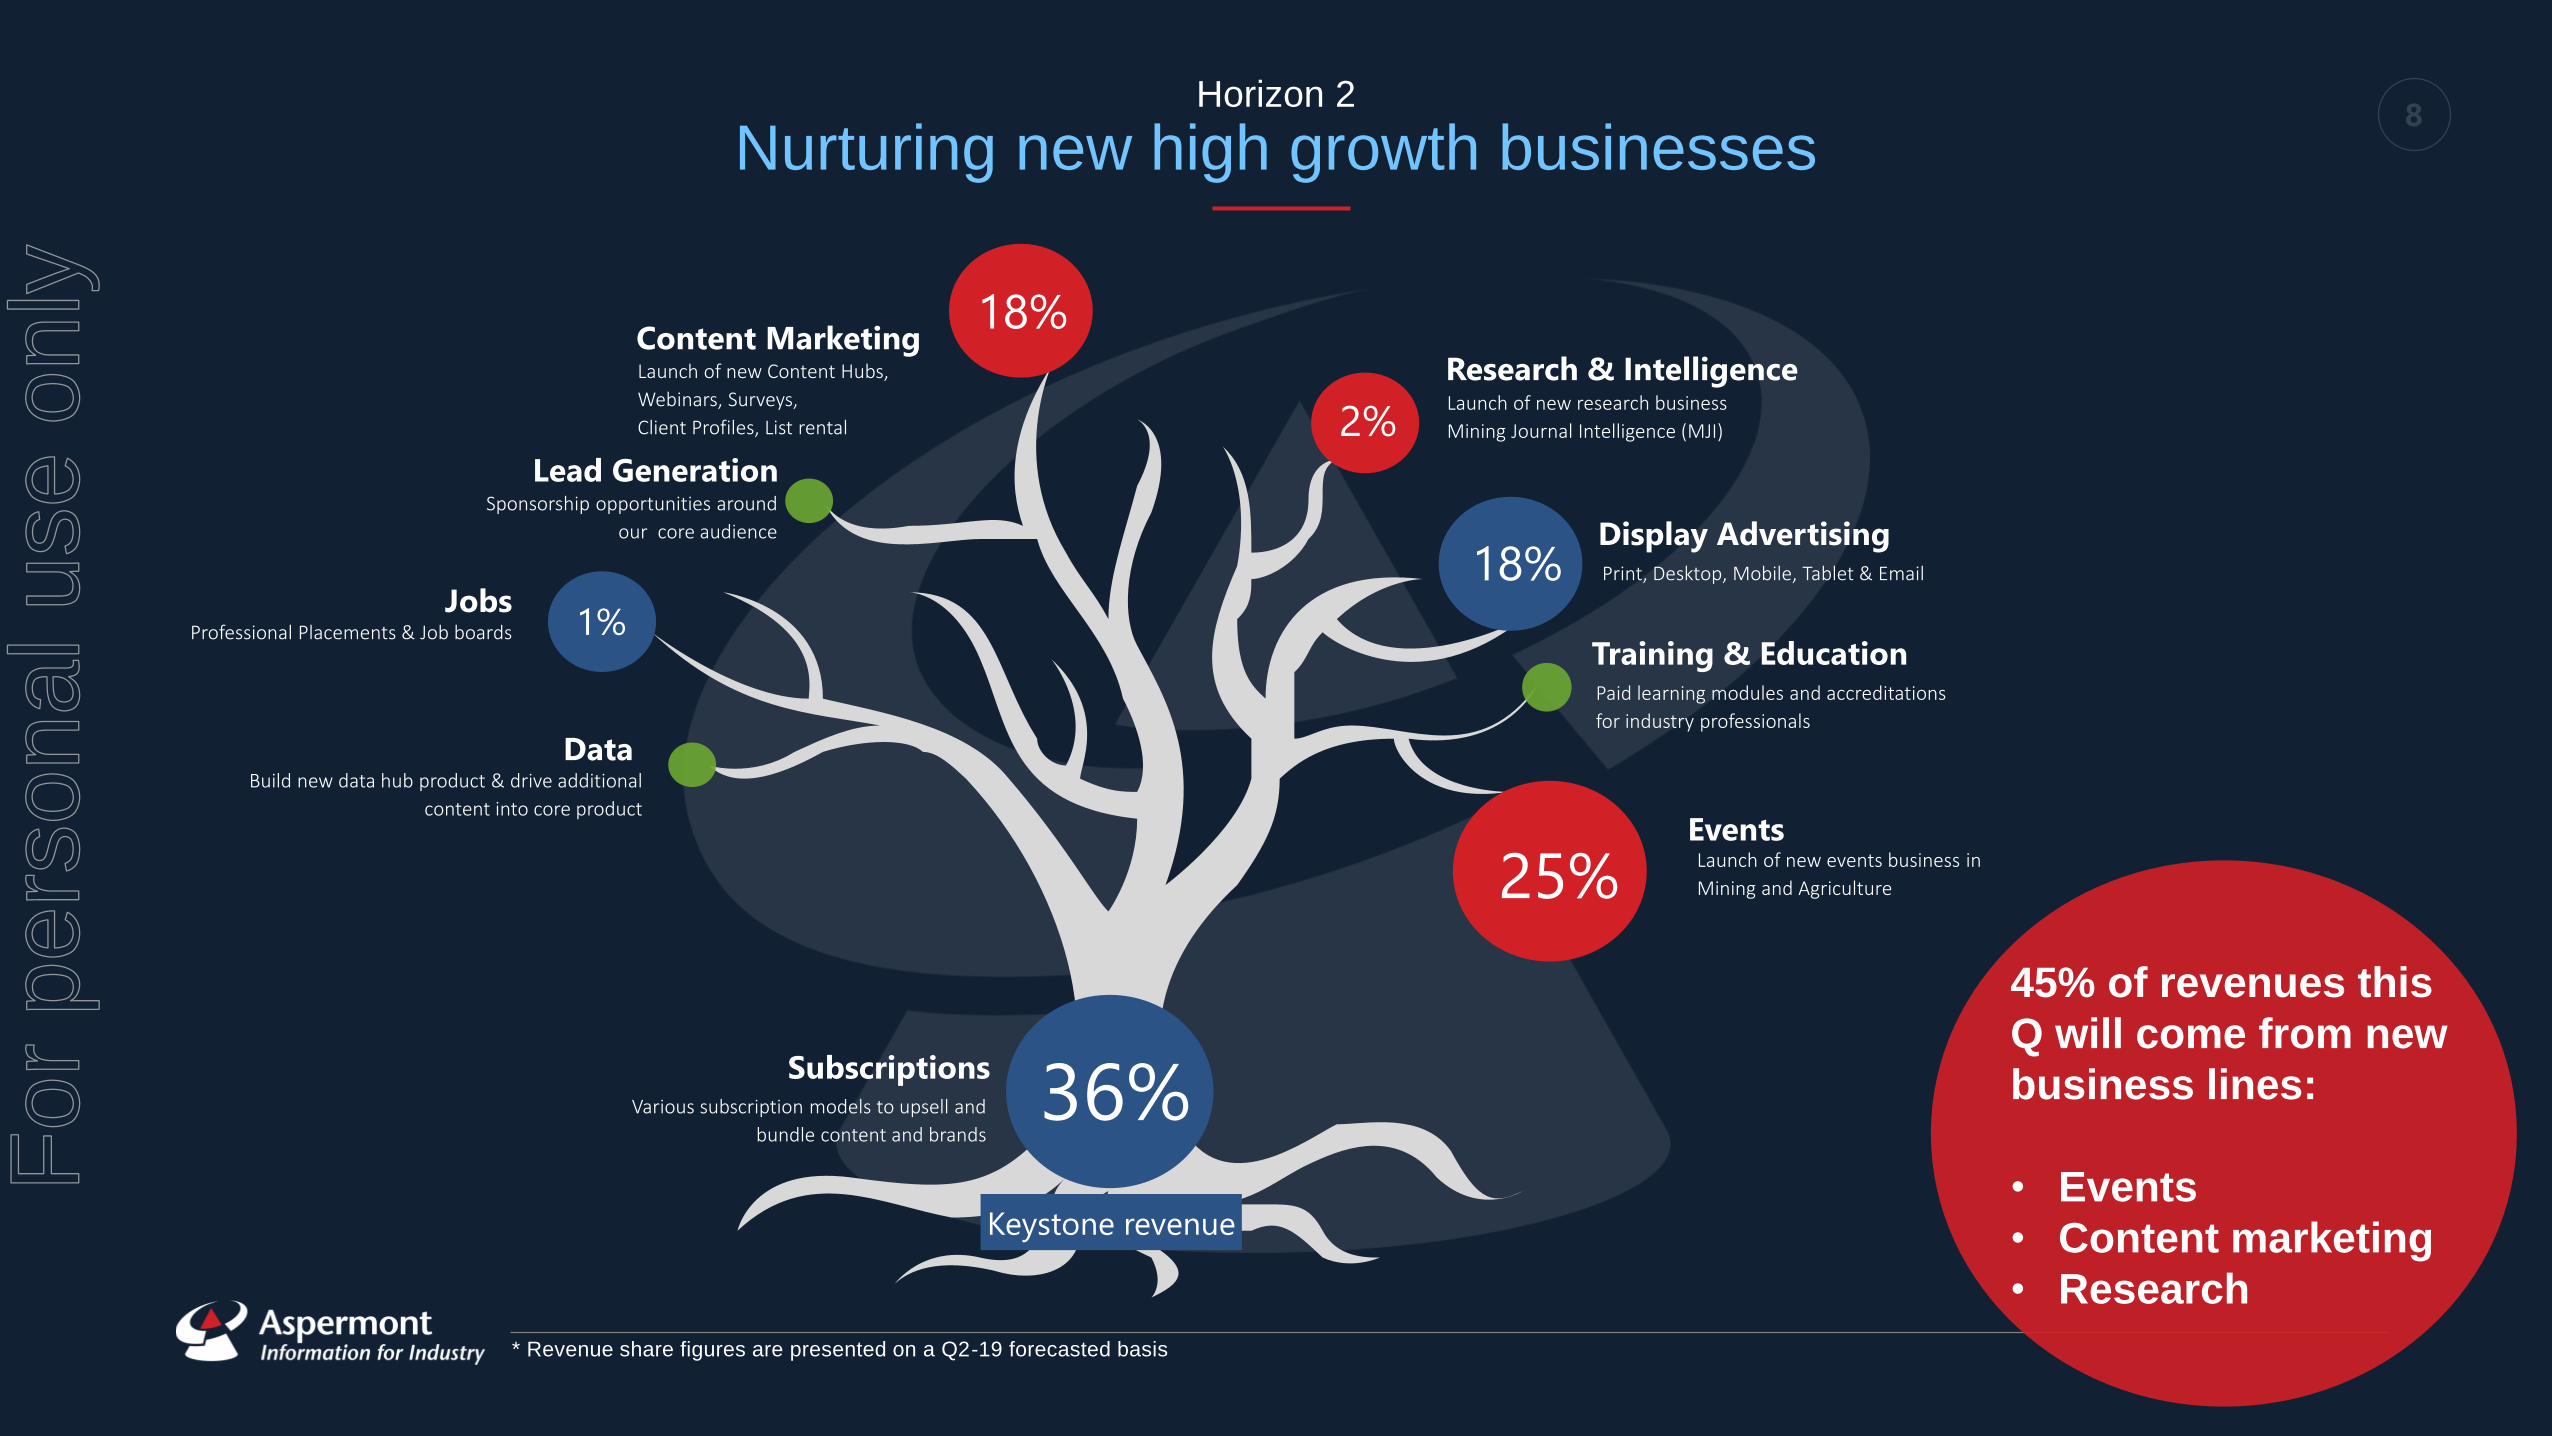
8Horizon 2
Nurturing new high growth businesses
45% of revenues this
Q will come from new
business lines:
• Events
• Content marketing
• Research
Content MarketingLaunch of new Content Hubs,
Webinars, Surveys,
Client Profiles, List rental
Research & IntelligenceLaunch of new research business
Mining Journal Intelligence (MJI)
Display AdvertisingPrint, Desktop, Mobile, Tablet & Email
SubscriptionsVarious subscription models to upsell and
bundle content and brands
2%
36%
18%
Events
DataBuild new data hub product & drive additional
content into core product
JobsProfessional Placements & Job boards 1%
Launch of new events business in
Mining and Agriculture25%
Keystone revenue
Training & EducationPaid learning modules and accreditations
for industry professionals
Lead GenerationSponsorship opportunities around
our core audience
18%
* Revenue share figures are presented on a Q2-19 forecasted basis
For
per
sona
l use
onl
y
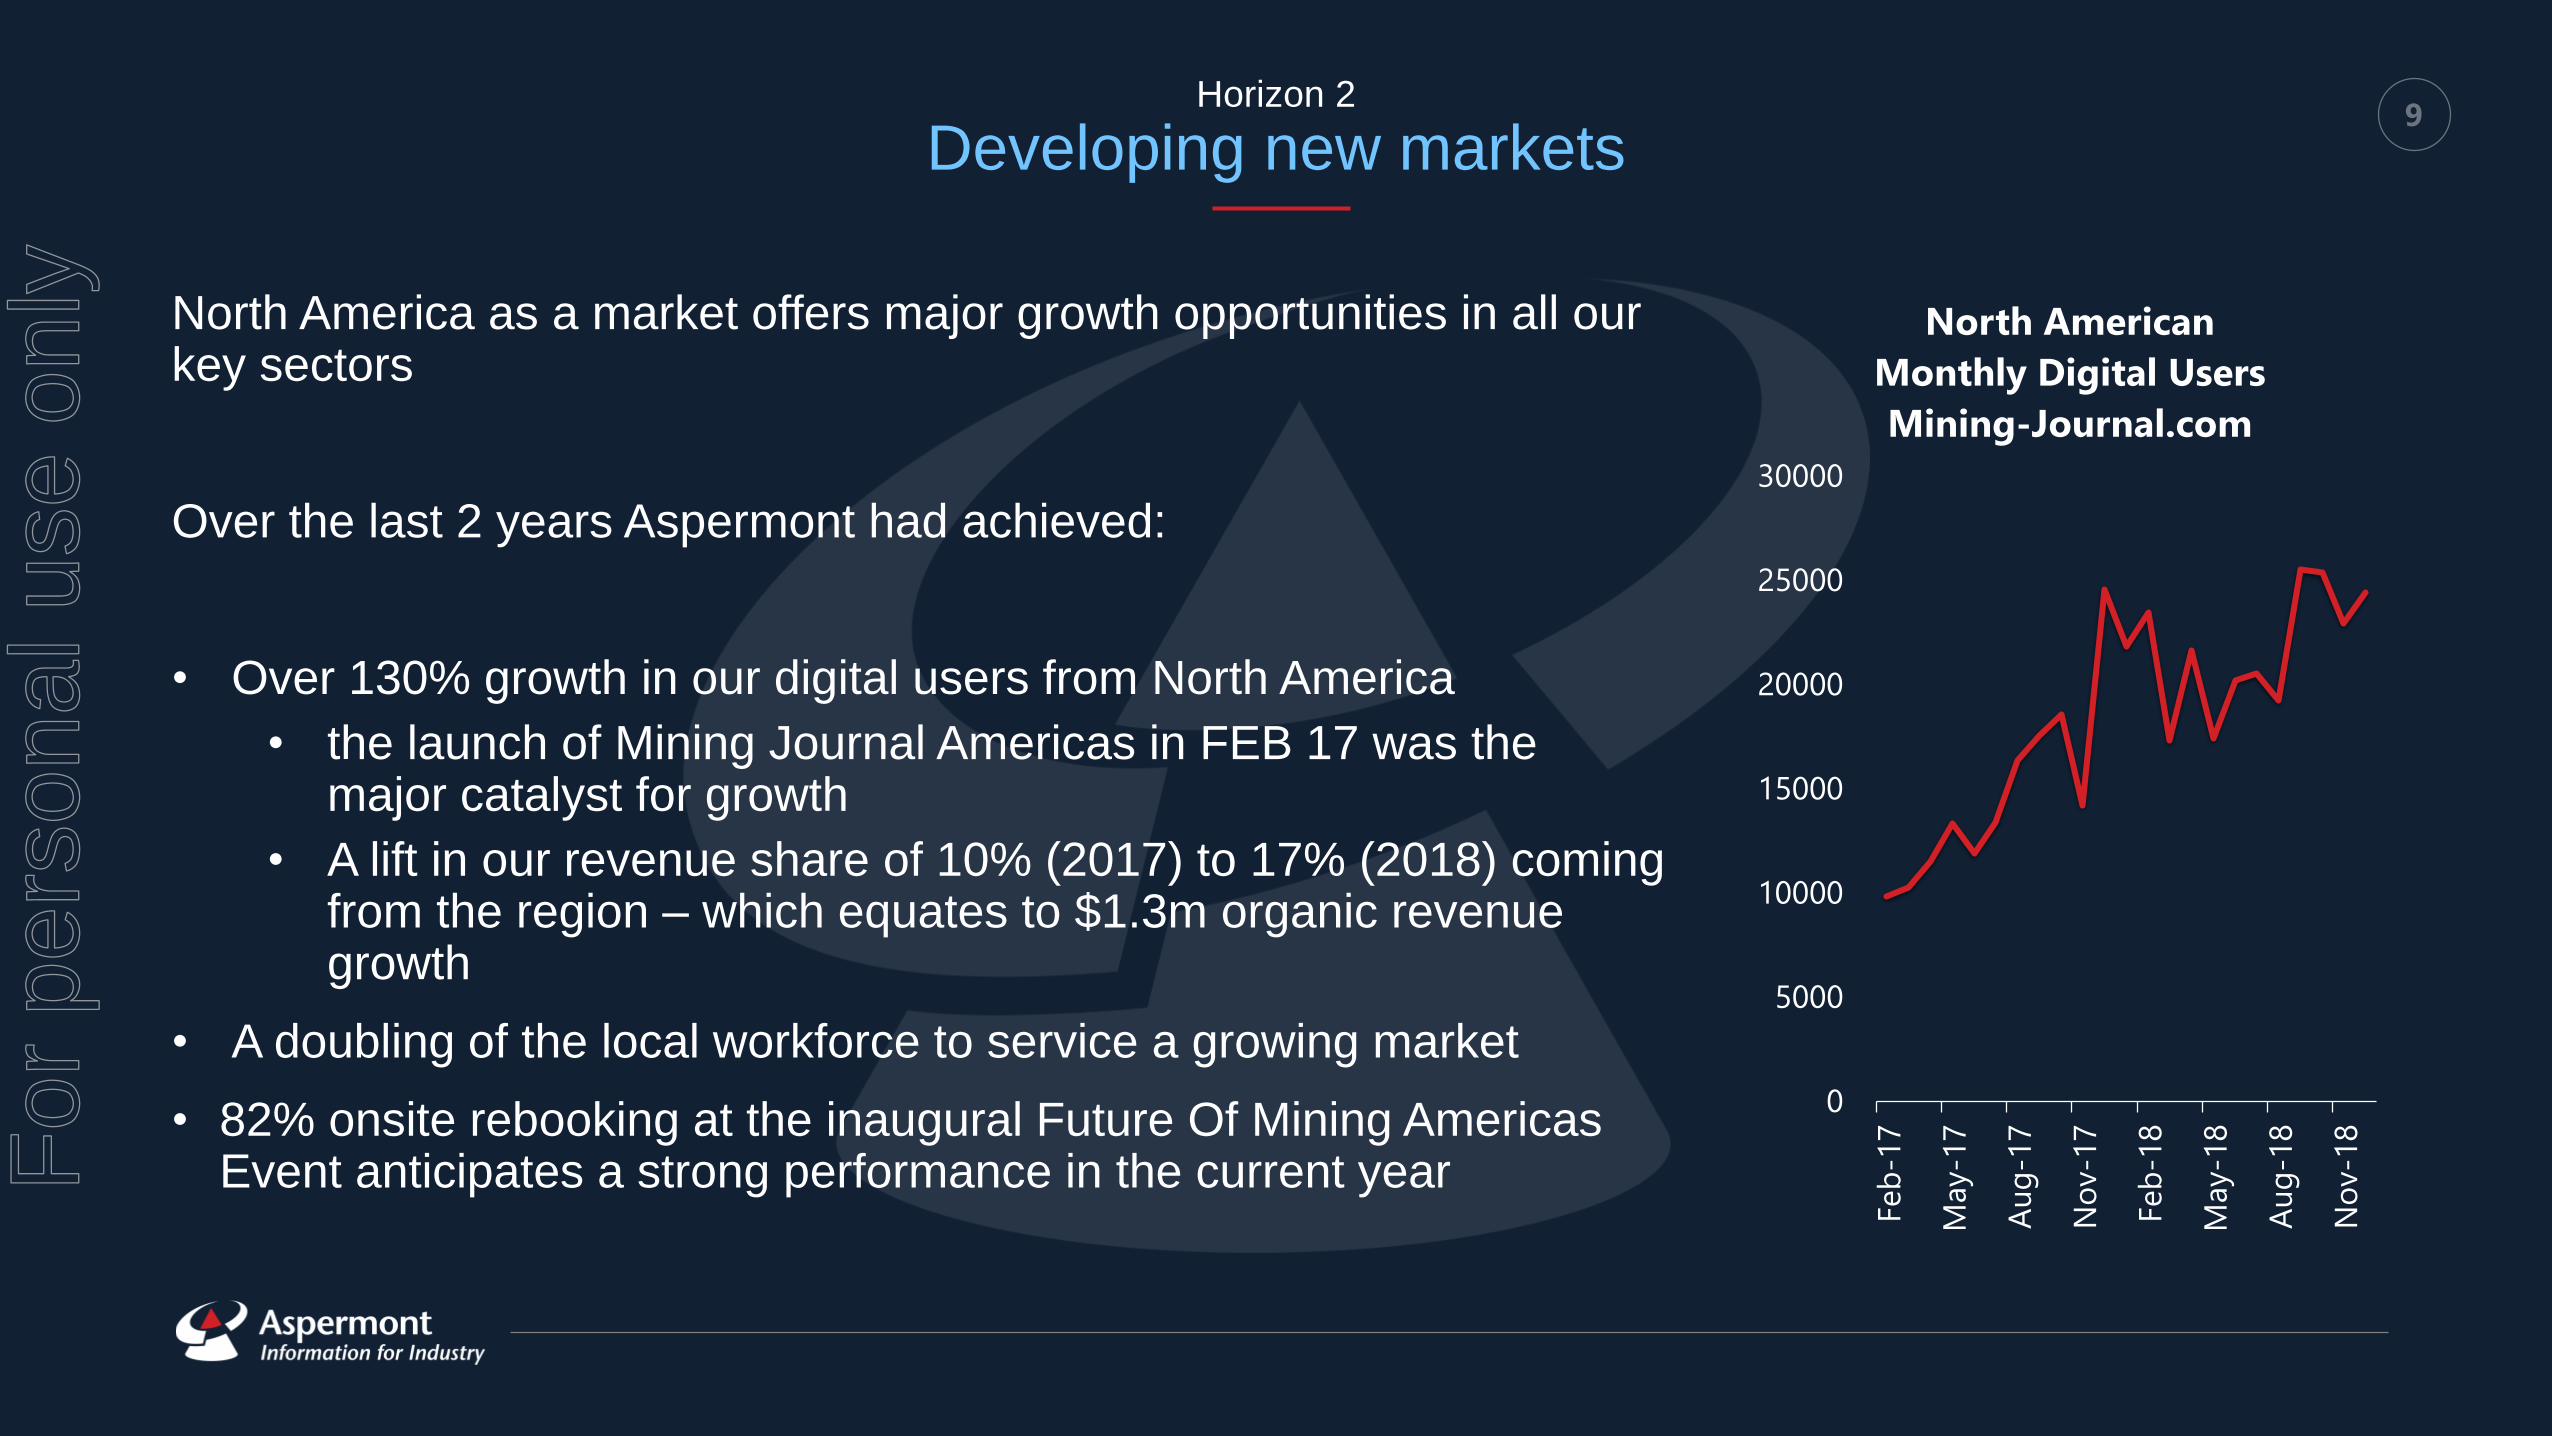
9Horizon 2
Developing new markets
North America as a market offers major growth opportunities in all our key sectors
Over the last 2 years Aspermont had achieved:
• Over 130% growth in our digital users from North America
• the launch of Mining Journal Americas in FEB 17 was the major catalyst for growth
• A lift in our revenue share of 10% (2017) to 17% (2018) coming from the region – which equates to $1.3m organic revenue growth
• A doubling of the local workforce to service a growing market
• 82% onsite rebooking at the inaugural Future Of Mining Americas Event anticipates a strong performance in the current year
0
5000
10000
15000
20000
25000
30000
Feb
-17
May-1
7
Au
g-1
7
No
v-1
7
Feb
-18
May-1
8
Au
g-1
8
No
v-1
8
North American
Monthly Digital Users
Mining-Journal.com
For
per
sona
l use
onl
y
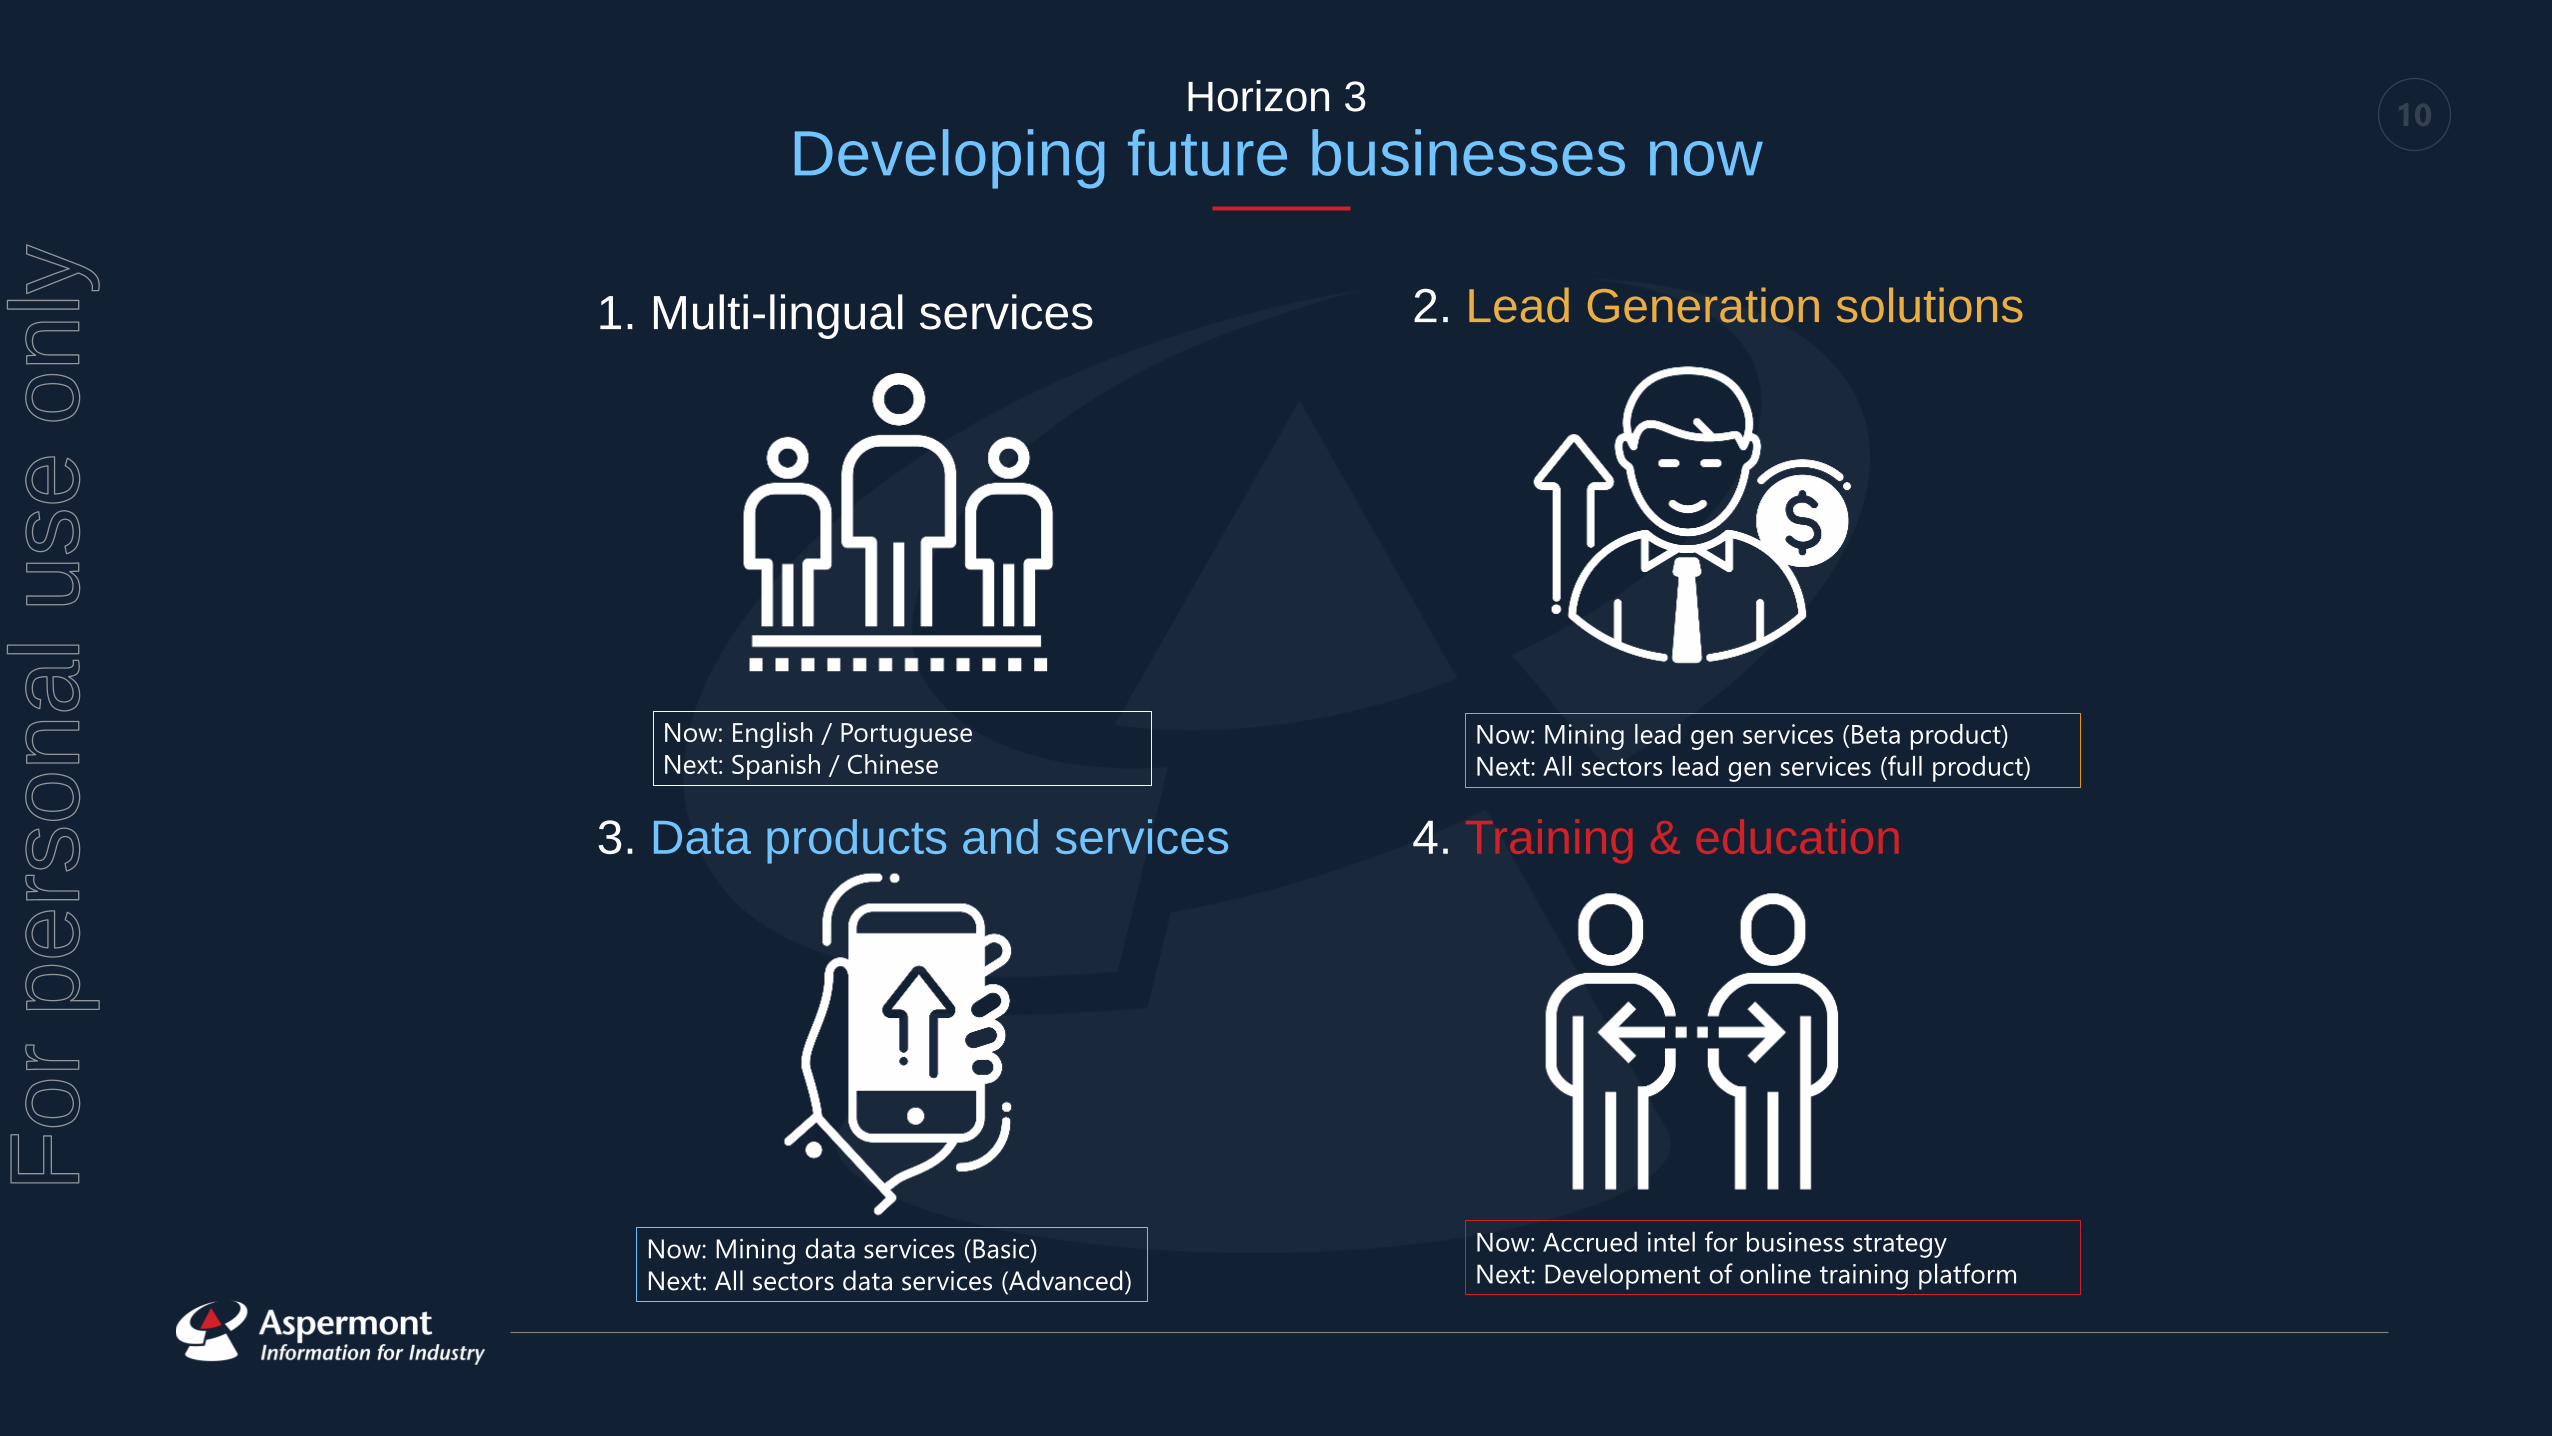
10Horizon 3
Developing future businesses now
1. Multi-lingual services
4. Training & education
2. Lead Generation solutions
3. Data products and services
Now: English / Portuguese
Next: Spanish / Chinese
Now: Mining data services (Basic)
Next: All sectors data services (Advanced)
Now: Mining lead gen services (Beta product)
Next: All sectors lead gen services (full product)
Now: Accrued intel for business strategy
Next: Development of online training platform
For
per
sona
l use
onl
y
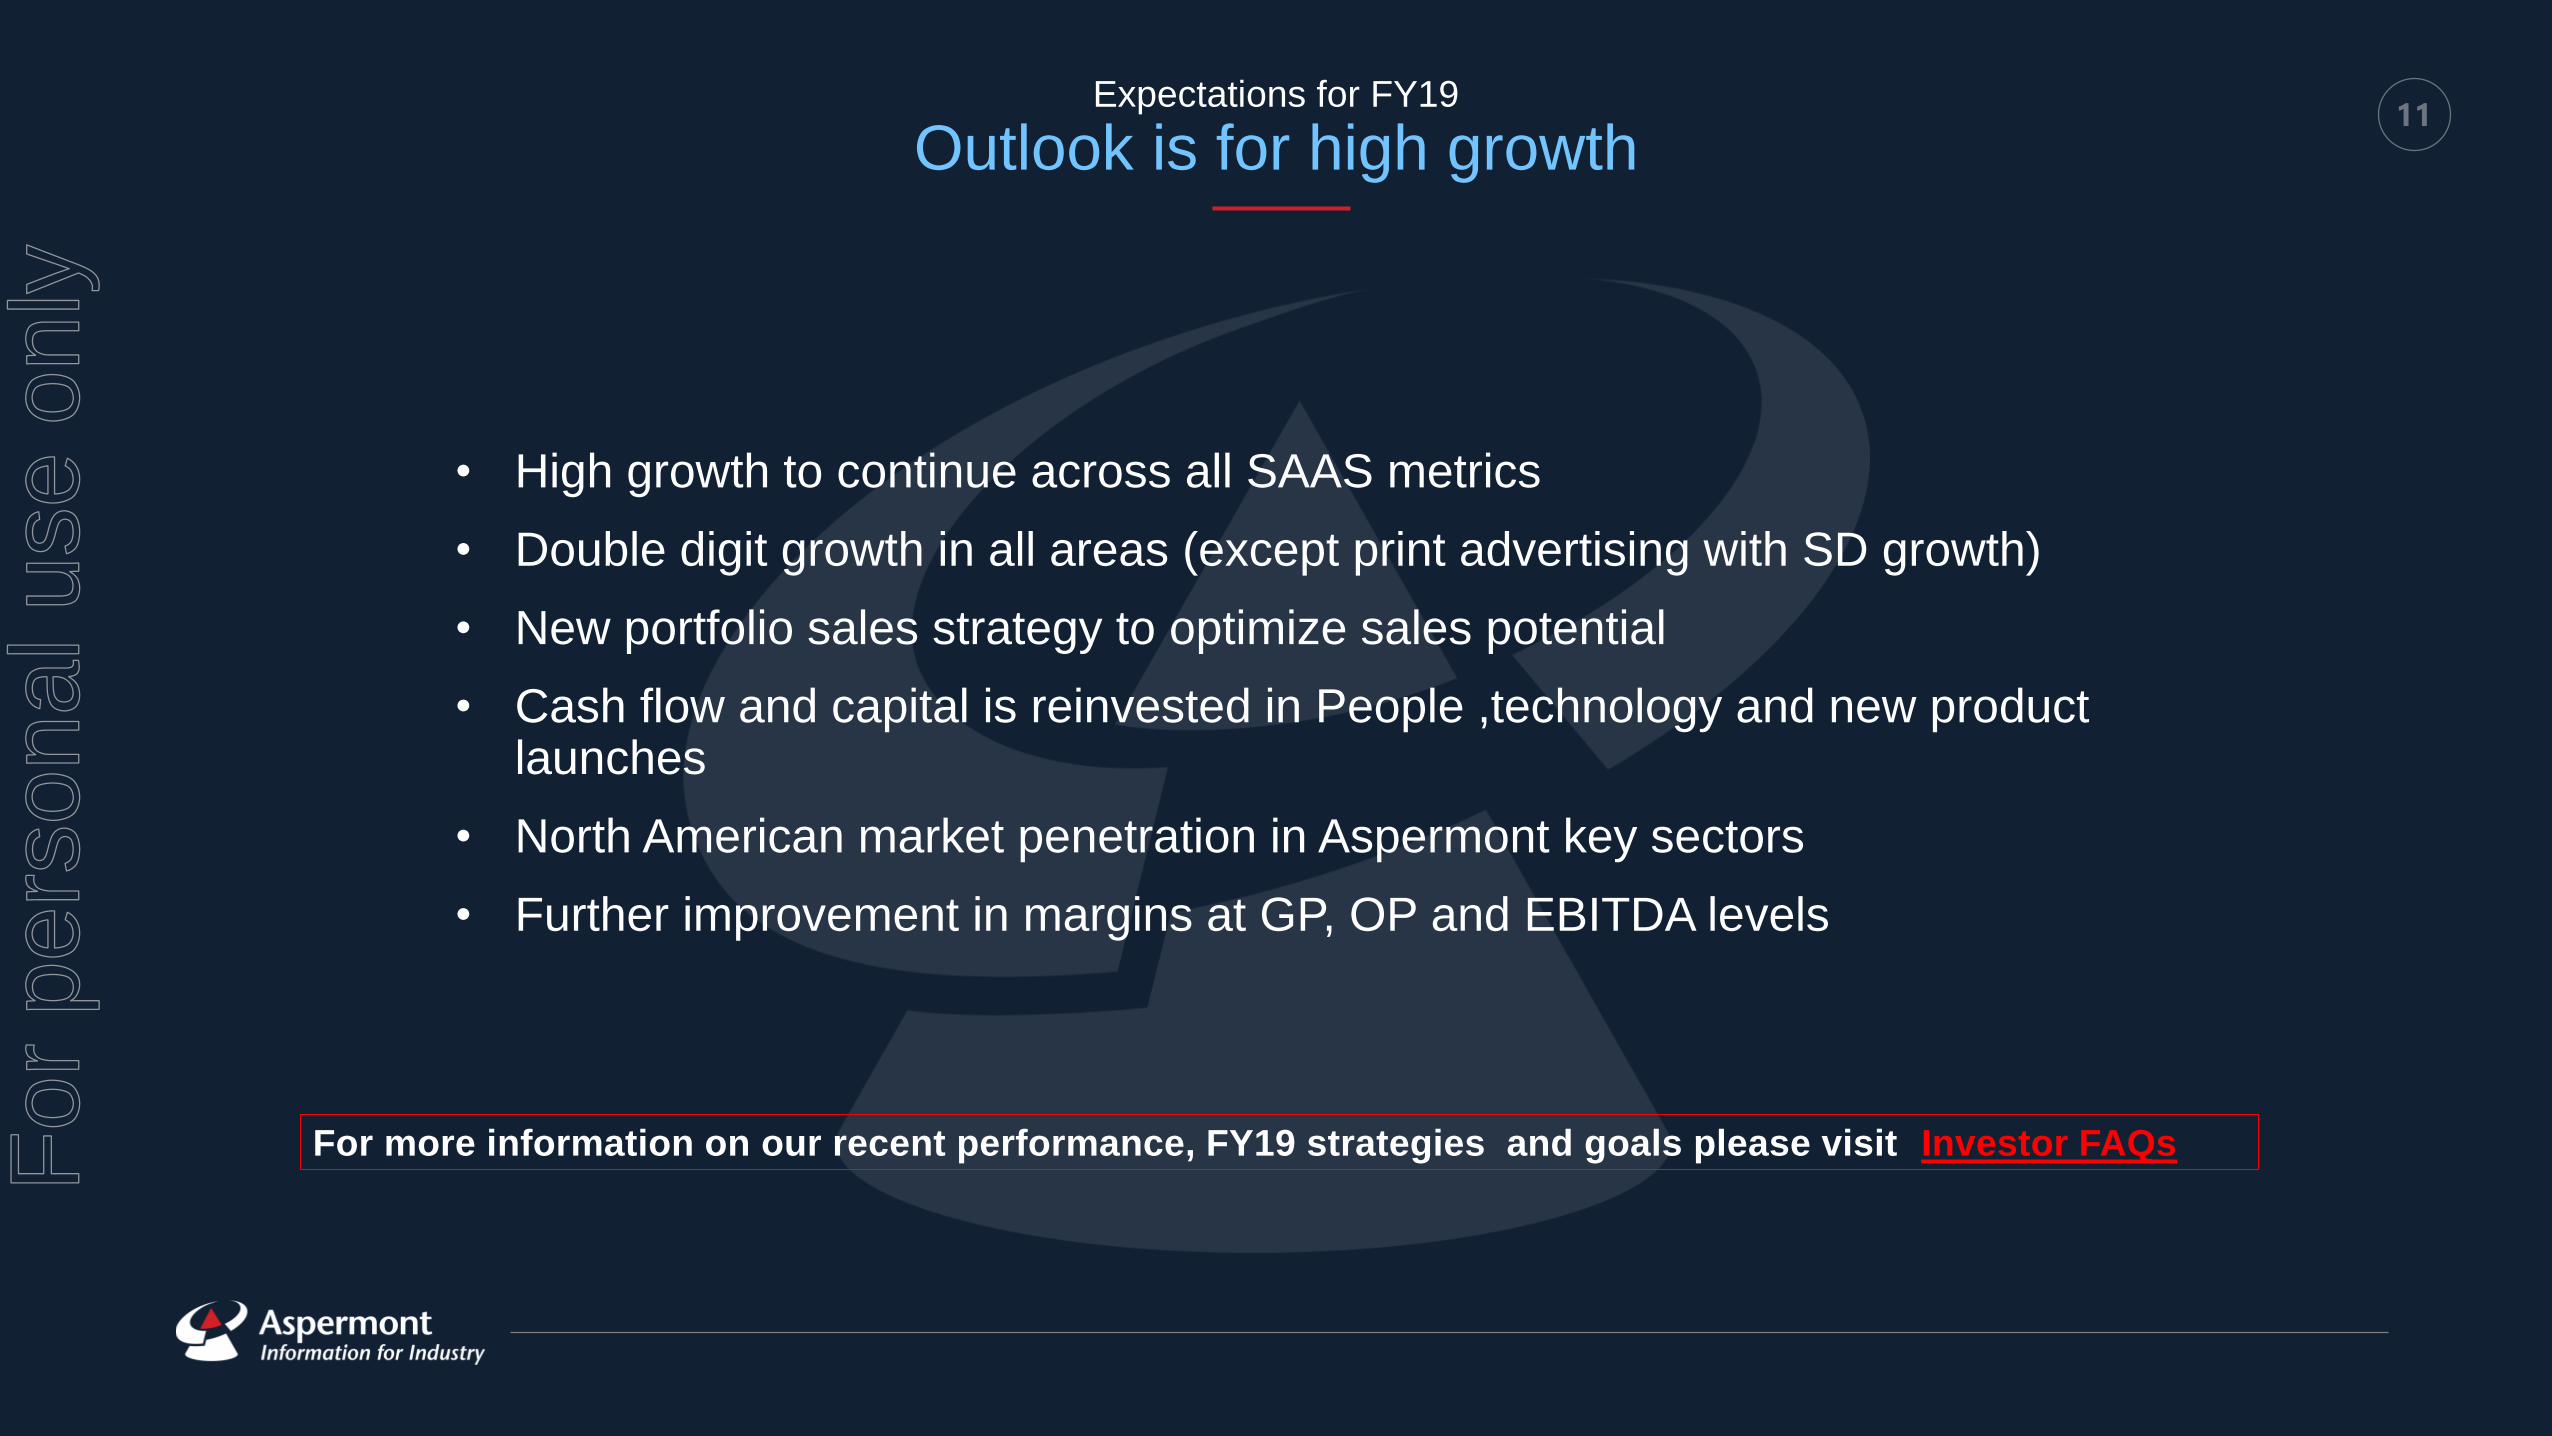
11Expectations for FY19
Outlook is for high growth
• High growth to continue across all SAAS metrics
• Double digit growth in all areas (except print advertising with SD growth)
• New portfolio sales strategy to optimize sales potential
• Cash flow and capital is reinvested in People ,technology and new product launches
• North American market penetration in Aspermont key sectors
• Further improvement in margins at GP, OP and EBITDA levels
For more information on our recent performance, FY19 strategies and goals please visit Investor FAQsFor
per
sona
l use
onl
y
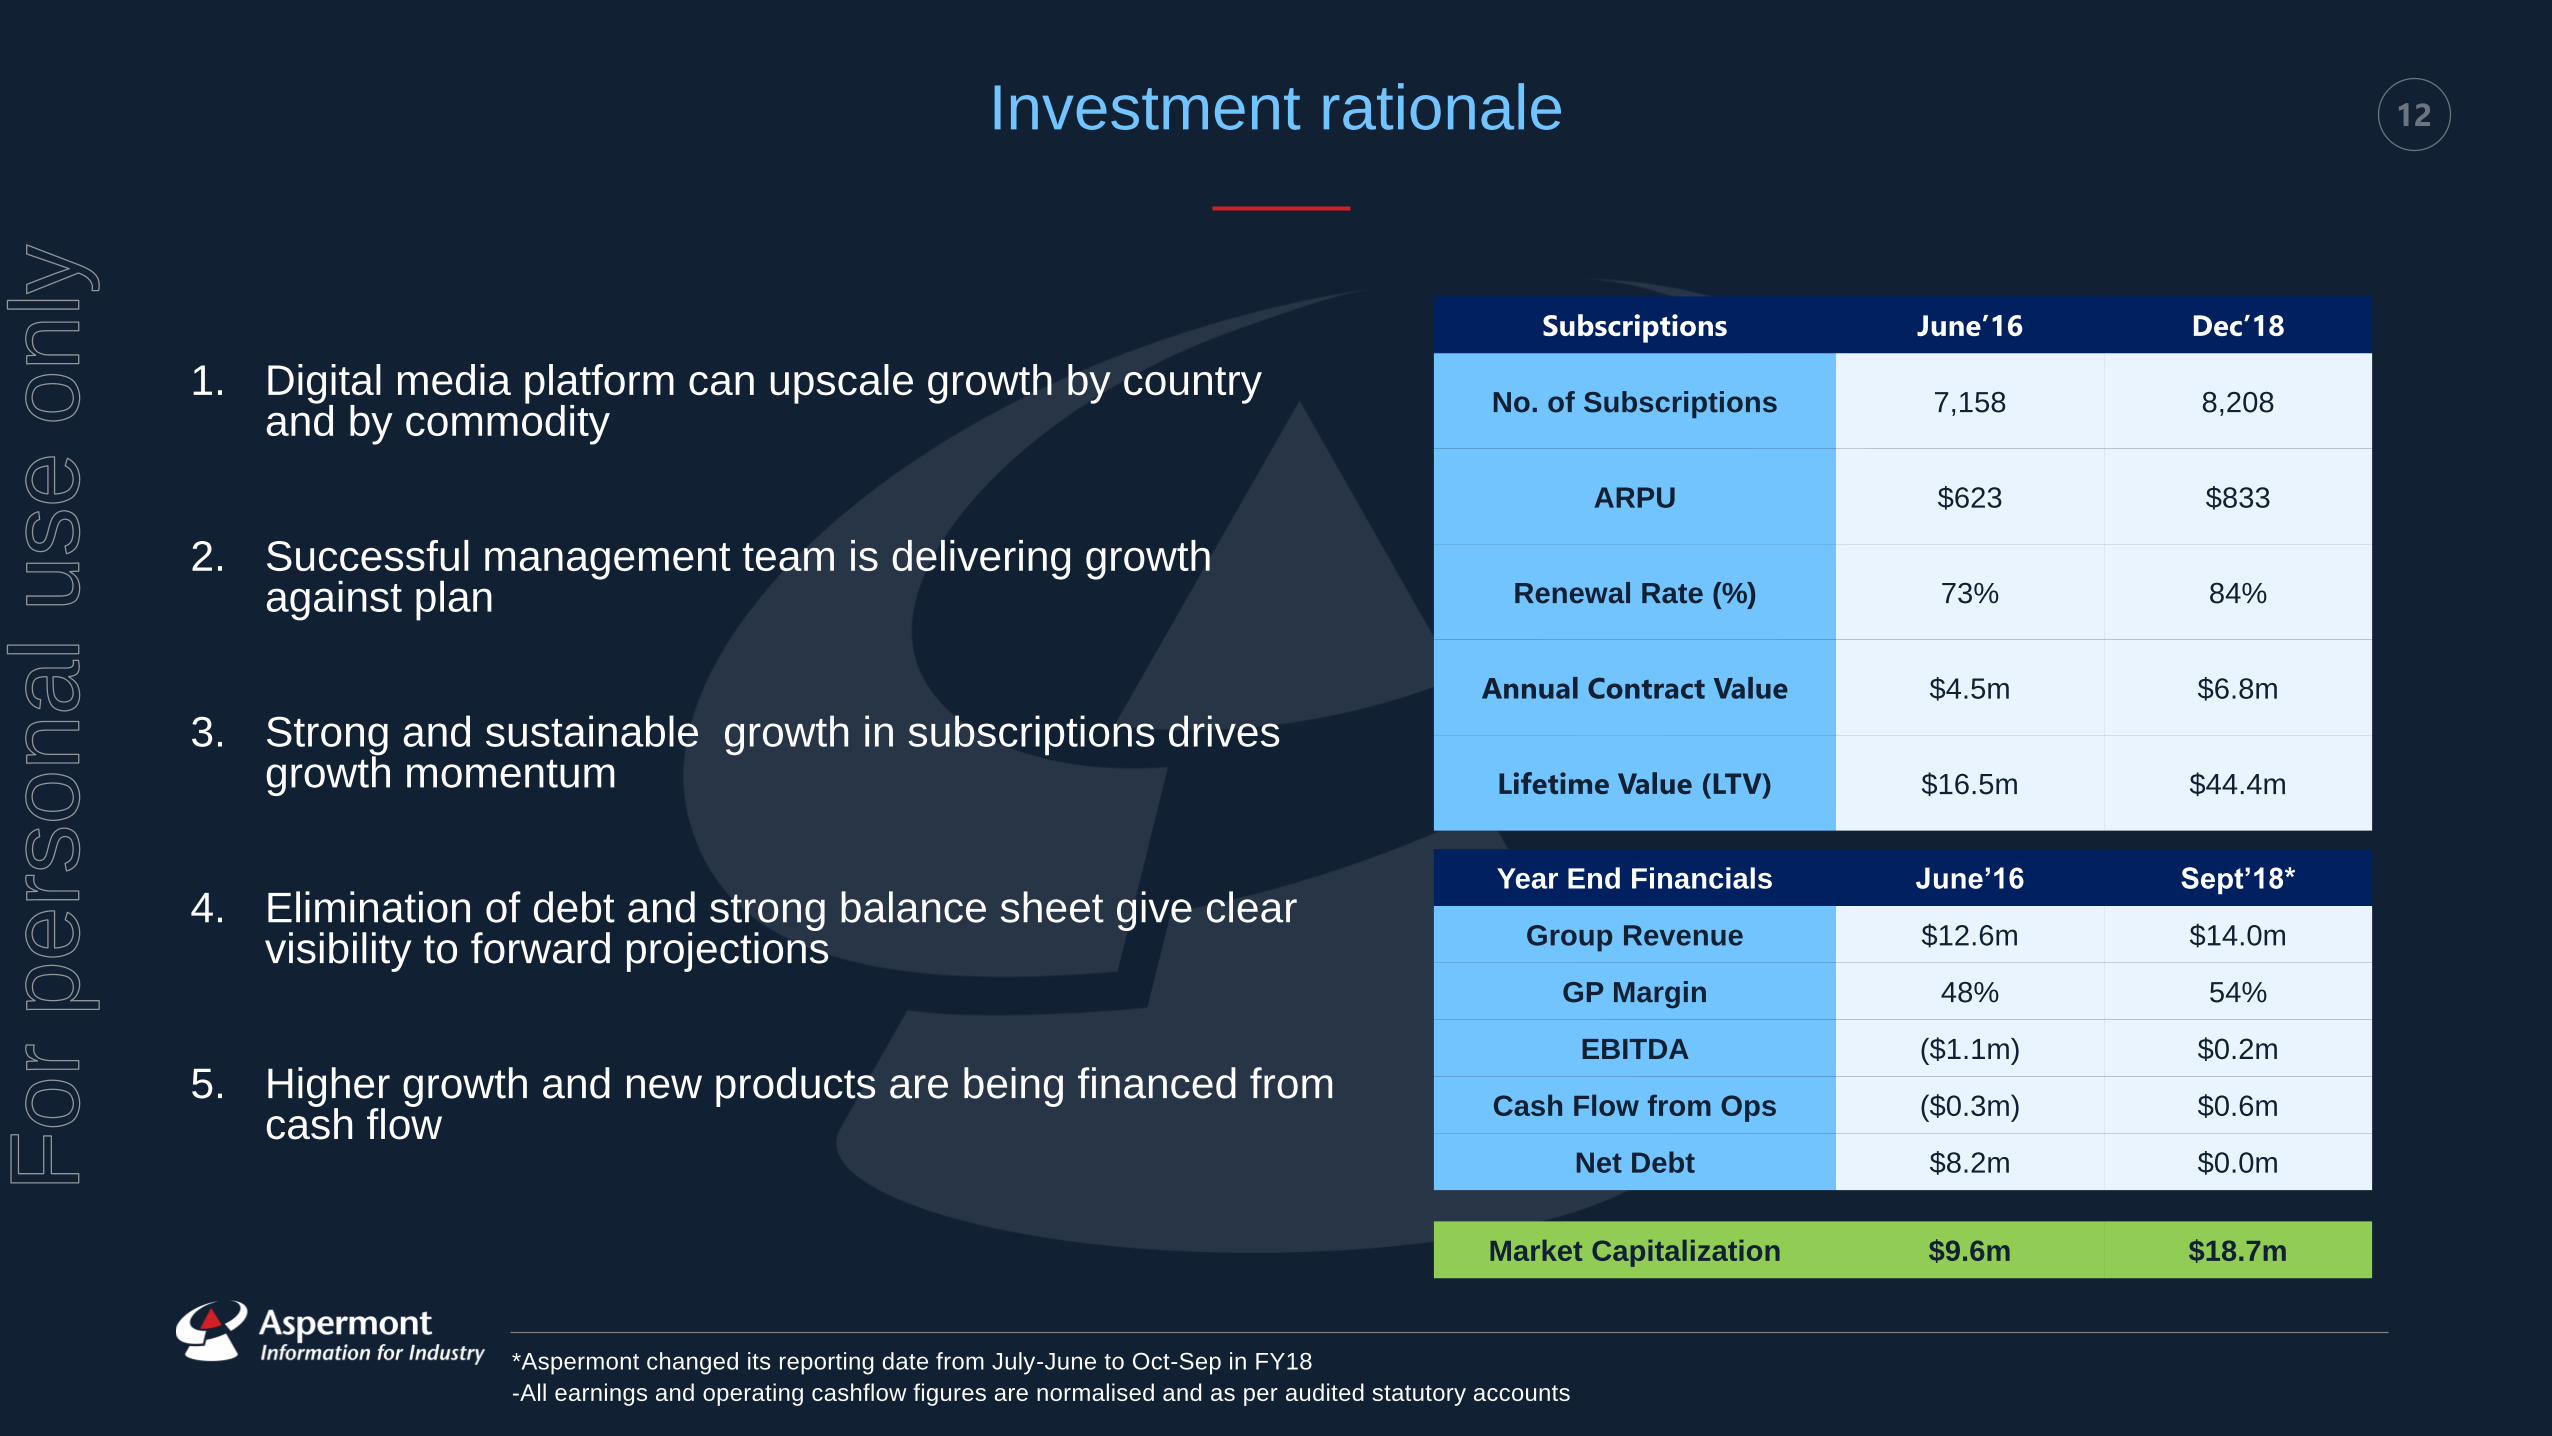
12Investment rationale
1. Digital media platform can upscale growth by country and by commodity
2. Successful management team is delivering growth against plan
3. Strong and sustainable growth in subscriptions drives growth momentum
4. Elimination of debt and strong balance sheet give clear visibility to forward projections
5. Higher growth and new products are being financed from cash flow
Subscriptions June’16 Dec’18
No. of Subscriptions 7,158 8,208
ARPU $623 $833
Renewal Rate (%) 73% 84%
Annual Contract Value $4.5m $6.8m
Lifetime Value (LTV) $16.5m $44.4m
*Aspermont changed its reporting date from July-June to Oct-Sep in FY18
-All earnings and operating cashflow figures are normalised and as per audited statutory accounts
Year End Financials June’16 Sept’18*
Group Revenue $12.6m $14.0m
GP Margin 48% 54%
EBITDA ($1.1m) $0.2m
Cash Flow from Ops ($0.3m) $0.6m
Net Debt $8.2m $0.0m
Market Capitalization $9.6m $18.7m
For
per
sona
l use
onl
y
13
For further information
Aspermont
613-619 Wellington Street
Perth
Western Australia, 6000
Email: [email protected]
Office Phone: +61 8 6263 9100
AUS Address
Contact Info
Telephone
Aspermont Media
No.1 Poultry
London
United Kingdom, EC2R 8EJ
Email: [email protected]
Office Phone: +44 207 216 6060
UK Address
Contact Info
Telephone
For
per
sona
l use
onl
y
14
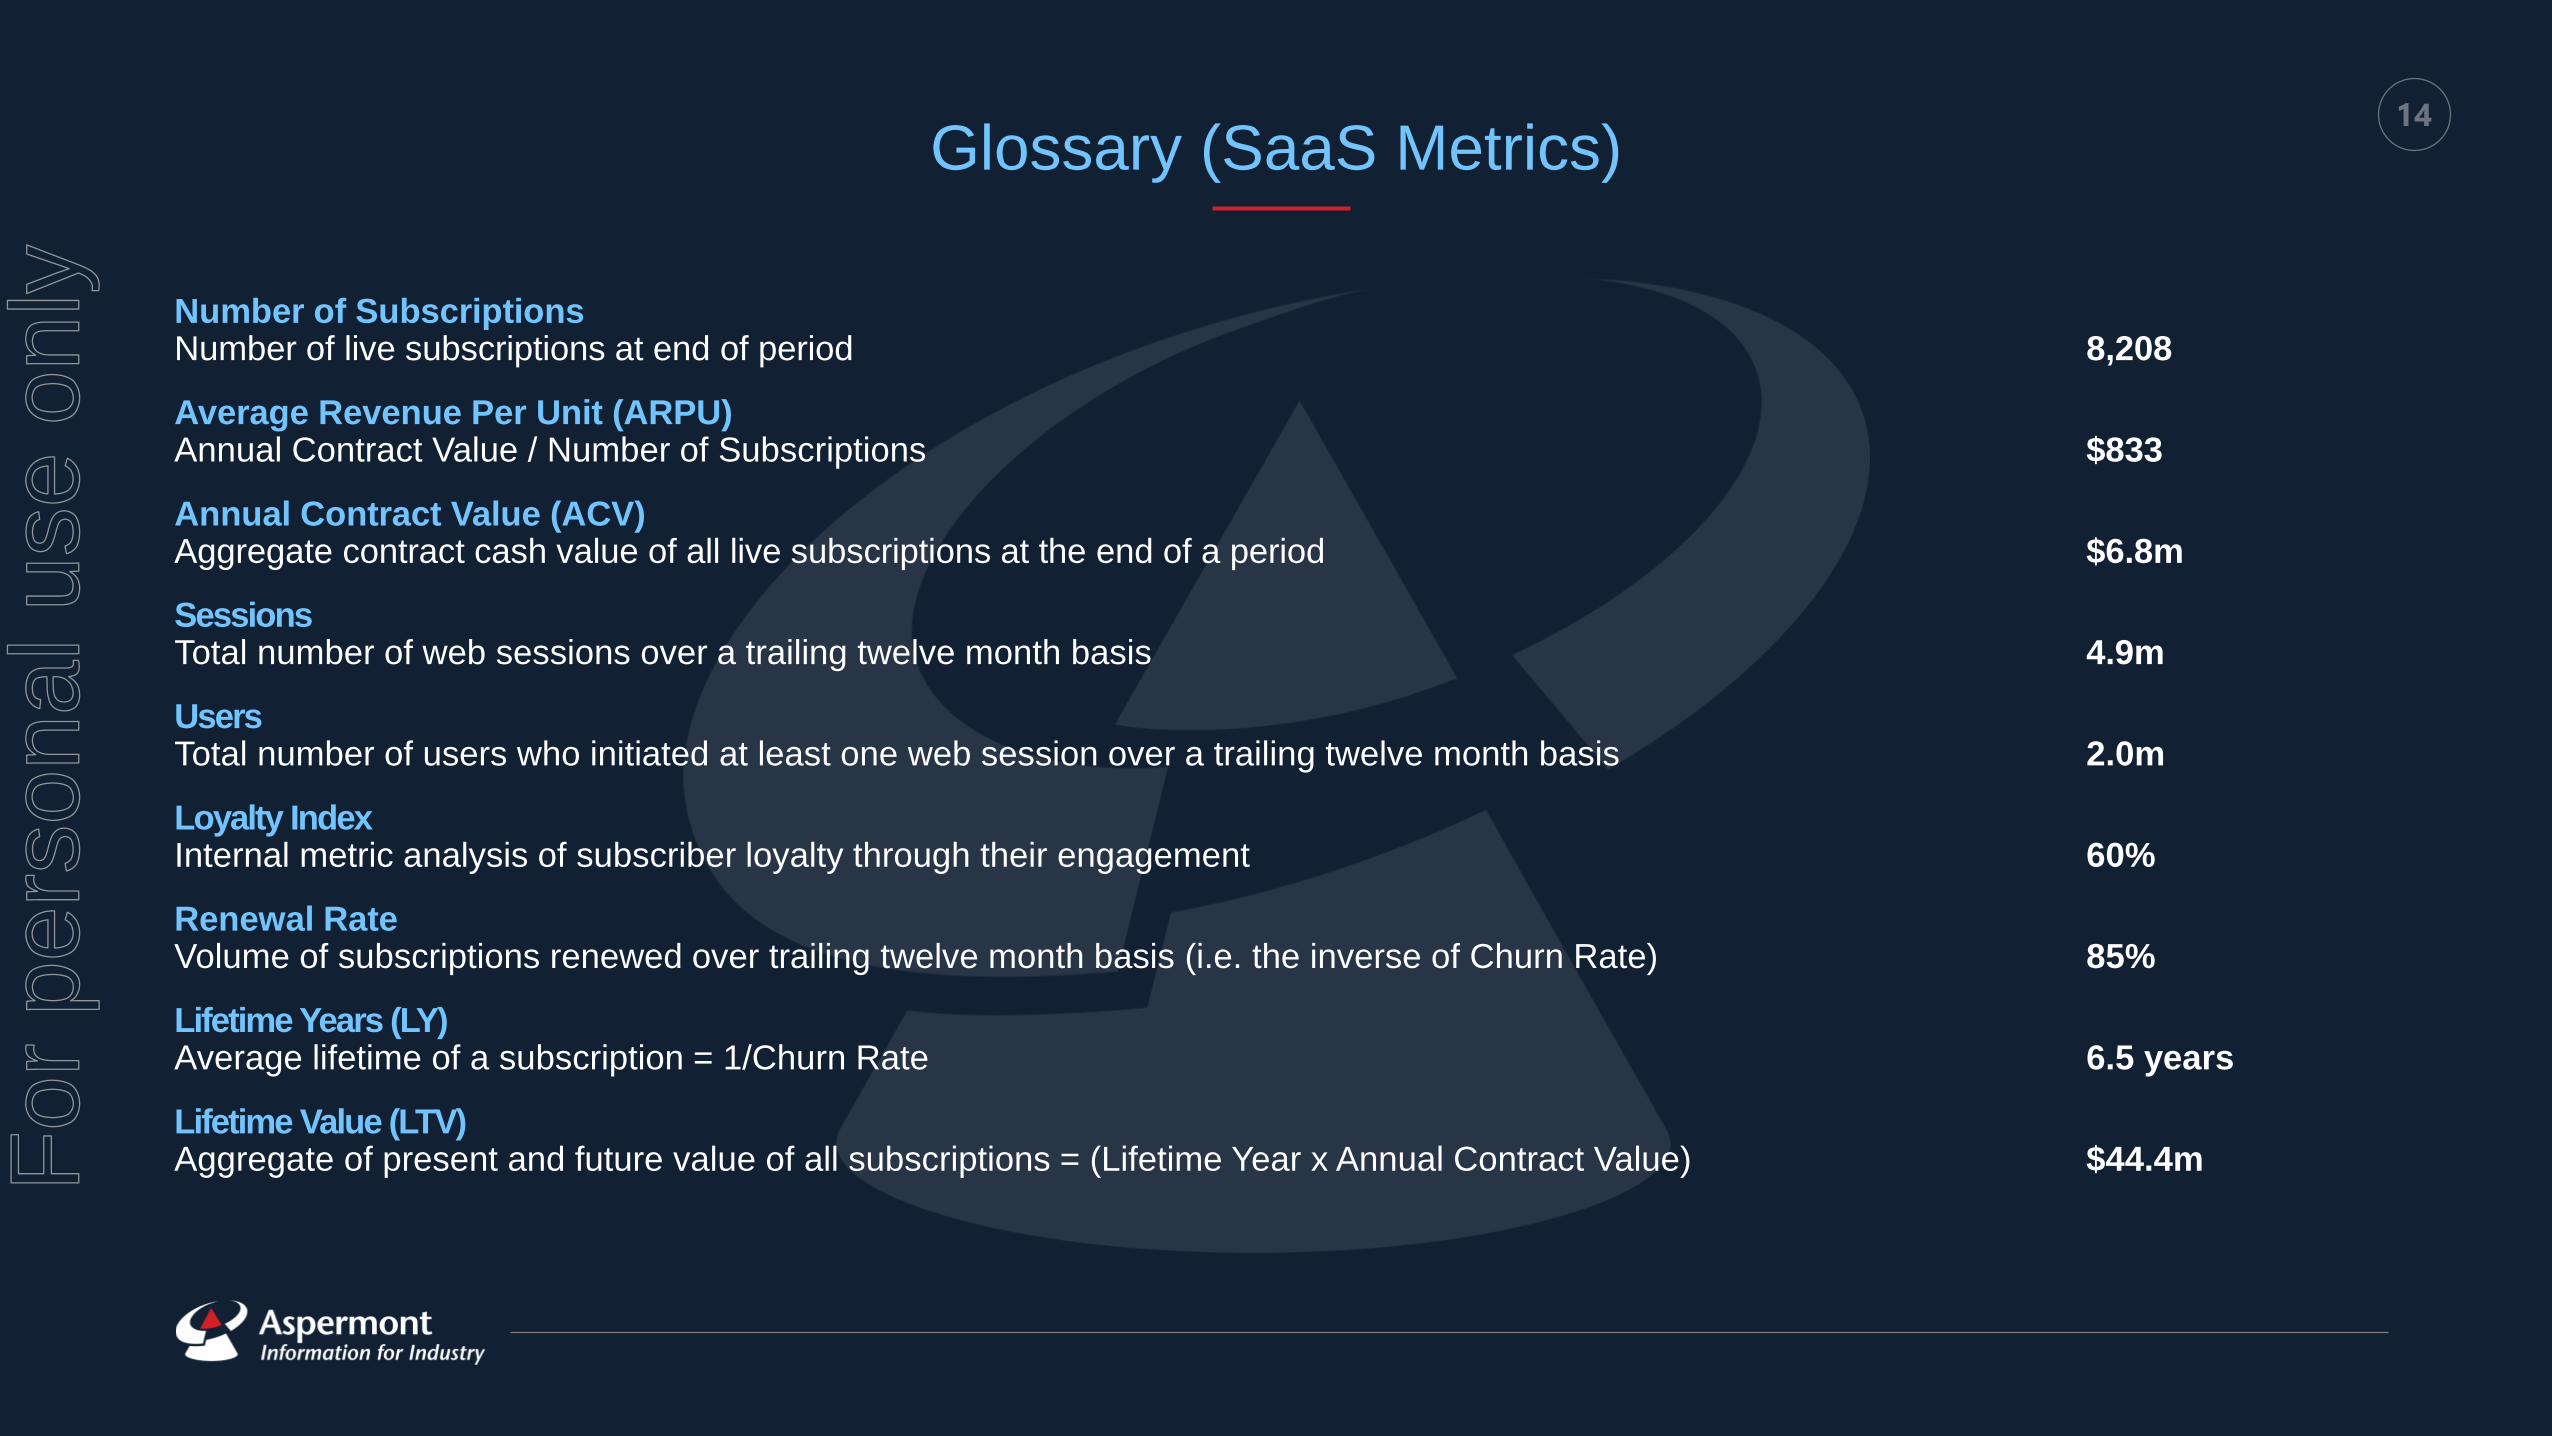
Glossary (SaaS Metrics)
Number of SubscriptionsNumber of live subscriptions at end of period 8,208
Average Revenue Per Unit (ARPU)Annual Contract Value / Number of Subscriptions $833
Annual Contract Value (ACV)Aggregate contract cash value of all live subscriptions at the end of a period $6.8m
SessionsTotal number of web sessions over a trailing twelve month basis 4.9m
UsersTotal number of users who initiated at least one web session over a trailing twelve month basis 2.0m
Loyalty IndexInternal metric analysis of subscriber loyalty through their engagement 60%
Renewal RateVolume of subscriptions renewed over trailing twelve month basis (i.e. the inverse of Churn Rate) 85%
Lifetime Years (LY)Average lifetime of a subscription = 1/Churn Rate 6.5 years
Lifetime Value (LTV)Aggregate of present and future value of all subscriptions = (Lifetime Year x Annual Contract Value) $44.4mF
or p
erso
nal u
se o
nly
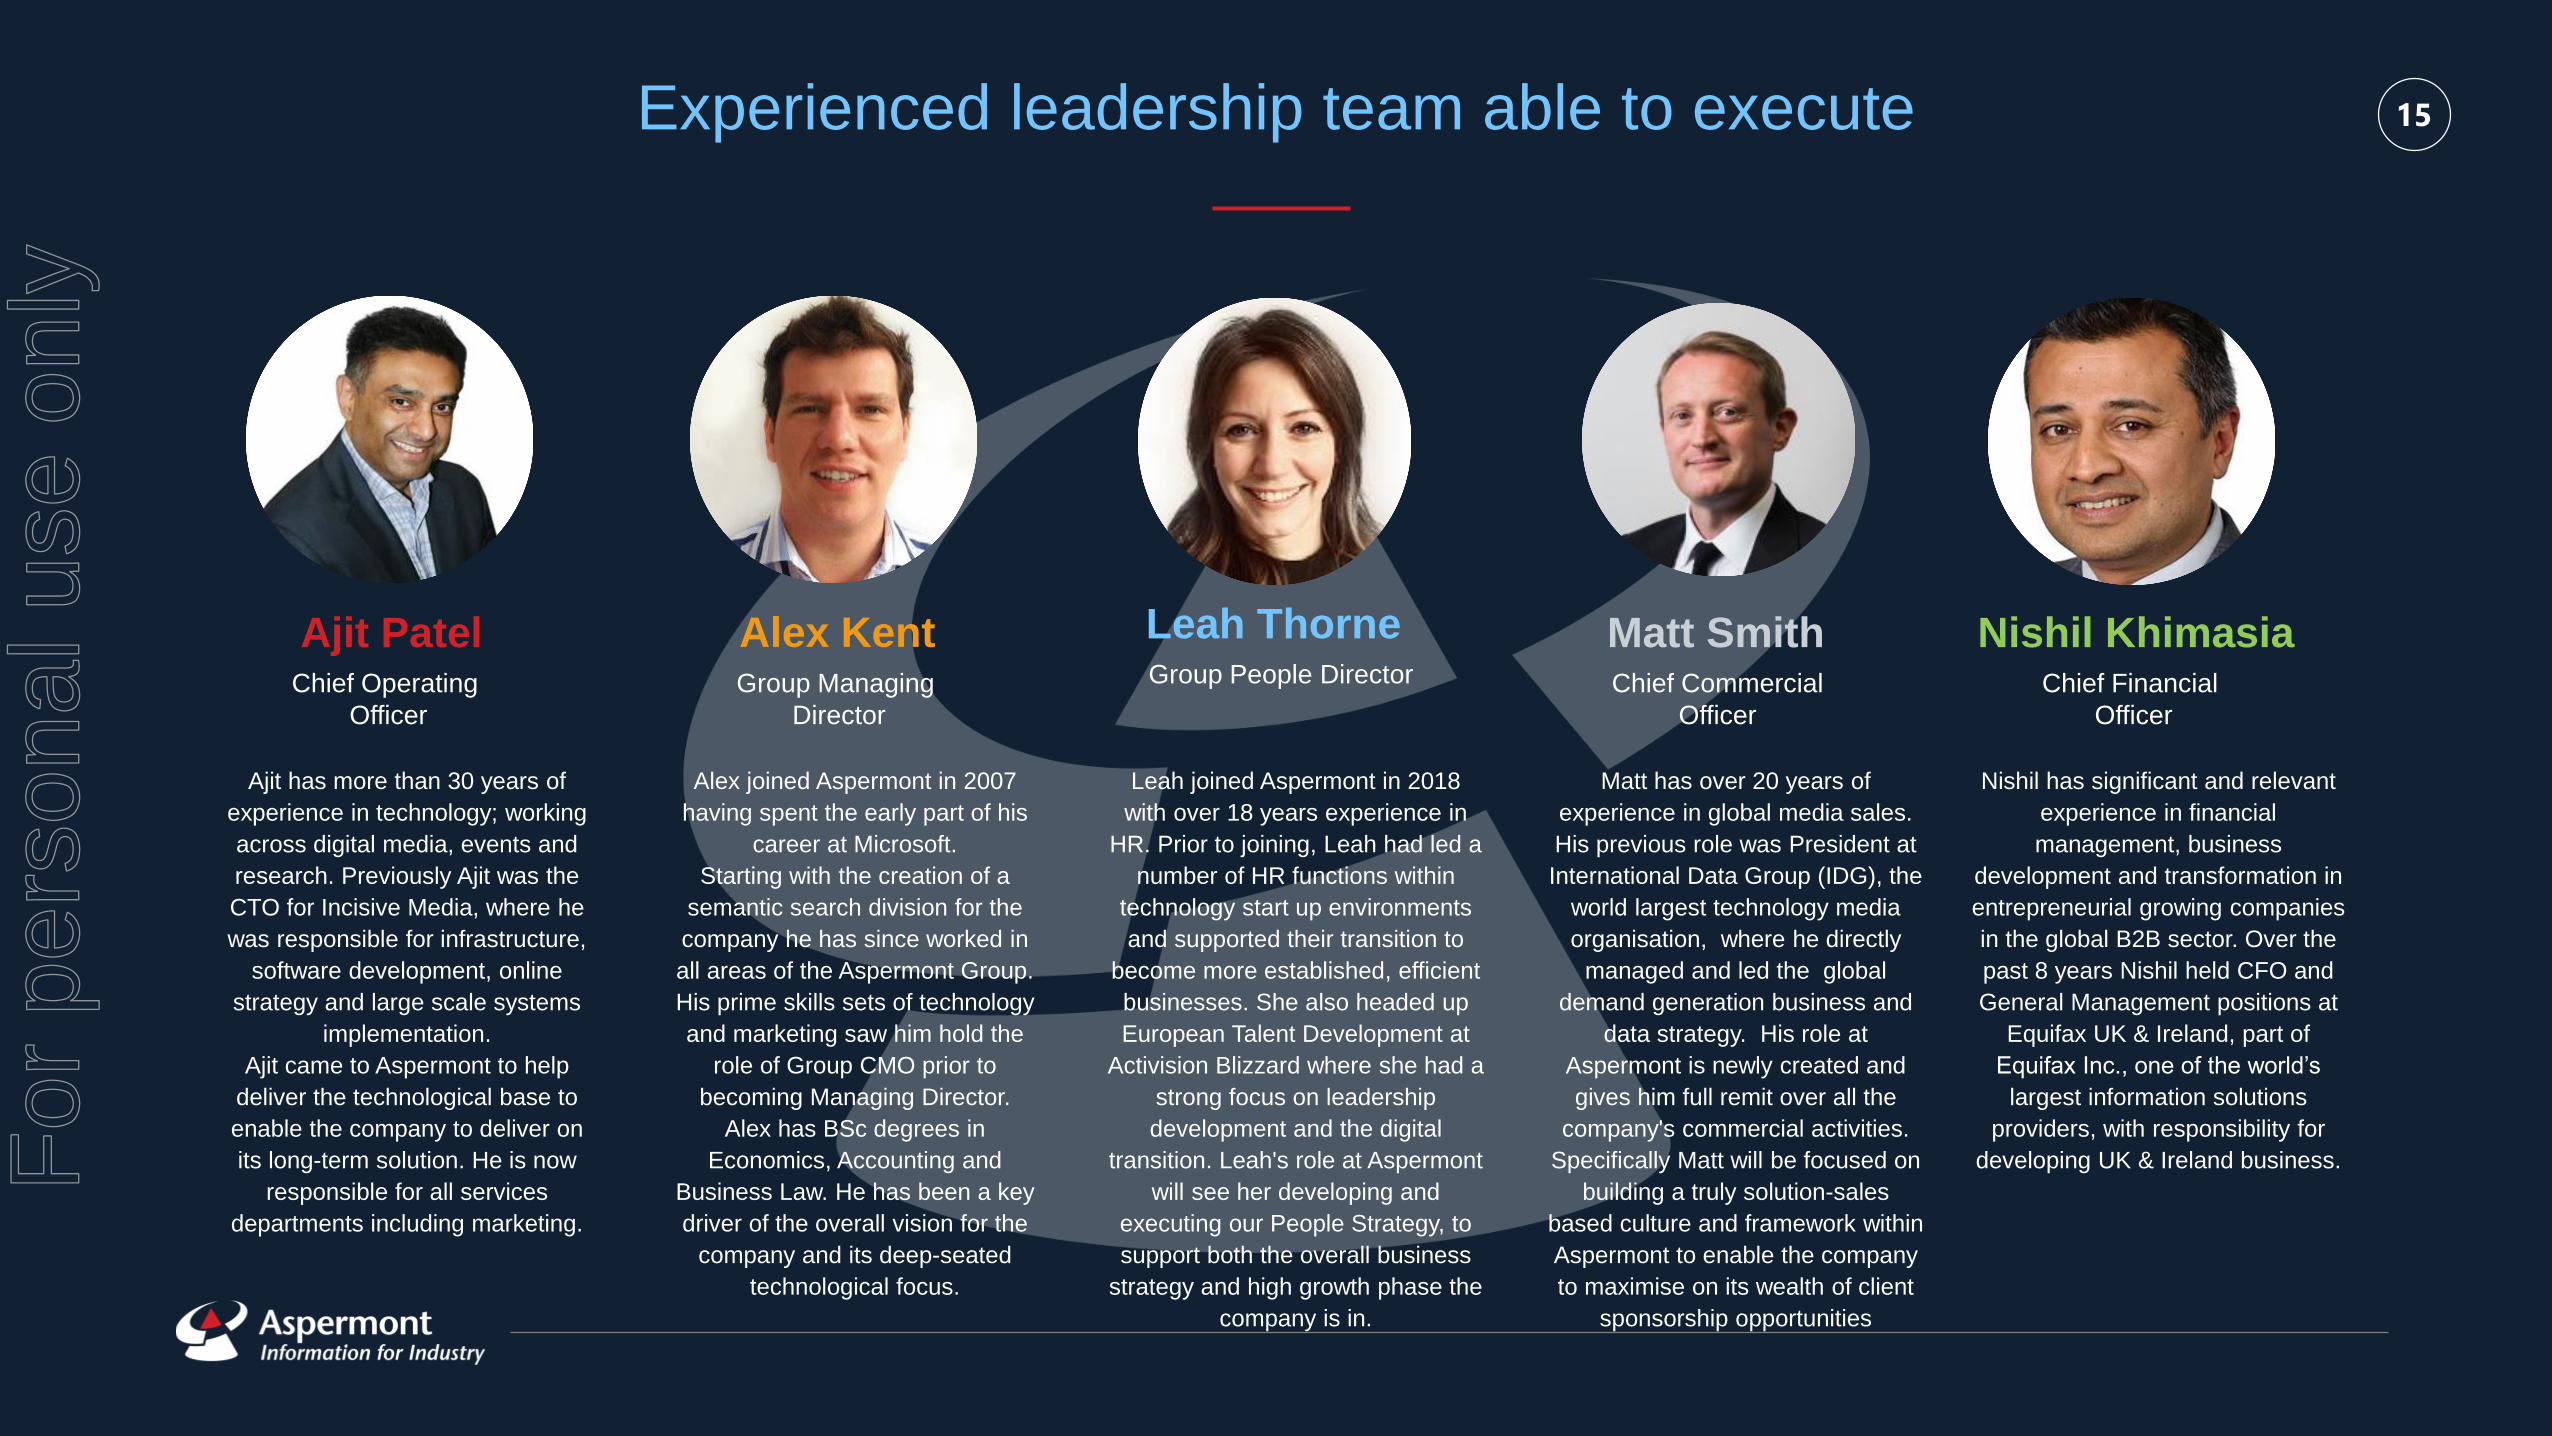
15Experienced leadership team able to execute
Leah Thorne Group People Director
Matt SmithChief Commercial
Officer
Matt has over 20 years of
experience in global media sales.
His previous role was President at
International Data Group (IDG), the
world largest technology media
organisation, where he directly
managed and led the global
demand generation business and
data strategy. His role at
Aspermont is newly created and
gives him full remit over all the
company's commercial activities.
Specifically Matt will be focused on
building a truly solution-sales
based culture and framework within
Aspermont to enable the company
to maximise on its wealth of client
sponsorship opportunities
Nishil KhimasiaChief Financial
Officer
Nishil has significant and relevant
experience in financial
management, business
development and transformation in
entrepreneurial growing companies
in the global B2B sector. Over the
past 8 years Nishil held CFO and
General Management positions at
Equifax UK & Ireland, part of
Equifax Inc., one of the world’s
largest information solutions
providers, with responsibility for
developing UK & Ireland business.
Ajit PatelChief Operating
Officer
Ajit has more than 30 years of
experience in technology; working
across digital media, events and
research. Previously Ajit was the
CTO for Incisive Media, where he
was responsible for infrastructure,
software development, online
strategy and large scale systems
implementation.
Ajit came to Aspermont to help
deliver the technological base to
enable the company to deliver on
its long-term solution. He is now
responsible for all services
departments including marketing.
Alex KentGroup Managing
Director
Alex joined Aspermont in 2007
having spent the early part of his
career at Microsoft.
Starting with the creation of a
semantic search division for the
company he has since worked in
all areas of the Aspermont Group.
His prime skills sets of technology
and marketing saw him hold the
role of Group CMO prior to
becoming Managing Director.
Alex has BSc degrees in
Economics, Accounting and
Business Law. He has been a key
driver of the overall vision for the
company and its deep-seated
technological focus.
Leah joined Aspermont in 2018
with over 18 years experience in
HR. Prior to joining, Leah had led a
number of HR functions within
technology start up environments
and supported their transition to
become more established, efficient
businesses. She also headed up
European Talent Development at
Activision Blizzard where she had a
strong focus on leadership
development and the digital
transition. Leah's role at Aspermont
will see her developing and
executing our People Strategy, to
support both the overall business
strategy and high growth phase the
company is in.
For
per
sona
l use
onl
y
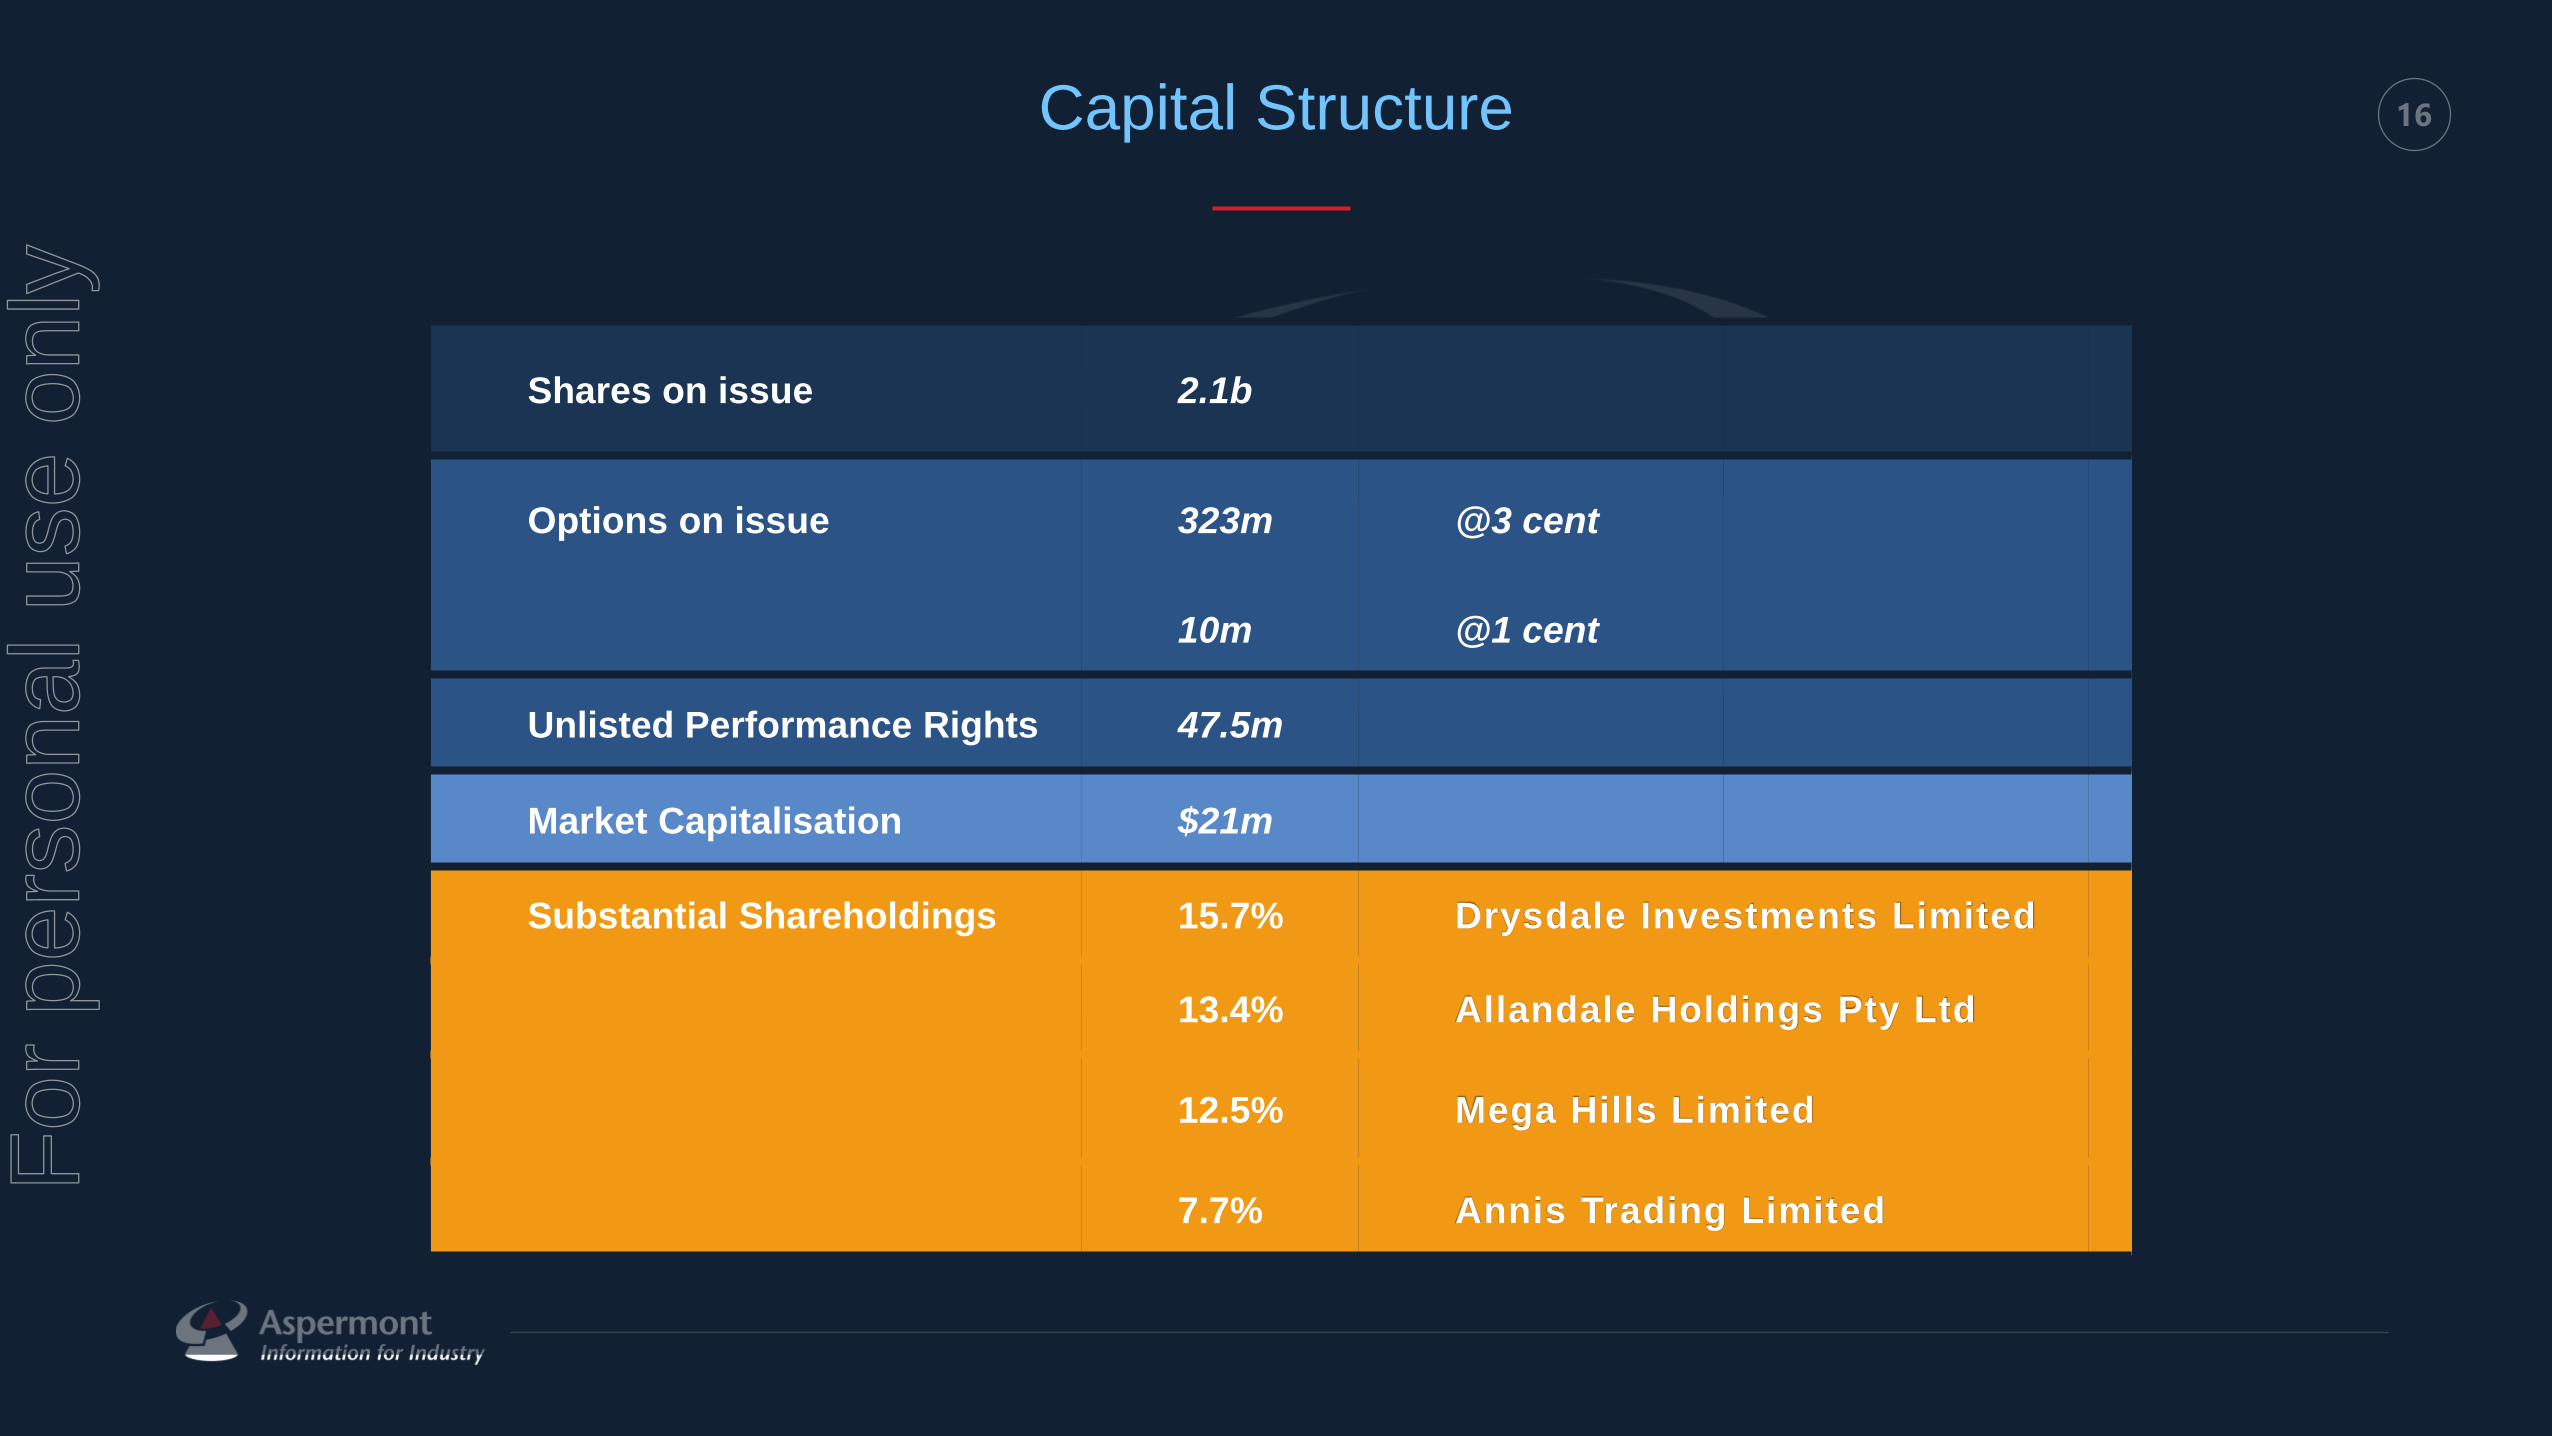
16Capital Structure
Shares on issue 2.1b
Options on issue 323m @3 cent
10m @1 cent
Unlisted Performance Rights 47.5m
Market Capitalisation $21m
Substantial Shareholdings 15.7% Drysdale Investments Limited
13.4% Allandale Holdings Pty Ltd
12.5% Mega Hills Limited
7.7% Annis Trading Limited
For
per
sona
l use
onl
y
17
Disclaimer
Important notice disclaimer
Forward-looking standard elements
This presentation may include forward-looking statements. Such statements can generally be identified by the use of words such as 'may', 'will', 'expect', 'intend', 'plan', 'estimate', 'anticipate', 'believe', 'continue', 'objectives', 'outlook', 'guidance‘, ‘forecast’ and similar expressions. Indications of plans, strategies, management objectives, sales and financial performance are also forward-looking statements.
Such statements are not guarantees of future performance, and involve known and unknown risks, uncertainties, assumptions, contingencies and other factors, many of which are outside the control of Aspermont Limited (Aspermont or Company). No representation is made or will be made that any forward-looking statements will be achieved or will prove to be correct. Actual results, performance, operations or achievements may vary materially from any forward-looking statements. Circumstances may change and the contents of this presentation may become outdated as a result. Readers are cautioned not to place undue reliance on forward-looking statements and Aspermont assumes no obligation to update such statements.
No representation or warranty, expressed or implied, is made as to the accuracy, reliability, adequacy or completeness of the information contained in this presentation.
Past performance
Past performance information given in this presentation is given for illustrative purposes only and should not be relied upon as (and is not) an indication of future performance.
Information is not advice or offer of securities
This presentation is not, and is not intended to constitute, financial advice, or an offer or an invitation, solicitation or recommendation to acquire or sell Aspermont shares or any other financial products in any jurisdiction and is not a prospectus, product disclosure statement, disclosure document or other offering document under Australian law or any other law. This presentation also does not form the basis of any contract or commitment to sell or apply for securities in Aspermont or any of its subsidiaries. It is for information purposes only.
Aspermont does not warrant or represent that the information in this presentation is free from errors, omissions or misrepresentations or is suitable for your intended use. The information contained in this presentation has been prepared without taking account of any person’s investment objectives, financial situation or particular needs and nothing contained in this presentation constitutes investment, legal, tax or other advice. The information provided in this presentation may not be suitable for your specific needs and should not be relied up on by you in substitution of you obtaining independent advice. Subject to any terms implied by law and which cannot be excluded, Aspermont accepts no responsibility for any loss, damage, cost or expense (whether direct, or indirect, consequential, exceptional or special damages including but not limited to loss of revenue, profits, time, goodwill, data, anticipated savings, opportunity, business reputation, future reputation, production or profit, any delay costs, economic loss or damage) incurred by you as a result of any error, omission or misrepresentation in this
presentation.
Preparation of information
All financial information has been prepared and reviewed in accordance with Australian Accounting Standards. Certain financial data included in this presentation is ‘non-IFRS financial information’. The Company believes that this non-IFRS financial information provides useful insight in measuring the financial performance and condition of Aspermont. Readers are cautioned not to place undue reliance on any non-IFRS financial information including ratios included in this presentation.
Presentation of information
Currency All amounts in this presentation are in Australian dollars unless otherwise stated.
FY refers to the full year to 30 June.
Rounding Amounts in this document have been rounded to the nearest $0.1m. Any differences between this document and the accompanying financial statements are due to rounding.
Third party information and market data
The views expressed in this presentation contain information that has been derived from publicly available sources that have not been independently verified. No representation or warranty is made as to the accuracy, completeness or reliability of the information. This presentation should not be relied upon as a recommendation or forecast by Aspermont. Market share information is based on management estimates except where explicitly identified.
No liability or responsibility
The information in this presentation is general in nature and is provided in summary form and is therefore does not purport to be complete.
To the maximum extent permitted by law, Aspermont and each of its affiliates, directors, employees, officers, partners, agents and advisers and any other person involved in the preparation of this presentation disclaim all liability and responsibility (including without limitation, any liability arising from fault or negligence) for any direct orindirect loss or damage which may arise or be suffered through use or reliance on anything contained in, or omitted from, this presentation. Aspermont accepts no responsibility or obligation to inform you of any matter arising or coming to their notice, after the date of this presentation, which may affect any matter referred to in this presentation.
This presentation should be read in conjunction with Aspermont’s other periodic and continuous disclosure announcements lodged with ASX.
For
per
sona
l use
onl
y