Embed Size (px)
Citation preview
This document is the property of AGR and the copyright therein is vested in AGR Well Management Limited. All rights reserved. Neither the whole nor any part of this document
may be disclosed to others or reproduced, stored in a retrieval system or transmitted in
any form by any means (electronic, mechanical, reprographic recording or otherwise)
without prior written consent of the copyright owner.
AGR Well Management
Annual Environmental Report 2018
AUTHORISATION
Name/Position Position Date
Prepared by Gavin Kerr HSEQ Manager 27/05/2019
Reviewed by Ian Burdis VP North Sea & WA 27/05/2019
Reviewed &
Approved by
Svein Sollund CEO 31/05/2019
DOCUMENT CONTROL
Record of Issue:
Rev No Date Modification Details Inserted / Checked by
A 27/05/2019 Draft for review GK
1 31/05/2019 For issue GK

AGR Well Management
Annual Environmental Report 2018
May 2019 Rev 1 Page 2 of 17
Contents
1 INTRODUCTION 3
2 SCOPE AND MODEL OF OPERATIONS 3
3 EMS OVERVIEW 4
4 ENVIRONMENTAL OBJECTIVES 5
4.1 Environmental Performance – Cambo Well 6
4.1.1 Drill Cuttings 6
4.1.2 Chemical Use and Discharge 7
4.1.3 Reservoir Oil Bearing Discharges - Payzone Cuttings 8
4.1.4 Reservoir Oil Bearing Discharges - Well Test Fluids 9
4.1.5 Atmospheric Emissions 9
4.1.6 Waste Management 9
4.1.7 Oil and Chemical Spills to Sea 11
4.1.8 Non-compliances 11
4.2 Environmental Performance – Orlando Well 12
4.2.1 Drill Cuttings 12
4.2.2 Other Base Oil Discharges 13
4.2.3 Chemical Use and Discharge 14
4.2.4 Atmospheric Emissions 14
4.2.5 Waste Management 15
4.2.6 Oil and Chemical Spills to Sea 16
Figure 1 - Well Locations .................................................................................... 3
Figure 2 - HSEQ Policy ....................................................................................... 4
Figure 3 - Environmental Focus Areas .................................................................. 5
Figure 4 - Summary of Cambo well drill cuttings discharges .................................... 6
Figure 5 - Chemical use and discharge quantities from Cambo well operations .......... 7
Figure 6 - Oil discharges during Cambo well operations .......................................... 8
Figure 7 - Atmospheric emissions from the Cambo well operations .......................... 9
Figure 8 - Waste generated during Cambo operations ...........................................10
Figure 9 - Cambo Well - Waste Destination ..........................................................11
Figure 10 - Summary of Orlando well drill cuttings and base oil discharges ..............13
Figure 11 - Summary of permitted and actual base oil discharges from Orlando well .13
Figure 12 - Chemical use and discharge quantities from Orlando well operations ......14
Figure 13 - Atmospheric emissions from the Orlando well operations ......................15
Figure 14 - Waste generated during Orlando operations ........................................15
Figure 15 - Cambo Well - Waste Destinations .......................................................16

AGR Well Management
Annual Environmental Report 2018
May 2019 Rev 1 Page 3 of 17
1 Introduction
This document presents the AGR Well Management Ltd (AGR) annual public statement
for offshore operations during 2018. The annual statement is provided in line with the
objectives of OSPAR Recommendation 2003/5 to Promote the Use and Implementation
of Environmental Management Systems by the Offshore Industry, as implemented by
the UK Department of Business, Energy and Industrial Strategy (BEIS). In accordance
with BEIS guidance on Environmental Management Systems (EMS), well operators on
the UK continental shelf (UKCS) must maintain a certified EMS, including the
requirement to produce an annual public statement covering all offshore operations
undertaken in the previous calendar year.
2 Scope and Model of Operations
AGR is an independent well management services company, which provides all aspects
of well operations, including well design and planning, execution and close-out. The
scope of operations includes exploration, appraisal and development drilling design and
implementation, rig procurement and well abandonment.
With the introduction of the Offshore Installations (Offshore Safety Directive) (Safety
Case etc) Regulations, licence operators for offshore oil and gas activities must formally
appoint a competent well operator to undertake exploration and appraisal well
operations, including drilling, well suspension and abandonment operations. As well
operator, in addition to general project management duties, AGR is responsible for
managing the environmental requirements of well operations, including the preparation
and submission of all environmental permit applications.
In 2018 AGR acted as the well operator for two wells, one located to the west of Shetland
and one in the northern North Sea. These operations were executed under the auspices
of the AGR HSEQ Management System. This document discusses the environmental
performance during these operations, including summaries of key emissions and
discharges.
Figure 1 - Well Locations
AGR Well Management
Annual Environmental Report 2018
May 2019 Rev 1 Page 4 of 17
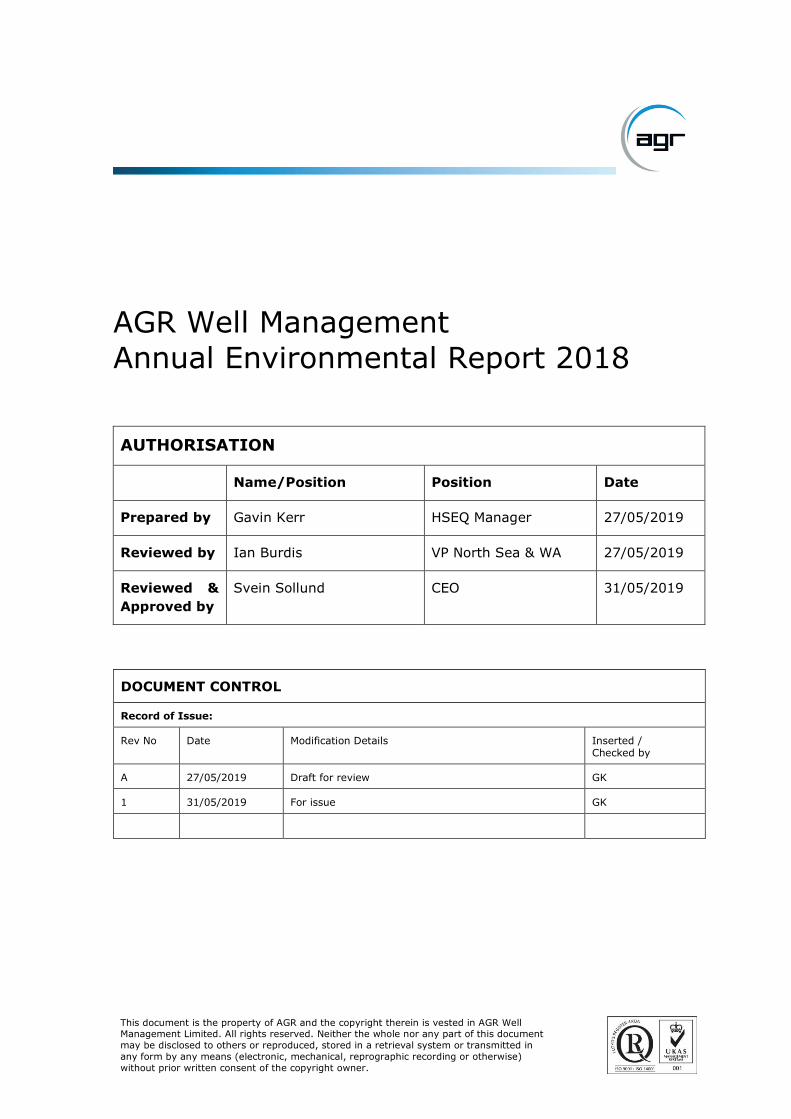
3 EMS Overview
AGR is aware of the potential environmental implications of its business operations and
is fully invested in safeguarding the environment as an underlying principle of our
operations. This is demonstrated by the commitments outlined in the HSEQ policy
underpinning our HSEQ Management System and all our activities. Following the
principles of ISO14001, the HSEQ policy commits AGR to enhance our environmental
performance, meet all identified compliance obligations and protect the environment
wherever possible.
Figure 2 - HSEQ Policy

AGR Well Management
Annual Environmental Report 2018
May 2019 Rev 1 Page 5 of 17
The HSEQ policy is part of the AGR integrated HSEQ Management System, which
includes Environmental Management System (EMS) requirements. The Management
System has been certified to the ISO14001 2015 International Standard in accordance
with the requirements of OSPAR Recommendation 2003/5 and associated BEIS
guidelines. The Management System is subject to regular external review and
certification against the requirements of ISO14001. It was last fully certified on 27
December 2016. As part of the EMS, AGR has identified the significant environmental
aspects of offshore operations and developed processes necessary to manage these
aspects. The environmental elements of the Management System are applied to all well
activities, including those covered in this annual statement.
4 Environmental Objectives
AGR collaborated with the Installation Operators to achieve a positive HSE culture
onboard the drilling rigs involved in the 2018 operations, in accordance with respective
HSE management systems and policies. This ensured that environmental protection was
prioritised and all personnel were aware of their environmental responsibilities and
associated risks. To help measure performance, the following key performance
indicators (KPI) relevant to environmental issues were agreed for 2018 operations:
Zero dropped objects
Zero reportable spills
Further key environmental focus areas were identified as requiring close supervision
during operations, based on the elevated environmental risk determined through the
AGR risk assessment process.
Environmental Focus Area Cambo Well
Orlando Well
Fuel bunkering
Chemical use and discharge
Well testing
Transfer and use of oil base mud (OBM) and pit cleaning operations
Processing and discharge of OBM cuttings at sea
Well clean up and flaring
Figure 3 - Environmental Focus Areas
These operations were monitored to ensure compliance with AGR and rig contractor
procedures, compliance with consent conditions and to help minimise environmental
impacts. The KPIs and focus areas are reflected in the following discussion of
environmental performance.
As stated above, AGR was well operator for two wells in 2018, the environmental
performance of which is discussed in turn below.

AGR Well Management
Annual Environmental Report 2018
May 2019 Rev 1 Page 6 of 17
4.1 Environmental Performance – Cambo Well
From April to September 2018, AGR acted as well operator for drilling operations in the
Cambo prospect in deepwater to the west of Shetland. Operations involved a deviated
appraisal pilot well (Well 204/10a-5) and associated horizontal sidetrack (Well 204/10a-
5Z). Drilling operations were undertaken from the West Hercules dynamically positioned
semi-submersible drilling rig, owned and operated by North Atlantic Drilling Ltd (NADL).
An extended well test (EWT) was undertaken in the horizontal sidetrack in order to
gather further information about the commercial viability of the reservoir.
4.1.1 Drill Cuttings
Drill cuttings, the fragments of broken rock generated by the action of the drill bit, vary
in nature depending on the characteristics of the rock layers present, but generally
range in size between very fine clay like particles to coarse gravels.
Typically, drill cuttings generated from the tophole sections of a well, before a blowout
preventer and marine riser are installed, are deposited directly on the seabed
surrounding the wellbore. However, in this case the uppermost section was replaced
with a Conductor Anchor Node ('CAN-ductor'), a pre-rig stage well construction
technology used in place of a conventional tophole section and associated conductor.
This removes the need for tophole drilling, conductor installation and subsequent
cementing operations. As a result, only cuttings from the second tophole section were
discharged to the seabed, reducing related physical impacts upon seabed communities.
Drill cuttings from deeper sections of the pilot well and all sections of the sidetrack well
were circulated up the marine riser to the drilling rig, where the drilling mud was
recovered and the cuttings discharged to sea. Due to issues with the angle of the initial
sidetrack reservoir section, it had to be re-drilled, resulting in additional cuttings being
generated and discharged from the rig.
The table below presents the total quantities of drill cuttings discharged at the seabed
and sea surface during drilling activities at Cambo.
Section Discharge point
Section length (m)
Section volume
(m3)
Cuttings discharged (tonnes)
Well 204/10a-5 (pilot well)
17½" Seabed 738 114.5 266.9
12¼" Surface 591 44.9 104.8
Total - - - 371.7
Well 204/10a-5Z (sidetrack)
12¼" Surface 789 60 139.8
8½" Surface 324 11.9 27.7
8½" (redrill) Surface 477 17.5 40.7
Total - - - 208.2
Figure 4 - Summary of Cambo well drill cuttings discharges

AGR Well Management
Annual Environmental Report 2018
May 2019 Rev 1 Page 7 of 17
4.1.2 Chemical Use and Discharge
Chemical use and discharge during offshore operations is controlled by the Offshore
Chemicals Regulations 2002, as amended (OCR regulations). These regulations
introduced the OSPAR Harmonised Mandatory Control Scheme for the use of chemicals
offshore. Within this scheme, all chemicals are ranked according to a hazard quotient
(HQ) calculated using the Chemical Hazard and Risk Management model (CHARM). The
HQ ranking is divided into six colour bands from least to most hazardous (gold, silver,
white, blue, orange and purple).
There are some chemicals to which the CHARM model cannot be applied, eg inorganic
substances. In such cases, chemicals are assigned a grouping under the Offshore
Chemical Notification Scheme (OCNS) based on their toxicity characteristics (A to E, E
being the least hazardous). Chemicals which are environmentally benign in seawater
are termed as ‘Poses Little or NO Risk’ (PLONOR). All PLONOR products are given an ‘E’
rating (least hazardous).
A summary of chemicals regulated under the OCR Regulations used and discharged
during offshore operations at the Cambo well is presented in the table below. Not all
chemicals approved for use in the operations were ultimately required, some were
identified as contingencies in case downhole conditions required them.
As introduced above, chemicals are categorised according to either their HQ colour band
or OCNS ranking. The majority of chemicals used and discharged were classified as
PLONOR and/or were ranked in the least environmentally hazardous categories.
Category Number of
chemicals
Used (kg) Discharged (kg)
Gold 27 122,273.9 114,629.5
Silver 1 82.5 82.5
OCNS C 1 950.0 950.0
OCNS D 1 5,901.5 5,901.5
OCNS E 31 4,435,000.8 4,260,997.1
Total 61 4,564,208.7 4,382,560.6
Figure 5 - Chemical use and discharge quantities from Cambo well operations Note: The HQ colour band and OCNS rankings are those in place at the time of operations, chemicals may have been re-categorised since that time.
Certain chemical components are marked with a ‘substitution warning’ (SUB) as they
are listed on the OSPAR list of chemicals for priority action or due to characteristics such
as high toxicity or poor biodegradation potential. The UK National Plan has set interim
targets for these chemicals to be replaced with more environmentally friendly products,
with priority given to those with the highest toxicity. Where technically possible, AGR
actively seeks to minimise the number of chemicals with substitution warnings to be
used when planning each offshore operation.
In total, 61 chemical products were ultimately used during the Cambo operations, of
which only six had substitution warnings. Four of these chemicals were small solid
tracers, Tracerco 165h, Tracerco 740, Tracerco 720 and Tracerco 701, used during the
extended well test to determine the origin of the reservoir oil and connectivity in the

AGR Well Management
Annual Environmental Report 2018
May 2019 Rev 1 Page 8 of 17
reservoir. As these tracers were oil soluble, any portion brought to surface would have
been entrained with the produced oil and captured during sampling, with the remainder
burnt in the flare. DMO86941 is a demuslifier used during the well test operations to
help separate the oil, gas and water produced to the rig. As this well test chemical is
also oil soluble, it would also have been entrained within the oil stream and sent to the
flare during testing. Therefore, there was no discharge of these chemicals to sea.
The remaining SUB chemical, MCS-J is a surfactant. This was added to the cement
spacer system to help remove drilling mud, clean the hole, and wet the casing and
surrounding formation surfaces immediately prior to the arrival of the cement slurry. As
a spacer chemical used to support cementing of the deeper well casings, most of this
product remained in the well trapped behind the casings. Only minimal discharge was
required in association with the washing out of tanks and lines once the cementing
operation was complete. As described in the chemical permit application, not more than
20% of the quantity used was ultimately discharged to sea in this case.
AGR's UK offshore operations are focused on the management of exploration and
appraisal drilling. As a different selection of chemicals may be required from one well to
the next, it is very difficult to manage the ongoing use of specific chemicals or schedule
the replacement of less environmentally favourable chemicals. However, AGR will
continue to identify, and encourage sub-contractors to look for, suitable alternatives in
future drilling operations.
4.1.3 Reservoir Oil Bearing Discharges - Payzone Cuttings
Whilst drilling through the target formation, drill cuttings and drilling muds returned to
the rig were contaminated with crude oil from the reservoir. Oil contaminated cuttings
and mud were encountered whilst drilling the 12¼" section of the pilot well and both
sections of the horizontal sidetrack. As normal, the cuttings involved were circulated up
to the rig and passed over the shakers to recover the drilling fluids. The cuttings and
any remaining mud residues, along with associated crude oil, were then discharged to
sea.
As required by relevant legislation, the discharge of oil contaminated drill cuttings was
undertaken under conditions of an oil discharge permit, which imposes limits for the
total quantity of crude oil discharged to sea. The permit requires samples of the returned
cuttings to be gathered and analysed in order to determine the quantities of oil
discharged were within approved limits. Based on the analysis undertaken, a total of
111.4 tonnes of oil contaminated cuttings containing 130 kg of crude oil were discharged
to sea in relation to the Cambo well operations. The average proportion of oil on the
cuttings discharged was 0.12%. The quantities of oil discharged were well within the
permitted thresholds, as demonstrated in the table below.
Cambo well Source of oil (tonnes)
Oil contaminated drill cuttings
Oil contaminated water during well testing
Permitted discharge 11.5 0.12
Actual discharge 0.13 0.0007
Figure 6 - Oil discharges during Cambo well operations

AGR Well Management
Annual Environmental Report 2018
May 2019 Rev 1 Page 9 of 17
4.1.4 Reservoir Oil Bearing Discharges - Well Test Fluids
During a well test, produced fluids from the reservoir are returned to the surface. These
fluids are a combination of completion fluids, oil, gas and produced water. Once returned
to the drilling rig, oil and gas and water are separated into separate streams, with the
hydrocarbons flared off (burnt). The separated water will contain some residual crude
oil. This water is treated to reduce the oil content, then discharged to sea under an oil
discharge permit. Samples of the fluids are taken and analysed to ensure the oil content
is below the permitted threshold before discharge. Additional samples are gathered and
sent onshore for further analysis to verify the oil content. A total of 63.75 m3 of oil
contaminated fluids were discharged in association with the Cambo extended well test.
These fluids contained 0.7 kg of crude oil with an average dispersed oil concentration of
approximately 11 mg/l. The quantities of oil discharged were also well within the
permitted thresholds.
4.1.5 Atmospheric Emissions
The main atmospheric emissions generated during the Cambo well operations were
derived from fuel combustion on the West Hercules drilling rig and the flaring of
hydrocarbons during the extended well test, undertaken to further evaluate the Cambo
reservoir. Over the course of operations, the rig burnt a total of 4,206 tonnes of diesel
for power generation. This generated a total of 10,009.2 tonnes of CO2 equivalents.
Sulphur content of the fuel was 0.1%.
Fuel use Flaring - well testing
Diesel Oil Gas
Consumption (tonnes) 4,206 6,727 296
Em
issio
ns (
tonnes)
CO2 13,459.2 21,526.4 828.8
CO 66.0 121.1 2.0
NOx 249.8 24.9 0.4
N2O 0.9 0.5 0.02
SO2 16.8 0.1 0.0
CH4 0.8 168.2 13.3
VOC 8.4 168.2 1.5
Total CO2 equivalents1
10,009.2 26,640.4 1,174.9
Figure 7 - Atmospheric emissions from the Cambo well operations
1Total CO2 is not a sum of all emission values given, it represents the contribution to climate change of all gaseous emissions by converting them into tonnes of CO2 before giving a final total.
The Cambo extended well test lasted 337 hours or just over 14 days. As a result of the
test, a total of 6,727 tonnes of crude oil and 296 tonnes of associated gas were flared
off. This resulted in the emission of a total of 27,815.25 tonnes of CO2 equivalents.
4.1.6 Waste Management
Under the relevant waste legislation designed to encourage waste reduction, appropriate
storage and proper disposal, waste generated during rig based offshore activities must
AGR Well Management
Annual Environmental Report 2018
May 2019 Rev 1 Page 10 of 17
be segregated and stored appropriately for disposal onshore. Waste is typically
segregated and recorded according to the following categories:
Group I is special waste such as oils, paints, used containers, sludges etc.
Group II is general waste including domestic waste. Segregated materials, such
as scrap metal, plastics, wood, paper and cardboard, are recycled.
Group III is other waste including asbestos, clinical and explosive materials and
radioactive materials.
It should be noted that, as water base mud (WBM) used throughout drilling of the Cambo
well, all cuttings and used muds were discharged to sea. Therefore, no backloading of
cuttings to shore for disposal as waste (Group IV – Backloaded Cuttings) was required.
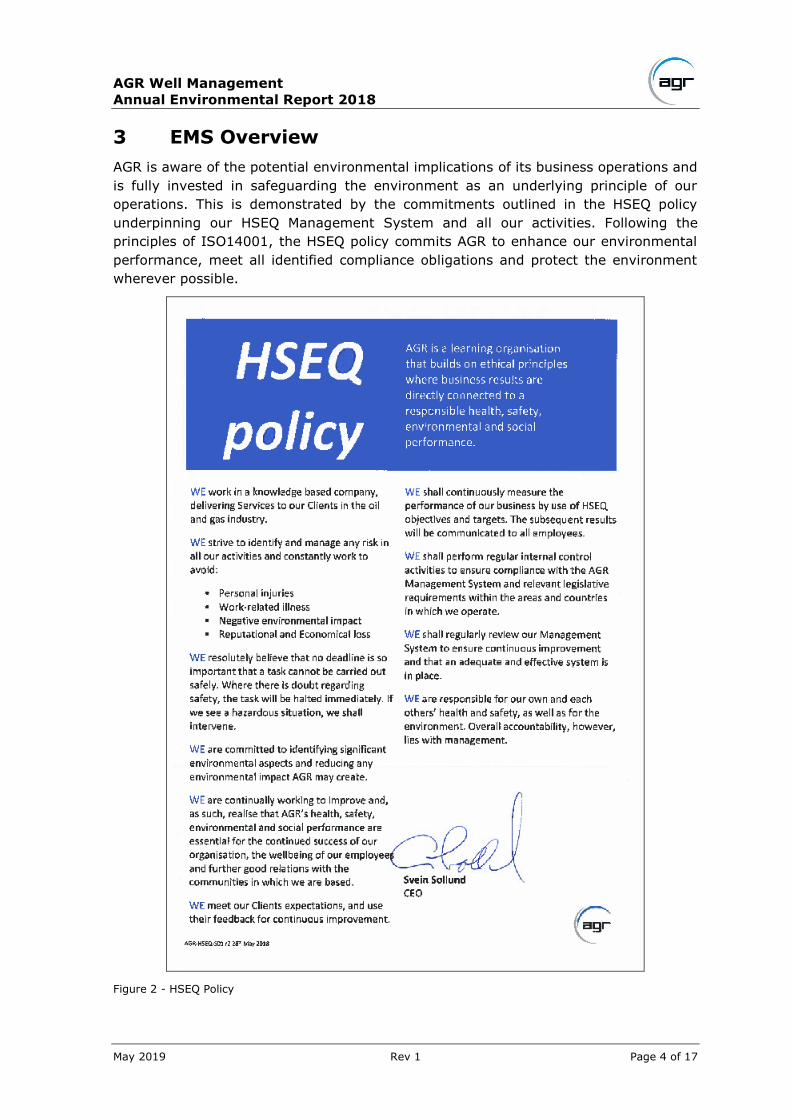
The types, quantities and disposal methods for waste generated during these operations
are shown in the table below.
Waste category
Reuse (t)
Recycling (t)
Waste to energy (t)
Incinerate (t)
Landfill (t)
Other (t)
Total (t)
Group I 2.15 31.94 56.00 0 0 76.32 166.4
Group II 0 60.79 17.51 0 14.23 0 92.53
Group III 0 0 0 0.005 0 0 0.005
Total 2.15 92.73 73.51 0.005 14.23 76.32 258.94
Figure 8 - Waste generated during Cambo operations
A total of approximately 259 tonnes of waste was generated during the Cambo
operations. The majority of waste was designated as Group I special waste, 166.4
tonnes. Within this category, waste was mostly comprised of sludges, liquids and tank
washings (124.74 tonnes) and oils (31.06 tonnes). Miscellaneous special waste (7.6
tonnes), drums/containers (2.39 tonnes) and chemical/paint wastes (0.61 tonnes)
made up the remaining quantity of special waste. The majority of the sludges, tank
washings and other liquids consisted of water which was ultimately discharged to a
sewer after being treated appropriately onshore. None of the waste was sent to landfill
with the remainder mostly recycled or converted to energy.
The vast majority of the remaining waste, 92.53 tonnes, was classified as general waste
(Group II), much of which was suitable for recycling. The remaining general waste was
either converted to energy or had to be disposed of in landfill, as it was not suitable for
other methods of disposal. A very small proportion of waste, 0.005 tonnes or 5 kg, was
clinical waste (Group III) that had to be incinerated.
AGR Well Management
Annual Environmental Report 2018
May 2019 Rev 1 Page 11 of 17
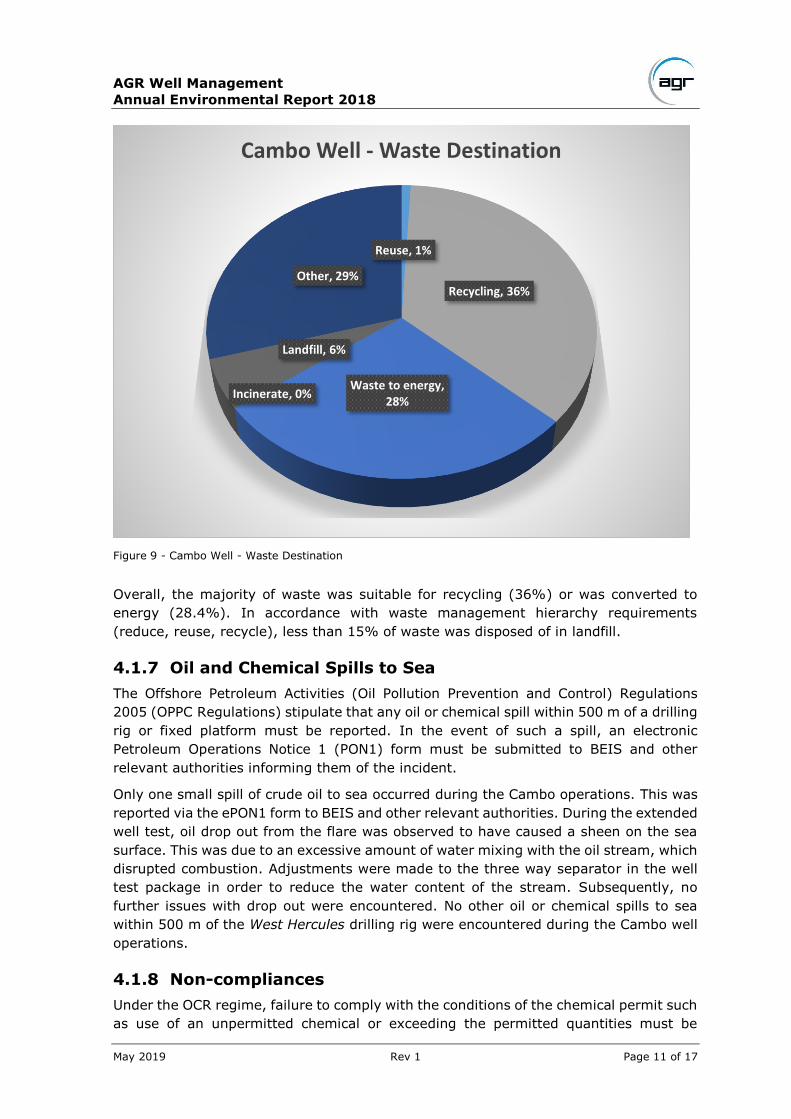
Figure 9 - Cambo Well - Waste Destination
Overall, the majority of waste was suitable for recycling (36%) or was converted to
energy (28.4%). In accordance with waste management hierarchy requirements
(reduce, reuse, recycle), less than 15% of waste was disposed of in landfill.
4.1.7 Oil and Chemical Spills to Sea
The Offshore Petroleum Activities (Oil Pollution Prevention and Control) Regulations
2005 (OPPC Regulations) stipulate that any oil or chemical spill within 500 m of a drilling
rig or fixed platform must be reported. In the event of such a spill, an electronic
Petroleum Operations Notice 1 (PON1) form must be submitted to BEIS and other
relevant authorities informing them of the incident.
Only one small spill of crude oil to sea occurred during the Cambo operations. This was
reported via the ePON1 form to BEIS and other relevant authorities. During the extended
well test, oil drop out from the flare was observed to have caused a sheen on the sea
surface. This was due to an excessive amount of water mixing with the oil stream, which
disrupted combustion. Adjustments were made to the three way separator in the well
test package in order to reduce the water content of the stream. Subsequently, no
further issues with drop out were encountered. No other oil or chemical spills to sea
within 500 m of the West Hercules drilling rig were encountered during the Cambo well
operations.
4.1.8 Non-compliances
Under the OCR regime, failure to comply with the conditions of the chemical permit such
as use of an unpermitted chemical or exceeding the permitted quantities must be
Reuse, 1%
Recycling, 36%
Waste to energy, 28%
Incinerate, 0%
Landfill, 6%
Other, 29%
Cambo Well - Waste Destination

AGR Well Management
Annual Environmental Report 2018
May 2019 Rev 1 Page 12 of 17
notified to BEIS via an OCR non-compliance notification form. All chemical use and
discharge were monitored throughout the Cambo operations to ensure they remained
within approved limits. Variations were made to the permit application in order to make
necessary increases to chemical use and discharge, or to add new chemicals in a timely
fashion as required.
There was a single isolated instance where gravel used in completing the well was
allowed to return to the surface and be discharged to sea. This was quickly identified
and no further instances of this discharge occurred. Although the gravel was not a
chemical product permitted under the OCR regime, its discharge was reported to BEIS
via the OCR NCN. As it involved a product outside its intended destination, this was
deemed the most appropriate route for reporting the incident. No further non-
compliance incidents were encountered.
Similarly, under the OPPC Regulations, failure to comply with the arrangements
described within the permit application, the permit approval and the Standard Industry
Conditions must be notified to BEIS via an OPPC non-compliance notification form
(NCN). However, the reservoir oil discharges made at the Cambo well were all made
within the conditions of the Oil Discharge permit.
Any failure to comply with the conditions of the Consent to Locate process under the
Energy Act 2008, Part 4A, including failure of navigational aids, must be notified to BEIS
via a PON10 form. As the West Hercules drilling rig had been out of use for several years
and was entering UK waters for the first time, it was not fitted with appropriate ID panels
and obstruction lights as stipulated under the Consent to Locate process. This was noted
upon the rig's arrival at the Cambo location. The consequences of non-compliance with
respect to navigation and potential collisions were deemed to be of low risk. However,
appropriate ID panels and obstruction lights were procured and installed as soon as
possible to address the non-compliance.
4.2 Environmental Performance – Orlando Well
The Orlando well operations were undertaken in Block 3/3b in the northern North Sea
from March to June 2018. Operations involved re-entry of an existing suspended
appraisal well (Well 3/3b-13Z) in order to drill and complete a new sidetrack (Well 3/3b-
13Y) as part of a wider field development. Drilling operations were undertaken from the
Ocean Guardian moored semi-submersible drilling rig, owned and operated by Diamond
Offshore Drilling Inc. (Diamond). Once the well was drilled, fluids were produced to the
surface and flared off in order to clean up the well and make it ready for development.
Base oil discharges were made at a number of stages during the operations, which are
detailed further at the relevant points below.
4.2.1 Drill Cuttings
A synthetic oil based mud (SBM) system was used throughout drilling the Orlando well.
The discharge of whole oil based mud to sea is prohibited, and any base oil
contamination on drill cuttings must not exceed 1% by weight of cuttings. Any discharge
of base oil, including in association with drilling cuttings, is covered by the Offshore
Chemical Regulations and therefore must be permitted via a Chemical Permit
application.

AGR Well Management
Annual Environmental Report 2018
May 2019 Rev 1 Page 13 of 17
During the Orlando drilling operations, all cuttings were returned to the rig with the SBM
recovered for re-use as far as possible. The drill cuttings and associated drilling mud
residues from the 17½" and 12¼" sections were then heat treated to evaporate the
liquid drilling mud and separate it into base oil and water streams. The dry, inert powder
cuttings remaining after this process were collected separately and tested to confirm
the residual base oil content represented no more than 1% of the total weight. Once
confirmed, the cuttings were discharged to sea from the rig. The total quantities of dry
cuttings discharged, and base oil therein, are presented in the table below. Drill cuttings
from the deepest section of the well (8½") were all contained and shipped back to shore
for treatment and disposal, hence related discharge of base oil to sea was zero. A total
of 0.68 tonnes of base oil was discharged to sea in association with the treated cuttings.
Section Discharge point
Section length
(m)
Section volume
(m3)
Cuttings discharged
(t)
Cuttings to shore
(t)
Base oil discharged
(t)
17½" Surface 1,475 226.1 533.52 0 0.343
12¼" Surface 2,053 156.1 363.87 0 0.338
8½" Surface 1,426 52.2 0 121.687 0
Total - - - 897.40 121.687 0.68
Figure 10 - Summary of Orlando well drill cuttings and base oil discharges
The total quantities of contaminated drill cuttings and associated base oil discharged to
sea were well within the permitted thresholds; 1,204 tonnes and 12.04 tonnes,
respectively.
4.2.2 Other Base Oil Discharges
In addition to base oil contaminated drill cuttings, several additional sources of base oil
discharge to sea were required during the Orlando well operations, as discussed below.
As stated above, a synthetic oil based mud system was used to drill the Orlando well,
with all drill cuttings and used SBM returned to the drilling rig. Heat treatment was used
to evaporate and separate the liquid components of the drilling mud into respective
water and oil streams. These were then re-condensed separately and the base oil re-
incorporated into the drilling mud. Once separated from the cuttings and re-condensed,
the water stream contained some residual base oil. Therefore, the fluids involved were
filtered to reduce this base oil content to no more than 30 mg/l and then discharged to
sea. Through this process, a total of 0.47 kg of base oil was discharged to sea, dispersed
within 223.37 m3 of separated water. The total quantity of base oil discharged was well
within the permitted threshold.
Base oil
stream
Volume of fluid
discharged (m3)
Base oil concentration
in fluid (mg/l)
Quantity of base oil
discharged (kg)
Permitted Actual Permitted Actual Permitted Actual
Separated water
436 223.37 30 7 13.1 0.47
Brine 800 83.48 30 9.85 24 0.8
Figure 11 - Summary of permitted and actual base oil discharges from Orlando well

AGR Well Management
Annual Environmental Report 2018
May 2019 Rev 1 Page 14 of 17
Brine used during the completion operations was contaminated with base oil in SBM
displaced from the well, and by pure base oil used to help flow the well during clean up
flaring. When circulated out of the well and up to the rig, this brine was filtered to reduce
any base oil contamination to a maximum of 30 mg/l on average. The treated brine was
then discharged to sea. Through this process, a total of 0.8 kg of base oil was discharged
to sea, dispersed within approximately 83.5 m3 of brine. The total quantity of base oil
discharged was well within the permitted threshold, as shown in the table above.
4.2.3 Chemical Use and Discharge
A summary of chemicals used and discharged under the OCR Regulations during
offshore operations at the Orlando well is presented in the table below. Not all chemicals
approved for use in the operations were actually required, as some were identified for
contingency in case downhole conditions required them. The majority of chemicals used
and discharged were classified as PLONOR and/or were ranked in the least
environmentally hazardous categories introduced above.
Category Number of chemicals
Used (kg) Discharged (kg)
Gold 11 28,259.1 7,129.0
Silver 2 18,612.6 0
OCNS C 1 11,280.0 0
OCNS D 2 3,535.5 3,423.0
OCNS E 27 2,923,618.6 486,465.7
Total 43 2,985,305.7 497,017.6
Figure 12 - Chemical use and discharge quantities from Orlando well operations
Note: The HQ colour band and OCNS rankings are those in place at the time of operations, chemicals may have been re-categorised since that time.
In total, 43 chemicals were used during the Orlando operations, of which only two had
substitution (SUB) warnings. Additional chemicals potentially proposed for use had SUB
warnings, but were ultimately not used during operations. The two SUB chemicals used
were VERSACLEAN CBE, an emulsifier, and VERSATROL M, a fluid loss control chemical.
As both of these chemicals were both used as part of the oil base mud system, neither
were discharged to the marine environment.
4.2.4 Atmospheric Emissions
The main atmospheric emissions generated during the Orlando well comprised of
combustion emissions from the Ocean Guardian drilling rig and clean up flaring to
prepare the well for production. The total atmospheric emissions generated from these
are shown in the table below. The total diesel fuel consumption of the drilling rig was
1,210 tonnes, producing approximately 2,880 tonnes of CO2 equivalents. Sulphur
content of the fuel was 0.1%.

AGR Well Management
Annual Environmental Report 2018
May 2019 Rev 1 Page 15 of 17
Fuel use Flaring – well clean up
Diesel Oil Gas
Consumption (tonnes) 1,210.0 1,501.5 0.1
Em
issio
ns (
ton
nes)
CO2 3,872 6,992.0 0.3
CO 19.0 39.3 0.0
NOx 71.9 8.1 0.0
N2O 0.3 0.2 0.0
SO2 4.8 13.1 0.0
CH4 0.2 54.6 0.005
VOC 2.4 54.6 0.001
Total CO2 equivalents1 2,879.5 5,946.3 0.4
Figure 13 - Atmospheric emissions from the Orlando well operations
1Total CO2 is not a sum of all emission values given, it represents the contribution to climate change of all gaseous emissions by converting them into tonnes of CO2 before giving a final total.
During clean up flaring, 1,501.51 tonnes of oil were flared off along with 0.1 tonnes of
gas. This resulted in total emissions equivalent to approximately 5,946 tonnes of CO2.
4.2.5 Waste Management
A total of approximately 202 tonnes of waste was generated during the Orlando
operations. The types, quantities and disposal methods for waste generated during
these operations are shown in the table below. Group I special wastes were mostly
drums or containers suitable for reuse, or oils sent for recycling. Most of the remaining
special waste, 7.9 tonnes, was converted to energy. A total of less than 0.5 tonnes had
to be incinerated or disposed of in landfill. Given the composition as drums or containers,
scrap metal and segregated recyclables, most of the general waste (Group II) was also
suitable for recycling. A smaller proportion, around 10 tonnes, was converted to energy
once on shore. No waste falling under this category was incinerated or sent to landfill.
A very small proportion of waste, 0.005 tonnes or 5 kg, was clinical waste (Group III)
that had to be incinerated.
Waste category
Reuse (t)
Recycling (t)
Waste to energy (t)
Incinerate (t)
Landfill (t)
Other (t)
Total (t)
Group I 1.74 9.37 7.91 0.05 0.42 0 19.49
Group II 0 47.82 10.34 0 0 0 58.16
Group III 0 0 0 0.005 0 0 0.005
Group IV 0 8.05 0 0 79.78 36.26 124.09
Total 1.74 65.24 18.25 0.06 80.2 36.26 201.75
Figure 14 - Waste generated during Orlando operations
In addition to the three categories of waste described above in relation to the Cambo
operations, the Orlando well operations also involved the backloading of used oil base
mud and contaminated cuttings as waste (Group IV). Under this waste group, cuttings
returned to shore were sub-divided into solids, water and oil components. In this case,

AGR Well Management
Annual Environmental Report 2018
May 2019 Rev 1 Page 16 of 17
the solid cuttings material had to be disposed of in landfill once separated,
approximately 80 tonnes. Base oil separated from the cuttings, just over 8 tonnes, was
reconditioned (recycled) and will be re-used as drilling mud in future operations. The
water separated from cuttings was appropriately treated and discharged to water
streams/sea under permit. In total, 124.09 tonnes of Group IV cuttings waste were
generated.
Figure 15 - Cambo Well - Waste Destinations
For this well, the largest overall component of waste generated, over half, was the Group
IV backloaded cuttings. Within that category, the largest sub-component was the dry
cuttings that were not suitable for reuse or recycling and had to be sent to landfill.
Consequently, the overall proportion of waste sent to landfill from Orlando (40%) was
higher than for Cambo, where water based drilling fluid was used and all cuttings were
suitable for discharge to sea. A significant proportion also falls under the “other”
category, 18%, largely due to the discharge of treated water to drainage. Other than
the cuttings wastes, wastes were mostly recycled or converted to energy, avoiding the
need to dispose of them in landfill.
4.2.6 Oil and Chemical Spills to Sea
Two incidents were encountered over the course of the Orlando operations that required
reporting via the ePON1 form. The first of these was a sheen observed at the sea
surface, caused by an unknown third party unrelated to the Orlando operations. It was
estimated from the sheen that up to 46 tonnes of oil may have been released. All
regulatory agencies were notified of the sighting (HM Coastguard, BEIS, JNCC and
Marine Scotland).
Reuse, 1%
Recycling, 32%
Waste to energy, 9%
Incinerate, 0%
Landfill, 40%
Other, 18%
Cambo Well - Waste Destination

AGR Well Management
Annual Environmental Report 2018
May 2019 Rev 1 Page 17 of 17
The second incident occurred during the clean up flaring period. A change in wind
direction brought the protective water curtain into contact with the flare. This dissolved
some of the smoke from the flare, causing a visible sheen on the surface for a short
period of time. The sheen was determined to be carbon dropout from the flare and no
physical drop out of unburnt hydrocarbons was observed. An inspection around the rig
confirmed no other sources of pollution to sea were present. As the incident duration
was very short, no steps could be taken such as to shut in the well or reposition flaring
operations. However, no further incidents of this nature were encountered.
No other oil or chemical spills to sea within 500 m of the Ocean Guardian drilling rig
were encountered during the Orlando well operations.