Embed Size (px)
Citation preview

Agricultural Economics
October 2002October 2002
Economic Subject Matter Meetings
Kentucky Horticulture Continues Expansion in 2002

Agricultural Economics
WINNERS (+%)• Leafy Let. (132%)• Peppers (49%)• Cucumbers (36%)• Strawberries (25%)• Carrots (23%)• Cantaloupe (22%)• Tomatoes (16%)• Snap beans (15%)
LOSERS (-%)• Cauliflower (20%)• Head Let. (15%)• Apples (9%)• Celery (8%)• Sw Potatoes. (6%)• Fresh F&V’s PCC
up 10% 1990-02.
Changes in U.S. per capita consumption for selected fruits and vegetables, 1991-2002

Agricultural Economics
U.S. Sweet Corn Shipping Point PricesU.S. Sweet Corn Shipping Point Prices1997-2001 and 20021997-2001 and 2002
$0.00
$5.00
$10.00
$15.00
$20.00
$25.00
June July August SeasonAverage
$/cw
t
1997-2001
2002
Source: USDA/ERS

Agricultural Economics
Kentucky Sweet Corn Situation
• Marketing alliances for tray pack continuing
• Expanding to include foodservice products
• Growers struggled in 2001 but did better with 2002 prices

Agricultural Economics
U.S. Tomato f.o.b Shipping Point PricesU.S. Tomato f.o.b Shipping Point Prices1997-2001 and 20021997-2001 and 2002
$0.00
$5.00
$10.00
$15.00
$20.00
$25.00
$30.00
$35.00
June July August SeasonAverage
$/cw
t 1997-2001
2002
Source: USDA/ERS

Agricultural Economics
U.S. vs. Canadian Tomato Importsby: Kevin Nierman, The Packer, 2002

Agricultural Economics
Tomato Imports Continue to Grow
$0
$100,000
$200,000
$300,000
$400,000
$500,000
$600,000
$700,000
$800,000
1990
1991
1992
1993
1994
1995
1996
1997
1998
1999
2000
2001
OtherNetherlandsMexicoCanada

Agricultural Economics
U.S. Cantaloupe Shipping Point PricesU.S. Cantaloupe Shipping Point Prices1997-2001 and 20021997-2001 and 2002
$0.00
$4.00
$8.00
$12.00
$16.00
$20.00
J une J uly August SeasonAverage
$/cw
t 1997-2001
2002
Source: USDA/ERS

Agricultural Economics
U.S. Cabbage Average Farm PriceU.S. Cabbage Average Farm Price1997-20011997-2001
$0.00
$2.00
$4.00
$6.00
$8.00
$10.00
$12.00
$14.00
$16.00
Pri
ce/cw
t
1997 1998 1999 2000 2001
Avg. Farm PriceSource: USDA/ERS

Agricultural Economics
U.S. Bell Pepper Average Farm PriceU.S. Bell Pepper Average Farm Price1997-20011997-2001
Source: USDA/ERS
$0.00
$5.00
$10.00
$15.00
$20.00
$25.00
$30.00
$35.00
Pri
ce/cw
t
1997 1998 1999 2000 2001
Avg. Farm Price

Agricultural Economics
U.S. Fresh Market Blueberry ProductionU.S. Fresh Market Blueberry Production
• Southern region production increases by 9% in 2002 BUT
• Southern market share decreases from 23% in 2001 due to increases in Western production
Source: North American Blueberry Council
2002
West30%
Midwest19%
Northeast30%
Southern21%
West Midwest Northeast Southern

Agricultural Economics
2002 Blueberry Production2002 Blueberry ProductionKentucky and Other StatesKentucky and Other States
Kentucky production (40 acres) equaled approximately 50,000 pounds in 2002, up from 37,000 in 1997. Production is expected to increase to 350,000 pounds (40 more acres) by 2004. (UKy, USDA)
02468
101214161820
AL AR GA KY NC OK, SC,TN
MI IN MN, MO,OH, WI
Mil
lio
n P
ou
nd
s

Agricultural Economics
Atlanta Terminal Market Blackberry PricesAtlanta Terminal Market Blackberry Prices
$0.00
$5.00
$10.00
$15.00
$20.00
$25.00
$30.00
1-Ju
n8-
Jun
15-J
un
22-J
un
29-J
un6-
Jul
13-J
ul
20-J
ul
27-J
ul
3-Aug
10-A
ug
17-A
ug
24-A
ug
Per
Do
zen
6
oz
or
1/2
pt.
co
nta
ine
rs
1999-2001
2002
Source: USDA/ERS

Agricultural Economics
U.S. Grape Vines, 1987-2002U.S. Grape Vines, 1987-2002
Sources: 1987-97: US Ag Census 2002: USDA/ERS, wineinstitute.org, CA Dept. of Food and Agriculture.
*2002 estimate includes 1,179,545 acres.
0
100,000,000
200,000,000
300,000,000
400,000,000
500,000,000
600,000,000
700,000,000
1987 1992 1997 2002*
Bearing Vines
Nonbearing Vines

Agricultural Economics
Approximate Grape Prices Paid By Regional Approximate Grape Prices Paid By Regional Wineries, 1997-2000Wineries, 1997-2000
$/ton$/ton Vidal Seyval Vignoles Chambourcin Foch Concord
IN 525-550 400-550 475-685 450-600 400-550
MI 400-600 475-600 650-700 575-750
MO 600-700 600-700 600-700 325-375
NY 450-580 400-575 450-650 800-900 500-650 275-315
OH 450-610 450-675 190-230
PA 600-700 550-600 700-750 700-1000 550-600 200-500
VA 500-700 500-700 500-700 600-750 500-700
Estimated KY Breakeven Price Per Ton: $650-1050
Source: “Business Planning and Economics of Midwestern Grape Production”Bruce Bordelon, Purdue University, http://viticulture.hort.iastate.edu/wsfeb01/business.html

Agricultural Economics
• Early indication is that Fall 2002 prices are slightly higher than usual.
• Good yields
Pumpkin Situation
Agricultural Economics
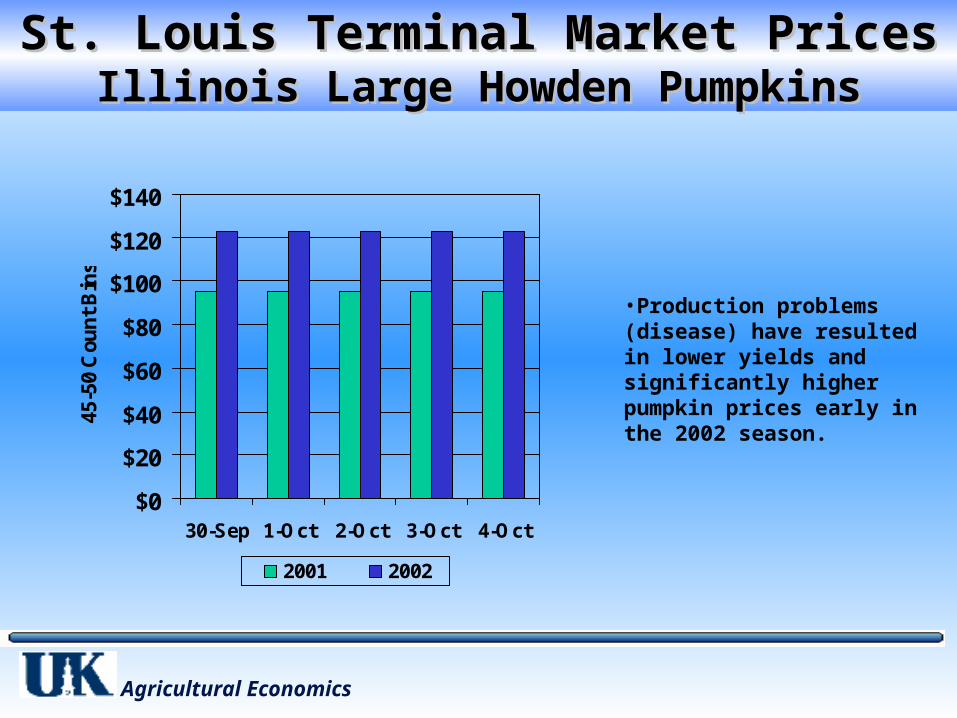
St. Louis Terminal Market PricesSt. Louis Terminal Market PricesIllinois Large Howden PumpkinsIllinois Large Howden Pumpkins
$0
$20
$40
$60
$80
$100
$120
$140
30-Sep 1-Oct 2-Oct 3-Oct 4-Oct
45-5
0 C
oun
t B
ins
2001 2002
•Production problems (disease) have resulted in lower yields and significantly higher pumpkin prices early in the 2002 season.

Agricultural Economics
Kentucky Agricultural Diversification Funds Kentucky Agricultural Diversification Funds by Countyby County
•$0-100,000
•$100,000-$199.999
•$200,000+ (Yellow counties)

Agricultural Economics
Value of KY Wholesale Floriculture Sales By Value of KY Wholesale Floriculture Sales By Grower Size, 1993-2001Grower Size, 1993-2001
$0
$5,000
$10,000
$15,000
$20,000
$25,000
$30,000
$35,000
$40,000
1993
1994
1995
1996
1997
1998
1999
2000
p
2001
p
Whole
sale
Sale
s ($
1,0
00)
$100,000+
$10,000-$99,999
<$10,000
Source: USDA/ERS Floriculture and Nursery Crops Situation and Outlook Yearbook, May 2002

Agricultural Economics
This presentation was presented with the Agricultural Situation and Outlook, Fall 2002, publicationnumber ESM-28, published by the Department of Agricultural Economics at the University of Kentucky with an additional contribution from Kentucky State University in October 2002. The entire publication can be accessed on the WWW at http://www.uky.edu/Ag/AgEcon/publications/esm_28.pdf. This article presents information on the economic situation and outlook for Kentucky agriculture and is intended to assist farmers, agribusiness professionals, Extension filed staff, and others with interest in agriculture and agribusiness. Information presented here is based on the most recent information and research available. However, the rapidly changing economic and policy conditions for agriculture limit the usefulness and life span of conclusions and recommendations cited here. Decision makers should keep these facts in mind. Feel free to use the information included in this publication for other uses, but please provide professional citation about the source. This paper is published without formal review and the views expressed are those of the authors and do not necessarily reflect the views of the Universityof Kentucky, the Agricultural Experiment Station, or the Cooperative Extension Service. If you need additional information or if you would like to provide comments or suggestions about this slideshow, please contact Tim Woods at [email protected].
University of Kentucky, Department of Agricultural Economics400 Charles E. Barnhart Bldg., Lexington, KY 40546-0276
Phone: 859-257-5762, Fax: 859-323-1913URL: http://www.uky.edu/Ag/AgEcon/