Embed Size (px)
Citation preview

Agricultural Factor Markets in Sub-Saharan Africa: An Updated View with Formal Tests for Market Failure
Brian Dillon, University of WashingtonChris Barrett, Cornell University
A part of the World Bank “Agriculture in Africa – Telling Facts from Myths” project, with support from the African Development Bank
June 23, 2014
ABCA Conference, Paris

“Factor markets regularly fail African farmers, leading to allocative inefficiencies within and between households”
Myth or Fact?

“Factor markets regularly fail African farmers, leading to allocative inefficiencies within and between households”
Myth or Fact?
The international development community takes factor market failure in SSA as given

“In Africa, the efficient functioning of markets is constrained among others by inappropriate policies, low volumes, limited competitiveness, lack of information, inadequate infrastructure, weak institutions and market power asymmetries.”
- FAO RSF for Africa 2010-2015

“Given the strategic importance of fertilizer in achieving the African Green Revolution to end hunger, the African Union Member States resolve to increase the level of use of fertilizer from…8 kg per hectare to an average of at least 50 kg per hectare by 2015.”
- Abuja Declaration 2010
“In Africa, the efficient functioning of markets is constrained among others by inappropriate policies, low volumes, limited competitiveness, lack of information, inadequate infrastructure, weak institutions and market power asymmetries.”
- FAO RSF for Africa 2010-2015

“Especially for seed and fertilizer, market failures continue to be pervasive in Sub-Saharan Africa because of high transaction costs, risks, and economies of scale.”
- WDR 2008
“Given the strategic importance of fertilizer in achieving the African Green Revolution to end hunger, the African Union Member States resolve to increase the level of use of fertilizer from…8 kg per hectare to an average of at least 50 kg per hectare by 2015.”
- Abuja Declaration 2010
“In Africa, the efficient functioning of markets is constrained among others by inappropriate policies, low volumes, limited competitiveness, lack of information, inadequate infrastructure, weak institutions and market power asymmetries.”
- FAO RSF for Africa 2010-2015

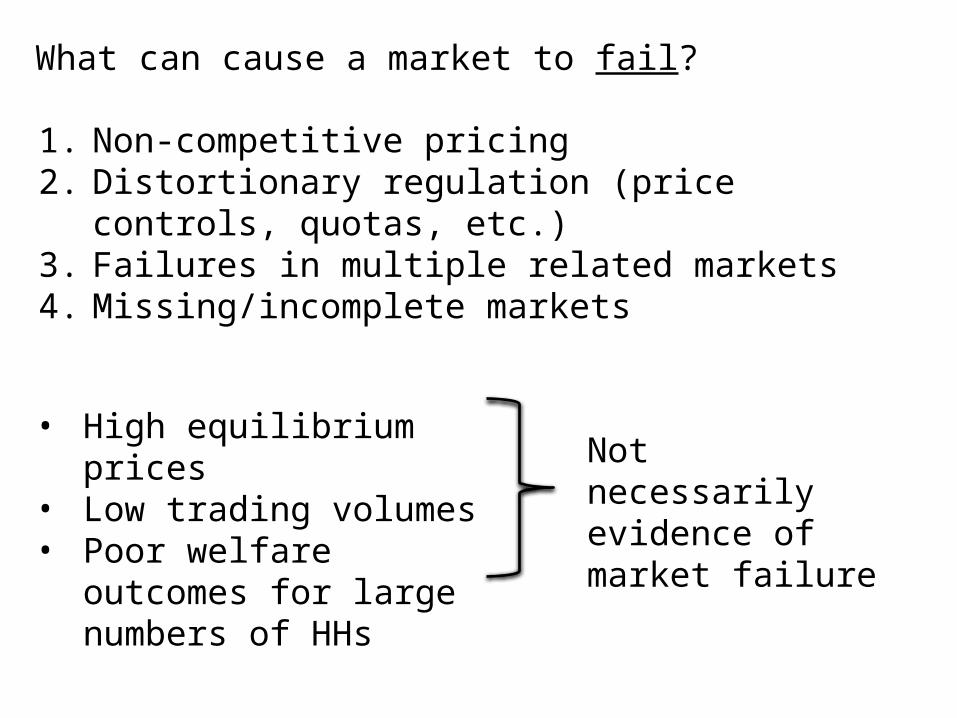
What can cause a market to fail?
1. Non-competitive pricing2. Distortionary regulation (price controls, quotas, etc.)3. Failures in multiple related markets4. Missing/incomplete markets
What can cause a market to fail?
1. Non-competitive pricing2. Distortionary regulation (price controls, quotas, etc.)3. Failures in multiple related markets4. Missing/incomplete markets
• High equilibrium prices• Low trading volumes• Poor welfare outcomes for
large numbers of HHs
Not necessarily evidence of market failure

Why does it matter whether the problem is market failure, or something else?
Policy responses are very different

If markets are truly missing / failing:
• Increase competitiveness• Allocate property rights• Fix the contract enforcement system• Maybe intervene to lower some prices (e.g. in
information markets)

If markets are truly missing / failing:
• Increase competitiveness• Allocate property rights• Fix the contract enforcement system• Maybe intervene to lower some prices (e.g. in
information markets)
If markets are working but welfare outcomes remain sub-optimal:
• Taxes and transfers to address endowment inequalities
• Assistance capturing value chains• Subsidies• Training and education
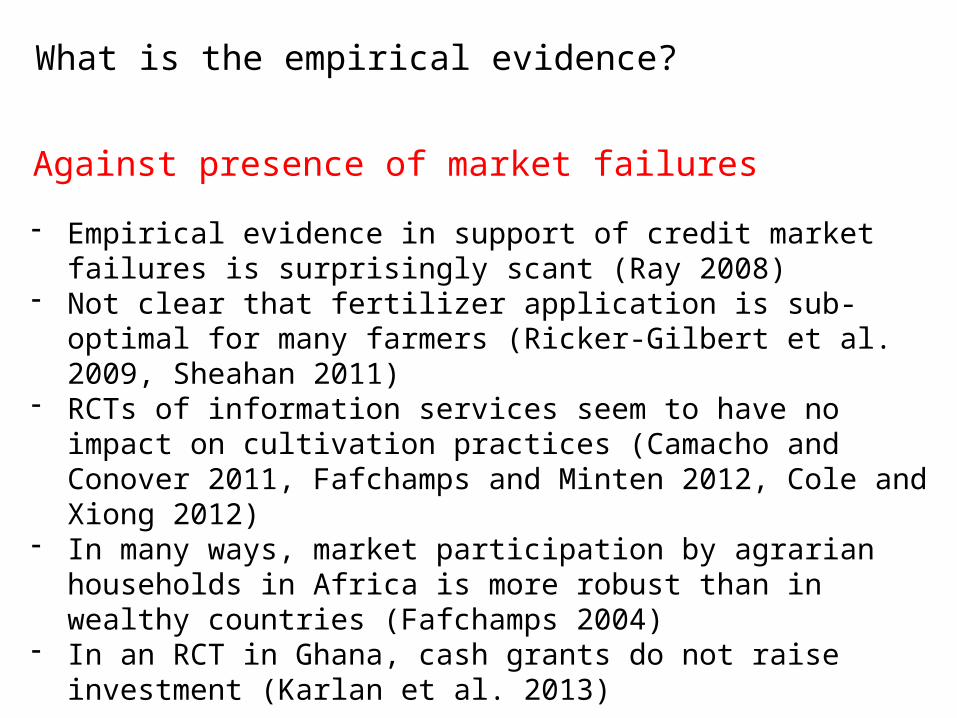
What is the empirical evidence?
- Empirical evidence in support of credit market failures is surprisingly scant (Ray 2008)
- Not clear that fertilizer application is sub-optimal for many farmers (Ricker-Gilbert et al. 2009, Sheahan 2011)
- RCTs of information services seem to have no impact on cultivation practices (Camacho and Conover 2011, Fafchamps and Minten 2012, Cole and Xiong 2012)
- In many ways, market participation by agrarian households in Africa is more robust than in wealthy countries (Fafchamps 2004)
- In an RCT in Ghana, cash grants do not raise investment (Karlan et al. 2013)
Against presence of market failures

What is the empirical evidence?
- Responses to anticipated income changes in S. Africa are consistent with credit market failures (Berg 2013)
- Strong evidence of insurance market failure in Ghana (Karlan et al. 2013)
- Evidence from household input choices: labor market failures in Kenya, financial market failures in Burkina Faso, and land market failures in both (Udry 1999)
In support

What we do in this paper:
1. Provide a summary overview of land and labor market participation in Sub-Saharan Africa
2. Implement a simple test of market failures in data from five African countries (testing whether the separation hypothesis holds)

What we do in this paper:
1. Provide a summary overview of land and labor market participation in Sub-Saharan Africa
2. Implement a simple test of market failures in data from five African countries (testing whether the separation hypothesis holds)
Preview of findings: we strongly reject the null hypothesis of complete and competitive markets in all study countries
(Ethiopia, Malawi, Niger, Tanzania, and Uganda)

Outline of the rest of the talk:
1. Model and empirical test
2. Data
3. Summary statistics and figures
4. Results

Simple version of the standard model (Singh et al. 1986)

Key implication:
Input demands are independent of HH characteristics, if separation holds

Key implication:
Input demands are independent of HH characteristics, if separation holds
This suggests a natural test (Benjamin 1992, Udry 1999):

Data source
LSMS-ISA data for five countries: Ethiopia, Malawi, Niger, Tanzania, Uganda
Standard LSMS survey combined with a comprehensive plot-level agricultural survey
Nationally representative
Generally comparable across countries
Panel data planned or already collected (but here we work with only a single cross-section for each country)

Table 2. Participation in land rental markets Ethiopia Malawi Niger Tanzania UgandaN 3094 2666 2339 2630 2135
Household rents land out 6.10% 0.90% 1.20% 3.40% 0.40%
Household rents land in 19.50% 13.10% 7.30% 6.20% 18.10%
Household rents or borrows land in 30.30% 28.40% 27.70% 23.20% 36.60%

Table 3. Percent of agricultural households hiring labor
Country Activity Number of households
Percent hiring workers
Ethiopia Cultivation 3091 18.5%Harvest 2666 20.9%
Overall 2666 30.2%Malawi Non-harvest 2605 32.6%
Harvest 2605 16.0% Overall 2605 42.0%Niger Preparation 2339 19.5%
Cultivation 2339 37.4%Harvest 2339 18.6%
Overall 2339 47.8%Tanzania Planting 2630 18.5%
Weeding 2630 18.9%Fertilizing 2630 2.6%Harvest 2630 16.0%
Overall 2630 30.8%Uganda Overall 2109 46.8%

Table 4. Summary statistics of variables used in regressions Ethiopia Malawi Niger Tanzania Uganda
Log labor demand (person-days)
4.257 3.851 4.287 4.332 4.756
1.302 0.989 0.982 0.974 0.776Log area cultivated (acres)
0.496 0.384 2.13 1.179 0.8181.332 0.82 1.124 1.05 1.001
Log median wage 2.768 5.563 6.998 7.82 8.7611.083 0.539 0.443 0.489 0.649
Log HH size 1.157 0.862 1.029 1.033 1.2290.457 0.454 0.46 0.498 0.571
Prime male share 0.326 0.408 0.431 0.408 0.3610.207 0.229 0.185 0.233 0.223
Prime female share 0.378 0.479 0.499 0.459 0.420.21 0.238 0.167 0.229 0.226
Elderly female share 0.136 0.071 0.027 0.078 0.124 0.204 0.206 0.111 0.192 0.208N 2499 2556 2183 2346 2047Notes: First row for each variable is the mean, second is the standard deviation

Table 5. Regression results from parsimonious OLS specification
Ethiopia Malawi Niger Tanzania Uganda
Log area (acres) 0.489*** 0.528*** 0.343*** 0.444*** 0.379***
-0.04 -0.048 -0.026 -0.027 -0.033
Log median wage 0.036 -0.121** -0.155 -0.077 0.012
-0.051 -0.052 -0.107 -0.065 -0.043
Log HH size 0.379*** 0.399*** 0.635*** 0.399*** 0.211***
-0.055 -0.061 -0.061 -0.043 -0.044
R-squared 0.33 0.278 0.301 0.321 0.312
N 2499 2556 2183 2346 2047

Table 5. Regression results from parsimonious OLS specification Ethiopia Malawi Niger Tanzania Uganda
Log area (acres) 0.489*** 0.528*** 0.343*** 0.444*** 0.379***
-0.04 -0.048 -0.026 -0.027 -0.033
Log median wage 0.036 -0.121** -0.155 -0.077 0.012
-0.051 -0.052 -0.107 -0.065 -0.043Log HH size 0.379*** 0.399*** 0.635*** 0.399*** 0.211***
-0.055 -0.061 -0.061 -0.043 -0.044
Prime male share 0.446** 0.036 0.008 -0.085 0.223*
-0.186 -0.14 -0.198 -0.136 -0.128
Prime female share 0.152 -0.068 -0.216 -0.147 0.314**
-0.247 -0.132 -0.214 -0.14 -0.131
Elderly female share -0.371** 0.108 -0.416 -0.249 0.042
-0.171 -0.165 -0.286 -0.187 -0.166Constant 3.454*** 3.993*** 4.045*** 4.056*** 3.869*** -0.251 -0.283 -0.802 -0.516 -0.402R-squared 0.33 0.278 0.301 0.321 0.312N 2499 2556 2183 2346 2047Notes: Standard errors in parentheses; standard errors clustered at the level of the zone (Ethiopia), TA (Malawi), grappe (Niger) or district (Tanzania and Uganda); sampling weights used for all regressions; dependent variable is the log of total labor demand, defined as total person-days employed on all plots; children under age 15 are counted as 0.5 adults; harvest labor is excluded for ET, MW, NG, and TZ, but included for UG because it cannot be separately distinguished; population shares defined with respect to adults > age 14

Table 6. Regression results from parsimonious OLS specification w/ district FE Ethiopia Malawi Niger Tanzania UgandaLog area (acres) 0.530*** 0.447*** 0.324*** 0.421*** 0.380***
-0.045 -0.045 -0.029 -0.029 -0.032Log HH size 0.377*** 0.515*** 0.609*** 0.488*** 0.237***
-0.045 -0.056 -0.07 -0.046 -0.039District/zone FE Yes Yes Yes Yes YesR-squared 0.47 0.415 0.5 0.44 0.42N 2765 2556 2183 2364 2047

Table 6. Regression results from parsimonious OLS specification w/ district FE Ethiopia Malawi Niger Tanzania Uganda
Log area (acres) 0.530*** 0.447*** 0.324*** 0.421*** 0.380***
-0.045 -0.045 -0.029 -0.029 -0.032Log HH size 0.377*** 0.515*** 0.609*** 0.488*** 0.237***
-0.045 -0.056 -0.07 -0.046 -0.039
Prime male share 0.531*** 0.061 0.141 -0.078 0.238*
-0.138 -0.128 -0.195 -0.134 -0.137
Prime female share 0.21 -0.069 -0.152 -0.124 0.312**
-0.182 -0.129 -0.223 -0.137 -0.138
Elderly female share -0.214 0.085 -0.480* -0.209 0.028
-0.139 -0.166 -0.288 -0.192 -0.166Constant 3.230*** 3.295*** 4.052*** 3.634*** 3.019*** -0.132 -0.121 -0.221 -0.12 -0.127District/zone FE Yes Yes Yes Yes YesR-squared 0.47 0.415 0.5 0.44 0.42N 2765 2556 2183 2364 2047
Notes: Standard errors in parentheses; standard errors clustered at the level of the zone (Ethiopia), TA (Malawi), grappe (Niger) or district (Tanzania and Uganda); sampling weights used for all regressions; dependent variable is the log of total labor demand, defined as total person-days employed on all plots; children under age 15 are counted as 0.5 adults; harvest labor is excluded for ET, MW, NG, and TZ, but included for UG because it cannot be separately distinguished; population shares defined with respect to adults > age 14

Table 7. Regression results with district FE and both land and labor endowments Ethiopia Malawi Niger Tanzania UgandaLog acres cultivated 0.529*** 0.409*** 0.298*** 0.418*** 0.362***
-0.048 -0.049 -0.035 -0.034 -0.041Log HH size [A] 0.377*** 0.519*** 0.602*** 0.488*** 0.233***
-0.045 -0.056 -0.071 -0.046 -0.039Log acres owned [B] 0.001 0.039*** 0.024* 0.002 0.016
-0.016 -0.012 -0.013 -0.014 -0.015District/zone FE Yes Yes Yes Yes YesF-test (joint sig of [A] & [B]) 35.08 45.56 42.12 56.54 18.38
R-squared 0.47 0.42 0.502 0.44 0.42N 2765 2556 2183 2364 2047

Table 7. Regression results with district FE and both land and labor endowments
Ethiopia Malawi Niger Tanzania UgandaLog acres cultivated 0.529*** 0.409*** 0.298*** 0.418*** 0.362***
-0.048 -0.049 -0.035 -0.034 -0.041Log HH size [A] 0.377*** 0.519*** 0.602*** 0.488*** 0.233***
-0.045 -0.056 -0.071 -0.046 -0.039Log acres owned [B] 0.001 0.039*** 0.024* 0.002 0.016
-0.016 -0.012 -0.013 -0.014 -0.015Prime male share 0.531*** 0.021 0.165 -0.077 0.241*
-0.138 -0.13 -0.193 -0.134 -0.136Prime female share 0.209 -0.107 -0.136 -0.123 0.315**
-0.183 -0.133 -0.222 -0.137 -0.139Elderly female share -0.214 0.053 -0.473 -0.209 0.023
-0.139 -0.168 -0.29 -0.192 -0.168Constant 3.231*** 3.393*** 4.066*** 3.636*** 3.051*** -0.134 -0.125 -0.224 -0.121 -0.138District/zone FE Yes Yes Yes Yes YesF-test (joint sig of [A] & [B]) 35.08 45.56 42.12 56.54 18.38
R-squared 0.47 0.42 0.502 0.44 0.42N 2765 2556 2183 2364 2047Notes: Standard errors in parentheses; standard errors clustered at the level of the zone (Ethiopia), TA (Malawi), grappe (Niger) or district (Tanzania and Uganda); sampling weights used for all regressions; dependent variable is the log of total labor demand, defined as total person-days employed on all plots; children under age 15 are counted as 0.5 adults; harvest labor is excluded for ET, MW, NG, and TZ, but included for UG because it cannot be separately distinguished; population shares defined with respect to adults > age 14; for households with zero acres owned, "Log acres owned" = ln(0.01); F-test statistic is for a test of the joint significance of "Log HH size" and "Log acres owned"; all F-stats are signficant at the 10e-8 level

Conclusions:
1. Clear evidence of market failure in rural areas of five SSA countries
2. Not clear which markets are failing (next step)
3. A caveat: high supervision costs or transaction costs could also generate the results in the paper
4. Clear that land/labor markets are not entirely missing, though they could be missing for some households