Embed Size (px)
Citation preview
IFPRI Discussion Paper 01255
March 2013
Agricultural Mechanization in Ghana
Is Specialization in Agricultural Mechanization a Viable Business Model?
Nazaire Houssou
Xinshen Diao
Frances Cossar
Shashidhara Kolavalli
Kipo Jimah
Patrick Aboagye
Development Strategy and Governance Division
INTERNATIONAL FOOD POLICY RESEARCH INSTITUTE
The International Food Policy Research Institute (IFPRI) was established in 1975 to identify and analyze
national and international strategies and policies for meeting the food needs of the developing world on a
sustainable basis, with particular emphasis on low-income countries and on the poorer groups in those
countries. IFPRI is a member of the CGIAR Consortium.
PARTNERS AND CONTRIBUTORS
IFPRI gratefully acknowledges the generous unrestricted funding from Australia, Canada, China,
Denmark, Finland, France, Germany, India, Ireland, Italy, Japan, the Netherlands, Norway, the
Philippines, South Africa, Sweden, Switzerland, the United Kingdom, the United States, and the World
Bank.
AUTHORS
Nazaire Houssou, International Food Policy Research Institute
Postdoctoral Fellow, Development Strategy and Governance Division
Xinshen Diao, International Food Policy Research Institute
Deputy Division Director, Development Strategy and Governance Division
Frances Cossar, International Food Policy Research Institute
Research Analyst, Development Strategy and Governance Division
Shashidhara Kolavalli, International Food Policy Research Institute
Senior Research Fellow/Program Leader, Development Strategy and Governance Division
Kipo Jimah, International Food Policy Research Institute
Research Officer, Development Strategy and Governance Division
Patrick Aboagye, Ministry of Food and Agriculture, Ghana
Senior Agricultural Engineer, Agricultural Engineering Services Directorate
Notices
IFPRI Discussion Papers contain preliminary material and research results. They have been peer reviewed, but have not been subject to a formal external review via IFPRI’s Publications Review Committee. They are circulated in order to stimulate discussion and critical comment; any opinions expressed are those of the author(s) and do not necessarily reflect the policies or opinions of IFPRI.
Copyright 2013 International Food Policy Research Institute. All rights reserved. Sections of this material may be reproduced for personal and not-for-profit use without the express written permission of but with acknowledgment to IFPRI. To reproduce the material contained herein for profit or commercial use requires express written permission. To obtain permission, contact the Communications Division at [email protected].
iii
SUMMARY | APRIL 2010
WORKING PAPER | September 2012
Contents
Abstract v
Aknowledgments vi
1. Introduction 1
2. Organization of the Agricultural Mechanization Service Provision Market 2
3. Methodology 4
4. Profitability of Agricultural Mechanization Service Provision: Main results 7
5. Concluding Remarks 12
Appendix: Supplementary Tables 13
References 14
iv
SUMMARY | APRIL 2010
WORKING PAPER | September 2012
Tables
2.1—Package and allocation terms of agricultural machinery to Agricultural Mechanization Services
Enterprise Centers, 2008 to 2011 2
4.1—Relationship (average) between profitability, cost efficiency, and operational scale among
providers by region 9
A.1—General assumptions 13
A.2—Model assumptions 13
A.3—Region-specific assumptions 13
Figures
4.1—Net profit per tractor investment—model for southern Ghana (top) and model for northern Ghana
(bottom) 7
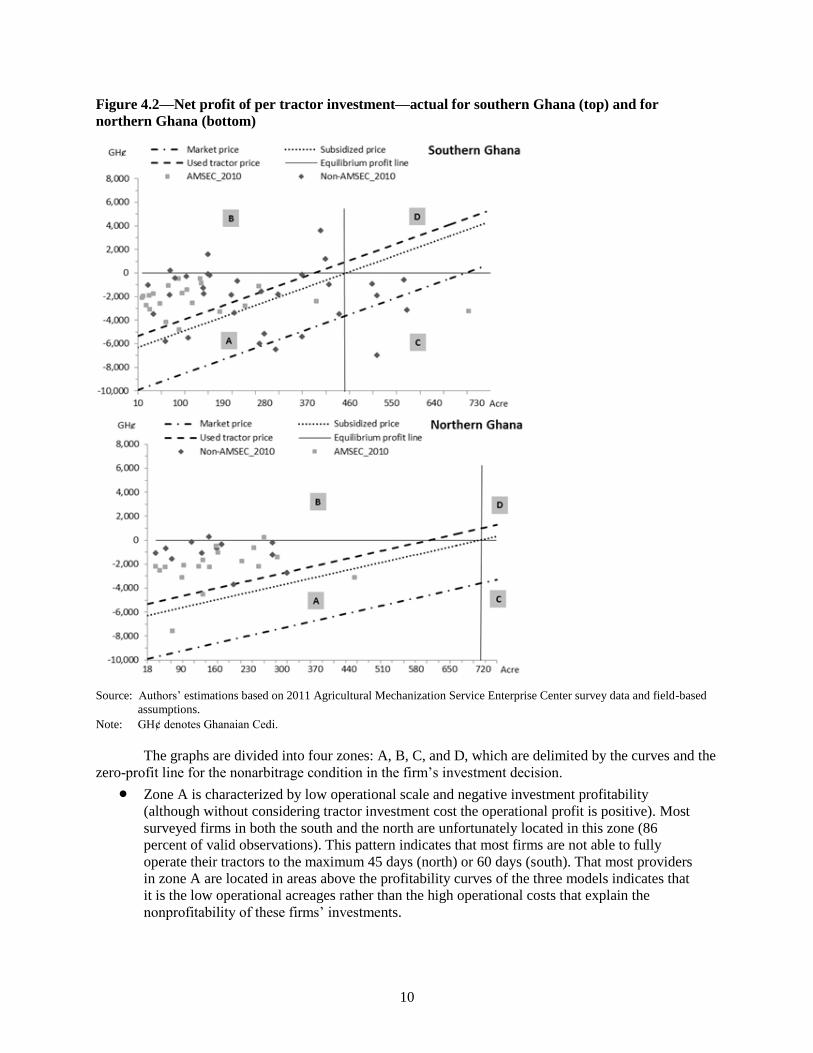
4.2—Net profit of per tractor investment—actual for southern Ghana (top) and for northern Ghana
(bottom) 10
v
SUMMARY | APRIL 2010
WORKING PAPER | September 2012
ABSTRACT
Since 2007, the government of Ghana has been providing subsidized agricultural machines to private
enterprises established as Agricultural Mechanization Services Enterprise Centers (AMSEC) to scale up
tractor-hire services to smallholder farmers. Although farmer’s demand for mechanization has increased
in recent years, most of this demand concentrates on land preparation (plowing) service. Using the firm
investment model and recent data, this paper quantitatively assesses whether AMSEC as a private
enterprise is a viable business model attractive to private investors. Even though the intention of the
government is to promote private sector-led mechanization, findings suggest that the AMSEC model is
unlikely to be a profitable business model attractive to private investors even with the current level of
subsidy. The low tractor utilization rate as a result of low operational scale is the most important
constraint to the intertemporal profitability of tractor-hire services. Our findings further support the
argument of Pingali, Bigot, and Binswanger (1987), who indicated that mechanization service centers
supported through government’s heavy subsidy are not a policy option anywhere in the world, even in the
current situation in Ghana. Although the tractor rental service market is a proper way of mechanizing
agriculture in a smallholder-dominated agricultural economy such as Ghana, this paper concludes that the
development of such a market depends crucially on a number of factors, including increased tractor use
through migration across the two very different rainfall zones (north and south), increased tractor use
through multiple tasks, and use of low-cost tractors. The government can play an important role in
facilitating the development of a tractor service market; however, the successful development of such a
market depends on the incentive and innovation of the private sector, including farmers who want to own
tractors as part of their business portfolio, traders who know how to bring in affordable tractors and
expand the market, and manufacturers in exporting countries who want to seek a long-term potential
market opportunity in Ghana and in other west African countries.
Keywords: agricultural transformation, mechanization, tractor-hire service, firm investment,
government policy on mechanization, Ghana
vi
SUMMARY | APRIL 2010
WORKING PAPER | September 2012
AKNOWLEDGMENTS
We would like to thank the regional and district staff of the Agricultural Engineering Services Directorate
(AESD) of the Ministry of Food and Agriculture for facilitating field interviews. Particularly, we express
our gratitude to Eng. Joseph Kwasi Boamah (director— engineering) and Eng. George K. A. Brantuo
(deputy director—engineering) at the AESD for providing useful comments. We also thank Eng. Gerald
Kojo Ahorbo and Dr. Victor Owusu for collecting the data on which this work is based. We acknowledge
the farmers, tractor owners, and numerous stakeholders who participated in the field surveys. This work
greatly benefited from comments from the participants of the 2013 Allied Social Sciences Association
meeting in San Diego, California, United States; and discussions with Xiaobo Zhang, Hiroyuki
Takeshima, and Alejandro Nin Pratt at IFPRI headquarters. We would also like to thank one anonymous
reviewer.
1
1. INTRODUCTION
Since 2007, the government of Ghana (GoG) has embarked on a bid to transform agriculture under its
Medium Term Agricultural Investment Plan and Accelerated Agricultural Modernization Policy. This
effort has led to the establishment of private enterprises known as Agricultural Mechanization Services
Enterprise Centers (AMSEC) and to the provision of subsidized agricultural machines to these centers.
Although the government’s subsidy on tractors for individual farmers (mainly medium and large farmers)
has been the policy since the late 1990s, the focus of such subsidies shifted to AMSECs after 2007. Even
though different types of agricultural equipment have been imported and distributed to AMSECs under
subsidized prices, observed mechanization services provided by AMSECs concentrate primarily on land
preparation, especially plowing. As a result, tractors are usually parked and remain unused after the
plowing seasons in the country. This pattern of demand for mechanization services raises the questions of
whether the current AMSEC policy is a practical model for agricultural mechanization service provision
and whether such enterprises can be a business model attractive to private investors.
Historically, tractor-based mechanization often has enjoyed popular support among policymakers
across Africa south of the Sahara because it is seen as vital to increasing production and relieving
drudgery in agriculture. From 1950 to 1980, many developing countries established state-run, subsidized
tractor-hire schemes to extend tractor-based mechanization to small farmers (see, for example, Food and
Agriculture Organization of the United Nations [FAO] 2008; Li 2005; Eziakor 1990; Akinola 1986;
Kolawole 1972; Chancellor 1969).1 These previous attempts to mechanize agriculture in Africa south of
the Sahara failed to induce sustained adoption of mechanization after the end of the initial government
support (see, for example, FAO 2008; Pingali 2007). A major lesson learned from the past is that
successful development of farm mechanization has rarely been driven by the government’s direct
involvement in machinery supply, development, and financing or by offering mechanization hire services
(FAO 2011; Pingali, Bigot, and Binswanger 1987). Yet, a few African countries support mechanization
today with similar policies, including tractor purchase (imports), tractor distribution, and tractor subsidies.
Using firm investment theory and survey data collected from tractor service providers in Ghana, we
examine the intertemporal profitability of agricultural mechanization services with a focus on land
preparation. This research is intended to contribute to the current policy debate on agricultural
mechanization in the country. Findings suggest that AMSEC as a specialized service provider is not a
viable business model, even with the current level of subsidy in the country. Furthermore, our results
indicate that underutilization of tractors as a result of low operational scale is the most important
constraint to the profitability of investment in specialized agricultural mechanization service provision.
This paper is organized as follows. Section 2 describes the current organization of the tractor service
provision market. Section 3 presents the theoretical framework applied, and section 4 presents the results.
Section 5 offers our concluding remarks.
1 See Obi and Chisango (2011), Binswanger (1978), and Hayami and Kawagoe (1989) for a review of the theories and
evidence surrounding the massive state involvement in agricultural mechanization in the 1950s and 1960s.
2
2. ORGANIZATION OF THE AGRICULTURAL MECHANIZATION SERVICE PROVISION MARKET
In Ghana, the first boost to agricultural mechanization took place after independence in 1957 when the
new government offered highly subsidized mechanized services to farmers (Boamah 2006). The GoG
withdrew from direct service provision in the early 1980s. Today’s unmet demand for mechanized
services in farming is perceived by GoG to be the result of a shortage of domestic tractor stock—a belief
that has significantly shaped GoG’s agricultural mechanization policy. Mechanization service provision
now is dominated by individual tractor owners and AMSECs set up with the support of GoG.
The AMSEC concept was initiated in 2003 to provide timely and affordable mechanized services
to farmers who cannot afford agricultural machinery on their own (Agricultural Engineering Services
Directorate, 2003). Initially, the proposed AMSEC package included a range of agricultural machinery,
such as tractors, harvesters, boom sprayers, planters, power tillers, seed drillers, slashers, ridgers, and rice
mills. However, during AMSEC implementation, this package changed. On average, each AMSEC was
allocated a package of five tractors with basic implements (plows, harrows), plus a trailer. According to
the Agricultural Engineering Services Directorate of the Ministry of Food and Agriculture, this decision
to allocate five tractors was based on the expectation that each AMSEC could serve in a season about 500
small-scale farmers with average landholding of 2.0 hectares (ha). A total of 89 AMSECs have been
established to date (see Table 2.1).
Table 2.1—Package and allocation terms of agricultural machinery to Agricultural Mechanization
Services Enterprise Centers, 2008 to 2011
2008 2009 2010 2011 Total
Number of agricultural mechanization services enterprise centers established
12 57 15 5 89
Package—average number of tractors 8.2 5.1 4.3 3.0 472
Source: Compiled from Agricultural Engineering Services Directorate (2011) data.
More than 90 percent of Ghana’s farming population consists of small-scale farmers, farming less
than 2 hectares on quite widely distributed farms (Statistics, Research, and Information Directorate 2011).
Farming is mostly a rainfed activity, and the timing of plowing is critical. “If there is no rain, there is no
business for a mechanization service provider,” said one of our interview respondents. The seasonal
pattern of demand for plowing service is strong. This demand pattern was confirmed by the 2011 survey
results (see Benin et al. 2012), which show that in 2009 and 2010 plowing revenues both for AMSEC and
for non-AMSEC providers amounted to 88 percent and 90 percent of their total revenues, respectively. Of
the revenues, 10–12 percent came from carting farm products and transportation.
The peak demand period spreads from June to July in the north, where a single cropping season
dominates as a result of a single major rainy season. This pattern allows for about 45 effective days of
plowing (April through September). In the south, two cropping seasons are possible, and the peak demand
period spreads from April to June during the major rainy season (March through July) and from
September to October during the minor rainy season (September through November), allowing for 60
effective days of plowing in total.
Although the demarcation between seasons makes it possible for tractor service providers to
migrate from the north to the south (and vice versa) to offer plowing services (for a maximum of 45 days)
in either region, in practice, migratory service providers are rare. Information gathered for this study
indicates that few AMSECs and individual tractor owners migrated across the two rainfall zones between
the north and south. A number of factors may explain the limited migration of tractor service providers
across regions, including providers’ lack of knowledge and limited networks outside their own regions,
additional costs imposed by operators’ oversight, and lack of support in making the necessary logistic
arrangements. With a constraint on tractor utilization beyond the local plowing seasons, it is important to

3
assess whether a specialized tractor service provider can survive, given the initial investment necessary to
run such a business. The high price of imported tractors has led to the strong belief that the state should
subsidize the provision of agricultural machinery services to farmers. Although it is true that such
machines are not affordable to many individual farmers, any subsidy should be designed in such a way
that it does not create a barrier to developing a sustainable supply chain for agricultural machinery in
which the private sector can play a leading role in this aspect of the transformation of agriculture in the
country.
4
3. METHODOLOGY
General Considerations
This research uses data from several sources. In April 2012, we interviewed both various stakeholders
along the agricultural machinery supply chains and service beneficiaries across the country. Information
gathered from these interviews was combined with the 2011 AMSEC survey data collected by a team of
consultants with assistance from the International Food Policy Research Institute.2 This survey was
conducted as part of the evaluation of the Ministry of Food and Agriculture’s four special initiatives,
which aim at accelerating the modernization of agriculture and increase the productivity of Ghanaian
farmers. These four special initiatives include (1) the subsidization of agricultural mechanization services
via support to the establishment and operation of AMSECs, (2) the subsidization of fertilizers via the
National Fertilizer Subsidy Program, (3) the establishment and management of block farms that benefit
from subsidized mechanization services and inputs (fertilizers, improved seed, and pesticides) and
extension services, and (4) the stabilization of output prices via the establishment and operation of the
National Food Buffer Stock Company.
A combination of purposive and random sampling of service providers and corresponding
districts was used to select the sample. First, a random selection of about 50 percent of the AMSEC
service providers operating or located within each of the relevant regions was performed. Then, for each
selected AMSEC service provider at least 2 non-AMSEC service providers in the same area were
selected. In total, 48 AMSEC and 88 non-AMSEC service providers were interviewed, depending on
providers’ availability and willingness to participate in the survey (see Benin et al. 2012 for further details
on the AMSEC survey). Given that both providers’ businesses are expected to be profitable, we treat them
as individual firms without distinction in our analysis.
Using firm investment theory and field-based assumptions on various costs, revenues, and tractor
efficiency, we first estimate the profitability of the provision of specialized plowing services under a
normal situation. Since rainfall patterns and service price levels differ between the north and south,
separate models were estimated for the two regions. Furthermore, we determine the actual profitability of
the AMSECs. This assessment implicitly considers the current functioning of the service rental market,
which is characterized by several constraints and weaknesses that, in combination, affect the overall
profitability of such businesses. Our analysis was informed by previous research on the profitability of
tractor hire services, including that of Paman, Uchida, and Inabaz (2010); Mahama et al. (2008);
Jayasuriya, Amanda Te, and Herdt (1986); and Chancellor (1969).
Theoretical Framework: Firm Investment Theory
To model investments in agricultural mechanization services, we adopted a modified version of the firm
investment theory described in Diao, Yeldan, and Roe (1998), who adapted it from Barro and Sala-i-
Martin (1995). Mechanization service provision is considered a business run by a firm. The firm’s goal is
to maximize its intertemporal net profit π, taking existing service provision technology; market prices for
service provision, fuel, and other inputs; and labor wage rates as given. The firm as an investor decides
between a plowing service business by investing in a tractor and saving in a bank to earn interest. The
firm will invest in a tractor only when the returns to such investment are higher than the interest earned on
saving the same amount of capital in a bank. This comparison is critical here as investing in a tractor is
riskier than saving in a bank. If the capital is convertible, that is, the money invested in tractor can be
taken back easily by selling the tractor, such investment has little risk for the investor. We first assume
that this is the case; that is, the tractor owner can easily sell his or her used tractor without any risk on the
2 We would like to thank Gerald Ahorbo and Victor Owusu, who conducted the survey of service providers, for numerous
and fruitful conversations and for sharing the survey data.

5
used tractor market, which does exist in the country. We show later that relaxing this assumption does not
affect our conclusions.
Furthermore, we did not consider inflation in the discount and interest rates. We also assume that
both rates are constant over time to simplify the model. Since a credit market for financing tractor
purchase does not exist in the country, we assume that the investor invests its own money instead of
borrowing. In Ghana, market-based lending rates are much higher than the saving rates of 7 percent used
in the model. Such a low saving interest rate increases the profitability of investing in a tractor. As shown
later in our analysis, however, even at such a low interest rate, investing in a tractor is not a viable option
for the investor. We further assume that once the firm invests in a tractor, the latter lasts for a certain
period (10 years in this case). With the required annual maintenance, the productivity of the tractor is not
affected by its depreciation. After 10 years, the old tractor will be replaced by a new one, the cost of
which is covered by the accumulated depreciation as part of the investment profit. To simplify the issue,
we further assume that the firm will always purchase the same tractor at the same price—that is, we
ignore the possibility that the firm may grow through increased capital accumulation.
Mathematically, this firm’s investment decision in any one 10-year period can be modeled as
maximizing the value of the following equation:
∑ (1)
, (2)
where π is the total discounted net profit over 10 years (as the tractor’s lifetime is assumed to be 10
years), is the annual discount factor, is the annual saving interest rate, and is the actual tractor cost
paid by the firm initially, assuming that the firm invests its own money and ignoring the cost of
borrowing. is the gross margin for the firm (that is, annual service provision revenue minus variable
costs). The gross margin in year t can be estimated as follows:
, (3)
where is the market-determined plowing service charge per acre, is the acreage plowed, represents
the fuel and lubricant costs per acre, represents the labor costs per acre, and M represents the
maintenance and repair costs, including other fixed operating costs per year. P, F, L, and M are assumed
to be constant over time.
Although equation (1) defines π for only one investment cycle (10 years), we assume that the firm
will reinvest in the same type of tractor, and the investment cycle will restart at the end of each cycle so
that the business is sustained in a natural fashion. Thus, the intertemporal decision for this firm can be
analyzed as an infinite time horizon problem, which allows us to ignore termination issues for this firm.
Solving this intertemporal profit maximization problem by taking into consideration capital
depreciation yields the following nonarbitrage condition:
, (4)
where is the capital depreciation rate. Equation 4 indicates that the nonarbitrage condition requires that
the gross margin G minus the annual depreciation cost of the tractor investment equals the interest earned
from saving the same capital at a bank. At this equilibrium point, the investor is indifferent between
investing in a tractor and saving. Given that once the investment in the tractor is made, the firm cannot
sell it and save the capital, equation (4) needs to hold over the entire time horizon of 10 years, although it
may not hold in each of the 10 years. To simplify the analysis, however, we assume that A1 = A2 = … =
A10 and and r are constant, so that equation (4) holds for each year. In other words, to make tractor
investment more attractive than simply earning annual interest from savings, the profits from tractor
6
service provision minus tractor annual depreciation cost must be higher than the returns (interest) from
saving the capital (tractor investment cost) at a bank in each year.
Let define the annual net profit from investing in a tractor—that is, the profit
minus the interest earned from saving the capital. Substituting the right-hand side of equation (3) for G
yields
. (5)
Given P, F, L, M, r, and , the net profit N depends on two key factors: the acreage plowed, A,
and the initial investment, I. We illustrate the relationship between N and A at different levels of I in the
following section.
Calibrating the Model to the Ghanaian Situation
We calibrate equation (5) using actual data or information for parameters P, F, L, and M with the
assumption of = 0.1 and r = .07. Parameters were estimated using field-observed information on costs,
prices, and tractor efficiency. For I, we consider three types of tractor prices: a normal business model in
which the tractor (and plow) price is not subsidized, a subsidized business model in which the subsidized
tractor price is similar to the price offered by the government, and a used tractor business model in which
a nonsubsidized price for used tractors found on the local market is considered.
The main reason for considering the third model is that the used tractor business has existed in
Ghana for a long time, and demand remains strong despite the government’s subsidy on new tractors.
Moreover, information collected from our field visits shows that the field efficiency of used tractors is
comparable with that of new tractors. Used tractors are much cheaper than new tractors; they are
purchased on the private market and do not enjoy any government subsidy or financial-sector credits
support.
Appendix Tables A.1 - A. 3 summarize the main assumptions regarding costs and revenues made
for our analysis.
7
4. PROFITABILITY OF AGRICULTURAL MECHANIZATION SERVICE PROVISION: MAIN RESULTS
Is Specialization in Agricultural Mechanization a Viable Business Model?
As mentioned earlier, we assess the profitability of specialized agricultural mechanization service
provision based on various cost and revenue assumptions. The graphs in Figure 4.1 illustrate the
relationship between the numbers of acres plowed and the net profit per tractor for the south and north of
Ghana, respectively. In all of our theoretical models, the tractor operational efficiency is assumed to be
the same.
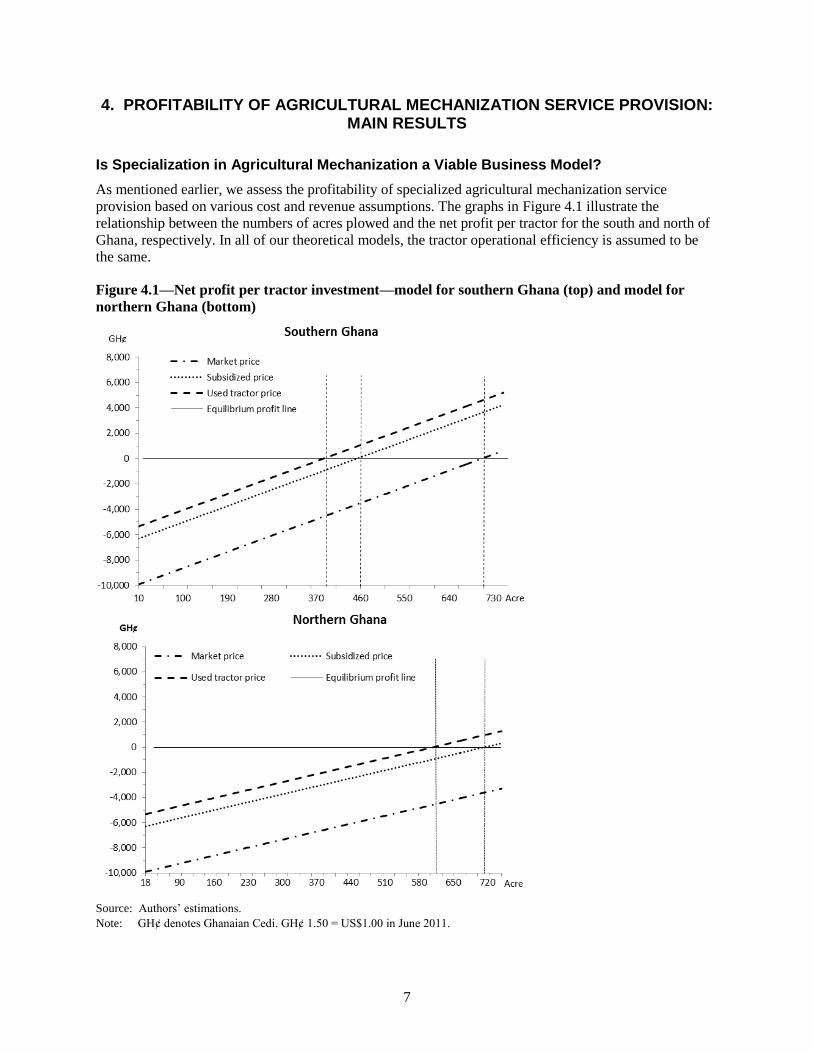
Figure 4.1—Net profit per tractor investment—model for southern Ghana (top) and model for
northern Ghana (bottom)
Source: Authors’ estimations.
Note: GHȼ denotes Ghanaian Cedi. GHȼ 1.50 = US$1.00 in June 2011.
8
Profitability is monotonically increasing with the number of acres plowed. The horizontal zero-
profit line represents the nonarbitrage condition displayed in equation (4). It represents the equilibrium in
which investing in a tractor yields the same return as saving the money in a bank to earn interest. Below
the equilibrium (or nonarbitrage) point, an investor prefers to save at a bank, whereas above this point, an
investor has an incentive to invest in a tractor, and mechanized service provision can be a rational
investment. This equilibrium point shows the minimum number of acres that must be plowed for
accumulated profits over 10 years (discounted by the interest rate on savings) to cover the tractor
investment cost, accounting for depreciation.
Given a tractor field capacity of 10 acres per day, 60 effective plowing days in the south, and 45
days in the north, the maximum number of acres that can be plowed by a tractor in the two seasons is
about 600 acres in the south and 450 acres in the single major season in the north. As indicated in Figure
4.1, both used and subsidized tractors are likely to be profitable in southern Ghana, as their equilibrium
points are at 380 and 460 acres, respectively—below the maximum number of acres that can be plowed in
southern Ghana. In northern Ghana, about 600 acres and 710 acres are required to reach the equilibrium
point for used and subsidized tractors, respectively, whereas the maximum number of plowed areas
possible is only 450 acres. This is because the service charge in northern Ghana is about 25 percent lower
than in southern Ghana. As a result, the gross margin is lower in the north, even though labor costs are
lower in this region of the country and fuel and maintenance costs are comparable between the regions.
Taking into consideration the differences in gross margin and effective plowing days between the north
and the south, the results suggest that none of the three models in the north is profitable at the maximum
effective plowing days—45 days to plow 450 acres in total. These results are not comparable with
findings from the West African Rice Development Association discussed by Pingali, Bigot, and
Binswanger (1987), who suggest that in the 1960s, with an average of 300 acres in a season, tractor-hire
services were profitable in northern Ghana. This result can be explained by the much lower tractor prices
and operating costs in the 1960s compared with those used in our analysis.
As mentioned earlier, if a used tractor cannot be easily sold on the used tractor market, investing
in a tractor would be more risky than simply saving at a bank. There are also other risks associated with
investing in a tractor, which we did not consider in our model. For example, service fees, fuel prices, and
maintenance costs are exogenous factors to tractor owners, and their changes can negatively affect the
returns to tractor investment. Likewise, weather-related risks such as a decrease in the number of effective
plowing days (due to erratic rainfalls) can reduce total revenues. In the Ghanaian case, falls in service fees
(per acre) are unlikely, and as observed during our field interviews, rises in fuel and other costs have been
passed on to farmers because demand for mechanization services is high and supply is the major
constraint to mechanization in the country. Nonetheless, we considered an additional scenario in which
certain risks associated with tractor investment are taken into account. Under this scenario, we simply
increased the interest rate from 7 percent to 10 percent, implying a risk premium of 3 percent. This
change results in higher acreage numbers at the equilibrium. For example, under the subsidized business
model, the numbers of acres at the equilibrium increase to 480 acres (from 460 acres) for the south and
760 acres (from 710 acres) for the north. These results further strengthen our conclusions and made
investment in tractor service provision more unattractive to the private sector.
Agricultural Mechanization Service Provision: Modeled versus Actual Profitability
In this section, we first examine the actual profitability of the providers across tercile groups and regions
using 2010 providers’ data. Table 4.1 presents the summary statistics across terciles as well as the model
estimates.

9
Table 4.1—Relationship (average) between profitability, cost efficiency, and operational scale
among providers by region
Region/Tractor Price
Terciles of Net Profit
a
Tercile Size
Tractor and Plow Price (GHȼ)
Maintenance Costs (GHȼ)
Number of Acres Plowed
Revenue (GHȼ)
Operational Profit (GHȼ)
Investment Profit (GHȼ)
No
rth
Mo
de
l
Market — — 34,222
4,243 450 11,250 4,061
–5,999
Subsidized — — 12,969 –2,387
Used tractor
— — 7,300 –1,423
Ac
tua
l p
rofi
t
1 12 16,439
(7,000; 19,667)
6,168
(100; 19,400)
221
(28; 580)
5,001
(700; 11,600)
1,845
(294; 4,686)
–7,118
(–21,440; –2,526)
2 12 13,304
(5,600; 18,000)
928
(150; 3,500)
139
(18; 280)
3,316
(365; 8,400)
1,319 (110; 4,200)
–1,871
(–2,261; –1,078)
3 10 9,968
(1,400; 18,000)
948
(260; 2,511)
138
(19; 251)
4,153
(380; 8,790)
2,082
(114; 4,897)
–466
(–1,064; 262)
So
uth
Mo
de
l
Market — — 34,222
4,243 600 19,800 8,550
–1,510
Subsidized — — 12,969 2,103
Used tractor
— — 7,300 3,066
Actu
al
pro
fit
1 18 15,912
(2,400; 30,000)
6,222
(635; 13,660)
245
(27; 705)
7,263
(1,060; 17,629)
3,235
(300; 7,930)
–5,692
(–14,776; –2,813)
2 18 14,096
(11,000; 20,000)
1,441
(51; 5,750)
143
(11; 510)
4,181
(375; 15,300)
1,833
(190; 6,885)
–1,925
(–2,755; –1,283)
3 18 10,167
(1,300; 20,000)
2,085
(100; 5,667)
230
(23; 567)
7,558
(900; 17,000)
3,665
(495; 8,580)
-148
(–1,133; 3,575)
Source: Authors’ estimations based on 2011 Agricultural Mechanization Services Enterprise Center survey data by Benin et al.
(2012).
Notes: Only six firms in the total sample (two in the north, four in the south) made positive net profits. GHȼ denotes Ghanaian
Cedi. a. Terciles of increasing net profits from 1 to 3. Tercile ranges are in parentheses.
Table 4.1 suggests that across terciles of net profitability operational profits are positive, whereas
investment profits are negative. Likewise, as investment profits increase across terciles, tractor and
maintenance costs decrease, with some exceptions. After a sharp drop between the first and second
terciles, maintenance costs remain steady in the second and third terciles. Plowing revenues and
operational profitability for incomes are lower in the second tercile but higher and comparable between
the first and third terciles, indicating a similar operational scale between these two terciles. Table 4.1 also
indicates that the surveyed providers display on average a low operational scale compared with the limit
allowed by the seasons in both regions. We provide in Figure 4.2 a full picture of model outcomes and
actual profitability by plotting net profitability in the provider sample against the model curves.
10
Figure 4.2—Net profit of per tractor investment—actual for southern Ghana (top) and for
northern Ghana (bottom)
Source: Authors’ estimations based on 2011 Agricultural Mechanization Service Enterprise Center survey data and field-based
assumptions.
Note: GHȼ denotes Ghanaian Cedi.
The graphs are divided into four zones: A, B, C, and D, which are delimited by the curves and the
zero-profit line for the nonarbitrage condition in the firm’s investment decision.
Zone A is characterized by low operational scale and negative investment profitability
(although without considering tractor investment cost the operational profit is positive). Most
surveyed firms in both the south and the north are unfortunately located in this zone (86
percent of valid observations). This pattern indicates that most firms are not able to fully
operate their tractors to the maximum 45 days (north) or 60 days (south). That most providers
in zone A are located in areas above the profitability curves of the three models indicates that
it is the low operational acreages rather than the high operational costs that explain the
nonprofitability of these firms’ investments.
11
Zone B is characterized by a low operational scale with positive investment profits. A few
firms in the south are located in this zone, and almost no firms in the north are located in this
zone. This result indicates that although they operate at low scale, the extremely low
operational costs observed (lower than the average situation used in the models) make their
investments profitable. Assuming that there is no reporting error, two factors can explain the
profitability of these firms: low maintenance costs and low tractor prices. The low tractor
price indicates that these are used tractors with low maintenance costs. Enterprises in this
group may be owned by experienced farmers.
High operational scale but negative investment profits characterize zone C. A few firms in the
south are located in this zone, indicating that although their operational scale is high enough
potentially to yield positive returns, they still did not make any profits from their investments.
Further analysis shows that the high maintenance cost incurred by the firms is the main factor
behind their nonprofitability. The average maintenance cost for firms falling into zone C is
estimated at GHȼ 6,200, about 40 percent higher than the model assumption of GHȼ 4,200.
Zone D is the zone with high operational scale and high profit. Unfortunately, none of the
firms in either the south or the north are found in this zone. Overall, all firms in the north and
about 90 percent of firms in the south plowed fewer acres than are required to break even.
The average number of acres plowed by a firm was 168 and 206 in the north and the south,
respectively, and both are well below the equilibrium break-even points.
In summary, the low operational scale observed for most providers is the main factor behind the
nonprofitability of investing in specialized tractor service provision in the country. The results here are
based on data from 2010, a year with good rainfalls. According to Statistics, Research, and Information
Directorate (2011), average rainfall for 2010 is estimated at 12,000 millimeters, which is higher than the
10-year average (11,606 millimeters) for the period 2002–11. Our field interviews provided information
and anecdotes that may explain why most firms cannot fully operate. The most important reason is the
frequent breakdown of the tractors, including new tractors. Poor maintenance or lack of skilled operators
result in frequent breakdowns. Likewise, delays in repairs due to the unavailability of spare parts and lack
of qualified mechanics are contributory factors. Indeed, these constraints are not new to the sector. A few
decades ago, research by Kolawole (1972), Akinola (1986), and Eziakor (1990) identified the same
problems in Nigeria, and recently Paman, Uchida, and Inabaz (2010) reported similar issues in the Riau
province of Indonesia.
Although in theory specialized agricultural mechanization service provision is a profitable
investment in the south, in practice, there are numerous constraints that private enterprises have to
overcome along the supply chain of mechanization services. Therefore, it seems fair to say that a
specialized agricultural mechanization service provision model is not a realistic model that can be
operated and sustained by the private sector in Ghana, even with the current subsidy policy.
12
5. CONCLUDING REMARKS
This paper assesses whether the recent promotion of specialized AMSECs by GoG is a viable business
model attractive to the private sector. Findings suggest that specialization in agricultural mechanization
service provision at the current stage of agricultural development in Ghana is not attractive to the private
sector. Underutilization as a result of low operational scale is the most important constraint to the
profitability of investment in tractors for specialized agricultural mechanization service provision. Making
tractor-hire services profitable under current conditions requires either encouraging service providers’
migration across rainfall zones to increase their utilization rate or lowering the tractor investment cost.
Indeed, different rainfall patterns across agroecological zones in Ghana make possible migratory services
that can be promoted to increase the operational scale of tractor owners.
Reducing the tractor cost by further increasing the tractor subsidy seems not to be an option given
that the tractor price paid by AMSECs is only about 62 percent of the imported price and an AMSEC
pays only 20 percent of the subsidized price upfront. Thus, to lower the tractor cost, it is essential to
consider various options for introducing lower-cost and smaller tractors into the Ghanaian market. For
example, in Indonesia, Paman, Uchida, and Inabaz (2010) found that owners of low-cost and small
tractors have been able to realize the full operational capacity of the tractors and to achieve profitability in
their use. The used tractor model is one of the options as the used tractor market is fully operated by the
private sector in Ghana. However, the general consensus among government officials is that used tractors
should be neither encouraged nor supported through the private financial sector.
The tractor market is large and diverse in the world, but all tractors in Ghana are imported by
GoG, and the country has no domestic manufacturing capacity. With heavy subsidies on larger and more
costly tractors, the subsidy policy can distort the development of the tractor supply chain, and only
government-selected foreign manufacturers will get access to the Ghanaian market. As a result, many
types of lower-cost machines are unlikely to be introduced into the local market. Furthermore, foreign
manufacturers are unlikely to accumulate local market knowledge that is essential to developing more
suitable and affordable tractors for the country as well as for other West African countries. Without
widening the range of choices and opportunities for private providers, they will lack necessary incentives
to create more innovative approaches to increase their profits. Improving the utilization rate of tractors
may also be achieved through exploiting the potential of tractors for multiple uses. For example, tractor
use to power stationary equipment, such as pump for irrigation and tractor sharing for postharvest
operations, is practiced by farmers in the country and this should be encouraged. Multiple uses of tractors
emerge as a result of farmers’ innovation, which can be fostered when tractors are owned by farmers
themselves who know how best to use the machines, instead of by nonfarm enterprises. With a policy that
focuses on specialized service provision, farmers’ innovation in agricultural mechanization is unlikely to
occur.
13
APPENDIX: SUPPLEMENTARY TABLES
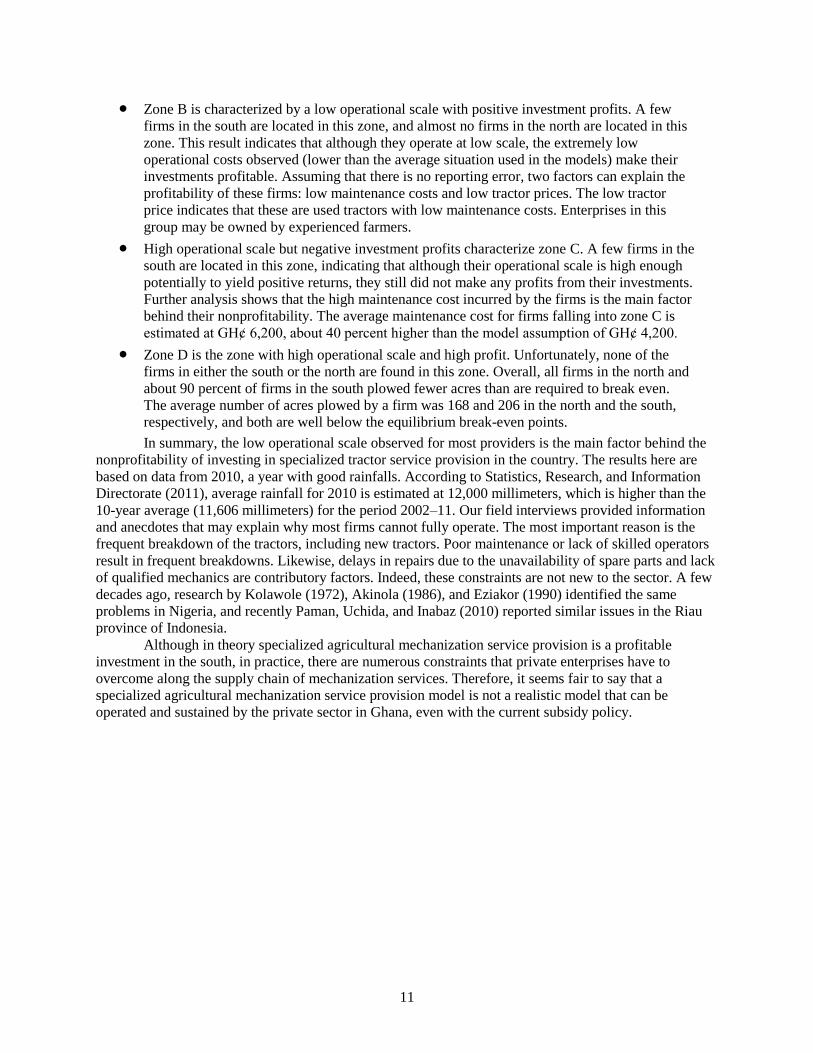
Table A.1—General assumptions
Assumptions
Provider has a good knowledge of and experience in farming and business.
There is demand for mechanization service.
Business focus is on plowing service only.
Costs and revenues are assumed to be constant over the years.
Plowing services are provided during both major seasons and the minor season in the south.
Capital invested is generated from the farmer’s own fund; there is no lending.
Interest rate on capital is 7 percent per year.
Source: Authors’ assumptions based on field data and Ministry of Food and Agriculture reports.
Table A.2—Model assumptions
Number Components Assumption Details
1
Three models:
1 tractor and 1 plow
Model 1: Normal business model
(2010 market prices, no subsidy) John Deere 55-horsepower tractor and three-disc plow: GHȻ 34,222
Model 2: Subsidized model (33%
subsidy on 2010 negotiated price) John Deere 55-horsepower tractor and three-disc plow: GHȻ 12,969
Model 3: Used hand tractor Tractor and plow: GHȻ 7,300
2 Tractor field capacity 9.88 acres per day (4 hectares)
3 Tractor lifetime (years) 10 years
4 Plough lifetime (years) 10 years
5 Annual tractor depreciation 10% of original investment in tractor
6 Annual plow depreciation 10% of original investment in plow
7 Lubricant costs as a percentage of fuel costs 15%
8 Fuel consumption per acre 1.5 gallons per acre
9 Fuel price per gallon GHȼ 8
10 Maintenance and repairs costs 7% of commercial tractor and plow prices
11 Shed building costs GHȼ 1,400
12 Shed useful life (years) 10 years
13 Annual shed depreciation 10% of shed-building costs
14 Office rental per year GHȼ 100
15 Comprehensive insurance per year GHȼ 571.02
16 Business registration (one-time payment) GHȼ 100
17 Business renewal per year GHȼ 20
18 Tractor registration at Driving License Authority GHȼ 62.70 (one-time payment)
19 Administrative costs 15% of operating costs
20 Discount rate or saving interest rate 7%
Source: Authors’ assumptions based on field data and Ministry of Food and Agriculture reports.
Note: GHȼ denotes Ghanaian Cedi.
Table A.3—Region-specific assumptions
Number Assumptions Northern Ghana Southern Ghana
1 2010 plowing service charge per acre (GHȼ) 25 33
2 Effective plowing days 45 60
3 Casual labor wages (one operator and one assistant)
10% of plowing revenue 15% of plowing revenue
Source: Authors’ assumptions based on field data and Ministry of Food and Agriculture reports.
Note: GHȼ denotes Ghanaian Cedi.
14
REFERENCES
Agricultural Engineering Services Directorate. 2011. List of Established Agricultural Mechanization Service
Enterprise Centers. Accra, Ghana: Ministry of Food and Agriculture.
________.2003. Establishment of Agricultural Mechanization Service Enterprise Centers (AMSEC Proposal 2003).
Accra, Ghana: Ministry of Food and Agriculture.
Akinola, A. A. 1986. “Government Tractor Hire Service Scheme as a Tractorization Policy in Africa: The Nigerian
Experience.” Agricultural Administration and Extension 25:63–71.
Barro, R. J., and X. Sala-i-Martin. 1995. “The Open Economy, Finite Horizons, and Adjustment Costs.” In
Economic Growth, McGraw-Hill Advanced Series in Economics, edited by L. H. Sutton and S. D.
Stratford. New York City, NY: McGraw-Hill, Inc.
Benin, S., M. Johnson, K. Jimah, J. Taabazuing, A. Tenga, E. Abokyi, G. Nasser, G. Ahorbo, and V. Owusu. 2012.
“Evaluation of Four Special Initiatives of the Ministry of Food and Agriculture, Government of Ghana.”
Final report, Ministry of Food and Agriculture, Accra, Ghana.
Binswanger, H. 1978. The Economics of Tractors in South Asia: An analytical Review. New York; Hyderabad,
India: Agricultural Development Council, New York; International Crops Research Institute for the Semi-
arid Tropics.
Boamah, J. K. 2006. “Policies on Engineering in Agricultural Development.” Paper presented at the Third National
Biannual Conference of the Ghana Society of Agricultural Engineering, Kumasi, Ghana, August.
Chancellor, W. J. 1969. Mechanization of Small Farms in West Malaysia by Tractor Hire Services. Davis, CA, US:
University of California, Davis.
Diao, X., A. E. Yeldan, and T. Roe. 1998. “A Simple Dynamic Applied General Equilibrium Model of a Small
Open Economy: Transitional Dynamics and Trade Policy.” Journal of Economic Development 23 (1): 77–
101.
Eziakor, E. G. 1990. “Comparative Analysis of the Effectiveness of Manual versus Mechanized Tillage among
Third-world Smallholders: A Case Study of the Bauchi State of Nigeria.” Agriculture, Ecosystems, and
Environment 31:301–312.
FAO (Food and Agriculture Organization of the United Nations). 2008. Agricultural Mechanization in Sub-Saharan
Africa: Time for a New Look. Occasional paper. Rome.
________. 2011. Investment in Agricultural Mechanization in Africa: Conclusions and Recommendations of a
Round Table Meeting of Experts. Agricultural and Food Engineering Technical Report. Rome.
Hayami, Y., and T. Kawagoe. 1989. “Farm Mechanization, Scale Economies, and Polarization: The Japanese
Experience.” Journal of Development Economics 31:221–239.
Jayasuriya, S. K., A. Te, and R. W. Herdt. 1986. “Mechanisation and Cropping Intensification: Economics of
Machinery Use in Low-wage Economies.” Journal of Development Studies 22 (2): 327–335.
Kolawole, M. 1972. “Economic Aspects of Tractor Contracting Operations in Western Nigeria.” Journal of
Agricultural Engineering Research 17:289–294.
Li, S. 2005. “Agricultural Mechanization Promotion in China—Current Situation and Future.” Agricultural
Engineering International: The CIGR Journal of Scientific Research and Development 7:1–17.
Mahama, A. A., M. Josiah, R. Bani, and S. Musah. 2008. “Input Cost of Tractor Operations in Ghana Using the
Farmtrac 70 Tractor.” Journal of Food, Agriculture, and Environment 6 (3/4): 397–401.
Obi, A., and F. F. Chisango. 2011. “Performance of Smallholder Agriculture under Limited Mechanization and the
Fast Track Land Reform Program in Zimbabwe.” International Food and Agribusiness Management
Review 14 (4): 85–104.
15
Paman, U., S. Uchida, and S. Inabaz. 2010. “The Economic Potential of Tractor Hire Business in Riau Province,
Indonesia: A Case of Small Tractor Use for Small Rice Farms.” Agricultural Engineering International:
The CIGR Ejournal 12 (1): 135–142.
Pingali, P. 2007. “Agricultural Mechanization: Adoption Patterns and Economic Impact.” In Handbook of
Agricultural Economics, Vol. 3, edited by R. Evenson and P. Pingali. Amsterdam: Elsevier.
Pingali, P., Y. Bigot, and H. Binswanger. 1987. Agricultural Mechanization and the Evolution of Farming Systems
in Sub-Saharan Africa. Washington, DC: World Bank.
Statistics, Research, and Information Directorate. 2011. Agriculture in Ghana: Facts and Figures (2010). Accra,
Ghana: Ministry of Food and Agriculture.

RECENT IFPRI DISCUSSION PAPERS
For earlier discussion papers, please go to www.ifpri.org/pubs/pubs.htm#dp. All discussion papers can be downloaded free of charge.
1254. A partial equilibrium model of the Malawi maize commodity market. Mariam A. T. J. Mapila, Johann F. Kirsten,
Ferdinand Meyer, and Henry Kankwamba, 2013.
1253. Exchange rate policy and devaluation in Malawi. Karl Pauw, Paul Dorosh, and John Mazunda, 2013.
1252. A regional computable general equilibrium model for Honduras: Modeling exogenous shocks and policy alternatives.
Samuel Morley and Valeria Piñeiro, 2013.
1251. Agricultural trade: What matters in the Doha Round? David Laborde and Will Martin, 2013.
1250. Opportunities and challenges for community involvement in public service provision in rural Guatemala. Johanna Speer
and William F. Vásquez, 2013.
1249. Rising wages in Bangladesh. Xiaobo Zhang, Shahidur Rashid, Kaikaus Ahmad, Valerie Mueller, Hak Lim Lee, Solomon
Lemma, Saika Belal, and Akhter Ahmed, 2013.
1248. How are farmers adapting to climate change in Vietnam?: Endogeneity and sample selection in a rice yield model.
Bingxin Yu, Tingju Zhu, Clemens Breisinger, and Nguyen Manh Hai, 2013.
1247. Evaluating the local economywide impacts of irrigation projects: Feed the Future in Tanzania. Mateusz Filipski, Dale
Manning, J. Edward Taylor, Xinshen Diao, and Angga Pradesha, 2013.
1246. Factor endowments, wage growth, and changing food self-sufficiency: Evidence from country-level panel data . Keijiro
Otsuka, Yanyan Liu, and Futoshi Yamauchi, 2013.
1245. Impact of food price changes on household welfare in Ghana. Nicholas Minot and Reno Dewina, 2013.
1244. Parametric decomposition of the Malmquist Index in an output-oriented distance function: Productivity in Chinese
agriculture. Bingxin Yu, Xiyuan Liao, and Hongfang Shen, 2013.
1243. Extreme weather and civil war in Somalia: Does drought fuel conflict through livestock price shocks? Jean-Francois
Maystadt, Olivier Ecker, and Athur Mabiso, 2013.
1242. Evidence on key policies for African agricultural growth. Xinshen Diao, Adam Kennedy, Ousmane Badiane, Frances
Cossar,Paul Dorosh, Olivier Ecker, Hosaena Ghebru Hagos, Derek Headey, Athur Mabiso, Tsitsi Makombe, Mehrab
Malek, and Emily Schmid, 2013.
1241. A global assessment of the economic effects of export taxes. David Laborde, Carmen Estrades, and Antoine Bouёt, 2013.
1240. The Women’s Empowerment in Agriculture Index. Sabina Alkire, Ruth Meinzen-Dick, Amber Peterman, Agnes R.
Quisumbing, Greg Seymour, and Ana Vaz, 2012.
1239. Food price volatility in Africa: Has it really increased? Nicholas Minot, 2012.
1238. The comprehensive Africa agriculture program as a collective institution. Shashidhara Kolavalli, Regina Birner, and
Kathleen Flaherty, 2012.
1237. Mechanization in Ghana: Searching for sustainable service supply models. Xinshen Diao, Frances Cossar, Nazaire
Houssou, Shashidhara Kolavalli, Kipo Jimah, and Patrick Aboagye, 2012.
1236. Differential export taxes along the oilseeds value chain: A partial equilibrium analysis. Antoine Bouët, Carmen Estrades,
and David Laborde, 2012.
1235. The role of rural producer organizations for agricultural service provision in fragile states. Catherine Ragasa and
Jennifer Golan, 2012.
1234. Cash, food, or vouchers?: Evidence from a randomized experiment in Northern Ecuador. Melissa Hidrobo, John
Hoddinott, Amber Peterman, Amy Margolies, and Vanessa Moreira, 2012.
1233. Public expenditures, private incentives, and technology adoption: The economics of hybrid rice in South Asia. David J.
Spielman, Deepthi Kolady, Patrick Ward, Harun-Ar-Rashid, and Kajal Gulati, 2012.
INTERNATIONAL FOOD POLICY RESEARCH INSTITUTE
www.ifpri.org
IFPRI HEADQUARTERS
2033 K Street, NW Washington, DC 20006-1002 USA Tel.: +1-202-862-5600 Fax: +1-202-467-4439 Email: [email protected]
IFPRI ACCRA
CSIR Campus Airport Residential Area, Accra PMB CT 112 Cantonments, Accra, Ghana Tel.: +233 (0) 21 780-716 Fax: +233 (0) 21 784-752


![[S] Science of Agricultural Mechanization [2010] · Science of Agricultural Mechanization 3 Acknowledgments The Science of Agricultural Mechanization curriculum was presented to the](https://img.pdfslide.net/doc/110x75/5e89f395fdf1fb7ddc317c08/s-science-of-agricultural-mechanization-2010-science-of-agricultural-mechanization.jpg)