Embed Size (px)
Citation preview
BackgroundImpact assessment
The modelConclusions
Agricultural Productivity,
Economic Growth, and Food Security
Doug Gollin
Williams College
Agriculture for Development � Revisited
UC Berkeley, October 2010
Doug Gollin Agriculture and Growth
BackgroundImpact assessment
The modelConclusions
Outline
1 Background
2 Impact assessment
3 The model
4 Conclusions
Doug Gollin Agriculture and Growth

BackgroundImpact assessment
The modelConclusions
Outline
1 Background
2 Impact assessment
3 The model
4 Conclusions
Doug Gollin Agriculture and Growth
BackgroundImpact assessment
The modelConclusions
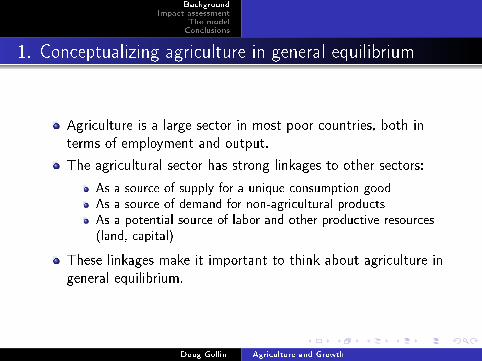
1. Conceptualizing agriculture in general equilibrium
Agriculture is a large sector in most poor countries, both in
terms of employment and output.
The agricultural sector has strong linkages to other sectors:
As a source of supply for a unique consumption goodAs a source of demand for non-agricultural productsAs a potential source of labor and other productive resources(land, capital)
These linkages make it important to think about agriculture in
general equilibrium.
Doug Gollin Agriculture and Growth

BackgroundImpact assessment
The modelConclusions
Agricultural productivity⇒Macroeconomic outcomesMany channels of connection
Agricultural performance a�ects GDP levels and growth rates
Agricultural production often has big impacts on in�ation rates
Governments may earn large shares of revenue from
agricultural exports (e.g., export taxes in many African
countries)
Poverty alleviation and inequality
Doug Gollin Agriculture and Growth
BackgroundImpact assessment
The modelConclusions
Macroeconomy ⇒Agriculture
Demand for products
Overall demand for labor
Exchange rates
Macro and monetary stability
Doug Gollin Agriculture and Growth
BackgroundImpact assessment
The modelConclusions
Outline
1 Background
2 Impact assessment
3 The model
4 Conclusions
Doug Gollin Agriculture and Growth
BackgroundImpact assessment
The modelConclusions
2. Impact assessment for agricultural interventions
Many agricultural interventions are targeted to the level of
farms or communities
New crop varietiesInput subsidiesRural roads and infrastructureEtc.
Doug Gollin Agriculture and Growth
BackgroundImpact assessment
The modelConclusions
Bene�ts spill overAre we looking in the right place?
Evaluations often focus on the impact of these interventions
on farm income or living standards.
These interventions may create some bene�ts at the farm level.
But bene�ts may instead be transmitted through markets to
others.
Consumers may bene�t through lower prices.Processors may bene�t through more consistent supply orlower costs.Firms in other sectors may demand more labor and drive upwage rates.
Micro evaluations that do not consider general equilibrium
e�ects may give misleading results.
Doug Gollin Agriculture and Growth
BackgroundImpact assessment
The modelConclusions
Example: Agricultural development
and structural transformation
Based on Gollin and Rogerson (2010), in a paper on Uganda.
Consider general equilibrium e�ects of programs and policies
that generate agricultural �development�.
These interventions cause the share of agriculture in GDP and
employment to fall.
Naive evaluation techniques might fail to recognize
agriculture's role.
Doug Gollin Agriculture and Growth

BackgroundImpact assessment
The modelConclusions
Outline
1 Background
2 Impact assessment
3 The model
4 Conclusions
Doug Gollin Agriculture and Growth

BackgroundImpact assessment
The modelConclusions
Related literature
Close in spirit to Eswaran and Kotwal (1993).
Some similarities to Caselli and Coleman (2001), Vollrath
(2004, 2008).
Also related to work on transportation and growth in
Herrendorf, Schmitz, and Teixeira (2006, 2008); Adamopoulos
(2005).
Most similar to models of structural transformation in Gollin,
Parente, and Rogerson (2004, 2007).
Doug Gollin Agriculture and Growth
BackgroundImpact assessment
The modelConclusions
Model environment
Consider a closed developing economy with two sectors: an
agricultural sector that produces food and an urban sector that
produces non-agricultural goods.
Non-agricultural goods can be consumed or used as inputs into
the production process in either sector.
Non-agricultural goods are produced in the city.
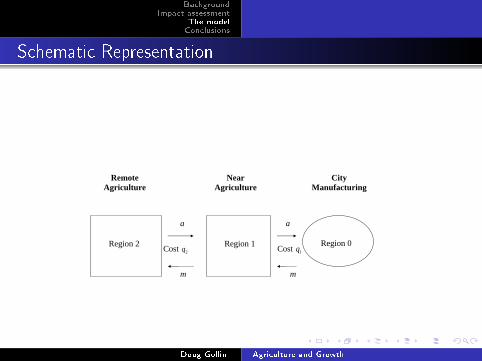
Food can be produced in either of two rural regions: an area
�close� to the city or an area that is more �remote�.
There are (high) transportation and transaction costs that
make it expensive to move manufactured goods from the city
to rural areas and (symmetrically) make it costly to move food
from rural areas to the city.
Doug Gollin Agriculture and Growth
BackgroundImpact assessment
The modelConclusions
Schematic Representation
Region 2 Region 0
a a
m m
Cost 1q Cost 2qRegion 1
City Manufacturing
Near Agriculture
Remote Agriculture
Doug Gollin Agriculture and Growth
BackgroundImpact assessment
The modelConclusions
Model environment, cont.
In equilibrium, people will inhabit all three regions.
Those in the remote rural area will produce less for the market
than those in the close rural area.
The urban population is limited by the ability of the
agricultural sector to produce �marketable surplus;� low
agricultural productivity implies small urban populations.
High transportation costs will make it costly to move goods
across regions.
Doug Gollin Agriculture and Growth
BackgroundImpact assessment
The modelConclusions
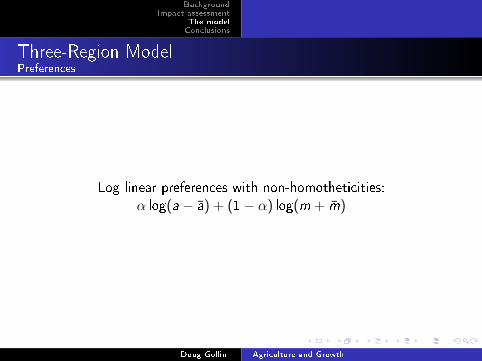
Three-Region ModelPreferences
Log linear preferences with non-homotheticities:
α log(a − a) + (1− α) log(m + m)
Doug Gollin Agriculture and Growth
BackgroundImpact assessment
The modelConclusions
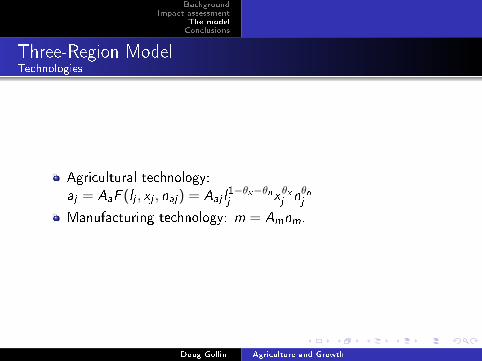
Three-Region ModelTechnologies
Agricultural technology:
aj = AaF (lj , xj , naj) = Aaj l1−θx−θnj xθxj nθnj
Manufacturing technology: m = Amnm.
Doug Gollin Agriculture and Growth
BackgroundImpact assessment
The modelConclusions
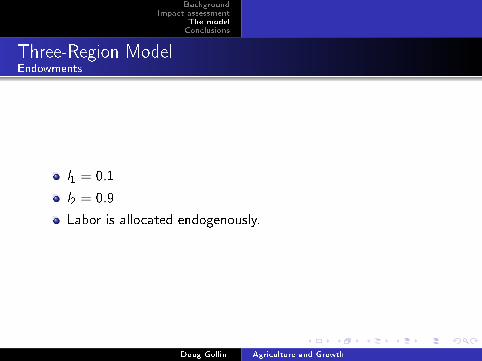
Three-Region ModelEndowments
l1 = 0.1
l2 = 0.9
Labor is allocated endogenously.
Doug Gollin Agriculture and Growth
BackgroundImpact assessment
The modelConclusions
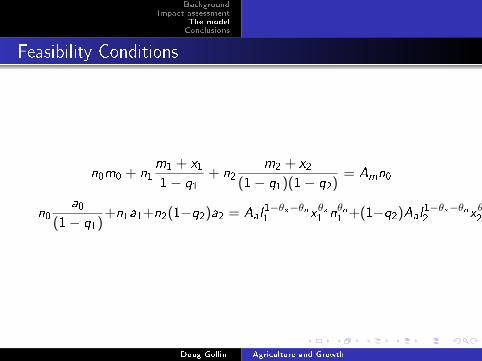
Feasibility Conditions
n0m0 + n1m1 + x1
1− q1+ n2
m2 + x2
(1− q1)(1− q2)= Amn0
n0a0
(1− q1)+n1a1+n2(1−q2)a2 = Aal
1−θx−θn1 xθx1 nθn1 +(1−q2)Aal
1−θx−θn2 xθx2 nθn2
Doug Gollin Agriculture and Growth

BackgroundImpact assessment
The modelConclusions
Equilibrium Allocations
For interior solution:
m0 + m =m1 + m
(1− q1)=
m2 + m
(1− q1)(1− q2)
a0 − a
(1− q1)= a1 − a = (1− q2)(a2 − a)
Corner solutions are plausible under some speci�cations. We
solve for them and check for them computationally.
Doug Gollin Agriculture and Growth
BackgroundImpact assessment
The modelConclusions
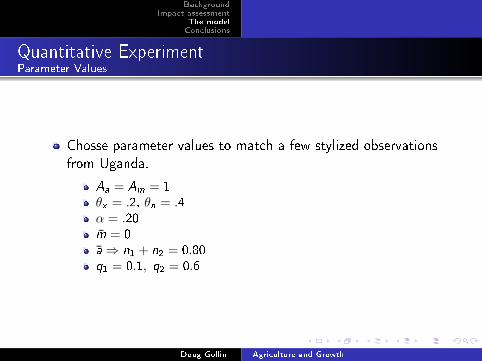
Quantitative ExperimentParameter Values
Chosse parameter values to match a few stylized observations
from Uganda.
Aa = Am = 1θx = .2, θn = .4α = .20m = 0a⇒ n1 + n2 = 0.80q1 = 0.1, q2 = 0.6
Doug Gollin Agriculture and Growth
BackgroundImpact assessment
The modelConclusions
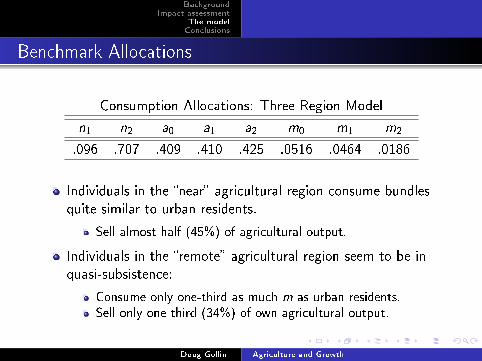
Benchmark Allocations
Consumption Allocations: Three Region Model
n1 n2 a0 a1 a2 m0 m1 m2
.096 .707 .409 .410 .425 .0516 .0464 .0186
Individuals in the �near� agricultural region consume bundles
quite similar to urban residents.
Sell almost half (45%) of agricultural output.
Individuals in the �remote� agricultural region seem to be in
quasi-subsistence:
Consume only one-third as much m as urban residents.Sell only one third (34%) of own agricultural output.
Doug Gollin Agriculture and Growth
BackgroundImpact assessment
The modelConclusions
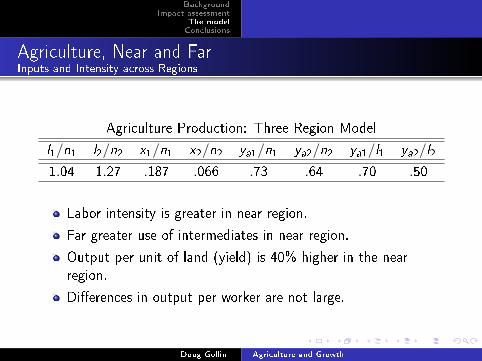
Agriculture, Near and FarInputs and Intensity across Regions
Agriculture Production: Three Region Model
l1/n1 l2/n2 x1/n1 x2/n2 ya1/n1 ya2/n2 ya1/l1 ya2/l2
1.04 1.27 .187 .066 .73 .64 .70 .50
Labor intensity is greater in near region.
Far greater use of intermediates in near region.
Output per unit of land (yield) is 40% higher in the near
region.
Di�erences in output per worker are not large.
Doug Gollin Agriculture and Growth
BackgroundImpact assessment
The modelConclusions
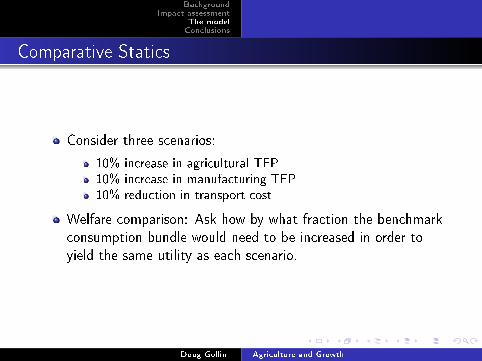
Comparative Statics
Consider three scenarios:
10% increase in agricultural TFP10% increase in manufacturing TFP10% reduction in transport cost
Welfare comparison: Ask how by what fraction the benchmark
consumption bundle would need to be increased in order to
yield the same utility as each scenario.
Doug Gollin Agriculture and Growth
BackgroundImpact assessment
The modelConclusions
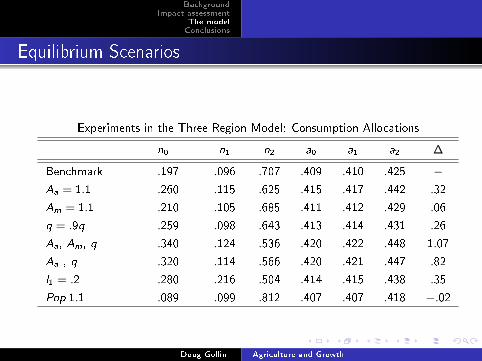
Equilibrium Scenarios
Experiments in the Three Region Model: Consumption Allocations
n0 n1 n2 a0 a1 a2 ∆
Benchmark .197 .096 .707 .409 .410 .425 −Aa = 1.1 .260 .115 .625 .415 .417 .442 .32
Am = 1.1 .210 .105 .685 .411 .412 .429 .06
q = .9q .259 .098 .643 .413 .414 .431 .26
Aa, Am, q .340 .124 .536 .420 .422 .448 1.07
Aa , q .320 .114 .566 .420 .421 .447 .82
l1 = .2 .280 .216 .504 .414 .415 .438 .35
Pop 1.1 .089 .099 .812 .407 .407 .418 −.02
Doug Gollin Agriculture and Growth

BackgroundImpact assessment
The modelConclusions
Manufacturing Consumption in Equilibrium
Experiments in the Three Region Model: Manufacturing Consumption
m0 m1 m2 ∆
Benchmark .052 .046 .019 −Aa = 1.1 .096 .087 .035 .32
Am = 1.1 .065 .059 .024 .06
q = .9q .085 .077 .036 .26
Aa, Am, q .16 .15 .068 1.07
Aa , q .14 .13 .057 .82
l1 = .2 .095 .085 .034 .35
Pop 1.1 .036 .032 .013 −.02
Doug Gollin Agriculture and Growth
BackgroundImpact assessment
The modelConclusions
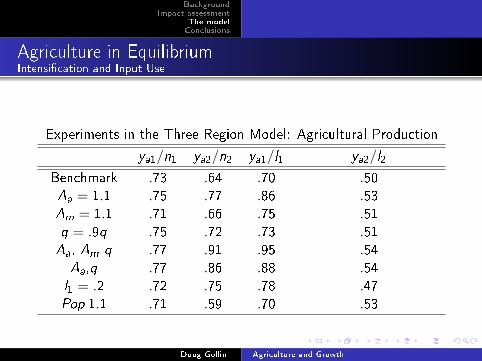
Agriculture in EquilibriumIntensi�cation and Input Use
Experiments in the Three Region Model: Agricultural Production
ya1/n1 ya2/n2 ya1/l1 ya2/l2
Benchmark .73 .64 .70 .50Aa = 1.1 .75 .77 .86 .53Am = 1.1 .71 .66 .75 .51q = .9q .75 .72 .73 .51Aa, Am q .77 .91 .95 .54Aa,q .77 .86 .88 .54l1 = .2 .72 .75 .78 .47Pop 1.1 .71 .59 .70 .53
Doug Gollin Agriculture and Growth

BackgroundImpact assessment
The modelConclusions
Agriculture in EquilibriumIntensi�cation and Input Use
Experiments in the Three Region Model: Agricultural Production
l1/n1 l2/n2 x1/n1 x2/n2
Benchmark 1.04 1.27 .187 .066Aa = 1.1 .87 1.44 .196 .080Am = 1.1 .95 1.31 .200 .075q = .9q 1.02 1.40 .221 .097Aa, Am q .81 1.68 .254 .137Aa,q .88 1.59 .225 .115l1 = .2 .92 1.59 .226 .094Pop 1.1 1.02 1.11 .176 .058
Doug Gollin Agriculture and Growth
BackgroundImpact assessment
The modelConclusions
Impact assessmentThe perils of overlooking GE e�ects
In all of these scenarios, 80-90 percent of welfare gains come
from sectoral reallocation of people, in the sense that
increasing consumption allocations alone would generate only
10-20% of the welfare gains.
Impact assessment techniquest that focus on �within� measures
of welfare gains will give misleading (low) estimates of impact.
Similar in spirit to Lewis model, in which growth consists of
moving people from a low productivity sector to a higher
productivity sector.
Doug Gollin Agriculture and Growth
BackgroundImpact assessment
The modelConclusions
Agricultural TFP increaseThe perils of overlooking GE e�ects
Consider the scenario in which agricultural TFP rises by 10%.
Our welfare measure suggests that this generates as much
improvement in well-being as a 32% increase in all
consumption allocations.
But suppose we do what is common in the agricultural
economics literature on impact assessment studies: we will
calculate increases in crop yields.
Doug Gollin Agriculture and Growth
BackgroundImpact assessment
The modelConclusions
Sectoral impacts in agriculture
At a national level, yield increases by 7.7% (for a
population-weighted sample) or 8.3% (for an area-weighted
sample). Both are smaller in percentage terms than the TFP
increases.
Agricultural output increases by 8.6%.
We do not calculate prices, but shadow prices fall in the model
economy. The value of agricultural output rises only very
slightly.
But the big e�ect is that 6.3% of the people move from rural
to urban areas, while another 1.9% move from
quasi-subsistence to commercial agriculture.
Doug Gollin Agriculture and Growth
BackgroundImpact assessment
The modelConclusions
Rural transportation infrastructure improvementsThe perils of overlooking GE e�ects
Consider the scenario in which transportation costs fall by
10%.
Our welfare measure suggests that this generates as much
improvement in well-being as a 35% increase in all
consumption allocations.
Suppose this policy is examined for its impact on rural
households.
Doug Gollin Agriculture and Growth
BackgroundImpact assessment
The modelConclusions
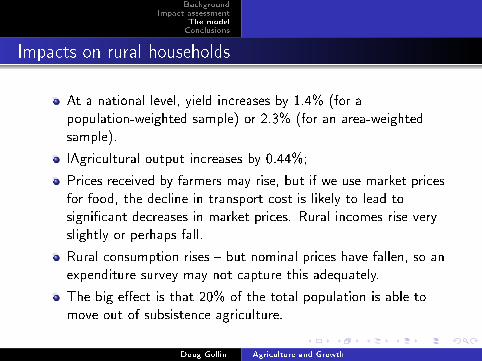
Impacts on rural households
At a national level, yield increases by 1.4% (for a
population-weighted sample) or 2.3% (for an area-weighted
sample).
lAgricultural output increases by 0.44%;
Prices received by farmers may rise, but if we use market prices
for food, the decline in transport cost is likely to lead to
signi�cant decreases in market prices. Rural incomes rise very
slightly or perhaps fall.
Rural consumption rises � but nominal prices have fallen, so an
expenditure survey may not capture this adequately.
The big e�ect is that 20% of the total population is able to
move out of subsistence agriculture.
Doug Gollin Agriculture and Growth
BackgroundImpact assessment
The modelConclusions
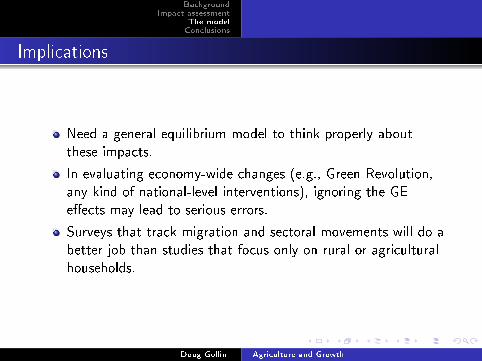
Implications
Need a general equilibrium model to think properly about
these impacts.
In evaluating economy-wide changes (e.g., Green Revolution,
any kind of national-level interventions), ignoring the GE
e�ects may lead to serious errors.
Surveys that track migration and sectoral movements will do a
better job than studies that focus only on rural or agricultural
households.
Doug Gollin Agriculture and Growth
BackgroundImpact assessment
The modelConclusions
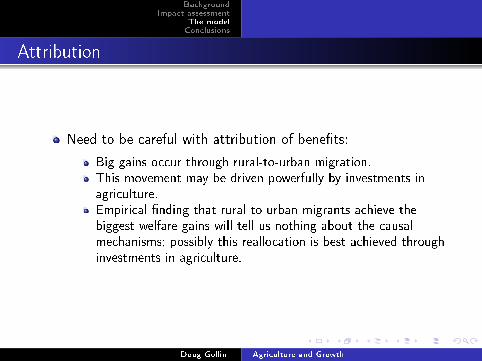
Attribution
Need to be careful with attribution of bene�ts:
Big gains occur through rural-to-urban migration.This movement may be driven powerfully by investments inagriculture.Empirical �nding that rural-to-urban migrants achieve thebiggest welfare gains will tell us nothing about the causalmechanisms; possibly this reallocation is best achieved throughinvestments in agriculture.
Doug Gollin Agriculture and Growth

BackgroundImpact assessment
The modelConclusions
Outline
1 Background
2 Impact assessment
3 The model
4 Conclusions
Doug Gollin Agriculture and Growth
BackgroundImpact assessment
The modelConclusions
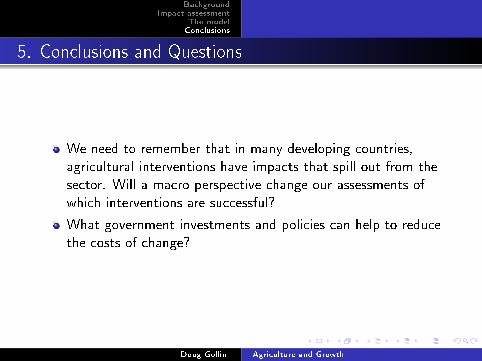
5. Conclusions and Questions
We need to remember that in many developing countries,
agricultural interventions have impacts that spill out from the
sector. Will a macro perspective change our assessments of
which interventions are successful?
What government investments and policies can help to reduce
the costs of change?
Doug Gollin Agriculture and Growth
BackgroundImpact assessment
The modelConclusions
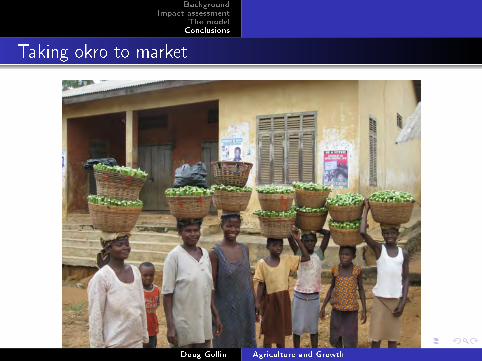
Taking okro to market
Doug Gollin Agriculture and Growth