Embed Size (px)
Citation preview
AGRICULTURAL SECTOR SKILLS PLAN
2011-2016:
Prepared on behalf of the Sector by AgriSETA
for submission to the Department of Higher Education and Training
AGRICULTURAL SECTOR STRATEGIC SKILLS PLAN August 2015
2
Table of Contents
Table of Contents .................................................................................................. 2 List of Acronyms ................................................................................................... 6 List of Tables ......................................................................................................... 7 List of Figures ........................................................................................................ 7 Chapter 1: SECTOR PROFILE ................................................................................ 8
1.1 Introduction ................................................................................................................. 8 1.2 Scope of coverage ........................................................................................................ 8 1.3 Key role players ......................................................................................................... 11
1.3.1 National government departments ................................................................... 11 1.3.2 Sector representatives ....................................................................................... 14
1.4 Economic performance.............................................................................................. 14 1.4.1 Overview of structure of the sector ................................................................... 14 1.4.2 GDP Contribution ............................................................................................... 15 1.4.3 Exports ................................................................................................................ 17 1.4.4 Revenue from Skills Development Levies .......................................................... 17
1.5 Employer profile ........................................................................................................ 17 1.6 Labour market profile ................................................................................................ 19
1.6.1 Occupational categories ..................................................................................... 21 1.6.2 Employee profile and trends .............................................................................. 23
1.7 Conclusion ................................................................................................................. 26 Chapter 2: KEY SKILLS ISSUES............................................................................ 27
2.1 Change Drivers ........................................................................................................... 27 2.1.1 Factors impacting on skills demand and supply ................................................. 27 2.1.2 Implications of these factors for skills planning ................................................. 39 2.1.3 Research methods employed ............................................................................. 40
2.2 Alignment with national strategies and plans ........................................................... 41 2.3 Implementing national strategies and plans ............................................................. 45 2.4 Conclusion ................................................................................................................. 46
Chapter 3: SKILLS MISMATCH ........................................................................... 47 3.1 Extent of skills demand .............................................................................................. 47
3.1.1 The National Education and Training Strategy for Agriculture (AET Strategy) .. 52 3.1.2 Skills demand forecasting by AgriSETA .............................................................. 53
3.2 Extent of skills supply ................................................................................................ 54 3.2.1 Colleges of agriculture ........................................................................................ 54 3.2.2 The role of AgriSETA in skills supply ................................................................... 56 3.2.3 Training Provider Perspectives ........................................................................... 56 3.2.4 Training Conducted ............................................................................................ 57
3.3 Scarce Skills and Skills Gaps ....................................................................................... 59 3.3.1 Top 10 Scarce Skills ............................................................................................ 59 3.3.2 Skills Gaps Overview ........................................................................................... 60
3.4 Conclusion ................................................................................................................. 62 Chapter 4: SECTOR PARTNERSHIPS ................................................................... 64
4.1 Current partnerships ................................................................................................. 64 4.1.1 Department of Rural Development and Land Reform (DRDLR) ......................... 64 4.1.2 Youth .................................................................................................................. 64 4.1.3 Department of Agriculture, Forestry and Fisheries (DAFF) ................................ 64 4.1.4 KZN Department of Agriculture.......................................................................... 65 4.1.5 Gert Sibande TVET College ................................................................................. 65
3
4.2 Planned Partnerships ................................................................................................. 65 4.2.1 Agricultural and TVET colleges ........................................................................... 65 4.2.2 Mentoring partnerships ..................................................................................... 66 4.2.3 SETA partnerships .............................................................................................. 67 4.2.4 Green Industry Partnership ................................................................................ 67
4.3 Partnership-related challenges .................................................................................. 68 4.4 Conclusion ................................................................................................................. 68
Chapter 5: Skills Priority Actions ....................................................................... 69 5.1 Introduction ............................................................................................................... 69 5.2 Key findings from previous chapters ......................................................................... 69 5.3 Key priority actions .................................................................................................... 70
5.3.1 Priority 1: Supporting skills development along the rural supply chain ............ 70 5.3.2 Priority 2: Skills to support equity in the sector ................................................. 70 5.3.3 Priority 3: skills to support enterprise development ......................................... 71 5.3.4 Priority 4: Improving the supply of quality education and training to the sector 72 5.3.5 Priority 5: skills for sustainability ....................................................................... 72 5.3.6 Priority 6: Building the capacity of government to support rural development 73
References .......................................................................................................... 74

4
Foreword This Final Draft of the Sector Skills Plan is submitted in fulfilment of the requirements of the Department of Higher Education and Training (DHET). It has been prepared for the period 2011 to 2016 in accordance with the Skills Development Act (Chapter 3; Section 10) and within the framework of the National Skills Development Strategy (NSDS) III. It has been developed in alignment with several National Policies. The policies include the: National Development Plan, New Growth Path, Human Resource Strategy for South Africa, Integrated Growth and Development Plan, National Policy on Food and Nutrition Security and, the White Paper on Post School education and training. The objective of this Sector Skills Plan is to provide information on the Agricultural Sector profile, identify scarce and critical skills in this sector and provide for measures the SETA has taken or is to take to address those scarcities.
---------------------------------------------------------- Prof G Mayende Chairperson: AgriSETA Accounting Official Sign-Off
5
Endorsement It is hereby certified that this Sector Skills Plan:
Was developed by the management of the AgriSETA under the guidance of the AgriSETA Accounting Authority.
It takes into account all the relevant policies, legislation and other mandates for which the AgriSETA is responsible.
Accurately reflects the strategic outcome orientated goals and objectives which the AgriSETA will endeavour to achieve over the period 2011 to 2016.
---------------------------------------------------------- Mr P Xaba Skills Planning Manager ---------------------------------------------------------- Mr J S Madiba CEO: AgriSETA

6
List of Acronyms
ADEP Aquaculture Development and Enhancement Programme
AET Strategy The National Education and Training Strategy for Agriculture
ATIs Agricultural Training Institutes
BFAP Bureau for Food and Agricultural Policy
CPI Consumer Price Index
DAFF Department of Agriculture, Forestry and Fisheries
DHET Department of Higher Education and Training
DRDLR Department of Rural Development and Land Reform
DTI Department of Trade and Industry
FGWU Food and general Workers Union
FMP Fibre Processing and Manufacturing
GDP Gross Domestic Product
HSRC Human Sciences Research Council
IDGP Integrated Growth and Development Plan
IDP Integrated Development Plan
IPAP Industrial Policy Action Plan
KZN KwaZulu-Natal
MAFISA Micro Agricultural Financial Institution of South Africa
MTSF Medium Term Strategic Framework
NAFU National African Farmers Union of South Africa
NDP National Development Plan
NERPO National Emergent Red Meat Producers Organisation
NGP New Growth Path
NEETS Not in Employment Education or Training
NSDS III National Skills Development Strategy III
NSFAS National Student Financial Aid Scheme
QLFS Qualterly Labour Force Survey
RADP Recapitalisation and Development Programme
RPL Recognition of Prior Learning
SACAU Southern African Confederation of Agricultural Unions
SADC Southern African Development Community
SAIVECET Vocational and Continuing Education and Training
SDA Skills Development Act
SIP Strategic Integrated Project
SIZA Sustainability Initiative of South Africa
StatsSA Statistics South Africa
UIF Unemployment Insurance Fund
WSP Workplace Skills Plan
WTO World Trade Organisation
7
List of Tables
Table 1: Activities within the agricultural sector by international SIC code .................. 8 Table 2: Government department roles in relation to agriculture.............................. 11 Table 3: Commercial farming enterprises 2013 .......................................................... 15 Table 4: Distribution of employers by size and province ............................................ 18 Table 5: Distribution of employers by sebsector ......................................................... 19 Table 6: Employment in the agriculture, forestry and fisheries sector ....................... 20 Table 7: StatsSA gender distribution: agriculture, forestry and fisheries ................... 20 Table 8: Average weighted labour cost for the pome and stone fruit industries ....... 22 Table 9: Labour costs at different wine farms in the Western Cape ........................... 23 Table 11: National policy and skills development implications table ......................... 41 Table 12: Interview Analysis of Skills Demanded ........................................................ 47 Table 13: Skills demand by employer category ........................................................... 50 Table 14: Demand for skills by occupational category ................................................ 53 Table 15: Colleges of agriculture ................................................................................. 55 Table 16: AgriSETA approved training providers ......................................................... 56 Table 17: Employee trained by occupational category and gender ............................ 58 Table Table 19: StatsSA gender distribution: agriculture, forestry and fisheries ........ 61
List of Figures
Figure 1: Gross value of products, 2013/2014 ............................................................ 16 Figure 2: Sector contribution to nominal GDP (1st quarter 2015) .............................. 16 Figure 3: Provincial distribution of employers ............................................................. 17 Figure 4: Distribution of employers by size ................................................................. 18 Figure 5: Employment categories within large organisations ..................................... 22 Figure 6: Gender profile of employees ........................................................................ 23 Figure 7: Employees per subsector .............................................................................. 25 Figure 8:Age profile of employees ............................................................................... 25 Figure 9:Employees by race in the agricultural sector ................................................ 26 Figure 10:Four dimensional skills typology (based on 2005/6 agriseta research) ...... 48 Figure 11:Skills Development Interventions ................................................................ 58

8
Chapter 1: SECTOR PROFILE
1.1 Introduction
The purpose of this chapter is to provide an overview of the agricultural sector in South Africa by describing the sector, to enable an understanding of:
Scope of coverage,
Key role players,
How the sector contributes to the broader South African economy,
The employer profile
The number of people employed in the sector and their demographics. This sector profile provides the context that will inform the strategic planning required of skills planning.
1.2 Scope of coverage
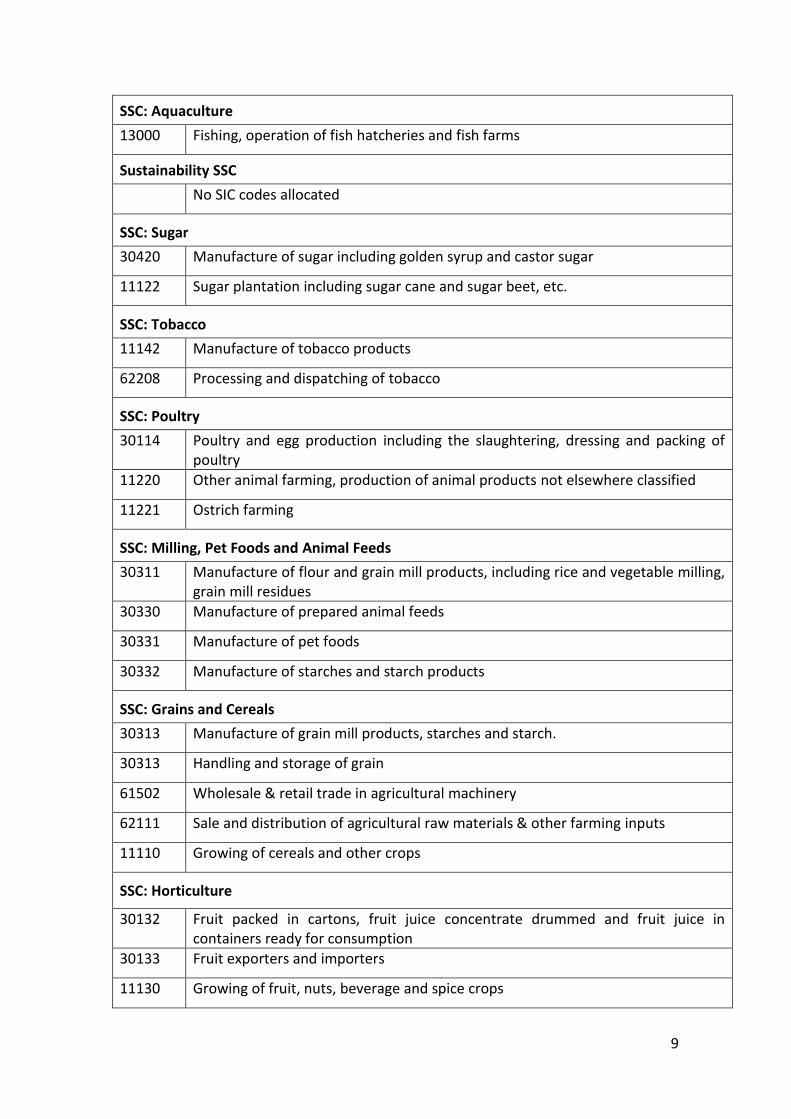
The agriculture sector in the context of skills development is based only on agricultural activity concerned with production and some primary processing of food, aquaculture and growing of trees as a secondary activity. As per the scope of coverage as determined by the Minister (AgriSETA Constitution, 2011), the agricultural sector in South Africa is divided into 41 Standard Industrial Classification (SIC) Codes that are classified according to agricultural and economic focus. The sector encompasses both primary (resource production) and secondary (primary processing) activities. Out of these 41 industries, AgriSETA has constituted twelve sub-sector committees. Table 1 below illustrates the allocation of the 41 industries into 12 sub-sectors, their codes, as well as their area of focus. These 12 sub-sector committees are as follows: Seed; Pest Control; Fibre; Aquaculture; Sustainability; Sugar; Tobacco; Poultry; Milling Pet Foods and Animal Feeds; Grains and Cereals; Horticulture; and Red Meat. Table 1: Activities within the agricultural sector by international SIC code
SIC Code Scope of Coverage / Description
SSC: Seed
11140 Seed production and marketing
SSC: Pest Control
99003 Pest control
SSC: Fibre
30118 Grading, ginning and packing of wool and cotton raw material.
9
SSC: Aquaculture
13000 Fishing, operation of fish hatcheries and fish farms
Sustainability SSC
No SIC codes allocated
SSC: Sugar
30420 Manufacture of sugar including golden syrup and castor sugar
11122 Sugar plantation including sugar cane and sugar beet, etc.
SSC: Tobacco
11142 Manufacture of tobacco products
62208 Processing and dispatching of tobacco
SSC: Poultry
30114 Poultry and egg production including the slaughtering, dressing and packing of poultry
11220 Other animal farming, production of animal products not elsewhere classified
11221 Ostrich farming
SSC: Milling, Pet Foods and Animal Feeds
30311 Manufacture of flour and grain mill products, including rice and vegetable milling, grain mill residues
30330 Manufacture of prepared animal feeds
30331 Manufacture of pet foods
30332 Manufacture of starches and starch products
SSC: Grains and Cereals
30313 Manufacture of grain mill products, starches and starch.
30313 Handling and storage of grain
61502 Wholesale & retail trade in agricultural machinery
62111 Sale and distribution of agricultural raw materials & other farming inputs
11110 Growing of cereals and other crops
SSC: Horticulture
30132 Fruit packed in cartons, fruit juice concentrate drummed and fruit juice in containers ready for consumption
30133 Fruit exporters and importers
11130 Growing of fruit, nuts, beverage and spice crops
10
62112 Service for nut farmers and companies.
30493 Processing and marketing of coffee and tea including coconuts, cocoa, nuts, olives, dates.
11301 Growing of coffee and tea including coconuts, cocoa, nuts, olives, dates, etc.
11120 Growing of vegetables, horticultural specialities and nursery products
11121 Growing of vegetables, horticultural specialities (including ornamental horticulture) and nursery products
12109 Growing of trees as a second crop by farmers
SSC: Red Meat
11141 Production and animal products
30111 Slaughtering, dressing and packing of livestock, incl. poultry and small game for meat
30115 Production, sale and marketing of agricultural by-products (e.g. bones, hides)
30117 Slaughtering, dressing and packing of livestock and processing of ostrich products
61210 Wholesale trade in agricultural raw materials and livestock
74136 Transport of livestock as supporting activity
87120 Agricultural and livestock research
11210 Farming of cattle, sheep, goats, horses, asses, mules and hinnies; dairy farming
11222 Game farming
11300 Growing of crops combined with farming of animals (mixed farming)
11400 Agricultural and animal husbandry services, except veterinary activities
11402 Other animal farming
SOURCE – AGRISETA 2015
The agriculture sector has strong linkages with many sectors including tourism, manufacturing, wholesale and retail among others. Regarding tourism, most South African game farms are in rural areas. These game lodges provide employment opportunities to rural people, but there is also potential for creating business for local people through the supply of fresh produce to the lodges for guests. In some areas, tourism ventures can be extended to villagers so that tourists go and experience an afternoon in a village, including tasting the cuisine. Such ventures require skills in business development, planning and business management in order for them to be sustainable and profitable for local communities. Backward linkages in manufacturing are created during the purchase of fertilisers, chemicals and implements, and forward linkages are established through the supply of agricultural raw materials to the manufacturing industry. Agricultural products like vegetables, fruit, dairy products and meat are marketed through retail shops, straight

11
from the farm. The agricultural sector therefore directly and indirectly creates employment for a significant number of people.
1.3 Key role players
1.3.1 National government departments
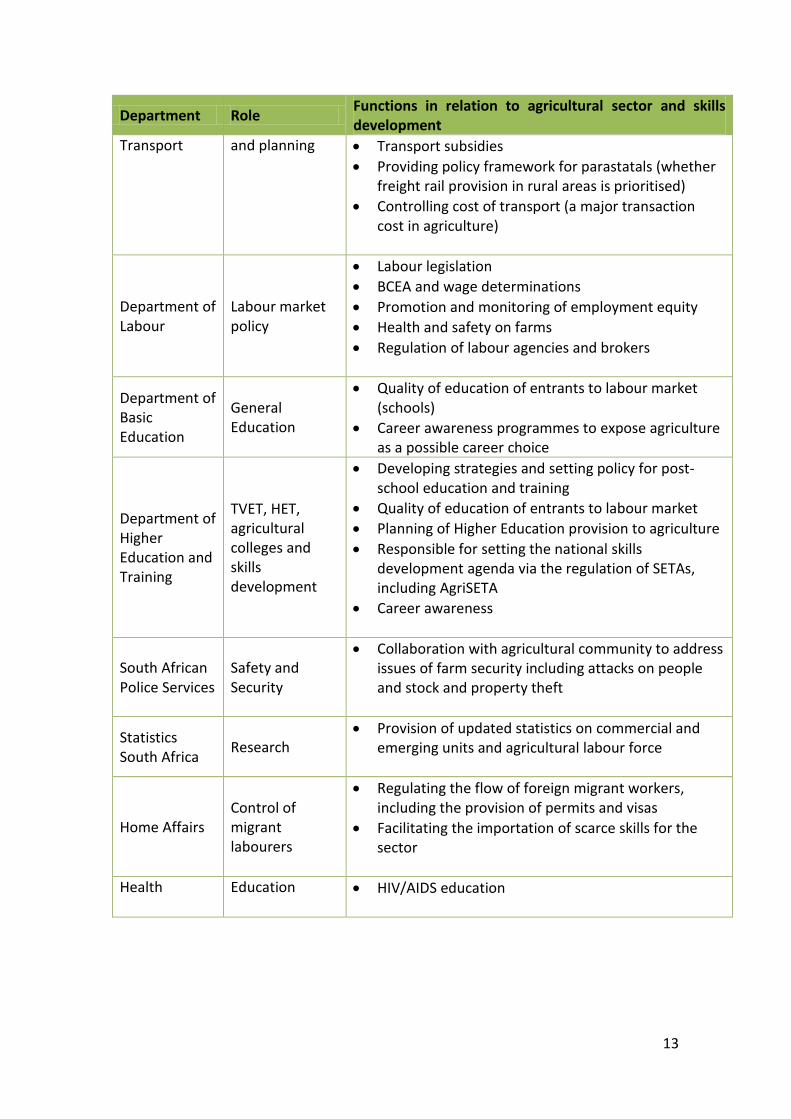
There are a number of government departments, nationally and in provinces as well as local municipalities involved in the agricultural sector. The following table sets out the broad contribution that each department makes to the agricultural sector. Table 2: Government department roles in relation to agriculture
Department Role Functions in relation to agricultural sector and skills development
Department of Agriculture, Forestry and Fisheries
Agricultural policy and support
Sector regulatory framework
Sector strategy and leadership
Organisation of support to farmers (extension services)
Sector BEE charter
Funding of development interventions in support of agriculture including provision of bursaries for scarce skills
Department of Rural Development and Land Reform
Land Reform and land claims settlements
Settling claims
Ensuring that farms remain functional pending the settlement of claims
Identifying claimants who wish to develop agricultural enterprises
Partnering with AgriSETA in mobilising funds for capacity building of claimants
Making land available for renting or purchase for farming
Custodians of the Recapitalisation and Development Programme implemented in 2009. Since then this has been revised in alignment with the National Development Plan, providing the enabling mechanism for land reform in the country.
Department of Economic Development
Economic planning
Sector economic strategies
Identification of economic policy levers and interventions and motivation of these in cabinet
National Treasury and SARS
Macro-economic policy
Financial planning
Financial incentives
Accountability of Land Bank
Regulations relating to credit
VAT, PAYE and company tax

12
Department Role Functions in relation to agricultural sector and skills development
National Planning Commission
Planning
Macro strategy in relation to land reform and rural development
Identification of inter-departmental overlaps and gaps
Department of Cooperative Governance and Traditional Affairs (and municipalities)
Municipal capacity development and coordination
Linking agricultural and rural development to IDPs and LED
Infrastructure and services to agricultural enterprises
Land and industrial zone management (making suitable space available for enterprises)
Department of Environmental Affairs
Environmental planning and natural resource management
Policy and guidelines on environment protection and natural resource management
Partner in environmental education
Department of Trade and Industry (and provincial departments of economic development)
Industrial strategy
IPAP 2
BEE codes
Identification of growth areas
Identification and promotion of export opportunities
Trade policies and international agreements on access to markets (WTO, GATT. DOHA)
SMME and cooperative registration (CIPRO)
SEDA services to SMMEs and Cooperatives
Provincial development agencies and banks (Wesgro, Ithala, etc.) who provide funds and advice on marketing and trade etc.
Has a sector desk focussing on agro-processing and agricultural strategy and policy implementation.
Informal unit within the Enterprise Development Unit also focuses on informal sector development in agriculture.
Department of Water Affairs
The management of water supply
Water supply
Boreholes
Regulation and management of water and prevention of waste/excess use. Responsible for Water Boards that manage local irrigation schemes
Department of Energy
Energy supply Strategy in relation to electricity supply to rural areas
Cost of power (Eskom)
Department of Transport policy Planning for transport needs in rural areas
13
Department Role Functions in relation to agricultural sector and skills development
Transport and planning Transport subsidies
Providing policy framework for parastatals (whether freight rail provision in rural areas is prioritised)
Controlling cost of transport (a major transaction cost in agriculture)
Department of Labour
Labour market policy
Labour legislation
BCEA and wage determinations
Promotion and monitoring of employment equity
Health and safety on farms
Regulation of labour agencies and brokers
Department of Basic Education
General Education
Quality of education of entrants to labour market (schools)
Career awareness programmes to expose agriculture as a possible career choice
Department of Higher Education and Training
TVET, HET, agricultural colleges and skills development
Developing strategies and setting policy for post-school education and training
Quality of education of entrants to labour market
Planning of Higher Education provision to agriculture
Responsible for setting the national skills development agenda via the regulation of SETAs, including AgriSETA
Career awareness
South African Police Services
Safety and Security
Collaboration with agricultural community to address issues of farm security including attacks on people and stock and property theft
Statistics South Africa
Research Provision of updated statistics on commercial and
emerging units and agricultural labour force
Home Affairs Control of migrant labourers
Regulating the flow of foreign migrant workers, including the provision of permits and visas
Facilitating the importation of scarce skills for the sector
Health Education HIV/AIDS education
14
1.3.2 Sector representatives
There are two major umbrella organisations representing the interests of farmers, AgriSA and the National African Farmers Union of South Africa (NAFU). AgriSA represents both commercial farmers and cooperatives’ interests through its engagement at national (has structures in all the provinces, except Limpopo) and international level. AgriSA is a member of the Southern African Confederation of Agricultural Unions (SACAU), a regional farmers’ union for farmers in Southern Africa. NAFU is a union for predominantly previously historically disadvantaged smallholder farmers with a membership base including farmers, agribusinesses, farmers’ organisations, corporations and individuals who support their goals. Different unions in all provinces represent NAFU. There are other employer organisations who are not affiliated to AgriSA and NAFU including:
Agricultural Industrial and Medium Employers Organisation
Agricultural, Mining and Industrial Chemical Manufacturers’ Association
Agrilabour Employers’ Organisation
Algoa Meat Traders Association
East Coast Poultry Producers Employers’ Association
East London and District Meat Traders Association
Fertiliser Industry Employers’ Organisation
Landbou Werkgewers organisasie
Red Meat Producers’ Association
1.4 Economic performance
1.4.1 Overview of structure of the sector
South Africa has a dual agricultural economy comprising a well-developed commercial sector (also referred to as formal) and a predominantly subsistence-oriented sector (also known as informal) in the rural areas (GCIS, 2012). In recent years, the commercial sector has been slowly transforming from a predominantly white owned sector and now includes what are referred to as ‘emerging’ or ‘new’ farmers, who have acquired agricultural land as part of government’s effort to transform the agricultural sector. Using data from the Stats SA 2007 commercial agriculture census and data from other multiple sources, Kirsten1 estimates the number of commercial farms in South Africa in 2013 to be 69 996, comprising 39 966 farms registered for value added tax (VAT) and another 30 000 that are not registered for VAT. Of the VAT registered farms, the sector is dominated by farms with an income of less than R500 000 as highlighted in Table 3.
1Personal email communication. The figures in this table were presented by Prof Johann Kirsten at an Agri
meeting in the Free State in July 2013.

15
Table 3: Commercial farming enterprises 2013
SOURCE: PROF JOHANN KIRSTEN, 2013
There is uncertainty about the number of smallholder farmers in South Africa and figures vary between 160 000 to 2.4 million, depending on the source (Pienaar, 2013). Subsistence farming for supplementing income and food reserves is also a feature of the agricultural sector. In 2013, 18.9% (up from 18.1% in 2012) of 25 330 South African households surveyed were involved in agricultural production, with 14,2% (up from 10.8% in 2012) cultivating farmland and 87.8% (down from 90,2%, in 2012) working on backyard gardens. There is scope for AgriSETA to provide skills development interventions to the subsistence sector, which receives very limited training.2 Useful training would be on livestock and crop production, as well as marketing for those who are farming to supplement their income. Skills would improve the efficiency and effectiveness of subsistence activities, which could contribute significantly to the national basket if subsistence farmers are linked up with markets.
1.4.2 GDP Contribution
The gross domestic product (GDP) contribution of primary commercial agriculture to South Africa’s economy is about 3%, and reaches 12% when the whole agricultural value chain is considered. 3 Over the past five years, the contribution of the agriculture, forestry and fisheries sector to the GDP has seen a steady increase as reflected in Figure 1.
2 Less than 3% of households surveyed indicated they received any training
3South Africa Yearbook 2013/2014, p.31
Category (Gross Farm Income) Number of farming units
Share of commercial farming units
R5 million and more 2 927 4.1%
R3 million to R5 million 2 172 3.1%
R500 000 to R3 million 12 290 17.57%
Less than R500 000 22 577 32.27%
Total (VAT registered famers) 39 966 57.12%
Other commercial farmers (not registered for VAT) (Census 2011)
30 000 42.88%
Total commercial farmers 69 966 100%
16
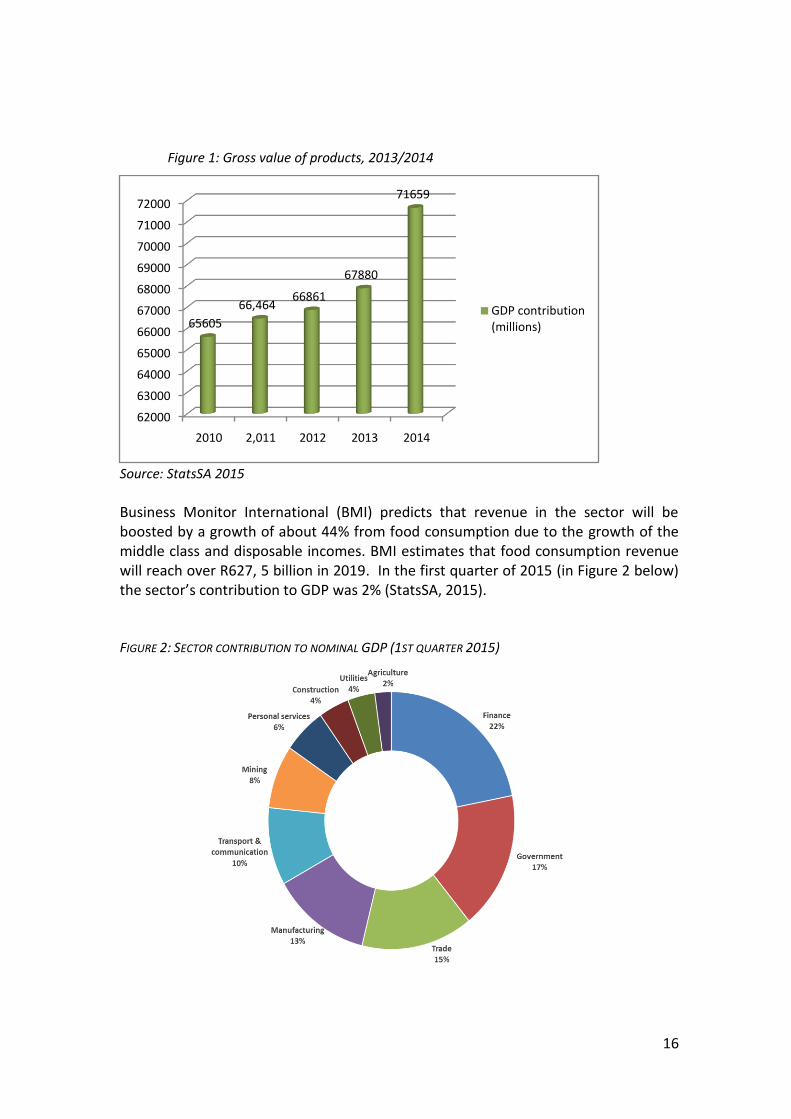
Figure 1: Gross value of products, 2013/2014
Source: StatsSA 2015
Business Monitor International (BMI) predicts that revenue in the sector will be boosted by a growth of about 44% from food consumption due to the growth of the middle class and disposable incomes. BMI estimates that food consumption revenue will reach over R627, 5 billion in 2019. In the first quarter of 2015 (in Figure 2 below) the sector’s contribution to GDP was 2% (StatsSA, 2015). FIGURE 2: SECTOR CONTRIBUTION TO NOMINAL GDP (1ST QUARTER 2015)
62000
63000
64000
65000
66000
67000
68000
69000
70000
71000
72000
2010 2,011 2012 2013 2014
65605
66,46466861
67880
71659
GDP contribution (millions)
17
1.4.3 Exports
The value of Southern African Customs Union (SACU) exports of agricultural products was estimated at over R72 billion in 2013, with fruits being the highest individual earners at over R9 billion. The highest amount from exports was earned from the Netherlands, where over R7 billion rand worth of products were exported, followed by the UK, with over R6 billion. The highest value export destinations in Africa are Zimbabwe (over R5 billion), Mozambique (over R4 billion) and Angola (over R2 billion).
1.4.4 Revenue from Skills Development Levies
Currently, there are only 21 408 employers registered with AgriSETA. Compared to the size of commercial farmers registered for VAT in the sector (just under 40 000), just over half of commercial farming units. The limited number of registered companies, and consequently levy payers, compared to the extent of the commercial sector, smallholders, and subsistence farmers, suggests that there is a strain on the skills development resources available. This means that in order for skills development interventions to reach a broader base, there is need for multiple resources to be channelled into skills development interventions.
1.5 Employer profile
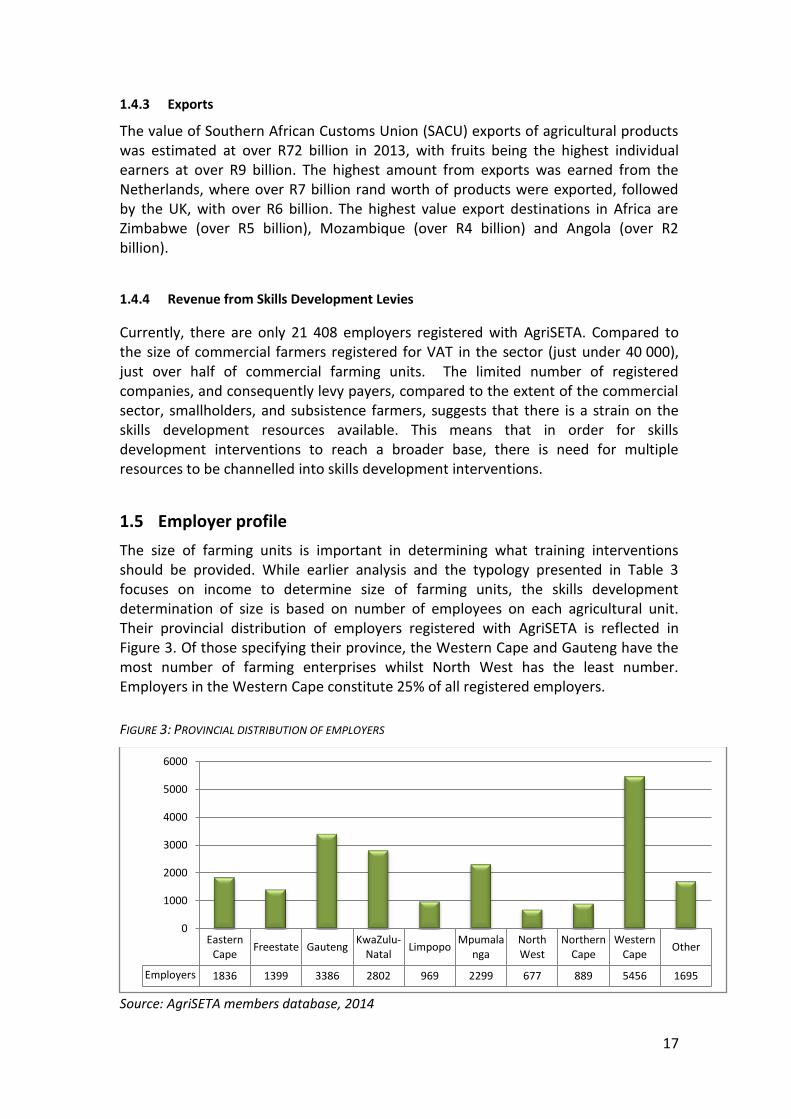
The size of farming units is important in determining what training interventions should be provided. While earlier analysis and the typology presented in Table 3 focuses on income to determine size of farming units, the skills development determination of size is based on number of employees on each agricultural unit. Their provincial distribution of employers registered with AgriSETA is reflected in Figure 3. Of those specifying their province, the Western Cape and Gauteng have the most number of farming enterprises whilst North West has the least number. Employers in the Western Cape constitute 25% of all registered employers.
FIGURE 3: PROVINCIAL DISTRIBUTION OF EMPLOYERS
Source: AgriSETA members database, 2014
Eastern Cape
Freestate GautengKwaZulu-
NatalLimpopo
Mpumalanga
North West
Northern Cape
Western Cape
Other
Employers 1836 1399 3386 2802 969 2299 677 889 5456 1695
0
1000
2000
3000
4000
5000
6000
18
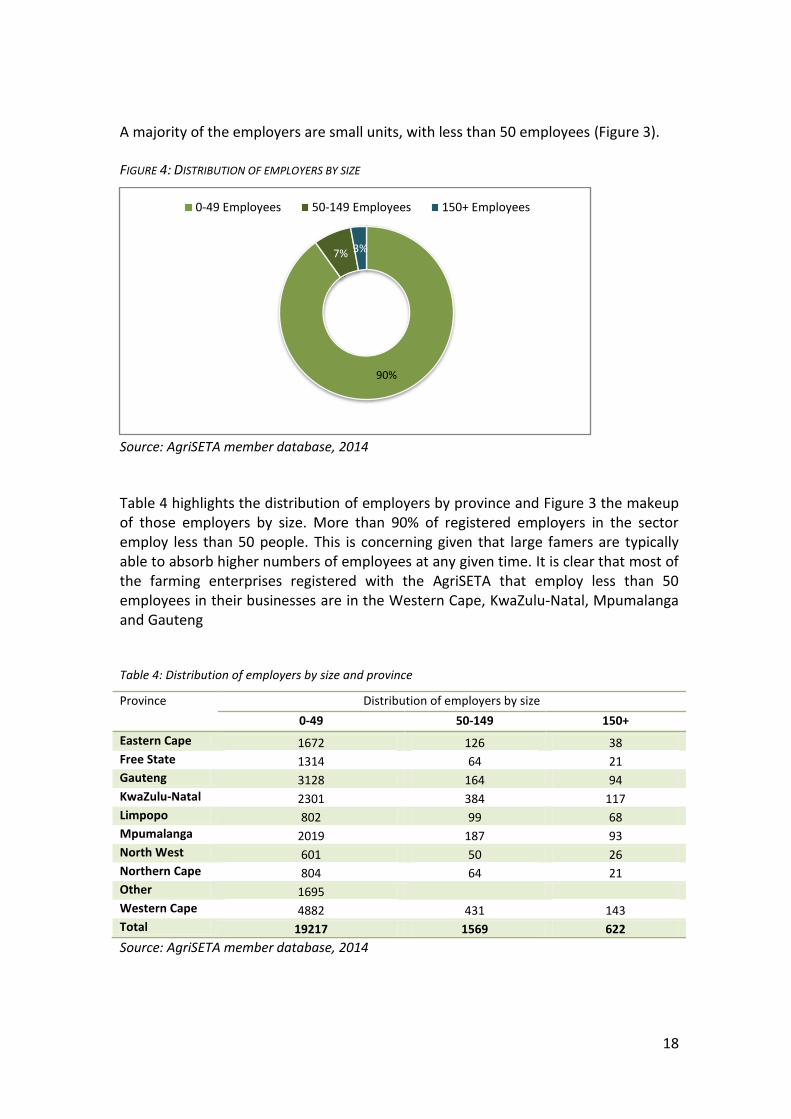
A majority of the employers are small units, with less than 50 employees (Figure 3). FIGURE 4: DISTRIBUTION OF EMPLOYERS BY SIZE
Source: AgriSETA member database, 2014
Table 4 highlights the distribution of employers by province and Figure 3 the makeup of those employers by size. More than 90% of registered employers in the sector employ less than 50 people. This is concerning given that large famers are typically able to absorb higher numbers of employees at any given time. It is clear that most of the farming enterprises registered with the AgriSETA that employ less than 50 employees in their businesses are in the Western Cape, KwaZulu-Natal, Mpumalanga and Gauteng Table 4: Distribution of employers by size and province
Province Distribution of employers by size
0-49 50-149 150+
Eastern Cape 1672 126 38 Free State 1314 64 21 Gauteng 3128 164 94 KwaZulu-Natal 2301 384 117 Limpopo 802 99 68 Mpumalanga 2019 187 93 North West 601 50 26 Northern Cape 804 64 21 Other 1695
Western Cape 4882 431 143 Total 19217 1569 622
Source: AgriSETA member database, 2014
90%
7% 3%
0-49 Employees 50-149 Employees 150+ Employees
19
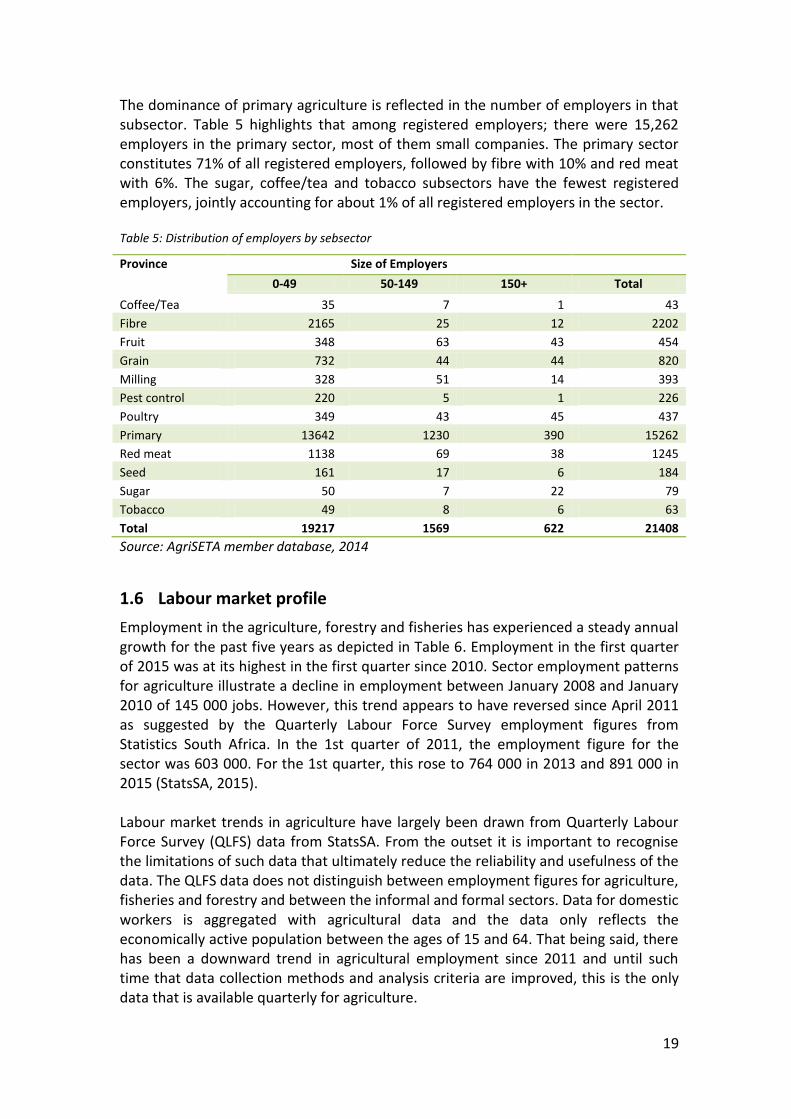
The dominance of primary agriculture is reflected in the number of employers in that subsector. Table 5 highlights that among registered employers; there were 15,262 employers in the primary sector, most of them small companies. The primary sector constitutes 71% of all registered employers, followed by fibre with 10% and red meat with 6%. The sugar, coffee/tea and tobacco subsectors have the fewest registered employers, jointly accounting for about 1% of all registered employers in the sector. Table 5: Distribution of employers by sebsector
Province Size of Employers
0-49 50-149 150+ Total
Coffee/Tea 35 7 1 43
Fibre 2165 25 12 2202
Fruit 348 63 43 454
Grain 732 44 44 820
Milling 328 51 14 393
Pest control 220 5 1 226
Poultry 349 43 45 437
Primary 13642 1230 390 15262
Red meat 1138 69 38 1245
Seed 161 17 6 184
Sugar 50 7 22 79
Tobacco 49 8 6 63
Total 19217 1569 622 21408
Source: AgriSETA member database, 2014
1.6 Labour market profile
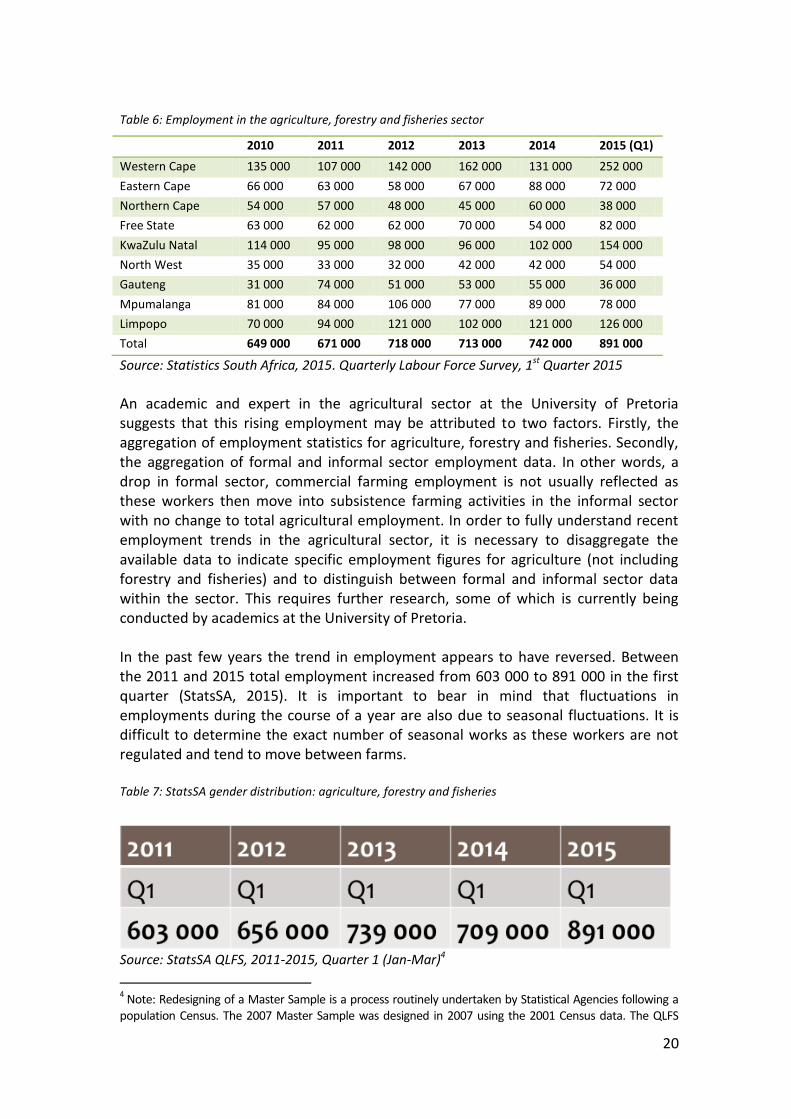
Employment in the agriculture, forestry and fisheries has experienced a steady annual growth for the past five years as depicted in Table 6. Employment in the first quarter of 2015 was at its highest in the first quarter since 2010. Sector employment patterns for agriculture illustrate a decline in employment between January 2008 and January 2010 of 145 000 jobs. However, this trend appears to have reversed since April 2011 as suggested by the Quarterly Labour Force Survey employment figures from Statistics South Africa. In the 1st quarter of 2011, the employment figure for the sector was 603 000. For the 1st quarter, this rose to 764 000 in 2013 and 891 000 in 2015 (StatsSA, 2015). Labour market trends in agriculture have largely been drawn from Quarterly Labour Force Survey (QLFS) data from StatsSA. From the outset it is important to recognise the limitations of such data that ultimately reduce the reliability and usefulness of the data. The QLFS data does not distinguish between employment figures for agriculture, fisheries and forestry and between the informal and formal sectors. Data for domestic workers is aggregated with agricultural data and the data only reflects the economically active population between the ages of 15 and 64. That being said, there has been a downward trend in agricultural employment since 2011 and until such time that data collection methods and analysis criteria are improved, this is the only data that is available quarterly for agriculture.
20
Table 6: Employment in the agriculture, forestry and fisheries sector
2010 2011 2012 2013 2014 2015 (Q1)
Western Cape 135 000 107 000 142 000 162 000 131 000 252 000
Eastern Cape 66 000 63 000 58 000 67 000 88 000 72 000
Northern Cape 54 000 57 000 48 000 45 000 60 000 38 000
Free State 63 000 62 000 62 000 70 000 54 000 82 000
KwaZulu Natal 114 000 95 000 98 000 96 000 102 000 154 000
North West 35 000 33 000 32 000 42 000 42 000 54 000
Gauteng 31 000 74 000 51 000 53 000 55 000 36 000
Mpumalanga 81 000 84 000 106 000 77 000 89 000 78 000
Limpopo 70 000 94 000 121 000 102 000 121 000 126 000
Total 649 000 671 000 718 000 713 000 742 000 891 000
Source: Statistics South Africa, 2015. Quarterly Labour Force Survey, 1st Quarter 2015
An academic and expert in the agricultural sector at the University of Pretoria suggests that this rising employment may be attributed to two factors. Firstly, the aggregation of employment statistics for agriculture, forestry and fisheries. Secondly, the aggregation of formal and informal sector employment data. In other words, a drop in formal sector, commercial farming employment is not usually reflected as these workers then move into subsistence farming activities in the informal sector with no change to total agricultural employment. In order to fully understand recent employment trends in the agricultural sector, it is necessary to disaggregate the available data to indicate specific employment figures for agriculture (not including forestry and fisheries) and to distinguish between formal and informal sector data within the sector. This requires further research, some of which is currently being conducted by academics at the University of Pretoria. In the past few years the trend in employment appears to have reversed. Between the 2011 and 2015 total employment increased from 603 000 to 891 000 in the first quarter (StatsSA, 2015). It is important to bear in mind that fluctuations in employments during the course of a year are also due to seasonal fluctuations. It is difficult to determine the exact number of seasonal works as these workers are not regulated and tend to move between farms. Table 7: StatsSA gender distribution: agriculture, forestry and fisheries
Source: StatsSA QLFS, 2011-2015, Quarter 1 (Jan-Mar)4
4 Note: Redesigning of a Master Sample is a process routinely undertaken by Statistical Agencies following a
population Census. The 2007 Master Sample was designed in 2007 using the 2001 Census data. The QLFS

21
South Africa recorded an unemployment rate of 26,4% (StatsSA, 2015) in the first quarter of 2014 (narrow definition). South Africa now has a NEET (not in employment, education or training) youth population of approximately 3,4 million people. The sheer scale of the crisis demands each and every sector’s involvement in addressing it. Although employment has decreased overall in the sector, employment trends have varied by sub-sector. Because of increased productivity, the wool growing sub-sector has experienced an increase in employment. Currently there are 35 000 farm workers involved in wool farming. There has been an additional 2 000 emerging farmers over the past few years, with close to 20 000 emerging farmers farming in wool. In the sugar sub-sector, there has also been an increase in employment because of land restitution and redistribution programmes which have led to a demand for seasonal and permanent workers. Sugar cane farming is labour intensive. While some employment growth has been experienced at sub-sector level, some companies that have expanded have also realised employment growth, for example, one of the interviewed grain companies has realised a 40% increase in employment from value adding services like abattoirs and feed mills. Elsewhere in the grain sub-sector employment has been stable in the last five years. Influence of weather conditions is big in the sub-sector so there has been fluctuating production. The sub-sector is not labour intensive in most of the functions, so output can increase without added human resource requirements (stakeholder interviews: 2014).
1.6.1 Occupational categories
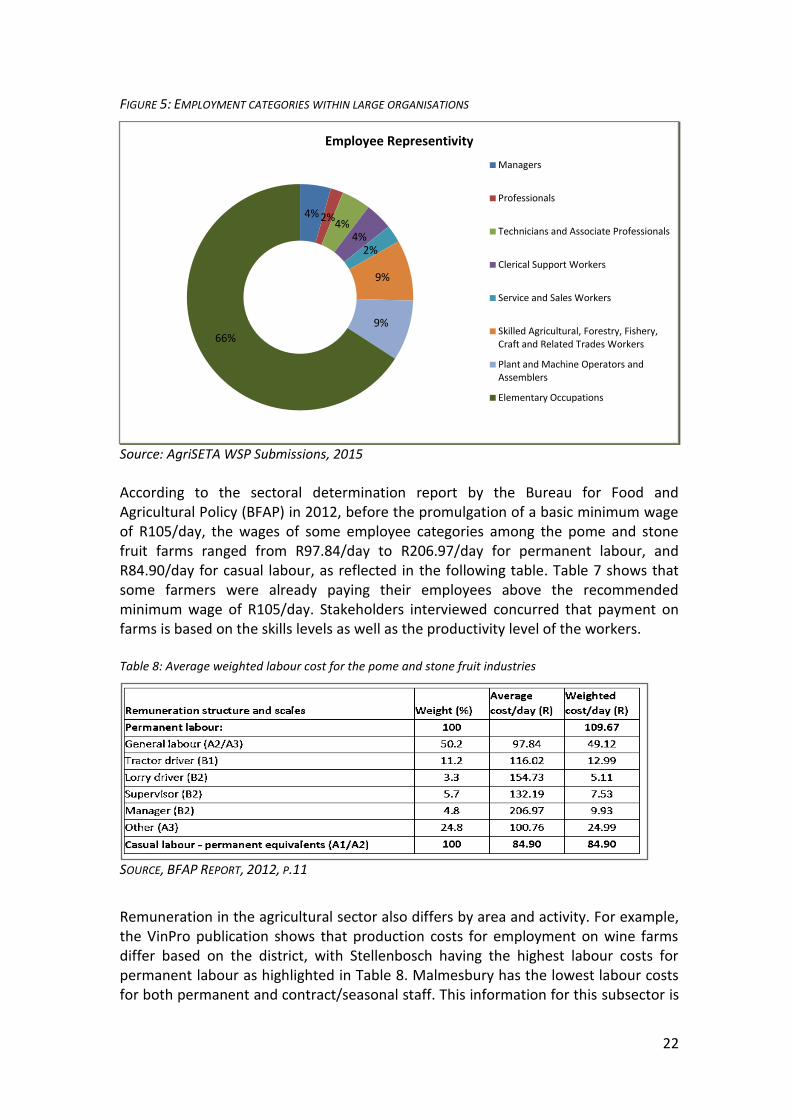
The skills requirements for agricultural units vary from highly skilled managerial and professional occupations to fairly low level skills for elementary occupations. An analysis of WSPs submitted by large employers in 2015 shows that the majority of employees (66%) are engaged in elementary occupations followed by Skilled Agricultural, Forestry, Fishery, Craft and Related Trades Workers (9%) and Plant and Machine Operators and Assemblers (9%). Professionals and the Service and Sales Workers have the lowest representivity at 1.8% and 2.5% respectively (Figure 5).
estimates for 2008 to 2013 (Q1: 2008 to Q4: 2014) resulted from the 2007 Master Sample. The 2011 Census showed that the structure of the underlying population had changed compared to the previous Census. The new Master Sample should improve the level of precision in the estimates produced. The Q1: 2015 (January to March 2015) estimates presented in this report are based on the new Master Sample (designed in 2013).
22
FIGURE 5: EMPLOYMENT CATEGORIES WITHIN LARGE ORGANISATIONS
Source: AgriSETA WSP Submissions, 2015
According to the sectoral determination report by the Bureau for Food and Agricultural Policy (BFAP) in 2012, before the promulgation of a basic minimum wage of R105/day, the wages of some employee categories among the pome and stone fruit farms ranged from R97.84/day to R206.97/day for permanent labour, and R84.90/day for casual labour, as reflected in the following table. Table 7 shows that some farmers were already paying their employees above the recommended minimum wage of R105/day. Stakeholders interviewed concurred that payment on farms is based on the skills levels as well as the productivity level of the workers. Table 8: Average weighted labour cost for the pome and stone fruit industries
SOURCE, BFAP REPORT, 2012, P.11
Remuneration in the agricultural sector also differs by area and activity. For example, the VinPro publication shows that production costs for employment on wine farms differ based on the district, with Stellenbosch having the highest labour costs for permanent labour as highlighted in Table 8. Malmesbury has the lowest labour costs for both permanent and contract/seasonal staff. This information for this subsector is
4% 2%4%
4%2%
9%
9%
66%
Employee Representivity
Managers
Professionals
Technicians and Associate Professionals
Clerical Support Workers
Service and Sales Workers
Skilled Agricultural, Forestry, Fishery, Craft and Related Trades Workers
Plant and Machine Operators and Assemblers
Elementary Occupations
23
useful in determining the interventions on skills. Data on salaries for top end agriculture professionals is not easily available, as no surveys have been done on this information. However, Quantec data shows that in 2014, compensation to employees constituted 27.69% of farming costs. Table 9: Labour costs at different wine farms in the Western Cape
Source: Vinpro Cost Guide 2013/2014, p. 15
1.6.2 Employee profile and trends
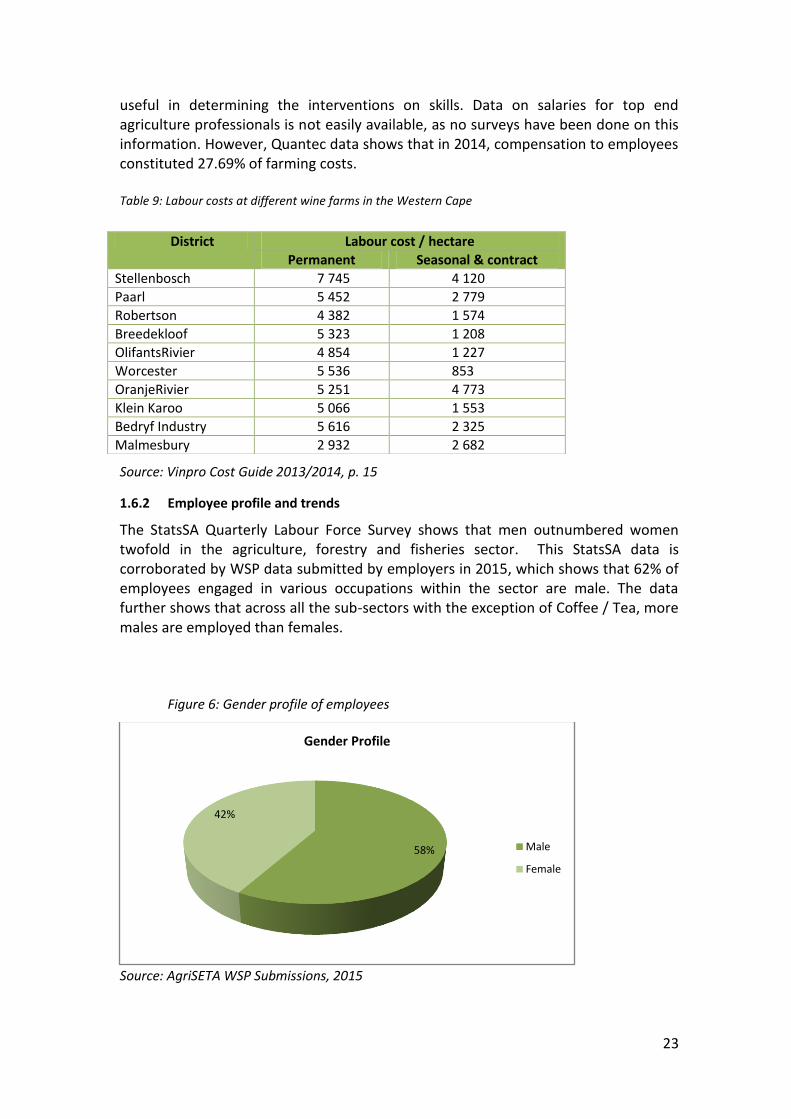
The StatsSA Quarterly Labour Force Survey shows that men outnumbered women twofold in the agriculture, forestry and fisheries sector. This StatsSA data is corroborated by WSP data submitted by employers in 2015, which shows that 62% of employees engaged in various occupations within the sector are male. The data further shows that across all the sub-sectors with the exception of Coffee / Tea, more males are employed than females.
Figure 6: Gender profile of employees
Source: AgriSETA WSP Submissions, 2015
58%
42%
Gender Profile
Male
Female
District Labour cost / hectare
Permanent Seasonal & contract
Stellenbosch 7 745 4 120
Paarl 5 452 2 779
Robertson 4 382 1 574
Breedekloof 5 323 1 208
OlifantsRivier 4 854 1 227
Worcester 5 536 853
OranjeRivier 5 251 4 773
Klein Karoo 5 066 1 553
Bedryf Industry 5 616 2 325
Malmesbury 2 932 2 682

24
Analysis of WSP submissions by employers in 2014 shows that the majority of employees are in the primary sub-sector (57%) followed by grain and poultry at 11% each. Coffee / Tea sub-sector has the least representivity of workers with 0.4% of the workforce (Figure 6).

25
Figure 7: Employees per subsector
Source: AgriSETA WSP Submissions
Half of the people employed in the sector amongst the employers submitting WSPs are in the ages 35 to 55. Young people below the age of 35 constitute 42% of people employed whilst 8% are above the age of 55. All in all, over 90% of the workers are below the age of 55 (Figure 7). Due to a high number of people between the age 35 and 55 it may be important to understand amongst those, which ones are approaching the age of 55, which makes people eligible for early retirement.
Figure 8:Age profile of employees
Source: AgriSETA WSP Submissions, 2015
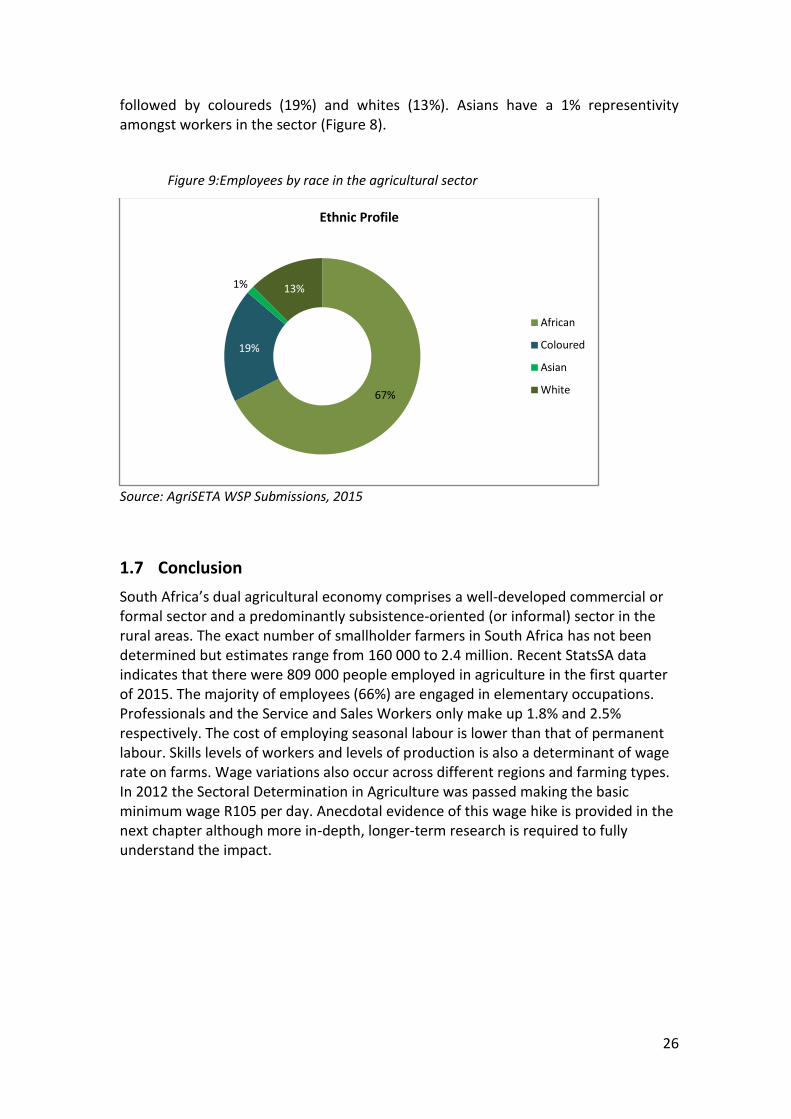
There are more Africans employed in the sector than any other race. The WSP data shows that about 67% of workers engaged by employers in the sector are Africans
0% 2%
7%11% 2%
0%
11%
57%
6% 1% 2% 1%
Employees per Subsector
Coffee / Tea
Fibre
Fruit
Grain
Milling
Pest control
Poultry
Primary
Red meat
Seed
Sugar
Tobacco
42%
50%
8%
Employee Age Profile
Age Group - Less than 35
Age Group - 35 to 55
Age Group - Greater than 55
26
followed by coloureds (19%) and whites (13%). Asians have a 1% representivity amongst workers in the sector (Figure 8).
Figure 9:Employees by race in the agricultural sector
Source: AgriSETA WSP Submissions, 2015
1.7 Conclusion
South Africa’s dual agricultural economy comprises a well-developed commercial or formal sector and a predominantly subsistence-oriented (or informal) sector in the rural areas. The exact number of smallholder farmers in South Africa has not been determined but estimates range from 160 000 to 2.4 million. Recent StatsSA data indicates that there were 809 000 people employed in agriculture in the first quarter of 2015. The majority of employees (66%) are engaged in elementary occupations. Professionals and the Service and Sales Workers only make up 1.8% and 2.5% respectively. The cost of employing seasonal labour is lower than that of permanent labour. Skills levels of workers and levels of production is also a determinant of wage rate on farms. Wage variations also occur across different regions and farming types. In 2012 the Sectoral Determination in Agriculture was passed making the basic minimum wage R105 per day. Anecdotal evidence of this wage hike is provided in the next chapter although more in-depth, longer-term research is required to fully understand the impact.
67%
19%
1% 13%
Ethnic Profile
African
Coloured
Asian
White

27
Chapter 2: KEY SKILLS ISSUES
This chapter identifies key factors that are driving change and impacting skills demand and supply within the agricultural sector. Particular attention is paid to the following: sustainable land reform, cooperative and smallholder farmer development, improvements in food security, mechanisation, sustainable farming, integrated rural development and, the creation of viable and sustainable rural enterprises and industry. Each of these issues is placed within a broader agrarian transformation agenda.
2.1 Change Drivers
2.1.1 Factors impacting on skills demand and supply
i. Land reform
Land reform has a significant bearing on food security and agriculture’s contribution to GDP. The objective of the land reform programme is to transfer 30% of agricultural land to black ownership by 2025 to ensure more equitable access to land by historically disadvantaged people and to increase their participation in agricultural activities (Xingwana, 2008). The MTSF target is for 20% or 16.2 million hectares by 2019. Four processes have informed land reform (Centre for Development Enterprise, 2008):
Land restitution, involving returning land or providing financial compensation to those whose land was dispossessed during apartheid;
Land redistribution, transferring more land to the historically disadvantaged;
Tenure reform, modernising land tenure rules and access to land ownership; and
Providing financial support for the development of emerging farmers. Between 1994 and 2010, 7,4 million hectares of land were transferred or redistributed to previously disadvantaged persons via the Land Reform Programme. This included agricultural land as well as land used for other activities. For agricultural land redistributed, the programme resulted neither in rising production nor increased economic growth as many of its beneficiaries lacked the necessary skills and knowledge to farm effectively. In 2010 the Department of Rural Development and Land Reform (DRDLR) introduced a Recapitalisation and Development Programme (RADP) for distressed farms that were redistributed since 1994. The aim of this programme is sustainable rural land reform and targets some 1807 farms over the current MTEF period. The use of mentors and strategic partners from the farming sector is central within the programme. Mentors and partners are expected to assist land reform beneficiaries with, “access to markets, farm production, skills development, packaging of projects, access to additional finance, coaching mentorship and advocacy” (DRDLR, 2012, 21). The programme has undergone numerous challenges. Emergent farmers face difficulties in accessing adequate financing, marketing their products and, accessing higher levels of the
28
value chain. Also, the pool of emergent farmers need extensive skills development and is ageing. Emergent farmers may access agricultural infrastructure finance via The Land Bank of South Africa. The Micro Agricultural Financial Institutions of South Africa (MAFISA) financial scheme provides soft loans at lower, fixed interest rates (currently 8 per cent) and is made available to livestock farmers. Pre-training is a prerequisite for accessing the MAFISA loan. The scheme provides state-subsidised loans but is often interpreted as providing grants, amongst those accessing them. Record keeping of agricultural input costs is poor making it difficult to measure output. There is a lack of general financial management skills. Many of the businesses applying for finance are built around one person and this is problematic for sustainability (SSP stakeholder interview, 2014). The proposed draft policy on strengthening the relative rights of people working the land by the Ministry of Rural Development and Land Reform has caused increased tensions in the sector. The main thrust of the policy is the development and implementation of a system of equity sharing on commercial farms whereby the commercial farmer retains 50% ownership of their farm, and cedes 50% ownership to workers in the form of equity shares based on length of time that they have worked on the farm (Hall, 2014). Challenges linked to the proposed ownership model are: the high cost to the State of acquiring the 50% equity on behalf of the workers, increased retrenchments of workers that have worked less than 10 years and departmental capacity needed to manage the 50% equity fund. Hall, a critic of current land reform processes, cautions that “the model can work if it is accompanied by carefully designed interventions in organizational development, worker empowerment and so on. The best share equity schemes in the wine industry (Stellar Organics, Thandi, and Solms Delta to mention some well-known examples) spent millions of Rands on this. If done well, it can lead to many workers bettering their position within the organization of the farm and entering into middle management; and it can increase vocational and educational opportunities for their children. But this requires careful design and lots of money. The handful of successes involved very substantial private investment alongside public funds” (Hall, 2014). Another critical view expressed suggests that many farm workers are not so much concerned with equity shareholding (a key focus of current policy) but are rather seeking land tenure security, better wages and working conditions and improved access to land for their own use through land redistribution programmes (Hall, 2014). In other words the intended beneficiaries and expected drivers of reform may not always seek to benefit in the manner set out in policy. The Department of Rural Development and Land Reform in conjunction with the Department of Agriculture, Forestry and Fisheries (DAFF) must find ways of addressing such challenges if the 2025 land redistribution target is to be met. There is a collective determination in the sector that in the process of engaging in land reform there should be retention of current skills, the development of new skills and

29
skills transfer during the period when land is changing hands, and as far as possible maintaining and expanding food production during after the transfer of land and/or equity. This is a major concern as of the 7 million hectares of land that has changed hand, some 4.3 million are viewed as underutilised. The MTSF sets a target of reducing this figure to 3 million by 2019. Many commodity organisations interviewed have an empowerment arm aimed at addressing empowerment issues for the sub-sector. There is a strong belief that empowerment will only be successful if a multi-pronged approach is adopted, focusing on enabling legislation, skills development, resource mobilisation, and education about the importance of land restitution and redistribution. Such a multi-pronged approach is envisaged in the NTSF. Many organisations are doing work to support land reform programmes through skills development interventions. Hortgro facilitates and supports land reform projects focussing on farmers becoming successful and commercially viable. Hortgro works with farmers who already own some land. To date, Hortgro has supported 47 projects in the Western Cape and 15 in the Eastern Cape. This translates to 4 973 beneficiaries in the Western Cape and 1 135 in the Eastern Cape. Similarly, the Wool Growers Association is assisting wool growers in rural areas to improve their productivity. The South African Sugar Association supports land restitution programmes by ensuring that no cane field lies fallow and that sugar cane becomes sustainable for small scale farmers. Mobile Agri Skills Development and Training trains small scale farmers in enterprise development (stakeholder interviews, 2014). There are many projects driven by different stakeholders and funded from various sources such as DAFF and the National Treasury Jobs Fund. AgriSA provides social skills programmes such as those aimed at the upliftment of women in rural areas and HIV/AIDS awareness as well as and management skills for emerging farmers. AgriSA has developed a partnership in the wool sub-sector targeted at the development of local skills in sheep shearing. Currently the industry mainly uses workers from Lesotho. Apart from in a certain industries such as poultry farming, on-site training is viewed as the most impactful form of training for emerging farmers because:
Training can be done in a manner that is practical and accessible to farm workers.
Training is conducted in the local language using appropriate methodologies
Training accommodates the farmer’s working schedule and does not affect productivity.
ii. Agricultural Co-operatives
The interview process for the SSP included a focus group discussion with twelve, primary agricultural co-operatives held in Katlehong in the East Rand of Johannesburg. All the co-operatives had been engaged for between 3 and 7 years in planting and growing crops (mainly vegetables) and selling these locally, mainly via

30
street vendors. All have aspirations to expand production and markets and feel that with more reliable water supply, access to better quality land, better implements and some machinery, as well as skills training, they could be much more effective. There are currently some 450 cooperatives and other small and emergent enterprises (generally governed by Community Property Associations (CPAs) that are receiving support from AgriSETA, some funded by the SETA, some by DAFF and some by funds obtained from the National Skills Fund. Although no formal evaluation of this work has been conducted a number of lessons have been learned and inform current strategy. Key challenges amongst the co-ops include:
Difficulties in accessing resources e.g. water & land. Co-ops make use of land provided by various land owners, including private land, schools, police stations, municipalities. These are often governed by short term leases or by way of an informal arrangement. Land access and greater security of leases is a key challenge as well as inadequate tools & equipment.
Lack of transport from home to the farm, and for produce – transporting it to the point of sale.
Lack of production skills: technical skills training is badly needed by all those engaging in cooperative farming.
Governance and management. Many worker cooperatives find it very difficult to manage cash flow, develop a sound business model and address governance issues such as the setting of viable pay levels, and putting in place financial and other controls.
Lack of other skills along the value chain: financial, negotiating with municipalities that own the land, marketing.
Cooperatives (an emergent farming entities in general) tend to be formed by more elderly workers, with few young people being attracted into the industry.
Poor organisation of co-ops. No secondary structures to rally on behalf of primary co-ops – for example to negotiate better leases and access to water. It is becoming clear that there is a need to focus more on the structures that can purchase and sell products on behalf of producers.
A number of conclusions emerged via the discussions with the co-ops. There was consensus over the need for some type of secondary co-op structure that is skilled in areas other than basic crop production, such as: business, marketing, communication & negotiation, machinery maintenance etc. All of the co-ops highlighted the need for better collaboration and agreement within co-ops amongst their members in terms of what to produce, how etc. In relation the type of training needed, co-op interviewees were in favour of longer-term (12 month) training programmes that lead to qualifications and that have a combination of practical, production-related training and business skills.
iii. Food security
South Africa currently produces enough food to meet the needs of its population. Despite this, many people continue to go hungry. According to FoodBank SA, 11
31
million people are food insecure in the country whilst a further 14 million are vulnerable to food insecurity (GCIS, 2012). Similarly, the results of the National Health and Nutrition Survey released in August 2013 indicate that only 45,6% of our population are food secure, 28,3% is at risk of hunger and 26% experienced hunger and were food insecure (HSRC, 2014). There is increasing evidence that food security can become a cause for concern. In a document produced by the Bureau for Food and Agricultural Policy (BFAP) in 2012, reference is made to the increasing impact of mining on agriculture in Mpumalanga Province. A pilot study has been initiated to evaluate the effects on coal mining on maize farming, in the Delmas, Ogies and Leandra areas. “At the current rate of coal mining in Mpumalanga, it was calculated that approximately 12% of South Africa’s total high potential arable land will be transformed, while a further 13.6% is currently being prospected by the mines in Mpumalanga. Current mining and new prospects for mining could soon have devastating effects on agricultural production as well as long term food security implications for the entire country” (BFAP, 2012). BFAP estimates that at current maize farming yields, 447 581 tons of maize will be taken out of production as the result of current and prospective mining operations. This will result in a 10% rise in the price of maize with huge repercussion for South Africa and particularly the poor and vulnerable sectors of our population. Despite government increases in the levels of social grants and in the number of persons receiving these grants to almost 16 million in February 2014 (StatsSA, 2014), rising unemployment, increased food prices, reduced agricultural yields, HIV and AIDS, poor environmental conditions and generally high levels of poverty all contribute to food insecurity, particularly amongst the poor and in rural areas. Whilst food is available it is often not accessible to families. The result has been a concerted effort on the part of government to prioritise the issue of food security in South Africa and this is reflected in multiple policy and strategic documents at the national, departmental and sectoral levels. The National Development Plan highlights food security as both a cause and effect of poverty and inequality. The NDP outlines several strategies aimed at improving levels of food security including: improved irrigation, secure land tenure (particularly amongst women) and better nutrition education (SA Presidency, 2011). This is the platform on which the national policy on food and nutrition security has recently been developed by the Department of Social Development and the Department of Agriculture, Forestry and Fisheries. The policy adopts a multi-faceted approach towards food and nutrition security that integrates existing strategies and programmes affiliated to health, education, environmental protection, agrarian reform and agricultural development across multiple departments and sectors. The policy defines food and nutrition security as: “Access to and control over the physical, social and economic means to ensure sufficient, safe and nutritious food at all times, for all South Africans, in order to meet the dietary requirements for a healthy life” (DSD, 2013, 8). Five key pillars make up the food security policy and are as follows:
32
Improved availability of nutritional safety nets including government, private sector, NGO and CBO nutrition and feeding programmes as well as emergency food relief.
Improved nutrition education so that people are better informed about nutrition choices.
Aligning agricultural investment to local economic development needs especially in rural areas. Here there is a focus on the provision and subsidization of agricultural inputs and services as well as better food storage and distribution networks. This is intended to reduce food wastage and improve the accessibility of food.
Improvements to the market participation of emerging farmers via public-private partnerships, the implementation of a government food purchase programme targeted at smallholder farmers as well as the implementation of the AgriBEE Charter whereby agro-processing industries are expected to incorporate emerging farmers as suppliers of agricultural produce.
Risk management linked to protecting prime agricultural land from other activities such as mining, game farming and property development that result in reduced food production. This also involves expanded investments in research and technology to better understand food production vulnerabilities associated with climate change and bioenergy demands (DSD, 2013).
iv. Mechanisation in agriculture
A prominent trend within the agricultural sector is that, “as agriculture becomes more mechanized, the unskilled labour force is replaced by a significantly smaller skilled labour force” (South African Ministry of Labour, 2013, 14). That being said, increases to the agricultural labour wage will not, “automatically result in increased mechanisation,” (South African Ministry of Labour, 2013, 16) as technologies are not always available and for certain types of agriculture such as intensive fruit farming, mechanized harvesting techniques are not appropriate for meeting the high quality standards required for the exporting of such produce. The rate at which mechanisation displaces labour in agriculture is dependent on the availability of technology, the cost of labour and capital and existing economic conditions. What has become noticeable in recent years is that demand for artisans (mechanics for example) has increased in the sector. As mechanisation occurs it is likely that this trend will continue with demand reducing for general labouring or less skilled workers and demand increasing for artisans and technically qualified workers.
v. Sustainable agricultural development
There has been an increasing focus on the use of environmentally sustainable farming practices across the agricultural sector. In some policy documents such as the National Development Plan and the New Growth Path this is referred to as green economy practices. However, within the agricultural sector “green economy” industries are often associated with such enterprises as ornamental horticulture, organic nurseries and farms and landscaping. Thus, for the purpose of this SSP, the

33
term sustainable farming is preferred as this better describes sustainable practices associated within the broader “green economy.” The United Nations Environment Programme (UNEP, 2013, 9) describes the green economy as “an economy that results in improved human well-being and social equity, while significantly reducing environmental risks and ecological scarcities”. A green economy operates in a manner whereby economic growth and development including employment creation follows a path in which carbon emissions are reduced, energy and resource efficiency is promoted and environmental degradation is lessoned. Sustainable farming is recognised as important as conveyed through industry-specific training interventions across different subsectors. In horticulture, training focuses on green issues in fruit farming. In wool growing, green issues are important in predator management. The sugar cane sub-sector is using waste fibre to generate energy; most of the mills are running their energy from fibre. There is investigation on how to transfer excess energy to Eskom, and research around biofuels is taking place. In poultry, environmental impact assessments (EIA) are needed to start farming with 5000 birds. This is costly and difficult for emerging farmers (SSP stakeholder interviews, 2014). The skills system needs to respond to a new set of knowledge and skills requirements (largely at a higher level) for sustainable farming. Research and development on the role of green industries in the agricultural sector should expand. Capacity development for developing and implementing green technologies is needed as is the upskilling of farm workers in energy-efficient methods, resource sustainability, agro-processing and other green technologies. Sustainable agricultural development has been closely aligned to what is termed “ethical farming,” the foundation of what Alan Wright refers to as the “new farming movement” (Wright, 2013). Ethics ultimately drive practice. In agriculture, increasing consumer demand for inexpensive food and need to maximise profit based on neoliberal economic thinking have formed the basis of underlying ethics within the sector and this in turn has encouraged industrial farming practices. Such practices have resulted in an increase in the use of chemicals, irrigation methods that are wasteful, climate change, the destruction of our oceans and other aquatic systems, rapid top soil loss leading to desertification and the implementation of poor worker health and safety conditions (Wright, 2013). Wright explains that historically, ethics and good practice were often passed down between the generations but that in today’s world this is not the case as many farmers are new to the sector and are in fact what he calls, “agricultural orphans” (Ibid, 2013). Many emergent farmers in South Africa may be classified as “agricultural orphans.” Despite the weaknesses of such as position, it does present us with an opportunity to develop new agricultural ethics that will shape sustainable and ecologically friendly farming practice that are tied to existing realities such as high levels of mechanisation and our scientific understanding. The development of new agricultural ethics, according to Wright, requires a number of things. Firstly, clear goals need to be set as these will guide the

34
development of our ethics and limit the number of possibilities. “If our goals are to grow food without toxic residues on the fruiting bodies, than we can no longer believe in spraying for mid-season pests” (Wright, 2013). The second step is to use science to better understand our physical and natural environment. Thirdly, we must observe the cause and effect of our farming practices on our natural environment carefully and where it appears to not be working we must change such practices. Fourthly, on-going sustainable agriculture is dependent on our ability to continuously reassess and evaluate our existing practice. Wright emphasises that we must not be fearful of abandoning standard farming practices simply because we fear failure. We must be prepared to listen and learn from others who are using innovative farming practice that is ecologically ethical. There has been a lot of research conducted in these areas and we must draw on this and the experience of these individuals. Finally, Wright warns that we should not restrict ourselves to a particular growing practice or style (e.g. deep organic) but that we should develop a blend of different practices that are suited to specific regional, climatic and other needs (Ibid, 2013). A view often expressed by farm employers is that current labour legislation makes dismissing workers difficult and so securing labour without entering into contracts of employment is an attractive alternative. Organised Labour is seeking to restrict these opportunities through either regulating or eliminating labour brokers, and efforts are being made to regulate the use of foreign labour. However for the foreseeable future, the trend is for formally employed people to reduce in number and contracted in and casual or agency work to increase. The Sustainability Initiative of South Africa, familiarly known as the SIZA programme, was initiated in 2008 by Fruit South Africa in an attempt to promote ongoing ethical labour practices on fruit farms and pack houses in South Africa (Fruit SA, 2012). The programme has developed a standard of ethical practice and audit methodology for monitoring such practice known as the SIZA Standard. This is based on local labour legislation as well as international standards. The Standard refers to a number of key labour issues including: wages and employment benefits; living conditions; occupational health and safety; the use of child labour; discrimination, harassment and abuse; freedom of association and collective bargaining; the right to terminate labour by workers and, the development of business policy on fair labour practices (Ibid, 2012). It was partly developed as the result of increased global pressure linked to the need for more ethical labour practices on farms (Ibid, 2012). Although it was developed by the fruit industry it may be adopted across other agricultural subsectors. This requires capacity building and increased awareness linked to implementing the SIZA standard. There is reference to the need for skills development opportunities to be provided to all agricultural workers, seasonal and permanent. Although targeted at growers, the SIZA standard also requires growers to sign a service level agreement with labour service providers to ensure that these providers are adhering to applicable legislation in terms of the workers that they supply. Furthermore, the Standard requires all non-permanent workers (including seasonal
35
workers) to sign a formal contract of employment with the employer and that the contracting of non-permanent workers “should not be used to avoid obligations that would normally accrue to permanent workers” (Fruit SA, 2012, 73). In addition, the Standard expects that all “non-permanent workers that leave and return to the same place of work shall accrue all leave and other benefits due to them by law” (Fruit SA, 2012, 74).
vi. Transformation in agriculture – wages and skills
The existence of a very large pool of largely unskilled unemployed workers has an impact on the farming sector. It drives wages down and creates opportunities for casualisation and the expansion of labour contract agencies and brokers. In addition there are significant numbers of foreign nationals, mainly from Zimbabwe and Mozambique, who are seeking work and often finding it on farms and in primary processing and packaging plants. There are benefits to the sector with skilled and semi-skilled workers coming into the labour market, being absorbed into the workforce and helping raise productivity levels. However at the lower skilled end of the market the existence of this pool brings further casualisation and downward pressure on wages. Tensions are likely to increase, and further protests either in the form of xenophobic outbreaks or actions against farmers are likely to increase. Indicative of this is the 2013 labour unrest amongst fruit farm workers in the De Doorns area in the Western Cape. Such unrest has caused government to relook the issue of farm worker wages, particularly with respect to casual labour. One of the outcomes of these protests was Sectoral Determination 13 that deals with employment conditions for farm workers in South Africa. One of the main changes adopted in Sectoral Determination 13 is in relation to the minimum wage for farm workers. As of the 1st March 2013, this minimum wage was increased from R69 per day to R105 per day. Although it is still early days to fully comprehend the real effects of the wage increase on both farmers and farm workers, there are indications that farmers are responding by down-scaling their operations and/or reducing the number of permanent farm workers employed (as suggested by the employment data over the past year). A previous study conducted Bhorat, Kanbur and Stanwix on the impact of the 2003 wage hike in the agricultural sector over a four year period indicates that this did result in a drop in employment on farms (Bhorat et al., 2013). However, it must be cautioned at this stage that an in-depth economic analysis that considers a range of factors, over a much longer period of time, is necessary to reach an accurate conclusion with respect to the 2013 wage hike. That being said, there is some anecdotal evidence to suggest that farmers are not really paying higher wages as they have responded to the wage hike by reducing the number of hours worked per day from nine to eight hours as well as reducing the number of seasonal and permanent workers employed. The decline the employment figure of 55 000 jobs as indicated in the Labour Force Survey for this year may be indicative of this. Generally higher earnings are accompanied by increased productivity and so it can be expected that these sorts of adjustments will happen. According to the CEO of Agriwes-Kaap, “wages have always been associated with productivity. On some farms some people

36
have been earning as much as R250 - R300 a day for productivity. Farmers will not pay workers a minimum wage if the workers are not producing what the minimum wage is” (SSP stakeholder interview, 2014). Thus, an argument against the wage increase is that increasing wages are not sustainable unless there is a commensurate increase in productivity. The Bureau for Food and Agricultural Policy (BFAP) has conducted modelling of the impact of the increased farm worker wage on farmers and farm workers (BFAP, 2012). Further research over time is nevertheless needed to fully comprehend these impacts, but also on the changing skills sets of those employed as other productivity changes take place linked to mechanisation and multi-skilling. A union representative interviewed explained that the implementation of the sectoral determination is not easy to monitor, particularly in the primary agricultural sector where farms are remote and inaccessible. Furthermore, the system of inspection is inefficient and under-capacitated. The outcome, according to the union representative interviewed, is that compliance is uneven across farms and that high levels of exploitation and abuse continue to exist on some farms. In terms of skills levels, primary agriculture is often associated with more lower level skills and secondary agriculture more higher level skills such as artisans. The union representative understood employee working conditions and skills development as being loosely tied together. In other words, farms that provided better working conditions were inevitably those that also provided skills development opportunities to their workers (SSP stakeholder interviews, 2014). The union representative described the role of unions in promoting skills development amongst their members as limited. In fact, it appears that union focus is heavily skewed towards worker conditions for farm workers and not skills development. Reasons provided for this during interviews included the fact that skills development and training is often too expensive. More importantly, though, it is a reflection of attitudes amongst trade union leadership in that the application of skills development in the workplace is overlooked. At a larger, societal level, what emerged through the union interview was that skills development is not only a workplace issue but, also, a public good issue and is therefore not only concerned with personal consumption. The approach presented during the union interview was that trade unions, in addition to their focus on policy, must be recognized as non-profit organisations and operate closer to the ground with other non-profit organisations as part of a two-tier system. These non-profit organisations could then be responsible for connecting the trade unions with employers. The SETA could play a facilitative role (stakeholder interviews, 2014). There were conflicting responses during the interview process with respect to the role that AgriBEE codes have played in increasing employer-driven skills development in the sector. Some respondents felt that compliance of BEE codes have resulted in expanded skills development amongst farm workers. Other respondents felt that the BEE codes have not been a driver for skills development in agriculture and that often, compliance lay with the application of other BEE criteria
37
(SSP stakeholder interviews, 2014). Further research is needed to review the full impact of AgriBEE codes on skills development in the sector. Over and above changes to the minimum wage, the recent wage protests have also brought about increased engagement and public debate on the broader issue of transformation and equity in the agricultural sector. The Deputy-President for example put into motion a number of public debate initiatives aimed at tackling such issues. What emerges through these and other such initiatives is that unless we as a nation tackle the issue of transformation and equity in the agricultural sector head-on, the sustainability of the sector will be undermined. All role-players in the sector must come together to develop a transformation agenda and implementation plan for the sector. Sustainable agricultural development is a national priority and this requires a sustainable agricultural workforce.
i. Skills development across the value chain in rural areas
Rural development plays a critical role in government’s plan to reduce poverty and inequality and boost economic and employment growth. The location of agricultural activities within rural areas means that agricultural development is largely tied to rural development. There is overall consensus across the policy terrain in South Africa that any development programme or plan designed to either address an immediate crisis (such as De Doorns) or the deeply embedded development challenges in many of the country’s rural areas, will include a “Skills Development” pillar or work stream. The content of this skills pillar will vary according to the overall plan. So for example, in an area where land redistribution is being prioritised the focus might be on how to support the planned use of that land and ensure that the land can provide sustainable livelihoods for those involved. There is a need to recognise that the rural economy is based on successful transactions all along the agricultural value chain. At each point in the chain there are skills needs that need to be addressed.
Farms source capital equipment, machinery, tools, implements, vehicles etc. (plant and machinery), for use in the farms. The plant and machinery would typically be used and maintained at the farms except for when specialised skills are required. Training is needed for operators and fitters, as well as local suppliers. The closer suppliers can be located and sustained the better for the local economy.
Other inputs may include fertilisers and chemicals used to control pests etc. Compost can also be produced locally for use in the farms. Training is needed to enable local supply.
Seeds and seedlings are either carefully prepared by the farmers or supplied to farms for use during the planting season. This implies a level of skill higher than those normally associated with general farm labourers and fruit pickers.
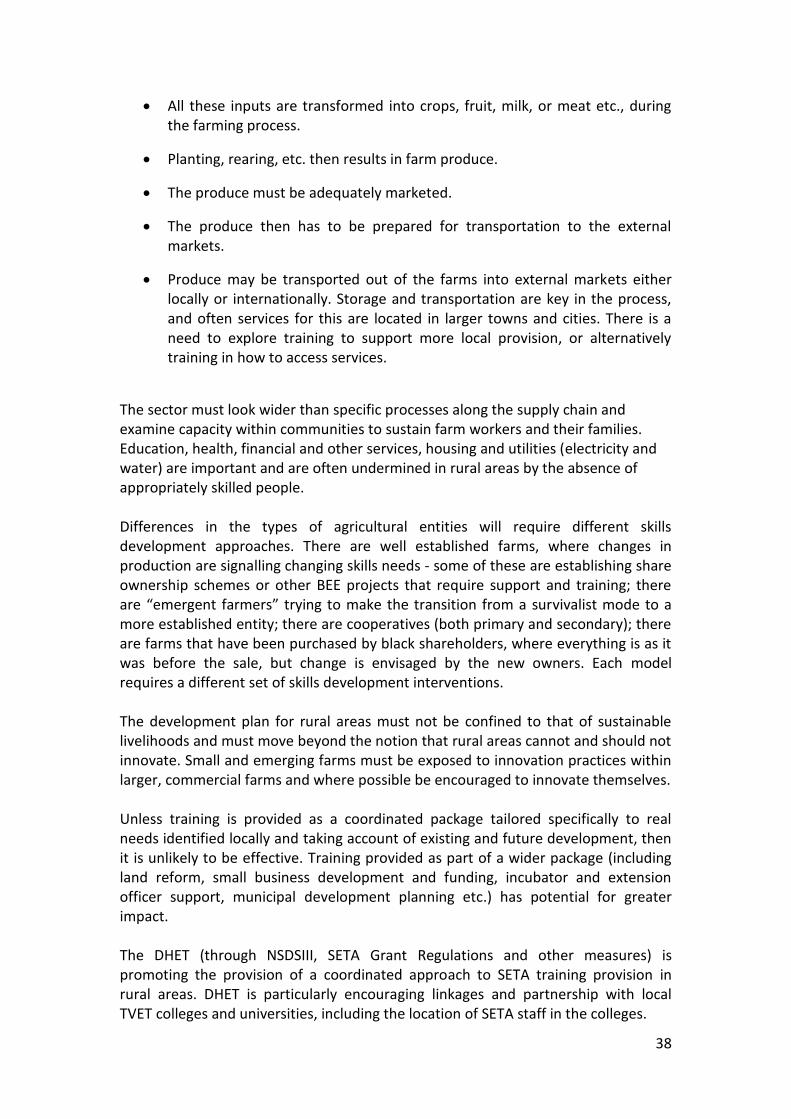
38
All these inputs are transformed into crops, fruit, milk, or meat etc., during the farming process.
Planting, rearing, etc. then results in farm produce.
The produce must be adequately marketed.
The produce then has to be prepared for transportation to the external markets.
Produce may be transported out of the farms into external markets either locally or internationally. Storage and transportation are key in the process, and often services for this are located in larger towns and cities. There is a need to explore training to support more local provision, or alternatively training in how to access services.
The sector must look wider than specific processes along the supply chain and examine capacity within communities to sustain farm workers and their families. Education, health, financial and other services, housing and utilities (electricity and water) are important and are often undermined in rural areas by the absence of appropriately skilled people. Differences in the types of agricultural entities will require different skills development approaches. There are well established farms, where changes in production are signalling changing skills needs - some of these are establishing share ownership schemes or other BEE projects that require support and training; there are “emergent farmers” trying to make the transition from a survivalist mode to a more established entity; there are cooperatives (both primary and secondary); there are farms that have been purchased by black shareholders, where everything is as it was before the sale, but change is envisaged by the new owners. Each model requires a different set of skills development interventions. The development plan for rural areas must not be confined to that of sustainable livelihoods and must move beyond the notion that rural areas cannot and should not innovate. Small and emerging farms must be exposed to innovation practices within larger, commercial farms and where possible be encouraged to innovate themselves. Unless training is provided as a coordinated package tailored specifically to real needs identified locally and taking account of existing and future development, then it is unlikely to be effective. Training provided as part of a wider package (including land reform, small business development and funding, incubator and extension officer support, municipal development planning etc.) has potential for greater impact. The DHET (through NSDSIII, SETA Grant Regulations and other measures) is promoting the provision of a coordinated approach to SETA training provision in rural areas. DHET is particularly encouraging linkages and partnership with local TVET colleges and universities, including the location of SETA staff in the colleges.
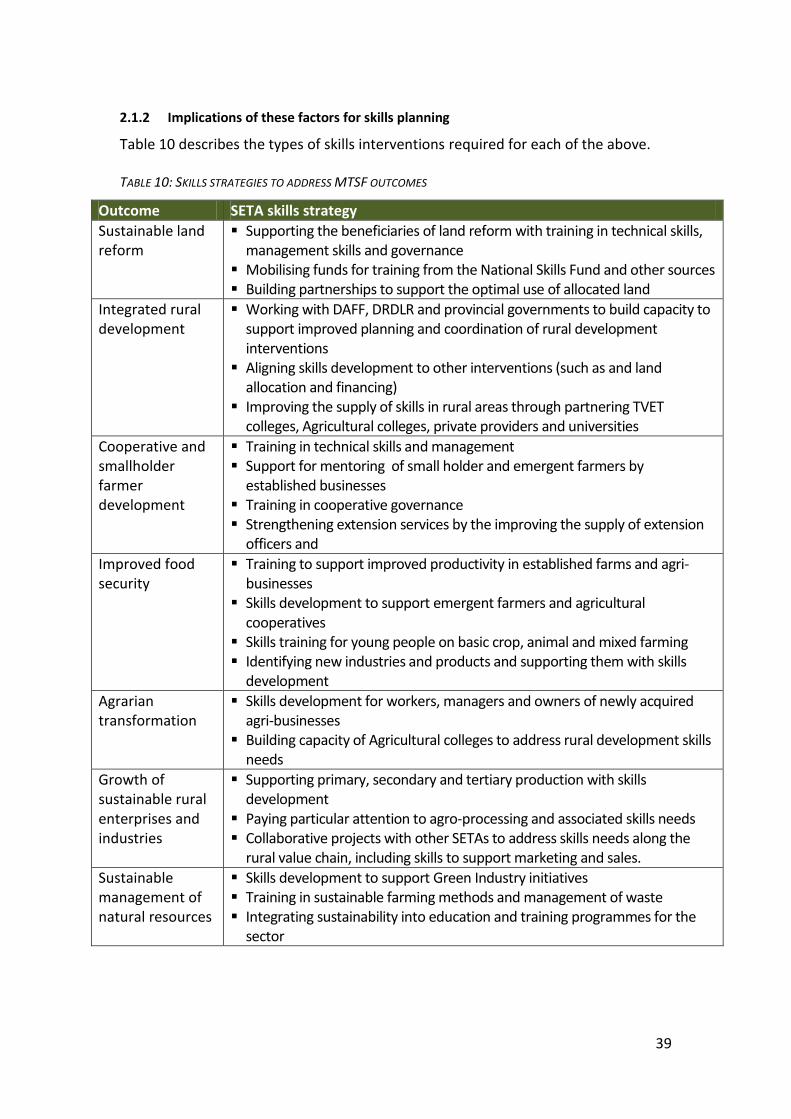
39
2.1.2 Implications of these factors for skills planning
Table 10 describes the types of skills interventions required for each of the above. TABLE 10: SKILLS STRATEGIES TO ADDRESS MTSF OUTCOMES
Outcome SETA skills strategy
Sustainable land reform
Supporting the beneficiaries of land reform with training in technical skills, management skills and governance
Mobilising funds for training from the National Skills Fund and other sources Building partnerships to support the optimal use of allocated land
Integrated rural development
Working with DAFF, DRDLR and provincial governments to build capacity to support improved planning and coordination of rural development interventions
Aligning skills development to other interventions (such as and land allocation and financing)
Improving the supply of skills in rural areas through partnering TVET colleges, Agricultural colleges, private providers and universities
Cooperative and smallholder farmer development
Training in technical skills and management Support for mentoring of small holder and emergent farmers by
established businesses Training in cooperative governance Strengthening extension services by the improving the supply of extension
officers and
Improved food security
Training to support improved productivity in established farms and agri-businesses
Skills development to support emergent farmers and agricultural cooperatives
Skills training for young people on basic crop, animal and mixed farming Identifying new industries and products and supporting them with skills
development
Agrarian transformation
Skills development for workers, managers and owners of newly acquired agri-businesses
Building capacity of Agricultural colleges to address rural development skills needs
Growth of sustainable rural enterprises and industries
Supporting primary, secondary and tertiary production with skills development
Paying particular attention to agro-processing and associated skills needs Collaborative projects with other SETAs to address skills needs along the
rural value chain, including skills to support marketing and sales.
Sustainable management of natural resources
Skills development to support Green Industry initiatives Training in sustainable farming methods and management of waste Integrating sustainability into education and training programmes for the
sector
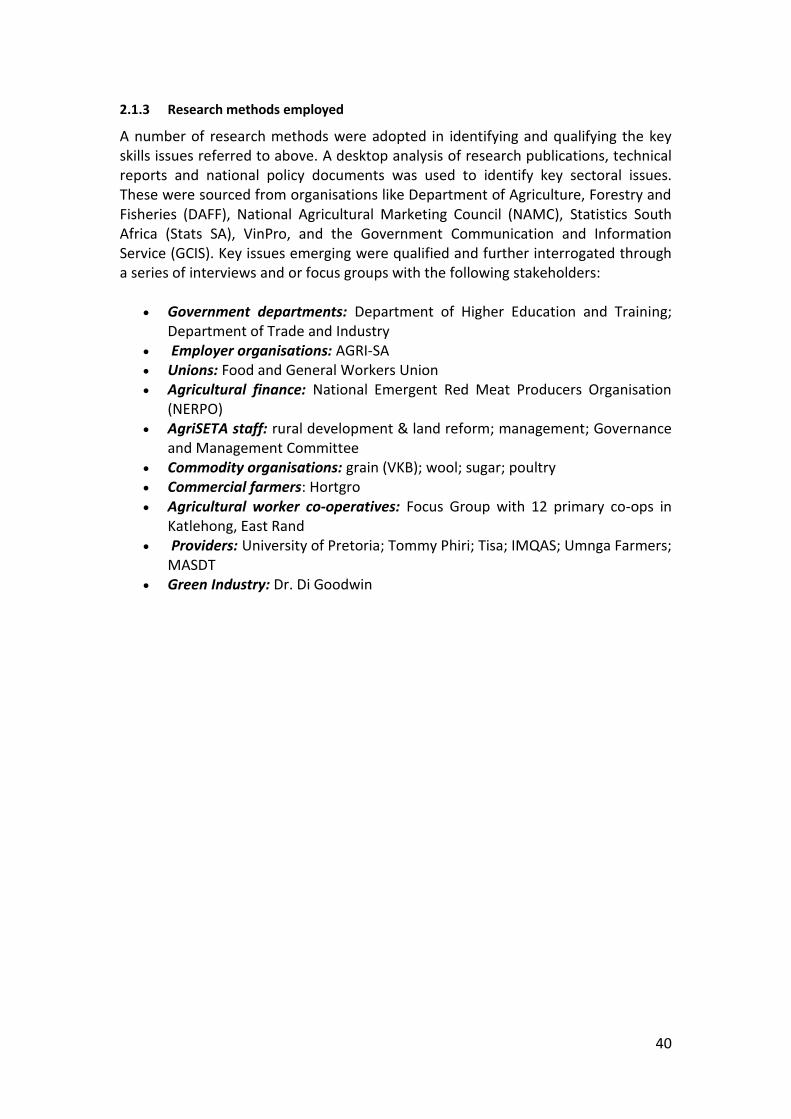
40
2.1.3 Research methods employed
A number of research methods were adopted in identifying and qualifying the key skills issues referred to above. A desktop analysis of research publications, technical reports and national policy documents was used to identify key sectoral issues. These were sourced from organisations like Department of Agriculture, Forestry and Fisheries (DAFF), National Agricultural Marketing Council (NAMC), Statistics South Africa (Stats SA), VinPro, and the Government Communication and Information Service (GCIS). Key issues emerging were qualified and further interrogated through a series of interviews and or focus groups with the following stakeholders:
Government departments: Department of Higher Education and Training; Department of Trade and Industry
Employer organisations: AGRI-SA Unions: Food and General Workers Union Agricultural finance: National Emergent Red Meat Producers Organisation
(NERPO) AgriSETA staff: rural development & land reform; management; Governance
and Management Committee Commodity organisations: grain (VKB); wool; sugar; poultry Commercial farmers: Hortgro Agricultural worker co-operatives: Focus Group with 12 primary co-ops in
Katlehong, East Rand Providers: University of Pretoria; Tommy Phiri; Tisa; IMQAS; Umnga Farmers;
MASDT Green Industry: Dr. Di Goodwin

41
2.2 Alignment with national strategies and plans
AgriSETA seeks to develop a sector strategy that responds to and resonates with government programmes that impact in the sector. These include national and sector growth and development strategies, the National Human Resources Development Strategy, the Industrial Policy Framework and Action Plan (IPAP), innovation and technology strategy, environmental sustainability plans, land reform and transformation and Rural Development. AgriSETA understands that the key document that draws together the various strategies and interventions of government is the National Development Plan (NDP). There are a number of other national policies that have either a direct or indirect impact on skills development in the agricultural sector. These are referred to in the table below. Table 11: National policy and skills development implications table
Policy Type Policy Description Policy Objectives Possible Skills Implications
National Development Plan (NDP)
The over-arching, long-term plan for South Africa that aims to eliminate poverty and reduce inequality by 2030 through faster and more inclusive economic growth. A priority of the NDP is “improving the quality of education, skills development and innovation” (SA Presidency, 2011, 17).
Increased investment in new agricultural technologies, research and development of adaptation strategies for the protection of rural livelihoods and expansion of commercial agriculture.
Channel public investment into research, new agricultural technologies for commercial farming, as well as for the development of adaptation strategies and support services for small-scale and rural farmers.
An additional 643 000 direct jobs and 326 000 indirect jobs in the agriculture, agro-processing and related sectors by 2030.
Maintain a positive trade balance for agricultural products.
Rural economies will be activated through improved infrastructure and service delivery, a review of land tenure, service to small and micro farmers, a review of mining industry commitments to social investment, and tourism investments.
Create tenure security for communal farmers,
Build a strong relationship between the college sector and industry, via SETAs (SA Presidency, 2011, 57-61).
The enhancement of skills amongst the small-scale and emergent farming sector is prioritised. This requires a skills development platform that targets multiple areas of skills development across the value chain. Training that is provided as part of a package (including land reform, small business development and funding, incubator and extension officer support, municipal development planning, etc.) and takes into account existing and future development, have the potential for greater impact.
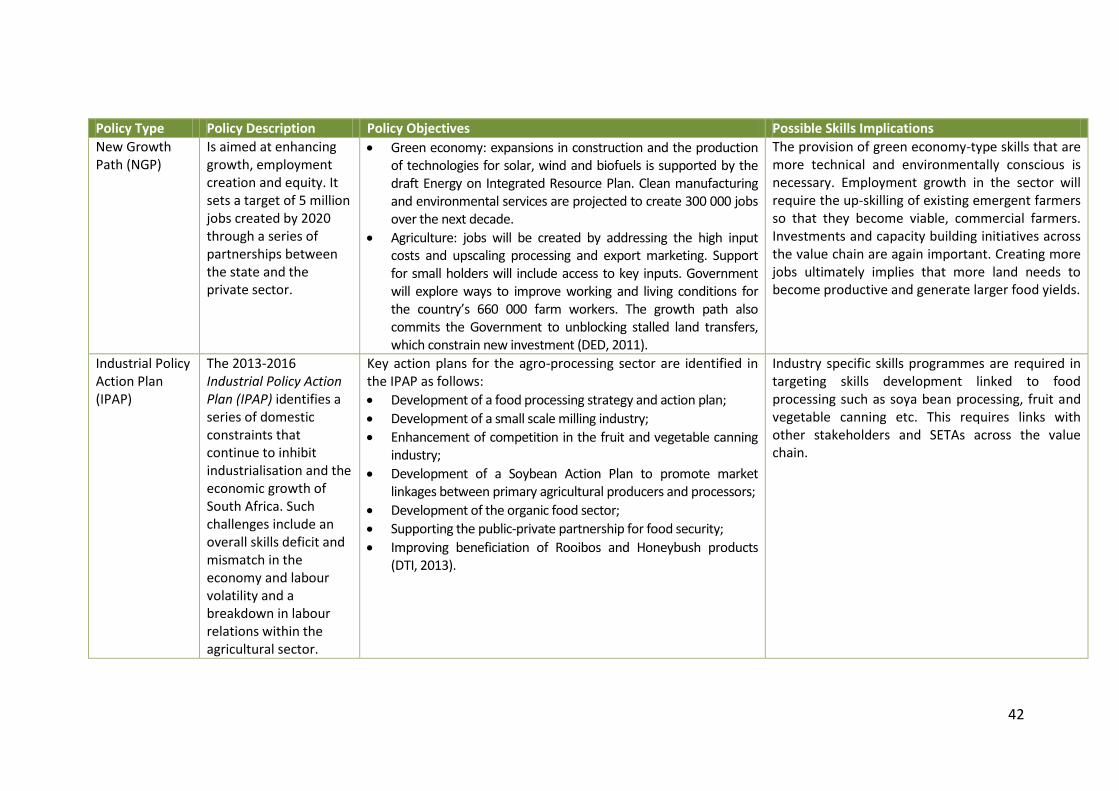
42
Policy Type Policy Description Policy Objectives Possible Skills Implications
New Growth Path (NGP)
Is aimed at enhancing growth, employment creation and equity. It sets a target of 5 million jobs created by 2020 through a series of partnerships between the state and the private sector.
Green economy: expansions in construction and the production of technologies for solar, wind and biofuels is supported by the draft Energy on Integrated Resource Plan. Clean manufacturing and environmental services are projected to create 300 000 jobs over the next decade.
Agriculture: jobs will be created by addressing the high input costs and upscaling processing and export marketing. Support for small holders will include access to key inputs. Government will explore ways to improve working and living conditions for the country’s 660 000 farm workers. The growth path also commits the Government to unblocking stalled land transfers, which constrain new investment (DED, 2011).
The provision of green economy-type skills that are more technical and environmentally conscious is necessary. Employment growth in the sector will require the up-skilling of existing emergent farmers so that they become viable, commercial farmers. Investments and capacity building initiatives across the value chain are again important. Creating more jobs ultimately implies that more land needs to become productive and generate larger food yields.
Industrial Policy Action Plan (IPAP)
The 2013-2016 Industrial Policy Action Plan (IPAP) identifies a series of domestic constraints that continue to inhibit industrialisation and the economic growth of South Africa. Such challenges include an overall skills deficit and mismatch in the economy and labour volatility and a breakdown in labour relations within the agricultural sector.
Key action plans for the agro-processing sector are identified in the IPAP as follows:
Development of a food processing strategy and action plan;
Development of a small scale milling industry;
Enhancement of competition in the fruit and vegetable canning industry;
Development of a Soybean Action Plan to promote market linkages between primary agricultural producers and processors;
Development of the organic food sector;
Supporting the public-private partnership for food security;
Improving beneficiation of Rooibos and Honeybush products (DTI, 2013).
Industry specific skills programmes are required in targeting skills development linked to food processing such as soya bean processing, fruit and vegetable canning etc. This requires links with other stakeholders and SETAs across the value chain.

43
Policy Type Policy Description Policy Objectives Possible Skills Implications
Human Resources Development Strategy for SA (HRDSA)
This is intended to be a coherent, national human resource development framework within which all other HRD-oriented policies operate. It is framed around four main elements of HRD that play a direct role in the country achieving its economic development needs, including: educational attainment, skills development, science and innovation and, labour market and employment policies. There is a particular focus on addressing skills mismatch in the economy.
Key strategic objectives that impact on the sector include:
Increase the number of appropriately qualified people to meet the HR demands in the agro-processing industry and biofuels industry;
Development of a credible, master skills list that of all key stakeholders and economic sectors;
Implementation of demand-led skills programmes based on substantive employer input;
Increase the coverage and scope of employers reporting on workplace training activities and spending;
Expand access to skills development programmes targeted at unemployed adults, women and the youth.
Improve levels of research;
Develop SSPs that are responsive to the real needs of the sector and that of the developmental state.
Establish capacity for conducting labour market demand and supply forecasting (HRDC, 2010).
Skills development needs to target new skills areas such as agro-processing and biofuels. In order for skills programmes to meet real, employer and sector-based demand, there must be increased stakeholder (particularly employer) input into the types of programmes development, their content etc. A better understanding of real sector needs depends on capacity building within the SETA, particularly in areas of skills planning, labour market forecasting, analysis and, research.
DAFF Integrated Growth & Development Plan (IGDP)
The vision of the IGDP is to develop, “an equitable, productive, competitive, profitable and sustainable Agriculture, Forestry and Fisheries Sector growing
The IGDP has prioritised four, key sector goals which include:
A transformed and equitable sector
Equitable growth and competitiveness
Improved sustainable natural resource management
Effective and efficient governance systems
SETAs are expected to play a role in skills development and training that will improve the viability of subsistence and small-scale production as well as in the development of a national food policy on national and household food safety and security. AgriSETA can play a role relate to the integration of small-scale farmers into the
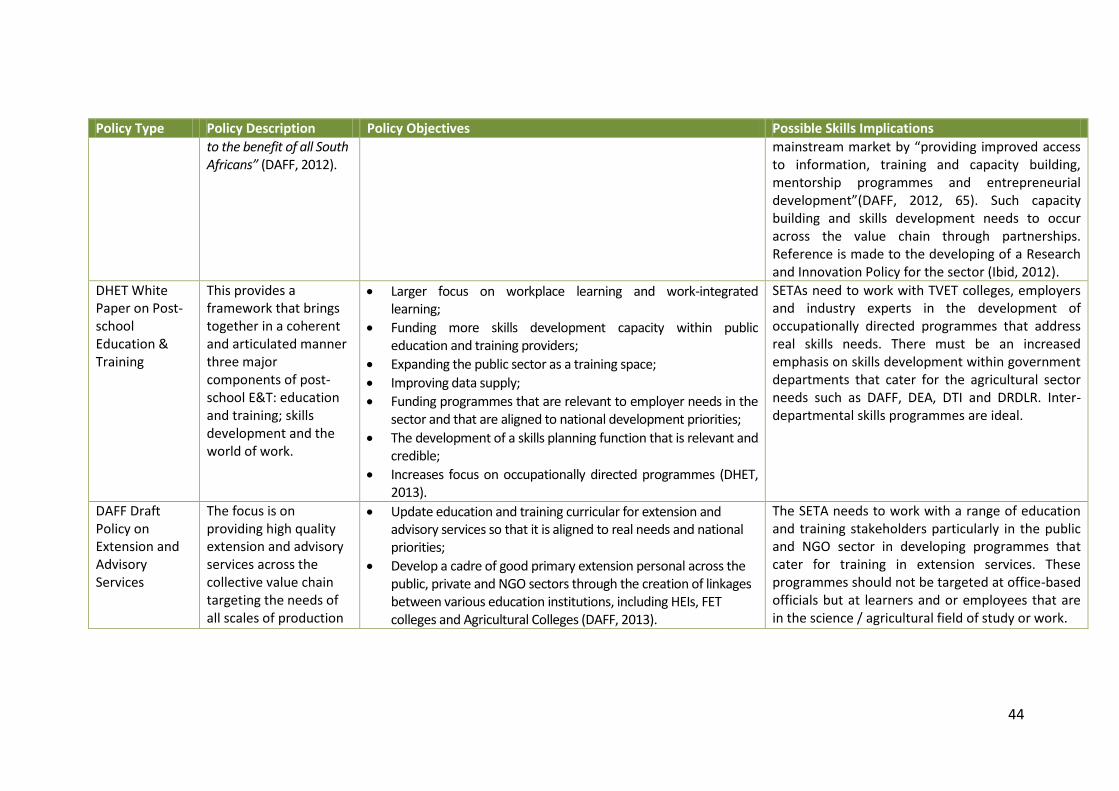
44
Policy Type Policy Description Policy Objectives Possible Skills Implications
to the benefit of all South Africans” (DAFF, 2012).
mainstream market by “providing improved access to information, training and capacity building, mentorship programmes and entrepreneurial development”(DAFF, 2012, 65). Such capacity building and skills development needs to occur across the value chain through partnerships. Reference is made to the developing of a Research and Innovation Policy for the sector (Ibid, 2012).
DHET White Paper on Post-school Education & Training
This provides a framework that brings together in a coherent and articulated manner three major components of post-school E&T: education and training; skills development and the world of work.
Larger focus on workplace learning and work-integrated learning;
Funding more skills development capacity within public education and training providers;
Expanding the public sector as a training space;
Improving data supply;
Funding programmes that are relevant to employer needs in the sector and that are aligned to national development priorities;
The development of a skills planning function that is relevant and credible;
Increases focus on occupationally directed programmes (DHET, 2013).
SETAs need to work with TVET colleges, employers and industry experts in the development of occupationally directed programmes that address real skills needs. There must be an increased emphasis on skills development within government departments that cater for the agricultural sector needs such as DAFF, DEA, DTI and DRDLR. Inter-departmental skills programmes are ideal.
DAFF Draft Policy on Extension and Advisory Services
The focus is on providing high quality extension and advisory services across the collective value chain targeting the needs of all scales of production
Update education and training curricular for extension and advisory services so that it is aligned to real needs and national priorities;
Develop a cadre of good primary extension personal across the public, private and NGO sectors through the creation of linkages between various education institutions, including HEIs, FET colleges and Agricultural Colleges (DAFF, 2013).
The SETA needs to work with a range of education and training stakeholders particularly in the public and NGO sector in developing programmes that cater for training in extension services. These programmes should not be targeted at office-based officials but at learners and or employees that are in the science / agricultural field of study or work.

45
2.3 Implementing national strategies and plans
Implementation plans for the NDP are contained in the Medium Term Strategic Framework (MTSF) and the 14 annexures that address the fourteen national priority outcomes of government (SA Presidency, 2014). These annexures relate to:
1. Quality basic education 2. A long and healthy life for all South Africans 3. All people in South Africa are and feel safe 4. Decent employment through inclusive growth 5. A skilled and capable workforce to support an inclusive growth path 6. An efficient, competitive and responsive economic infrastructure network 7. Vibrant, equitable, sustainable rural communities contributing towards food
security for all 8. Sustainable human settlements and improved quality of household life 9. Responsive, accountable, effective and efficient local government 10. Protect and enhance our environmental assets and natural resources 11. Create a better South Africa and contribute to a better Africa and a better
world 12. An efficient, effective and development-oriented public service 13. A comprehensive, responsive and sustainable social protection system 14. A diverse, socially cohesive society with a common national identity
From these government priorities, it is clear that the work of the AgriSETA contributes directly to three priorities (bolded) and impacts on at least three more priorities (italicised). Outcome 7 is particularly important with its target of 1 million new jobs in the agricultural sector by 2030. The following capture the key MTSF aligned results that the AgriSETA seeks to support with skills development:
Sustainable land reform
Integrated rural development
Development of Agricultural Cooperatives
Improved food security
Sustainable management of natural resources
Smallholder farmer development
Agrarian transformation
Growth of sustainable rural enterprises and industries and expanding employment. This is a feature of rural economic development: an economy with strong rural-urban linkages, expansion in agro-processing, expanded markets including exports and vibrant supply chains and linkages.
46
2.4 Conclusion
All of the key, national policies talk to the need to increase employment and boost skills. The aim is to ensure alignment between these policies and understanding skills development in the sector. Land reform is a priority of the state. Land reform programmes have been largely unsuccessful due to factors such as poor access to markets and other services by emergent farmers as well as inadequate skills. Government recognizes the link between successful land reform and skills development. Support needs to be provided across the value chain. Half of our population are either hungry or at risk of being hungry. Food security is high up on the agenda of government. There are skills development implications associated with increasing the availability and accessibility of food production in the country. Food storage and distribution networks need to be improved so as to reduce wastage; market participation of emergent farmers needs to be expanded and existing agricultural land needs to be preserved and protected through sustainable resource management to ensure greater product yields now and in the future. Labour market trends in the agricultural sector are complex and require further, in-depth economic analysis over a four to five year period, particularly regarding the effects of the 2013 wage hike. There are also challenges relating to the usefulness of the StatsSA data. The Quarterly Labour Force Survey (QLFS) does not distinguish between employment figures for agriculture, fisheries and forestry and between the informal and formal sectors. Data for domestic workers is aggregated with agricultural data and the data only reflects the economically active population between the ages of 15 and 64. Although anecdotal evidence points to a reduction in employment as the result of the wage hike but this cannot be determined without additional research. All role-players in the sector must come together to develop a transformation agenda and implementation plan for the sector. Sustainable agricultural development is a national priority and this requires a sustainable agricultural workforce. An expanded focus on sustainable farming practices necessitates a growth in higher level knowledge (through research) and skills linked to developing and implementing green technologies that improve energy efficiency, reduce carbon emissions and advance resource sustainability. Agricultural sector development is closely tied to rural development and skills development is an important pillar in both. It is imperative that skills development occurs at each point of the agricultural value chain and that training is provided as a coordinated package.

47
Chapter 3: SKILLS MISMATCH
3.1 Extent of skills demand
The following section reflects research on skills demand in the Agricultural sector arising from the sector analysis, AgriSETA skills demand research for Sector Skills Planning during 2010 -2015, analysis of WSP data and interviews and surveys of subsector key informants and stakeholders. Besides the sub-sector specific skills requirements, what emerged out of the stakeholder interviews is that, the skills priorities for different farming constituencies are similar across the different sub-sectors, and are mostly to do with financial, business and technical skills. Although this is anecdotal evidence it is included as there is triangulation with skills demand data that emerged through the WSP and ATR analysis. These are summarised below in Table 12. Table 12: Interview Analysis of Skills Demanded
Farming constituency
Generic priority skills Sub-sector specific priority skills
Small and emerging farmers
Financial management
Literacy skills – reading and writing
Business skills – basic business skills, profit, loss, income.
Marketing
Adaptability – fore planning.
Knowledge of current affairs.
Compliance with legislation
Governance skills especially when organized into coops
Wool
Hand and machine shearing
Health and welfare of animals to get better
Wool grading Red Meat
Grader
Meat examiner
Meat inspector Poultry
Biosecurity
Vaccination
Health and welfare of birds
Monitoring of birds
Commercial farmers
Most commercial farmers have acquired skills through experience but need to keep up with national developments in legislation to comply, as well as what is happening on the global market.
Wool
Nutrition
Wool classing
Predation management
Cooperative farmers
Governance
Business management
Financial management
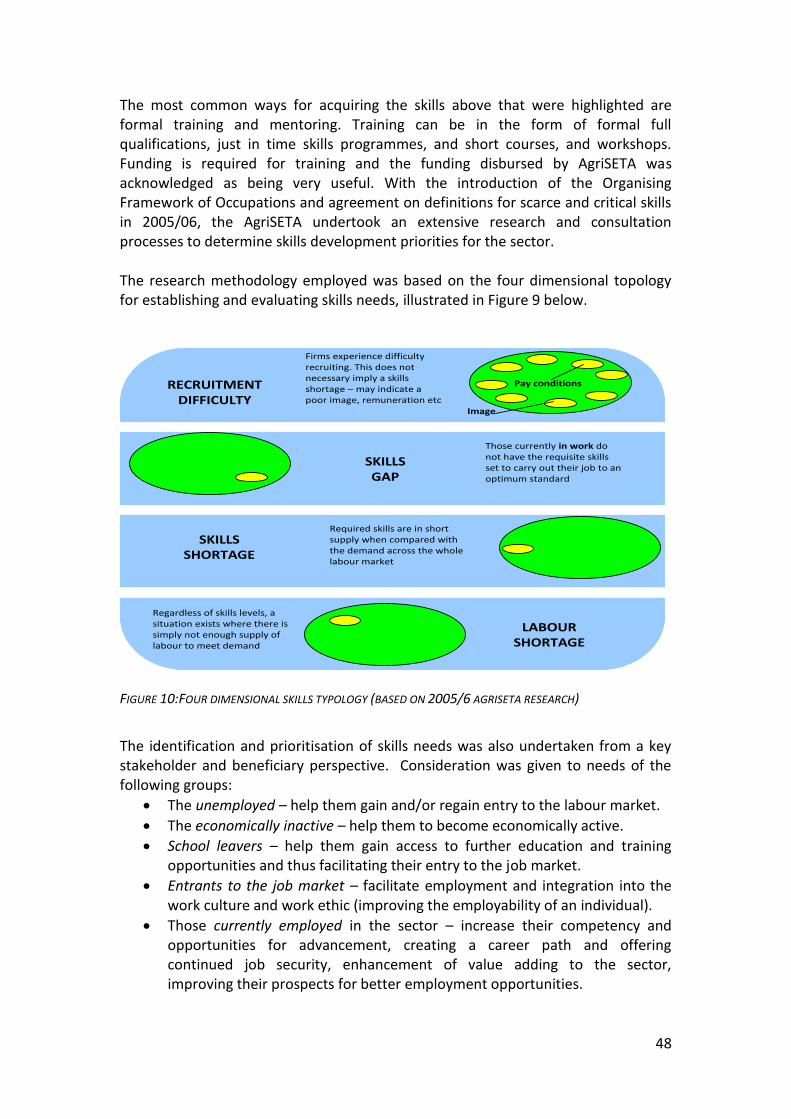
48
The most common ways for acquiring the skills above that were highlighted are formal training and mentoring. Training can be in the form of formal full qualifications, just in time skills programmes, and short courses, and workshops. Funding is required for training and the funding disbursed by AgriSETA was acknowledged as being very useful. With the introduction of the Organising Framework of Occupations and agreement on definitions for scarce and critical skills in 2005/06, the AgriSETA undertook an extensive research and consultation processes to determine skills development priorities for the sector. The research methodology employed was based on the four dimensional topology for establishing and evaluating skills needs, illustrated in Figure 9 below.
FIGURE 10:FOUR DIMENSIONAL SKILLS TYPOLOGY (BASED ON 2005/6 AGRISETA RESEARCH)
The identification and prioritisation of skills needs was also undertaken from a key stakeholder and beneficiary perspective. Consideration was given to needs of the following groups:
The unemployed – help them gain and/or regain entry to the labour market.
The economically inactive – help them to become economically active.
School leavers – help them gain access to further education and training opportunities and thus facilitating their entry to the job market.
Entrants to the job market – facilitate employment and integration into the work culture and work ethic (improving the employability of an individual).
Those currently employed in the sector – increase their competency and opportunities for advancement, creating a career path and offering continued job security, enhancement of value adding to the sector, improving their prospects for better employment opportunities.
Pay conditions
Image
RECRUITMENT DIFFICULTY
SKILLSGAP
SKILLSSHORTAGE
LABOURSHORTAGE
Firms experience difficulty recruiting. This does not necessary imply a skills shortage – may indicate a poor image, remuneration etc
Those currently in work do not have the requisite skills set to carry out their job to an optimum standard
Required skills are in short supply when compared with the demand across the whole labour market
Regardless of skills levels, a situation exists where there is simply not enough supply of labour to meet demand
49
Organisations and enterprises within the sector – make sure that skills development and knowledge creation occurs in such a way as to improve the sector’s viability and allowing companies/enterprises to become more sustainable and profitable along the way, improving productivity, competitiveness and innovation within organisations.
In organising and reporting the identified priority skills development needs, the following structuring approach was followed:
Tier 1: The four categories of needs as per the Typology presented above were used for the identification, evaluation and grouping of needs.
Tier 2: Within each of the first tier groupings, needs were further broken down and organised per target group. At this second level needs were grouped by:
o General skills development needs (cross-cutting across target groups) o Needs experienced by small scale farmers (this group included
subsistence farmers, new emerging land reform beneficiaries and small-scale AgriBEE farmers)
o Needs within the commercial agricultural sector (per subsector groupings where specific needs for such were identified – both on-farm needs and within the secondary subsector or related agri-businesses)
o Needs of the Department of Agriculture, Fisheries and Forestry (DAFF) To further guide and direct the identification and selection of scarce and critical skills, the following factors or criteria were identified:
1. Basic Skills Development Promoting basic literacy and numeracy and raising the base level of education for the sector, improving the work and livelihood of workers.
2. Employability: Enhancing employability via better fit between their skills and sector needs.
3. Enterprise Viability: Improving the capability and feasibility of the enterprise by increasing effectiveness of or possibilities for profit generation, etc.
4. Enterprise Sustainability: Allow enterprises to survive and grow over an extended period without compromising the value of renewable resources, creating long-term, meaningful employment for larger numbers of people.
5. Sector Growth: Enabling the sector to develop or pursue new opportunities or improve the effectiveness of current operations.
6. Sector Competitiveness: Enabling the sector to compete effectively globally, improving market intelligence and interpretation, productivity, cost efficiency, etc.
7. Human Resource Development Capacity:
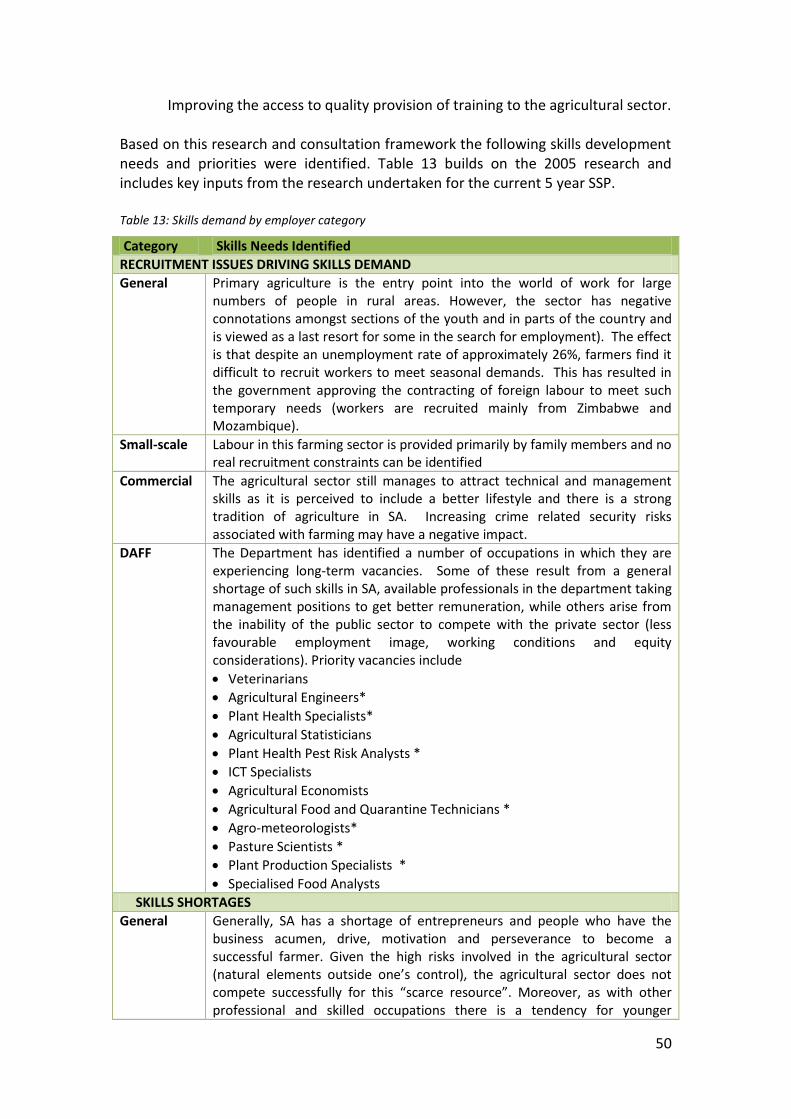
50
Improving the access to quality provision of training to the agricultural sector. Based on this research and consultation framework the following skills development needs and priorities were identified. Table 13 builds on the 2005 research and includes key inputs from the research undertaken for the current 5 year SSP. Table 13: Skills demand by employer category
Category Skills Needs Identified
RECRUITMENT ISSUES DRIVING SKILLS DEMAND
General Primary agriculture is the entry point into the world of work for large numbers of people in rural areas. However, the sector has negative connotations amongst sections of the youth and in parts of the country and is viewed as a last resort for some in the search for employment). The effect is that despite an unemployment rate of approximately 26%, farmers find it difficult to recruit workers to meet seasonal demands. This has resulted in the government approving the contracting of foreign labour to meet such temporary needs (workers are recruited mainly from Zimbabwe and Mozambique).
Small-scale Labour in this farming sector is provided primarily by family members and no real recruitment constraints can be identified
Commercial The agricultural sector still manages to attract technical and management skills as it is perceived to include a better lifestyle and there is a strong tradition of agriculture in SA. Increasing crime related security risks associated with farming may have a negative impact.
DAFF The Department has identified a number of occupations in which they are experiencing long-term vacancies. Some of these result from a general shortage of such skills in SA, available professionals in the department taking management positions to get better remuneration, while others arise from the inability of the public sector to compete with the private sector (less favourable employment image, working conditions and equity considerations). Priority vacancies include
Veterinarians
Agricultural Engineers*
Plant Health Specialists*
Agricultural Statisticians
Plant Health Pest Risk Analysts *
ICT Specialists
Agricultural Economists
Agricultural Food and Quarantine Technicians *
Agro-meteorologists*
Pasture Scientists *
Plant Production Specialists *
Specialised Food Analysts
SKILLS SHORTAGES
General Generally, SA has a shortage of entrepreneurs and people who have the business acumen, drive, motivation and perseverance to become a successful farmer. Given the high risks involved in the agricultural sector (natural elements outside one’s control), the agricultural sector does not compete successfully for this “scarce resource”. Moreover, as with other professional and skilled occupations there is a tendency for younger
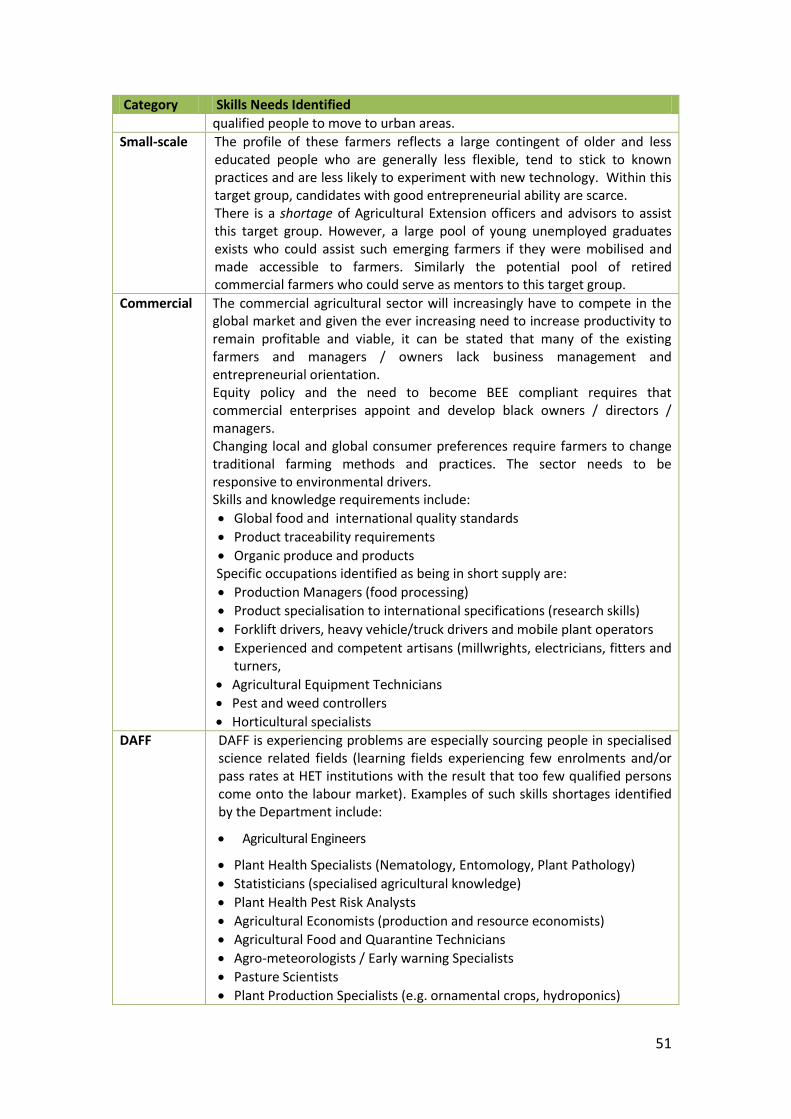
51
Category Skills Needs Identified
qualified people to move to urban areas.
Small-scale The profile of these farmers reflects a large contingent of older and less educated people who are generally less flexible, tend to stick to known practices and are less likely to experiment with new technology. Within this target group, candidates with good entrepreneurial ability are scarce. There is a shortage of Agricultural Extension officers and advisors to assist this target group. However, a large pool of young unemployed graduates exists who could assist such emerging farmers if they were mobilised and made accessible to farmers. Similarly the potential pool of retired commercial farmers who could serve as mentors to this target group.
Commercial The commercial agricultural sector will increasingly have to compete in the global market and given the ever increasing need to increase productivity to remain profitable and viable, it can be stated that many of the existing farmers and managers / owners lack business management and entrepreneurial orientation. Equity policy and the need to become BEE compliant requires that commercial enterprises appoint and develop black owners / directors / managers. Changing local and global consumer preferences require farmers to change traditional farming methods and practices. The sector needs to be responsive to environmental drivers. Skills and knowledge requirements include:
Global food and international quality standards
Product traceability requirements
Organic produce and products Specific occupations identified as being in short supply are:
Production Managers (food processing)
Product specialisation to international specifications (research skills)
Forklift drivers, heavy vehicle/truck drivers and mobile plant operators
Experienced and competent artisans (millwrights, electricians, fitters and turners,
Agricultural Equipment Technicians
Pest and weed controllers
Horticultural specialists
DAFF DAFF is experiencing problems are especially sourcing people in specialised science related fields (learning fields experiencing few enrolments and/or pass rates at HET institutions with the result that too few qualified persons come onto the labour market). Examples of such skills shortages identified by the Department include:
Agricultural Engineers
Plant Health Specialists (Nematology, Entomology, Plant Pathology)
Statisticians (specialised agricultural knowledge)
Plant Health Pest Risk Analysts
Agricultural Economists (production and resource economists)
Agricultural Food and Quarantine Technicians
Agro-meteorologists / Early warning Specialists
Pasture Scientists
Plant Production Specialists (e.g. ornamental crops, hydroponics)
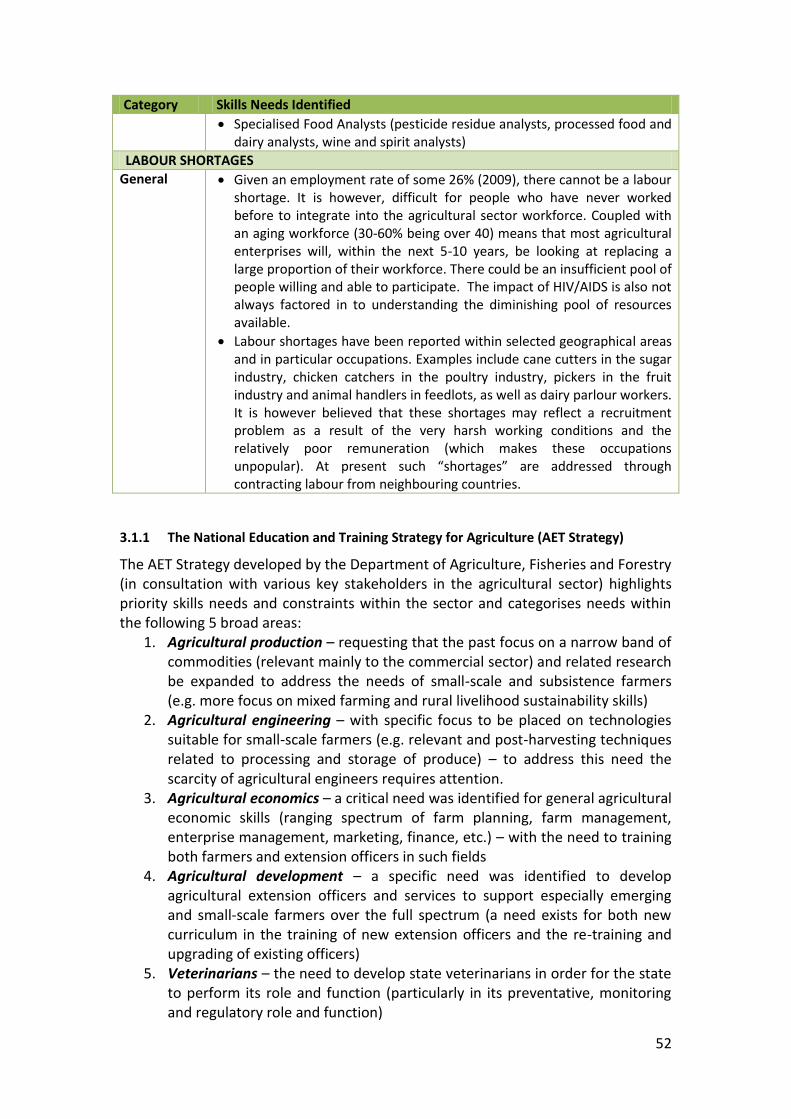
52
Category Skills Needs Identified
Specialised Food Analysts (pesticide residue analysts, processed food and dairy analysts, wine and spirit analysts)
LABOUR SHORTAGES
General Given an employment rate of some 26% (2009), there cannot be a labour shortage. It is however, difficult for people who have never worked before to integrate into the agricultural sector workforce. Coupled with an aging workforce (30-60% being over 40) means that most agricultural enterprises will, within the next 5-10 years, be looking at replacing a large proportion of their workforce. There could be an insufficient pool of people willing and able to participate. The impact of HIV/AIDS is also not always factored in to understanding the diminishing pool of resources available.
Labour shortages have been reported within selected geographical areas and in particular occupations. Examples include cane cutters in the sugar industry, chicken catchers in the poultry industry, pickers in the fruit industry and animal handlers in feedlots, as well as dairy parlour workers. It is however believed that these shortages may reflect a recruitment problem as a result of the very harsh working conditions and the relatively poor remuneration (which makes these occupations unpopular). At present such “shortages” are addressed through contracting labour from neighbouring countries.
3.1.1 The National Education and Training Strategy for Agriculture (AET Strategy)
The AET Strategy developed by the Department of Agriculture, Fisheries and Forestry (in consultation with various key stakeholders in the agricultural sector) highlights priority skills needs and constraints within the sector and categorises needs within the following 5 broad areas:
1. Agricultural production – requesting that the past focus on a narrow band of commodities (relevant mainly to the commercial sector) and related research be expanded to address the needs of small-scale and subsistence farmers (e.g. more focus on mixed farming and rural livelihood sustainability skills)
2. Agricultural engineering – with specific focus to be placed on technologies suitable for small-scale farmers (e.g. relevant and post-harvesting techniques related to processing and storage of produce) – to address this need the scarcity of agricultural engineers requires attention.
3. Agricultural economics – a critical need was identified for general agricultural economic skills (ranging spectrum of farm planning, farm management, enterprise management, marketing, finance, etc.) – with the need to training both farmers and extension officers in such fields
4. Agricultural development – a specific need was identified to develop agricultural extension officers and services to support especially emerging and small-scale farmers over the full spectrum (a need exists for both new curriculum in the training of new extension officers and the re-training and upgrading of existing officers)
5. Veterinarians – the need to develop state veterinarians in order for the state to perform its role and function (particularly in its preventative, monitoring and regulatory role and function)
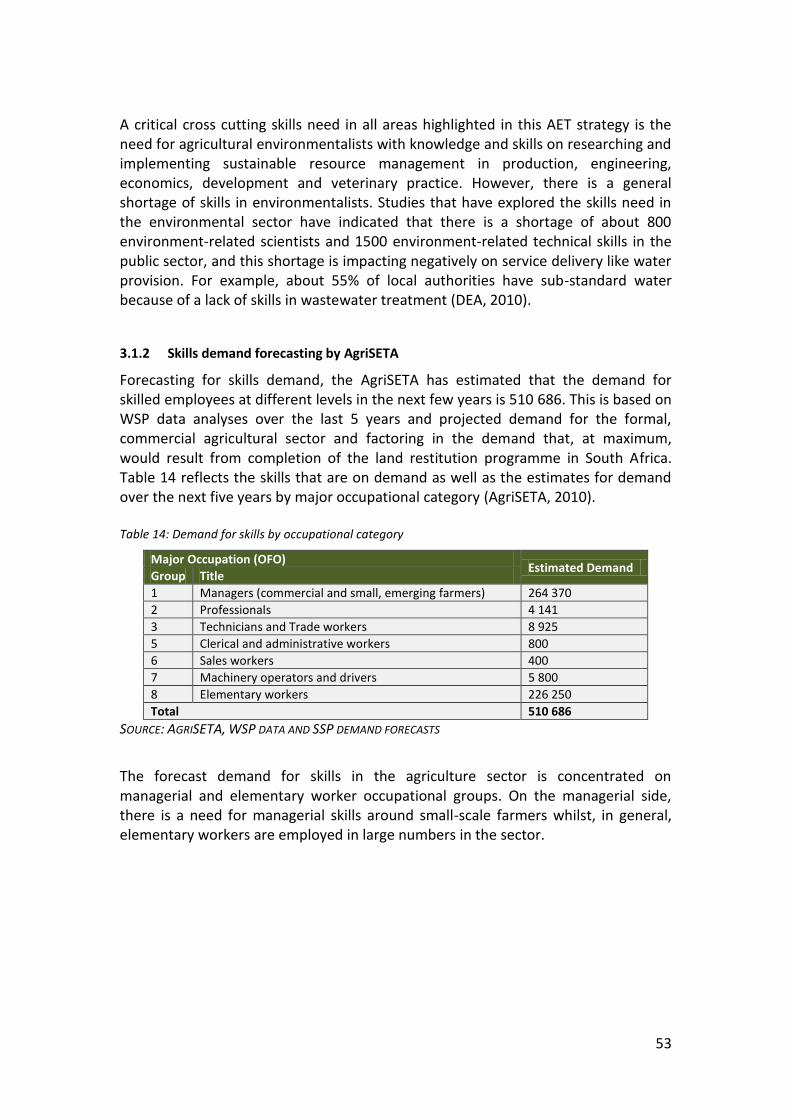
53
A critical cross cutting skills need in all areas highlighted in this AET strategy is the need for agricultural environmentalists with knowledge and skills on researching and implementing sustainable resource management in production, engineering, economics, development and veterinary practice. However, there is a general shortage of skills in environmentalists. Studies that have explored the skills need in the environmental sector have indicated that there is a shortage of about 800 environment-related scientists and 1500 environment-related technical skills in the public sector, and this shortage is impacting negatively on service delivery like water provision. For example, about 55% of local authorities have sub-standard water because of a lack of skills in wastewater treatment (DEA, 2010).
3.1.2 Skills demand forecasting by AgriSETA
Forecasting for skills demand, the AgriSETA has estimated that the demand for skilled employees at different levels in the next few years is 510 686. This is based on WSP data analyses over the last 5 years and projected demand for the formal, commercial agricultural sector and factoring in the demand that, at maximum, would result from completion of the land restitution programme in South Africa. Table 14 reflects the skills that are on demand as well as the estimates for demand over the next five years by major occupational category (AgriSETA, 2010). Table 14: Demand for skills by occupational category
Major Occupation (OFO) Estimated Demand
Group Title
1 Managers (commercial and small, emerging farmers) 264 370
2 Professionals 4 141
3 Technicians and Trade workers 8 925
5 Clerical and administrative workers 800
6 Sales workers 400
7 Machinery operators and drivers 5 800
8 Elementary workers 226 250
Total 510 686
SOURCE: AGRISETA, WSP DATA AND SSP DEMAND FORECASTS
The forecast demand for skills in the agriculture sector is concentrated on managerial and elementary worker occupational groups. On the managerial side, there is a need for managerial skills around small-scale farmers whilst, in general, elementary workers are employed in large numbers in the sector.
54
3.2 Extent of skills supply
South Africa’s agriculture skills are produced in high schools, agricultural colleges, FET colleges, and Higher Education institutions. All high schools can offer Agricultural Sciences, Agricultural Management Practices and Agricultural Technology as choice subjects in Grades 10 to 12 provided they have qualified agricultural teachers and the required practical facilities. In most instances it is the specialized agricultural high schools that offer the latter two subjects, as these subjects require learners to have access to farms and agricultural production (DBE, 2013). These students could progress to taking agriculture as a focus area at an FET college or university. In 2004, there were 10 FET colleges offering vocationally directed agricultural programmes. These FET colleges offered complete qualifications and short courses. Universities also offer various agricultural qualifications including advanced certificates, diplomas and degrees.
3.2.1 Colleges of agriculture
South Africa has 12 colleges of agriculture. A thirteenth college, Marapyane Campus, was established in 2012 as a satellite campus of Lowveld College in Mpumalanga. Nine of these colleges offer a qualifications mix at NQF Level 5-7 that includes national certificates, higher certificates, diplomas and degrees in a range of subject areas including animal production, crop production, agribusiness and general agriculture. The Council for Higher Education (CHE) accredits these qualifications. The remaining three colleges, Madzivhandila College, Tompi Seleka College and Tsolo College operate as farmer training centres offering short courses and learnerships at NQF Level 1-4 that are accredited by the AgriSETA.
There are a large number of short courses in technical agricultural skills some of which include dairy processing, pig production, agricultural extension, poultry production, plant improvement and soil fertility. These colleges lost their accreditation status to offer higher education programmes but have recently applied for re-accreditation from the CHE. The table below indicates the provincial distribution of the 12 colleges of agriculture. Except for the Northern Cape and Gauteng, the other seven provinces all have agricultural colleges (DAFF, 2013). Total enrolments for first year students at the agricultural colleges have increased consistently between 2009 and 2012 as were 820 and 1361 students respectively. A gender breakdown indicates that female first year students comprise approximately a third of all students enrolled at the colleges of agriculture. Despite the fact that first year enrolments have been increasing year on year between 2009 and 2011, graduation rates has declined from 744 students to 535 students. Forty one per cent of these graduates were female (DAFF, 2013).

55
Table 15: Colleges of agriculture
Province Colleges
KwaZulu-Natal Cedara College, Owen Sithole College
North West Potchefstroom College, Taung College
Western Cape Elsenburg College
Eastern Cape Fort Cox College, Tsolo College, Grootfontein Agricultural Institute
Free State Glen College
Mpumalanga Lowveld College, Marapyane Campus of Lowveld College*
Limpopo Madzivhandila, TompiSeleka
SOURCE: DEPARTMENT OF AGRICULTURE FORESTRY AND FISHERIES, 24 JANUARY 2013
The incorporation of the agricultural colleges into DHET has been agreed. This should enable greater coherence and articulation opportunity. Close collaboration between DHET and DAFF will remain important to ensure curriculum relevance and alignment to sector needs. A Task Team is currently being established by DHET to fully understand the impact of the incorporation of the agricultural colleges as well as the appropriate model for doing so. At present, ten colleges fall under their Provincial Departments of Agriculture and are funded entirely by these departments. Fort Cox College operates under the Provincial Department of Education (although is funded by the Provincial Department of Agriculture) and Grootfontein College falls under the mandate of the National Department of Agriculture and is fully funded by this department. Diverse governance models have impact profoundly on the agricultural college landscape - a landscape that has largely been delinked from the broader higher education system. The result had been a highly differentiated agricultural college system based on the level of priority afforded to these colleges within their respective provincial departments. As such, some colleges are well funded, equipped and resourced whilst others are not. Nationally, financial aid through the National Student Financial Aid Scheme (NSFAS), for example, has not been accessible to students at agricultural colleges. Moreover, the current system does not facilitate articulation between colleges and between colleges of agriculture and universities and this has largely been the result of the disjuncture between colleges of agriculture and the post-school education and training system as well as the curricula bias within these colleges towards addressing agricultural issues within their agri-ecological zones. AgriSETA has finalised a memorandum of agreement for funding with the Agricultural Colleges. The SETA plans to invest R28.3 million over three years on the development and support of these Colleges. This fund will be used for capacity building, curriculum or learning programme development, lecturer training and development, and infrastructure.

56
3.2.2 The role of AgriSETA in skills supply
While long term planning of skilling of new entrants in the sector can be done through close consultation between the sector, agricultural schools and colleges, FET colleges and HET institutions so that they teach relevant skills, there are other avenues for training for those who are already employed in the sector, for example skills programmes and learnerships. There are 15 registered qualifications for the primary agriculture sub sectors. Currently, AgriSETA has 94 registered learnerships that can address the skills needs of the identified scarce skills. AgriSETA has approved / accredited a number of training providers across the country to deliver the theoretical and practical components of these learnerships. These include agricultural colleges, FET colleges, and private providers. Currently, the AgriSETA has 595 registered and approved providers distributed nationally as follows: Table 16: AgriSETA approved training providers
Province Number of providers Percentage of total
Gauteng 182 30%
KwaZulu Natal 65 11%
Limpopo 75 13%
North West 52 9%
Northern Cape 5 1%
Free State 40 7%
Mpumalanga 35 6%
Western Cape 54 9%
Eastern Cape 89 15%
Total 595 100%
AGRISETA WEBSITE, 2013
The providers are small to large organisations. In primary agriculture small providers appear to offer the most training in rural areas and community projects (AgriSETA, 2010). Most of the operating providers will be in FET colleges and agricultural colleges. The AgriSETA is unable to meet the total demands for skills across the duality of their sector. There seems to be fairness in the approval of training for both permanent and casual and seasonal workers.
3.2.3 Training Provider Perspectives
From the interviews conducted it appears that there is adequate provision of agricultural training, particularly at lower NQF levels (NQF Level 1 and 2), although provision at NQF levels 3 and 4 is becoming more available. One particular provider indicated that in the past four to five years, training providers were struggling due to an over supply of providers in the system. There was some criticism of the system of mentorship in the sector especially in terms of providing mentorship monitoring guidelines. Also, one respondent explained that, “a mentor needs to do skills transfer and not do the job for the emergent farmer” and that the mentor should
57
withdraw as soon as the sufficient skills have been transferred (SSP stakeholder interview, 2014). Some providers are providing business skills in addition to agricultural production skills and have expressed the need to provide skills training across the value chain. For example, a provider who provides ornamental horticulture skills training to large nurseries must also provide these trainees with business skills associated with sales, store management and labour relations. In fact, all of the providers interviewed believed in the need to focus on a range of skills as well as higher-level skills, particularly in light of increased mechanization in agriculture. In other words, there needs to be a correlation between the types of skills provided and the needs of the economy. The Farm Together Project was applauded by some respondents for providing skills across the value chain but was also criticised for mentors being too involved in production rather than simply transferring these skills. All interviewees also agreed with the need for a combination of practical and theoretical skills training. The Department of Trade and Industry is funding a 5-year entrepreneurial skills programme (Centres for Entrepreneurship) at two TVET colleges (King Hintsa and Butterworth College) and a number of Universities of Technology. 15 million rand has been made available to the colleges over a 5-year period. The purpose of the programme is to provide top-up entrepreneurial skills to agricultural students that already have a qualification from the college, to final year students and to provide community-based support. In addition to the type of training provided one respondent highlighted the need to further explore e-learning provision of agricultural skills, using mobile phone access. The AgriPedia training programmes is an example of such an initiative that is in its infancy stage and that aims to provide agricultural skills training across Africa. The majority of providers interviewed had existing partnerships with public TVET colleges and universities. This suggests that private providers are becoming aware of the need to partner with public providers and the importance of such collaboration for skills development at large. There was a suggestion for the need to expand union involvement in skills development through increased collaboration with commercial farmers. This was suggested in light of increasing input costs that sought to squeeze skills development spending by commercial farmers. RPL is difficult in the agricultural sector because it is difficult to gather evidence.
3.2.4 Training Conducted
In addressing scarce and critical skills needs in the sector, there are various skills development interventions that the AgriSETA and the employers in the sector undertake. In 2014/15, employers submitting training reports have indicated a total of over 125 300 training interventions being attended by employees. There was a higher proportion of males trained (58%) as compared to females (42%). Majority of those who received training were in elementary occupations (63%) followed by Skilled Agricultural, Forestry, Fishery, Craft and Related Trades Workers (9%) and Plant and Machine Operators and Assemblers (8%). This is almost in line with the occupational breakdown of employees in the sector.

58
Given the seasonality of employment in the sector, employers provide training to the temporary workers they employ so that they are effective and efficient in their roles. The reported training in the sector, 37% was received by temporary employees. Table 17: Employee trained by occupational category and gender
Occupational Group Male Female Total
Managers 4697 1623 6320
Professionals 1707 1023 2730
Technicians and Associate Professionals 3666 2519 6185
Clerical Support Workers 2847 3887 6734
Service and Sales Workers 2014 1202 3216
Skilled Agricultural, Forestry, Fishery, Craft and Related Trades Workers
6452 2947 9399
Plant and Machine Operators and Assemblers 10360 1177 11537
Elementary Occupations 40695 38494 79189
Total 72438 52872 125310
SOURCE: AGRISETA, ATR DATA, 2015
The AgriSETA partners with employers to implement skills development programmes that are professional or vocational, technical, occupational and that result in full or part qualifications. These are implemented in the form of include internships, skills programmes, learnerships and bursaries for further study; and are generally referred to as PIVOTAL learning programmes. Employers submitting WSPs are reporting implementation of over 3400 such interventions in 2014/15. Learnerships were the most preferred skills development intervention, accounting for 44% followed by skills programmes (33%). FIGURE 11:SKILLS DEVELOPMENT INTERVENTIONS
SOURCE: AGRISETA, ATR DATA, 2015
ArtisanDegree/Diplo
maGraduate
PlacementInternship Learnership
Skills Programme
Total 225 296 121 147 1517 1166
0
200
400
600
800
1000
1200
1400
1600
Interventions Implemented

59
3.3 Scarce Skills and Skills Gaps
A number of approaches were combined to identify the scarce and critical skills in the agricultural sector, to project these over the period 2011-2016 and to extrapolate the list of priority skills that form the focal point of skills development interventions for the AgriSETA over this period.
3.3.1 Top 10 Scarce Skills
The top ten scarce skills for the agriculture sector spread across various major occupational groups. Whereas most are in the managerial and professional occupational groups, there are some plant and machine operators that are also featuring. The list represents priority skills and doesn’t imply these are the only skills that are critical for the sector economy. The top ten scarce skills occupations needs to be understood in the context of the organising framework of occupations which provides for an occupation with multiple alternative titles. TABLE 18: TOP 10 SCARCE SKILLS
OCCUPATION CODE OCCUPATION SPECIALISATION/ ALTERNATIVE TITLE
225101 Veterinarian Animal Doctor; Veterinary Epidemiologist; Veterinary Parasitologist; Veterinary Pathologist and Veterinary Surgeon
213202 Agricultural Scientists Agronomists, Plant Breeders, Plant Pathologists, Animal Scientists, Plant Scientist , Soil, and Pasture Scientists
131101 Farm Manager Agronomy, Horticulture, Crop, Livestock Mixed Crop and Livestock, and Ornamental Horticultural Managers
325703 Agricultural Produce Inspectors Meat Inspector, Fruit and Vegetable Inspector, Produce Inspector, and Quality Controller
214905 Agricultural Engineer
Agricultural Product Process Engineer, Irrigation Engineer, Agricultural Structures and Facilities Engineer, and Crop Production Mechanisation Engineer
653301 Industrial Machinery Mechanic Agricultural Machinery Mechanic, Farm Machinery Repairer
734101 Mobile Plant Operators Agrochemical Spraying Operator, Tractor driver, Harvester Operator, and Farm Equipment /Machinery Operator.
134915 Operations Managers Abattoir Manager, Abattoir Veterinarian, Feedmill Manager, Sugar Mill Manager, Pet Food Mill Manager, Seed Processing Plant Manager
841601 Mixed Crop and Livestock Farm Worker
Agronomy, Horticulture, Crop, Livestock Mixed Crop and Livestock skills
122301 Research and Development Manager
Product Development Manager, Research Managers
213201 Agriculture Consultant Agriculture Extension Officer
AgriSETA has a number of programmes including bursaries, internships and learnership programmes to address the scarce skills. Due to limited funds, the AgriSETA cannot on its own meet the anticipated demand in the sector.

60
3.3.2 Skills Gaps Overview
The following table provides an overview of identified priority skills gaps across the sector. SKILLS GAPS
General Low literacy and numeracy levels – both amongst workers within the sector at large and at owner/manager level in many of the small-scale farming.
Farm management skills (and general management skills in other agricultural businesses) coupled with a business orientation and entrepreneurship skills.
A general need to increase compliance with environmental, occupational health and safety, animal welfare, produce safety and hygiene standards, regulations and requirements (local and international standards)
Small –scale Farm Management (Mainly owners / managers)
Farm management and entrepreneurship
Resource management and record keeping
Financial planning and management
Project management
Business plan development
Marketing and processing
Processing and packaging
Transport management
Marketing produce, including branding
Planning for marketing
Knowledge of markets
Technical knowledge and skills
Production management (related to specific enterprise)
Demonstration of production techniques
Natural resources management
Mechanical knowledge
Farm maintenance
Repairs of machinery and equipment
Electrical maintenance and installation
Commercial A critical constraint is the poor educational levels of a large proportion of the labour force in the sector demanding a considerable effort and investment in ABET and other life skills programmes. Need for improved management skills and relevant technological knowledge for increasing productivity levels and improved production methods. Rising importance for environmentally responsible production and processing management systems. Rising competitive and international markets increases need for business and marketing abilities among owners and managers. Increasing requirements for compliance with environmental, health and safety, and international trade standards... Information technology although not a priority, is increasing in importance. Business management ability is becoming increasingly important as more farmers are making decisions about restructuring their businesses,
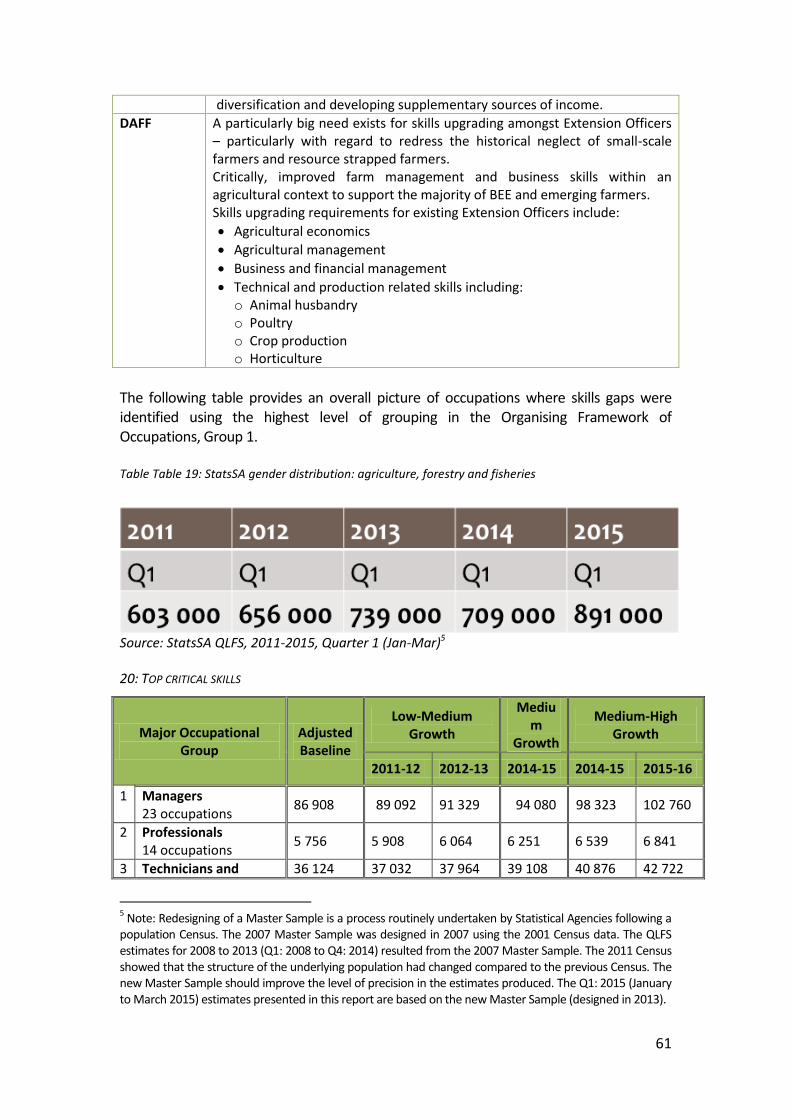
61
diversification and developing supplementary sources of income.
DAFF A particularly big need exists for skills upgrading amongst Extension Officers – particularly with regard to redress the historical neglect of small-scale farmers and resource strapped farmers. Critically, improved farm management and business skills within an agricultural context to support the majority of BEE and emerging farmers. Skills upgrading requirements for existing Extension Officers include:
Agricultural economics
Agricultural management
Business and financial management
Technical and production related skills including: o Animal husbandry o Poultry o Crop production o Horticulture
The following table provides an overall picture of occupations where skills gaps were identified using the highest level of grouping in the Organising Framework of Occupations, Group 1. Table Table 19: StatsSA gender distribution: agriculture, forestry and fisheries
Source: StatsSA QLFS, 2011-2015, Quarter 1 (Jan-Mar)5 20: TOP CRITICAL SKILLS
Major Occupational Group
Adjusted Baseline
Low-Medium Growth
Medium
Growth
Medium-High Growth
2011-12 2012-13 2014-15 2014-15 2015-16
1 Managers 23 occupations
86 908 89 092 91 329 94 080 98 323 102 760
2 Professionals 14 occupations
5 756 5 908 6 064 6 251 6 539 6 841
3 Technicians and 36 124 37 032 37 964 39 108 40 876 42 722
5 Note: Redesigning of a Master Sample is a process routinely undertaken by Statistical Agencies following a
population Census. The 2007 Master Sample was designed in 2007 using the 2001 Census data. The QLFS estimates for 2008 to 2013 (Q1: 2008 to Q4: 2014) resulted from the 2007 Master Sample. The 2011 Census showed that the structure of the underlying population had changed compared to the previous Census. The new Master Sample should improve the level of precision in the estimates produced. The Q1: 2015 (January to March 2015) estimates presented in this report are based on the new Master Sample (designed in 2013).
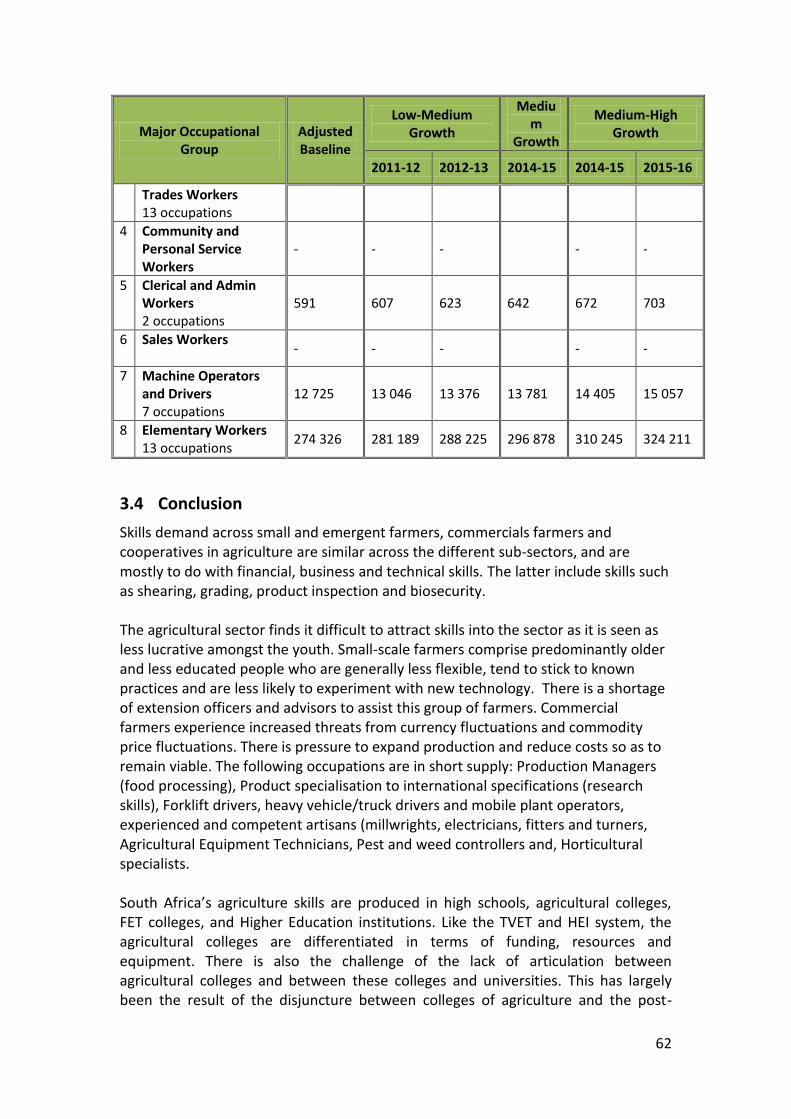
62
Major Occupational Group
Adjusted Baseline
Low-Medium Growth
Medium
Growth
Medium-High Growth
2011-12 2012-13 2014-15 2014-15 2015-16
Trades Workers 13 occupations
4 Community and Personal Service Workers
- - - - -
5 Clerical and Admin Workers 2 occupations
591 607 623 642 672 703
6 Sales Workers
- - - - -
7 Machine Operators and Drivers 7 occupations
12 725 13 046 13 376 13 781 14 405 15 057
8 Elementary Workers 13 occupations
274 326 281 189 288 225 296 878 310 245 324 211
3.4 Conclusion
Skills demand across small and emergent farmers, commercials farmers and cooperatives in agriculture are similar across the different sub-sectors, and are mostly to do with financial, business and technical skills. The latter include skills such as shearing, grading, product inspection and biosecurity. The agricultural sector finds it difficult to attract skills into the sector as it is seen as less lucrative amongst the youth. Small-scale farmers comprise predominantly older and less educated people who are generally less flexible, tend to stick to known practices and are less likely to experiment with new technology. There is a shortage of extension officers and advisors to assist this group of farmers. Commercial farmers experience increased threats from currency fluctuations and commodity price fluctuations. There is pressure to expand production and reduce costs so as to remain viable. The following occupations are in short supply: Production Managers (food processing), Product specialisation to international specifications (research skills), Forklift drivers, heavy vehicle/truck drivers and mobile plant operators, experienced and competent artisans (millwrights, electricians, fitters and turners, Agricultural Equipment Technicians, Pest and weed controllers and, Horticultural specialists. South Africa’s agriculture skills are produced in high schools, agricultural colleges, FET colleges, and Higher Education institutions. Like the TVET and HEI system, the agricultural colleges are differentiated in terms of funding, resources and equipment. There is also the challenge of the lack of articulation between agricultural colleges and between these colleges and universities. This has largely been the result of the disjuncture between colleges of agriculture and the post-

63
school education and training system as well as the curricula bias within these colleges towards addressing agricultural issues within their agri-ecological zones. It is hoped that better integration will be achieved with the incorporation of the agricultural colleges into DHET.
64
Chapter 4: SECTOR PARTNERSHIPS
AgriSETA recognises the importance of partnerships to achieve implementation of the Sector strategy. Over a number of years the SETA has worked with various sector stakeholders to implement skills development projects. Some projects are of a short term nature, but many have developed into medium term collaborations that have organically evolved into more meaningful longer term partnerships. This section is in two parts: the one dealing with existing partnerships, setting out their focus and scope; the second setting out a strategy for the development of new partnerships during the period 2015-2020.
4.1 Current partnerships
4.1.1 Department of Rural Development and Land Reform (DRDLR)
The partnership with DRDLR has two components, land reform and youth. The DRDLR and the AgriSETA partnered in 2010 to identify the beneficiaries of land reform who might be supported to establish viable agri-businesses on their newly acquired land. The NSF was approached and provided R44m. The SETA allocated R20 million. Training has been provided and continues to be provided to Communal Property Associations (CPAs). Training was provided on governance as well as plant and animal production. Mentoring has also been arranged. Funding is in place to 2016. It is the intention of the SETA to apply for more funds. However such an application is not guaranteed and so discussions will be held with DRDLR to discuss how such training to land reform beneficiaries can be sustained in future.
4.1.2 Youth
The National Rural Youth Service Corps (NARYSEC) has as its focus to develop rural youth. In a joint project some 470 young people have been provided access to agricultural training. This is an important project as it aims to motivate and incentivise young people to work on the land and thereby have a stake in their rural communities rather than gravitate to the towns. It is unclear at this stage how successful the project has been. On the basis of a review the DRDLR and the SETA will determine whether to take the project forward in the longer term.
4.1.3 Department of Agriculture, Forestry and Fisheries (DAFF)
The DAFF and AgriSETA have a partnership that is centred around the project Farm Together which supports agricultural cooperative development. The focus of the training is on governance, which means that the DRDLR also supports the project as it expands the number of land reform beneficiaries receiving such training via the NSF project. DAFF and DRDLR have provided the farms and projects, whist the SETA provides and quality assures the training. 456 groups (coops and CPAs) and 2280 individual cooperative members were trained in the year 2012-2013. In addition to this work there is another long term project with DAFF that focuses on the development and training of extension officers. This is funded from ring-fenced skills development funds within DAFF.
65
4.1.4 KZN Department of Agriculture
The Department of Agriculture in KZN and the SETA have partnered in the delivery of skills development to a number of agricultural cooperatives. The focus has been on some of the larger cooperatives. One has 27 workers, others have less. There are 84 workers and members being trained in all. The training is in a learnership – in plant production, animals, horticulture, mixed farming systems, and poultry. The qualifications are mainly level 1 and 2. More recently it has been agreed to start at level 2 and above so as to address scarce skills. The aim is to take people beyond the basic technical skills needed to become effective in farm management. Those targeted (for farm management) will start at level 3 with technical skills, and then engage in level 4 and 5 management programmes. If this project is viewed as successful it could be replicated in other provinces and expanded.
4.1.5 Gert Sibande TVET College
Currently, the AgriSETA provides funding to Gert Sibande TVET College.
4.2 Planned Partnerships
4.2.1 Agricultural and TVET colleges
Whilst there is no formal partnership in place, there has been a strategy developed in the sector and which informs a range of projects that need to be developed into a formal set of partnerships. The strategy is one of building the capabilities of the 12 Agricultural Colleges to deliver occupational qualifications to the sector. These colleges are in the process of being transferred from DAFF to DHET. There are a number of challenges that need to be addressed including funding models for programmes required in the sector, neglected infrastructure and equipment and the difficulty in establishing long term plans during a transitional period. The establishment of a formal partnership requires engagement with both the Departments (DAFF and DHET) and the SETA will initiate these discussions. It also requires engagement with the CEOs of the colleges and their umbrella body the Association of Principals for Agricultural Colleges (APAC). Working with the 12 colleges does not imply a neglect of either TVET colleges or universities but rather an acceptance that there are specialist colleges that have their own working farms and a long tradition of developing farm managers, and that this sector resource must be valued and retained. The SETA will work with universities to provide support to the 12 colleges and with the TVET colleges to identify learners in agricultural programmes who can be drawn into Agricultural college programmes and work experience opportunities. Certain public TVET colleges that have invested in farms and trainers will also be partnered, but there are few (such as the Waterberg College). There are a number of components of the planned partnership with Agricultural colleges, interested universities and selected TVET colleges. These are:

66
Developing a model of career-pathing between TVET and university. This is being
piloted between Waterberg TVET college and the University of Limpopo where 30
learners are being assisted through an articulation and career path programme that
takes them from FET level college programmes to university farm management
programmes. If the pilot is effective it could be the basis of a longer term partnership
and could be replicated in other areas of the country.
There is a similar pilot with the University of Mpumalanga to assist the learners who
were in the agricultural colleges to get into university. The focus is farmer
development programmes - develop a person who can do farming. Traditionally the
Agricultural colleges were playing that role but have lost capacity. The aim is to forge
partnerships that will re-establish the colleges as suppliers of farm and agri-business
managers and technicians.
Another pilot is for RPL with Glen College of Agriculture (Free State). Ten learners are
being put through an RPL process. The SETA has developed tools, identified advisors
and mentors and has done work with the college on qualification. This is currently for
a level 1 plant production programme but could be expanded to other qualifications
and extended to other colleges. The aim is to support agricultural workers to gain
higher level skills by recognising existing skills and experience and enabling them to
access higher level programmes.
Capacity building of lecturers. The SETA supports lecturers to attend university-based
educator programmes - advanced courses, training competence, Masters degrees,
etc. There will also be a need to expand the opportunities for lecturers to include real
work experience in established agri-businesses.
The SETA assists the colleges with learning material, curriculum and the alignment of
programmes to the needs of local agri-businesses. Local needs can vary from goat
farming in parts of the Eastern Cape to Sugar in KZN and fruit growing in the Western
Cape. It is important to develop the capacity of colleges in line with the industry
needs in the locality.
Mentoring and other interventions. In some colleges there is the capacity to provide
mentoring services and colleges can participate if that capacity is in place.
Support to local cooperatives as part of Farm Together. Establishing the colleges to
support cooperative farm managers rather than focusing entirely on lower level
technical skills.
Working with industry bodies to identify agri-businesses and commodity associations
to sit on governance structures. Part of rebuilding Agricultural College capacity will be
to strengthen their boards and governance.
4.2.2 Mentoring partnerships
One of the key strategic interventions of the AgriSETA is to incentivise mentoring of emergent agribusinesses and farms by established businesses in the sector. This has been very successful where it has been put in place. There are a number of companies and institutions that have been effective in the delivery of mentoring and it may be sensible for the SETA to enter into longer term partnerships so as to build sustainable networks of support to emergent farmers.
67
4.2.3 SETA partnerships
The AgriSETA is committed to supporting skills development along value chains. The intention is to ensure that not only is there capacity built in the sector but that the broader rural economy (including non-agricultural industries and services are also strengthened. There is a need for various government programmes to support each other and support local economic development. If skills development support from the AgriSETA is aligned to other interventions a wider and more substantial impact could be achieved. During the next five years AgriSETA will aspire to engage a number of SETAs in areas of common interest such as:
Foodbev: There are a number of secondary agricultural industries that share skills needs with industries located in the food and beverages sector. There are overlaps in relation to produces in the citrus fruit and wine industries and a need to develop a set of skills interventions that recognised the need for a more coordinated approach to beneficiation (i.e. the production of fruit products from fruit).
FPM SETA: The FPM SETA is engaged with Forestry, a responsibility of DAFF. There are common skills needs between Agriculture and Forestry, including the need for effective extension services. The two SETAs need to work together on such services. There are a number of secondary production processes that fall between the two SETAs, including leather, hemp, cotton, and new industries such as the Eastern Cape goats hair initiative. A joint approach is needed to work in these industries, so as to maximise the potential for job creation.
W&R SETA: In working with cooperatives one of the most difficult challenges is access to markets. The logical market is supermarkets located in the Wholesale and Retail sector. There is a trend of established farmers supplying supermarkets directly and forming direct relationships rather than trading through intermediaries. A partnership approach whereby cooperatives contracted to supply produce to a supermarket is provided with training from AgriSETA needs to be explored.
H&W SETA: A serious skills shortage in the sector is animal health. Many qualified Vets are located in towns and equity is a challenge. Veterinary schools are located in the H&W sector. The needs of animals are most keenly understood in the Agri sector. The SETAs need to focus on not only vets, but also animal health technicians and nurses. The partnership could include para-professionals.
4.2.4 Green Industry Partnership
There will be research conducted as part of the revision of the current Sector Skills Plan to identify new industries that need to be supported with skills development. This is in line with the SETA’s commitment to not only support established businesses but to help nurture new ones. Some of the industries might be categorised as Green Industries or industries responding to market changes emanating from the sustainable development policies and strategies being pursued. One possible set of industries involves organic farms. This type pf farming has the potential to expand local produce for local markets and to expand employment beyond traditional farming businesses. AgriSETA will explore possible partnerships to provide support on a sustainable basis to viable Green business initiative that show potential for job creation.

68
4.3 Partnership-related challenges
There are a number of challenges that have been experienced in establishing and or maintaining the current partnerships referred to above. The first relates to levels of bureaucracy internally that can disrupt and hinder project initiation and delivery. A second challenge relates to limited AgriSETA project management staff that puts strain on existing capacity. Finally, adequate funding to ensure project sustainability beyond the life cycle of the project is challenging.
4.4 Conclusion
The AgriSETA is involved in a number of key partnerships linked to skills development for land reform beneficiaries, youth skills development in rural areas and the development of agricultural cooperatives. Key, planned partnerships include increased collaboration and joint initiatives with other SETAs such as FoodBev as part of a coordinated approach to beneficiation across the value chain. There are also pilot projects being initiated in Recognition of Prior Learning (RPL) at Glen College in the Free State and one on articulation between Waterberg TVET College and the University of Limpopo.
69
Chapter 5: Skills Priority Actions
5.1 Introduction
This section sets out the priorities for the sector. These are explained and summarised as outcomes and outputs that will be developed further in programmes set out in the AgriSETA Strategic Plan and Annual Performance Plan.
5.2 Key findings from previous chapters
The agricultural sector is described as a dual sector comprising of large, highly productive, highly mechanised and well resourced commercial farms in the formal sector and the informal sector where the bulk of subsistence farmers are located. Subsistence farmers are poorly resourced, lack the necessary agricultural skills to be productive and do have or have limited access to finance and supply chain networks. These farmers are mostly in rural areas of the country. Agrarian transformation is paramount to the sustainability of the agricultural sector. This includes equitable wages and conditions of employment amongst farm workers, land redistribution, land tenure rights and the skills development of land reform beneficiaries. There is increasing evidence that food security can become a cause for concern. The National Health and Nutrition Survey released in August 2013 indicates that only 45,6% of our population are food secure, 28,3% is at risk of hunger and 26% experienced hunger and were food insecure (HSRC, 2014). Skills development for small-holder and emergent farmers including training in appropriate farming techniques is crucial to enhanced productivity leading to improved food security. The skills development needs in agriculture are different for commercial farmers, small-scale farmers, subsistence farmers and government departments, yet each is important in their own way for producing food and generating employment. A multi-faceted approach to skills development is needed. The quality of education and training in agriculture is varied across the public and private sector. Agricultural colleges are similar to TVET colleges in that they are highly differentiated with respect to funding, resources, equipment and lecturer capacity. There has been an increasing focus on the use of environmentally sustainable farming practices across the agricultural sector. The skills system needs to respond to a new set of knowledge and skills requirements for sustainable farming. Research and development on the role of green industries in the agricultural sector should expand. Capacity development for developing and implementing green technologies is needed as is the upskilling of farm workers in energy-efficient methods, resource sustainability, agro-processing and other green technologies. Rural development, land reform and the development of viable agricultural enterprises and cooperatives require multi-stakeholder collaboration and a variety of skills development and other interventions across government departments. The same is true for skills development across the agricultural product value chain.

70
5.3 Key priority actions
5.3.1 Priority 1: Supporting skills development along the rural supply chain
The dual nature of the South African economy is experienced most acutely in the rural areas of the country. Very often the suppliers of plant, machinery, seeds, fertiliser and other inputs (looking backwards in the supply chain) as well as the packaging, transport, storage, marketing and retail outputs (looking forward in the supply chain) are all located in the lager towns and cities. Efforts have been made to locate such activities in rural and peri-urban areas but economies of scale, infrastructure and other factors, including skills shortages, mitigated against the success of such attempts. The weakness of the rural agricultural supply chain is a critical factor in the failure of the rural economy to respond to successive government interventions and initiatives. From the perspective of the SETA it has become clear that supporting emerging farming enterprises but ignoring the supply chain is an error. Skills development may assist in improving production methods, but if input costs are high and transaction costs involved in getting products to commercial centres are also prohibitive, those enterprises will fail. The SETA will therefore focus skills development not only the needs of rural-based co-operatives and emerging farmers, but also on the supply chains on which these farming activities depend. It is recognised that when attempting to provide skills development services in the supply chain other SETAs will also have key roles to play: for example, in transport, TETA, in equipment supplies and services MERSETA, in storage, packaging and retail W&RSETA. The AgriSETA will therefore forge partnerships and develop common programmes with relevant SETAs to achieve this objective. AgriSETA will not provide programmes located with other SETAs, but funding for agricultural sector workers and new entrants, the communication of programmes and how they can be accessed will be coordinated and efforts will be made to make access to skills development as simple as possible. Few have access to working farms and adequate trainers to teach farming skills.
STRATEGIC OBJECTIVE OUTCOME OUTPUTS
1. Skills development located within the agriculture supply chain contributing to growth in the rural economy
Skills development is contributing to strengthening rural supply chains and the rural economy reflects growth and sustainability.
1.1. Cross SETA and cross-sectoral skills development needs are identified and addressed. 1.2. Learning programmes and support for the under-resourced implemented.
5.3.2 Priority 2: Skills to support equity in the sector
There are two key and related dimensions of equity in the South African context: Enterprise ownership and management (BEE) and Employment Equity (expanded to include class, age and HIV/AIDS with race, gender and disability as reflected in NSDS III).
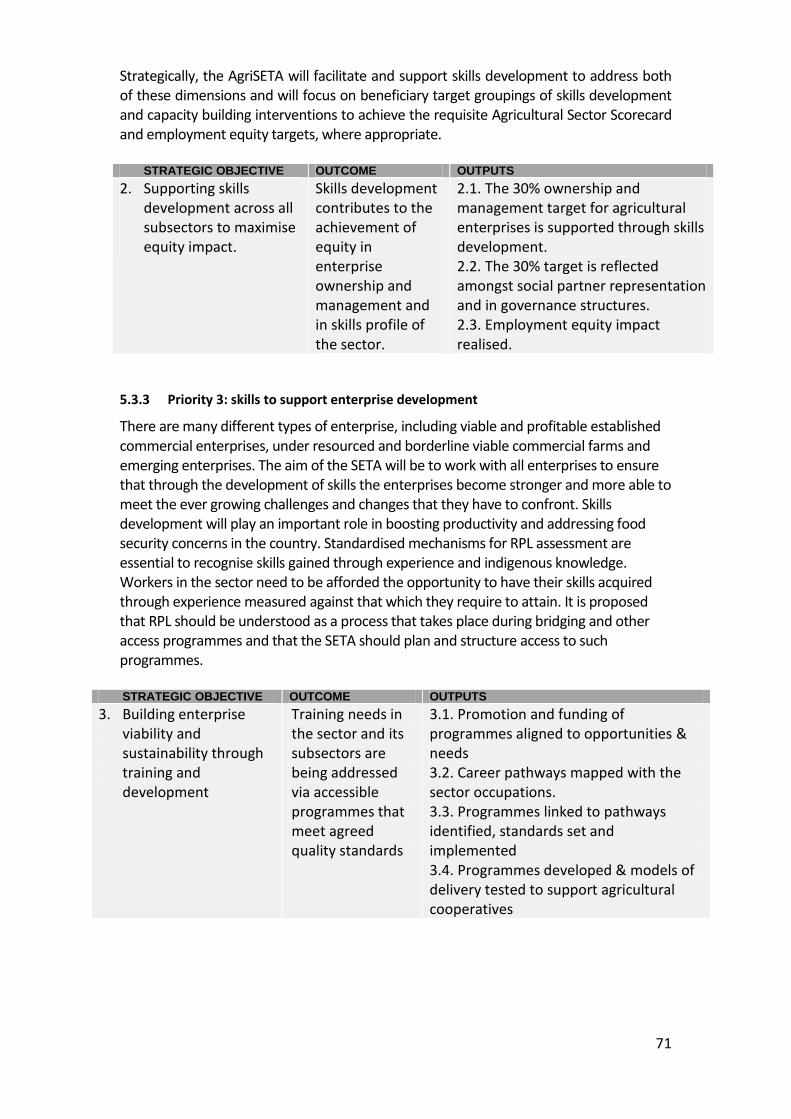
71
Strategically, the AgriSETA will facilitate and support skills development to address both of these dimensions and will focus on beneficiary target groupings of skills development and capacity building interventions to achieve the requisite Agricultural Sector Scorecard and employment equity targets, where appropriate.
STRATEGIC OBJECTIVE OUTCOME OUTPUTS
2. Supporting skills development across all subsectors to maximise equity impact.
Skills development contributes to the achievement of equity in enterprise ownership and management and in skills profile of the sector.
2.1. The 30% ownership and management target for agricultural enterprises is supported through skills development. 2.2. The 30% target is reflected amongst social partner representation and in governance structures. 2.3. Employment equity impact realised.
5.3.3 Priority 3: skills to support enterprise development
There are many different types of enterprise, including viable and profitable established commercial enterprises, under resourced and borderline viable commercial farms and emerging enterprises. The aim of the SETA will be to work with all enterprises to ensure that through the development of skills the enterprises become stronger and more able to meet the ever growing challenges and changes that they have to confront. Skills development will play an important role in boosting productivity and addressing food security concerns in the country. Standardised mechanisms for RPL assessment are essential to recognise skills gained through experience and indigenous knowledge. Workers in the sector need to be afforded the opportunity to have their skills acquired through experience measured against that which they require to attain. It is proposed that RPL should be understood as a process that takes place during bridging and other access programmes and that the SETA should plan and structure access to such programmes. STRATEGIC OBJECTIVE OUTCOME OUTPUTS
3. Building enterprise viability and sustainability through training and development
Training needs in the sector and its subsectors are being addressed via accessible programmes that meet agreed quality standards
3.1. Promotion and funding of programmes aligned to opportunities & needs 3.2. Career pathways mapped with the sector occupations. 3.3. Programmes linked to pathways identified, standards set and implemented 3.4. Programmes developed & models of delivery tested to support agricultural cooperatives

72
5.3.4 Priority 4: Improving the supply of quality education and training to the sector
The AgriSETA has identified the 12 Agricultural colleges and the development of occupational programmes delivered by the colleges as a critical enabler of its skills development strategy. A key need in relation to skills training for the agricultural sector is access to a working farm and the capacity of the lecturers and trainers to teach farming skills. The 12 colleges have that capacity, though not necessarily at an optimum level. The SETA will seek to assist the colleges to increase their capacity to supply needed skills to the sector. The support provided might be in: Curriculum and qualification design; lecturer, teacher or trainer development (a matter of national priority); learning material; student information and support; facilitation of partnerships between public and private providers.
STRATEGIC OBJECTIVE OUTCOME OUTPUTS
4. Building supporting partnerships to facilitate access to learning programmes, enhance the quality of learning programmes and raising the skills base of the sector
Education and training capacity issues are addressed contributing to better access and improved quality.
4.1. Capacity evaluated and programmes in place to address priorities.
5.3.5 Priority 5: skills for sustainability
One of the most difficult challenges for the agricultural sector is the damage being done to the environment and natural resources by primary production processes. An obvious and current challenge is the pollution of crops and water supplies from mining and other industrial activities. Another identified by environmental scientists is the extensive damage being done to natural ecosystems. Soil erosion due to over grazing has also reached crisis proportions in many areas. It is anticipated that there will be a series of crises over the coming years, whether due to over use of limited water supplies and other resources, diseases and damaged immune systems because of experimental changes in production methods, or a failure to heed danger signals in time. At the same time environmental measures are creating new industries and opportunities as well as new technologies, which the sector needs to be aware of and access. As the sector moves from one of seeing the environmental challenges as a risk to one of seeing the opportunities opening up (note the growth in the solar heating panel industry resulting from recent electricity price increased) there will be industries and services that will grow and which will require skills development interventions. AgriSETA will monitor the environmental discourses in the sector, enter research and other partnerships, will conduct awareness workshops and will plan and support the delivery of training where it is needed.
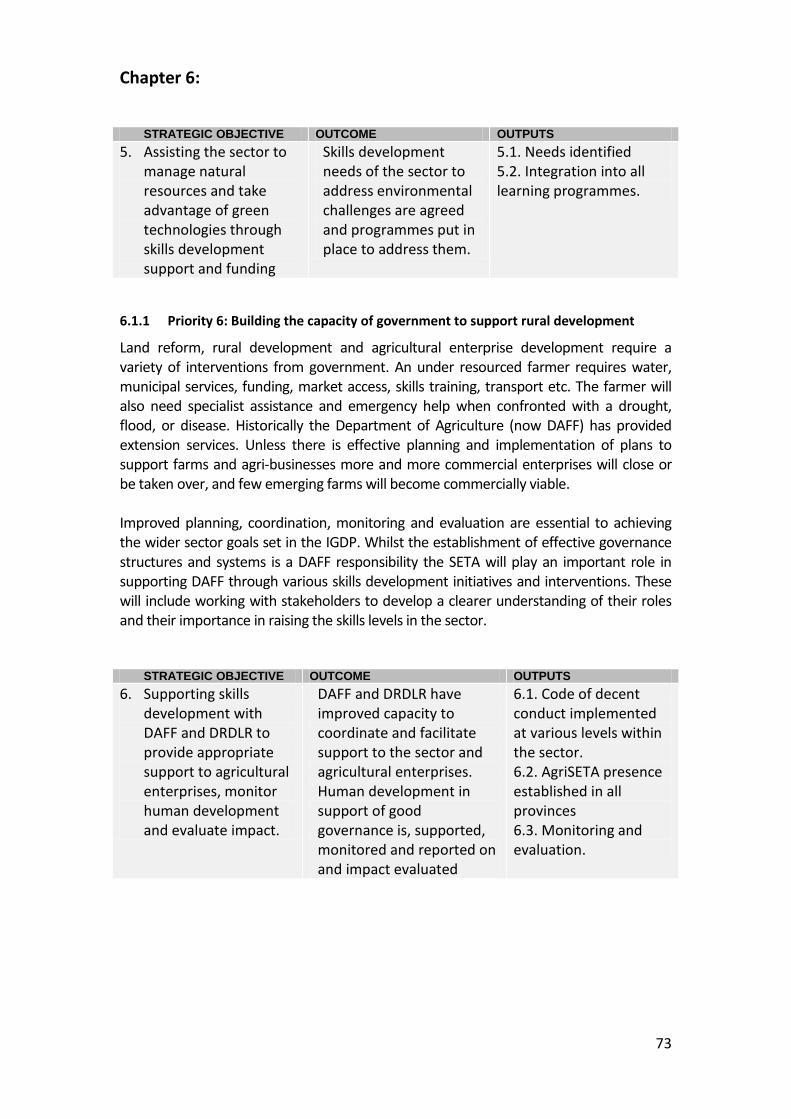
73
Chapter 6:
STRATEGIC OBJECTIVE OUTCOME OUTPUTS
5. Assisting the sector to manage natural resources and take advantage of green technologies through skills development support and funding
Skills development needs of the sector to address environmental challenges are agreed and programmes put in place to address them.
5.1. Needs identified 5.2. Integration into all learning programmes.
6.1.1 Priority 6: Building the capacity of government to support rural development
Land reform, rural development and agricultural enterprise development require a variety of interventions from government. An under resourced farmer requires water, municipal services, funding, market access, skills training, transport etc. The farmer will also need specialist assistance and emergency help when confronted with a drought, flood, or disease. Historically the Department of Agriculture (now DAFF) has provided extension services. Unless there is effective planning and implementation of plans to support farms and agri-businesses more and more commercial enterprises will close or be taken over, and few emerging farms will become commercially viable. Improved planning, coordination, monitoring and evaluation are essential to achieving the wider sector goals set in the IGDP. Whilst the establishment of effective governance structures and systems is a DAFF responsibility the SETA will play an important role in supporting DAFF through various skills development initiatives and interventions. These will include working with stakeholders to develop a clearer understanding of their roles and their importance in raising the skills levels in the sector.
STRATEGIC OBJECTIVE OUTCOME OUTPUTS
6. Supporting skills development with DAFF and DRDLR to provide appropriate support to agricultural enterprises, monitor human development and evaluate impact.
DAFF and DRDLR have improved capacity to coordinate and facilitate support to the sector and agricultural enterprises. Human development in support of good governance is, supported, monitored and reported on and impact evaluated
6.1. Code of decent conduct implemented at various levels within the sector. 6.2. AgriSETA presence established in all provinces 6.3. Monitoring and evaluation.

74
References
AgriSETA SSP interview with CEO of Agriwes-Cape. August 2013. Bhorat, Kanbur and Stanwix. 2013. Estimating the Impact of Minimum Wages on Employment, Wages and Non-Wage Benefits: The Case of Agriculture in South Africa. Cornell University, USA. Bureau for Food and Agricultural Policy (BFAP). 2012. Farm Sectoral Determination: An Analysis of Agricultural Wages in South Africa. Business Monitor International. 2014. South Africa Agribusiness Report Q3 2014. London: Business Monitor International. DAFF. 2014. Abstract of Agricultural Statistics 2014. Pretoria: DAFF. Department of Agriculture Forestry and Fisheries. 2011. Norms and Standards for the Agricultural Training Institutes of South Africa Department of Agriculture Forestry and Fisheries. 2012. Integrated Growth and Development Plan Department of Agriculture Forestry and Fisheries. 2013. Draft Policy on Extension and Advisory Services Department of Agriculture. 2005. National Education and Training Strategy for Agriculture and Rural development in South Africa Department of Economic Development. 2011. The New Growth Path (NGP). Department of Higher Education and Training. 2011. Green Paper on Post-School Education and Training Department of Higher Education and Training. November 2013. Building an expanded, effective and integrated post-school system: A White Paper for Post-School Education and Training. Department of Rural Development and Land Reform. 2012. Mid-Term Review Department of Social Development and the Department of Agriculture, Forestry and Fisheries. August 2013. National Policy on Food and Nutrition Security. Department of Social Development and the Department of Agriculture, Forestry and Fisheries. August 2013. National Policy on Food and Nutrition Security. Department of Trade and Industry. 2013. Industrial Policy Action Plan Fruit South Africa. July 2012. The Sustainability Initiative of South Africa (SIZA), Version 4.
75
GCIS. 2012. South Africa Yearbook 2012/2013. Pretoria: GCIS GCIS. 2013. South Africa Yearbook 2012/2013. Pretoria: GCIS. Hall, R. 15 April 2014. Smoke and Mirrors in Government’s Farm Worker Policy. Available at http://www.plaas.org.za Human Resource Development Council of South Africa. 2010. Human Resource Development Strategy for South Africa Human Sciences Research Council. 2014. The South African National Health and Nutrition Examination Survey 2012 Pienaar, P.L. 2013. Typology of smallholder farming in South Africa’s former homelands: Towards an appropriate classification system. Unpublished MSc Thesis. University of Stellenbosch. South African Ministry of Labour. 2013. Final ECC Farm Worker Report. South African Presidency. 2011. National Development Plan. National Planning Commission. South African Presidency. 2013. State of the Nation Address. South African Presidency. 2014. State of the Nation Address. South African Presidency. 2014. Medium Term Strategic Framework (MTSF). Statistics SA. February 2014. Fact Sheet Issue 2 2014. Statistics South Africa, 2015. Quarterly Labour Force Survey. 1st Quarter 2015. Statistics South Africa. February 2014b. Quarterly Labour Force Survey, Quarter 4, 2013. Statistical release P0211. Pretoria: StatsSA. Statistics South Africa. June 2014a. General Household Survey 2013. Statistical Release P0318. United Nations Environment Programme (UNEP). 2013. Green Economy: Modelling Report of South Africa Wright, A. 2013. Ethics in Agriculture: the necessary foundation of the new farming movement. Available at: http://www.agrowingculture.org