Embed Size (px)
Citation preview
For updated information, please visit www.ibef.org April 2019
AGRICULTURE AND
ALLIED INDUSTRIES
Table of Content
Executive Summary……………….….…….3
Advantage India…………………..….……..4
Market Overview.…………………….……..6
Recent Trends and Strategies …………..17
Growth Drivers…………………….............21
Opportunities…….……….......……………30
Industry Associations……………....……..33
Useful Information……….......…………….35
For updated information, please visit www.ibef.orgAgriculture and Allied
Services3
EXECUTIVE SUMMARY
India is the largest producer of spices, pulses, milk, tea, cashew and jute; and the second largest producer
of wheat, rice, fruits and vegetables, sugarcane, cotton and oilseeds.
India is currently the world’s fourth largest producer of agrochemicals.
India has the largest livestock population of around 512 million.
Global standing
Source: Ministry of Agriculture, Government of India, MOSPI, BCG, Crisil
India is one of the largest manufacturers of farm equipment such as tractors, harvesters and tillers. India
accounts for nearly one-third of the overall tractor production, globally.
Tractor sales in the country are expected to increase 11-13 per cent in FY19, while the tractor industry is
expected grow at 8-10 per cent between FY17-22.
Increasing farm
mechanisation
India has the 10th largest arable land resources in the world. With 20 agri-climatic regions, all 15 major
climates in the world exist in India. The country also possesses 46 of the 60 soil types in the world. Growth
in Gross Value Added (GVA) by agriculture and allied sectors is estimated at 3 per cent in 2017-18**.
Strategic geographic location and proximity to food importing nations favour India in terms of exporting
processed foods.
Favourable conditions
Consumer spending in in India is likely to reach US$ 3.6 trillion by 2020.
Private final consumption expenditure (at constant prices) increased by 6.1** per cent in 2017-18 and 8.6
per cent in April-June quarter of 2018-19.
Rising consumption
expenditure
During 2017-18* crop year, food grain production is estimated at record 284.83 million tonnes. In 2018-19,
Government of India is targeting foodgrain production of 285.2 million tonnes.
Record production of food
grains
Note: *as per 4th advance estimates, ** as per 2nd advance estimates
Global standing
Favourable conditions

Agriculture and Allied Services
ADVANTAGE INDIA
For updated information, please visit www.ibef.orgAgriculture and Allied
Services5
ADVANTAGE INDIA
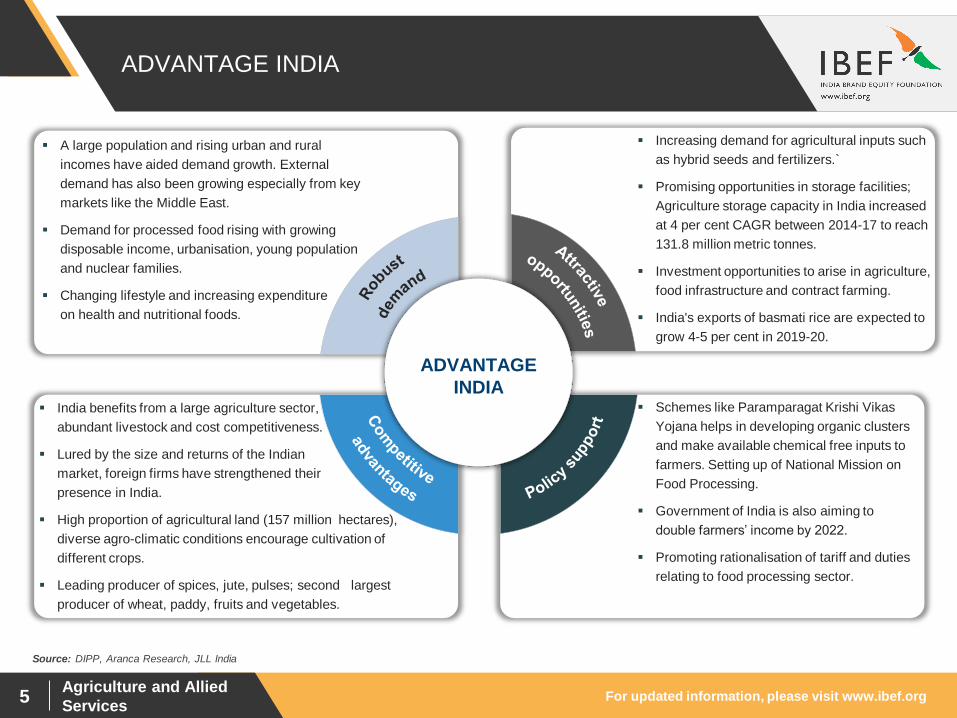
A large population and rising urban and rural
incomes have aided demand growth. External
demand has also been growing especially from key
markets like the Middle East.
Demand for processed food rising with growing
disposable income, urbanisation, young population
and nuclear families.
Changing lifestyle and increasing expenditure
on health and nutritional foods.
Increasing demand for agricultural inputs such
as hybrid seeds and fertilizers.`
Promising opportunities in storage facilities;
Agriculture storage capacity in India increased
at 4 per cent CAGR between 2014-17 to reach
131.8 million metric tonnes.
Investment opportunities to arise in agriculture,
food infrastructure and contract farming.
India's exports of basmati rice are expected to
grow 4-5 per cent in 2019-20.
India benefits from a large agriculture sector,
abundant livestock and cost competitiveness.
Lured by the size and returns of the Indian
market, foreign firms have strengthened their
presence in India.
High proportion of agricultural land (157 million hectares),
diverse agro-climatic conditions encourage cultivation of
different crops.
Leading producer of spices, jute, pulses; second largest
producer of wheat, paddy, fruits and vegetables.
Schemes like Paramparagat Krishi Vikas
Yojana helps in developing organic clusters
and make available chemical free inputs to
farmers. Setting up of National Mission on
Food Processing.
Government of India is also aiming to
double farmers’ income by 2022.
Promoting rationalisation of tariff and duties
relating to food processing sector.
ADVANTAGE
INDIA
Source: DIPP, Aranca Research, JLL India
Agriculture and Allied Services
MARKET OVERVIEW -
AGRICULTURE

For updated information, please visit www.ibef.orgAgriculture and Allied
Services7
GROWTH IN AGRICULTURE
Source: Ministry of Agriculture, Print Release, RBI, Aranca Research, MOSPI, Central Statistics Office (CSO)
Agriculture is the primary source of livelihood for about 58 per cent of
India’s population.
Gross Value Added by agriculture, forestry and fishing is estimated
at Rs 18.53 trillion (US$ 271.00 billion) in FY18**.
Agriculture and allied sector’s GVA at constant 2011-12 prices grew
a CAGR of 3.56 per cent between FY12-18.
As per Union Budget 2019-20, allocation of Rs 140,763.97 crore
(US$ 1.95 trillion) was made for The Agriculture Ministry.
Visakhapatnam port traffic (million tonnes)Gross Value Added by Agriculture and Allied sectors (US$
billion) at Constant 2011-12 prices
CAGR 3.56%
233.0
4
236.5
1
249.6
8
249.2
1
266.4
8
279.7
6
271.0
0
0.00
50.00
100.00
150.00
200.00
250.00
300.00
FY12 FY13 FY14 FY15 FY16 FY17* FY18**
Notes: GDP – Gross Domestic Product, MOSPI – Ministry of Statistics and Programme Implementation, * 1st revised estimates, ** 2nd advance estimates

For updated information, please visit www.ibef.orgAgriculture and Allied
Services8
MAJOR SEASONS: KHARIF AND RABI
Source: Ministry of Agriculture and Farmers’ Welfare
There are two major agricultural seasons in India: Kharif and Rabi.
Kharif season lasts from April to September (summer); rice (paddy) is the season’s main crop.
Rabi season lasts from October to March (winter); wheat is the season’s main crop.
As of October 2018, total area sown with kharif crops in India reached 105.24 million hectares.
38.42
13.5517.54
17.59
5.16
0.7412.24
Rice Pulses Coarse CerealsOilseeds Sugarcane Jute & MestaCotton
Visakhapatnam port traffic (million tonnes)Kharif Area Sown in 2018-192 (million hectares)
29.85
15.63
8.04
4.87
3.34
Wheat Pulses Oilseeds Coarse Cereals Rice
Visakhapatnam port traffic (million tonnes)Rabi Area Sown in 2018-191 (million hectares)
Notes: 1 – As on February 15, 2019, 2 – As on October 10, 2018

For updated information, please visit www.ibef.orgAgriculture and Allied
Services9
INCREASING PRODUCTION
Source: Ministry of Agriculture and Farmers’ Welfare
Since 2010, production as well as yield of both major crops - rice and wheat has increased significantly. As per fourth advance estimates,
production of rice is estimated at record 112.91 million tonnes while production of wheat is estimated at 98.70 million tonnes in 2017-18 crop year.
India ranks second in global production of fruits and vegetables and is a leading exporter of mangoes and bananas.
Production of horticulture crops in India is estimated at record 314.7 million metric tonnes (MMT) in 2018-19**, implying a CAGR of 3.69 per cent
between FY08-19.
India's wheat production may surpass record 99.12 million tonnes (MT) in 2018-19 crop year.
Note: * As per 4th advance estimates, ***as per 1st advance estimates, **as per 3rd advance estimates, 1as of February 28, 2019, 2018-19 as per 2nd advance estimate, *** estimate as
per the Indian Cotton Federation
211.2
214.7
223.1
240.5
257.3
268.8
277.3
280.5
283.4
300.6
306.8
314.7
0.0
50.0
100.0
150.0
200.0
250.0
300.0
350.0
FY
08
FY
09
FY
10
FY
11
FY
12
FY
13
FY
14
FY
15
FY
16
FY
17
FY
18**
FY
19**
*
Visakhapatnam port traffic (million tonnes)India’s Horticulture Production (MMT)
CAGR 3.69%
Crop 2011-12 2017-18* 2018-191
Rice 105.30 112.91 115.60
Wheat 94.88 99.70 99.12
Total Cereals 242.20 259.59 257.35
Total Pulses 17.09 25.23 24.02
Total Foodgrains 259.29 284.83 281.37
Total Oilseeds 297.99 298.82 315.02
Sugarcane 361.04 376.91 380.83
Cotton (million bales of
170 kg each)35.2 34.89 300.87
***
Jute & Metsa (million
bales of 180 kg each)11.40 10.14 10.07
Foodgrains and Commercial Crops Production (million tonnes)
For updated information, please visit www.ibef.orgAgriculture and Allied
Services10
SURGE IN DEMAND OF INDIAN AGRICULTURAL
PRODUCTS…(1/2)
11.3
0
15.6
0
24.7
0
29.2
0
42.8
6
38.7
0
32.0
8
33.8
7
38.2
1
34.3
6
0.00
5.00
10.00
15.00
20.00
25.00
30.00
35.00
40.00
45.00
50.00
FY10 FY11 FY12 FY13 FY14 FY15 FY16 FY17 FY18 FY19*
Source: World Trade Organisation, APEDA, DGCIS
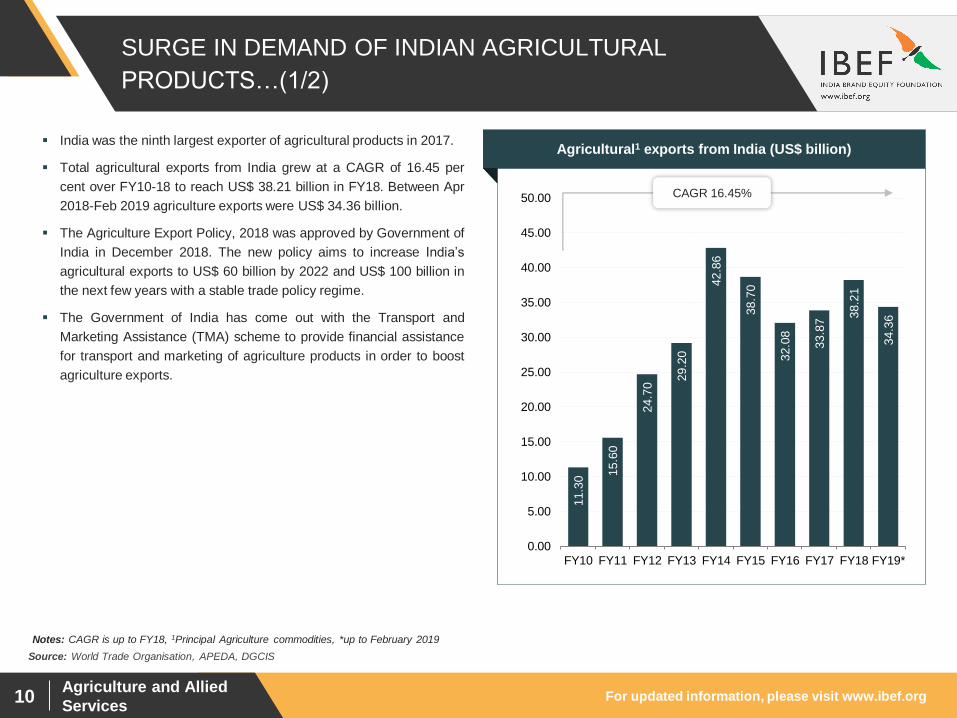
India was the ninth largest exporter of agricultural products in 2017.
Total agricultural exports from India grew at a CAGR of 16.45 per
cent over FY10-18 to reach US$ 38.21 billion in FY18. Between Apr
2018-Feb 2019 agriculture exports were US$ 34.36 billion.
The Agriculture Export Policy, 2018 was approved by Government of
India in December 2018. The new policy aims to increase India’s
agricultural exports to US$ 60 billion by 2022 and US$ 100 billion in
the next few years with a stable trade policy regime.
The Government of India has come out with the Transport and
Marketing Assistance (TMA) scheme to provide financial assistance
for transport and marketing of agriculture products in order to boost
agriculture exports.
Visakhapatnam port traffic (million tonnes)Agricultural1 exports from India (US$ billion)
CAGR 16.45%
Notes: CAGR is up to FY18, 1Principal Agriculture commodities, *up to February 2019
For updated information, please visit www.ibef.orgAgriculture and Allied
Services11
SURGE IN DEMAND OF INDIA AGRICULTURAL
PRODUCTS…(2/2)
7.4
4.2 4.0
3.1
3.6
1.9
1.10.8
6.3
4.1
3.32.9
2.7
1.9
1.3 1.1
0.0
1.0
2.0
3.0
4.0
5.0
6.0
7.0
8.0
FY18 FY19*
Source: Ministry of Agriculture and Farmers’ Welfare, APEDA
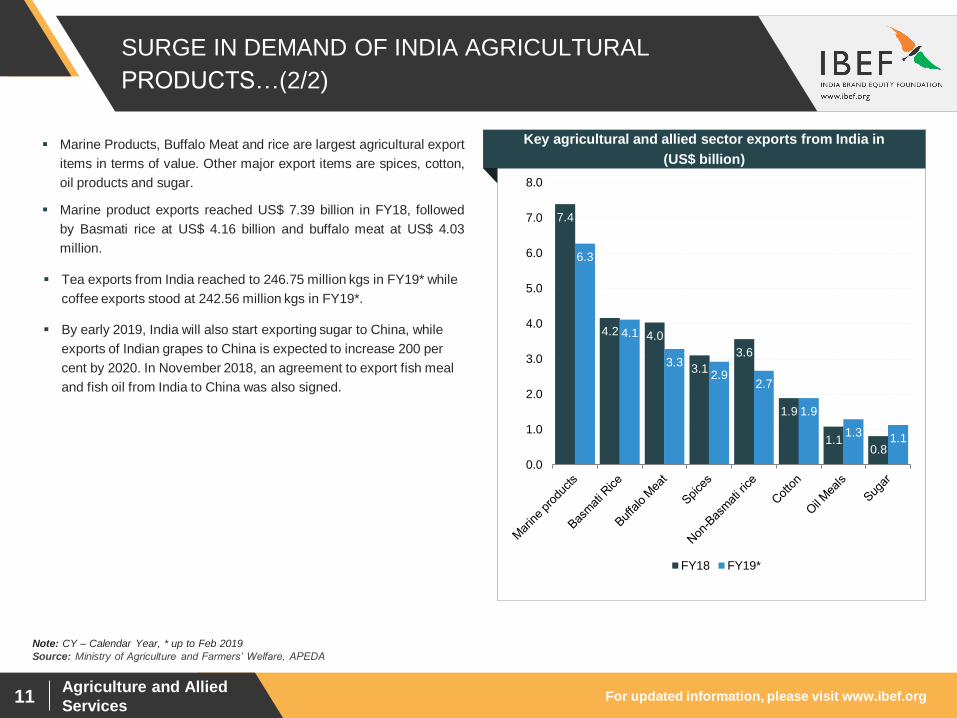
Marine Products, Buffalo Meat and rice are largest agricultural export
items in terms of value. Other major export items are spices, cotton,
oil products and sugar.
Marine product exports reached US$ 7.39 billion in FY18, followed
by Basmati rice at US$ 4.16 billion and buffalo meat at US$ 4.03
million.
Tea exports from India reached to 246.75 million kgs in FY19* while
coffee exports stood at 242.56 million kgs in FY19*.
By early 2019, India will also start exporting sugar to China, while
exports of Indian grapes to China is expected to increase 200 per
cent by 2020. In November 2018, an agreement to export fish meal
and fish oil from India to China was also signed.
Key agricultural and allied sector exports from India in
(US$ billion)
Note: CY – Calendar Year, * up to Feb 2019
Agriculture and Allied Services
MARKET OVERVIEW –
FOOD PROCESSING
For updated information, please visit www.ibef.orgAgriculture and Allied
Services13
FOOD PROCESSING INDUSTRY IN INDIA…(1/2)
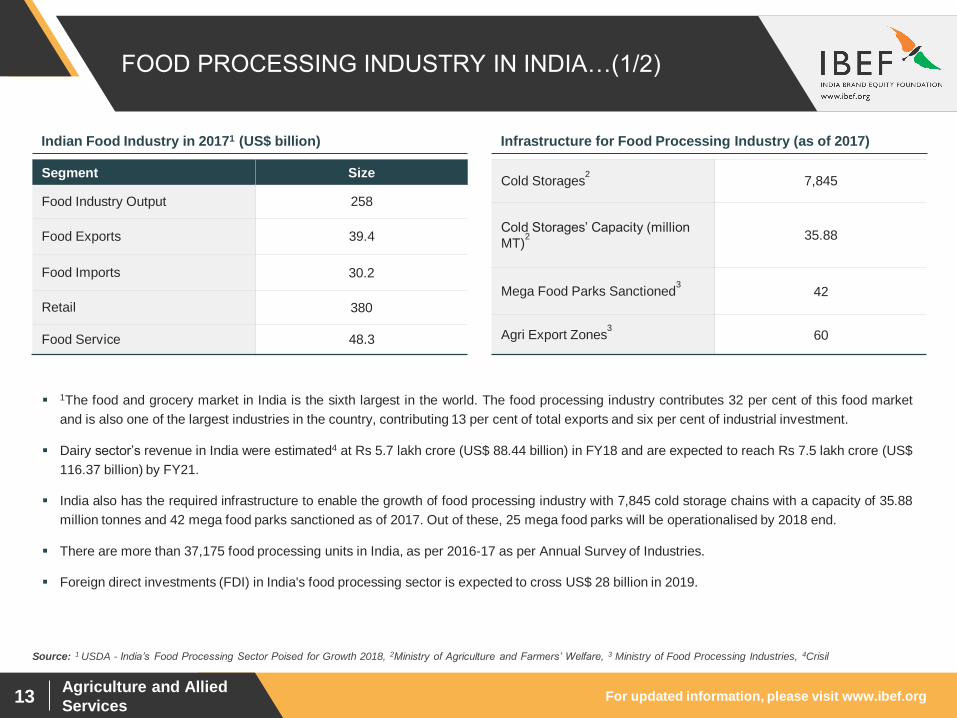
1The food and grocery market in India is the sixth largest in the world. The food processing industry contributes 32 per cent of this food market
and is also one of the largest industries in the country, contributing 13 per cent of total exports and six per cent of industrial investment.
Dairy sector’s revenue in India were estimated4 at Rs 5.7 lakh crore (US$ 88.44 billion) in FY18 and are expected to reach Rs 7.5 lakh crore (US$
116.37 billion) by FY21.
India also has the required infrastructure to enable the growth of food processing industry with 7,845 cold storage chains with a capacity of 35.88
million tonnes and 42 mega food parks sanctioned as of 2017. Out of these, 25 mega food parks will be operationalised by 2018 end.
There are more than 37,175 food processing units in India, as per 2016-17 as per Annual Survey of Industries.
Foreign direct investments (FDI) in India's food processing sector is expected to cross US$ 28 billion in 2019.
Segment Size
Food Industry Output 258
Food Exports 39.4
Food Imports 30.2
Retail 380
Food Service 48.3
Indian Food Industry in 20171 (US$ billion)
Cold Storages2
7,845
Cold Storages’ Capacity (million
MT)2 35.88
Mega Food Parks Sanctioned3
42
Agri Export Zones3
60
Infrastructure for Food Processing Industry (as of 2017)
Source: 1 USDA - India’s Food Processing Sector Poised for Growth 2018, 2Ministry of Agriculture and Farmers’ Welfare, 3 Ministry of Food Processing Industries, 4Crisil
For updated information, please visit www.ibef.orgAgriculture and Allied
Services14
FOOD PROCESSING INDUSTRY IN INDIA…(2/2)
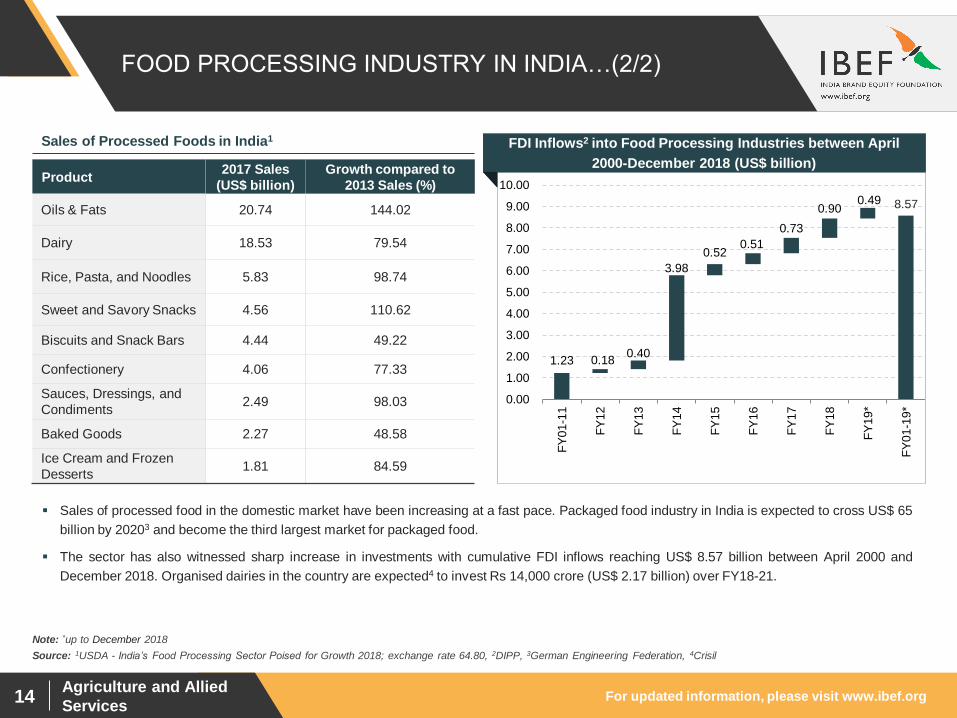
Product2017 Sales
(US$ billion)
Growth compared to
2013 Sales (%)
Oils & Fats 20.74 144.02
Dairy 18.53 79.54
Rice, Pasta, and Noodles 5.83 98.74
Sweet and Savory Snacks 4.56 110.62
Biscuits and Snack Bars 4.44 49.22
Confectionery 4.06 77.33
Sauces, Dressings, and
Condiments2.49 98.03
Baked Goods 2.27 48.58
Ice Cream and Frozen
Desserts1.81 84.59
Sales of Processed Foods in India1
Source: 1USDA - India’s Food Processing Sector Poised for Growth 2018; exchange rate 64.80, 2DIPP, 3German Engineering Federation, 4Crisil
Sales of processed food in the domestic market have been increasing at a fast pace. Packaged food industry in India is expected to cross US$ 65
billion by 20203 and become the third largest market for packaged food.
The sector has also witnessed sharp increase in investments with cumulative FDI inflows reaching US$ 8.57 billion between April 2000 and
December 2018. Organised dairies in the country are expected4 to invest Rs 14,000 crore (US$ 2.17 billion) over FY18-21.
Note: *up to December 2018
Visakhapatnam port traffic (million tonnes)FDI Inflows2 into Food Processing Industries between April
2000-December 2018 (US$ billion)
1.23 0.180.40
3.98
0.520.51
0.73
0.900.49 8.57
0.00
1.00
2.00
3.00
4.00
5.00
6.00
7.00
8.00
9.00
10.00
FY
01-1
1
FY
12
FY
13
FY
14
FY
15
FY
16
FY
17
FY
18
FY
19*
FY
01-1
9*
For updated information, please visit www.ibef.orgAgriculture and Allied
Services15
EXPORTS OF PROCESSED FOOD AND RELATED
PRODUCTS
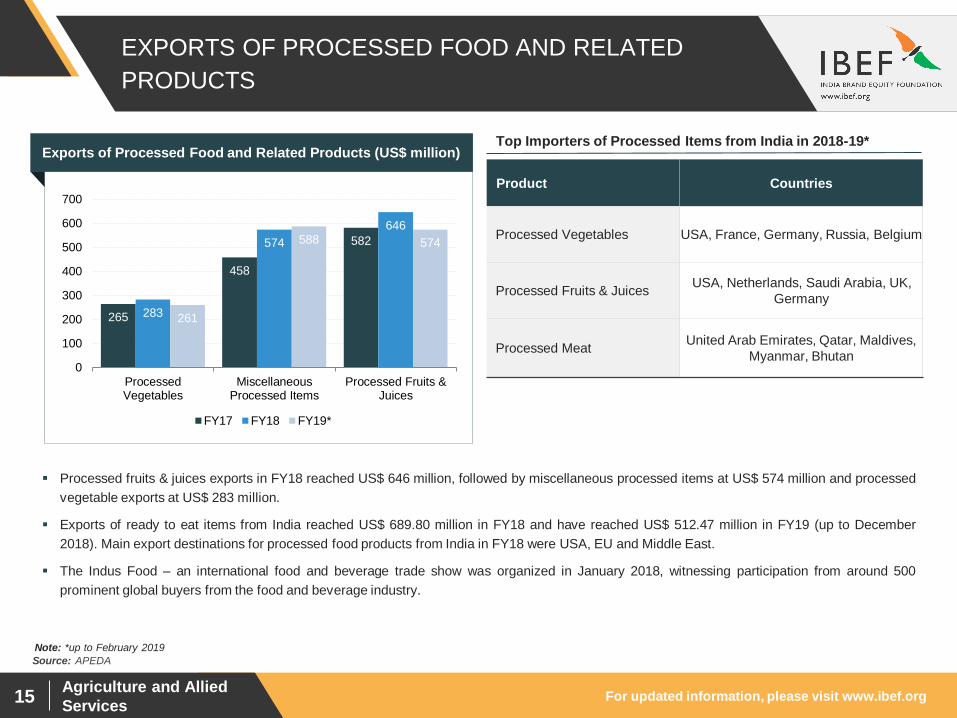
Processed fruits & juices exports in FY18 reached US$ 646 million, followed by miscellaneous processed items at US$ 574 million and processed
vegetable exports at US$ 283 million.
Exports of ready to eat items from India reached US$ 689.80 million in FY18 and have reached US$ 512.47 million in FY19 (up to December
2018). Main export destinations for processed food products from India in FY18 were USA, EU and Middle East.
The Indus Food – an international food and beverage trade show was organized in January 2018, witnessing participation from around 500
prominent global buyers from the food and beverage industry.
Source: APEDA
Exports of Processed Food and Related Products (US$ million)
265
458
582
283
574
646
261
588 574
0
100
200
300
400
500
600
700
ProcessedVegetables
MiscellaneousProcessed Items
Processed Fruits &Juices
FY17 FY18 FY19*
Product Countries
Processed Vegetables USA, France, Germany, Russia, Belgium
Processed Fruits & JuicesUSA, Netherlands, Saudi Arabia, UK,
Germany
Processed MeatUnited Arab Emirates, Qatar, Maldives,
Myanmar, Bhutan
Top Importers of Processed Items from India in 2018-19*
Note: *up to February 2019
For updated information, please visit www.ibef.orgAgriculture and Allied
Services16
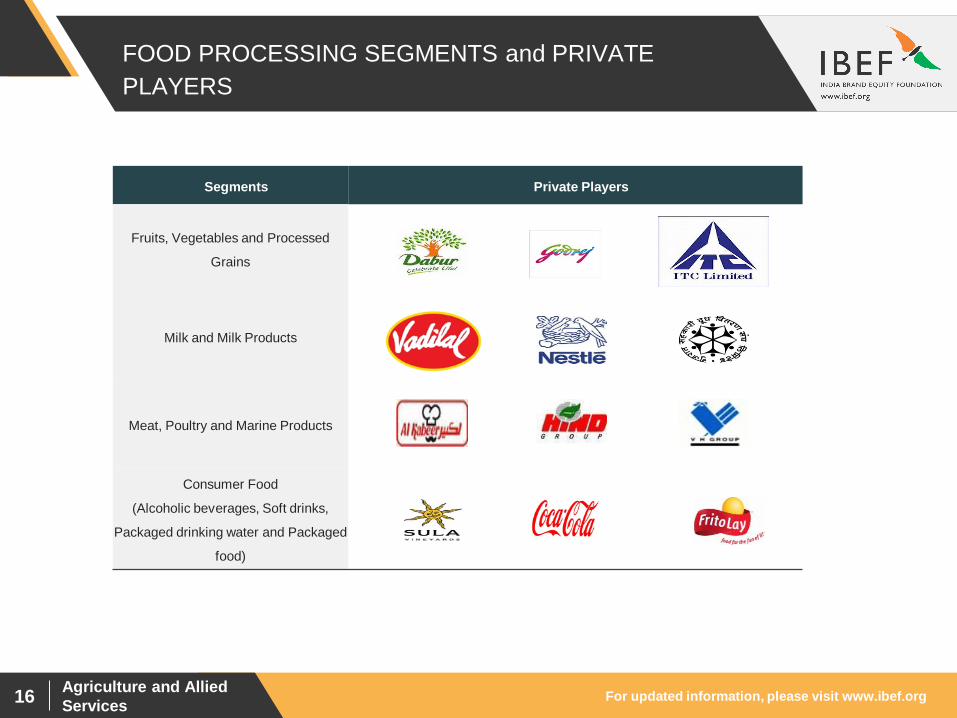
FOOD PROCESSING SEGMENTS and PRIVATE
PLAYERS
Segments Private Players
Fruits, Vegetables and Processed
Grains
Milk and Milk Products
Meat, Poultry and Marine Products
Consumer Food
(Alcoholic beverages, Soft drinks,
Packaged drinking water and Packaged
food)
Agriculture and Allied Services
RECENT TRENDS
AND STRATEGIES

For updated information, please visit www.ibef.orgAgriculture and Allied
Services18
Food processing companies are serving health and wellness as a new ingredient in processed food, given
that health conscious consumers prefer food products with lower carbohydrate content and with low
cholesterol edible oils. e.g. zero-per cent trans fat snacks and biscuits, slim milk, whole wheat products, etc.
ITC is planning to launch multigrain Bingo to increase its share in healthy snacks market.
Emphasis on Healthier
Ingredients
NOTABLE TRENDS…(1/2)
Wide array of products, coupled with increasing global connectivity, has led to a change in the tastes and
preference of domestic consumers
This trend has been bolstered by rising incomes, increasing urbanisation, a young population and the
emergence of nuclear families. Consumer preference is moving towards healthier snacks.
Changing consumer tastes
Source: Ministry of Agriculture and Farmers’ Welfare, Government of India, News Sources
Strategic geographic location and continuous increase in raw material production help India to supply
cheaper products to other countries
Companies like Haldiram’s and Bikanerwala have a presence in over 70 countries, whereby they provide
Indian snacks.
Rising demand on Indian
products in international
market
Liberalisation and growth of organised retail have made the Indian market more attractive for global players
With a large agriculture sector, abundant livestock, cost competitiveness, India is fast emerging as a
sourcing hub of processed food. Danone, Nestle, Kraft Foods, Mondelez International, Heinz are the
international players in food processing market in India
Italian confectionery manufacturer Ferrero will invest Rs 2,000 crore (US$ 310.3 million) by 2021 to make
India a hub for developing new products.
Hindustan Coca-Cola Beverages is establishing two greenfield plants at Ahmedabad and Nellore, with an
investment worth US$ 148.74 million
Expansion of international
companies
For updated information, please visit www.ibef.orgAgriculture and Allied
Services19
In FY18, Ministry of Food Processing Industries granted fund of Rs 268.8 crore (US$ 41.7 million) for the
ongoing Mega Food Parks scheme.
Heritage Foods, a Hyderabad-based company, has plans to add five more milk processing units in the next
five years for an investment of US$ 22.31 million, being a part of the former expansion plan to achieve US$
1 billion turnover by 2022.
In the first half of 2018, venture capital investments in startups working in agriculture and allied areas
reached US$ 32 million.
Contract farming has been operational in India for a long time now; however, the experience of the private
sector players involved therein has been a mixed bag of successes and failures
Largely, it has helped both the processing companies, via increasing sales and therefore augmenting their
incomes, as well as providing access to better technology and fetching better prices by securing an assured
market for Indian farmers.
NOTABLE TRENDS…(2/2)
There is a surge in demand for fruits and vegetables as a result of a shift in consumption. Accordingly,
Indian farmers are also shifting production towards horticulture crops to cash in on the growing demand
As of February 2019, fresh fruit exports from India reached US$ 593.9 million while fresh vegetable exports
reached US$ 688.8 million.
Coca Cola is aiming to improve its sourcing of fruits for aerated drinks and juice beverages categories. As of
May 2017, the company sources 200,000 tonnes fruits, and is planning to further increase it by sourcing
through its 'fruit circular economy' initiative.
Higher Consumption of
Horticulture Crops
Source: Ministry of Agriculture and Farmers’ Welfare, Government of India
Strengthening Procurement
via Direct Farmer-Firm
Linkages
Product Innovation as the
Key to Expansion
For updated information, please visit www.ibef.orgAgriculture and Allied
Services20
Low-cost price strategy is adopted so as to make the product affordable to the consumers by guaranteeing
them value for money. The main aim is to provide quality products to the consumers at minimum cost, e.g.,
Amul Milk. Parle and Sunfeast works on their pricing and costs so as to make the products available at
economical prices.
In 2017, agriculture sector in India witnessed 18 M&A deals worth US$ 251 million.
Crop protection, soil enhancement, increased productivity are the major segments for the industry.
Rallis acquired a research-led seeds company ‘Metahelix’ and launched a PGN product in the name of
‘Ralligold’.
Companies have been moving up the value chain; for example, cooperatives are transitioning from being
pure producers of milk to offering a wide range of dairy products.
Both domestic and global firms have been focusing on product innovation to cater to domestic tastes, while
also introducing international flavours; for example Ruchi Soya is innovating by entering into the ready-to-
cook segment to meet the needs of people with significant time constraint to provide a rich source of protein
in the breakfast category
STRATEGIES ADOPTED
Rising business and
product innovation
Source: Ministry of Agriculture and Farmers’ Welfare, Government of India
Mergers and Acquisitions
Low - cost price strategy
Research
Agriculture and Allied Services
GROWTH DRIVERS
For updated information, please visit www.ibef.orgAgriculture and Allied
Services22
GROWTH DRIVERS OF INDIAN AGRICULTURE
Source: Note: MSP - Minimum Support Price
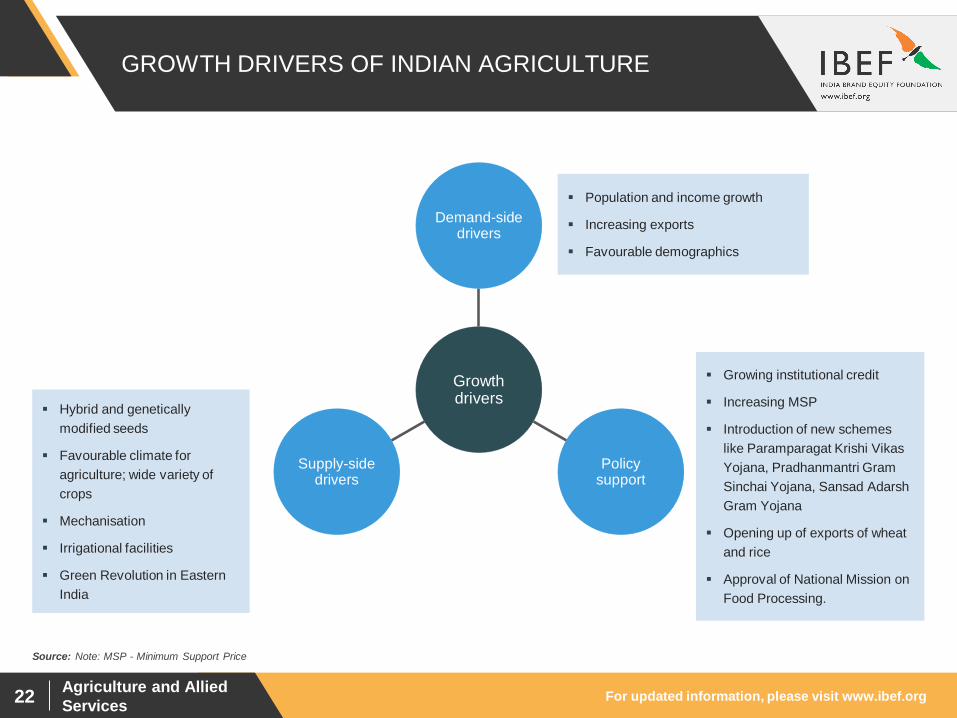
Growth drivers
Demand-side drivers
Policy support
Supply-side drivers
Hybrid and genetically
modified seeds
Favourable climate for
agriculture; wide variety of
crops
Mechanisation
Irrigational facilities
Green Revolution in Eastern
India
Growing institutional credit
Increasing MSP
Introduction of new schemes
like Paramparagat Krishi Vikas
Yojana, Pradhanmantri Gram
Sinchai Yojana, Sansad Adarsh
Gram Yojana
Opening up of exports of wheat
and rice
Approval of National Mission on
Food Processing.
Population and income growth
Increasing exports
Favourable demographics
For updated information, please visit www.ibef.orgAgriculture and Allied
Services23
GROWING AREA UNDER IRRIGATION
54.7
15
56.4
89
58.5
5
59.5
12
60.4
15
58.1
22
61.0
65
61.6
12
61.6
32
68.4
0
10
20
30
40
50
60
70
80
FY05 FY06 FY07 FY08 FY09 FY10 FY11 FY12 FY13 FY18*
Source: Food and Agricultural Organisation US, Ministry of Agriculture, *Ministry of Agriculture and Farmers’ Welfare Annual Report 2017-18
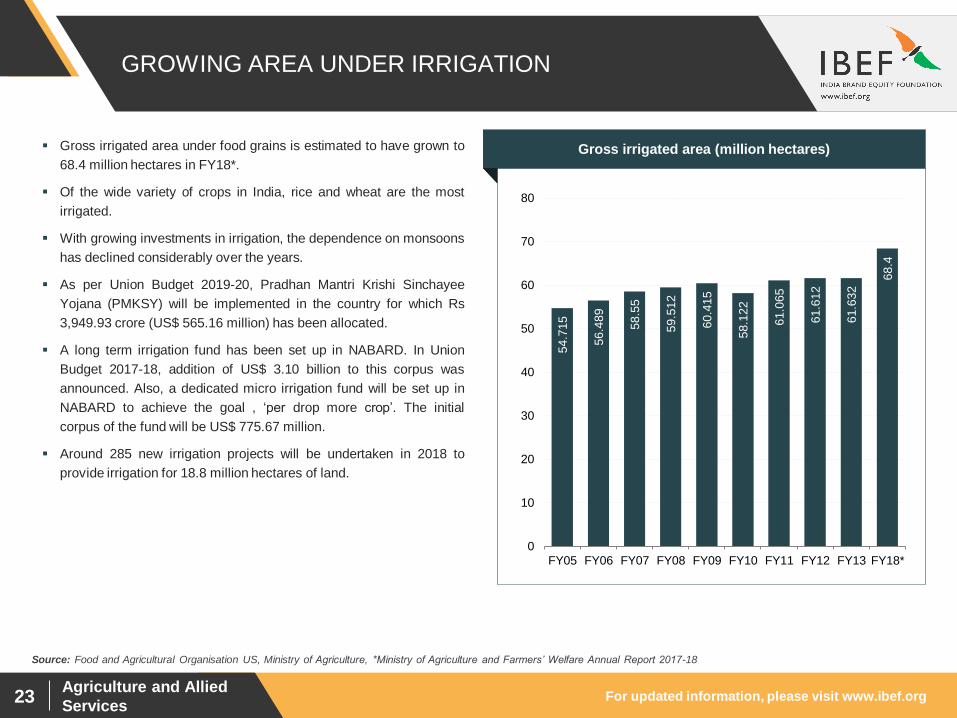
Gross irrigated area under food grains is estimated to have grown to
68.4 million hectares in FY18*.
Of the wide variety of crops in India, rice and wheat are the most
irrigated.
With growing investments in irrigation, the dependence on monsoons
has declined considerably over the years.
As per Union Budget 2019-20, Pradhan Mantri Krishi Sinchayee
Yojana (PMKSY) will be implemented in the country for which Rs
3,949.93 crore (US$ 565.16 million) has been allocated.
A long term irrigation fund has been set up in NABARD. In Union
Budget 2017-18, addition of US$ 3.10 billion to this corpus was
announced. Also, a dedicated micro irrigation fund will be set up in
NABARD to achieve the goal , ‘per drop more crop’. The initial
corpus of the fund will be US$ 775.67 million.
Around 285 new irrigation projects will be undertaken in 2018 to
provide irrigation for 18.8 million hectares of land.
Visakhapatnam port traffic (million tonnes)Gross irrigated area (million hectares)

For updated information, please visit www.ibef.orgAgriculture and Allied
Services24
INSTITUTIONAL CREDIT AND INVESTMENTS ON A
RISE
Source: Ministry of Agriculture and Farmers’ Welfare, RBI, VCCEdge’s Food and Agri Report 2018, AgFunder
Agricultural credit disbursal target of Rs 10 trillion (155.16 billion) was met for 2017-18.
The target for 2018-19 has been set at Rs 11 trillion (170.67 billion). As of June* 2018, credit of Rs 10.35 trillion (US$ 154 billion) was deployed to
agriculture and allied activities in India.
Agrifood start-ups in India received funding of US$ 1,66 billion between 2013-17 in 558 deals. In December 2018, Ninjacart received funding of
US$ 35 million, making it the biggest investment round in India’s agritech sector.
Visakhapatnam port traffic (million tonnes)Investment Deals in Agriculture and Food Sector of India (US$
million)
Note: **as of June 22, 2018, *up to October 2018
Visakhapatnam port traffic (million tonnes)Credit to Agriculture & Allied Activities (outstanding) (US$
billion)
85 92
103
119
137
154 160
154
-
20
40
60
80
100
120
140
160
180
FY12 FY13 FY14 FY15 FY16 FY17 FY18 FY19**
488
Food-tech
881 147
Packaged Foods
582
19
Beverages & Breweries
81 12
Others
1,200

For updated information, please visit www.ibef.orgAgriculture and Allied
Services25
RISING INCOME AND GROWING MIDDLE CLASS TO
DRIVE DEMAND FOR PROCESSED FOOD
Strong growth in per-capita income has resulted in greater demand
for food items
Per capita GDP of India is expected to reach US$ 3,274 in 2023 from
US$ 2,135 in 2018.
Packaged food industry in India is expected to cross US$ 65 billion
by 2020 and become the third largest market for packaged food.
Ministry of Food Processing has been allocated Rs 1,400 crore (US$
216.25 million) in Union Budget 2018-19.
There has also been a shift in demand:
• From carbohydrates to meat products (in line with the various
phases of economic growth); &
• To convenience foods, and organic and diet foods
1,4
82
1,4
86
1,6
10
1,6
39
1,7
49
1,9
83
2,1
35
2,3
34
2,5
39
2,7
62
3,0
07 3,2
74
0
500
1,000
1,500
2,000
2,500
3,000
3,500
2012
2013
2014
2015
2016
2017
2018
2019
2020
2021
2022
2023
Visakhapatnam port traffic (million tonnes)GDP Per Capita at Current Prices* (US$)
Source: International Monetary Fund, World Economic Outlook Database, April 2018, Euromonitor
Notes: * estimates after 2013

For updated information, please visit www.ibef.orgAgriculture and Allied
Services26
COMPETITIVE ADVANTAGE
India’s comparative advantage lies in its favourable climate, large
agriculture sector and livestock base, long coastline and inland water
resources.
India also has an edge in cost of production compared to its
competitors in Asia and the developed world.
ProductProduction in 2017-18 (million
tonnes)
Milk 176.3
Pulses 24.51
Meat 7.7
Banana 29.29
Mango 20.52
Tea (million kgs) 1,325.05
Rice 111.52
Sugarcane 355.01
Wheat 98.61
Source: Ministry of Agriculture and Farmers’ Welfare, Tea Board, Department of Animal Husbandry, Dairying & Fisheries
Units Global Rank
Arable land
(million hectares)161 2
Area under irrigation
(million hectares)55 1
Coast line
('000 kilometers)7.5 7
Cattle (million) 3.1 1
Arable land
(million hectares)161 2
Area under irrigation
(million hectares)55 1

For updated information, please visit www.ibef.orgAgriculture and Allied
Services27
FAVOURABLE POLICIES ARE SUPPORTING THE
SECTOR GROWTH … (1/2)
Prime Minister of India, launched the Pradhan Mantri Kisan Samman Nidhi Yojana (PM-Kisan) and
transferred Rs 2,021 crore (US$ 284.48 million) to the bank accounts of more than 10 million beneficiaries
on February 24, 2019.
Pradhan Mantri Kisan
Samman Nidhi Yojana (PM-
Kisan)
Source: Ministry of Agriculture and Farmers’ Welfare, Union Budget, Aranca Research
In May 2018, Government of India finalised the Model Contract Act, to include all services in the agriculture
value chain under its ambit along with contract farming activity. The act has laid special emphasis on
protecting farmers’ rights in the country.
Model Contract Farming &
Services Act 2018
The scheme ensures access to the means of irrigation to all agricultural farms in the country to produce
‘per drop more crop’, thus bringing much desired rural prosperity
To increase agricultural production and productivity by increasing availability of water and its efficient use.
Pradhan Mantri Krishi
Sinchai Yojana (PMKSY)
In September 2018, the Government of India announced Rs 15,053 crore (US$ 2.25 billion) procurement
policy, under which states can decide the compensation scheme and can also partner with private agencies
to ensure fair prices for farmers in the country.
Pradhan Mantri Annadata
Aay SanraksHan Abhiyan'
(PM-AASHA)
New export policy cleared by Government of India in December 2018.
Targets increasing India’s agricultural exports to over US$ 60 billion by 2022.
Agriculture Export Policy,
2018
For updated information, please visit www.ibef.orgAgriculture and Allied
Services28
FAVOURABLE POLICIES ARE SUPPORTING THE
SECTOR GROWTH … (2/2)
Source: Ministry of Agriculture and Farmers’ Welfare, Union Budget, Aranca Research
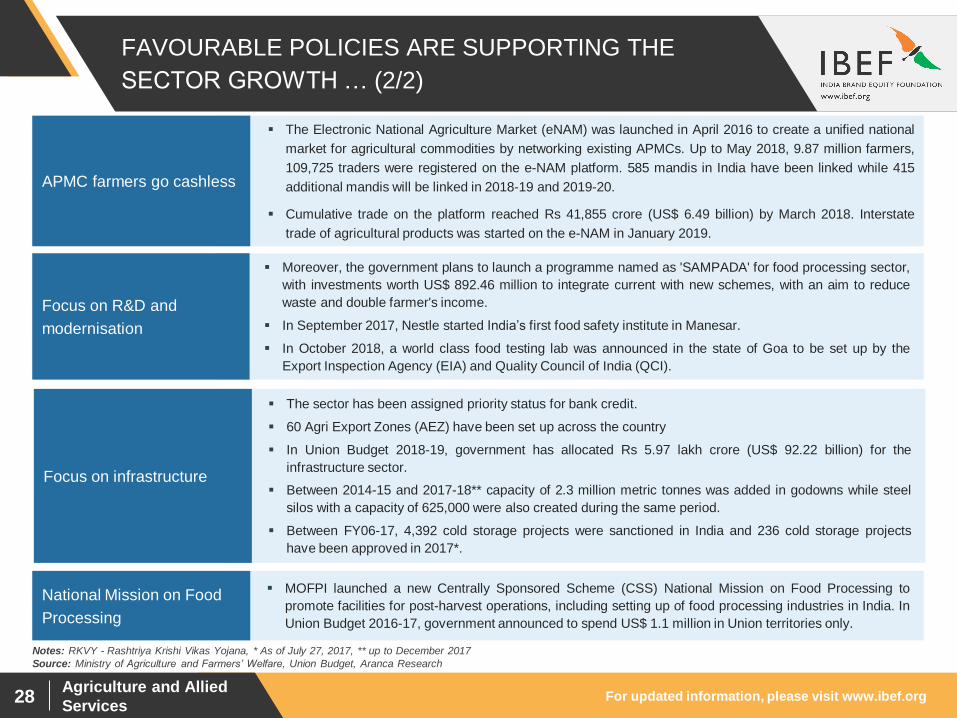
MOFPI launched a new Centrally Sponsored Scheme (CSS) National Mission on Food Processing to
promote facilities for post-harvest operations, including setting up of food processing industries in India. In
Union Budget 2016-17, government announced to spend US$ 1.1 million in Union territories only.
National Mission on Food
Processing
Notes: RKVY - Rashtriya Krishi Vikas Yojana, * As of July 27, 2017, ** up to December 2017
The sector has been assigned priority status for bank credit.
60 Agri Export Zones (AEZ) have been set up across the country
In Union Budget 2018-19, government has allocated Rs 5.97 lakh crore (US$ 92.22 billion) for the
infrastructure sector.
Between 2014-15 and 2017-18** capacity of 2.3 million metric tonnes was added in godowns while steel
silos with a capacity of 625,000 were also created during the same period.
Between FY06-17, 4,392 cold storage projects were sanctioned in India and 236 cold storage projects
have been approved in 2017*.
Focus on infrastructure
Moreover, the government plans to launch a programme named as 'SAMPADA' for food processing sector,
with investments worth US$ 892.46 million to integrate current with new schemes, with an aim to reduce
waste and double farmer's income.
In September 2017, Nestle started India’s first food safety institute in Manesar.
In October 2018, a world class food testing lab was announced in the state of Goa to be set up by the
Export Inspection Agency (EIA) and Quality Council of India (QCI).
Focus on R&D and
modernisation
The Electronic National Agriculture Market (eNAM) was launched in April 2016 to create a unified national
market for agricultural commodities by networking existing APMCs. Up to May 2018, 9.87 million farmers,
109,725 traders were registered on the e-NAM platform. 585 mandis in India have been linked while 415
additional mandis will be linked in 2018-19 and 2019-20.
Cumulative trade on the platform reached Rs 41,855 crore (US$ 6.49 billion) by March 2018. Interstate
trade of agricultural products was started on the e-NAM in January 2019.
APMC farmers go cashless

For updated information, please visit www.ibef.orgAgriculture and Allied
Services29
HIGHLIGHTS OF UNION BUDGET 2019-20
Source: Union Budget 2018
Under Agricultural Marketing Infrastructure (AMI) scheme 40 lakh MT of storage capacity & 400 other marketing Infrastructure projects are
targeted by 2019-20.
In the 2019-20 budget Government of India allocated Rs 8078.76 (US$ 1.12 billion) to Department of Agricultural Research and Education.
India is the second largest fish producing nation in the world accounting for 6.3 per cent of global production, to support this sector Government of
India increase allocation to the Rashtriya Gokul mission to Rs 750 crore (US$ 103.95) in the current year.
Rs 1.41 billion (US$ 19.54 million) allocated for Ministry of Agriculture and Farmers' Welfare.
A fund of Rs. 60,000 crore (US$ 8.32 billion) is allocated to the Mahatma Gandhi National Rural Employment Gurantee Act (MNREGA).
The Budget 2019 has identified Agriculture Sector as one of the key drivers of the economy.
Agriculture and Allied Services
OPPORTUNITIES

For updated information, please visit www.ibef.orgAgriculture and Allied
Services31
OPPORTUNITIES
New agri business, which provides
inputs such as seeds, fertilizers along
with providing advice and training
farmers on latest agricultural practices
It introduces efficiencies into the whole
gamut of agri practices
Provides assistance to sell products at
appropriate prices
In June 2017, Bhoomee, a startup from
Bengaluru created an app which offers a
one-stop platform that enables farmers
to connect to traders and vice-versa
through their online portals and call
centers.
Farm management services
Limited arable land against growing
population makes agricultural inputs crucial
Huge opportunity exists for agri input
segments like seeds and plant growth
nutrients
In India, commercial seeds only account for
minor percentage (25 per cent) and huge
demand is expected for quality branded
seeds
Global supermarket majors looking at India
as a major outsourcing hub
The government has helped by investing in
AEZs, mega food parks, easier credit
The establishment of food parks – a unique
opportunity for entrepreneurs, including
foreign investors to enter in the Indian food
processing sector.
As of July 2018, out of the 42 approved
mega food parks in the country, eight had
been made operational.
Potential global outsourcing hub
Agriculture storage capacity in India increased
at 4 per cent CAGR between 2014-17 to reach
131.8 million metric tonnes.
Cold storage capacity needs to grow rapidly
from the current level of 24 million tonnes
Private warehouse operators are supported by
multiple income streams, subsidy and available
of credit
It is expected that 4 per cent growth in the food
grain storage capacity would restructure
agricultural sector over the next few years
Both firms and the government are eager to
boost efficiency and access to markets
Investment potential of US$ 22 billion in food
processing infrastructure; 100 per cent FDI in
this area
Firms increasingly taking recourse to contract
farming in order to secure supply
Supply chain infrastructure – this niche has
investment potential in food processing
infrastructure, the government’s main focus is
on supply chain related infrastructure like cold
storage, abattoirs and food parks.
Supply chain infrastructure and contract
farming
Source: Ministry of Agriculture and Farmers’ Welfare, Ministry of Food Processing Industries
For updated information, please visit www.ibef.orgAgriculture and Allied
Services32
GOVERNMENT INITIATIVES THAT WILL FURTHER
PROP UP THE SECTOR
Source: Ministry of Agriculture and Farmers’ Welfare, DIPP, Aranca Research; Note: RFID – Radio Frequency Identification
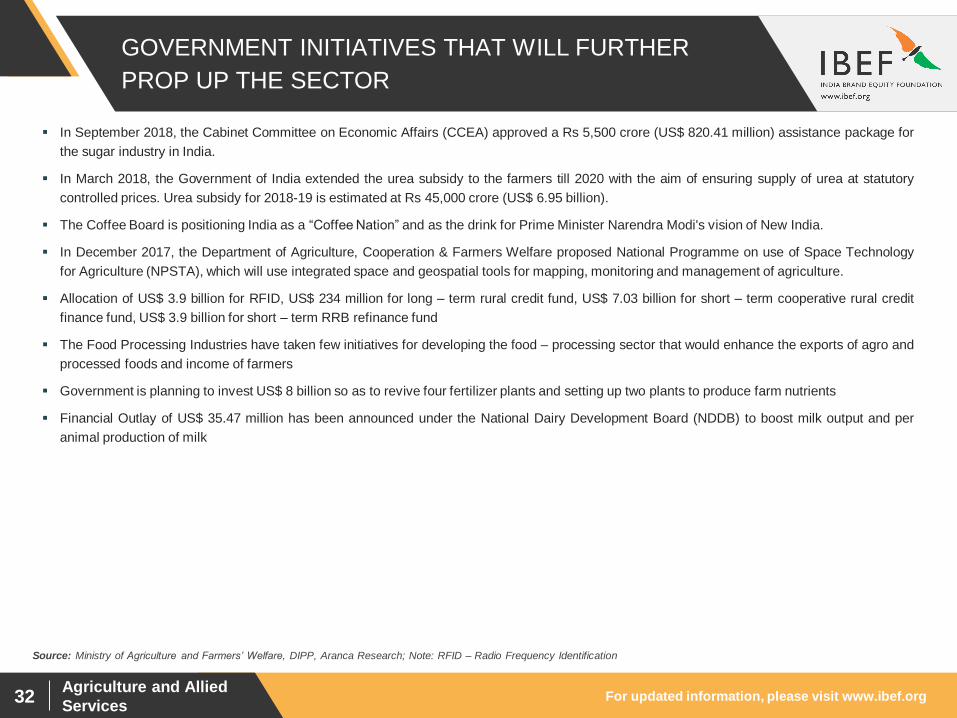
In September 2018, the Cabinet Committee on Economic Affairs (CCEA) approved a Rs 5,500 crore (US$ 820.41 million) assistance package for
the sugar industry in India.
In March 2018, the Government of India extended the urea subsidy to the farmers till 2020 with the aim of ensuring supply of urea at statutory
controlled prices. Urea subsidy for 2018-19 is estimated at Rs 45,000 crore (US$ 6.95 billion).
The Coffee Board is positioning India as a “Coffee Nation” and as the drink for Prime Minister Narendra Modi's vision of New India.
In December 2017, the Department of Agriculture, Cooperation & Farmers Welfare proposed National Programme on use of Space Technology
for Agriculture (NPSTA), which will use integrated space and geospatial tools for mapping, monitoring and management of agriculture.
Allocation of US$ 3.9 billion for RFID, US$ 234 million for long – term rural credit fund, US$ 7.03 billion for short – term cooperative rural credit
finance fund, US$ 3.9 billion for short – term RRB refinance fund
The Food Processing Industries have taken few initiatives for developing the food – processing sector that would enhance the exports of agro and
processed foods and income of farmers
Government is planning to invest US$ 8 billion so as to revive four fertilizer plants and setting up two plants to produce farm nutrients
Financial Outlay of US$ 35.47 million has been announced under the National Dairy Development Board (NDDB) to boost milk output and per
animal production of milk

Agriculture and Allied Services
INDUSTRY
ASSOCIATIONS
For updated information, please visit www.ibef.orgAgriculture and Allied
Services34
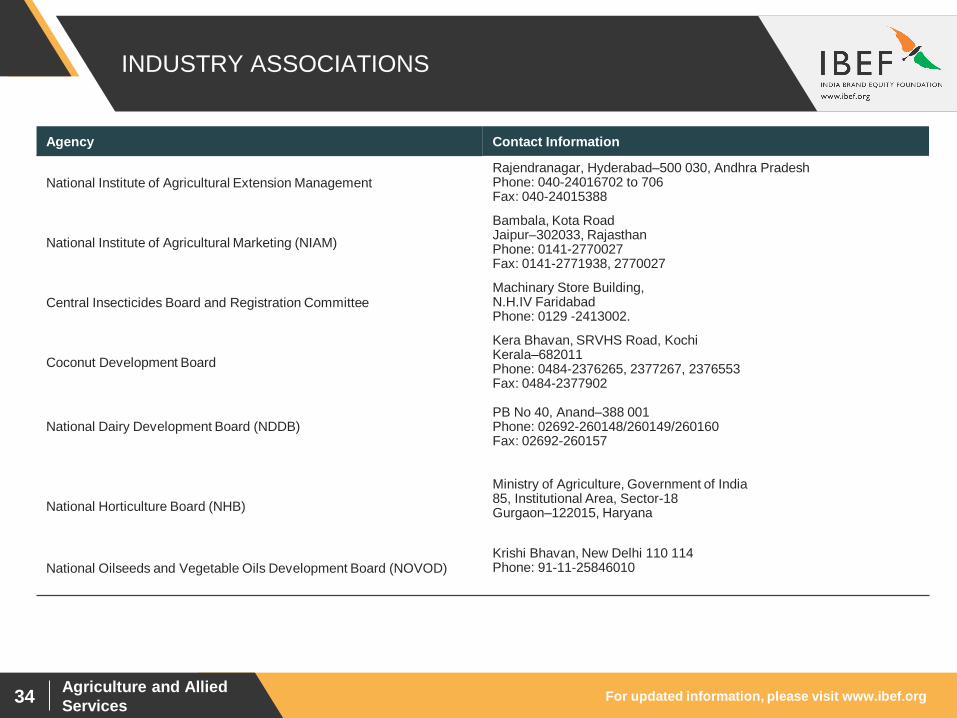
INDUSTRY ASSOCIATIONS
Agency Contact Information
National Institute of Agricultural Extension Management Rajendranagar, Hyderabad–500 030, Andhra PradeshPhone: 040-24016702 to 706 Fax: 040-24015388
National Institute of Agricultural Marketing (NIAM)
Bambala, Kota RoadJaipur–302033, RajasthanPhone: 0141-2770027Fax: 0141-2771938, 2770027
Central Insecticides Board and Registration CommitteeMachinary Store Building,N.H.IV FaridabadPhone: 0129 -2413002.
Coconut Development Board
Kera Bhavan, SRVHS Road, KochiKerala–682011Phone: 0484-2376265, 2377267, 2376553Fax: 0484-2377902
National Dairy Development Board (NDDB)PB No 40, Anand–388 001Phone: 02692-260148/260149/260160 Fax: 02692-260157
National Horticulture Board (NHB)
Ministry of Agriculture, Government of India85, Institutional Area, Sector-18Gurgaon–122015, Haryana
National Oilseeds and Vegetable Oils Development Board (NOVOD)Krishi Bhavan, New Delhi 110 114Phone: 91-11-25846010

Agriculture and Allied Services
USEFUL
INFORMATION

For updated information, please visit www.ibef.orgAgriculture and Allied
Services36
GLOSSARY
AIBP: Accelerated Irrigation Benefit Programme
Breeder seeds: Seeds move from germ-plasm (research) stage to breeder stage
CAGR: Compound Annual Growth Rate
Certified/quality seeds: Foundation seeds are further multiplied to get certified seeds, which are sold to farmers
FMTTI: Farm Machinery Training and Testing Institutes
Foundation seeds: Breeder seeds are multiplied as foundation seeds
FY: Indian Financial Year (April to March) – FY12 implies April 2011 to March 2012
KCC: Kisan Credit Card
MSP: Minimum Support Prices
NFSM: National Food Security Mission
NMAM: National Mission on Agricultural Mechanisation
PGN: Plant Growth Nutrients
RKVY: Rashtriya Krushi Vikas Yojana is a central government scheme providing funds to state governments to spend on agriculture
Wherever applicable, numbers have been rounded off to the nearest whole number

For updated information, please visit www.ibef.orgAgriculture and Allied
Services37
EXCHANGE RATES
Exchange Rates (Fiscal Year) Exchange Rates (Calendar Year)
Year INR INR Equivalent of one US$
2004–05 44.95
2005–06 44.28
2006–07 45.29
2007–08 40.24
2008–09 45.91
2009–10 47.42
2010–11 45.58
2011–12 47.95
2012–13 54.45
2013–14 60.50
2014-15 61.15
2015-16 65.46
2016-17 67.09
2017-18 64.45
2018-19 69.89
Year INR Equivalent of one US$
2005 44.11
2006 45.33
2007 41.29
2008 43.42
2009 48.35
2010 45.74
2011 46.67
2012 53.49
2013 58.63
2014 61.03
2015 64.15
2016 67.21
2017 65.12
2018 68.36
Source: Reserve Bank of India, Average for the year

For updated information, please visit www.ibef.orgAgriculture and Allied
Services38
DISCLAIMER
India Brand Equity Foundation (IBEF) engaged Aranca to prepare this presentation and the same has been prepared by Aranca in consultation
with IBEF.
All rights reserved. All copyright in this presentation and related works is solely and exclusively owned by IBEF. The same may not be reproduced,
wholly or in part in any material form (including photocopying or storing it in any medium by electronic means and whether or not transiently or
incidentally to some other use of this presentation), modified or in any manner communicated to any third party except with the written approval
of IBEF.
This presentation is for information purposes only. While due care has been taken during the compilation of this presentation to ensure that the
information is accurate to the best of Aranca and IBEF’s knowledge and belief, the content is not to be construed in any manner whatsoever as a
substitute for professional advice.
Aranca and IBEF neither recommend nor endorse any specific products or services that may have been mentioned in this presentation and nor do
they assume any liability or responsibility for the outcome of decisions taken as a result of any reliance placed on this presentation.
Neither Aranca nor IBEF shall be liable for any direct or indirect damages that may arise due to any act or omission on the part of the user due to any
reliance placed or guidance taken from any portion of this presentation.