Embed Size (px)
Citation preview

Agriculture and FoodCHAPTER
8
Agriculture has been a way of life and continues to be the single most important
livelihood of the masses. Agricultural policy focus in India across decades has beenon self-sufficiency and self-reliance in foodgrains production. Considerable progress
has been made on this front. Foodgrains production rose from 52 million tonnes in
1951-52 to 244.78 million tonnes in 2010-11. The share of agriculture in real GDPhas fallen given its lower growth rate relative to industry and services. However,
what is of concern is that growth in the agricultural sector has quite often fallen
short of the Plan targets. During the period 1960-61 to 2010-11, foodgrainsproduction grew at a compounded annual growth rate (CAGR) of around 2 per
cent. In fact, the Ninth and Tenth Five Year Plans witnessed agricultural sectoral
growth rate of 2.44 per cent and 2.30 per cent respectively compared to 4.72 percent during Eighth Five Year Plan. During the current Five Year plan, agriculture
growth is estimated at 3.28 per cent against a target of 4 per cent. The ApproachPaper to the Twelfth Five Year Plan emphasises the need to “redouble our efforts to
ensure that 4.0 per cent average growth” is achieved during the Plan if not more.
Without incremental productivity gains and technology diffusion across regions,achieving this higher growth may not be feasible and has implications for the
macroeconomic stability given the rising demand of the 1.2 billion people for food.
Achieving minimum agricultural growth is a pre-requisite for inclusive growth,reduction of poverty levels, development of the rural economy and enhancing of
farm incomes.
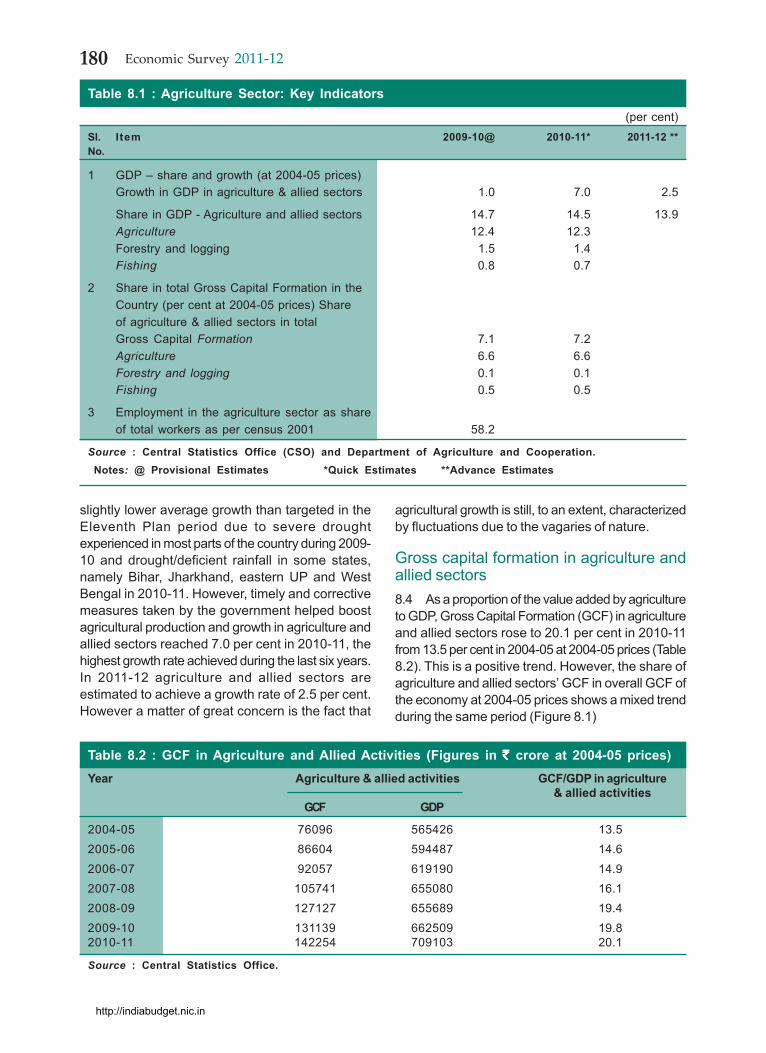
8.2 Agriculture including allied activities, accountedfor 14.5 per cent of gross domestic product (GDP)at 2004-05 prices, in 2010-11 as compared to 14.7per cent in 2009-10. Notwithstanding the decliningtrend in agriculture’s share in the GDP, it is criticalfrom the income distribution perspective as itaccounted for about 58 per cent employment in thecountry according to Census 2001. Hence growth inagriculture and allied sectors remains a ‘necessarycondition’ for inclusive growth. In terms ofcomposition, out of the total share of 14.5 per centthat agriculture and allied sectors had in GDP in2010-11, agriculture alone accounted for 12.3 percent, followed by forestry and logging at 1.4 per cent
and fishing at 0.7 per cent (Table 8.1). Reasonablegrowth in agriculture is important both from thenutritional point of view as well as to control foodprices and overall headline inflation.
PERFORMANCE OF THE AGRICULTURESECTOR DURING THE CURRENT FIVEYEAR PLAN (2007-2012)8.3 The average annual growth in agriculture andallied sectors realized during the first four years ofthe Eleventh Plan Period, i.e. 2007-08 to 2010-11, is3.5 per cent against the targeted growth rate of 4per cent. Agriculture and allied sectors recorded
http://indiabudget.nic.in
180 Economic Survey 2011-12
Table 8.1 : Agriculture Sector: Key Indicators(per cent)
Sl. Item 2009-10@ 2010-11* 2011-12 **No.
1 GDP – share and growth (at 2004-05 prices)Growth in GDP in agriculture & allied sectors 1.0 7.0 2.5
Share in GDP - Agriculture and allied sectors 14.7 14.5 13.9Agriculture 12.4 12.3Forestry and logging 1.5 1.4Fishing 0.8 0.7
2 Share in total Gross Capital Formation in theCountry (per cent at 2004-05 prices) Shareof agriculture & allied sectors in totalGross Capital Formation 7.1 7.2Agriculture 6.6 6.6Forestry and logging 0.1 0.1Fishing 0.5 0.5
3 Employment in the agriculture sector as shareof total workers as per census 2001 58.2
Source : Central Statistics Office (CSO) and Department of Agriculture and Cooperation. Notes: @ Provisional Estimates *Quick Estimates **Advance Estimates
slightly lower average growth than targeted in theEleventh Plan period due to severe droughtexperienced in most parts of the country during 2009-10 and drought/deficient rainfall in some states,namely Bihar, Jharkhand, eastern UP and WestBengal in 2010-11. However, timely and correctivemeasures taken by the government helped boostagricultural production and growth in agriculture andallied sectors reached 7.0 per cent in 2010-11, thehighest growth rate achieved during the last six years.In 2011-12 agriculture and allied sectors areestimated to achieve a growth rate of 2.5 per cent.However a matter of great concern is the fact that
agricultural growth is still, to an extent, characterizedby fluctuations due to the vagaries of nature.
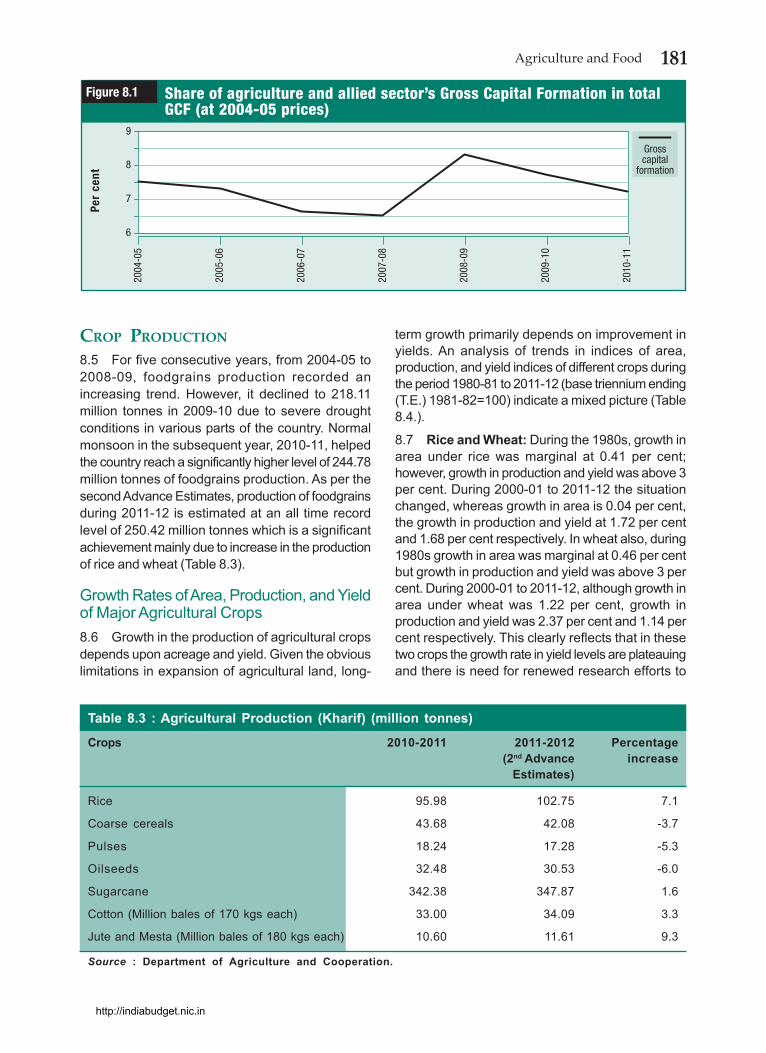
Gross capital formation in agriculture andallied sectors8.4 As a proportion of the value added by agricultureto GDP, Gross Capital Formation (GCF) in agricultureand allied sectors rose to 20.1 per cent in 2010-11from 13.5 per cent in 2004-05 at 2004-05 prices (Table8.2). This is a positive trend. However, the share ofagriculture and allied sectors’ GCF in overall GCF ofthe economy at 2004-05 prices shows a mixed trendduring the same period (Figure 8.1)
Table 8.2 : GCF in Agriculture and Allied Activities (Figures in ` ` ` ` ` crore at 2004-05 prices)Year Agriculture & allied activities GCF/GDP in agriculture
& allied activitiesGCF GDP
2004-05 76096 565426 13.52005-06 86604 594487 14.62006-07 92057 619190 14.92007-08 105741 655080 16.12008-09 127127 655689 19.42009-10 131139 662509 19.82010-11 142254 709103 20.1
Source : Central Statistics Office.
http://indiabudget.nic.in
181Agriculture and Food
CROP PRODUCTION
8.5 For five consecutive years, from 2004-05 to2008-09, foodgrains production recorded anincreasing trend. However, it declined to 218.11million tonnes in 2009-10 due to severe droughtconditions in various parts of the country. Normalmonsoon in the subsequent year, 2010-11, helpedthe country reach a significantly higher level of 244.78million tonnes of foodgrains production. As per thesecond Advance Estimates, production of foodgrainsduring 2011-12 is estimated at an all time recordlevel of 250.42 million tonnes which is a significantachievement mainly due to increase in the productionof rice and wheat (Table 8.3).
Growth Rates of Area, Production, and Yieldof Major Agricultural Crops8.6 Growth in the production of agricultural cropsdepends upon acreage and yield. Given the obviouslimitations in expansion of agricultural land, long-
term growth primarily depends on improvement inyields. An analysis of trends in indices of area,production, and yield indices of different crops duringthe period 1980-81 to 2011-12 (base triennium ending(T.E.) 1981-82=100) indicate a mixed picture (Table8.4.).
8.7 Rice and Wheat: During the 1980s, growth inarea under rice was marginal at 0.41 per cent;however, growth in production and yield was above 3per cent. During 2000-01 to 2011-12 the situationchanged, whereas growth in area is 0.04 per cent,the growth in production and yield at 1.72 per centand 1.68 per cent respectively. In wheat also, during1980s growth in area was marginal at 0.46 per centbut growth in production and yield was above 3 percent. During 2000-01 to 2011-12, although growth inarea under wheat was 1.22 per cent, growth inproduction and yield was 2.37 per cent and 1.14 percent respectively. This clearly reflects that in thesetwo crops the growth rate in yield levels are plateauingand there is need for renewed research efforts to
Table 8.3 : Agricultural Production (Kharif) (million tonnes)
Crops 2010-2011 2011-2012 Percentage(2nd Advance increase
Estimates)
Rice 95.98 102.75 7.1
Coarse cereals 43.68 42.08 -3.7
Pulses 18.24 17.28 -5.3
Oilseeds 32.48 30.53 -6.0
Sugarcane 342.38 347.87 1.6
Cotton (Million bales of 170 kgs each) 33.00 34.09 3.3
Jute and Mesta (Million bales of 180 kgs each) 10.60 11.61 9.3
Source : Department of Agriculture and Cooperation.
6
Grosscapital
formation
Share of agriculture and allied sector’s Gross Capital Formation in totalGCF (at 2004-05 prices)
7
8
Figure 8.1Pe
r ce
nt
2004
-05
2005
-06
2006
-07
2007
-08
2008
-09
2009
-10
2010
-11
9
http://indiabudget.nic.in

182 Economic Survey 2011-12
boost production and productivity (Figures 8.2 and8.3). Both public and private-sector investment inresearch and development (R&D) in these cropsneeds to be encouraged.
8.8 Coarse Cereals: The growth rate in index ofarea of total coarse cereals during 1980-81 to 2011-12 was negative reflecting either shift to other cropsor relatively dry area remaining fallow. However, thegrowth in production and yield which was 0.40 percent and 1.62 per cent respectively in the 1980shas improved significantly to 3.01 per cent and 4.39
per cent respectively in the 2000-01 to 2011-12 period.This increase is primarily driven by rise in productionand yield of maize and bajra. It also refectes growingpopularity of coarse cereals as nutri-food (Figure 8.4).
8.9 Pulses: Pulses are the main source of proteinfor a large section of population in India. Gram andtur are the major contributors to total production ofpulses in the country. During the 1980s there wasnegative growth in area of total pulses and growth inproduction and yield was 1.52 per cent and 1.61 percent respectively. During the period 2000-01 to 2011-
Table 8.4 : Compound Growth Rates of Area, Production, and Yield Indices of PrincipalCrops during 1980-1990, 1990-2000 and 2000-2011 (Base: TE 1981-82=100)
1980-81 to 1989-90 1990-91 to 1999-2000 2000-01 to 2011-12*
Area Production Yield Area Production Yield Area Production Yield
Rice 0.41 3.62 3.19 0.68 2.02 1.34 0.04 1.72 1.68
Wheat 0.46 3.57 3.10 1.72 3.57 1.83 1.22 2.37 1.14
Coarse Cereals -1.34 0.40 1.62 -2.12 -0.02 1.82 -0.75 3.01 4.39
Total Pulses -0.09 1.52 1.61 -0.60 0.59 0.93 1.70 3.47 1.91
Sugarcane 1.44 2.70 1.24 -0.07 2.73 1.05 1.37 1.96 0.58
Total Oilseeds 1.51 5.20 2.43 -0.86 1.63 1.15 2.08 4.45 3.39
Total Foodgrains -0.23 2.85 2.74 -0.07 2.02 1.52 0.43 2.32 2.91
Source : Department of Agriculture and Cooperation.Notes : * Growth rates are based on the second advance estimates (AE) 2011-12 released on 03 February2012;Total oilseeds include nine oilseeds, cotton seed, and coconut.
0
Area
Indices of area, production and yield of rice
100
200
Figure 8.2
Indi
ces
2004
-05
2005
-06
2006
-07
2007
-08
2008
-09
2009
-10
2010
-11
50
150
250
Production
Yield
0
Area
Indices of area, production and yield of wheat
100
200
Figure 8.3
Indi
ces
50
150
250
Production
Yield
2004
-05
2005
-06
2006
-07
2007
-08
2008
-09
2009
-10
2010
-11
http://indiabudget.nic.in

183Agriculture and Food
12, the indices of area, production and yield of pulseshave grown by 1.70 per cent, 3.47 per cent, and1.91 per cent respectively. The growth in indices ofarea and production during 2000-01 to 2011-12 ismainly on account of gram. A breakthrough in pulsesproduction technology is necessary to keep pacewith rising demand for this commodity (Figure 8.5).
8.10 Sugarcane: The compound growth rates ofindices of area, production, and yield of sugarcaneduring 2000-01 to 2011-12 has declined comparedto the 1980s. The decline in yield during this periodis because of relatively higher decline in growth rateof production. A concerted effort is required toincrease yield of this crop to avoid fluctuations inproduction and spikes in price of sugar (Figure 8.6).
The production of sugar in the 2011-12 sugar seasonis estimated at about 246.65 lakh tonnes againstthe estimated demand of about 220 lakh tonnes.
8.11 Oilseeds: There has been improvement inannual growth in the indices of yield and area underoilseeds during 2000-01 to 2011-12 as compared tothe 1980s. India, however, still imports about50 per cent of its requirement of edible oil. The currentlevel of growth rate in yield index needs to bemaintained to ensure a reasonable level of self-sufficiency in this crop (Figure 8.7). The productionof oilseeds during 2011-12 and net availability ofedible oil from all domestic sources (primary) areestimated at 305.29 lakh tonnes and 72.69 lakhtonnes respectively.
0
Area
Indices of area, production and yield of coarse cereals
100
200
Figure 8.4In
dice
s
50
150
250
Production
Yield
2004
-05
2005
-06
2006
-07
2007
-08
2008
-09
2009
-10
2010
-11
60
Area
Indices of area, production and yield of total pulses
120
180
Figure 8.5
Indi
ces
90
150
210
Production
Yield
2004
-05
2005
-06
2006
-07
2007
-08
2008
-09
2009
-10
2010
-11
0
Area
Indices of area, production and yield of sugarcane
100
200
Figure 8.6
Indi
ces
50
150
250
Production
Yield
2004
-05
2005
-06
2006
-07
2007
-08
2008
-09
2009
-10
2010
-11
http://indiabudget.nic.in

184 Economic Survey 2011-12
Increased requirements of foodconsumption8.12 Given the growth rate of population, the risein demand for food is a natural concomitant. Further,the rise in income levels and change in tastes andpreferences of people have also contributed to theincreased demand for diverse food products. Therecent spurt in food prices was mainly driven byincrease in prices of items like fruits and vegetables,milk, meat, poultry, and fish, which account forapproximately 70 per cent of the wholesale priceindex (WPI) basket for primary food items. Anexamination of food consumption expenditure in thecountry during the period 1987-88 to 2009-10 clearlyreveals that there has been a shift in expendituretowards milk and milk products, egg, fish, meat,and vegetables both in rural and urban areas, whereasthe share of consumption of cereals in the total foodbasket has gone down (Table 8.5). Some of the short-term, medium-term, and long-term measures thatcould be undertaken to achieve higher productionand productivity in the agriculture sector to ensurethat the higher demand for food items is met includemeasures related to supply response, storage, andmarketing (Box 8.1).
AREA COVERAGE OF FOODGRAINS IN2011-128.13 There has been a decline in overall areaunder foodgrains during 2011-12 (2nd AdvanceEstimates) as compared to 2010-11. The areacoverage under foodgrains during 2011-12 stoodat 1254.92 lakh ha compared to 1267.65 lakhha last year. The lower area under foodgrainshas been due to a shortfall in the area underjowar in Maharashtra, Rajasthan and Gujarat;bajra in Maharashtra, Gujarat and Haryana; andin pulses in Maharashtra, Uttar Pradesh, AndhraPradesh, and Rajasthan. However the area undercoarse cereals and oilseeds has also come downas compared to the previous year. The areacoverage under rice during 2011-12 is around444.06 lakh ha which is 15.44 lakh ha more thanthe previous year. The area coverage undersugarcane during the current year has slightlyimproved to 50.81 lakh ha, higher by about 1.96lakh hectares as compared to the previous year,and the area under cotton has increasedsignificantly to 121.78 lakh ha as compared to112.35 lakh ha during 2010-11.
Area
Indices of area, production and yield of oilseeds
100
200
Figure 8.7In
dice
s
50
150
250
Production
Yield
300
2004
-05
2005
-06
2006
-07
2007
-08
2008
-09
2009
-10
2010
-11
Table 8.5: Item-wise Share of Expenditure to Total Food Expenditure
Rural Urban
1987-1988 2009-2010 1987-1988 2009-2010
Cereals 41.1 29.1 26.6 22.4
Pulses and products 6.3 6.9 6.0 6.6
Milk and products 13.4 16.0 16.8 19.2
Egg, fish, and meat 5.2 6.5 6.4 6.6
Vegetables 8.1 11.6 9.4 10.6
Sugar 4.5 4.5 4.3 3.7
Food total 100 100 100 100
Source : Key Indicators of Household Consumer Expenditure in India 2009-10, National Sample Survey(NSS) 66th Round
http://indiabudget.nic.in

185Agriculture and Food
Rubber8.14 India is the fourth largest producer of naturalrubber (NR) with a share of 8.2 per cent in worldproduction in 2010. Despite not having geographicallyvery favourable regions for growing NR, Indiacontinued to record the highest productivity amongmajor NR-producing countries. The production of NRin 2011-12 is projected at 9.02 lakh tonnes, anincrease of 4.6 per cent over 2010-11. India continuesto be the second largest consumer of NR with 8.8per cent share of world consumption in 2010.Consumption of NR in 2011-12 is projected at 9.77lakh tonnes, an increase of 3.1 per cent over theprevious year.
Coffee8.15 India is the sixth largest producer of coffeeafter Brazil, Vietnam, Colombia, Indonesia, andEthiopia. With 2 per cent share in global area undercoffee, India contributes about 4 per cent to worldcoffee production as well as international trade.Coffee is cultivated in an area about 4.0 lakh haprimarily in the southern states of Karnataka, Kerala,and Tamil Nadu. Presently consumption in thecountry is over 1 lakh tonnes and India producesabout 3 lakh tonnes of coffee comprising bothArabica (32 per cent) and Robusta (68 per cent)
coffee. The country’s coffee production reached ahigh of 3.02 lakh tonnes during 2011-12 and isexpected to touch an all-time record production of3.22 lakh tonnes during 2011-12, an increase of 6.7per cent over 2010-11 production.
8.16 Over the past two decades, coffee cultivationhas been promoted in the tribal regions of AndhraPradesh, Orissa, and the north-eastern statesprimarily with the objective of tribal development andafforestation. Indian coffee is primarily an export-oriented commodity with about 70 per cent ofproduction being exported.
Tea8.17 India is the largest producer and consumer ofblack tea in the world. Tea is grown in 16 states inIndia. Assam, West Bengal, Tamil Nadu, and Keralaaccount for about 95 per cent of total tea production.Tea production in India during the year 2010-11 hasbeen estimated at 0.97 million tonnes as against0.99 million tonnes in 2009-10.
Exports and Imports8.18 India’s trade policy on agricultural items isguided by the twin objectives of ensuring food securityand building export markets for enhancing the incomeof farmers, depending on domestic availability. In
Box 8.1 : Options for addressing supply-side constraints Given the compositional shift in foodbasket of a common household and its impact on consumption demand, improved
supply response is critical for ensuring price stability in food items.
Extension programmes and guidance to farmers regarding fertilizer and insecticide usage and alternate croppingpattern based on soil analysis could be undertaken and intensified.
As a strategy, regular imports of agricultural commodities in relatively smaller quantities with an upper ceiling on totalquantity could be considered. The upper ceiling can be decided annually, relatively well in advance, after assessing thelikely domestic situation in terms of production and consumption requirements.
Setting up special markets for specific crops in states/regions/areas producing those crops would facilitate supply ofsuperior commodities to the consumers.
Mandi governance is an area of concern. A greater number of traders must be allowed as agents in the mandis. Anyonewho gets better prices and terms outside the Agricultural Produce Marketing Committee (APMC) or at its farm gateshould be allowed to do so. For promoting inter-state trade, a commodity for which market fee has been paid oncemust not be subjected to subsequent market fee in other markets including that for transaction in other states. Onlyuser charges linked to services provided may be levied for subsequent transactions.
Perishables could be taken out of the ambit of the APMC Act. The recent episodes of inflation in vegetables and fruitshave exposed flaws in our supply chains. The government-regulated mandis sometimes prevent retailers fromintegrating their enterprises with those of farmers. In view of this, perishables may have to be exempted from thisregulation.
Considering significant investment gaps in post-harvest infrastrure of agricultrual produce, organised trade in agricultureshould be encouraged and the FDI in multi-brand retail once implemented could be effectively leveraged towards thisend.
Government should step up creation of modern storage faclities for food grains.
http://indiabudget.nic.in
186 Economic Survey 2011-12
September 2011, government has put the exports ofwheat, non-basmati rice, and cotton under opengeneral licence.
8.19 India is among 15 leading exporters ofagricultural products in the world. As per theInternational Trade Statistics 2011, published by theWorld Trade Organization (WTO), India’s agriculturalexports amounted to US $ 23.2 billion with a 1.7 percent share of world trade in agriculture in 2010. Onthe other hand, India’s agricultural imports amountedto US $ 17.5 billion with a 1.2 per cent share ofworld trade in agriculture in 2010.
AGRICULTURAL INPUTS8.20 Improvement in yield, which is key to long-term growth, depends on a host of factors includingtechnology, use of quality seeds, fertilizers,pesticides, micronutrients, and irrigation. Each ofthese plays a role in determining yield level and inturn augmentation in the level of production.
Seeds8.21 Good quality seed is one of the most importantinputs for enhancing agricultural productivity andproduction. Efficacy of other agricultural inputs suchas fertilizers, pesticides, and irrigation is largelydetermined by it. Seed quality is estimated toaccount for 20-25 per cent of productivity. It is,therefore, important that quality seeds are madeavailable to the farmers. Since the year 2005-06,the central government has been implementing acentral-sector scheme known as ‘Development andStrengthening of Infrastructure Facilities forProduction and Distribution of Quality Seeds’ toaddress the gaps in infrastructure and to increaseavailability of quality seeds for different crops throughvarious interventions. The objective of the scheme isto ensure production and multiplication of high-yielding certified/quality seeds of all crops in sufficientquantities and make them available to farmers ataffordable prices. An amount of ̀ 1987.83 crore (till15 February 2012) has been released as grants-in-aid under different components of the scheme.Although this scheme has contributed to doublingthe availability of quality seeds in the last five years,it requires major changes and upgradation to meetthe challenges of the rapidly evolving seed sectorand ensure wider use of quality seeds. Accordingly,a National Mission on Seeds for the Twelfth PlanPeriod has been proposed.
8.22 The New Policy on Seed Development(NPSD) was formulated way back in 1988 with a
view to providing the best planting material availableabroad to Indian farmers. The policy has, over theyears, facilitated import of seeds under variouscategories. The policy permits initial import of smallquantities of seeds of cereals, oilseeds, pulses, etc.for in-house trial by the importer. Based onsatisfactory results of multi-location trials, importersare permitted to import in bulk. Subsequently, NPSD1988 was revised to allow import of seeds of wheatand paddy, coarse cereals, pulses, and oilseedsunder prescribed conditions. The revisions in NPSDcould usher in an enabling environment for speedytrial and evaluation of seeds, thereby facilitating timelyimports.
8.23 In response to the changes that have takenplace in the seed sector, the Seed Act 1966 isproposed to be replaced by a suitable legislation to(i) create an enabling climate for growth of the seedindustry, (ii) enhance the seed replacement rates,(iii) boost export of seeds and encourage import ofuseful germplasm, and (iv) create a conduciveatmosphere for the application of frontier sciencesin variety development and enhanced investment forR&D. Presently, the Bill is under consideration formoving official amendments to it based onsuggestions received from various quarters.
8.24 FDI policy for agriculture sector was amendedto allow 100 per cent FDI under automatic route for‘development of seed’. Earlier, FDI was permitted for‘development of seed under controlled condition’.
Mechanization and Technology8.25 Farm mechanization has immense potentialfor improving farm productivity. Empirical datareaffirm that availability of farm power has a directcorrelation to agricultural productivity. Appropriatecrop and region-specific agricultural equipmentenable efficient utilization of farm inputs makingfarming viable and attractive. Though the countryhas been witnessing considerable progress in farmmechanization, its spread across the country stillremains uneven. Current farm power availabilityhovers around 1.7 kw/ha which is much lower thanthat of Korea (7+ kw/ha), Japan (14+kw/ha), andthe USA (6+kw/ha). It is estimated that in order toupscale farm productivity so as to grow more foodgiven the stagnant net sown area, farm poweravailability must reach at least 2.0 kw/ha by theend of Twelfth Five Year Plan. Gradual increase infarm mechanization will also help release agriculturallabour for other emerging and valued sectors, thuscontributing more towards GDP.
http://indiabudget.nic.in

187Agriculture and Food
8.26 So far in India, ‘tractors’ have been the majorsymbol of agriculture mechanization. Indianagriculture is dominated by small and marginalfarmers, whose smaller landholding and weakereconomic status render single ownership of muchhigh-value agricultural machinery and equipment. Inthis context, supporting and franchising ruralentrepreneurs for establishing custom hiring or farmservice centers will help extending benefits of farmmechinization to so far ‘excluded farmers’ category.
Fertilizers8.27 India is meeting 80 per cent of its urearequirement through indigenous production but islargely import dependent for meeting therequirements of potassic (K) and phosphatic (P)fertilizers (Table 8.6). Chemical fertilizers have playeda significant role in the development of the agriculturalsector. Consumption of chemical fertilizers hassteadily increased over the years (Table 8.7).
8.28 The Nutrient Based Subsidy (NBS) Policy forfertilizers was implemented in 2010. Under the NBSPolicy, a fixed subsidy is announced on per kg basisof nutrient annually. An additional subsidy is alsogiven to micro-nutrients. With the objective of
providing a variety of subsidized fertilizers to farmersdepending upon soil and crop requirements, thegovernment has included seven new grades ofcomplex fertilizers under the NBS. Under thisscheme, manufactures/marketers are allowed to fixthe maximum retail price (MRP). Farmers pay only50 per cent of the delivered cost of P and K fertilizers,the rest is borne by the Government of India in theform of subsidy.
Rainfall and Reservoir Levels8.29 Rainfall continues to influence crop productionand productivity in a substantial way. Around 75 percent of annual rainfall is received during the south-west monsoon season (June-September). During thesouth-west monsoon season 2011, the country as awhole received 1 per cent more rainfall than the longperiod average (LPA). Central India and north-westIndia experienced excess rainfall over the LPA by 10per cent and 7 per cent respectively. The southernpeninsula received normal rainfall. North-east Indiareceived 14 per cent less rainfall than the LPA. Atdistrict level, 24 per cent of districts received excessrainfall, 52 per cent normal rainfall, 23 per centdeficient rainfall, and 1 per cent scanty rainfall.
8.30 Out of 36 Subdivisions, 3 recorded deficientrainfall during the south-west Monsoon in 2011. Outof the 33 remaining subdivisions, 7 recorded excessrainfall and the remaining 26 recorded normal rainfall(Table 8.8).
8.31 The total designed storage capacity at fullreservoir level (FRL) of 81 major reservoirs in thecountry monitored by the Central Water Commission(CWC) is 151.77 billion cubic meters (BCM). At theend of monsoon 2011, the total live storage in thesereservoirs was 131.076 BCM which is more than thelive storage of 115.23 BCM at the end of monsoon2010 and 102.759 BCM which is the average of thelast 10 years. Given the vagaries of the monsoon,augmenting irrigation potential is key to sustainedgrowth in agriculture.
Irrigation8.32 Irrigation is one of the most important inputsrequired at different critical stages of plant growth ofvarious crops for optimum production. TheGovernment of India has taken up augmentation ofirrigation potential through public funding and isassisting farmers to create potential on their ownfarms. Substantial irrigation potential has beencreated through major and medium irrigationschemes.
Table 8.7 : Per Hectare Consumption ofFertilizers in Nutrient Terms
(in lakh tonnes)Year 2006- 2007- 2008- 2009- 2010-
07 08 09 10 11
Nitrogenous (N) 137.73 144.19 150.90 155.80 165.58Phosphatic (P) 55.43 55.15 65.06 72.74 80.50Potassic (K) 23.35 26.36 33.13 36.32 35.14Total (N+P+K) 216.51 225.70 249.09 264.86 281.22Per hectareconsumption (kg) 111.8 116.50 127.2 135.76 144.14
Source : Department of Fertilizers.
Table 8.6 : Production of Urea, DAP andComplex Fertilizers
(in lakh tonnes)Year 2006- 2007- 2008- 2009- 2010- 2011-
07 08 09 10 11 12*
Urea 203.10 198.60 199.20 211.12 218.80 222.88Di-ammo- 48.52 42.12 29.93 42.46 35.37 39.41ium phos-phate.
Complex 74.64 58.50 68.48 80.38 87.27 90.69fertilizers
Source : Department of Fertilizers.*Estimated
http://indiabudget.nic.in

188 Economic Survey 2011-12
8.33 The central government initiated theAccelerated Irrigation Benefit Programme (AIBP)from 1996-97 for extending assistance for thecompletion of incomplete irrigation schemes. Underthis programme, projects approved by the PlanningCommission are eligible for assistance. Under theAIBP, ` 50,380.64 crore of central loan assistance(CLA)/grant has been released up to 30 November2011. As on 31 March 2011, 290 projects werecovered under the AIBP and 134 completed. During2010-11, an irrigation potential of 566.24 thousandha is reported to have been created by states, frommajor / medium /minor irrigation projects under theAIBP. While the higher irrigation potential would helpaugment production and productivity, assuredremuneration from such production is vital fordevelopment of agriculture.
PRICE POLICY FOR AGRICULTURALPRODUCE
8.34 Government’s price policy for agriculturalproduce seeks to ensure remunerative prices togrowers for their produce with a view to encouraginghigher investment and production and safeguardingthe interests of consumers by making available foodsupplies at reasonable prices. The price policy alsoseeks to evolve a balanced and integrated pricestructure in keeping with the overall needs of theeconomy. To achieve this end, the governmentannounces minimum support prices (MSPs) formajor agricultural commodities each season andorganizes purchase operations through the FoodCorporation of India, and cooperative and otheragencies designated by state governments. The
0
Paddy(common)
Recent trends in MSPs of some important crops
1000
2000
3000
Figure 8.8
��/
quin
tal
3500
500
1500
2500
2005
-06
2006
-07
2007
-08
2008
-09
2009
-10
2010
-11
2011
-12
Jowar
Wheat
Arhar (Tur)
Cotton
Table 8.8 : Monsoon Performance : 2001 to 2011 (June – September)Year Number of meteorological subdivisions Percentage of Percentage
districts with of long periodNormal Excess Deficient/ normal/ average rainfall
Scanty excess for the countryrainfall as a whole
2001 28 1 6 68 912002 14 1 21 37 812003 23 8 5 76 1052004 23 0 13 56 872005 24 8 4 72 992006 21 6 9 60 1002007 18 13 5 72 1062008 31 2 3 76 982009 11 3 22 42 782010 17 14 5 70 1022011 26 7 3 76 101
Source : Indian Meteorological Department.
http://indiabudget.nic.in

189Agriculture and Food
government decides on the MSPs for variousagricultural commodities taking into account therecommendations of the Commission for AgriculturalCosts and Prices (CACP), the views of stategovernments and central ministries as well as suchother relevant factors which are considered importantfor fixation of support prices. In the year 2011-12,the MSPs of various agricultural crops have beenincreased as reflected in Table 8.9. The MSPs ofsome major crops exhibit a rising trend in line withcosts and as incentive for higher output (Figure 8.8).
8.35 NAFED appoints state agencies to undertakePrice Support Scheme (PSS) operations. The losses,if any, incurred by the central agencies onundertaking PSS operations are reimbursed up to
15 per cent by the central government. Apart fromthis, government provides working capital to thecentral agencies for undertaking PSS operations.The government also implements the MarketIntervention Scheme (MIS) for horticultural andagricultural commodities, generally perishable innature and not covered under the PSS, thus helpingfarmers get remunerative prices for their produce.The MIS is contingent on the specific request of astate/union territory (UT) government which is readyto bear 50 per cent loss (25 per cent in the case ofnorth-eastern states), if any, incurred on itsimplementation. However, the loss is restricted upto 25 per cent of total procurement value. Profitearned, if any, in implementing the MIS is retainedby the procuring agencies.
Table 8.9 : Minimum Support Prices(` per quintal)
2010-11 2011-12 Difference between2011-12 and
2010-11 Prices
Kharif CropsPaddy (common) 1000 1080 80Paddy (Gr.A) 1030 1110 80Jowar (hybrid) 880 980 100Jowar (maldandi) 900 1000 100Bajra 880 980 100Maize 880 980 100Ragi 965 1050 85Arhar (tur) 3000* 3200* 200Moong 3170* 3500* 330Urad 2900* 3300* 400Groundnut in shell 2300 2700 400Sunflower 2350 2800 450Soyabean (black) 1400 1650 250Soyabean (yellow) 1440 1690 250Sesamum 2900 3400 500Nigerseed 2450 2900 450Cotton (F-414/H-777/J34)a 2500 2800 300Rabi cropsWheat 1120b 1285 165Barley 780 980 200Gram 2100 2800 700Masur (lentil) 2250 2800 550Rapeseed/mustard 1850 2500 650Safflower 1800 2500 700
Source : Department of Agriculture and Cooperation.Note : * An additional incentive at the rate of `̀̀̀̀ 500 per quintal for tur, urad, and moong is given to procurementagencies during the harvest/arrival period of two months. a- Staple length (mm) of 24.5 and 25.5 and micronairevalue of 4.3-5.1. b-An additional incentive bonus of `̀̀̀̀ 50 per quintal over the MSP.
http://indiabudget.nic.in

190 Economic Survey 2011-12
MAJOR SCHEMES/PROGRAMMES INTHE AGRICULTURE SECTOR
8.36 Agriculture being a state subject, the primaryresponsibility for increasing agriculture production,enhancing productivity, and exploring the vastuntapped potential of the sector rests with the stategovernments. However, in order to supplement theefforts of the state governments, a number of centrallysponsored and central-sector schemes are beingimplemented for enhancing agricultural productionand productivity in the country and increasing theincome of the farming community.
National Food Security Mission (NFSM)8.37 The NFSM, launched in 2007, is a cropdevelopment scheme of the Government of India thataims at additional production of 10, 8, and 2 milliontonnes of rice, wheat, and pulses respectively bythe end of 2011-12.The scheme was approved withan outlay of ̀ 4,883 crore for the period from 2007-08 to 2011-12. A sum of about ` 3,381 crore hasbeen spent till 31 March 2011. The Missioninterventions consist of a judicious mix of proventechnological components covering seeds ofimproved variety, soil ameliorants, plant nutrients,farm machines/implements, and plant protectionmeasures. In addition, a special initiative under thename of the Accelerated Pulses ProductionProgramme was initiated in 2010 to boost theproduction of pulses by active promotion oftechnologies in 1,000 clusters of 1,000 ha each.Considerable achievements under the NFSM havebeen recorded during the course of implementationof the programme such as new farm practices,distribution of seeds of high yielding varieties of rice,wheat, pulses, and hybrid rice, and treating areawith soil ameliorants to restore soil fertility for higherproductivity. Through targeted interventions, themission has already achieved, a year in advance,25 millions tonnes of additional production of foodgrains exceeding the target of 20 million tonnes ofproduction set for the terminal year 2011-12, of theEleventh Year Plan.
Macro Management of Agriculture (MMA)8.38 The MMA Scheme was revised in 2008 toimprove its efficacy in supplementing/complementingthe efforts of the states towards enhancement ofagricultural production and productivity. It alsoprovides opportunity to draw upon agriculturaldevelopment programmes out of ten sub-schemesrelating to crop production and natural resource
management, and give it the flexibility to use 20 percent of resources for innovative components. Therevised MMA scheme has formula-based allocationcriteria and provides assistance in the form of grants:loan to the states/UTs on 90:10 ratio basis, exceptin case of the north-eastern states where the centralshare is 100 per cent grant. Out of the total outlayfor the Eleventh Plan, i.e. ̀ 5,500 crore, funds to thetune of ̀ 3,845 crore have been utilized/released tothe states/UTs during the first four years of the Planperiod. An outlay of ̀ 780 crore has been approvedfor 2011-12, out of which an amount of ̀ 772 crorehas been released to states till 21 February 2012.
Rashtriya Krishi Vikas Yojana (RKVY)8.39 The RKVY was launched in 2007-08 with anoutlay of ` 25,000 crore in the Eleventh Plan forincentivizing states to enhance public investment toachieve 4 per cent growth rate in agriculture andallied sectors during the Eleventh Five Year Planperiod. The states have been provided ̀ 14,598.31crore under the RKVY during 2007-08 to 2010-11.Allocation under the RKVY for the current year is` 7,810.87 crore.
8.40 The RKVY format permits taking up nationalpriorities as sub-schemes, allowing the statesflexibility in project selection and implementation.The sub-schemes include Bringing Green Revolutionto Eastern Region; Integrated Development of 60,000Pulses Villages in Rainfed Areas; Promotion of OilPalm; Initiative on Vegetable Clusters; Nutri-cereals;National Mission for Protein Supplements;Accelerated Fodder Development Programme;Rainfed Area Development Programme; and SaffronMission. The RKVY links 50 per cent of centralassistance to those states that have stepped uppercentage of State Plan expenditure on agricultureand allied sectors. States have indeed increasedallocation to agriculture and allied sectors from 4.88per cent of total State Plan expenditure in 2006-07to 6.04 per cent of in 2010-11 (Revised Estimates—RE).
Integrated Scheme of Oilseeds, Pulses, OilPalm, and Maize (ISOPOM)8.41 Oilseeds are raised mostly under rainfedconditions and are important for the livelihood of smalland marginal farmers in the arid and semi-arid areasof the country. The centrally sponsored ISOPOMhave been under implementation during the EleventhPlan in 14 states for oilseeds and pulses, 15 formaize, and 9 for oil palm. The pulses component
http://indiabudget.nic.in

191Agriculture and Food
has been merged with the NFSM with effect from 1April 2010.
National Mission for Sustainable Agriculture(NMSA)8.42 The NMSA aims at enhancing food securityand protection of resources such as land, water,biodiversity, and genetic resources by developingstrategies to make Indian agriculture more resilientto climate change. The Prime Minister’s Council onClimate Change has approved the Mission inSeptember 2010 and the Ministry of Agriculture hasinitiated activities under this Mission during thecurrent financial year (Box 8.2).
Extension Services8.43 The Support to State Extension Programmesfor Extension Reforms Scheme was launched in2005-06, aiming at making the extension systemfarmer driven as well as accountable to farmers byproviding for new institutional arrangements fortechnology dissemination. This has been donethrough setting up of Agricultural TechnologyManagement Agencies (ATMA) at district level tooperationalize the extension reforms. The ATMA hasactive participation of farmers/farmer groups, non-government organizations (NGOs) and otherstakeholders operating at district level and below.Gender concerns are being mainstreamed bymandating that 30 per cent of resources onprogrammes and activities are utilized by womenfarmers and women extension functionaries. Sinceinception, 1.70 crore farmers of which 25 per centare women farmers, have been benefited under variousextension activities.
8.44 Certain other schemes which supportagriculture sector are mass media support toagriculture focusing on Doordarshan infrastructureand All India Radio (AIR) broadcasting agriculture-related information; kisan call centres to provideagricultural information to the farming communitythrough toll free telephone lines; agri-clinic and agri-business centres by agriculture graduates to provideextension services to farmers on payment basisthrough setting up of economically viable self–employment ventures, and information disseminationthrough agri fairs. Further, extension educationinstitutes at Nilokher (Haryana), Rajendra Nagar,(Andhra Pradesh), Anand (Gujarat), and Jorhat(Assam) are operating at regional level to improvethe skills and professional competence of extensionfield functionaries of agriculture and allieddepartments. In addition, there are model trainingcourses on thrust areas of agriculture, horticulture,animal husbandry, and fisheries with the objective ofimproving the professional competence, upgradingthe knowledge, and developing technical skills ofsubject matter specialists/extension workers ofagriculture and allied departments. MANAGE,Hyderabad, an apex Institute at the national level,provides training to middle and senior level officersof agriculture and allied departments of the states/UTs.
National Horticulture Mission (NHM)8.45 The horticulture sector includes a wide rangeof crops, such as fruits, vegetables, roots and tubercrops, flowers, aromatic and medicinal plants, spices,and plantation crops, which facilitate diversificationin agriculture. It has been recognized that growinghorticulture crops is now an ideal option to improve
Box 8.2 : Impacts of Climate Change on Indian AgricultureIndian agriculture, with two-third rainfed area remains vulnerable to various vagaries of monsoon, besides facing occurrenceof drought and flood in many parts of the country. Natural calamities such as drought and flood occur frequently in manyparts of the country. Climate change will aggravate these risks and may considerably affect food security through directand indirect effects on crops, soils, livestock, fisheries, and pests. Building climate resilience, therefore, is critical. Potentialadaptation strategies to deal with the adverse impacts of climate change are developing cultivars tolerant to heat,moisture, and salinity stresses; modifying crop management practices; improving water management; adopting new farmpractices such as resource-conserving technologies; crop diversification; improving pest management; making availabletimely weather-based advisories; crop insurance; and harnessing the indigenous technical knowledge of farmers.
The Indian Council of Agricultural Research has initiated a scheme on National Initiative on Climate Resilient Agriculturewith an outlay of ̀ 350 crore for 2010-12. This initiative has been planned as a multi-disciplinary, multi-institutional effortcovering crops, livestock, and fisheries and focusing mainly on adaptation and mitigation of climate change in agriculture.It also has a component for demonstration of climate-coping technologies on farmers’ fields in 100 most vulnerabledistricts. State-of-the-art infrastructure is being set up at key research institutes to undertake frontier research on climatechange adaptation and mitigation.
http://indiabudget.nic.in

192 Economic Survey 2011-12
livelihood security, enhance employment generation,attain food and nutritional security, and increaseincome through value addition. Over the years, therehave been noticeable achievements and significantimprovement in the production and productivity ofvarious horticulture crops.
8.46 The NHM scheme was launched during theTenth Plan for holistic development of the horticulturesector, duly ensuring forward and backward linkagesby adopting a cluster approach, with the activeparticipation of all the stakeholders. At present 372districts in 18 States and 3 UTs have been coveredunder the NHM. The supply of quality planting materialthrough establishment of nurseries and tissue cultureunits, production and productivity improvementprogrammes through area expansion andrejuvenation, technology promotion, technologydissemination, human resource development,creation of infrastructure for post-harvest managementand marketing in consonance with the comparativeadvantages of each state/region and their diverseagro-climatic conditions are the major programmesof the Mission. A major initiative has been takenduring 2011-12 for enhancing the supply of goodquality vegetables to metro cities under the VegetableInitiative in Urban Clusters.
National Bamboo Mission (NBM)8.47 The NBM, a centrally sponsored scheme ofthe Ministry of Agriculture for harnessing the potentialof the bamboo crop in the country, is underimplementation in 27 states with a total outlay of `568.23 crore. The Mission envisages promotingholistic growth of the bamboo sector by adopting anarea-based, regionally differentiated strategy toincrease the area under bamboo cultivation andmarketing. Under the Mission, steps have been takento increase the availability of quality planting materialby supporting the setting up of new nurseries/tissueculture units and strengthening existing ones. Toaddress forward integration, the Mission is takingsteps to strengthen marketing of bamboo products,especially those of handicraft items. During 2011-12, 9,349 ha of forest and 5,526 ha of non-forestarea has so far been covered under bamboo plantationand 1,074 ha of existing bamboo plantation has beenimproved for higher productivity. Since the inceptionof the Mission, 1,89,466 ha has been covered withbamboo plantation. Besides the Mission has providedfinancial assistance to different institutions/universities for twenty-three R&D projects aimed athigher productivity of bamboo. Agro-forestry trials
comprising bamboo grown along with agricultural/horticultural crops and medicinal plants under differentagro-climatic conditions in various states have beeninitiated.
ANIMAL HUSBANDRY, DAIRYING,AND FISHERIES
8.48 The Eleventh Five Year Plan envisages overallgrowth of 6-7 per cent per annum for the sector. In2010-11, this sector contributed 121.84 million tonnesof milk, 63.02 billion eggs, 42.99 million kg wool,and 4.83 million tonnes of meat. The EighteenthLivestock Census (2007) has placed total livestockpopulation at 529.7 million and total of poultry birdsat 648.8 million.
Dairy Sector8.49 India ranks first in the world in milk production,which went up from 17 million tonnes in 1950-51 to121.84 million tonnes in 2010-11. The per capitaavailability of milk has also increased from 112 gramsper day in 1968-69 to 281 grams in 2010-11. However,world average per capita availability was 284 gramsper day in 2009-10 compared to 273 grams per dayfor India.
8.50 The Indian dairy sector acquired substantialgrowth momentum from the Ninth Plan onwards,achieving an annual output of 121.84 million tonnesof milk during 2010-11 (Table 8.10). This representssustained growth in the availability of milk and milkproducts for the growing population of the country.Dairying has become an important secondary sourceof income for millions of rural families and hasassumed an important role in providing employmentand income-generating opportunities.
Table 8.10 : Production and Per CapitaAvailability of MilkYear Per capita Production
availability (million tonnes)(grams/day)
1990-91 176 53.92000-01 217 80.62005-06 241 97.12006-07 251 102.62007-08 260 107.92008-09 266 112.22009-10 273 116.42010-11# 281 121.8
Source : Department of Animal Husbandry, Dairyingand Fisheries.Note : # : Provisional
http://indiabudget.nic.in

193Agriculture and Food
8.51 The Ministry of Agriculture is implementingimportant schemes, namely the Intensive DairyDevelopment Programme, StrengtheningInfrastructure for Quality and Clean Milk Production,and Assistance to Cooperative and DairyEntrepreneurship Development Scheme, in the dairysector. A major programme for genetic improvementcalled the National Project for Cattle and BuffaloBreeding (NPCBB) was also launched in 2000. TheNPCBB envisaged genetic upgradation anddevelopment of indigenous breeds on priority basis.
8.52 A centrally sponsored scheme for livestockinsurance is being implemented in all the states withthe twin objectives of providing protection mechanismto farmers and cattle rearers against any eventualloss of their animals due to death and to demonstratethe benefit of the insurance of livestock and popularizeit with the ultimate goal of attaining qualitativeimprovement in livestock and its products. Thescheme benefits farmers and cattle rearers withindigenous/cross-bred milch cattle and buffaloes in300 selected districts. The benefit of subsidy is tobe restricted to two animals per beneficiary perhousehold. During 2010-11, 8.16 lakh animals(indigenous crossbreed milch cattle and buffalo) wereinsured against the target of 6.55 lakh. In 2011-12,` 30.99 crore had been released up to December2011 and 29.10 lakh animals were insured from 2006-07 to 2010-11.
Poultry8.53 The poultry sector encompasses a range offarming systems from highly industrialized andexport-oriented at one end to backyard, small andmarginal model (or systems), addressing livelihoodissues at the other end. The per capita availability isaround 53 eggs per year in the year 2010-11. Exportsof poultry products were around ̀ 372 crore in 2009-10 as per the Agricultural and Processed FoodProducts Export Development Authority (APEDA).
8.54 Four regional Central Poultry DevelopmentOrganizations located at Chandigarh, Bhubaneswar,Mumbai, and Hessarghatta are focusing onproduction of stocks suitable for backyard rearing,training to the farmers to upgrade their technicalskills. The Central Poultry Performance TestingCentre gives valuable information relating to differentgenetic stock available in the country. The “PoultryDevelopment” scheme comprising threecomponents, namely Assistance to State PoultryFarms, Rural Backyard Poultry Development, andPoultry Estates, is being implemented. Further, in
order to encourage entrepreneurship skills ofindividuals, a central-sector ‘Poultry Venture CapitalFund’ Scheme is also being implemented on capitalsubsidy mode since 1 April 2011, covering variouspoultry activities.
Livestock health8.55 Animal wealth in India has increased manifoldprompting the animal husbandry sector to adoptskilled practices. With increased trade activity andextensive cross-breeding programmes, the chancesof ingress of exotic diseases into the country haveincreased. To ensure disease-free status and becompatible with the standards laid down by the WorldAnimal Health Organization, many animal healthschemes have been initiated. The Government ofIndia provides financial assistance to states/UTs tocontrol major livestock diseases and strengthenveterinary services including reporting of animaldiseases through various centrally sponsoredschemes. Major achievements include carrying out81 million vaccinations and maintaining the country’sRinderpest-free and contagious bovine pleuro-pneumonia-free status.
8.56 The Ministry of Agriculture is alsoimplementing a World Bank- assisted project on‘Preparedness, Control and Containment of AvianInfluenza’ which envisages surveillance, capacitybuilding in terms of training and laboratoryinfrastructure, and logistical support for undertakingcontrol and containment measures at the time ofoutbreaks. All avian influenza outbreaks reported inthe country have been effectively controlled. The lastoutbreak was reported in February, 2012 in Odishawhere Control & Containment operations are beingcarried out. In the last five occurrences of avianinfluenza in the country, the disease has beenbrought under control within 10 to 15 days’ timethrough a robust Action Plan for Prevention, Controland Containment of the disease.
Fisheries8.57 The fisheries sector contributed 0.7 per centof total GDP at factor cost and 5.0 per cent of GDPat factor cost from agriculture, forestry, and fishingin the year 2010-11 (QE). Fish production increasedfrom 3.8 million tonnes in 1990-91 to 8.29 milliontonnes in 2010-11 (Table 8.11). Fishing, aquaculture,and allied activities are reported to have providedlivelihood to over 14 million people in 2010-11, apartfrom being a major foreign exchange earner.
http://indiabudget.nic.in

194 Economic Survey 2011-12
Feed and fodder8.58 Adequate availability of feed and fodder forlivestock is very vital for increasing milk productionand sustaining the ongoing genetic improvementprogramme. Green fodder shortage in the country isestimated at about 34 per cent. The Ministry ofAgriculture has been implementing a modifiedcentrally sponsored Fodder and Feed DevelopmentScheme since 2010 to supplement the efforts of thestates to improve fodder production. Under theCentral Minikit Testing Programme, fodder seedminikits of high-yielding fodder varieties aredistributed free of cost to farmers. During the currentyear (2011-12), 12.67 lakh fodder seed minikits havebeen allotted to states for distribution.
CREDIT AND INSURANCE
Agricultural Credit8.59 Agricultural credit plays an important role inimproving agricultural production and productivity andmitigating distress of farmers. Government has takenseveral measures for improving agricultural credit flowand bringing down the rate of interest on farm loans.Important achievements/ initiatives taken by thegovernment in recent years are the following.
(i) The flow of agricultural credit since 2003-04 has consistently exceeded the target.In the year 2010-11 the achievement was119 per cent of target. The target of creditflow for the year 2011-12 has been fixed at` 4,75,000 crore and achievement as onNovember 2011 is ̀ 2,94,023 crore.
(ii) Farmers have been receiving crop loansup to a principal amount of ` 3 lakh at 7per cent rate of interest since 2006-07. In2009-10, government provided an additional1 per cent interest subvention to thosefarmers who repaid their short-term croploans as per schedule. This subventionwas raised to 2 per cent in 2010-11 andfurther to 3 per cent in 2011-12. Thus theeffective rate of interest for such farmerswill be 4 per cent per annum.
(iii) Initiative has been taken to provide kisancredit cards (KCC) to all eligible and willingfarmers in a time-bound manner. Thescheme includes reasonable componentsof consumption credit and investmentcredit within the overall credit limit toprovide adequate and timely credit supportto farmers for their cultivation needs. About10.78 crore KCCs had been issued up toOctober 2011.
(v) The government is implementing a revivalpackage for Short-term Rural CooperativeCredit Structure involving financial outlayof ` 13,596 crore. Twenty-five stategovernments have signed a memorandumof understanding with the Government ofIndia and the National Bank for Agricultureand Rural Development (NABARD). Thiscovers 96 per cent of the primaryagricultural cooperative societies (PACS)and 96 per cent of the central cooperativebanks in the country. As of November 2011,an amount of ` 9,002.98 crore had beenreleased by NABARD as Government of
Table 8.11 : Production and Export of FishFish production (million tonnes) Export of marine products
Year Marine Inland Total Qty Value(‘000 tonnes) (` ` ` ` ` crore)
1990-91 2.3 1.5 3.8 140 8932000-01 2.8 2.8 5.6 503 6,2882003-04 3.0 3.4 6.4 412 6,0872004-05 2.8 3.5 6.3 482 6,4602005-06 2.8 3.8 6.6 551 7,0192006-07 3.0 3.8 6.8 612 8,3632007-08 2.9 4.2 7.1 541 7,6202008-09 3.0 4.6 7.6 602 8,6082009-10 3.1 4.8 7.9 678 10,0482010-11 3.2 5.1 8.3 813 12,901
Source : Department of Animal Husbandry, Dairying and Fisheries.
http://indiabudget.nic.in
195Agriculture and Food
India share for recapitalization of 53,205eligible PACS in seventeen states.
Agricultural Insurance8.60 There are various major crop insuranceschemes under implementation in the country.
i) National Agricultural Insurance Scheme(NAIS)The NAIS is a government-sponsored central-sectorcrop insurance scheme being implemented in thecountry since 1999-2000 season with the objectiveof providing financial support to farmers in the eventof failure of crops as a result of natural calamities,pests, and diseases. The Agriculture InsuranceCompany of India Ltd. is the implementing agencyfor the Scheme. At present, the scheme is beingimplemented by 25 states and two UTs. Claims tothe tune of about ` 22142 crore have been paidagainst the premium income of about ̀ 6593 crorebenefiting about 487 lakh farmers.
During the last 23 crop seasons, i.e. from rabi 1999-2000 to rabi 2010-11, 1,762 lakh farmers over anarea of about 2,685 lakh ha have been covered,insuring a sum amounting to about ̀ 2,21,307 crore.
ii) Modified NAIS (MNAIS)With the aim of further improving crop insuranceschemes, the MNAIS is under implementation onpilot basis in 50 districts in the country from rabi2010-11 season. Some of the major improvementsmade in the MNAIS are actuarial premium withsubsidy in premium at different rates, all claimsliability to be on the insurer, unit area of insurancereduced to village panchayat level for major crops,indemnity for prevented/sowing/planting risk and forpost-harvest losses due to cyclone, on accountpayment up to 25 per cent advance of likely claimsas immediate relief, more proficient basis forcalculation of threshold yield, and allowing private-sector insurers with adequate infrastructure. Onlyupfront premium subsidy is shared by the centraland state governments on 50: 50 basis and claimsare the liability of the insurance companies. Thescheme has been notified by 17 states in a total of50 districts for rabi 2011-12 season. During rabi 2010-11, about 3.58 lakh farmers over an area of about3.23 lakh hectares have been covered, insuring asum amounting to ` 69,406 lakh. The claimsamounting to ` 15.96 crore have been provided to46,224 farmers. 4.89 lakh farmers have been coveredover an area of 7.18 lakh ha insuring a sum amountingto ` 1,47,074 lakh
iii) Pilot Weather Based Crop InsuranceScheme (WBCIS)Similarly, the WBCIS is also being implemented asa central-sector scheme from kharif 2007 season.The scheme is intended to provide insuranceprotection to farmers against adverse weatherincidence, such as deficit and excess rainfall, highor low temperature, and humidity that are deemedto adversely impact crop production. The WBCIS isbased on actuarial rates of premium but to makethe scheme attractive, premium actually chargedfrom farmers has been restricted to be on a par withthe NAIS. From kharif 2007-08 to kharif 2010-11,195.33 lakh farmers over an area of about 278 lakhha with sum insured of about ` 31,953 crore havebeen covered under the scheme. Claims to the tuneof about ` 991 crore have been paid against thepremium of about ` 2868 crore. Detailed fundrequirements as estimated by the implementingagency for these schemes for the year 2012-13 areto the tune of ̀ 2,200 crore.
AGRICULTURAL MARKETING
8.61 The role of the agriculture market is to deliveragricultural produce from the farmer to the consumerin the most efficient way. Agriculture markets areregulated in India through the APMC Acts. Accordingto the provisions of the APMC Acts of the states,every APMC is authorized to collect market feesfrom the buyers/traders in the prescribed manner onthe sale of notified agricultural produce. The relativelyhigh incidence of commission charges on agricultural/horticultural produce renders their marketing costhigh, which is an undesirable outcome. All thissuggests that a single point market fee system isnecessary for facilitating free movement of produce,bringing price stabilization, and reducing pricedifferences between the producer and consumermarket segments. Another point to be highlighted isthat the cleaning, grading, and packaging ofagricultural produce before sale by the farmers havenot been popularized by these market committeeson a sufficient scale.
8.62 Nevertheless, there have been someachievements in leading states like Maharashtra,Karnataka, Andhra Pradesh and Gujarat since theModel APMC Act 2003 has been implimented in thosestates. Some state governments have grantedlicences to the private sector for setting up of marketsand direct purchase from the farmers in order toprovide alternative marketing channels. There is
http://indiabudget.nic.in

196 Economic Survey 2011-12
considerable potential for agricultural markets to becompetitive. As the APMC was created to protectthe interests of farmers it will be in the fitness ofthings to give farmers the choice of going to theAPMC or not. In the light of this, the need is to pursuefurther reforms in the state APMC Acts.
FOOD MANAGEMENT
8.63 The main objectives of food management areprocurement of foodgrains from farmers atremunerative prices, distribution of foodgrains toconsumers, particularly the vulnerable sections ofsociety, at affordable prices, and maintenance of foodbuffers for food security and price stability. Theinstruments at the disposal of the government arethe MSP and central issue price (CIP). The nodalagency which undertakes procurement, distribution,and storage of foodgrains is the Food Corporation ofIndia (FCI). Procurement at MSP is open-ended,while distribution is governed by the scale of allocationand its offtake by beneficiaries. The offtake offoodgrains is primarily under the targeted publicdistribution system (TPDS) and other welfareschemes of the Government of India.
Procurement and Offtake of Foodgrains8.64 During rabi marketing season (RMS) 2011-12, 28.35 million tonnes of wheat was procuredagainst 22.52 million tonnes in 2010-11. In kharifmarketing season (KMS) 2011-12, as on 1 November2011, the total procurement of rice was 8.5 million
tonnes as against 7.68 million tonnes in thecorresponding period of the previous year.Procurement of coarse grains in 2010-11 was 1.28lakh tonnes as compared to 4.07 lakh tonnes in 2009-10. Procurement of foodgrains is mainly from stateslike Punjab, Haryana, Uttar Pradesh, MadhyaPradesh, Andhra Pradesh, and Chhattisgarh.Increased MSP along with various other steps takenby the government has resulted in higher levels ofprocurement. This has paved the way for comfortablelevels of food stocks to meet TPDS needs and bufferstock norms. Offtake of wheat and rice from thecentral pool for the TPDS and other welfare schemeshas also gone up in the recent years (Table 8.12).This poses a challenge to FCI operations given theshortage of storage capacity. Initiatives taken by thegovernment to augment storage capacity is given inBox 8.3.
Decentralized Procurement Scheme8.65 A number of states have opted forimplementation of the Decentralized ProcurementScheme (DCP) introduced in 1997, under whichfoodgrains are procured and distributed by the stategovernments themselves. Under this scheme, thedesignated states, procure, store, and issuefoodgrains under the TPDS and welfare schemes ofthe Government of India. The difference between theeconomic cost fixed for the state and the CIP ispassed on to the state government as subsidy. Thedecentralized system of procurement has theobjectives of covering more farmers under MSP
Table 8.12 : Procurement and Offtake of Wheat and Rice (million tonnes)
2007-08 2008-09 2009-10 2010-11 2011-12
ProcurementRice 28.8 34.1 32.03 34.2 18.1*Wheat 11.1 22.7 25.4 22.5 28.3Total 39.9 56.8 57.4 56.7 46.4
Offtake from the central pool
2007-08 2008-09 2009-10 2009-10 2010-11(Up to
Dec. 2011)Rice 25.23 24.62 27.37 29.93 24.18
Wheat 12.20 14.87 22.34 23.07 17.80
Total 37.43 39.49 49.71 52.00 41.98
Source : Department of Food and Pubic Distribution.Note : Figures of procurement of wheat and rice are marketing season-wise, while the figures of offtake arefinancial year-wise. *- As on 10.01.2012.
http://indiabudget.nic.in
197Agriculture and Food
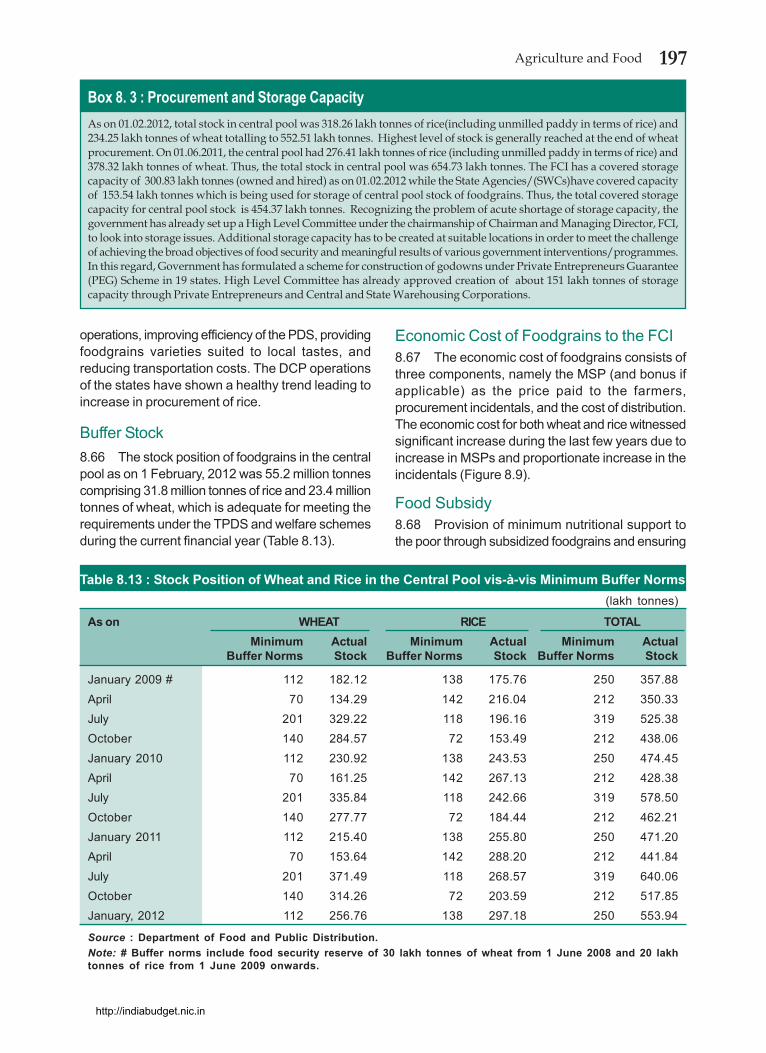
Box 8. 3 : Procurement and Storage CapacityAs on 01.02.2012, total stock in central pool was 318.26 lakh tonnes of rice(including unmilled paddy in terms of rice) and234.25 lakh tonnes of wheat totalling to 552.51 lakh tonnes. Highest level of stock is generally reached at the end of wheatprocurement. On 01.06.2011, the central pool had 276.41 lakh tonnes of rice (including unmilled paddy in terms of rice) and378.32 lakh tonnes of wheat. Thus, the total stock in central pool was 654.73 lakh tonnes. The FCI has a covered storagecapacity of 300.83 lakh tonnes (owned and hired) as on 01.02.2012 while the State Agencies/(SWCs)have covered capacityof 153.54 lakh tonnes which is being used for storage of central pool stock of foodgrains. Thus, the total covered storagecapacity for central pool stock is 454.37 lakh tonnes. Recognizing the problem of acute shortage of storage capacity, thegovernment has already set up a High Level Committee under the chairmanship of Chairman and Managing Director, FCI,to look into storage issues. Additional storage capacity has to be created at suitable locations in order to meet the challengeof achieving the broad objectives of food security and meaningful results of various government interventions/programmes.In this regard, Government has formulated a scheme for construction of godowns under Private Entrepreneurs Guarantee(PEG) Scheme in 19 states. High Level Committee has already approved creation of about 151 lakh tonnes of storagecapacity through Private Entrepreneurs and Central and State Warehousing Corporations.
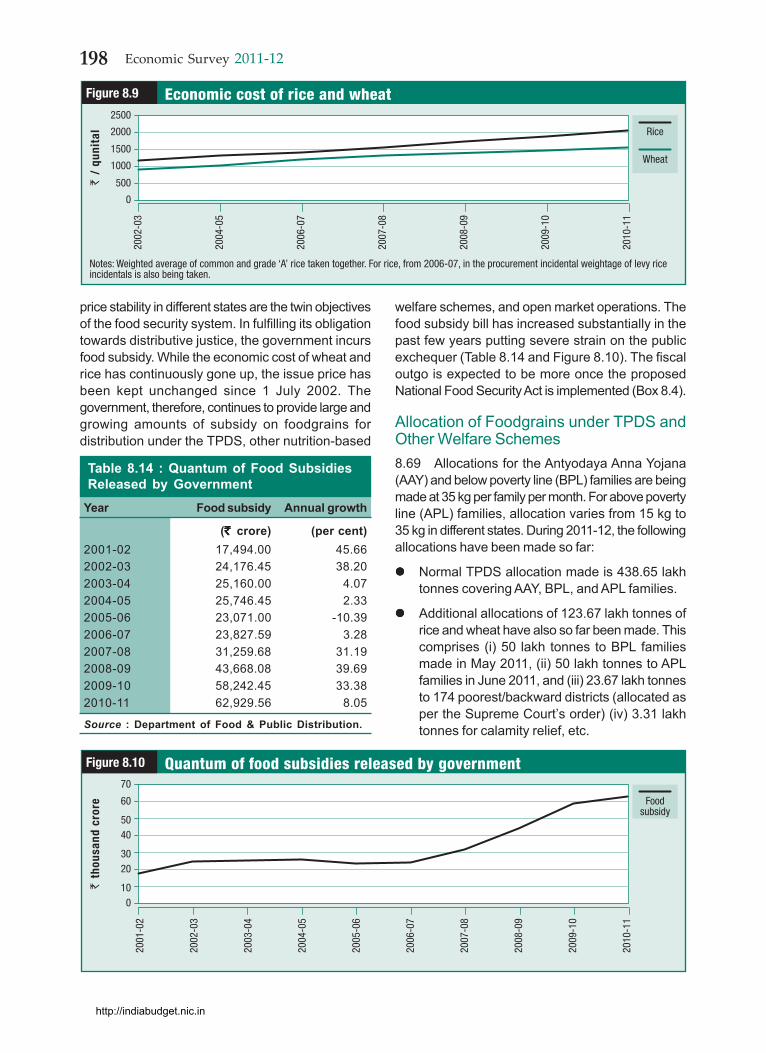
operations, improving efficiency of the PDS, providingfoodgrains varieties suited to local tastes, andreducing transportation costs. The DCP operationsof the states have shown a healthy trend leading toincrease in procurement of rice.
Buffer Stock8.66 The stock position of foodgrains in the centralpool as on 1 February, 2012 was 55.2 million tonnescomprising 31.8 million tonnes of rice and 23.4 milliontonnes of wheat, which is adequate for meeting therequirements under the TPDS and welfare schemesduring the current financial year (Table 8.13).
Economic Cost of Foodgrains to the FCI8.67 The economic cost of foodgrains consists ofthree components, namely the MSP (and bonus ifapplicable) as the price paid to the farmers,procurement incidentals, and the cost of distribution.The economic cost for both wheat and rice witnessedsignificant increase during the last few years due toincrease in MSPs and proportionate increase in theincidentals (Figure 8.9).
Food Subsidy8.68 Provision of minimum nutritional support tothe poor through subsidized foodgrains and ensuring
Table 8.13 : Stock Position of Wheat and Rice in the Central Pool vis-à-vis Minimum Buffer Norms(lakh tonnes)
As on WHEAT RICE TOTALMinimum Actual Minimum Actual Minimum Actual
Buffer Norms Stock Buffer Norms Stock Buffer Norms Stock
January 2009 # 112 182.12 138 175.76 250 357.88April 70 134.29 142 216.04 212 350.33July 201 329.22 118 196.16 319 525.38October 140 284.57 72 153.49 212 438.06January 2010 112 230.92 138 243.53 250 474.45April 70 161.25 142 267.13 212 428.38July 201 335.84 118 242.66 319 578.50October 140 277.77 72 184.44 212 462.21January 2011 112 215.40 138 255.80 250 471.20April 70 153.64 142 288.20 212 441.84July 201 371.49 118 268.57 319 640.06October 140 314.26 72 203.59 212 517.85January, 2012 112 256.76 138 297.18 250 553.94
Source : Department of Food and Public Distribution.Note: # Buffer norms include food security reserve of 30 lakh tonnes of wheat from 1 June 2008 and 20 lakhtonnes of rice from 1 June 2009 onwards.
http://indiabudget.nic.in
198 Economic Survey 2011-12
price stability in different states are the twin objectivesof the food security system. In fulfilling its obligationtowards distributive justice, the government incursfood subsidy. While the economic cost of wheat andrice has continuously gone up, the issue price hasbeen kept unchanged since 1 July 2002. Thegovernment, therefore, continues to provide large andgrowing amounts of subsidy on foodgrains fordistribution under the TPDS, other nutrition-based
welfare schemes, and open market operations. Thefood subsidy bill has increased substantially in thepast few years putting severe strain on the publicexchequer (Table 8.14 and Figure 8.10). The fiscaloutgo is expected to be more once the proposedNational Food Security Act is implemented (Box 8.4).
Allocation of Foodgrains under TPDS andOther Welfare Schemes8.69 Allocations for the Antyodaya Anna Yojana(AAY) and below poverty line (BPL) families are beingmade at 35 kg per family per month. For above povertyline (APL) families, allocation varies from 15 kg to35 kg in different states. During 2011-12, the followingallocations have been made so far:
Normal TPDS allocation made is 438.65 lakhtonnes covering AAY, BPL, and APL families.
Additional allocations of 123.67 lakh tonnes ofrice and wheat have also so far been made. Thiscomprises (i) 50 lakh tonnes to BPL familiesmade in May 2011, (ii) 50 lakh tonnes to APLfamilies in June 2011, and (iii) 23.67 lakh tonnesto 174 poorest/backward districts (allocated asper the Supreme Court’s order) (iv) 3.31 lakhtonnes for calamity relief, etc.
0
Rice
Economic cost of rice and wheat
1000
2000
Figure 8.9��
/ qu
nita
l
2002
-03
2004
-05
2006
-07
2007
-08
2008
-09
2009
-10
2010
-11
500
1500
2500
Wheat
Notes: Weighted average of common and grade ‘A’ rice taken together. For rice, from 2006-07, in the procurement incidental weightage of levy riceincidentals is also being taken.
Table 8.14 : Quantum of Food SubsidiesReleased by Government
Year Food subsidy Annual growth
(` ` ` ` ` crore) (per cent)2001-02 17,494.00 45.662002-03 24,176.45 38.202003-04 25,160.00 4.072004-05 25,746.45 2.332005-06 23,071.00 -10.392006-07 23,827.59 3.282007-08 31,259.68 31.192008-09 43,668.08 39.692009-10 58,242.45 33.382010-11 62,929.56 8.05
Source : Department of Food & Public Distribution.
0
Foodsubsidy
Quantum of food subsidies released by government
20
40
60
Figure 8.10
��th
ousa
nd c
rore
70
10
30
50
2001
-02
2002
-03
2003
-04
2004
-05
2005
-06
2006
-07
2007
-08
2008
-09
2009
-10
2010
-11
http://indiabudget.nic.in
199Agriculture and Food
49.05 lakh tonnes allocated for other welfareschemes such as the Midday Meals Scheme,Wheat Based Nutrition Programme under theIntegrated Child Development Services,Annapurna, etc.
Total release of foodgrains during the current yearso far has been 614.69 lakh tonnes.
Open Market Sale Scheme (Domestic)[OMSS (D)]8.70 In addition to maintaining buffer stocks andproviding foodgrain stocks for meeting therequirements of the TPDS and other welfareschemes, the FCI on behalf of the Government ofIndia has been undertaking sale of wheat and rice atpredetermined prices in the open market from timeto time to enhance market supply of foodgrains tohave a moderating influence on open market prices.
COMMODITY FUTURES MARKET
8.71 The commodity futures market facilitates theprice discovery process and provides a platform forprice risk management in commodities. Currently,113 commodities are notified for futures trading ofwhich 50 are actively traded in five national and 16commodity specific exchanges. Agriculturalcommodities, bullion, energy, and base metalproducts account for a large share of the commoditiestraded in the commodity futures market. The totalvalue of trade in the commodity futures market rosesignificantly in 2011 compared to that of the previousyear due to increased awareness, the advent of newcommodity exchanges, increase in globalcommodity prices, and improved regulation.
8.72 During the year 2011-12 (up to January 2012),in value terms bullion accounted for the maximumshare of traded value among the commodity groups(57.7 per cent) followed by energy (15.9 per cent),metals (15.2 per cent), and agricultural commodities(11.2 per cent). However, in quantity terms, tradein energy accounted for 57.5 per cent followed byagricultural commodities (33.2 per cent), metals (9.3per cent), and bullion (0.1 per cent) (Table 8.15).
8.73 To strengthen and broad base the market,the Forward Markets Commission (FMC), which isthe regulator for commodity futures trading underthe provisions of the Forward Contracts (Regulation)Act 1952, has taken many initiatives and conductedawareness programmes during 2011 such as amedia campaign under the Jago Grahak JagoProgramme about the Dos and Don’ts of trading inthe commodity futures market; Police trainingprogrammes in the states of Madhya Pradesh,Chhattisgarh, Tamil Nadu, and Delhi with regard todabba trading/ illegal trading; a massive awarenessand capacity-building programme for variousstakeholder groups, with primary focus on farmers.On the regulatory front, the FMC undertookmeasures for the development of the commodityfutures market which include ensuring moreeffective inspection of members of the exchangeson regular basis and in a comprehensive mannercovering all aspects of regulatory regime; bringingout a guidance manual for improving audit practices,prescribing penalty structure for client codemodification and for executing trade; and grantingexemptions for short hedge for soyabean / oilfutures, issuing directives for segregation of clientaccounts.
BOX 8.4: National Food Security BillThe National Food Security Bill was introduced in the Lok Sabha on 22 December 2011. As per the provisions of the Bill, itis proposed to provide 7 kg. of foodgrains per person per month belonging to priority households at prices not exceeding` 3 per kg of rice, ` 2 per kg of wheat, and ` 1 per kg of coarse grains and to general households not less than 3 kg offoodgrains per person per month at prices not exceeding 50 per cent of the MSP for wheat and coarse grains and derivedMSP for rice. It will benefit up to 75 per cent of rural population (with at least 46 per cent belonging to priority households)and up to 50 per cent of urban population (with at least 28 per cent belonging to priority households), besides providingnutritional support to women and children and meals to special groups such as destitute and homeless, emergency anddisaster affected, and persons living in starvation. Pregnant and lactating women will also be entitled to maternity benefitof ̀ 1,000/per month for six months. In case of non-supply of foodgrains or meals, entitled persons will be provided foodsecurity allowance by the concerned state/UT governments. Provisions for reforms in the TPDS such as doorstep deliveryof foodgrains , application of information and communication technology (ICT) including end to end computerization,leveraging ‘aadhaar’ for unique identification of beneficiaries have also been made in the Bill. Provisions have also beenmade for transparency and accountability including disclosure of records relating to the PDS, social audits, and setting upof vigilance committees besides an elaborate grievance redressal mechanism.
http://indiabudget.nic.in

200 Economic Survey 2011-12
OUTLOOK AND CHALLENGES
8.74 Agriculture and allied sectors have madesubstantial progress in terms of production andproductivity since the beginning of the Planningprocess. The successive Five Year Plans haveemphasized growth in the agriculture sector, as aresult of which foodgrains production reached arecord level of 244.78 million tonnes in 2010-11.However, the challenges are far from over. Agriculturalgrowth in the current Five Year Plan is expected tobe less than the target. A number of supply-sideconstraints exist and thereby achieving the food andnutritional security is a challenge. In order to make4 per cent agricultural growth a reality, adequateefforts are required to focus on addressing thechallenges in this sector.
8.75 The area under foodgrains has declined in thelast three decades. This calls for speedyimprovement in yield in order to increase productionthrough adequate investment in research anddevelopment. In yield parameters, India is laggingbehind global levels in most crops. With very littlegrowth in area and marginal growth in yields of manycrops during the last decade, increasing agriculturalproduction remains a challenge. A holistic approach,spanning agricultural R&D, dissemination oftechnology, and provision of agricultural inputs suchas quality seed, fertilizers, pesticides, and irrigation,would help achieve higher levels of productivity.Access of small and marginal farmers to formalsources of agricultural credit is still inadequate,though the flow of agricultural credit has increased
in the recent past. Effective coordination andmonitoring of ongoing agriculture and allied sectorsprogrammes need to be ensured for optimum results.
8.76 Indian farmers are mostly small and marginalfarmers with small and fragmented landholdings. Theaverage farm size in the country has declined overthe years. This poses a challenge in terms of adoptionof farm mechanization as well as generatingproductive income from farm operation. Pooling ofmany landholdings may yield better economies ofscale, for which land laws for leasing with sufficientsafeguards in place should be considered.
8.77 Higher levels of purchasing power is supportinghigher demand for protein rich food items. Thecountry has to step up efforts for increasingproduction of milk and other dairy products, egg,poultry, fish, meat, etc. There have been increasesin the prices of these items because supply has notkept pace with demand.
8.78 Declining per capita availability of foodgrainshas been a matter of major concern. For ensuringnutritional security, it is not only important to increaseper capita availability of foodgrains but also to ensurethat right quantities of food items are there in thefood basket of the common man. A thrust onhorticulture products is required for enhancing percapita availability of food items as well as ensuringnutritional security.
8.79 Indian agriculture is still dependent on themonsoon. This adds to the risks a farmer faces.The dependency of the Indian farmer on the monsoon
Table 8.15 Trade in Commodity Futures Market(Volume of trading in lakh tonnes, value ` in crore)
Commodity 2009-10 2010-11 2011-12 (up to Jan’12)Volume Value Volume Value Volume Value
Agricultural 3991.21(39.3) 1217949(15.7) 4168(32.6) 1456390(12.2) 3878.45(33.2) 1695550.8 (11.2)commodities
Bullion 4.73(0.05) 3164152(40.8) 7.38(0.1) 5493892(46.0) 8.86(0.1) 8758384.3 (57.7)
Metals 982(9.7) 1801636(23.2) 1410(11.0) 2687673(22.5) 1081.10(9.3) 2311689.0 (15.2)
Energy 5163(50.9) 1577882(20.3) 7220.12(56.4) 2310959(19.3) 6714.96(57.5) 2423261.2 (15.9)
Other 2.12(0.02) 3134(0.04) *0 29.04 *0.01 5.9
Total 10143 7764754 12805.57 11948942 11683.38 15188891.3
Source : Department of Consumer Affairs.Note : * volume of certified emission reduction (CER), electricity, heating oil and gasoline not includedin the total volumes of other commodities.Figures in bracket show the percentage share to total.
http://indiabudget.nic.in

201Agriculture and Food
has to be reduced largely by increasing the irrigationfacilities. Climate change and extreme weatherconditions impacting agriculture; there is need todevise insurance schemes linked to indices of variousvulnerability parameters. The insurance policyframework needs to be dynamic, incorporating theperspectives of the insured, insurers, and publicpolicy so that it covers a large section of population.
8.80 Storage capacity is a major problem facingthe country. Adequate storage facility would helpreduce post-harvest losses. Adoption of modern farmimplements and tools especially by small farmersis still low because of their lack of resources. This,in turn, hampers the development of the agriculturesector. Addressing infrastructure requirements in theagriculture sector, especially storage,communication, roads, and markets should be apriority. Public private partnership models can be ofhelp in ensuring faster development of theserequirements which are of vital importance for thegrowth of the agriculture sector.
8.81 Another area for improvement is the generationof real-time market intelligence and also agriculturalmarket reforms. Enhancing the returns farmers geton their production is essential for incentivizing themto produce more. Farmers need to realize the marketprice for their produce. Setting up of efficient supplychains is essential not only for ensuring adequatesupplies of essential items at reasonable prices butalso so that producers get adequately compensated.Linking farmers to the market is, therefore, veryimportant. The successful experience of cooperativesin the milk sector in managing the supply chain andproviding remunerative prices to the producers maybe emulated in the case of agricultural products.
8.82 The level of secondary food processing in Indiais very low compared to many western countries.
With increasing income and population, demand forprocessed food is likely to increase. It is necessaryto cater to this changing demand and at the sametime enhance the income of farmers. So far the focusin food management has been on cereals, mainlyrice and wheat. However, the demand for processedfood is expected to increase. Investment in foodprocessing, cold chains, handling, and packagingof processed food needs encouragement.
8.83 There has been substantial increase in theMSPs of various crops over the last few years. Thisis considered necessary for incentivizing farmers toincrease production and productivity. At the sametime, the MSP signals the floor price for the producewhich, in turn, has the potential of increasing prices.Addressing the welfare of agricultural producers andconsumers simultaneously poses a challenge.Further, inability of a large number of small andmarginal farmers to directly access the agriculturemarket puts a question mark on increases in MSPactually benefiting such farmers. Record procurementof rice and wheat in the last few years has helpedbuild up the buffer stock and strategic reserve ofwheat and rice. There is, however, a huge costinvolved in the process, in the form of food subsidy.The issue of efficient food stocks management andoffloading of stocks in time needs urgent attention.
8.84 We need to address the challenges of theagriculture sector through comprehensive andcoordinated efforts directed at improving farmproduction and productivity of foodgrains as well ashigh value crops, developing rural infrastructure,renewing thrust on the irrigation sector, strengtheningmarketing infrastructure, and supporting investmentin R&D with due emphasis on environmentalconsiderations. These efforts will in time rejuvenateagriculture sector and bring about inclusive growthof the economy.
http://indiabudget.nic.in