Embed Size (px)
Citation preview


Agriculture Education Websites
Alabama 4-H Foundation http://www.alabama4hfoundation.org/ Alabama Association of Agriscience Educators http://alabamaaged.org/ Alabama Cooperative Extension Service: 4-H http://www.aces.edu/fourh/ Alabama Forestry Commission shttp://www.forestry.alabama.gov/ Alabama Future Farmers of America http://www.alabamaffa.org/ Future Farmers of America Education Center http://agedlearning.com/ Alabama A & M University http://www.aamu.edu/ Auburn University http://auburn.edu/ Tuskegee University http://www.tuskegee.edu/ USDA Ag in the Classroom http://www.agclassroom.org/index.cfm USDA NASS Education Outreach http://www.nass.usda.gov/Education_and_Outreach/index.asp USDA Forestry Service http://www.fs.fed.us/r8/alabama/
The attractive cover design and composition was provided by the Alabama Farmer’s Federation. A special thanks to Jeff Helms and his staff for their creativity for Alabama’s bulletin cover. The Bulletin is available on our website: http://www.nass.usda.gov/al Photos provided by the Alabama Future Farmers of America and the Alabama Cooperative Extension Service. The land grant university paintings on the back cover were created by renowned Alabama artist Cindy Mask.
ALABAMA AGRICULTURAL STATISTICS
Bulletin 52 ● Prepared by the UNITED STATES DEPARTMENT OF AGRICULTURE NATIONAL AGRICULTURAL STATISTICS SERVICE
ALABAMA FIELD OFFICE
Post Office Box 240578, Montgomery, Alabama 36124-0578 Sterling Centre, 4121 Carmichael Road, Suite 200, Montgomery, AL 36106-2872
Telephone: (334) 279-3555 Fax: (334) 279-3590 Internet: http://www.nass.usda.gov/al
e-mail: [email protected]
William Weaver, Director
Kathy Broussard, Deputy Director
S T A F F
UNITED STATES DEPARTMENT OF AGRICULTURE
NATIONAL AGRICULTURAL STATISTICS SERVICE Cynthia Clark, Administrator
ALABAMA DEPARTMENT OF AGRICULTURE
AND INDUSTRIES Ron Sparks, Commissioner
Front: Greg Herbek, Kathy Broussard, Rick Geesey Back: Kathy Tribble, Kathy Guerin, Pat Gregory Not Pictured: John Dasher
Front: Stephanie Jackson, Bill Weaver, Stacey Nestor Back: Darien Lee, Linda Tillery, Christie Drew, Jamila Scott, Yumicka Powell
Issued Cooperatively by

Pictured L- R: Gerald Bentley, Judy Horton, Gary Steadman, John Cross Not Pictured: Robert Slate, Don Smith
Pictured L- R: Clyde Earnest, Nathan Wynne, Bill Fields, Pat Davis, Joe McDaniel Not Pictured: Julian Phillips, Jimmy Woodfin
Pictured L- R: Cheryl Grace, Debbie Lovell, Francis Gomes, Judy Scott, Mary Ann Bozeman, Allen Tarleton, Rachel Davis
Pictured L- R: Ginny Joseph, Elaine Haggard, Ann Vaughan, Gloria Davis, June Mackey, Dean Hyde
Pictured L- R: Jesse Birchfield, George White, Sandra Welch, Larry Searcy, Roy Kendrick, Patsy Sutton, Don Peacock, Fred Tice
Pictured Front Row L- R: Bernice Butler, Tom Brantley, Ginger Bodiford, Felisa Webster Back Row L – R: Mable Jackson, Vanessa Whitehurst, Marilyn Bullard, Joyce Bailey, Latonya Moore
OFFICE ENUMERATORS
FIELD ENUMERATORS Northwest Central
Southwest Northeast
Southeast

USDA, NASS, Alabama Field Office 3
Table of Contents General Office Staff ....................................................................... 1 Field and Office Enumerators .......................................... 2 Table of Contents ............................................................ 3 Commissioner and State Director's Message ................. 4 Highlights and Alabama=s Rank Among States ............... 5 Number of Farms ........................................................... 6 Farm Land Values and Cash Rent .................................. 7 Alabama Agricultural Exports. ......................................... 8 Climatological Data ......................................................... 9 Crops Crops Review ................................................................ 10 Acreage, Yield, Production, and Record Years ............. 11 Corn Acreage, Yield, and Production ............................ 12 Corn by County, 2008-2009. ......................................... 13 Cotton Acreage, Yield, and Production ......................... 14 Cotton by County, 2008-2009 ....................................... 15 Hay Acreage, Yield, and Production ............................. 16 Hay by County, 2008-2009 ............................................ 17 Peanuts Acreage, Yield, and Production ....................... 18 Peanuts by County, 2008-2009 ..................................... 19 Soybean Acreage, Yield, and Production ...................... 20 Soybeans by County, 2008-2009 .................................. 21 Wheat Acreage, Yield, and Production ......................... 22 Row Crops District Estimates ........................................ 23 Potatoes, Sweet Potatoes, Peaches, and Pecans ........ 24 Vegetables and Blueberries .......................................... 25 Livestock Livestock Review ........................................................... 26 Cattle and Calves. ......................................................... 27 Cattle Production and Income ....................................... 28 Cattle by County, 2008-2009-2010 ............................... 29 Hogs and Pigs ............................................................... 30 Hog Production and Income. ......................................... 31 Goats, Honey, and Milk Cow Inventory ......................... 32 Catfish ........................................................................... 33
Poultry Poultry Review .............................................................. 34 Broiler Production and Value ........................................ 35 Poultry Inventory and Value .......................................... 36 Poultry by County, 2008-2009 ....................................... 37 Commodity Prices Marketing Year Average Prices .................................... 38 Cash Receipts Cash Receipts Review .................................................. 39 Cash Receipts by Commodities .................................... 40
Cattle, Hogs, and Dairy. ................................... 41 Broilers, Eggs, and Catfish .............................. 42 Total Livestock and Poultry .............................. 42 Corn, Hay, and Wheat ..................................... 43 Cotton, Peanuts, and Soybeans ...................... 44 Fruit, Pecans, and Vegetables ......................... 45 Greenhouse, Sod, and Nursery. ...................... 45 Total Crops ...................................................... 45 Total, All Commodities ..................................... 46 Government Payments .................................... 46 Total Farm Receipts ......................................... 46
Special Features Alabama County Map.................................................... 47 County Profiles ......................................................... 48-70 Alabama Agriculture Graphic Overview ................... 71-72 Reports Issued by AASS .............................................. 73 Access to Electronic Information ................................... 74 Alabama County Extension System .............................. 75 Alabama County Facts. ................................................. 76

The continued success of agriculture in Alabama depends on how well we educate the next generation of farmers and Alabama is blessed with strong youth organizations such as the Future Farmers of America and the Cooperative Extension’s 4-H program to support this transition. Not only are these organizations vital in training our youth how to become successful farmers, they are essential in teaching our children the importance of where their food and fiber comes from. For many years, these organizations have effectively prepared our young people for additional educational opportunities in our agri-science high school programs and for agricultural degrees offered by Alabama A&M, Auburn, and Tuskegee Universities. The training received from these excellent universities has produced exceptional farmers as well as highly regarded professionals in research and business. As the Commissioner of Agriculture and Industries in Alabama, I support the Alabama agri-science professionals who work as advisors and educators to our youth and I am proud of their accomplishments. And I am especially proud of our young people who’ve made a commitment to agriculture despite all of the challenges it represents. It is through their commitment and dedication that the strong farming legacy in Alabama will continue.
Ron Sparks Commissioner
My father was born in 1929, the same year as the stock market crash and the year many consider to be the start of the great depression. Despite the difficult times, my father managed to acquire a calf for his 4-H project and the money he realized from the sale of that calf funded a trip to Florida to visit his cousins. This changed his life. The Cooperative Extension Service’s 4-H clubs along with other youth oriented agricultural organizations such as the Future Farmers of America have changed the lives of thousands of our state’s young people by teaching them the value of hard work and the importance of agriculture. Educating our youth not only benefits Alabama by producing competent farmers, it also creates an awareness and appreciation among its citizens of the food they eat and the clothes they wear. Once again, as the director for the Alabama Field Office, USDA/NASS, I want to thank our field and telephone enumerators for doing an outstanding job always under tight time constraints. Without their dedication and commitment, the data in this bulletin would not exist. And once again I want to thank the office staff for compiling another excellent bulletin. Finally, I want to thank the farmers in Alabama for taking the time out from of their busy schedules to respond to our surveys. Your responses ensure that the Alabama Agricultural Statistics Bulletin is an accurate source of information as well as your voice to tell the public who you are and what you do.
Bill Weaver Director
4 USDA, NASS, Alabama Field Office

USDA, NASS, Alabama Field Office 5
Alabama's Rank Among States: Crop Production, Livestock, and Poultry 2009
Unit Rank Production or Number Percent of U.S. Amount Alabama United States
Thousand Catfish, annual sales Dollars 2 90,688 372,567 24.3 Broilers 1/ Birds 3 1,002,300 8,285,200 12.1 Peanuts Pounds 3 471,200 3,688,350 12.8
Pecans, utilized production Pounds 5 14,000 291,830 4.8 Sweet potatoes Cwt. 6 391 19,647 2.0 Meat Goats (Jan. 1, 2010) Head 9 60 2,538 2.4
Cottonseed 2/ Tons 10 114 4,149 2.8 Cotton, upland Bales 10 345 11,788 2.9 Tomatoes, fresh market Cwt. 10 403 32,365 1.3
Watermelons, fresh market Cwt. 12 416 40,122 1.0 Blueberries, utilized production Pounds 13 300 364,900 0.09 Layers, 20 weeks and older Birds 14 9,029 339,526 2.7 Eggs Number 14 2,106,000 90,359,000 2.3 Small Farms (sales < $10,000) Number 15 31.2 1,228 2.5 Beef cow inventory (Jan. 1, 2010) Head 15 669 31,376 2.1 Peaches, utilized production Pounds 18 3,500 1,082,610 0.3 Greenhouse, Sod and Nursery Sales 19 255,319 15,914,592 1.6 Soybeans Bushels 22 17,200 3,361,028 0.5 Sweet corn, fresh market Cwt. 24 74 28,421 0.3 All cattle and calves (Jan. 1, 2010) Head 24 1,280 93,701 1.4 Winter wheat Bushels 25 9,900 1,522,718 0.7 Hogs and pigs Head 27 140 65,807 0.2 Corn for grain Bushels 29 27,000 13,151,062 0.2 Hay, All Tons 31 1,920 147,442 1.3 Honey Pounds 31 441 144,108 0.3 Milk cows (Jan. 1, 2010) Head 40 11 9,201 0.1 Milk Pounds 42 164,000 189,320,000 0.091/ U.S. excludes states producing less than 500,000 birds. 2/ Preliminary.
State Highlights for 2009-2010: ● Total farm receipts were over $4.75 billion for the year. (excluding forestry) ● Cash receipts from crops, livestock and poultry totaled $4.22 billion, versus $4.50 billion the previous year. ● The top five farm commodities for cash receipts were: (1) poultry, (2) cattle and calves, (3) greenhouse, sod, and nursery products, (4) soybeans and (5) cotton. Together they make up 86 percent of the total commodity receipts. ● Livestock and poultry accounted for 79% of the commodity receipts and crops the other 21%. ● Poultry made up 67 percent of the cash receipts for all commodities (excluding forestry). ● Alabama ranked 3 rd in the U.S. in broiler production with marketings of 1.00 billion birds. ● Greenhouse, sod, and nursery receipts totaled $255.3 million ranking Alabama 19th in the nation. ● Laying flocks produced 2.11 billion eggs to rank 14th in egg production. ● Cattle inventory on January 1, 2010 was 1.28 million head and the state ranked 24th nationally. ● Catfish sales amounted to $90.7 million. Alabama ranked second behind Mississippi in sales. ● Principal acreages for crops were: corn (280,000), cotton (255,000), peanuts (152,000), soybeans (440,000). ● Alabama ranked 3 rd in peanuts and 10th in cotton production. ● The state was 5th in pecan production and 18th in peach.

6 USDA, NASS, Alabama Field Office
Number of Farms and Operations with Livestock, 2000-2009
Year All Farms 1/ Land in Farms AverageSize of Farm
Operationswith
Cattle
Operations with
Beef Cows
Operationswith
Milk Cows
Operationswith
Hogs Number Thou Acres Acres Number
2000 47,000 9,000 191 27,000 26,000 300 7002001 46,000 8,900 193 26,000 24,000 250 6002002 45,000 8,900 198 26,000 24,000 200 5502003 45,000 9,000 200 26,000 24,000 200 5002004 44,000 8,900 202 25,000 23,000 190 5002005 43,500 8,800 202 25,000 23,000 190 5002006 43,000 8,900 207 25,000 23,000 170 4502007 48,800 9,000 184 24,000 22,000 160 7502008 48,500 8,950 185 2/ 2/ 2/ 2/2009 48,500 9,000 186 2/ 2/ 2/ 2/
1/ A farm is defined as any establishment from which $1,000 or more of agricultural products were sold or would normally be sold during the year. 2/ The number of operations by State will be published in conjunction with the Census of Agriculture every 5 years.
1930 1940 1950 1960 1970 1980 1990 2000 20090
50
100
150
200
250
300NO. FARMS (Thou)
5
10
15
20
25ACRES (Mil)
Number of Farms Acres
ALABAMA FARMS

USDA, NASS, Alabama Field Office 7
Farm Real Estate: Average Value per Acre, January 1, 2005 - 2010 States 2005 2006 2007 2008 2009 2010 Change 09-10
Dollars Percent Alabama 2,050 2,100 2,200 2,300 2,150 2,100 -3.3 Florida 4,790 5,230 5,500 5,640 5,150 5,000 -2.3 Georgia 3,140 3,800 4,350 4,300 4,100 3,900 -2.9 South Carolina 2,370 2,550 2,820 2,950 2,900 2,900 0.0 Southeast States 3,220 3,580 3,890 3,940 3,690 3,570 -3.3
1/ Includes land and buildings.
Cropland: Average Value per Acre, January 1, 2005 - 2010 States 2005 2006 2007 2008 2009 2010 Change 09-10
Dollars Percent Alabama 2,050 2,300 2,450 2,650 2,500 2,400 -4.0 Florida 6,260 6,540 6,860 6,980 6,430 6,180 -3.9 Georgia 2,700 3,620 4,290 4,540 4,050 3,690 -8.9 South Carolina 2,020 2,110 2,430 2,610 2,500 2,520 0.8 Southeast States 3,330 3,790 4,180 4,380 3,960 3,750 -5.3
Pasture: Average Value per Acre, January 1, 2005 - 2010
States 2005 2006 2007 2008 2009 2010 Change 09-10
Dollars Percent Alabama 1,650 1,650 1,750 1,800 1,700 1,650 -2.9 Florida 4,570 4,810 5,360 5,930 5,300 5,050 -4.7 Georgia 5,500 7,100 7,850 7,450 6,000 5,400 -10.0 South Carolina 2,270 2,500 2,920 3,000 2,900 2,900 0.0 Southeast States 3,870 4,300 4,770 5,040 4,270 4,030 -5.6
Cropland: Average Cash Rent per Acre, January 1, 2005 - 2010
States 2005 2006 2007 2008 2009 2010 Change 09-10 Dollars Percent Alabama 40.00 39.00 43.00 43.00 48.00 48.00 0.0 Florida 1/ 37.00 39.00 40.00 40.00 45.00 43.00 -4.4 Georgia 1/ 41.00 43.00 44.00 48.00 49.00 51.00 4.1 South Carolina 29.00 29.00 29.50 32.50 34.00 32.50 -4.4 Southeast States 48.00 48.00 64.00 66.00 60.00 62.00 3.3
1/ Non-irrigated Pasture: Average Cash Rent per Acre, January 1, 2005 - 2010
States 2005 2006 2007 2008 2009 2010 Change 09-10 Dollars Percent Alabama 17.50 18.50 19.50 19.50 19.50 19.00 -2.6 Florida 18.50 22.00 24.00 25.00 18.00 14.00 -22.2 Georgia 22.00 25.00 25.00 27.00 25.00 24.00 -4.0 South Carolina N/A N/A N/A N/A N/A N/A N/A Southeast States 19.00 20.00 23.00 23.50 20.50 18.00 -12.2

8 USDA, NASS, Alabama Field Office
.
Alabama Agricultural Exports, 2009Total: $866.6 Million
Peanuts & Products $41.9
Cotton & Products $106.9
Soybeans & Products $90.7
Poultry $423.7
Live Animals & Meat (excl. poultry) $10.2
All Other Commodities $117.5
Wheat & Feed Grains $75.8
Source: United States Agricultural Exports, FY 2009 Economic Research Service, USDA
Alabama Agricultural Exports: Estimated value, by commodity group, FY 2005-2009 1/ Year Wheat Feed grains Soybeans Peanuts Cotton and Cottonseed Fruit/Veg.
Million Dollars 2005 12.4 13.9 13.7 27.4 136.5 6.2 2006 15.3 9.3 7.7 26.4 147.3 5.5 2007 29.6 18.7 16.0 27.2 95.0 5.8 2008 95.5 33.7 79.6 44.2 177.3 6.1 2009 53.2 22.6 90.7 41.9 106.9 5.0
Year Tree nuts Live animals & meat, exc. Poultry Feeds & fodders Other 2/
commodities Total
Million Dollars 2005 1.2 11.2 258.3 14.4 67.8 563.1 2006 3.5 11.8 245.6 12.4 75.5 560.4 2007 5.7 12.6 311.8 13.0 91.0 626.4 2008 10.8 11.5 429.4 20.3 85.6 994.0 2009 6.1 10.2 423.7 19.6 86.8 866.6
1/ Totals may not add due to rounding. 2/ Other Commodities = Misc. oilseeds, nursery and greenhouse, and other animal and crop products.
USDA, NASS, Alabama Field Office 9
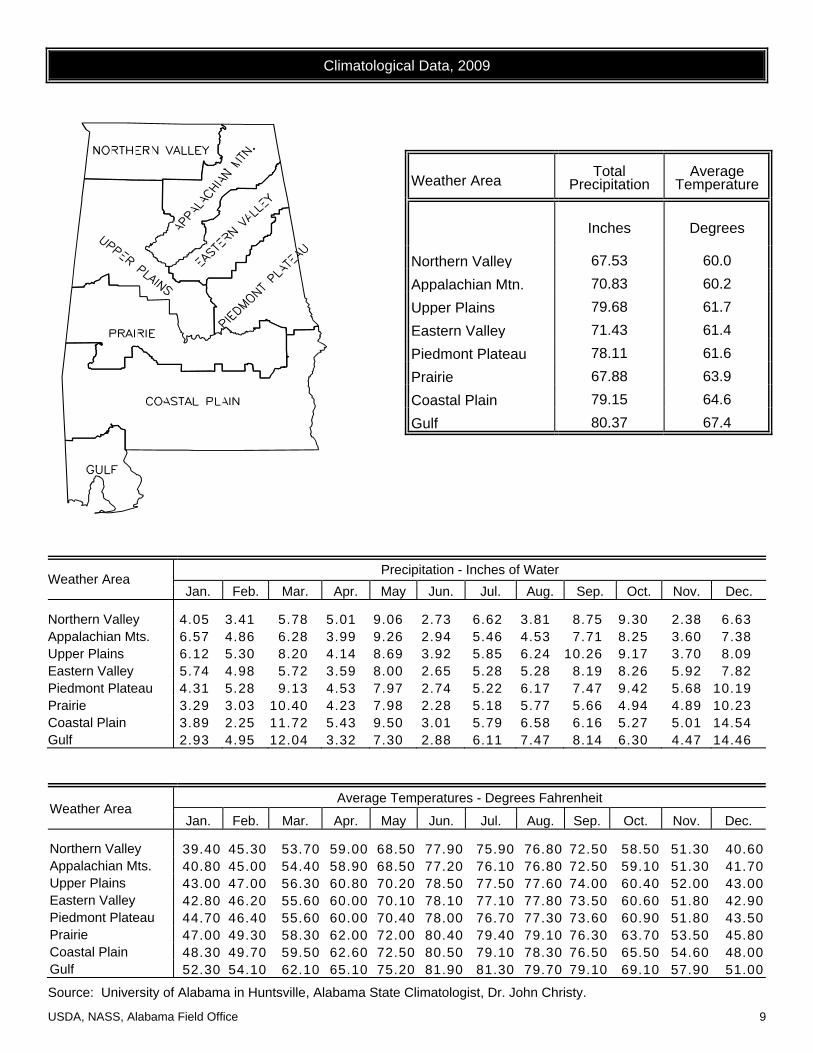
Climatological Data, 2009
Weather Area Precipitation - Inches of Water
Jan. Feb. Mar. Apr. May Jun. Jul. Aug. Sep. Oct. Nov. Dec.
Northern Valley 4.05 3.41 5.78 5.01 9.06 2.73 6.62 3.81 8.75 9.30 2.38 6.63 Appalachian Mts. 6.57 4.86 6.28 3.99 9.26 2.94 5.46 4.53 7.71 8.25 3.60 7.38 Upper Plains 6.12 5.30 8.20 4.14 8.69 3.92 5.85 6.24 10.26 9.17 3.70 8.09 Eastern Valley 5.74 4.98 5.72 3.59 8.00 2.65 5.28 5.28 8.19 8.26 5.92 7.82 Piedmont Plateau 4.31 5.28 9.13 4.53 7.97 2.74 5.22 6.17 7.47 9.42 5.68 10.19 Prairie 3.29 3.03 10.40 4.23 7.98 2.28 5.18 5.77 5.66 4.94 4.89 10.23 Coastal Plain 3.89 2.25 11.72 5.43 9.50 3.01 5.79 6.58 6.16 5.27 5.01 14.54 Gulf 2.93 4.95 12.04 3.32 7.30 2.88 6.11 7.47 8.14 6.30 4.47 14.46
Weather Area Average Temperatures - Degrees Fahrenheit
Jan. Feb. Mar. Apr. May Jun. Jul. Aug. Sep. Oct. Nov. Dec.
Northern Valley 39.40 45.30 53.70 59.00 68.50 77.90 75.90 76.80 72.50 58.50 51.30 40.60Appalachian Mts. 40.80 45.00 54.40 58.90 68.50 77.20 76.10 76.80 72.50 59.10 51.30 41.70Upper Plains 43.00 47.00 56.30 60.80 70.20 78.50 77.50 77.60 74.00 60.40 52.00 43.00Eastern Valley 42.80 46.20 55.60 60.00 70.10 78.10 77.10 77.80 73.50 60.60 51.80 42.90Piedmont Plateau 44.70 46.40 55.60 60.00 70.40 78.00 76.70 77.30 73.60 60.90 51.80 43.50Prairie 47.00 49.30 58.30 62.00 72.00 80.40 79.40 79.10 76.30 63.70 53.50 45.80Coastal Plain 48.30 49.70 59.50 62.60 72.50 80.50 79.10 78.30 76.50 65.50 54.60 48.00Gulf 52.30 54.10 62.10 65.10 75.20 81.90 81.30 79.70 79.10 69.10 57.90 51.00 Source: University of Alabama in Huntsville, Alabama State Climatologist, Dr. John Christy.
Weather Area Total Precipitation
Average Temperature
Inches Degrees
Northern Valley 67.53 60.0 Appalachian Mtn. 70.83 60.2 Upper Plains 79.68 61.7 Eastern Valley 71.43 61.4 Piedmont Plateau 78.11 61.6 Prairie 67.88 63.9 Coastal Plain 79.15 64.6 Gulf 80.37 67.4
10 USDA, NASS, Alabama Field Office
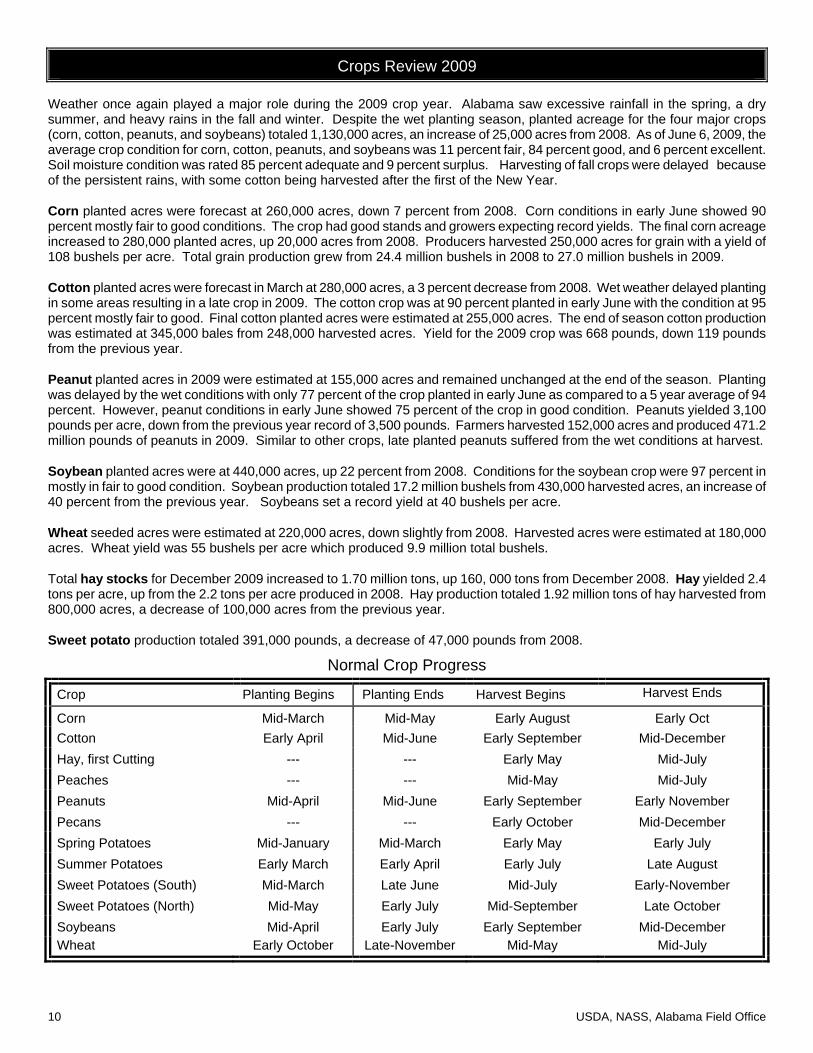
Crops Review 2009 Weather once again played a major role during the 2009 crop year. Alabama saw excessive rainfall in the spring, a dry summer, and heavy rains in the fall and winter. Despite the wet planting season, planted acreage for the four major crops (corn, cotton, peanuts, and soybeans) totaled 1,130,000 acres, an increase of 25,000 acres from 2008. As of June 6, 2009, the average crop condition for corn, cotton, peanuts, and soybeans was 11 percent fair, 84 percent good, and 6 percent excellent. Soil moisture condition was rated 85 percent adequate and 9 percent surplus. Harvesting of fall crops were delayed because of the persistent rains, with some cotton being harvested after the first of the New Year. Corn planted acres were forecast at 260,000 acres, down 7 percent from 2008. Corn conditions in early June showed 90 percent mostly fair to good conditions. The crop had good stands and growers expecting record yields. The final corn acreage increased to 280,000 planted acres, up 20,000 acres from 2008. Producers harvested 250,000 acres for grain with a yield of 108 bushels per acre. Total grain production grew from 24.4 million bushels in 2008 to 27.0 million bushels in 2009. Cotton planted acres were forecast in March at 280,000 acres, a 3 percent decrease from 2008. Wet weather delayed planting in some areas resulting in a late crop in 2009. The cotton crop was at 90 percent planted in early June with the condition at 95 percent mostly fair to good. Final cotton planted acres were estimated at 255,000 acres. The end of season cotton production was estimated at 345,000 bales from 248,000 harvested acres. Yield for the 2009 crop was 668 pounds, down 119 pounds from the previous year. Peanut planted acres in 2009 were estimated at 155,000 acres and remained unchanged at the end of the season. Planting was delayed by the wet conditions with only 77 percent of the crop planted in early June as compared to a 5 year average of 94 percent. However, peanut conditions in early June showed 75 percent of the crop in good condition. Peanuts yielded 3,100 pounds per acre, down from the previous year record of 3,500 pounds. Farmers harvested 152,000 acres and produced 471.2 million pounds of peanuts in 2009. Similar to other crops, late planted peanuts suffered from the wet conditions at harvest. Soybean planted acres were at 440,000 acres, up 22 percent from 2008. Conditions for the soybean crop were 97 percent in mostly in fair to good condition. Soybean production totaled 17.2 million bushels from 430,000 harvested acres, an increase of 40 percent from the previous year. Soybeans set a record yield at 40 bushels per acre. Wheat seeded acres were estimated at 220,000 acres, down slightly from 2008. Harvested acres were estimated at 180,000 acres. Wheat yield was 55 bushels per acre which produced 9.9 million total bushels. Total hay stocks for December 2009 increased to 1.70 million tons, up 160, 000 tons from December 2008. Hay yielded 2.4 tons per acre, up from the 2.2 tons per acre produced in 2008. Hay production totaled 1.92 million tons of hay harvested from 800,000 acres, a decrease of 100,000 acres from the previous year. Sweet potato production totaled 391,000 pounds, a decrease of 47,000 pounds from 2008.
Normal Crop Progress
Crop Planting Begins Planting Ends Harvest Begins Harvest Ends Corn
Mid-March Mid-May Early August
Early Oct
Cotton
Early April Mid-June Early September
Mid-December Hay, first Cutting
--- --- Early May
Mid-July
Peaches
--- --- Mid-May
Mid-July Peanuts
Mid-April Mid-June Early September
Early November
Pecans
--- --- Early October
Mid-December Spring Potatoes
Mid-January Mid-March Early May
Early July
Summer Potatoes
Early March Early April Early July
Late August Sweet Potatoes (South)
Mid-March Late June Mid-July
Early-November
Sweet Potatoes (North)
Mid-May Early July Mid-September
Late October Soybeans
Mid-April Early July Early September
Mid-December
Wheat
Early October Late-November Mid-May
Mid-July

USDA, NASS, Alabama Field Office 11
Acreage, Yield, Production, Price, and Value of Production, 2009
Crop
Unit
Planted for All
Purposes Harvested
Yield per Harvested
Acre
Production
Season Average
Price
Value of
Production
Thousand Acres Units Thou Units
Dollars Thou Dollars Corn grain
Bu. 280 250 108 27,000 4.15 112,050
Corn silage Ton - 9 13 117 - -
Cotton lint 1/ Lb. 255 248 668 345 0.644 111,283
Cottonseed Ton - - - 114 129.00 15,480
Hay
Ton - 800 2.4 1,920 77.00 147,840
Oats
Bu. 50 11 50 550 2.10 1,155
Peanuts Lb. 155 152 3,100 471,200 0.222 104,606
Soybeans Bu. 440 430 40 17,200 10.40 178,880
Sweet potatoes Cwt. 2.6 2.3 170 391 20.50 8,016
Winter wheat Bu. 220 180 55 9,900 4.60 45,540
Sweet corn Cwt. 2.0 1.4 53 74 30.00 2,220
Tomatoes Cwt. 1.4 1.3 310 403 32.30 13,017
Watermelons Cwt. 3.6 2.6 160 416 10.60 4,410
Blueberries 2/ 3/ Lb. - 310 968 300 1.64 492
Peaches 3/
Ton - - - 3.5 1,250 4,375
Pecans 3/
Lb. - - - 14,000 1.160 16,248
1/ Production in 480 pound net weight bales. 2/ Actual acres. 3/ Utilized Production.
Record Year Of Principal Crops Crop
Unit
Harvested Yield Per Acre
Production
Year Thou Acres Year 1/ Units
Year Thou Units
Corn grain
Bu.
1917 3,830 2004 123
1917 59,365 Cotton lint
Lb.
1911 3,833 1985 795
1914 2/ 1,748
Hay
Ton
1943 1,228 1994 2.7
2001 2,392 Potatoes
Cwt.
1944 54 1999 204
1953 3,768
Oats
Bu.
1883 410 1992 60
1945 6,292 Peanuts
Lb.
1943 574 2008 3,500
2008 675,500
Sorghum grain
Bu.
1985 230 2001 60
1985 12,650 Soybeans
Bu.
1979 2,150 2009 40
1979 53,750
Sweet potatoes
Cwt.
1934 111 1994 190
1955 936 Winter wheat
Bu.
1982 725 2008 71
1981 24,860
1/ Most recent year 2/ Production in 500 lb. gross weight bales

12 USDA, NASS, Alabama Field Office
Corn Acreage And Production, 2009
Planted Acres
Leading Counties Bushels Lawrence .................................... 3,895,000 Limestone ................................... 3,278,000 Lauderdale ................................. 2,620,000
Madison ...................................... 2,364,000Colbert ........................................ 2,064,000
00 01 02 03 04 05 06 07 08 09150
200
250
300
350
Thousand Acres
Corn Acres Planted 2000 - 2009
Corn: Acreage, Yield, and Production, 2000-2009
Year Planted Harvested Yield Per Harvested Acre Production Value of Production
Thousand Acres Bushels Thousand Bushels Thousand Dollars
2000 230 165 65 10,725 23,166
2001 180 150 107 16,050 37,718
2002 200 180 88 15,840 43,085
2003 220 190 122 23,180 54,705
2004 220 195 123 23,985 59,483
2005 220 200 119 23,800 59,500
2006 200 165 72 11,880 34,571
2007 340 280 78 21,840 99,154
2008 260 235 104 24,440 128,554
2009 280 250 108 27,000 112,050

USDA, NASS, Alabama Field Office 13
Corn: Acreage, Yield, and Production, 2008-2009
County 2008 2009
Planted Harvested Yield Production Planted Harvested Yield Production Acres Bushels Acres Bushels
Autauga ....................... * * * * * * * *Baldwin ........................ * * * * 5,000 4,600 124 570,000Barbour ........................ * * * * 3,300 2,800 109 304,000Bibb .............................. * * * * * * * *Blount ........................... * * * * 1,000 800 110 88,000Bullock ......................... * * * * * * * *Butler ........................... * * * * * * * *Calhoun ....................... * * * * 1,200 1,100 103 113,000Chambers .................... * * * * * * * *Cherokee ..................... * * * * 2,500 2,200 83 183,000Chilton .......................... * * * * * * * *Choctaw ....................... * * * * * * * *Clarke .......................... * * * * * * * *Clay .............................. * * * * * * * *Cleburne ...................... * * * * * * * *Coffee .......................... * * * * 7,000 5,600 63 350,000Colbert ......................... * * * * 17,000 16,400 126 2,064,000Conecuh ...................... * * * * 1,000 900 72 65,000Coosa .......................... * * * * * * * *Covington ..................... * * * * 3,200 2,500 51 127,000Crenshaw ..................... * * * * * * * *Cullman ........................ * * * * 3,100 2,400 104 250,000Dale ............................. * * * * 4,100 2,800 75 210,000Dallas ........................... * * * * 4,300 4,050 81 328,000DeKalb ......................... 10,000 9,900 71 700,000 11,000 10,900 117 1,271,000Elmore ......................... * * * * * * * *Escambia ..................... * * * * 5,700 4,700 85 399,000Etowah ......................... * * * * 2,500 1,800 85 153,000Fayette ......................... * * * * 2,500 1,600 64 103,000Franklin ........................ * * * * * * * *Geneva ........................ * * * * 7,000 6,200 80 499,000Greene ......................... * * * * * * * *Hale ............................. * * * * * * * *Henry ........................... * * * * 6,500 6,000 61 365,000Houston ....................... * * * * 3,200 2,600 83 215,000Jackson ........................ 24,500 23,800 93 2,225,000 20,000 18,600 110 2,055,000Jefferson ...................... * * * * * * * *Lamar ........................... * * * * 1,300 1,200 71 85,000Lauderdale ................... 17,500 17,200 99 1,710,000 21,000 20,200 130 2,620,000Lawrence ..................... 33,500 33,300 98 3,270,000 36,000 34,700 112 3,895,000Lee ............................... * * * * * * * *Limestone .................... 20,000 19,800 122 2,422,000 24,000 23,100 142 3,278,000Lowndes ...................... * * * * * * * *Macon .......................... * * * * 2,500 2,300 107 247,000Madison ....................... 17,800 17,600 153 2,689,000 19,000 18,500 128 2,364,000Marengo ....................... * * * * * * * *Marion .......................... * * * * * * * *Marshall ....................... * * * * 4,200 3,000 77 232,000Mobile .......................... * * * * * * * *Monroe ......................... * * * * 2,000 1,800 75 135,000Montgomery ................. * * * * * * * *Morgan ......................... * * * * 5,100 3,700 124 458,000Perry ............................ * * * * * * * *Pickens ........................ * * * * * * * *Pike .............................. * * * * 5,500 4,900 86 419,000Randolph ..................... * * * * * * * *Russell ......................... * * * * * * * *Shelby .......................... * * * * 1,000 700 114 80,000St. Clair ........................ * * * * * * * *Sumter ......................... * * * * * * * *Talladega ..................... * * * * 7,800 7,250 121 880,000Tallapoosa ................... * * * * * * * *Tuscaloosa .................. * * * * 2,800 2,650 99 262,000Walker .......................... * * * * * * * *Washington .................. * * * * 800 600 83 50,000Wilcox .......................... * * * * * * * *Winston ........................ * * * * * * * *State Total ................... 260,000 235,000 104 24,440,000 280,000 250,000 108 27,000,000 *County level data not published due to confidentiality criteria. All counties included in State Total. .

14 USDA, NASS, Alabama Field Office
Cotton Acreage And Production, 2009
Planted Acres
Leading Counties Bales Geneva ........................................... 31,800 Madison .......................................... 29,800 Houston .......................................... 26,400
Monroe ........................................... 24,500 Henry .............................................. 22,700
00 01 02 03 04 05 06 07 08 09200
300
400
500
600
700 Thousand Acres
Cotton Acres Planted2000 - 2009
Cotton: Acreage, Yield, and Production, 2000-2009
Year Planted Harvested Yield Per Harvested Acre Production Value of Production
Thousand Acres Pounds Thousand Bales Thousand Dollars
2000 590 530 492 543 137,618
2001 610 605 730 920 122,323
2002 590 540 507 570 119,016
2003 525 510 772 820 234,586
2004 550 540 724 814 158,632
2005 550 545 747 848 198,228
2006 575 560 579 675 144,504
2007 400 385 519 416 119,209
2008 290 286 787 469 101,079
2009 255 248 668 345 111,283

USDA, NASS, Alabama Field Office 15
Cotton: Acreage, Yield, and Production, 2008-2009
County 2008 2009
Planted Harvested Yield Production Planted Harvested Yield Production Acres Pounds Bales Acres Pounds Bales
Autauga ....................... 5,300 5,300 725 8,000 5,100 5,100 536 5,700Baldwin ........................ 9,100 9,100 1,002 19,000 8,500 8,350 776 13,500Barbour ........................ 3,600 3,340 632 4,400 * * * *Bibb .............................. * * * * * * * *Blount ........................... * * * * * * * *Bullock ......................... * * * * * * * *Butler ........................... * * * * * * * *Calhoun ....................... * * * * 1,700 1,700 734 2,600Chambers .................... * * * * * * * *Cherokee ..................... 9,400 9,360 841 16,400 6,000 5,910 723 8,900Chilton .......................... * * * * * * * *Choctaw ....................... * * * * * * * *Clarke .......................... * * * * * * * *Clay .............................. * * * * * * * *Cleburne ...................... * * * * * * * *Coffee .......................... 11,400 11,000 572 13,100 13,600 12,700 431 11,400Colbert ......................... 9,000 9,000 635 11,900 2,700 2,700 498 2,800Conecuh ...................... 4,400 4,200 846 7,400 3,500 3,300 582 4,000Coosa .......................... * * * * * * * *Covington ..................... 12,100 11,900 799 19,800 12,900 12,600 690 18,100Crenshaw ..................... * * * * * * * *Cullman ........................ * * * * * * * *Dale ............................. 8,200 8,080 653 11,000 9,700 9,400 495 9,700Dallas ........................... 3,900 3,800 897 7,100 4,500 4,450 561 5,200DeKalb ......................... * * * * * * * *Elmore ......................... 10,800 10,800 729 16,400 9,300 9,110 569 10,800Escambia ..................... 10,300 10,300 1,100 23,600 12,900 12,100 710 17,900Etowah ......................... * * * * * * * *Fayette ......................... * * * * * * * *Franklin ........................ * * * * * * * *Geneva ........................ * * * * 23,100 22,600 675 31,800Greene ......................... * * * * * * * *Hale ............................. * * * * * * * *Henry ........................... 17,900 17,300 572 20,600 14,500 14,200 767 22,700Houston ....................... 18,200 17,900 767 28,600 19,800 19,400 653 26,400Jackson ........................ * * * * * * * *Jefferson ...................... * * * * * * * *Lamar ........................... * * * * * * * *Lauderdale ................... 13,800 13,800 776 22,300 10,800 10,800 831 18,700Lawrence ..................... 14,800 14,800 668 20,600 4,300 4,300 692 6,200Lee ............................... * * * *Limestone .................... 14,900 14,900 776 24,100 11,300 11,000 711 16,300Lowndes ...................... * * * * * * * *Macon .......................... * * * * * * * *Madison ....................... 26,000 26,000 953 51,600 19,300 18,800 761 29,800Marengo ....................... * * * * * * * *Marion .......................... * * * * * * * *Marshall ....................... * * * * * * * *Mobile .......................... 5,600 5,600 1,286 15,000 6,900 6,900 863 12,400Monroe ......................... 15,900 15,700 920 30,100 17,100 16,000 735 24,500Montgomery ................. * * * * * * * *Morgan ......................... * * * * * * * *Perry ............................ * * * * * * * *Pickens ........................ * * * * * * * *Pike .............................. * * * * 4,200 4,100 527 4,500Randolph ..................... * * * * * * * *Russell ......................... * * * * * * * *Shelby .......................... * * * * 2,500 2,500 442 2,300St. Clair ........................ * * * * * * * *Sumter ......................... * * * * * * * *Talladega ..................... * * * * 2,900 2,810 581 3,400Tallapoosa ................... * * * * * * * *Tuscaloosa .................. * * * * * * * *Walker .......................... * * * * * * * *Washington .................. * * * * * * * *Wilcox .......................... * * * * * * * *Winston ........................ * * * * * * * *State Total ................... 290,000 286,000 787 469,000 255,000 248,000 668 345,000 *County level data not published due to confidentiality criteria. All counties included in State Total.

16 USDA, NASS, Alabama Field Office
Hay Acreage And Production, 2009
Harvested Acres
Leading Counties Tons Cullman ........................................ 108,600 DeKalb ............................................ 80,900 Jackson .......................................... 69,200
Pike ................................................ 64,700 Blount ............................................. 61,600
00 01 02 03 04 05 06 07 08 09700
750
800
850
900
950 Thousand Acres
Hay Harvested Acres2000 - 2009
Hay: Acreage, Yield, and Production, 2000 - 2009
Year Harvested for Dry Hay Yield Per Harvested Acre Production Value of Production
Thousand Acres Tons Thousand Tons Thousand Dollars
2000 720 1.8 1,296 72,576
2001 920 2.6 2,392 131,560
2002 825 2.2 1,815 103,455
2003 780 2.6 2,028 117,624
2004 850 2.7 2,295 130,815
2005 730 2.7 1,971 112,347
2006 720 2.0 1,440 97,920
2007 840 1.8 1,512 146,664
2008 900 2.2 1,980 194,040
2009 800 2.4 1,920 147,840

USDA, NASS, Alabama Field Office 17
Hay: Acreage, Yield, and Production, 2008-2009
County 2008 2009
Harvested Yield Production Harvested Yield Production Acres Tons Acres Tons
Autauga ................................... * * * 8,200 2.7 21,900Baldwin .................................... 11,600 2.4 28,000 16,400 2.1 33,400Barbour .................................... 10,100 2.3 23,000 8,000 3.6 28,300Bibb ......................................... * * * * * *Blount ...................................... 22,500 2.7 60,000 21,300 2.9 61,600Bullock ..................................... * * * 5,500 2.0 10,900Butler ....................................... 13,700 2.6 35,000 15,500 2.4 36,300Calhoun ................................... 11,400 2.4 27,000 12,000 2.5 29,100Chambers ................................ * * * 9,000 2.6 23,000Cherokee ................................. * * * 8,300 2.6 21,500Chilton ..................................... 14,800 2.3 34,000 12,300 2.5 30,000Choctaw .................................. * * * * * *Clarke ...................................... * * * 4,000 2.2 8,800Clay ......................................... 8,100 2.2 18,000 8,500 1.8 15,300Cleburne .................................. * * * 6,100 2.4 14,300Coffee ...................................... 10,600 2.5 26,000 10,600 2.7 28,600Colbert ..................................... 17,200 2.3 39,000 14,200 2.9 41,000Conecuh .................................. * * * 8,700 2.9 25,000Coosa ...................................... * * * 4,800 2.0 9,500Covington ................................ 10,800 2.3 25,000 7,800 3.4 26,500Crenshaw ................................ 7,500 2.3 17,000 7,800 3.0 23,300Cullman ................................... 42,500 2.6 110,000 39,300 2.8 108,600Dale ......................................... 13,900 2.0 28,000 10,200 2.4 24,700Dallas ...................................... 20,000 1.8 36,000 21,300 2.4 51,300DeKalb ..................................... 36,300 2.4 87,000 31,000 2.6 80,900Elmore ..................................... 12,400 2.0 25,000 11,300 2.7 29,700Escambia ................................. * * * * * *Etowah .................................... 10,500 2.6 27,000 10,500 2.2 22,600Fayette .................................... * * * 7,800 2.4 18,300Franklin .................................... 19,100 2.7 51,000 17,300 2.6 45,200Geneva .................................... 17,900 1.8 32,000 20,300 2.7 54,900Greene .................................... * * * 10,000 2.1 20,300Hale ......................................... * * * 6,800 1.4 9,600Henry ....................................... * * * 6,400 2.4 15,500Houston ................................... 7,100 1.3 9,000 5,300 2.2 11,600Jackson ................................... 28,800 2.3 66,000 26,600 2.6 69,200Jefferson .................................. * * * 7,800 1.6 12,500Lamar ...................................... 7,500 2.3 17,000 7,000 2.0 13,500Lauderdale .............................. 44,600 1.9 85,000 29,300 2.0 58,500Lawrence ................................. 25,000 1.9 48,000 22,200 2.1 45,300Lee .......................................... * * * 2,300 2.9 6,500Limestone ................................ 22,200 1.9 43,000 19,500 1.9 36,000Lowndes .................................. * * * 12,000 2.6 30,800Macon ...................................... * * * 6,700 2.4 16,200Madison ................................... 21,100 2.0 42,000 18,700 2.0 37,500Marengo .................................. 17,500 1.8 31,000 20,800 1.6 32,600Marion ..................................... 10,200 2.2 22,000 9,000 2.5 22,500Marshall ................................... 27,100 2.8 77,000 20,000 2.9 57,600Mobile ...................................... * * * 8,500 2.0 17,200Monroe .................................... 8,900 2.8 25,000 8,600 3.1 26,200Montgomery ............................ 25,200 1.9 48,000 17,800 1.9 32.600Morgan .................................... 25,200 2.1 52,000 19,800 2.2 44,000Perry ........................................ * * * 9,300 2.1 19,300Pickens .................................... 12,900 2.6 34,000 11,600 2.6 30,400Pike ......................................... 19,500 2.7 53,000 17,000 3.8 64,700Randolph ................................. 8,900 2.1 19,000 8,500 2.7 22,500Russell ..................................... * * * 2,600 2.3 5,900Shelby ..................................... * * * * * *St. Clair .................................... 12,200 2.9 35,000 8,900 2.2 19,600Sumter ..................................... 14,800 2.0 30,000 14,300 1.8 25,800Talladega ................................. 13,300 2.1 28,000 9,800 2.3 22,100Tallapoosa ............................... * * * 2,900 3.1 9,000Tuscaloosa .............................. 11,900 1.8 21,000 10,000 1.9 19,100Walker ..................................... 16,300 2.2 36,000 16,800 2.4 39,400Washington ............................. * * * 3,000 2.0 5,800Wilcox ...................................... * * * 9,800 2.2 21,600Winston ................................... 12,400 2.1 26,000 10,000 2.0 20,000State Total ............................... 900,000 2.2 1,980,000 800,000 2.4 1,920,000 *County level data not published due to confidentiality criteria. All counties included in State Total.

18 USDA, NASS, Alabama Field Office
Planted Acres
Peanut Acreage And Production, 2009 Leading Counties Pounds
Houston ................................... 98,500,000 Baldwin .................................... 56,652,000 Henry ....................................... 54,785,000
Geneva .................................... 42,942,000 Escambia ................................. 35,472,000
00 01 02 03 04 05 06 07 08 09150160170180190200210220230 Thousand Acres
Peanut Planted Acres2000 - 2009
Peanuts: Acreage, Yield, and Production, 2000-2009
Year Planted Harvested Yield Per Harvested Acre Production Value of Production
Thousand Acres Pounds Thousand Pounds Thousand Dollars
2000 190 182 1,490 271,180 72,134
2001 200 199 2,675 532,325 128,823
2002 185 180 2,110 379,800 62,287
2003 190 185 2,750 508,750 93,101
2004 200 199 2,800 557,200 99,182
2005 225 223 2,750 613,250 101,186
2006 165 163 2,500 407,500 68,460
2007 160 157 2,550 400,350 76,467
2008 195 193 3,500 675,500 151,988
2009 155 152 3,100 471,200 104,606

USDA, NASS, Alabama Field Office 19
Peanuts: Acreage, Yield, and Production, 2008-2009
County 2008 2009
Harvested Yield Production Harvested Yield Production
Acres Pounds Acres PoundsAutauga ................................... * * * * * *Baldwin .................................... 18,300 3,915 71,631,000 16,200 3,495 56,652,000Barbour .................................... 5,100 3,945 20,131,000 3,280 3,260 10,690,000Bibb ......................................... * * * * * *Blount ...................................... * * * * * *Bullock ..................................... * * * * * *Butler ....................................... * * * * * *Calhoun ................................... * * * * * *Chambers ................................ * * * * * *Cherokee ................................. * * * * * *Chilton ..................................... * * * * * *Choctaw .................................. * * * * * *Clarke ...................................... * * * * * *Clay ......................................... * * * * * *Cleburne .................................. * * * * * *Coffee ...................................... * * * 7,800 2,415 18,840,000Colbert ..................................... * * * * * *Conecuh .................................. * * * * * *Coosa ...................................... * * * * * *Covington ................................ 9,000 3,775 33,957,000 6,400 3,510 22,460,000Crenshaw ................................ * * * * * *Cullman ................................... * * * * * *Dale ......................................... 12,100 2,910 35,216,000 9,300 3,535 32,855,000Dallas ...................................... * * * 3,800 2,870 10,900,000DeKalb ..................................... * * * * * *Elmore ..................................... * * * * * *Escambia ................................. 12,100 3,775 45,654,000 9,600 3,695 35,472,000Etowah .................................... * * * * * *Fayette .................................... * * * * * *Franklin .................................... * * * * * *Geneva .................................... 21,500 3,085 66,274,000 16,300 2,635 42,942,000Greene .................................... * * * * * *Hale ......................................... * * * * * *Henry ....................................... 21,400 3,270 69,990,000 18,700 2,930 54,785,000Houston ................................... 38,600 3,555 137,313,000 33,500 2,940 98,500,000Jackson ................................... * * * * * *Jefferson .................................. * * * * * *Lamar ...................................... * * * * * *Lauderdale .............................. * * * * * *Lawrence ................................. * * * * * *Lee .......................................... * * * * * *Limestone ................................ * * * * * *Lowndes .................................. * * * * * *Macon ...................................... * * * * * *Madison ................................... * * * * * *Marengo .................................. * * * * * *Marion ..................................... * * * * * *Marshall ................................... * * * * * *Mobile ...................................... 8,300 3,690 30,646,000 * * *Monroe .................................... 7,750 4,210 32,616,000 5,780 3,525 20,363,000Montgomery ............................ * * * * * *Morgan .................................... * * * * * *Perry ........................................ * * * * * *Pickens .................................... * * * * * *Pike ......................................... 5,800 2,795 16,216,000 3,200 3,415 10,930,000Randolph ................................. * * * * * *Russell ..................................... * * * * * *Shelby ..................................... * * * * * *St. Clair .................................... * * * * * *Sumter ..................................... * * * * * *Talladega ................................. * * * * * *Tallapoosa ............................... * * * * * *Tuscaloosa .............................. * * * * * *Walker ..................................... * * * * * *Washington ............................. * * * 2,250 2,975 6,696,000Wilcox ...................................... * * * * * *Winston ................................... * * * * * *State Total ............................... 193,000 3,500 675,500,000 152,000 3,100 471,200,000 *County level data not published due to confidentiality criteria. All counties included in State Total.

20 USDA, NASS, Alabama Field Office
Soybeans Acreage And Production, 2009
Planted Acres
Leading Counties Bushels Limestone ....................... 2,830,000 Madison .......................... 1,917,000 Jackson ........................... 1,163,000
Lawrence ........................ 1,057,000 Cherokee ........................ 1,025,000
00 01 02 03 04 05 06 07 08 09100
200
300
400
500 Thousand Acres
Soybean Planted Acres2000 - 2009
Soybean: Acreage, Yield, and Production, 2000-2009
Year Planted Harvested Yield Per Harvested Acre Production Value of Production
Thousand Acres Bushels Thousand Bushels Thousand Dollars
2000 190 160 18 2,880 13,680
2001 140 135 35 4,725 21,735
2002 170 155 24 3,720 20,646
2003 170 160 36 5,760 41,760
2004 210 190 35 6,650 41,563
2005 150 145 33 4,785 28,471
2006 160 150 20 3,000 20,550
2007 190 185 21 3,885 44,289
2008 360 350 35 12,250 126,175
2009 440 430 40 17,200 178,880

USDA, NASS, Alabama Field Office 21
Soybeans: Acreage, Yield, and Production, 2008-2009
County 2008 2009
Planted Harvested Yield Production Planted Harvested Yield Production Acres Bushels Acres Bushels
Autauga ....................... * * * * 2,100 1,900 30.0 57,000Baldwin ........................ 19,400 19,000 41.5 793,000 24,000 23,600 40.5 953,000Barbour ........................ * * * * * * * *Bibb .............................. * * * * * * * *Blount ........................... * * * * * * * *Bullock ......................... * * * * * * * *Butler ........................... * * * * * * * *Calhoun ....................... * * * * 4,300 4,200 38.0 160,000Chambers .................... * * * * * * * *Cherokee ..................... * * * * 24,000 23,700 43.0 1,025,000Chilton .......................... * * * * * * * *Choctaw ....................... * * * * * * * *Clarke .......................... * * * * * * * *Clay .............................. * * * * * * * *Cleburne ...................... * * * * * * * *Coffee .......................... * * * * 7,300 6,800 33.5 227,000Colbert ......................... * * * * 23,000 22,900 44.5 1,014,000Conecuh ...................... * * * * 2,900 2,700 45.0 122,000Coosa .......................... * * * * * * * *Covington ..................... * * * * 2,400 2,200 36.5 80,000Crenshaw ..................... * * * * * * * *Cullman ........................ * * * * 5,300 5,300 47.5 252,000Dale ............................. * * * * * * * *Dallas ........................... * * * * 9,400 9,100 41.0 374,000DeKalb ......................... 12,200 11,800 25.5 300,000 11,000 10,800 38.0 411,000Elmore ......................... * * * * 2,300 2,200 24.5 54,000Escambia ..................... * * * * 12,000 11,900 42.5 508,000Etowah ......................... * * * * 5,500 5,500 44.5 245,000Fayette ......................... * * * * * * * *Franklin ........................ * * * * * * * *Geneva ........................ * * * * 6,800 6,600 36.5 242,000Greene ......................... * * * * * * * *Hale ............................. * * * * * * * *Henry ........................... * * * * * * * *Houston ....................... * * * * 8,000 7,600 29.5 224,000Jackson ........................ * * * * 32,000 31,800 36.5 1,163,000Jefferson ...................... * * * * * * * *Lamar ........................... * * * * * * * *Lauderdale ................... 17,000 16,700 26.5 440,000 22,000 21,900 39.5 863,000Lawrence ..................... * * * * 24,000 23,900 44.0 1,057,000Lee ............................... * * * * * * * *Limestone .................... 60,000 59,900 34.0 2,050,000 64,000 63,900 44.5 2,830,000Lowndes ...................... * * * * * * * *Macon .......................... * * * * 2,400 2,300 38.0 87,000Madison ....................... 39,000 38,800 38.5 1,500,000 46,000 45,800 42.0 1,917,000Marengo ....................... * * * * * * * *Marion .......................... * * * * * * * *Marshall ....................... * * * * 6,100 6,000 38.5 232,000Mobile .......................... * * * * 2,300 2,300 41.0 94,000Monroe ......................... * * * * 5,000 4,200 37.5 157,000Montgomery ................. * * * * * * * *Morgan ......................... 7,000 6,900 36.0 250,000 7,000 6,900 38.5 264,000Perry ............................ * * * * * * * *Pickens ........................ * * * * * * * *Pike .............................. * * * * 1,500 1,500 47.5 71,000Randolph ..................... * * * * * * * *Russell ......................... * * * * * * * *Shelby .......................... * * * * * * * *St. Clair ........................ * * * * * * * *Sumter ......................... * * * * 900 800 22.5 18,000Talladega ..................... * * * * 10,000 10,000 39.5 397,000Tallapoosa ................... * * * * * * * *Tuscaloosa .................. * * * * 5,200 5,000 40.0 201,000Walker .......................... * * * * * * * *Washington .................. * * * * * * * *Wilcox .......................... * * * * * * * *Winston ........................ * * * * * * * *State Total ................... 360,000 350,000 35.0 12,250,000 440,000 430,000 40.0 17,200,000 *County level data not published due to confidentiality criteria. All counties included in State Total.

22 USDA, NASS, Alabama Field Office
Planted Acres
Wheat Acreage, 2008*
00 01 02 03 04 05 06 07 08 0950
100
150
200
250 Thousand Acres
Wheat Planted Acres2000 - 2009
*Map reflects 2008 planted acres. County level data was discontinued as of 2009.
Wheat: Acreage, Yield, and Production, 2000-2009
Year Planted Harvested Yield Per Harvested Acre Production Value of Production
Thousand Acres Bushels Thousand Bushels Thousand Dollars
2000 140 90 54 4,860 11,421
2001 170 70 48 3,360 8,568
2002 150 60 40 2,400 7,440
2003 150 75 41 3,075 9,840
2004 120 60 48 2,880 10,224
2005 100 45 50 2,250 6,975
2006 100 45 57 2,565 10,132
2007 120 76 42 3,192 16,918
2008 240 200 71 14,200 84,490
2009 220 180 55 9,900 45,540

USDA, NASS, Alabama Field Office 23
District Estimates for Major Crops 1/ Corn District Estimates, 2009 2/ Cotton District Estimates, 2009 2/
Planted Harvested Yield Production Planted Harvested Yield Production Acres Bushels Acres Pounds Bales District 10 130,000 124,000 123 15,225,000 49,300 48,500 740 74,800 District 20 46,000 41,000 106 4,360,000 11,800 11,500 764 18,300 District 30 21,000 17,500 103 1,797,000 10,400 10,300 480 10,300 District 40 20,000 14,500 88 1,283,000 25,900 25,400 573 30,300 District 50 19,000 16,000 98 1,561,000 52,700 50,300 723 75,800 District 60 44,000 37,000 75 2,774,000 104,900 102,000 638 135,500
State Total 280,000 250,000 108 27,000,000 255,000 248,000 668 345,000
Soybean District Estimates, 2009 2/ Peanuts District Estimates, 2009 2/ Planted Harvested Yield Production Planted Harvested Yield Production Acres Bushels Acres Pounds District 10 195,000 194,000 42.5 8,254,000 * * * * District 20 91,000 90,000 40.0 3,601,000 * * * * District 30 30,000 29,000 36.5 1,054,000 * * * * District 40 40,000 37,000 34.5 1,270,000 * * * * District 50 50,000 48,000 41.0 1,965,000 41,000 40,000 3,485 139,300,000 District 60 34,000 32,000 33.0 1,056,000 103,600 101,600 2,975 302,252,000
State Total 440,000 430,000 40.0 17,200,000 155,000 152,000 3,100 471,200,000
Hay District Estimates, 2009 2/ Planted Harvested Yield Production
Acres Tons District 10 na 160,000 2.20 350,000 District 20 na 184,000 2.65 485,000 District 30 na 132,000 2.25 296,000 District 40 na 144,000 2.10 301,000 District 50 na 84,000 2.45 204,000 District 60 na 96,000 2.95 284,000
State Total na 800,000 2.40 1,920,000* Included in State total, na not applicable. 1/ Wheat district estimates discontinued for 2009. 2/ See page 47 for district boundaries.
24 USDA, NASS, Alabama Field Office
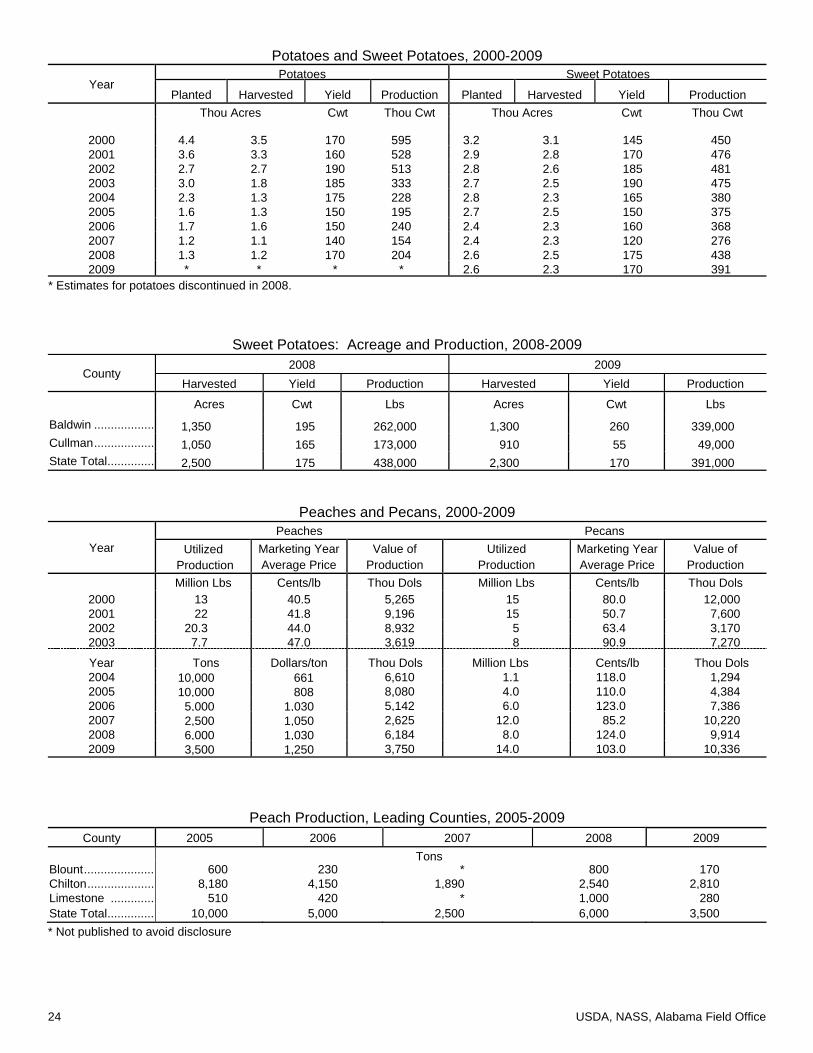
Potatoes and Sweet Potatoes, 2000-2009
Year Potatoes Sweet Potatoes
Planted Harvested Yield Production Planted Harvested Yield Production Thou Acres Cwt Thou Cwt Thou Acres Cwt Thou Cwt
2000 4.4 3.5 170 595 3.2 3.1 145 4502001 3.6 3.3 160 528 2.9 2.8 170 4762002 2.7 2.7 190 513 2.8 2.6 185 4812003 3.0 1.8 185 333 2.7 2.5 190 4752004 2.3 1.3 175 228 2.8 2.3 165 3802005 1.6 1.3 150 195 2.7 2.5 150 3752006 1.7 1.6 150 240 2.4 2.3 160 3682007 1.2 1.1 140 154 2.4 2.3 120 2762008 1.3 1.2 170 204 2.6 2.5 175 4382009 * * * * 2.6 2.3 170 391
* Estimates for potatoes discontinued in 2008.
Sweet Potatoes: Acreage and Production, 2008-2009
County 2008 2009
Harvested Yield Production Harvested Yield Production
Acres Cwt Lbs Acres Cwt Lbs
Baldwin .................. 1,350 195 262,000 1,300 260 339,000 Cullman .................. 1,050 165 173,000 910 55 49,000 State Total .............. 2,500 175 438,000 2,300 170 391,000
Peaches and Pecans, 2000-2009
Year Peaches Pecans
Utilized Production
Marketing Year Average Price
Value of Production
Utilized Production
Marketing Year Average Price
Value of Production
Million Lbs Cents/lb Thou Dols Million Lbs Cents/lb Thou Dols 2000 13 40.5 5,265 15 80.0 12,0002001 22 41.8 9,196 15 50.7 7,6002002 20.3 44.0 8,932 5 63.4 3,1702003 7.7 47.0 3,619 8 90.9 7,270
Year Tons Dollars/ton Thou Dols Million Lbs Cents/lb Thou Dols2004 10,000 661 6,610 1.1 118.0 1,2942005 10,000 808 8,080 4.0 110.0 4,3842006 5,000 1,030 5,142 6.0 123.0 7,3862007 2,500 1,050 2,625 12.0 85.2 10,2202008 6,000 1,030 6,184 8.0 124.0 9,9142009 3,500 1,250 3,750 14.0 103.0 10,336
Peach Production, Leading Counties, 2005-2009
County 2005 2006 2007 2008 2009 Tons Blount ..................... 600 230 * 800 170Chilton .................... 8,180 4,150 1,890 2,540 2,810Limestone ............. 510 420 * 1,000 280State Total .............. 10,000 5,000 2,500 6,000 3,500 * Not published to avoid disclosure
USDA, NASS, Alabama Field Office 25
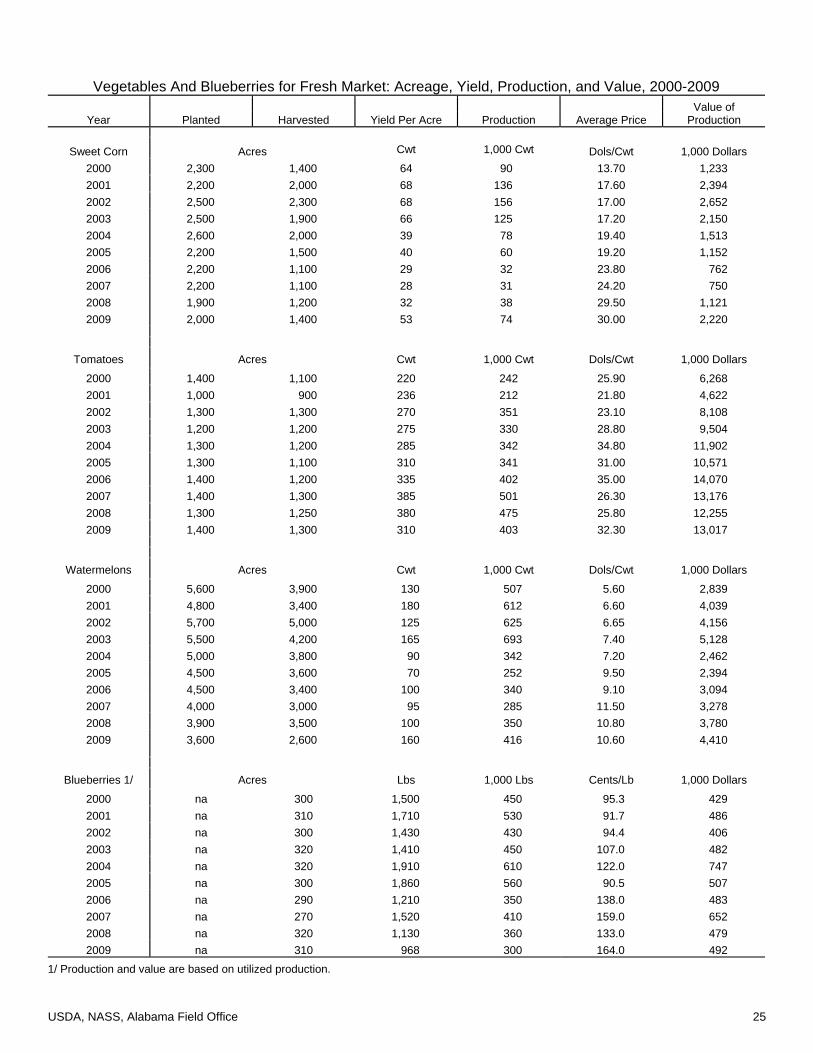
Vegetables And Blueberries for Fresh Market: Acreage, Yield, Production, and Value, 2000-2009
Year
Planted
Harvested
Yield Per Acre
Production
Average Price Value of
Production
Sweet Corn
Acres Cwt 1,000 Cwt
Dols/Cwt 1,000 Dollars
2000 2,300 1,400 64 90 13.70 1,233 2001 2,200 2,000 68 136 17.60 2,394 2002 2,500 2,300 68 156 17.00 2,652 2003 2,500 1,900 66 125 17.20 2,150 2004 2,600 2,000 39 78 19.40 1,513 2005 2,200 1,500 40 60 19.20 1,152 2006 2,200 1,100 29 32 23.80 762 2007 2,200 1,100 28 31 24.20 750 2008 1,900 1,200 32 38 29.50 1,121 2009 2,000 1,400 53 74 30.00 2,220
Tomatoes
Acres Cwt 1,000 Cwt Dols/Cwt 1,000 Dollars
2000 1,400 1,100 220 242 25.90 6,268 2001 1,000 900 236 212 21.80 4,622 2002 1,300 1,300 270 351 23.10 8,108 2003 1,200 1,200 275 330 28.80 9,504 2004 1,300 1,200 285 342 34.80 11,902 2005 1,300 1,100 310 341 31.00 10,571 2006 1,400 1,200 335 402 35.00 14,070 2007 1,400 1,300 385 501 26.30 13,176 2008 1,300 1,250 380 475 25.80 12,255 2009 1,400 1,300 310 403 32.30 13,017
Watermelons
Acres Cwt 1,000 Cwt Dols/Cwt 1,000 Dollars
2000 5,600 3,900 130 507 5.60 2,839 2001 4,800 3,400 180 612 6.60 4,039 2002 5,700 5,000 125 625 6.65 4,156 2003 5,500 4,200 165 693 7.40 5,128 2004 5,000 3,800 90 342 7.20 2,462 2005 4,500 3,600 70 252 9.50 2,394 2006 4,500 3,400 100 340 9.10 3,094 2007 4,000 3,000 95 285 11.50 3,278 2008 3,900 3,500 100 350 10.80 3,780 2009 3,600 2,600 160 416 10.60 4,410
Blueberries 1/
Acres Lbs 1,000 Lbs Cents/Lb 1,000 Dollars
2000 na 300 1,500 450 95.3 429 2001 na 310 1,710 530 91.7 486 2002 na 300 1,430 430 94.4 406 2003 na 320 1,410 450 107.0 482 2004 na 320 1,910 610 122.0 747 2005 na 300 1,860 560 90.5 507 2006 na 290 1,210 350 138.0 483 2007 na 270 1,520 410 159.0 652 2008 na 320 1,130 360 133.0 479 2009 na 310 968 300 164.0 492
1/ Production and value are based on utilized production.

26 USDA, NASS, Alabama Field Office
Livestock Review 2009
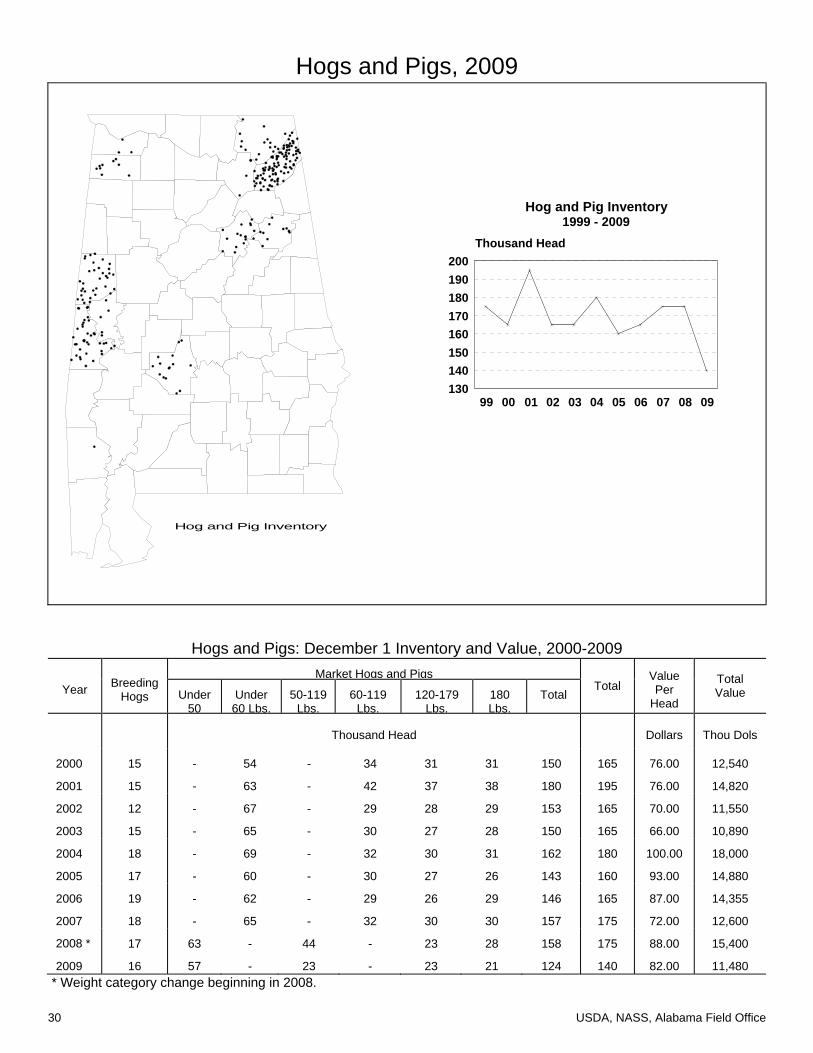
On January 1, 2010, 1.28 million head of cattle and calves were on farms in Alabama with cash receipts that totaled $308.3 million. There was a 1 percent increase in the number of cattle and calves marketed. Prices received by Alabama producers during 2009 decreased to $67.20 per cwt for cattle and $88.50 for calves. Beef cow inventory slightly increased to 669,000 head and beef cow replacement heifers, remained at 95,000 head. There were 11,000 milk cows in Alabama dairy herds, which was 8 percent lower than the previous year. Milk produced in the State totaled 164 million pounds in 2009, down 11 percent from the previous year. Milk per cow averaged 14,909 pounds. Prices received for milk was $15.60 in 2009. Alabama cash receipts from milk decreased 36 percent to $25.4 million. All hogs and pigs on hand December 1, 2009 numbered 140,000 head. The number of breeding hogs dropped to 16,000 and total market hogs decreased to 124,000; and 32,000 sows farrowed 271,000 pigs in 2009. The average number of pigs per litter was 8.47, compared with 8.93 a year ago. Cash receipts from hogs and pigs were $35.32 million and the average price received per cwt was $41.70. Sales of catfish in Alabama decreased 3 percent to $90.7 million during 2009. Honey production in 2009 totaled 441,000 pounds. There were 9,000 colonies producing honey in 2009. Yield per colony averaged 49 pounds, down 17 pounds from a year earlier. The average price per pound was 182 cents, down 8 cents from a year ago.
Livestock and Poultry Receipts, 2009
Commodity Receipts $ Pct of Total Broilers 2,519.30 mil 75.5 Cattle & Calves 308.29 mil 9.3 Eggs 281.04 mil 8.4 Catfish 90.69 mil 2.7 Other Lvstk and Poultry 75.08 mil 2.3 Hogs 35.32 mil 1.1 Dairy 25.43 mil 0.7 Lvstk and Poultry, Total 3,335.2 mil 100.0
Cash receipts for Alabama’s livestock and poultry production
totaled $3.34 billion for 2009. Receipts for broilers and other
poultry & egg products were $2.82 billion, while cattle, calf
and hog receipts were $343.61 million. Catfish receipts
totaled $90.7 million for 2009.
Alabama: Record Year Of Livestock and Poultry Livestock Unit Record Number Year
Broiler Production, Annual Mil Birds 1,063 2008
Beef Cows Thou Hd 1,314 1976
Catfish Sales, Annual Thou Dols 101,198 2004
Cattle and Calves, Jan 1 Thou Hd 2,850 1976
Egg Production, Annual Mil Eggs 3,354 1980
Hogs and Pigs, Inventory Dec 1 Thou Hd 1,640 1897
Layer Inventory, Dec 1 Mil Birds 14.60 1965
Milk Production, Annual Mil Lbs 1,360 1944
USDA, NASS, Alabama Field Office 27
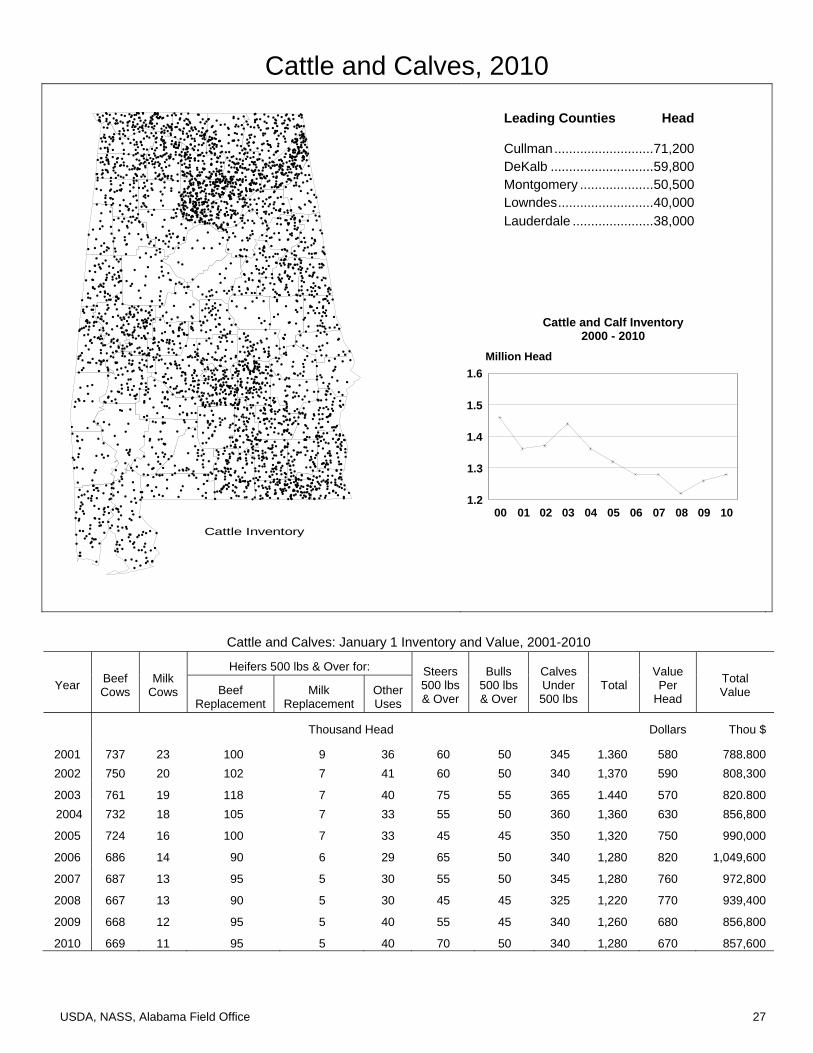
Cattle and Calves, 2010
Cattle Inventory
Leading Counties Head
Cullman ........................... 71,200 DeKalb ............................ 59,800 Montgomery .................... 50,500 Lowndes .......................... 40,000
Lauderdale ...................... 38,000
00 01 02 03 04 05 06 07 08 09 101.2
1.3
1.4
1.5
1.6 Million Head
Cattle and Calf Inventory2000 - 2010
Cattle and Calves: January 1 Inventory and Value, 2001-2010
Year Beef Cows
Milk Cows
Heifers 500 lbs & Over for: Steers 500 lbs & Over
Bulls 500 lbs & Over
Calves Under 500 lbs
Total Value Per
Head
Total Value Beef
Replacement Milk
Replacement Other Uses
Thousand Head Dollars Thou $
2001 737 23 100 9 36 60 50 345 1,360 580 788,8002002 750 20 102 7 41 60 50 340 1,370 590 808,300
2003 761 19 118 7 40 75 55 365 1,440 570 820,800 2004 732 18 105 7 33 55 50 360 1,360 630 856,800
2005 724 16 100 7 33 45 45 350 1,320 750 990,000
2006 686 14 90 6 29 65 50 340 1,280 820 1,049,600
2007 687 13 95 5 30 55 50 345 1,280 760 972,800
2008 667 13 90 5 30 45 45 325 1,220 770 939,400
2009 668 12 95 5 40 55 45 340 1,260 680 856,800
2010 669 11 95 5 40 70 50 340 1,280 670 857,600
28 USDA, NASS, Alabama Field Office
Cattle and Calves: Inventory, Supply, and Disposition, 2000-2009
Year Beginning Inventory
Calf Crop Inshipments Marketings Farm
Slaughter Deaths Ending
Inventory Cattle Calves Cattle Calves Thousand Head
2000 1,460 690 24 549 210 2 22 31 1,360 2001 1,360 680 18 462 170 2 22 32 1,370 2002 1,370 690 16 423 154 2 23 34 1,440 2003 1,440 680 15 580 141 2 25 27 1,360 2004 1,360 670 10 535 131 2 22 30 1,320 2005 1,320 630 13 511 121 2 21 28 1,280 2006 1,280 620 16 457 121 2 26 30 1,280 2007 1,280 590 15 486 127 2 22 28 1,220 2008 1,220 580 30 436 81 2 22 29 1,260 2009 1,260 590 20 433 101 2 23 31 1,280
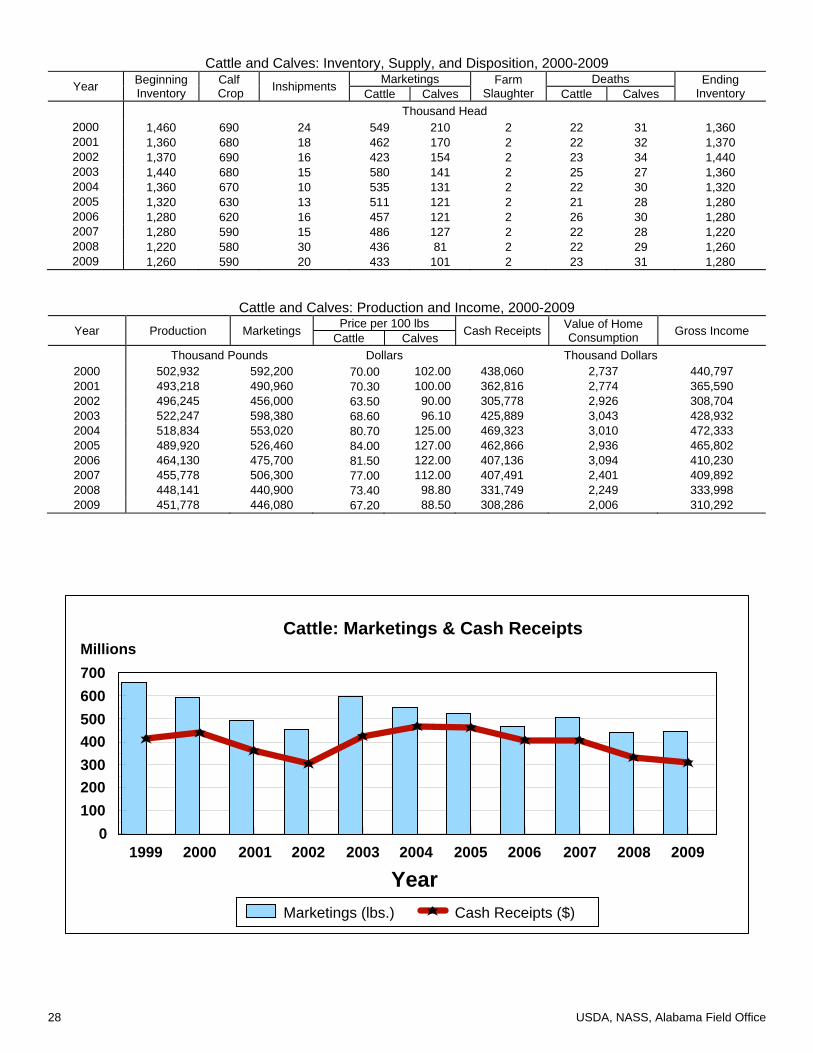
Cattle and Calves: Production and Income, 2000-2009 Year Production Marketings Price per 100 lbs Cash Receipts Value of Home
Consumption Gross Income Cattle Calves Thousand Pounds Dollars Thousand Dollars
2000 502,932 592,200 70.00 102.00 438,060 2,737 440,797 2001 493,218 490,960 70.30 100.00 362,816 2,774 365,590 2002 496,245 456,000 63.50 90.00 305,778 2,926 308,704 2003 522,247 598,380 68.60 96.10 425,889 3,043 428,932 2004 518,834 553,020 80.70 125.00 469,323 3,010 472,333 2005 489,920 526,460 84.00 127.00 462,866 2,936 465,802 2006 464,130 475,700 81.50 122.00 407,136 3,094 410,230 2007 455,778 506,300 77.00 112.00 407,491 2,401 409,892 2008 448,141 440,900 73.40 98.80 331,749 2,249 333,998 2009 451,778 446,080 67.20 88.50 308,286 2,006 310,292
1999 2000 2001 2002 2003 2004 2005 2006 2007 2008 2009
Year
0100200300400500600700Millions
Marketings (lbs.) Cash Receipts ($)
Cattle: Marketings & Cash Receipts
USDA, NASS, Alabama Field Office 29
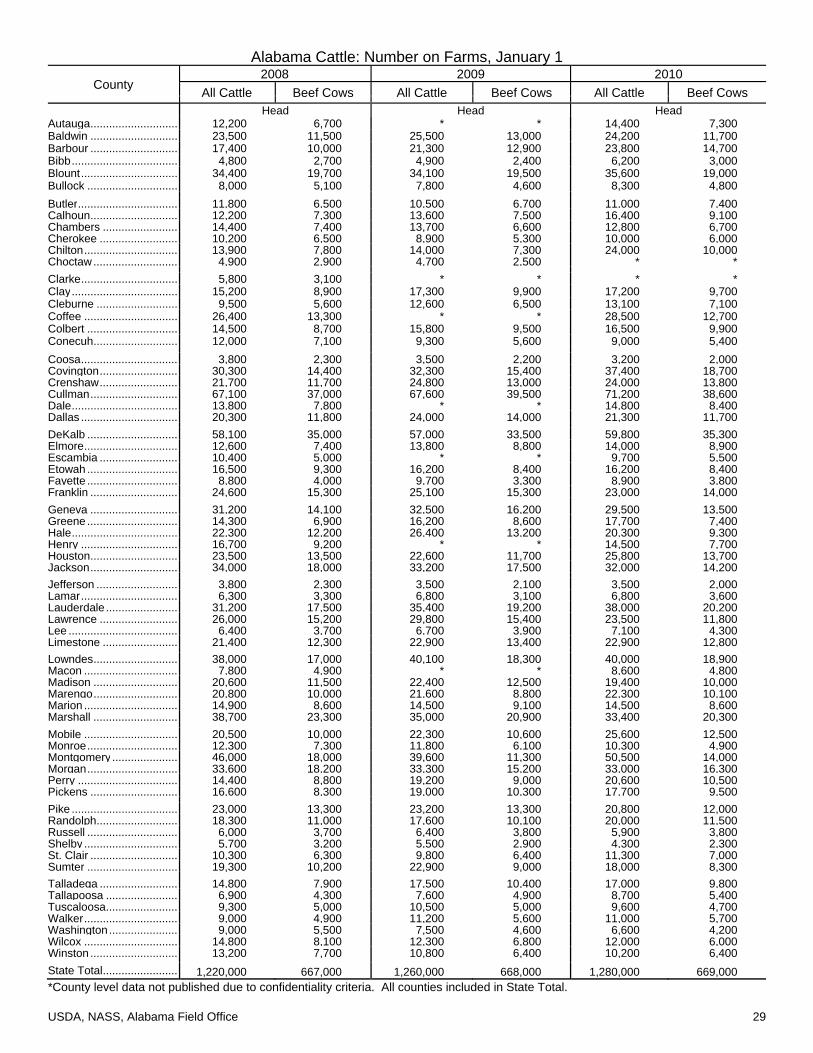
Alabama Cattle: Number on Farms, January 1
County 2008 2009 2010
All Cattle Beef Cows All Cattle Beef Cows All Cattle Beef Cows Head Head Head
Autauga ............................ 12,200 6,700 * * 14,400 7,300Baldwin ............................ 23,500 11,500 25,500 13,000 24,200 11,700Barbour ............................ 17,400 10,000 21,300 12,900 23,800 14,700Bibb .................................. 4,800 2,700 4,900 2,400 6,200 3,000Blount ............................... 34,400 19,700 34,100 19,500 35,600 19,000Bullock ............................. 8,000 5,100 7,800 4,600 8,300 4,800Butler ................................ 11,800 6,500 10,500 6,700 11,000 7,400Calhoun ............................ 12,200 7,300 13,600 7,500 16,400 9,100Chambers ........................ 14,400 7,400 13,700 6,600 12,800 6,700Cherokee ......................... 10,200 6,500 8,900 5,300 10,000 6,000Chilton .............................. 13,900 7,800 14,000 7,300 24,000 10,000Choctaw ........................... 4,900 2,900 4,700 2,500 * *Clarke ............................... 5,800 3,100 * * * *Clay .................................. 15,200 8,900 17,300 9,900 17,200 9,700Cleburne .......................... 9,500 5,600 12,600 6,500 13,100 7,100Coffee .............................. 26,400 13,300 * * 28,500 12,700Colbert ............................. 14,500 8,700 15,800 9,500 16,500 9,900Conecuh ........................... 12,000 7,100 9,300 5,600 9,000 5,400Coosa ............................... 3,800 2,300 3,500 2,200 3,200 2,000Covington ......................... 30,300 14,400 32,300 15,400 37,400 18,700Crenshaw ......................... 21,700 11,700 24,800 13,000 24,000 13,800Cullman ............................ 67,100 37,000 67,600 39,500 71,200 38,600Dale .................................. 13,800 7,800 * * 14,800 8,400Dallas ............................... 20,300 11,800 24,000 14,000 21,300 11,700DeKalb ............................. 58,100 35,000 57,000 33,500 59,800 35,300Elmore .............................. 12,600 7,400 13,800 8,800 14,000 8,900Escambia ......................... 10,400 5,000 * * 9,700 5,500Etowah ............................. 16,500 9,300 16,200 8,400 16,200 8,400Fayette ............................. 8,800 4,000 9,700 3,300 8,900 3,800Franklin ............................ 24,600 15,300 25,100 15,300 23,000 14,000Geneva ............................ 31,200 14,100 32,500 16,200 29,500 13,500Greene ............................. 14,300 6,900 16,200 8,600 17,700 7,400Hale .................................. 22,300 12,200 26,400 13,200 20,300 9,300Henry ............................... 16,700 9,200 * * 14,500 7,700Houston ............................ 23,500 13,500 22,600 11,700 25,800 13,700Jackson ............................ 34,000 18,000 33,200 17,500 32,000 14,200Jefferson .......................... 3,800 2,300 3,500 2,100 3,500 2,000Lamar ............................... 6,300 3,300 6,800 3,100 6,800 3,600Lauderdale ....................... 31,200 17,500 35,400 19,200 38,000 20,200Lawrence ......................... 26,000 15,200 29,800 15,400 23,500 11,800Lee ................................... 6,400 3,700 6,700 3,900 7,100 4,300Limestone ........................ 21,400 12,300 22,900 13,400 22,900 12,800Lowndes ........................... 38,000 17,000 40,100 18,300 40,000 18,900Macon .............................. 7,800 4,900 * * 8,600 4,800Madison ........................... 20,600 11,500 22,400 12,500 19,400 10,000Marengo ........................... 20,800 10,000 21,600 8,800 22,300 10,100Marion .............................. 14,900 8,600 14,500 9,100 14,500 8,600Marshall ........................... 38,700 23,300 35,000 20,900 33,400 20,300Mobile .............................. 20,500 10,000 22,300 10,600 25,600 12,500Monroe ............................. 12,300 7,300 11,800 6,100 10,300 4,900Montgomery ..................... 46,000 18,000 39,600 11,300 50,500 14,000Morgan ............................. 33,600 18,200 33,300 15,200 33,000 16,300Perry ................................ 14,400 8,800 19,200 9,000 20,600 10,500Pickens ............................ 16,600 8,300 19,000 10,300 17,700 9,500Pike .................................. 23,000 13,300 23,200 13,300 20,800 12,000Randolph .......................... 18,300 11,000 17,600 10,100 20,000 11,500Russell ............................. 6,000 3,700 6,400 3,800 5,900 3,800Shelby .............................. 5,700 3,200 5,500 2,900 4,300 2,300St. Clair ............................ 10,300 6,300 9,800 6,400 11,300 7,000Sumter ............................. 19,300 10,200 22,900 9,000 18,000 8,300Talladega ......................... 14,800 7,900 17,500 10,400 17,000 9,800Tallapoosa ....................... 6,900 4,300 7,600 4,900 8,700 5,400Tuscaloosa ....................... 9,300 5,000 10,500 5,000 9,600 4,700Walker .............................. 9,000 4,900 11,200 5,600 11,000 5,700Washington ...................... 9,000 5,500 7,500 4,600 6,600 4,200Wilcox .............................. 14,800 8,100 12,300 6,800 12,000 6,000Winston ............................ 13,200 7,700 10,800 6,400 10,200 6,400State Total ........................ 1,220,000 667,000 1,260,000 668,000 1,280,000 669,000 *County level data not published due to confidentiality criteria. All counties included in State Total.
30 USDA, NASS, Alabama Field Office
Hogs and Pigs, 2009
Hog and Pig Inventory
99 00 01 02 03 04 05 06 07 08 09130140150160170180190200 Thousand Head
Hog and Pig Inventory1999 - 2009
Hogs and Pigs: December 1 Inventory and Value, 2000-2009
Year Breeding Hogs
Market Hogs and PigsTotal
Value Per
Head
Total Value Under
50 Under
60 Lbs. 50-119
Lbs. 60-119
Lbs.120-179
Lbs.180 Lbs.
Total
Thousand Head Dollars Thou Dols
2000 15 - 54 - 34 31 31 150 165 76.00 12,540
2001 15 - 63 - 42 37 38 180 195 76.00 14,820
2002 12 - 67 - 29 28 29 153 165 70.00 11,550
2003 15 - 65 - 30 27 28 150 165 66.00 10,890
2004 18 - 69 - 32 30 31 162 180 100.00 18,000
2005 17 - 60 - 30 27 26 143 160 93.00 14,880
2006 19 - 62 - 29 26 29 146 165 87.00 14,355
2007 18 - 65 - 32 30 30 157 175 72.00 12,600
2008 * 17 63 - 44 - 23 28 158 175 88.00 15,400
2009 16 57 - 23 - 23 21 124 140 82.00 11,480 * Weight category change beginning in 2008.
USDA, NASS, Alabama Field Office 31
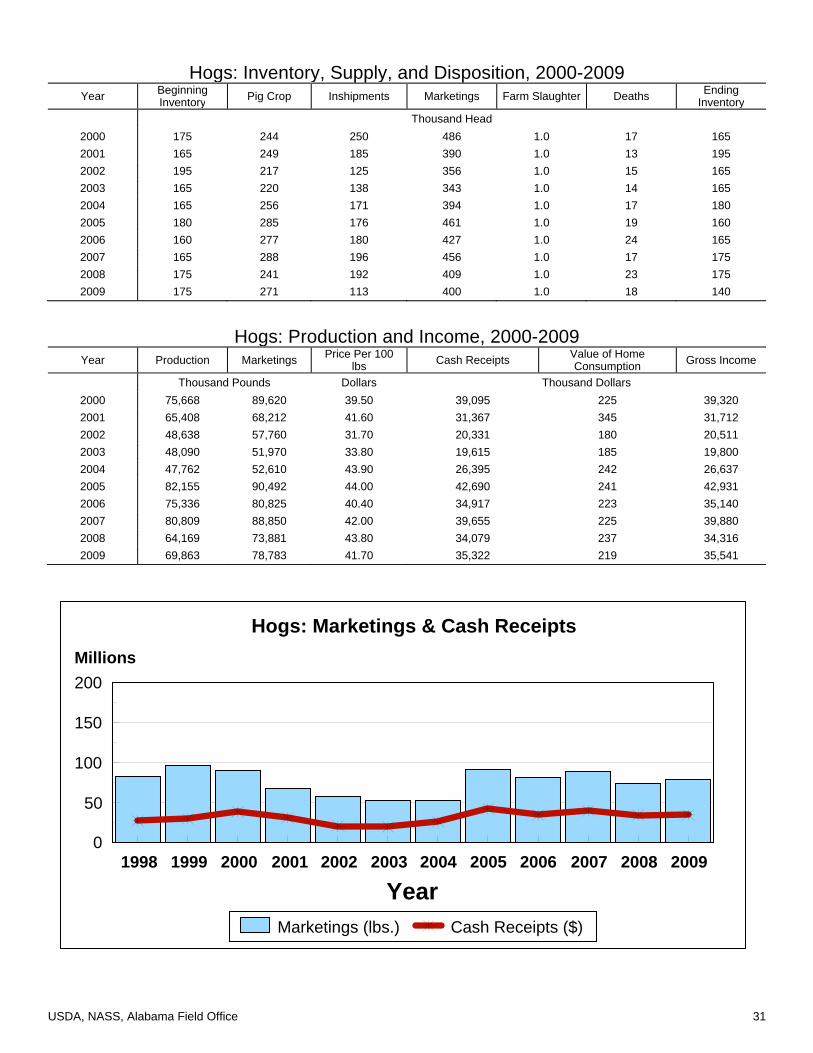
Hogs: Inventory, Supply, and Disposition, 2000-2009
Year Beginning Inventory Pig Crop Inshipments Marketings Farm Slaughter Deaths Ending
Inventory Thousand Head
2000 175 244 250 486 1.0 17 165 2001 165 249 185 390 1.0 13 195 2002 195 217 125 356 1.0 15 165 2003 165 220 138 343 1.0 14 165 2004 165 256 171 394 1.0 17 180 2005 180 285 176 461 1.0 19 160 2006 160 277 180 427 1.0 24 165 2007 165 288 196 456 1.0 17 175 2008 175 241 192 409 1.0 23 175 2009 175 271 113 400 1.0 18 140
Hogs: Production and Income, 2000-2009 Year Production Marketings Price Per 100
lbs Cash Receipts Value of Home Consumption Gross Income
Thousand Pounds Dollars Thousand Dollars 2000 75,668 89,620 39.50 39,095 225 39,320 2001 65,408 68,212 41.60 31,367 345 31,712 2002 48,638 57,760 31.70 20,331 180 20,511 2003 48,090 51,970 33.80 19,615 185 19,800 2004 47,762 52,610 43.90 26,395 242 26,637 2005 82,155 90,492 44.00 42,690 241 42,931 2006 75,336 80,825 40.40 34,917 223 35,140 2007 80,809 88,850 42.00 39,655 225 39,880 2008 64,169 73,881 43.80 34,079 237 34,316 2009 69,863 78,783 41.70 35,322 219 35,541
1998 1999 2000 2001 2002 2003 2004 2005 2006 2007 2008 2009
Year
0
50
100
150
200Millions
Marketings (lbs.) Cash Receipts ($)
Hogs: Marketings & Cash Receipts

32 USDA, NASS, Alabama Field Office
Goats: Alabama and U.S. 2006-2010
Year Meat and Other Goats Milk Goats
Alabama Percent Change for Alabama U.S. Alabama Percent Change
for Alabama U.S.
January Head Head 2006 43,000 108 2,336,000 3,000 100 305,0002007 53,000 123 2,507,000 3,500 117 311,0002008 70,000 132 2,590,000 4,000 114 323,0002009 65,000 93 2,549,000 4,500 113 335,0002010 60,000 92 2,538,000 4,200 93 355,000
Honey Production 2000-2009 Year Honey Producing Colonies Yield Per Colony Production Average Price Per Pound Value of Production
Thousand Pounds Thousand Pounds Cents Thousand Dollars 2000 16 78 1,248 59 736 2001 14 73 1,022 72 736 2002 12 86 1,032 118 1,218 2003 13 82 1,066 124 1,322 2004 12 87 1,044 141 1,472 2005 13 66 858 102 875 2006 11 72 792 121 958 2007 11 56 616 149 918 2008 9 66 594 190 1,129 2009 9 49 441 182 803
Milk Cows
00 01 02 03 04 05 06 07 08 09 109
12
15
18
21
24
27 Thousand Head
Milk Cow Inventory2000 - 2010

USDA, NASS, Alabama Field Office 33
Catfish Water Acres
Catfish: Quarterly Inventory, 2006-2010Date Broodfish Total Food Size Total Stockers Fingerlings 1/
Number Pounds Number Pounds Number Pounds Number Pounds ThousandJanuary 2006 89 400 67,220 91,700 304,700 38,500 167,000 5,970 2007 70 324 61,190 80,650 94,900 25,050 60,000 2,350 2008 96 393 59,560 82,200 100,000 25,950 64,700 2,850 2009 39 197 63,100 97,050 73,300 20,100 78,800 3,150 2010 10 73 75,300 109,700 46,700 13,100 23,400 1,250
July 2006 73 348 69,570 92,100 141,300 34,300 71,400 1,040 2007 * * 45,110 58,700 138,300 38,750 69,300 1,230 2008 60 260 59,000 85,400 91,000 24,800 * * 2009 59 266 62,600 93,950 87,100 22,450 54,000 960 2010 21 99 67,500 97,500 79,600 18,200 40,200 1,200
1/ Fingerling inventory for July includes fry. *Not published to avoid disclosure of individual operations.
Total Annual Sales, Number of Operations and Water Surface Acreage, 2006-2010Item Unit 2006 2007 2008 2009 2010
Total Annual Sales $1,000 96,710 95,782 93,254 90,688 N/A Operations, Jan 1 Number 194 199 252 N/A N/A Water Surface Area, Jan 1 Acres 23,700 23,900 22,200 22,100 19,800
Catfish Water Surface Acres, 2010
01 02 03 04 05 06 07 08 09 1019.020.021.022.023.024.025.026.027.028.0 Thousand Acres
Water Surface Acres

34 USDA, NASS, Alabama Field Office
Poultry Review 2009
Alabama broiler producers marketed 1,002.3 million birds during the 2009 marketing year, a 6 percent decrease from the previous year. Cullman was the leading broiler county, followed by DeKalb, Marshall, and Coffee. Cash receipts amounted to $2.52 billion, down 6 percent from 2008. Alabama ranked third nationally in broiler production behind Georgia and Arkansas. Commercial broiler hatcheries in Alabama hatched 1.28 billion chicks for the period October 1, 2008 through September 30, 2009, down 8 percent from the previous year. Alabama hatcheries shipped 236.2 million broiler-type chicks to other states, including 46.5 million to Mississippi and 116.4 million to Georgia. Egg-type hatchery data are not published to avoid disclosing individual operations. During 2009, Alabama's laying flocks produced 2.11 billion eggs, down 2 percent from the previous year. Cash receipts from eggs were $281.0 million, down 6 percent from the previous year. Alabama ranked 14th nationally in egg production. There were 9.03 million layers 20 weeks old and older on hand December 1, 2009. Cullman County had the largest layer inventory, followed by DeKalb, Randolph and Marshall counties.
Poultry Facts Y A cockerel is a male chicken under one year of age; cock or a rooster is a male more than one year old; pullet is a female under one year, and a hen is a female over one year of age Y A broiler or fryer is a young meat-type chicken that can be cooked tender by broiling or frying and usually weighing between 2 ½ and 3 ½ pounds Y A roaster is a young meat type chicken that can be cooked tender by roasting and usually weighing 4 pounds or more Y Laying hens will start to lay eggs at about 20 weeks of age
Annual Egg Production
2000 2001 2002 2003 2004 2005 2006 2007 2008 20090.25
0.50
0.75
1.00
Table Eggs (Billion)
1.55
1.60
1.65
1.70
1.75
1.80
Hatching Eggs (Billion)
Table Hatching
Alabama Egg Production.
Year Total Table Hatching
Million
2000 2,371 791 1,580
2001 2,359 730 1,629
2002 2,281 635 1,646
2003 2,190 589 1,601
2004 2,099 517 1,582
2005 2,071 461 1,610
2006 2,131 449 1,682
2007 2,090 341 1,749
2008 2,150 374 1,776
2009 2,106 368 1,738

USDA, NASS, Alabama Field Office 35
Broilers Produced, 2009
Broiler Production
Leading Counties Thousand Birds Cullman ........................................ 118,768DeKalb.......................................... 102,001Marshall.......................................... 64,696Coffee............................................. 58,696
00 01 02 03 04 05 06 07 08 09980
1,000
1,020
1,040
1,060
1,080
1,100 Million Birds
Broiler Production2000 - 2009
Commercial Broilers: Production and Value of Production, 2000-2009
Year Number Produced
Average Live weight Per Broiler
Pounds Produced
Price Per Pound
Value of Production
Mil Pounds Bil Cents Bil Dollars
2000 1,038.7 5.1 5.30 33.0 1.75
2001 1,007.6 5.1 5.14 39.0 2.00
2002 1,051.3 5.1 5.36 30.0 1.61
2003 1,039.4 5.2 5.40 34.0 1.84 2004 1,052.0 5.2 5.47 44.0 2.41
2005 1,057.3 5.3 5.60 43.0 2.41
2006 1,053.4 5.4 5.69 36.0 2.05
2007 1,022.7 5.5 5.62 43.0 2.42
2008 1,062.9 5.5 5.85 46.0 2.69
2009 1,002.3 5.5 5.51 45.7 2.52
Marketing year: December 1 - November 30.

36 USDA, NASS, Alabama Field Office
Layers 20 Weeks and Older, 2009
Layer Inventory
Leading Counties Thousand Birds Cullman ............................................ 1,532DeKalb.............................................. 1,342Randolph............................................. 549Marshall............................................... 531
00 01 02 03 04 05 06 07 08 098.5
9.0
9.5
10.0
10.5 Million Birds
Layer Inventory2000 - 2009
Poultry: December 1 Inventory and Value, 2000-2009
Year Layers 20 Weeks Old and Older
Pullets Less Than 20 Weeks Old
Other Chickens
All Chickens (excluding broilers)
Number
Value Per Bird
Total Value
Thousand Head Thousand Head Dollars Thousand Dollars
2000 10,183 4,366 1,098 15,647 5.30 82,929
2001 10,390 4,413 1,100 15,903 4.90 77,925
2002 9,645 4,385 1,226 15,256 3.60 54,922
2003 9,328 3,983 1,114 14,425 4.20 60,585
2004 9,237 4,025 1,004 14,266 3.70 52,784
2005 9,138 4,045 1,034 14,217 4.00 56,868
2006 9,568 5,026 974 15,568 4.50 70,056 2007 9,379 5,006 1,029 15,414 4.80 73,9872008 9,382 5,291 1,042 15,715 5.60 88,0042009 9,029 5,446 1,208 15,683 6.70 105,076
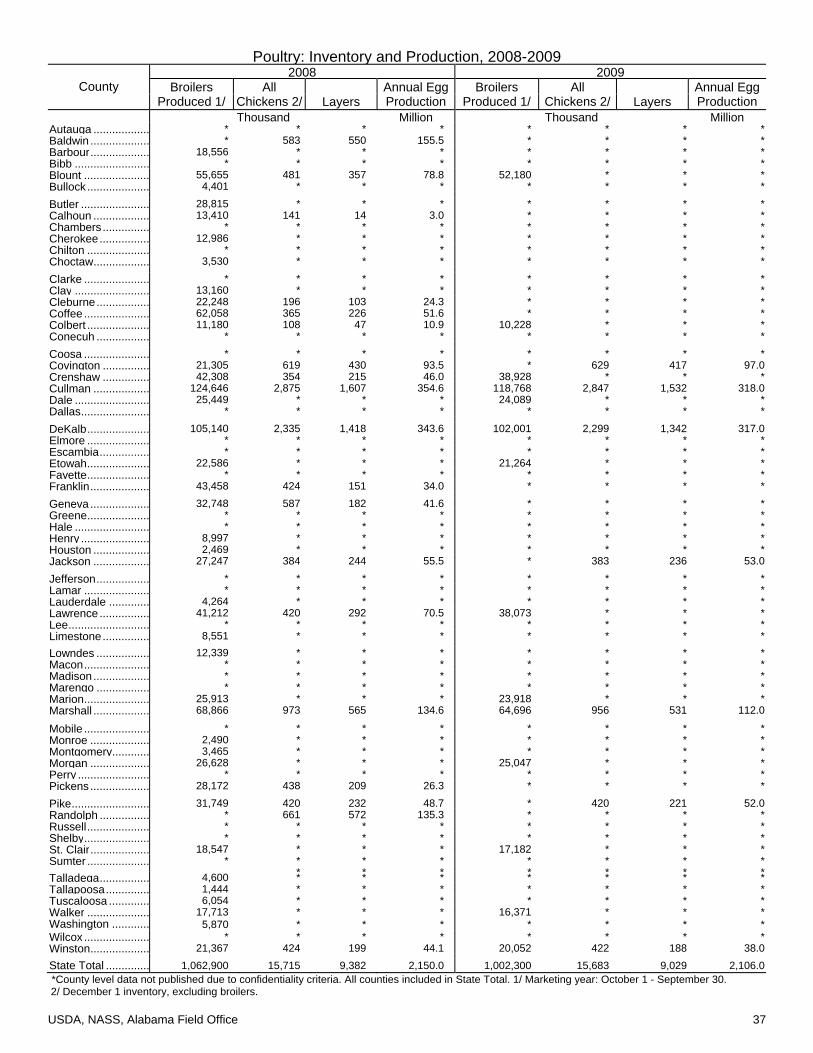
USDA, NASS, Alabama Field Office 37
Poultry: Inventory and Production, 2008-2009
County 2008 2009
Broilers Produced 1/
All Chickens 2/
Layers
Annual Egg Production
Broilers Produced 1/
All Chickens 2/
Layers
Annual Egg Production
Thousand Million Thousand MillionAutauga .................. * * * * * * * *Baldwin ................... * 583 550 155.5 * * * *Barbour ................... 18,556 * * * * * * *Bibb ........................ * * * * * * * *Blount ..................... 55,655 481 357 78.8 52,180 * * *Bullock .................... 4,401 * * * * * * *
Butler ...................... 28,815 * * * * * * *Calhoun .................. 13,410 141 14 3.0 * * * *Chambers ............... * * * * * * * *Cherokee ................ 12,986 * * * * * * *Chilton .................... * * * * * * * *Choctaw .................. 3,530 * * * * * * *
Clarke ..................... * * * * * * * *Clay ........................ 13,160 * * * * * * *Cleburne ................. 22,248 196 103 24.3 * * * *Coffee ..................... 62,058 365 226 51.6 * * * *Colbert .................... 11,180 108 47 10.9 10,228 * * *Conecuh ................. * * * * * * * *
Coosa ..................... * * * * * * * *Covington ............... 21,305 619 430 93.5 * 629 417 97.0Crenshaw ............... 42,308 354 215 46.0 38,928 * * *Cullman .................. 124,646 2,875 1,607 354.6 118,768 2,847 1,532 318.0Dale ........................ 25,449 * * * 24,089 * * *Dallas ...................... * * * * * * * *
DeKalb .................... 105,140 2,335 1,418 343.6 102,001 2,299 1,342 317.0Elmore .................... * * * * * * * *Escambia ................ * * * * * * * *Etowah .................... 22,586 * * * 21,264 * * *Fayette .................... * * * * * * * *Franklin ................... 43,458 424 151 34.0 * * * *
Geneva ................... 32,748 587 182 41.6 * * * *Greene .................... * * * * * * * *Hale ........................ * * * * * * * *Henry ...................... 8,997 * * * * * * *Houston .................. 2,469 * * * * * * *Jackson .................. 27,247 384 244 55.5 * 383 236 53.0
Jefferson ................. * * * * * * * *Lamar ..................... * * * * * * * *Lauderdale ............. 4,264 * * * * * * *Lawrence ................ 41,212 420 292 70.5 38,073 * * *Lee .......................... * * * * * * * *Limestone ............... 8,551 * * * * * * *Lowndes ................. 12,339 * * * * * * *Macon ..................... * * * * * * * *Madison .................. * * * * * * * *Marengo ................. * * * * * * * *Marion ..................... 25,913 * * * 23,918 * * *Marshall .................. 68,866 973 565 134.6 64,696 956 531 112.0
Mobile ..................... * * * * * * * *Monroe ................... 2,490 * * * * * * *Montgomery ............ 3,465 * * * * * * *Morgan ................... 26,628 * * * 25,047 * * *Perry ....................... * * * * * * * *Pickens ................... 28,172 438 209 26.3 * * * *
Pike ......................... 31,749 420 232 48.7 * 420 221 52.0Randolph ................ * 661 572 135.3 * * * *Russell .................... * * * * * * * *Shelby ..................... * * * * * * * *St. Clair ................... 18,547 * * * 17,182 * * *Sumter .................... * * * * * * * *
* * * * * * *Talladega ................ 4,600 * * * * * * *Tallapoosa .............. 1,444 * * * * * * *Tuscaloosa ............. 6,054 * * * * * * *Walker .................... 17,713 * * * 16,371 * * *Washington ............ 5,870 * * * * * * *Wilcox ..................... * * * * * * * *Winston ................... 21,367 424 199 44.1 20,052 422 188 38.0State Total .............. 1,062,900 15,715 9,382 2,150.0 1,002,300 15,683 9,029 2,106.0 *County level data not published due to confidentiality criteria. All counties included in State Total. 1/ Marketing year: October 1 - September 30. 2/ December 1 inventory, excluding broilers.

38 USDA, NASS, Alabama Field Office
Prices Review 2009
Marketing Year Average Prices Received by Farmers, 2000-2009 1/
Commodity Unit 2000 2001 2002 2003 2004 2005 2006 2007 2008 2009
Corn $/bu. 2.16 2.35 2.72 2.36 2.48 2.50 2.91 4.54 5.26 4.15
Cotton ct/lb. 52.8 27.7 43.5 59.6 40.6 48.7 44.6 59.7 59.3 64.4
Cottonseed $/ton 92.00 76.00 85.50 98.50 91.00 81.50 90.50 135.00 196.00 129.00
Hay $/ton 56.00 55.00 57.00 58.00 57.00 57.00 68.00 97.00 98.00 77.00
Peanuts ct/lb. 26.6 24.2 16.4 18.3 17.8 16.5 16.8 19.1 22.5 22.2
Soybeans $/bu. 4.75 4.60 5.55 7.25 6.25 5.95 6.85 11.40 10.30 10.40
Sorghum Grain $/cwt. 3.48 3.75 4.10 4.10 4.00 3.50 5.00 7.00 6.10 3/
Wheat $/bu. 2.35 2.55 3.10 3.20 3.55 3.10 3.95 5.30 5.95 4.60
Blueberries $/lb. 0.953 0.917 0.944 1.070 1.220 .905 1.380 1.590 1.330 1.640
Peaches 2/ $/ton 40.5 41.8 880.00 940.00 661.00 808.00 977.00 1,050.00 1,030.00 1,250.00
Pecans $/lb. .800 .507 .634 .909 1.18 1.10 1.23 .852 1.24 1.16
Potatoes $/cwt. 11.50 10.40 11.60 9.30 6.60 8.55 15.00 17.30 15.10 3/
Sweet Potatoes $/cwt. 15.20 18.20 14.80 25.50 20.80 21.40 25.70 31.90 12.10 20.50
Sweet Corn $/cwt. 13.70 17.60 17.00 17.20 19.40 19.20 23.80 24.20 29.50 30.00
Tomatoes $/cwt. 25.90 21.80 23.10 28.80 34.80 31.00 35.00 26.30 25.80 32.30
Watermelons $/cwt. 5.60 6.60 6.65 7.40 7.20 9.50 9.10 11.50 10.80 10.60
Broilers ct/lb. 33.0 39.0 30.0 34.0 44.0 43.0 36.0 43.0 46.0 45.7
Eggs, Table ct/doz. 42.0 46.7 40.7 57.6 56.4 34.5 41.8 75.7 1.030 66.3
Catfish, Foodsize ct/lb. 69.0 59.0 52.0 52.0 66.0 65.0 75.0 73.0 70.0 70.0
Honey ct/lb. 59.0 72.0 118.0 124.0 141.0 102.0 121.0 149.0 190.0 182.0
Hogs $/cwt. 39.50 41.60 31.70 33.80 43.90 44.00 40.40 42.00 43.80 41.70
All Beef Cattle $/cwt. 70.00 70.30 63.50 68.60 80.70 84.00 81.50 77.00 73.40 67.20
Calves $/cwt. 102.00 100.00 90.00 96.10 125.00 127.00 122.00 112.00 98.80 88.50
Steers and Heifers $/cwt. 83.10 82.90 75.00 82.70 96.40 101.00 98.40 91.20 85.00 79.00
Milk Cows $/head 1,300 1,550 1,550 1,350 1,600 1,750 1,600 1,850 1,800 1,400
Milk, Wholesale $/cwt. 14.20 16.90 14.00 14.10 17.90 16.90 15.40 21.40 21.70 15.60
1/ Marketing year average prices are weighted prices for commodities sold during the marketing year. They represent average prices received by farmers at point of first sale for all grades and qualities. 2/ Unit change in 2002 from ct/lb to $/ton. 3/ Program discontinued in Alabama.
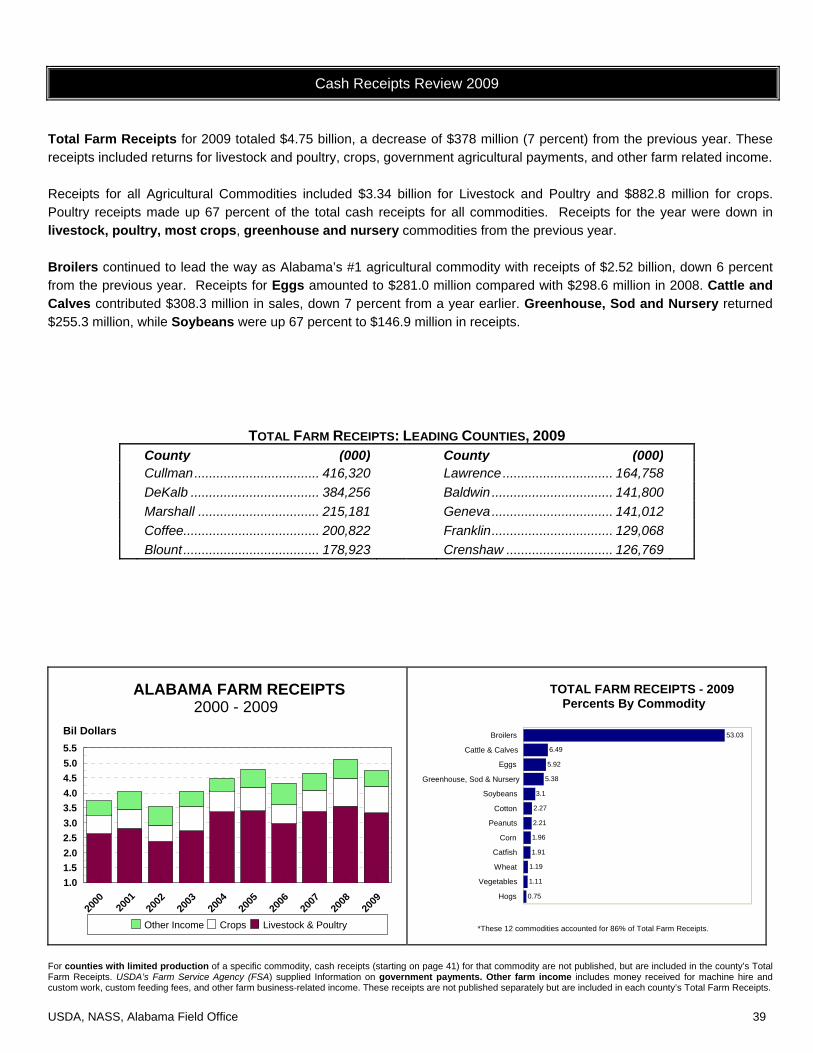
USDA, NASS, Alabama Field Office 39
Cash Receipts Review 2009
Total Farm Receipts for 2009 totaled $4.75 billion, a decrease of $378 million (7 percent) from the previous year. These receipts included returns for livestock and poultry, crops, government agricultural payments, and other farm related income. Receipts for all Agricultural Commodities included $3.34 billion for Livestock and Poultry and $882.8 million for crops. Poultry receipts made up 67 percent of the total cash receipts for all commodities. Receipts for the year were down in livestock, poultry, most crops, greenhouse and nursery commodities from the previous year. Broilers continued to lead the way as Alabama’s #1 agricultural commodity with receipts of $2.52 billion, down 6 percent from the previous year. Receipts for Eggs amounted to $281.0 million compared with $298.6 million in 2008. Cattle and Calves contributed $308.3 million in sales, down 7 percent from a year earlier. Greenhouse, Sod and Nursery returned $255.3 million, while Soybeans were up 67 percent to $146.9 million in receipts.
TOTAL FARM RECEIPTS: LEADING COUNTIES, 2009 County (000) County (000)
Cullman .................................. 416,320 Lawrence .............................. 164,758 DeKalb ................................... 384,256 Baldwin ................................. 141,800 Marshall ................................. 215,181 Geneva ................................. 141,012 Coffee..................................... 200,822 Franklin ................................. 129,068 Blount ..................................... 178,923 Crenshaw ............................. 126,769
2000
2001
2002
2003
2004
2005
2006
2007
2008
2009
1.01.52.02.53.03.54.04.55.05.5Bil Dollars
Other Income Crops Livestock & Poultry
ALABAMA FARM RECEIPTS2000 - 2009
53.03
6.49
5.92
5.38
3.1
2.27
2.21
1.96
1.91
1.19
1.11
0.75
Broilers
Cattle & Calves
Eggs
Greenhouse, Sod & Nursery
Soybeans
Cotton
Peanuts
Corn
Catfish
Wheat
Vegetables
Hogs
. *These 12 commodities accounted for 86% of Total Farm Receipts.
TOTAL FARM RECEIPTS - 2009 Percents By Commodity
.
For counties with limited production of a specific commodity, cash receipts (starting on page 41) for that commodity are not published, but are included in the county’s Total Farm Receipts. USDA’s Farm Service Agency (FSA) supplied Information on government payments. Other farm income includes money received for machine hire and custom work, custom feeding fees, and other farm business-related income. These receipts are not published separately but are included in each county’s Total Farm Receipts.
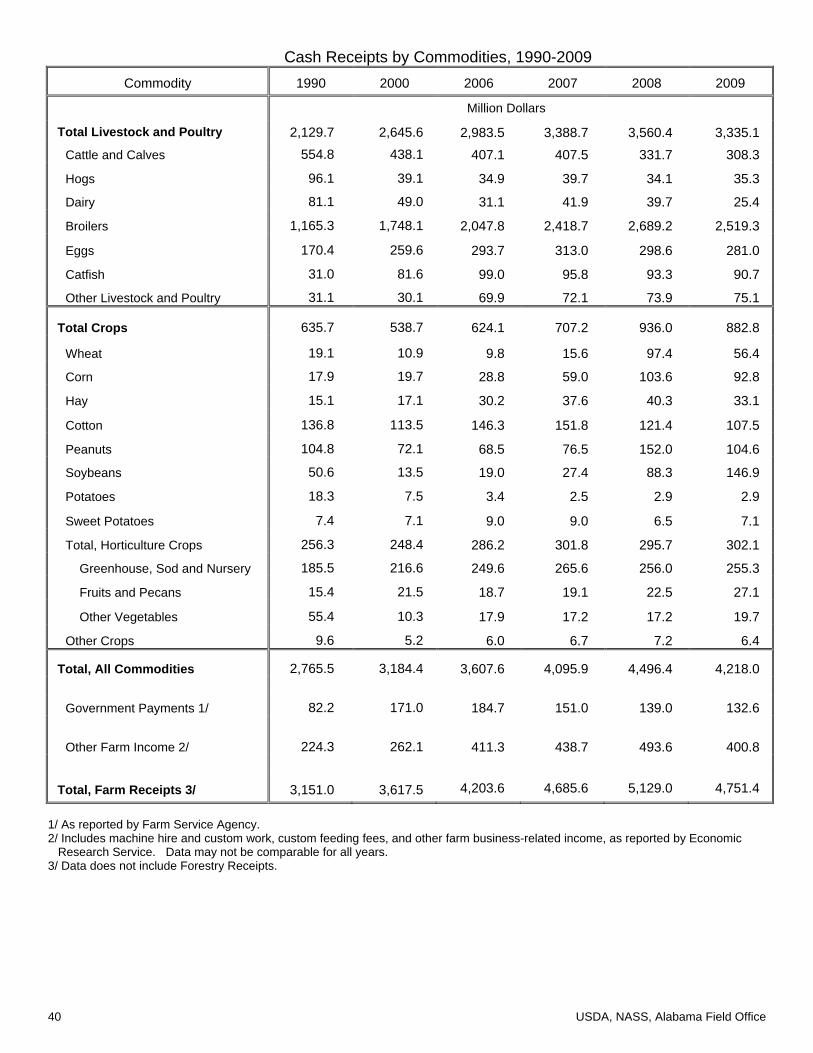
40 USDA, NASS, Alabama Field Office
Cash Receipts by Commodities, 1990-2009 Commodity 1990 2000 2006 2007 2008 2009
Million Dollars
Total Livestock and Poultry 2,129.7 2,645.6 2,983.5 3,388.7 3,560.4 3,335.1 Cattle and Calves 554.8 438.1 407.1 407.5 331.7 308.3
Hogs 96.1 39.1 34.9 39.7 34.1 35.3
Dairy 81.1 49.0 31.1 41.9 39.7 25.4
Broilers 1,165.3 1,748.1 2,047.8 2,418.7 2,689.2 2,519.3
Eggs 170.4 259.6 293.7 313.0 298.6 281.0
Catfish 31.0 81.6 99.0 95.8 93.3 90.7
Other Livestock and Poultry 31.1 30.1 69.9 72.1 73.9 75.1
Total Crops 635.7 538.7 624.1 707.2 936.0 882.8
Wheat 19.1 10.9 9.8 15.6 97.4 56.4
Corn 17.9 19.7 28.8 59.0 103.6 92.8
Hay 15.1 17.1 30.2 37.6 40.3 33.1
Cotton 136.8 113.5 146.3 151.8 121.4 107.5
Peanuts 104.8 72.1 68.5 76.5 152.0 104.6
Soybeans 50.6 13.5 19.0 27.4 88.3 146.9
Potatoes 18.3 7.5 3.4 2.5 2.9 2.9
Sweet Potatoes 7.4 7.1 9.0 9.0 6.5 7.1
Total, Horticulture Crops 256.3 248.4 286.2 301.8 295.7 302.1
Greenhouse, Sod and Nursery 185.5 216.6 249.6 265.6 256.0 255.3
Fruits and Pecans 15.4 21.5 18.7 19.1 22.5 27.1
Other Vegetables 55.4 10.3 17.9 17.2 17.2 19.7
Other Crops 9.6 5.2 6.0 6.7 7.2 6.4
Total, All Commodities 2,765.5 3,184.4 3,607.6 4,095.9 4,496.4 4,218.0 Government Payments 1/ 82.2 171.0 184.7 151.0 139.0 132.6 Other Farm Income 2/ 224.3 262.1 411.3 438.7 493.6 400.8
Total, Farm Receipts 3/ 3,151.0 3,617.5 4,203.6 4,685.6 5,129.0 4,751.4
1/ As reported by Farm Service Agency. 2/ Includes machine hire and custom work, custom feeding fees, and other farm business-related income, as reported by Economic Research Service. Data may not be comparable for all years. 3/ Data does not include Forestry Receipts.
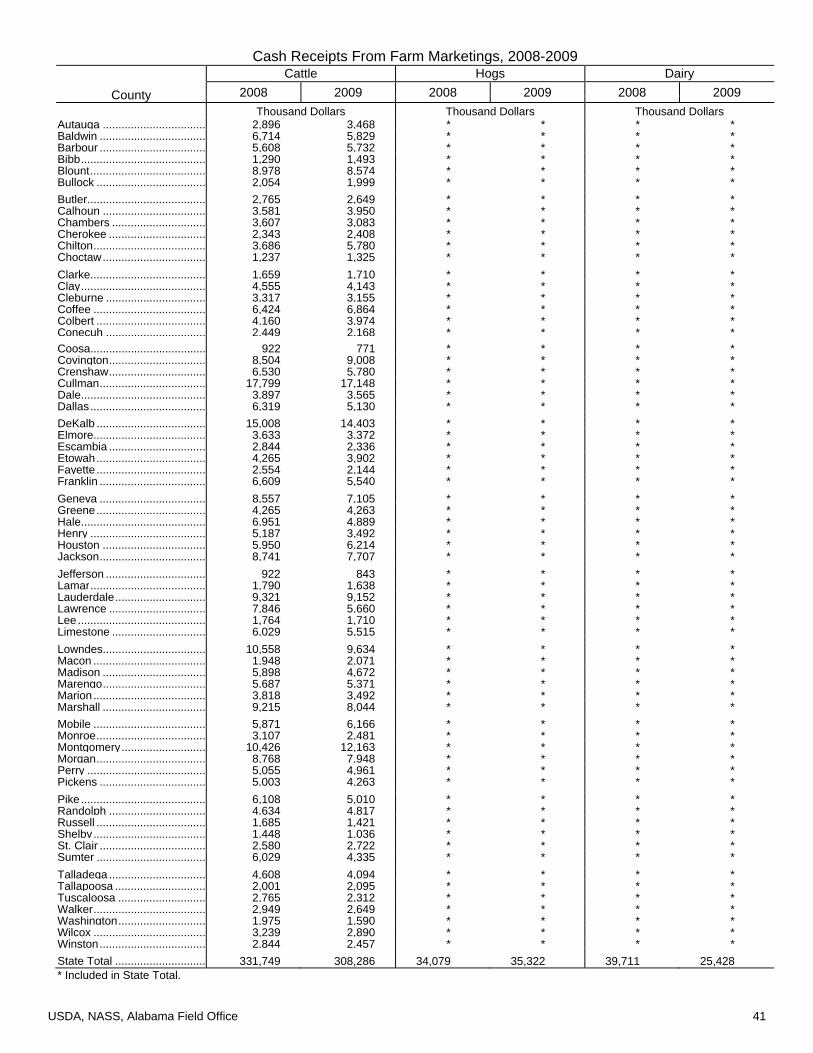
USDA, NASS, Alabama Field Office 41
Cash Receipts From Farm Marketings, 2008-2009
County
Cattle Hogs Dairy 2008 2009 2008 2009 2008 2009
Thousand Dollars Thousand Dollars Thousand DollarsAutauga ................................. 2,896 3,468 * * * *Baldwin .................................. 6,714 5,829 * * * *Barbour .................................. 5,608 5,732 * * * *Bibb ........................................ 1,290 1,493 * * * *Blount ..................................... 8,978 8,574 * * * *Bullock ................................... 2,054 1,999 * * * *Butler ...................................... 2,765 2,649 * * * *Calhoun ................................. 3,581 3,950 * * * *Chambers .............................. 3,607 3,083 * * * *Cherokee ............................... 2,343 2,408 * * * *Chilton .................................... 3,686 5,780 * * * *Choctaw ................................. 1,237 1,325 * * * *Clarke..................................... 1,659 1,710 * * * *Clay ........................................ 4,555 4,143 * * * *Cleburne ................................ 3,317 3,155 * * * *Coffee .................................... 6,424 6,864 * * * *Colbert ................................... 4,160 3,974 * * * *Conecuh ................................ 2,449 2,168 * * * *Coosa..................................... 922 771 * * * *Covington ............................... 8,504 9,008 * * * *Crenshaw ............................... 6,530 5,780 * * * *Cullman .................................. 17,799 17,148 * * * *Dale ........................................ 3,897 3,565 * * * *Dallas ..................................... 6,319 5,130 * * * *DeKalb ................................... 15,008 14,403 * * * *Elmore.................................... 3,633 3,372 * * * *Escambia ............................... 2,844 2,336 * * * *Etowah ................................... 4,265 3,902 * * * *Fayette ................................... 2,554 2,144 * * * *Franklin .................................. 6,609 5,540 * * * *Geneva .................................. 8,557 7,105 * * * *Greene ................................... 4,265 4,263 * * * *Hale ........................................ 6,951 4,889 * * * *Henry ..................................... 5,187 3,492 * * * *Houston ................................. 5,950 6,214 * * * *Jackson .................................. 8,741 7,707 * * * *Jefferson ................................ 922 843 * * * *Lamar ..................................... 1,790 1,638 * * * *Lauderdale ............................. 9,321 9,152 * * * *Lawrence ............................... 7,846 5,660 * * * *Lee ......................................... 1,764 1,710 * * * *Limestone .............................. 6,029 5,515 * * * *Lowndes................................. 10,558 9,634 * * * *Macon .................................... 1,948 2,071 * * * *Madison ................................. 5,898 4,672 * * * *Marengo ................................. 5,687 5,371 * * * *Marion .................................... 3,818 3,492 * * * *Marshall ................................. 9,215 8,044 * * * *Mobile .................................... 5,871 6,166 * * * *Monroe ................................... 3,107 2,481 * * * *Montgomery ........................... 10,426 12,163 * * * *Morgan ................................... 8,768 7,948 * * * *Perry ...................................... 5,055 4,961 * * * *Pickens .................................. 5,003 4,263 * * * *Pike ........................................ 6,108 5,010 * * * *Randolph ............................... 4,634 4,817 * * * *Russell ................................... 1,685 1,421 * * * *Shelby .................................... 1,448 1,036 * * * *St. Clair .................................. 2,580 2,722 * * * *Sumter ................................... 6,029 4,335 * * * *Talladega ............................... 4,608 4,094 * * * *Tallapoosa ............................. 2,001 2,095 * * * *Tuscaloosa ............................ 2,765 2,312 * * * *Walker .................................... 2,949 2,649 * * * *Washington ............................ 1,975 1,590 * * * *Wilcox .................................... 3,239 2,890 * * * *Winston .................................. 2,844 2,457 * * * *State Total ............................. 331,749 308,286 34,079 35,322 39,711 25,428 * Included in State Total.

42 USDA, NASS, Alabama Field Office
Cash Receipts From Farm Marketings, 2008-2009
County Broilers Eggs Catfish Total Livestock and Poultry
2008 2009 2008 2009 2008 2009 2008 2009 Thousand Dollars Thousand Dollars Thousand Dollars Thousand Dollars
Autauga ................................ * * * * * * 3,128 4,383Baldwin ................................. * * 21,595 * * * 29,552 28,197Barbour ................................. 46,947 * * * * * 59,639 57,475Bibb ...................................... * * * * * * 1,469 1,660Blount ................................... 140,808 131,155 10,943 * * * 165,126 155,004Bullock .................................. 11,135 * * * * * 14,117 13,265Butler .................................... 72,903 * * * * * 79,048 74,129Calhoun ................................ 33,928 * 417 * * * 40,769 39,215Chambers ............................. * * * * * * 3,809 3,247Cherokee .............................. 32,855 * * * * * 49,039 47,020Chilton .................................. * * * * * * 5,162 7,089Choctaw ................................ 8,931 * * * * * 10,316 9,819Clarke ................................... * * * * * * 1,814 1,844Clay ...................................... 33,295 * * * * * 38,974 37,297Cleburne ............................... 56,288 * 3,375 * * * 64,575 59,634Coffee ................................... 157,008 * 7,166 * * * 175,309 166,434Colbert .................................. 28,286 * 1,514 * * * 35,005 32,062Conecuh ............................... * * * * * * 5,232 4,964
Coosa ................................... * * * * * * 1,101 949Covington ............................. 53,902 * 12,985 12,945 * * 78,573 74,747Crenshaw ............................. 107,040 97,846 6,388 * * * 121,583 111,931Cullman ................................ 315,357 298,526 49,245 42,437 * * 394,527 368,229Dale ...................................... 64,387 60,548 * * * * 72,125 67,932Dallas .................................... * * * * 13,432 22,241 22,364 30,092DeKalb .................................. 266,006 256,382 47,717 42,303 * * 348,610 333,376Elmore .................................. * * * * * * 4,136 3,870Escambia .............................. * * * * * * 3,024 2,459Etowah .................................. 57,143 53,447 * * * * 65,069 60,673Fayette .................................. * * * * * * 13,649 11,928Franklin ................................. 109,950 * 4,722 * * * 124,166 113,344Geneva ................................. 82,853 * 5,777 * * * 102,520 93,083Greene .................................. * * * * 13,329 14,462 18,852 20,013Hale ...................................... * * * * 40,584 35,967 51,927 44,979Henry .................................... 22,763 * * * * * 28,375 25,247Houston ................................ 6,247 * * * * * 16,041 14,523Jackson ................................ 68,935 * 7,707 7,073 * * 90,124 85,744Jefferson ............................... * * * * * * 1,695 1,556Lamar ................................... * * * * * * 5,991 5,293Lauderdale ........................... 10,788 * * * * * 28,820 27,712Lawrence .............................. 104,267 95,697 9,791 * * * 124,362 113,366Lee ........................................ * * * * * * 2,523 2,414Limestone ............................. 21,634 * * * * * 32,329 29,873Lowndes ............................... 31,218 * * * * * 44,509 43,008Macon ................................... * * * * * * 5,789 3,159Madison ................................ * * * * * 9,539 8,108Marengo ............................... * * * * 3,185 1,748 13,246 9,832Marion ................................... 65,560 60,118 * * * * 73,746 67,846Marshall ................................ 174,232 162,615 18,692 14,946 * * 205,893 189,449Mobile ................................... * * * * * * 7,209 7,281Monroe ................................. 6,300 * * * * * 9,581 8,833Montgomery .......................... 8,767 * * * * * 21,377 23,136Morgan ................................. 67,369 62,956 * * * * 85,405 77,995Perry ..................................... * * * * 15,017 9,556 20,515 14,813Pickens ................................. 71,276 * 3,652 * 2,445 2,443 88,185 83,918
Pike ....................................... 80,326 * 6,763 6,939 * * 95,539 89,000Randolph .............................. * * 18,790 * * * 81,530 79,917Russell .................................. * * * * * * 5,170 5,007Shelby ................................... * * * * * * 2,770 2,236St. Clair ................................. 46,924 43,187 * * * * 52,628 49,049Sumter .................................. * * * * 3,854 3,523 16,112 14,618Talladega .............................. 11,638 * * * * * 18,292 15,133Tallapoosa ............................ 3,653 * * * * * 5,966 6,177Tuscaloosa ........................... 15,317 * * * * * 20,073 18,718Walker .................................. 44,814 41,149 * * * * 49,035 45,055Washington .......................... 14,851 * * * * * 25,925 24,498Wilcox ................................... * * * * * * 3,797 3,379Winston ................................. 54,059 50,401 6,124 5,071 * * 64,038 58,912
State Total ............................ 2,689,160 2,519,301 298,550 281,043 93,254 90,688 3,560,438 3,335,144 * Included in State Total.
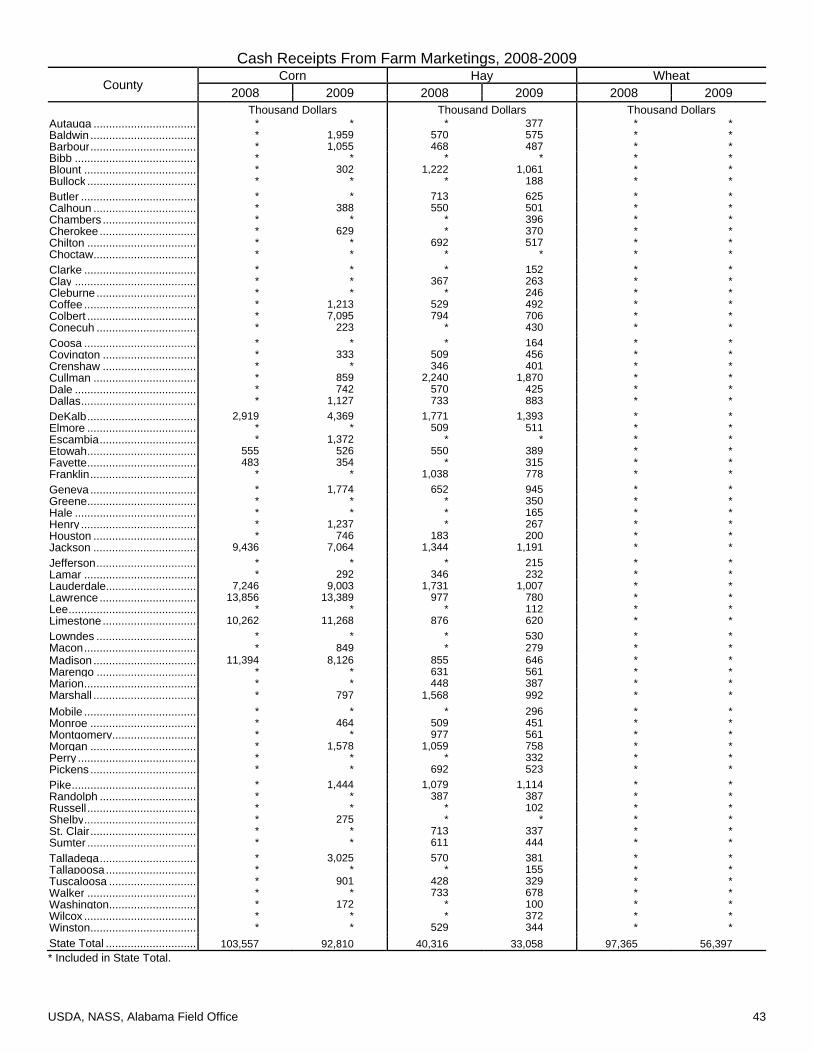
USDA, NASS, Alabama Field Office 43
Cash Receipts From Farm Marketings, 2008-2009
County Corn Hay Wheat
2008 2009 2008 2009 2008 2009 Thousand Dollars Thousand Dollars Thousand Dollars
Autauga ................................. * * * 377 * *Baldwin .................................. * 1,959 570 575 * *Barbour .................................. * 1,055 468 487 * *Bibb ....................................... * * * * * *Blount .................................... * 302 1,222 1,061 * *Bullock ................................... * * * 188 * *Butler ..................................... * * 713 625 * *Calhoun ................................. * 388 550 501 * *Chambers .............................. * * * 396 * *Cherokee ............................... * 629 * 370 * *Chilton ................................... * * 692 517 * *Choctaw ................................. * * * * * *Clarke .................................... * * * 152 * *Clay ....................................... * * 367 263 * *Cleburne ................................ * * * 246 * *Coffee .................................... * 1,213 529 492 * *Colbert ................................... * 7,095 794 706 * *Conecuh ................................ * 223 * 430 * *Coosa .................................... * * * 164 * *Covington .............................. * 333 509 456 * *Crenshaw .............................. * * 346 401 * *Cullman ................................. * 859 2,240 1,870 * *Dale ....................................... * 742 570 425 * *Dallas ..................................... * 1,127 733 883 * *DeKalb ................................... 2,919 4,369 1,771 1,393 * *Elmore ................................... * * 509 511 * *Escambia ............................... * 1,372 * * * *Etowah ................................... 555 526 550 389 * *Fayette ................................... 483 354 * 315 * *Franklin .................................. * * 1,038 778 * *Geneva .................................. * 1,774 652 945 * *Greene ................................... * * * 350 * *Hale ....................................... * * * 165 * *Henry ..................................... * 1,237 * 267 * *Houston ................................. * 746 183 200 * *Jackson ................................. 9,436 7,064 1,344 1,191 * *Jefferson ................................ * * * 215 * *Lamar .................................... * 292 346 232 * *Lauderdale ............................. 7,246 9,003 1,731 1,007 * *Lawrence ............................... 13,856 13,389 977 780 * *Lee ......................................... * * * 112 * *Limestone .............................. 10,262 11,268 876 620 * *Lowndes ................................ * * * 530 * *Macon .................................... * 849 * 279 * * Madison ................................. 11,394 8,126 855 646 * *Marengo ................................ * * 631 561 * *Marion .................................... * * 448 387 * *Marshall ................................. * 797 1,568 992 * * Mobile .................................... * * * 296 * *Monroe .................................. * 464 509 451 * *Montgomery ........................... * * 977 561 * *Morgan .................................. * 1,578 1,059 758 * *Perry ...................................... * * * 332 * *Pickens .................................. * * 692 523 * *Pike ........................................ * 1,444 1,079 1,114 * *Randolph ............................... * * 387 387 * *Russell ................................... * * * 102 * *Shelby .................................... * 275 * * * *St. Clair .................................. * * 713 337 * *Sumter ................................... * * 611 444 * *Talladega ............................... * 3,025 570 381 * *Tallapoosa ............................. * * * 155 * *Tuscaloosa ............................ * 901 428 329 * *Walker ................................... * * 733 678 * *Washington ............................ * 172 * 100 * *Wilcox .................................... * * * 372 * *Winston .................................. * * 529 344 * *State Total ............................. 103,557 92,810 40,316 33,058 97,365 56,397 * Included in State Total.

44 USDA, NASS, Alabama Field Office
Cash Receipts From Farm Marketings, 2008-2009
County Cotton Peanuts Soybeans
2008 2009 2008 2009 2008 2009 Thousand Dollars Thousand Dollars Thousand Dollars
Autauga ................................. 1,775 * * * 487Baldwin .................................. 4,917 4,205 16,117 12,577 5,713 8,141Barbour .................................. 1,139 * 4,529 2,361 * *Bibb ....................................... * * * * * *Blount .................................... * * * * * *Bullock ................................... * * * * * *Butler ..................................... * * * * * *Calhoun ................................. * 810 * * * 1,367Chambers .............................. * * * * * *Cherokee ............................... 4,244 2,772 * * * 8,757Chilton ................................... * * * * * *Choctaw ................................. * * * * * *Clarke .................................... * * * * * *Clay ....................................... * * * * * *Cleburne ................................ * * * * * *Coffee .................................... 3,390 3,551 * 4,219 * 1,939Colbert ................................... 3,079 872 * * * 8,663Conecuh ................................ 1,915 1,246 * * * 1,042Coosa .................................... * * * * * *Covington .............................. 5,124 5,638 7,640 4,971 * 683Crenshaw .............................. * * * * * *Cullman ................................. * * * * * 2,153Dale ....................................... 2,847 3,021 7,924 7,290 * *Dallas ..................................... 1,837 1,620 * 2,398 * 3,195DeKalb ................................... * * * * 2,161 3,511Elmore ................................... 4,244 3,364 * * * 461Escambia ............................... 6,107 5,576 10,272 7,875 * 4,340Etowah ................................... * * * * * 2,093Fayette ................................... * * * * * *Franklin .................................. * * * * * *Geneva .................................. * 9,905 14,912 9,533 * 2,067Greene ................................... * * * * * *Hale ....................................... * * * * * *Henry ..................................... 5,331 7,071 15,748 12,083 * *Houston ................................. 7,401 8,223 30,896 21,869 * 1,914Jackson ................................. * * * * * 9,935Jefferson ................................ * * * * * *Lamar .................................... * * * * * *Lauderdale ............................. 5,771 5,825 * * 3,170 7,373Lawrence ............................... 5,331 1,931 * * * 9,030Lee ......................................... * * * * * *Limestone .............................. 6,237 5,077 * * 14,769 24,177Lowndes ................................ * * * * * *Macon .................................... * * * * * 743 Madison ................................. 13,353 9,282 * * 10,807 16,377Marengo ................................ * * * * * *Marion .................................... * * * * * *Marshall ................................. * * * * * 1,982 Mobile .................................... 3,882 3,862 6,895 * * 803Monroe .................................. 7,789 7,631 7,339 4,521 1,225 1,341Montgomery ........................... * 966 * * * *Morgan .................................. * * * * 1,801 2,255Perry ...................................... * * * * * *Pickens .................................. * * * * * *Pike ........................................ * 1,402 3,649 2,547 * 607Randolph ............................... * * * * * *Russell ................................... * * 1,683 1,472 * *Shelby .................................... * 716 * * * *St. Clair .................................. * * * * * *Sumter ................................... * * * * * 154Talladega ............................... * 1,059 * * * 3,392Tallapoosa ............................. * * * * * *Tuscaloosa ............................ * * * * * 1,717Walker ................................... * * * * * *Washington ............................ * * * 1,487 * *Wilcox .................................... * * * * * *Winston .................................. * * * * * *State Total ............................. 121,367 107,463 151,988 104,606 88,255 146,939 * Included in State Total.

USDA, NASS, Alabama Field Office 45
Cash Receipts From Farm Marketings, 2008-2009
County Fruit, Pecans, & Vegetables Greenhouse, Sod, Nursery Total Crops
2008 2009 2008 2009 2008 2009 Thousand Dollars Thousand Dollars Thousand Dollars
Autauga ................................. 4,043 4,304 2,519 2,512 12,225 11,049Baldwin .................................. 10,856 18,561 48,822 48,687 93,969 98,023Barbour .................................. 396 486 7,883 7,862 18,373 15,648Bibb ....................................... 246 209 8 8 877 709Blount .................................... 3,417 2,994 928 926 7,577 7,414Bullock ................................... 171 346 19,567 19,513 21,273 21,161Butler ..................................... 243 215 92 92 3,450 3,172Calhoun ................................. 267 255 6,419 6,402 10,505 10,155Chambers .............................. 361 246 621 619 1,749 1,664Cherokee ............................... 243 255 8,286 8,263 20,380 22,405Chilton ................................... 4,900 5,972 1,762 1,757 7,655 8,577Choctaw ................................. 139 153 0 0 669 801Clarke .................................... 247 263 6 6 957 971Clay ....................................... 164 169 138 138 718 620Cleburne ................................ 52 59 1,011 1,008 1,576 1,400Coffee .................................... 588 484 227 227 18,732 12,496Colbert ................................... 145 156 1,868 1,863 23,827 22,222Conecuh ................................ 176 223 134 133 4,067 4,301Coosa .................................... 110 62 41 41 475 300Covington .............................. 2,118 2,008 1,489 1,485 20,249 16,692Crenshaw .............................. 232 220 0 0 2,607 2,546Cullman ................................. 4,288 2,672 2,913 2,905 12,121 10,814Dale ....................................... 578 663 82 82 14,260 12,836Dallas ..................................... 706 202 3,445 3,435 15,931 14,843DeKalb ................................... 2,582 2,702 2,984 2,975 14,510 16,185Elmore ................................... 531 549 2,108 2,102 8,924 7,792Escambia ............................... 91 112 1,257 1,253 27,115 22,933Etowah ................................... 693 751 666 665 4,975 5,296Fayette ................................... 87 85 55 55 2,492 1,837Franklin .................................. 85 86 178 178 4,463 4,105Geneva .................................. 2,749 3,004 1,498 1,494 32,017 29,309Greene ................................... 220 240 33 32 844 1,219Hale ....................................... 56 61 0 0 3,042 2,254Henry ..................................... 290 396 3 3 23,566 22,570Houston ................................. 8,371 10,462 833 831 51,409 45,277Jackson ................................. 3,219 2,734 611 610 24,993 24,508Jefferson ................................ 55 60 1,204 1,201 1,584 1,527Lamar .................................... 210 207 5 5 1,546 1,998Lauderdale ............................. 149 161 750 748 24,474 27,122Lawrence ............................... 166 154 459 457 32,377 30,022Lee ......................................... 99 81 25,474 25,403 27,810 27,004Limestone .............................. 1,599 943 7,497 7,477 61,017 61,291Lowndes ................................ 3,587 2,575 2,890 2,882 11,639 9,027Macon .................................... 782 609 4,625 4,613 9,356 7,800 Madison ................................. 365 389 3,657 3,647 53,304 46,127Marengo ................................ 58 69 0 0 4,287 3,389Marion .................................... 102 111 26 25 3,115 2,629Marshall ................................. 734 743 1,233 1,230 6,152 6,183 Mobile .................................... 1,253 4,590 59,287 59,124 72,990 72,544Monroe .................................. 159 182 3 3 18,590 14,989Montgomery ........................... 170 178 7,734 7,713 11,354 10,764Morgan .................................. 1,495 860 800 798 9,171 7,409Perry ...................................... 477 503 0 0 5,275 4,088Pickens .................................. 117 124 391 390 4,557 3,778Pike ........................................ 297 436 248 247 8,185 8,194Randolph ............................... 136 146 568 566 1,379 1,225Russell ................................... 569 498 4,308 4,296 8,545 8,649Shelby .................................... 56 59 7,906 7,885 10,856 10,513St. Clair .................................. 1,188 1,289 3,605 3,595 5,541 5,276Sumter ................................... 419 437 15 15 1,574 1,127Talladega ............................... 109 99 661 659 12,131 10,213Tallapoosa ............................. 95 115 501 499 1,343 1,609Tuscaloosa ............................ 133 143 3,306 3,297 7,686 7,092Walker ................................... 1,083 1,173 196 195 2,088 2,107Washington ............................ 163 169 148 147 2,413 2,383Wilcox .................................... 284 315 26 26 2,380 2,076Winston .................................. 88 92 14 14 671 582State Total ............................. 69,859 79,869 256,025 255,319 935,964 882,841 * Included in State Total.

46 USDA, NASS, Alabama Field Office
Cash Receipts From Farm Marketings, 2008-2009
County Total All Commodities Government Payments 1/ Total Farm Receipts 2/
2008 2009 2008 2009 2008 2009
Autauga ................................ 15,352 15,432 2,645 2,371 19,683 19,270Baldwin ................................. 123,521 126,220 3,864 3,585 140,944 141,800Barbour ................................. 78,012 73,123 3,516 2,813 90,091 82,885Bibb ...................................... 2,346 2,368 191 171 2,795 2,765Blount ................................... 172,703 162,418 476 1,071 192,138 178,923Bullock .................................. 35,390 34,426 904 673 40,179 38,371Butler .................................... 82,498 77,300 805 622 92,359 85,268Calhoun ................................ 51,275 49,370 727 702 57,630 54,763Chambers ............................. 5,558 4,911 315 315 6,483 5,693Cherokee .............................. 69,419 69,425 3,255 3,240 80,294 79,262Chilton .................................. 12,817 15,666 812 225 15,036 17,379Choctaw ................................ 10,984 10,620 105 160 12,296 11,789Clarke ................................... 2,771 2,816 240 234 3,315 3,317Clay ...................................... 39,692 37,917 77 335 44,126 41,855Cleburne ............................... 66,151 61,034 131 341 73,543 67,174Coffee ................................... 194,041 178,930 6,523 4,889 221,865 200,822Colbert .................................. 58,832 54,284 4,117 4,797 69,407 64,240Conecuh ............................... 9,300 9,265 1,351 1,069 11,671 11,215Coosa ................................... 1,576 1,249 24 24 1,773 1,392Covington ............................. 98,822 91,439 4,414 3,705 114,083 103,833Crenshaw ............................. 124,190 114,477 1,652 1,413 139,474 126,769Cullman ................................ 406,647 379,043 1,063 1,259 452,348 416,320Dale ...................................... 86,385 80,767 3,232 2,574 99,100 91,016Dallas .................................... 38,295 44,935 4,665 4,911 47,163 54,116DeKalb .................................. 363,120 349,560 1,124 1,479 404,103 384,256Elmore .................................. 13,060 11,662 2,753 2,593 17,246 15,363Escambia .............................. 30,140 25,393 5,222 6,137 38,671 33,942Etowah .................................. 70,044 65,969 727 902 78,460 73,140Fayette .................................. 16,142 13,765 457 765 18,370 15,838Franklin ................................. 128,629 117,450 503 457 143,252 129,068Geneva ................................. 134,537 122,392 9,622 6,989 158,927 141,012Greene .................................. 19,696 21,232 815 636 22,673 23,886Hale ...................................... 54,969 47,233 1,356 819 62,359 52,540Henry .................................... 51,941 47,816 6,394 4,087 64,037 56,446Houston ................................ 67,450 59,800 8,589 6,488 83,442 71,970Jackson ................................ 115,118 110,252 1,954 2,232 129,709 122,961Jefferson ............................... 3,279 3,083 21 46 3,660 3,422Lamar ................................... 7,538 7,291 323 387 8,688 8,371Lauderdale ........................... 53,294 54,834 4,211 4,902 63,356 64,947Lawrence .............................. 156,739 143,389 6,766 7,743 180,710 164,758Lee ........................................ 30,333 29,418 629 701 34,292 32,914Limestone ............................. 93,345 91,164 9,500 9,798 113,092 109,624Lowndes ............................... 56,148 52,035 1,833 1,473 64,145 58,453Macon ................................... 15,145 10,959 768 886 17,576 12,886Madison ................................ 62,843 54,235 6,038 6,357 75,779 65,745Marengo ............................... 17,533 13,221 1,620 1,354 21,077 15,831Marion ................................... 76,862 70,474 369 446 85,668 77,617Marshall ................................ 212,045 195,633 508 958 235,829 215,181Mobile ................................... 80,199 79,825 2,504 2,317 91,507 89,727Monroe ................................. 28,171 23,822 4,007 4,642 35,270 30,727Montgomery .......................... 32,731 33,900 1,250 1,545 37,575 38,666Morgan ................................. 94,576 85,404 1,218 1,167 106,176 94,687Perry ..................................... 25,790 18,901 1,680 1,328 30,301 22,025Pickens ................................. 92,743 87,696 786 494 103,709 96,523Pike ....................................... 103,724 97,194 3,038 2,731 118,147 109,161Randolph .............................. 82,908 81,142 141 541 92,151 89,394Russell .................................. 13,716 13,656 1,237 1,505 16,458 16,459Shelby ................................... 13,626 12,749 82 119 15,204 14,079St. Clair ................................. 58,169 54,325 578 811 65,132 60,299Sumter .................................. 17,685 15,745 964 727 20,591 17,968Talladega .............................. 30,423 25,346 1,266 1,392 35,028 29,146Tallapoosa ............................ 7,308 7,785 337 417 8,447 8,942Tuscaloosa ........................... 27,759 25,810 891 1,000 31,697 29,263Walker .................................. 51,123 47,162 28 14 56,762 51,658Washington .......................... 28,338 26,881 334 461 31,782 29,896Wilcox ................................... 6,177 5,455 1,434 1,181 8,289 7,154Winston ................................. 64,709 59,493 48 73 71,861 65,220
State Total ............................ 4,496,402 4,217,985 139,030 132,601 5,129,004 4,751,402 1/ Includes all government payments reported by FSA 2/ Does not include farm forest products. Includes other farm income (machine hire and custom work, custom feeding fees and other business related income)

USDA, NASS, Alabama Field Office 47
Autauga
Baldwin
Barbour
Bibb
Blount
Bullock
Butler
Calhoun
Chambers
Cherokee
Chilton
Choctaw
Clarke
Clay
Coffee
Colbert
Conecuh
Coosa
Covington
Crenshaw
Cullman
Dale
Dallas
De Kalb
Elmore
Escambia
Etowah
Fayette
Franklin
Geneva
Hale
Henry
Houston
Jackson
Jefferson
Lamar
Lauderdale
Lawrence
Lee
Limestone
Lowndes
Macon
Madison
Marengo
Marion
Marshall
Mobile
Monroe
Montgomery
Morgan
Perry
Pickens
Pike
Randolph
Russell
Shelby
Sumter
Talladega
Tallapoosa
Tuscaloosa
Walker
Washington
Wilcox
Winston
Autauga
Baldwin
Barbour
Bibb
Blount
Bullock
Butler
Calhoun
Chambers
Cherokee
Chilton
Choctaw
Clarke
Clay
Cleburne
Coffee
Colbert
Conecuh
Coosa
Covington
Crenshaw
Cullman
Dale
Dallas
De Kalb
Elmore
Escambia
Etowah
Fayette
Franklin
Geneva
Greene
Hale
Henry
Houston
Jackson
Jefferson
Lamar
Lauderdale
Lawrence
Lee
Limestone
Lowndes
Macon
Madison
Marengo
Marion
Marshall
Mobile
Monroe
Montgomery
Morgan
Perry
Pickens
Pike
Randolph
Russell
St. Clair
Shelby
Sumter
Talladega
Tallapoosa
Tuscaloosa
Walker
Washington
Wilcox
Winston
Alabama Counties
District 10 District 20
District 30
District 40
District 60
District 50
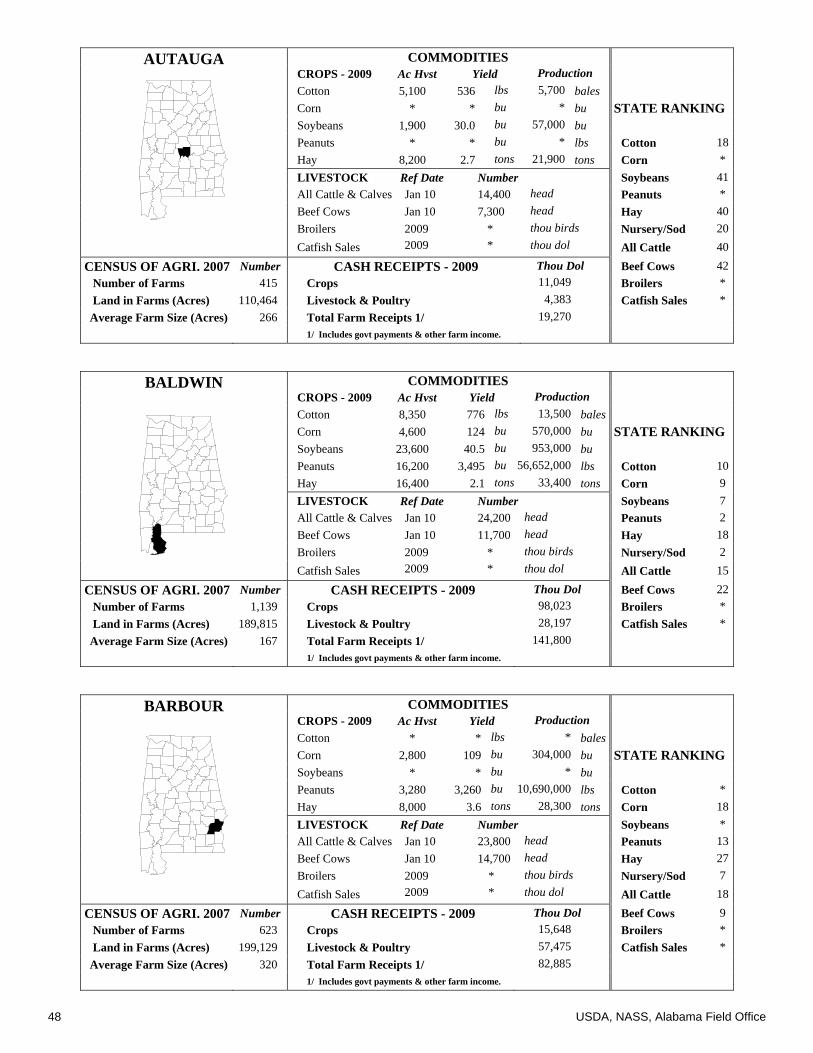
48 USDA, NASS, Alabama Field Office
AUTAUGA COMMODITIES CROPS - 2009 Ac Hvst Yield Production
Cotton 5,100 536 lbs 5,700 bales Corn * * bu * bu STATE RANKING Soybeans 1,900 30.0 bu 57,000 bu Peanuts * * bu * lbs Cotton 18Hay 8,200 2.7 tons 21,900 tons Corn * LIVESTOCK Ref Date Number Soybeans 41All Cattle & Calves Jan 10 14,400 head Peanuts * Beef Cows Jan 10 7,300 head Hay 40Broilers 2009 * thou birds Nursery/Sod 20Catfish Sales 2009 * thou dol All Cattle 40
CENSUS OF AGRI. 2007 Number CASH RECEIPTS - 2009 Thou Dol Beef Cows 42 Number of Farms 415 Crops 11,049 Broilers * Land in Farms (Acres) 110,464 Livestock & Poultry 4,383 Catfish Sales * Average Farm Size (Acres) 266 Total Farm Receipts 1/ 19,270
1/ Includes govt payments & other farm income.
BALDWIN COMMODITIES CROPS - 2009 Ac Hvst Yield Production
Cotton 8,350 776 lbs 13,500 bales Corn 4,600 124 bu 570,000 bu STATE RANKING Soybeans 23,600 40.5 bu 953,000 bu Peanuts 16,200 3,495 bu 56,652,000 lbs Cotton 10Hay 16,400 2.1 tons 33,400 tons Corn 9 LIVESTOCK Ref Date Number Soybeans 7 All Cattle & Calves Jan 10 24,200 head Peanuts 2 Beef Cows Jan 10 11,700 head Hay 18Broilers 2009 * thou birds Nursery/Sod 2 Catfish Sales 2009 * thou dol All Cattle 15
CENSUS OF AGRI. 2007 Number CASH RECEIPTS - 2009 Thou Dol Beef Cows 22 Number of Farms 1,139 Crops 98,023 Broilers * Land in Farms (Acres) 189,815 Livestock & Poultry 28,197 Catfish Sales * Average Farm Size (Acres) 167 Total Farm Receipts 1/ 141,800
1/ Includes govt payments & other farm income.
BARBOUR COMMODITIES CROPS - 2009 Ac Hvst Yield Production
Cotton * * lbs * bales Corn 2,800 109 bu 304,000 bu STATE RANKING Soybeans * * bu * bu Peanuts 3,280 3,260 bu 10,690,000 lbs Cotton * Hay 8,000 3.6 tons 28,300 tons Corn 18LIVESTOCK Ref Date Number Soybeans * All Cattle & Calves Jan 10 23,800 head Peanuts 13Beef Cows Jan 10 14,700 head Hay 27Broilers 2009 * thou birds Nursery/Sod 7 Catfish Sales 2009 * thou dol All Cattle 18
CENSUS OF AGRI. 2007 Number CASH RECEIPTS - 2009 Thou Dol Beef Cows 9 Number of Farms 623 Crops 15,648 Broilers * Land in Farms (Acres) 199,129 Livestock & Poultry 57,475 Catfish Sales * Average Farm Size (Acres) 320 Total Farm Receipts 1/ 82,885
1/ Includes govt payments & other farm income.
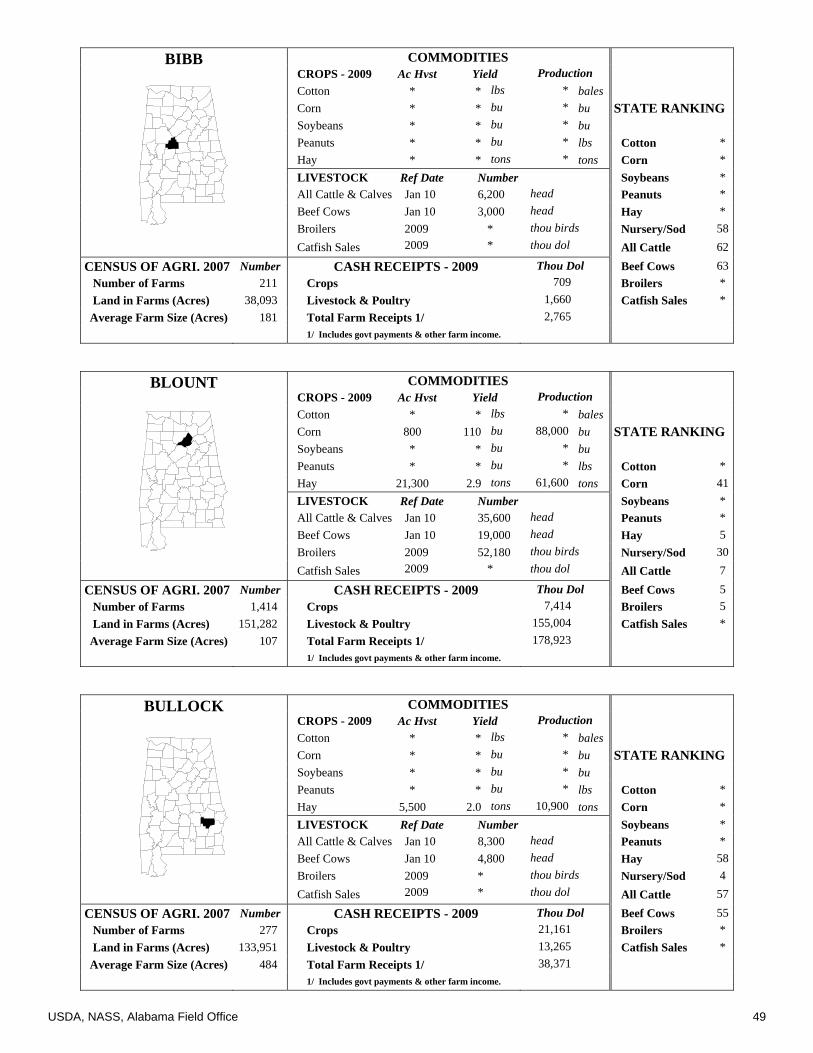
USDA, NASS, Alabama Field Office 49
BIBB COMMODITIES CROPS - 2009 Ac Hvst Yield Production
Cotton * * lbs * bales Corn * * bu * bu STATE RANKING Soybeans * * bu * bu Peanuts * * bu * lbs Cotton * Hay * * tons * tons Corn * LIVESTOCK Ref Date Number Soybeans * All Cattle & Calves Jan 10 6,200 head Peanuts * Beef Cows Jan 10 3,000 head Hay * Broilers 2009 * thou birds Nursery/Sod 58Catfish Sales 2009 * thou dol All Cattle 62
CENSUS OF AGRI. 2007 Number CASH RECEIPTS - 2009 Thou Dol Beef Cows 63 Number of Farms 211 Crops 709 Broilers * Land in Farms (Acres) 38,093 Livestock & Poultry 1,660 Catfish Sales * Average Farm Size (Acres) 181 Total Farm Receipts 1/ 2,765
1/ Includes govt payments & other farm income.
BLOUNT COMMODITIES CROPS - 2009 Ac Hvst Yield Production
Cotton * * lbs * bales Corn 800 110 bu 88,000 bu STATE RANKING Soybeans * * bu * bu Peanuts * * bu * lbs Cotton * Hay 21,300 2.9 tons 61,600 tons Corn 41LIVESTOCK Ref Date Number Soybeans * All Cattle & Calves Jan 10 35,600 head Peanuts * Beef Cows Jan 10 19,000 head Hay 5 Broilers 2009 52,180 thou birds Nursery/Sod 30Catfish Sales 2009 * thou dol All Cattle 7
CENSUS OF AGRI. 2007 Number CASH RECEIPTS - 2009 Thou Dol Beef Cows 5 Number of Farms 1,414 Crops 7,414 Broilers 5 Land in Farms (Acres) 151,282 Livestock & Poultry 155,004 Catfish Sales * Average Farm Size (Acres) 107 Total Farm Receipts 1/ 178,923
1/ Includes govt payments & other farm income.
BULLOCK COMMODITIES CROPS - 2009 Ac Hvst Yield Production
Cotton * * lbs * bales Corn * * bu * bu STATE RANKING Soybeans * * bu * bu Peanuts * * bu * lbs Cotton * Hay 5,500 2.0 tons 10,900 tons Corn * LIVESTOCK Ref Date Number Soybeans * All Cattle & Calves Jan 10 8,300 head Peanuts * Beef Cows Jan 10 4,800 head Hay 58Broilers 2009 * thou birds Nursery/Sod 4 Catfish Sales 2009 * thou dol All Cattle 57
CENSUS OF AGRI. 2007 Number CASH RECEIPTS - 2009 Thou Dol Beef Cows 55 Number of Farms 277 Crops 21,161 Broilers * Land in Farms (Acres) 133,951 Livestock & Poultry 13,265 Catfish Sales * Average Farm Size (Acres) 484 Total Farm Receipts 1/ 38,371
1/ Includes govt payments & other farm income.
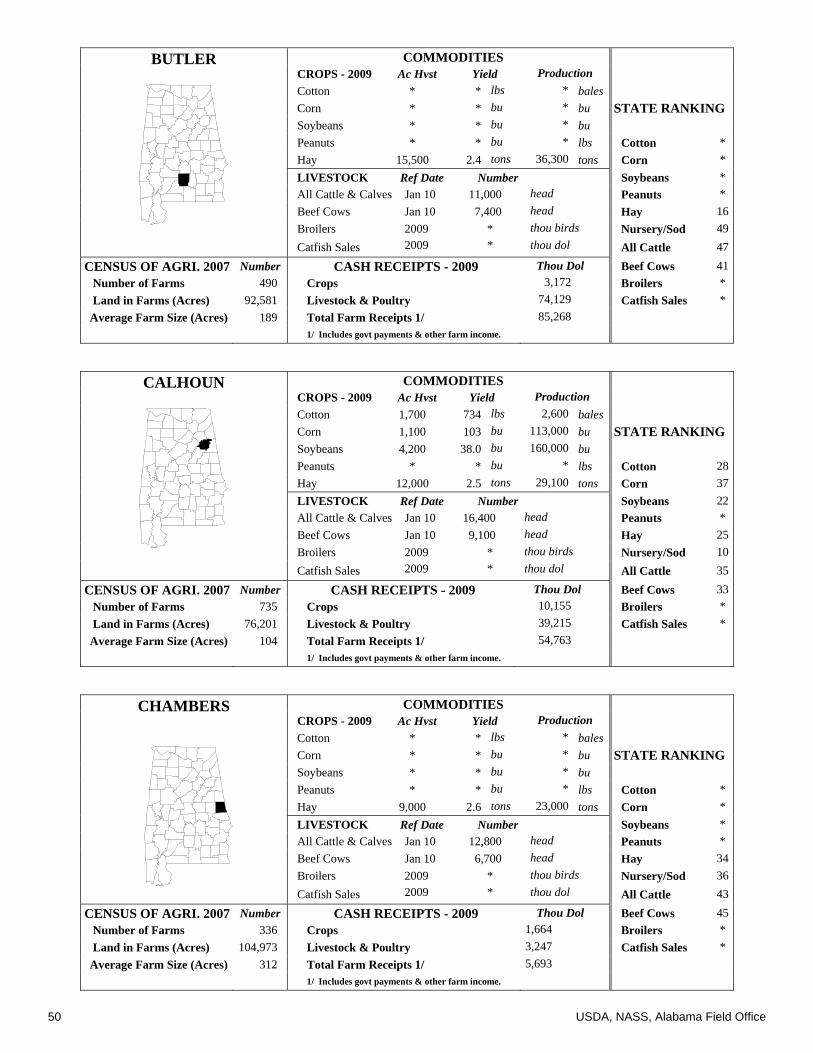
50 USDA, NASS, Alabama Field Office
BUTLER COMMODITIES CROPS - 2009 Ac Hvst Yield Production
Cotton * * lbs * bales Corn * * bu * bu STATE RANKING Soybeans * * bu * bu Peanuts * * bu * lbs Cotton * Hay 15,500 2.4 tons 36,300 tons Corn * LIVESTOCK Ref Date Number Soybeans * All Cattle & Calves Jan 10 11,000 head Peanuts * Beef Cows Jan 10 7,400 head Hay 16Broilers 2009 * thou birds Nursery/Sod 49Catfish Sales 2009 * thou dol All Cattle 47
CENSUS OF AGRI. 2007 Number CASH RECEIPTS - 2009 Thou Dol Beef Cows 41 Number of Farms 490 Crops 3,172 Broilers * Land in Farms (Acres) 92,581 Livestock & Poultry 74,129 Catfish Sales * Average Farm Size (Acres) 189 Total Farm Receipts 1/ 85,268
1/ Includes govt payments & other farm income.
CALHOUN COMMODITIES CROPS - 2009 Ac Hvst Yield Production
Cotton 1,700 734 lbs 2,600 bales Corn 1,100 103 bu 113,000 bu STATE RANKING Soybeans 4,200 38.0 bu 160,000 bu Peanuts * * bu * lbs Cotton 28Hay 12,000 2.5 tons 29,100 tons Corn 37LIVESTOCK Ref Date Number Soybeans 22All Cattle & Calves Jan 10 16,400 head Peanuts * Beef Cows Jan 10 9,100 head Hay 25Broilers 2009 * thou birds Nursery/Sod 10Catfish Sales 2009 * thou dol All Cattle 35
CENSUS OF AGRI. 2007 Number CASH RECEIPTS - 2009 Thou Dol Beef Cows 33 Number of Farms 735 Crops 10,155 Broilers * Land in Farms (Acres) 76,201 Livestock & Poultry 39,215 Catfish Sales * Average Farm Size (Acres) 104 Total Farm Receipts 1/ 54,763
1/ Includes govt payments & other farm income.
CHAMBERS COMMODITIES CROPS - 2009 Ac Hvst Yield Production
Cotton * * lbs * bales Corn * * bu * bu STATE RANKING Soybeans * * bu * bu Peanuts * * bu * lbs Cotton * Hay 9,000 2.6 tons 23,000 tons Corn * LIVESTOCK Ref Date Number Soybeans * All Cattle & Calves Jan 10 12,800 head Peanuts * Beef Cows Jan 10 6,700 head Hay 34Broilers 2009 * thou birds Nursery/Sod 36Catfish Sales 2009 * thou dol All Cattle 43
CENSUS OF AGRI. 2007 Number CASH RECEIPTS - 2009 Thou Dol Beef Cows 45 Number of Farms 336 Crops 1,664 Broilers * Land in Farms (Acres) 104,973 Livestock & Poultry 3,247 Catfish Sales * Average Farm Size (Acres) 312 Total Farm Receipts 1/ 5,693
1/ Includes govt payments & other farm income.

USDA, NASS, Alabama Field Office 51
CHEROKEE COMMODITIES CROPS - 2009 Ac Hvst Yield Production
Cotton 5,910 723 lbs 8,900 bales Corn 2,200 83 bu 183,000 bu STATE RANKING Soybeans 23,700 43.0 bu 1,025,000 bu Peanuts * * bu * lbs Cotton 15Hay 8,300 2.6 tons 21,500 tons Corn 27LIVESTOCK Ref Date Number Soybeans 5 All Cattle & Calves Jan 10 10,000 head Peanuts 63Beef Cows Jan 10 6,000 head Hay 42Broilers 2009 * thou birds Nursery/Sod 5 Catfish Sales 2009 * thou dol All Cattle 50
CENSUS OF AGRI. 2007 Number CASH RECEIPTS - 2009 Thou Dol Beef Cows 48 Number of Farms 654 Crops 22,405 Broilers * Land in Farms (Acres) 132,918 Livestock & Poultry 47,020 Catfish Sales * Average Farm Size (Acres) 203 Total Farm Receipts 1/ 79,262
1/ Includes govt payments & other farm income.
CHILTON COMMODITIES CROPS - 2009 Ac Hvst Yield Production
Cotton * * lbs * bales Corn * * bu * bu STATE RANKING Soybeans * * bu * bu Peanuts * * bu * lbs Cotton * Hay 12,300 2.5 tons 30,000 tons Corn * LIVESTOCK Ref Date Number Soybeans * All Cattle & Calves Jan 10 24,000 head Peanuts * Beef Cows Jan 10 10,000 head Hay 23Broilers 2009 * thou birds Nursery/Sod 23Catfish Sales 2009 * thou dol All Cattle 17
CENSUS OF AGRI. 2007 Number CASH RECEIPTS - 2009 Thou Dol Beef Cows 26 Number of Farms 645 Crops 8,577 Broilers * Land in Farms (Acres) 100,217 Livestock & Poultry 7,089 Catfish Sales * Average Farm Size (Acres) 155 Total Farm Receipts 1/ 17,379
1/ Includes govt payments & other farm income.
CHOCTAW COMMODITIES CROPS - 2009 Ac Hvst Yield Production
Cotton * * lbs * bales Corn * * bu * bu STATE RANKING Soybeans * * bu * bu Peanuts * * bu * lbs Cotton * Hay * * tons * tons Corn * LIVESTOCK Ref Date Number Soybeans * All Cattle & Calves Jan 10 * head Peanuts * Beef Cows Jan 10 * head Hay * Broilers 2009 * thou birds Nursery/Sod 63Catfish Sales 2009 * thou dol All Cattle *
CENSUS OF AGRI. 2007 Number CASH RECEIPTS - 2009 Thou Dol Beef Cows * Number of Farms 264 Crops 801 Broilers * Land in Farms (Acres) 55,016 Livestock & Poultry 9,819 Catfish Sales * Average Farm Size (Acres) 208 Total Farm Receipts 1/ 11,789
1/ Includes govt payments & other farm income.

52 USDA, NASS, Alabama Field Office
CLARKE COMMODITIES CROPS - 2009 Ac Hvst Yield Production
Cotton * * lbs * bales Corn * * bu * bu STATE RANKING Soybeans * * bu * bu Peanuts * * bu * lbs Cotton * Hay 4,000 2.2 tons 8,800 tons Corn * LIVESTOCK Ref Date Number Soybeans * All Cattle & Calves Jan 10 * head Peanuts * Beef Cows Jan 10 * head Hay 63Broilers 2009 * thou birds Nursery/Sod 59Catfish Sales 2009 * thou dol All Cattle *
CENSUS OF AGRI. 2007 Number CASH RECEIPTS - 2009 Thou Dol Beef Cows * Number of Farms 321 Crops 971 Broilers * Land in Farms (Acres) 73,737 Livestock & Poultry 1,844 Catfish Sales * Average Farm Size (Acres) 230 Total Farm Receipts 1/ 3,317
1/ Includes govt payments & other farm income.
CLAY COMMODITIES CROPS - 2009 Ac Hvst Yield Production
Cotton * * lbs * bales Corn * * bu * bu STATE RANKING Soybeans * * bu * bu Peanuts * * bu * lbs Cotton * Hay 8,500 1.8 tons 15,300 tons Corn * LIVESTOCK Ref Date Number Soybeans * All Cattle & Calves Jan 10 17,200 head Peanuts * Beef Cows Jan 10 9,700 head Hay 53Broilers 2009 * thou birds Nursery/Sod 47Catfish Sales 2009 * thou dol All Cattle 32
CENSUS OF AGRI. 2007 Number CASH RECEIPTS - 2009 Thou Dol Beef Cows 30 Number of Farms 432 Crops 620 Broilers * Land in Farms (Acres) 74,415 Livestock & Poultry 37,297 Catfish Sales * Average Farm Size (Acres) 172 Total Farm Receipts 1/ 41,855
1/ Includes govt payments & other farm income.
CLEBURNE COMMODITIES CROPS - 2009 Ac Hvst Yield Production
Cotton * * lbs * bales Corn * * bu * bu STATE RANKING Soybeans * * bu * bu Peanuts * * bu * lbs Cotton * Hay 6,100 2.4 tons 14,300 tons Corn * LIVESTOCK Ref Date Number Soybeans * All Cattle & Calves Jan 10 13,100 head Peanuts * Beef Cows Jan 10 7,100 head Hay 54Broilers 2009 * thou birds Nursery/Sod 29Catfish Sales 2009 * thou dol All Cattle 42
CENSUS OF AGRI. 2007 Number CASH RECEIPTS - 2009 Thou Dol Beef Cows 43 Number of Farms 380 Crops 1,400 Broilers * Land in Farms (Acres) 49,493 Livestock & Poultry 59,634 Catfish Sales * Average Farm Size (Acres) 130 Total Farm Receipts 1/ 67,174
1/ Includes govt payments & other farm income.
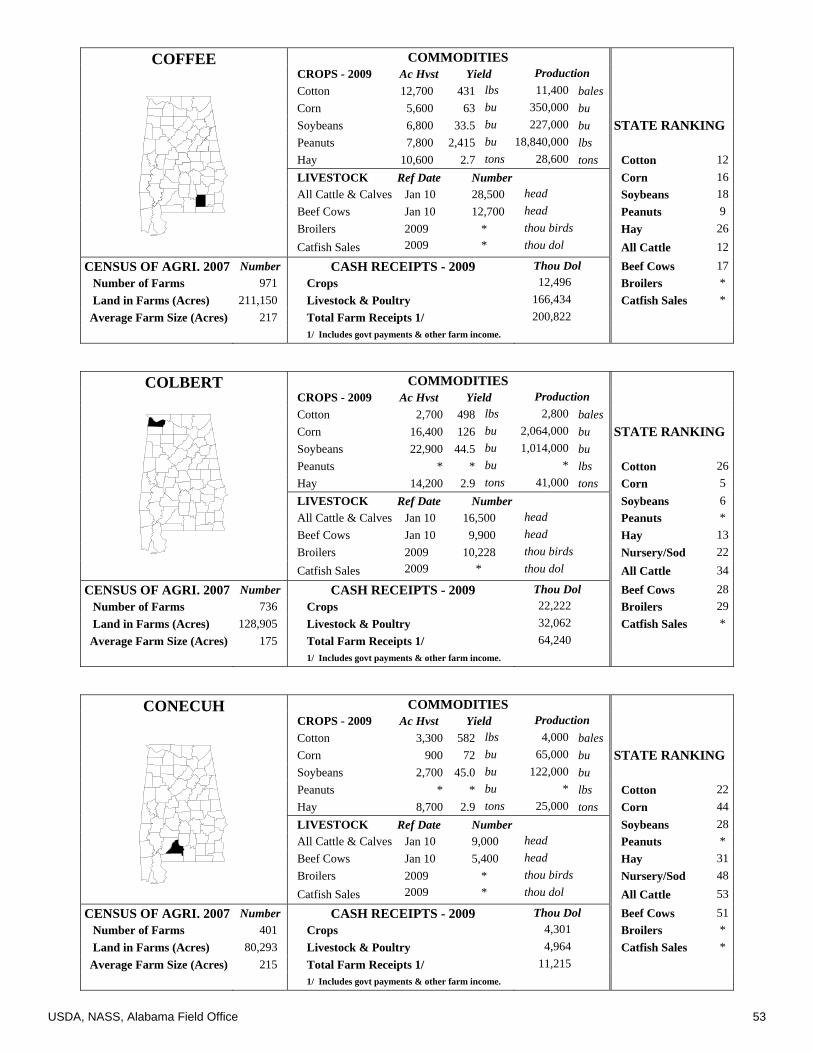
USDA, NASS, Alabama Field Office 53
COFFEE COMMODITIES CROPS - 2009 Ac Hvst Yield Production
Cotton 12,700 431 lbs 11,400 bales Corn 5,600 63 bu 350,000 bu Soybeans 6,800 33.5 bu 227,000 bu STATE RANKING Peanuts 7,800 2,415 bu 18,840,000 lbs Hay 10,600 2.7 tons 28,600 tons Cotton 12LIVESTOCK Ref Date Number Corn 16All Cattle & Calves Jan 10 28,500 head Soybeans 18Beef Cows Jan 10 12,700 head Peanuts 9 Broilers 2009 * thou birds Hay 26Catfish Sales 2009 * thou dol All Cattle 12
CENSUS OF AGRI. 2007 Number CASH RECEIPTS - 2009 Thou Dol Beef Cows 17 Number of Farms 971 Crops 12,496 Broilers * Land in Farms (Acres) 211,150 Livestock & Poultry 166,434 Catfish Sales * Average Farm Size (Acres) 217 Total Farm Receipts 1/ 200,822
1/ Includes govt payments & other farm income.
COLBERT COMMODITIES CROPS - 2009 Ac Hvst Yield Production
Cotton 2,700 498 lbs 2,800 bales Corn 16,400 126 bu 2,064,000 bu STATE RANKING Soybeans 22,900 44.5 bu 1,014,000 bu Peanuts * * bu * lbs Cotton 26Hay 14,200 2.9 tons 41,000 tons Corn 5 LIVESTOCK Ref Date Number Soybeans 6 All Cattle & Calves Jan 10 16,500 head Peanuts * Beef Cows Jan 10 9,900 head Hay 13Broilers 2009 10,228 thou birds Nursery/Sod 22Catfish Sales 2009 * thou dol All Cattle 34
CENSUS OF AGRI. 2007 Number CASH RECEIPTS - 2009 Thou Dol Beef Cows 28 Number of Farms 736 Crops 22,222 Broilers 29 Land in Farms (Acres) 128,905 Livestock & Poultry 32,062 Catfish Sales * Average Farm Size (Acres) 175 Total Farm Receipts 1/ 64,240
1/ Includes govt payments & other farm income.
CONECUH COMMODITIES CROPS - 2009 Ac Hvst Yield Production
Cotton 3,300 582 lbs 4,000 bales Corn 900 72 bu 65,000 bu STATE RANKING Soybeans 2,700 45.0 bu 122,000 bu Peanuts * * bu * lbs Cotton 22Hay 8,700 2.9 tons 25,000 tons Corn 44LIVESTOCK Ref Date Number Soybeans 28All Cattle & Calves Jan 10 9,000 head Peanuts * Beef Cows Jan 10 5,400 head Hay 31Broilers 2009 * thou birds Nursery/Sod 48Catfish Sales 2009 * thou dol All Cattle 53
CENSUS OF AGRI. 2007 Number CASH RECEIPTS - 2009 Thou Dol Beef Cows 51 Number of Farms 401 Crops 4,301 Broilers * Land in Farms (Acres) 80,293 Livestock & Poultry 4,964 Catfish Sales * Average Farm Size (Acres) 215 Total Farm Receipts 1/ 11,215
1/ Includes govt payments & other farm income.

54 USDA, NASS, Alabama Field Office
COOSA COMMODITIES CROPS - 2009 Ac Hvst Yield Production
Cotton * * lbs * bales Corn * * bu * bu STATE RANKING Soybeans * * bu * bu Peanuts * * bu * lbs Cotton * Hay 4,800 2.0 tons 9,500 tons Corn * LIVESTOCK Ref Date Number Soybeans * All Cattle & Calves Jan 10 3,200 head Peanuts * Beef Cows Jan 10 2,000 head Hay 60Broilers 2009 * thou birds Nursery/Sod 52Catfish Sales 2009 * thou dol All Cattle 67
CENSUS OF AGRI. 2007 Number CASH RECEIPTS - 2009 Thou Dol Beef Cows 67 Number of Farms 207 Crops 300 Broilers * Land in Farms (Acres) 45,403 Livestock & Poultry 949 Catfish Sales * Average Farm Size (Acres) 219 Total Farm Receipts 1/ 1,392
1/ Includes govt payments & other farm income.
COVINGTON COMMODITIES CROPS - 2009 Ac Hvst Yield Production
Cotton 12,600 690 lbs 18,100 bales Corn 2,500 51 bu 127,000 bu STATE RANKING Soybeans 2,200 36.5 bu 80,000 bu Peanuts 6,400 3,510 bu 22,460,000 lbs Cotton 7 Hay 7,800 3.4 tons 26,500 tons Corn 40LIVESTOCK Ref Date Number Soybeans 38All Cattle & Calves Jan 10 37,400 head Peanuts 7 Beef Cows Jan 10 18,700 head Hay 28Broilers 2009 * thou birds Nursery/Sod 25Catfish Sales 2009 * thou dol All Cattle 6
CENSUS OF AGRI. 2007 Number CASH RECEIPTS - 2009 Thou Dol Beef Cows 7 Number of Farms 1,096 Crops 16,692 Broilers * Land in Farms (Acres) 200,141 Livestock & Poultry 74,747 Catfish Sales * Average Farm Size (Acres) 183 Total Farm Receipts 1/ 103,833
1/ Includes govt payments & other farm income.
CRENSHAW COMMODITIES CROPS - 2009 Ac Hvst Yield Production
Cotton * * lbs * bales Corn * * bu * bu STATE RANKING Soybeans * * bu * bu Peanuts * * bu * lbs Cotton * Hay 7,800 3.0 tons 23,300 tons Corn * LIVESTOCK Ref Date Number Soybeans * All Cattle & Calves Jan 10 24,000 head Peanuts * Beef Cows Jan 10 13,800 head Hay 33Broilers 2009 38,928 thou birds Nursery/Sod 65Catfish Sales 2009 * thou dol All Cattle 16
CENSUS OF AGRI. 2007 Number CASH RECEIPTS - 2009 Thou Dol Beef Cows 13 Number of Farms 638 Crops 2,546 Broilers 7 Land in Farms (Acres) 132,385 Livestock & Poultry 111,931 Catfish Sales * Average Farm Size (Acres) 208 Total Farm Receipts 1/ 126,769
1/ Includes govt payments & other farm income.

USDA, NASS, Alabama Field Office 55
CULLMAN COMMODITIES CROPS - 2009 Ac Hvst Yield Production
Cotton * * lbs * bales Corn 2,400 104 bu 250,000 bu STATE RANKING Soybeans 5,300 47.5 bu 252,000 bu Peanuts * * bu * lbs Cotton * Hay 39,300 2.8 tons 108,600 tons Corn 21LIVESTOCK Ref Date Number Soybeans 14All Cattle & Calves Jan 10 71,200 head Peanuts * Beef Cows Jan 10 38,600 head Hay 1 Broilers 2009 118,768 thou birds Nursery/Sod 18Catfish Sales 2009 * thou dol All Cattle 1
CENSUS OF AGRI. 2007 Number CASH RECEIPTS - 2009 Thou Dol Beef Cows 1 Number of Farms 2,465 Crops 10,814 Broilers 1 Land in Farms (Acres) 229,791 Livestock & Poultry 368,229 Catfish Sales * Average Farm Size (Acres) 93 Total Farm Receipts 1/ 416,320
1/ Includes govt payments & other farm income.
DALE COMMODITIES CROPS - 2009 Ac Hvst Yield Production
Cotton 9,400 495 lbs 9,700 bales Corn 2,800 75 bu 210,000 bu STATE RANKING Soybeans * * bu * bu Peanuts 9,300 3,535 bu 32,855,000 lbs Cotton 14Hay 10,200 2.4 tons 24,700 tons Corn 25LIVESTOCK Ref Date Number Soybeans * All Cattle & Calves Jan 10 14,800 head Peanuts 6 Beef Cows Jan 10 8,400 head Hay 32Broilers 2009 24,089 thou birds Nursery/Sod 50Catfish Sales 2009 * thou dol All Cattle 37
CENSUS OF AGRI. 2007 Number CASH RECEIPTS - 2009 Thou Dol Beef Cows 37 Number of Farms 528 Crops 12,836 Broilers 15 Land in Farms (Acres) 138,197 Livestock & Poultry 67,932 Catfish Sales * Average Farm Size (Acres) 262 Total Farm Receipts 1/ 91,016
1/ Includes govt payments & other farm income.
DALLAS COMMODITIES CROPS - 2009 Ac Hvst Yield Production
Cotton 4,450 561 lbs 5,200 bales Corn 4,050 81 bu 328,000 bu STATE RANKING Soybeans 9,100 41.0 bu 374,000 bu Peanuts 3,800 2,870 bu 10,900,000 lbs Cotton 19Hay 21,300 2.4 tons 51,300 tons Corn 17LIVESTOCK Ref Date Number Soybeans 12All Cattle & Calves Jan 10 21,300 head Peanuts 12Beef Cows Jan 10 11,700 head Hay 9 Broilers 2009 * thou birds Nursery/Sod 15Catfish Sales 2009 22,241 thou dol All Cattle 23
CENSUS OF AGRI. 2007 Number CASH RECEIPTS - 2009 Thou Dol Beef Cows 21 Number of Farms 555 Crops 14,843 Broilers * Land in Farms (Acres) 257,015 Livestock & Poultry 30,092 Catfish Sales 2 Average Farm Size (Acres) 463 Total Farm Receipts 1/ 54,116
1/ Includes govt payments & other farm income.

56 USDA, NASS, Alabama Field Office
DEKALB COMMODITIES CROPS - 2009 Ac Hvst Yield Production
Cotton * * lbs * bales Corn 10,900 117 bu 1,271,000 bu STATE RANKING Soybeans 10,800 38.0 bu 411,000 bu Peanuts * * bu * lbs Cotton * Hay 31,000 2.6 tons 80,900 tons Corn 7 LIVESTOCK Ref Date Number Soybeans 10All Cattle & Calves Jan 10 59,800 head Peanuts * Beef Cows Jan 10 35,300 head Hay 2 Broilers 2009 102,001 thou birds Nursery/Sod 17Catfish Sales 2009 * thou dol All Cattle 2
CENSUS OF AGRI. 2007 Number CASH RECEIPTS - 2009 Thou Dol Beef Cows 2 Number of Farms 2,426 Crops 16,185 Broilers 2 Land in Farms (Acres) 235,246 Livestock & Poultry 333,376 Catfish Sales * Average Farm Size (Acres) 97 Total Farm Receipts 1/ 384,256
1/ Includes govt payments & other farm income.
ELMORE COMMODITIES CROPS - 2009 Ac Hvst Yield Production
Cotton 9,110 569 lbs 10,800 bales Corn * * bu * bu STATE RANKING Soybeans 2,200 24.5 bu 54,000 bu Peanuts * * bu * lbs Cotton 13Hay 11,300 2.7 tons 29,700 tons Corn * LIVESTOCK Ref Date Number Soybeans 42All Cattle & Calves Jan 10 14,000 head Peanuts * Beef Cows Jan 10 8,900 head Hay 24Broilers 2009 * thou birds Nursery/Sod 21Catfish Sales 2009 * thou dol All Cattle 41
CENSUS OF AGRI. 2007 Number CASH RECEIPTS - 2009 Thou Dol Beef Cows 34 Number of Farms 626 Crops 7,792 Broilers * Land in Farms (Acres) 102,816 Livestock & Poultry 3,870 Catfish Sales * Average Farm Size (Acres) 164 Total Farm Receipts 1/ 15,363
1/ Includes govt payments & other farm income.
ESCAMBIA COMMODITIES CROPS - 2009 Ac Hvst Yield Production
Cotton 12,100 710 lbs 17,900 bales Corn 4,700 85 bu 399,000 bu STATE RANKING Soybeans 11,900 42.5 bu 508,000 bu Peanuts 9,600 3,695 bu 35,472,000 lbs Cotton 8 Hay * * tons * tons Corn 13LIVESTOCK Ref Date Number Soybeans 9 All Cattle & Calves Jan 10 9,700 head Peanuts 5 Beef Cows Jan 10 5,500 head Hay 64Broilers 2009 * thou birds Nursery/Sod 26Catfish Sales 2009 * thou dol All Cattle 51
CENSUS OF AGRI. 2007 Number CASH RECEIPTS - 2009 Thou Dol Beef Cows 50 Number of Farms 502 Crops 22,933 Broilers * Land in Farms (Acres) 112,841 Livestock & Poultry 2,459 Catfish Sales * Average Farm Size (Acres) 225 Total Farm Receipts 1/ 33,942
1/ Includes govt payments & other farm income.

USDA, NASS, Alabama Field Office 57
ETOWAH COMMODITIES CROPS - 2009 Ac Hvst Yield Production
Cotton * * lbs * bales Corn 1,800 85 bu 153,000 bu Soybeans 5,500 44.5 bu 245,000 bu STATE RANKING Peanuts * * bu * lbs Cotton * Hay 10,500 2.2 tons 22,600 tons Corn 29LIVESTOCK Ref Date Number Soybeans 15All Cattle & Calves Jan 10 16,200 head Peanuts * Beef Cows Jan 10 8,400 head Hay 35Broilers 2009 21,264 thou birds Nursery/Sod 34Catfish Sales 2009 * thou dol All Cattle 36
CENSUS OF AGRI. 2007 Number CASH RECEIPTS - 2009 Thou Dol Beef Cows 36 Number of Farms 1,004 Crops 5,296 Broilers 18 Land in Farms (Acres) 94,201 Livestock & Poultry 60,673 Catfish Sales * Average Farm Size (Acres) 94 Total Farm Receipts 1/ 73,140
1/ Includes govt payments & other farm income.
FAYETTE COMMODITIES CROPS - 2009 Ac Hvst Yield Production
Cotton * * lbs * bales Corn 1,600 64 bu 103,000 bu STATE RANKING Soybeans * * bu * bu Peanuts * * bu * lbs Cotton * Hay 7,800 2.4 tons 18,300 tons Corn 38LIVESTOCK Ref Date Number Soybeans * All Cattle & Calves Jan 10 8,900 head Peanuts * Beef Cows Jan 10 3,800 head Hay 48Broilers 2009 * thou birds Nursery/Sod 51Catfish Sales 2009 * thou dol All Cattle 54
CENSUS OF AGRI. 2007 Number CASH RECEIPTS - 2009 Thou Dol Beef Cows 61 Number of Farms 401 Crops 1,837 Broilers * Land in Farms (Acres) 78,799 Livestock & Poultry 11,928 Catfish Sales * Average Farm Size (Acres) 197 Total Farm Receipts 1/ 15,838
1/ Includes govt payments & other farm income.
FRANKLIN COMMODITIES CROPS - 2009 Ac Hvst Yield Production
Cotton * * lbs * bales Corn * * bu * bu STATE RANKING Soybeans * * bu * bu Peanuts * * bu * lbs Cotton * Hay 17,300 2.6 tons 45,200 tons Corn * LIVESTOCK Ref Date Number Soybeans * All Cattle & Calves Jan 10 23,000 head Peanuts * Beef Cows Jan 10 14,000 head Hay 11Broilers 2009 * thou birds Nursery/Sod 45Catfish Sales 2009 * thou dol All Cattle 20
CENSUS OF AGRI. 2007 Number CASH RECEIPTS - 2009 Thou Dol Beef Cows 11 Number of Farms 958 Crops 4,105 Broilers * Land in Farms (Acres) 140,861 Livestock & Poultry 113,344 Catfish Sales * Average Farm Size (Acres) 147 Total Farm Receipts 1/ 129,068
1/ Includes govt payments & other farm income.

58 USDA, NASS, Alabama Field Office
GENEVA COMMODITIES CROPS - 2009 Ac Hvst Yield Production
Cotton 22,600 675 lbs 31,800 bales Corn 6,200 80 bu 499,000 bu STATE RANKING Soybeans 6,600 36.5 bu 242,000 bu Peanuts 16,300 2,635 bu 42,942,000 lbs Cotton 1 Hay 20,300 2.7 tons 54,900 tons Corn 10LIVESTOCK Ref Date Number Soybeans 16All Cattle & Calves Jan 10 29,500 head Peanuts 4 Beef Cows Jan 10 13,500 head Hay 8 Broilers 2009 * thou birds Nursery/Sod 24Catfish Sales 2009 * thou dol All Cattle 11
CENSUS OF AGRI. 2007 Number CASH RECEIPTS - 2009 Thou Dol Beef Cows 15 Number of Farms 1,108 Crops 29,309 Broilers * Land in Farms (Acres) 220,676 Livestock & Poultry 93,083 Catfish Sales * Average Farm Size (Acres) 199 Total Farm Receipts 1/ 141,012
1/ Includes govt payments & other farm income.
GREENE COMMODITIES CROPS - 2009 Ac Hvst Yield Production
Cotton * * lbs * bales Corn * * bu * bu STATE RANKING Soybeans * * bu * bu Peanuts * * bu * lbs Cotton * Hay 10,000 2.1 tons 20,300 tons Corn * LIVESTOCK Ref Date Number Soybeans * All Cattle & Calves Jan 10 17,700 head Peanuts * Beef Cows Jan 10 7,400 head Hay 43Broilers 2009 * thou birds Nursery/Sod 53Catfish Sales 2009 * thou dol All Cattle 30
CENSUS OF AGRI. 2007 Number CASH RECEIPTS - 2009 Thou Dol Beef Cows 40 Number of Farms 316 Crops 1,219 Broilers * Land in Farms (Acres) 135,652 Livestock & Poultry 20,013 Catfish Sales * Average Farm Size (Acres) 429 Total Farm Receipts 1/ 23,886
1/ Includes govt payments & other farm income.
HALE COMMODITIES CROPS - 2009 Ac Hvst Yield Production
Cotton * * lbs * bales Corn * * bu * bu STATE RANKING Soybeans * * bu * bu Peanuts * * bu * lbs Cotton * Hay 6,800 1.4 tons 9,600 tons Corn * LIVESTOCK Ref Date Number Soybeans * All Cattle & Calves Jan 10 20,300 head Peanuts * Beef Cows Jan 10 9,300 head Hay 59Broilers 2009 * thou birds Nursery/Sod 64Catfish Sales 2009 35,967 thou dol All Cattle 26
CENSUS OF AGRI. 2007 Number CASH RECEIPTS - 2009 Thou Dol Beef Cows 32 Number of Farms 479 Crops 2,254 Broilers * Land in Farms (Acres) 169,287 Livestock & Poultry 44,979 Catfish Sales 1 Average Farm Size (Acres) 353 Total Farm Receipts 1/ 52,540
1/ Includes govt payments & other farm income.

USDA, NASS, Alabama Field Office 59
HENRY COMMODITIES CROPS - 2009 Ac Hvst Yield Production
Cotton 14,200 767 lbs 22,700 bales Corn 6,000 61 bu 365,000 bu STATE RANKING Soybeans * * bu * bu Peanuts 18,700 2,930 bu 54,785,000 lbs Cotton 5 Hay 6,400 2.4 tons 15,500 tons Corn 15LIVESTOCK Ref Date Number Soybeans 34All Cattle & Calves Jan 10 14,500 head Peanuts 3 Beef Cows Jan 10 7,700 head Hay 52Broilers 2009 * thou birds Nursery/Sod 61Catfish Sales 2009 * thou dol All Cattle 39
CENSUS OF AGRI. 2007 Number CASH RECEIPTS - 2009 Thou Dol Beef Cows 39 Number of Farms 478 Crops 22,570 Broilers * Land in Farms (Acres) 165,699 Livestock & Poultry 25,247 Catfish Sales * Average Farm Size (Acres) 347 Total Farm Receipts 1/ 56,446
1/ Includes govt payments & other farm income.
HOUSTON COMMODITIES CROPS - 2009 Ac Hvst Yield Production
Cotton 19,400 653 lbs 26,400 bales Corn 2,600 83 bu 215,000 bu STATE RANKING Soybeans 7,600 29.5 bu 224,000 bu Peanuts 33,500 2,940 bu 98,500,000 lbs Cotton 3 Hay 5,300 2.2 tons 11,600 tons Corn 24LIVESTOCK Ref Date Number Soybeans 19All Cattle & Calves Jan 10 25,800 head Peanuts 1 Beef Cows Jan 10 13,700 head Hay 57Broilers 2009 * thou birds Nursery/Sod 31Catfish Sales 2009 * thou dol All Cattle 13
CENSUS OF AGRI. 2007 Number CASH RECEIPTS - 2009 Thou Dol Beef Cows 14 Number of Farms 841 Crops 45,277 Broilers * Land in Farms (Acres) 204,645 Livestock & Poultry 14,523 Catfish Sales * Average Farm Size (Acres) 243 Total Farm Receipts 1/ 71,970
1/ Includes govt payments & other farm income.
JACKSON COMMODITIES CROPS - 2009 Ac Hvst Yield Production
Cotton * * lbs * bales Corn 18,600 110 bu 2,055,000 bu STATE RANKING Soybeans 31,800 36.5 bu 1,163,000 bu Peanuts * * bu * lbs Cotton * Hay 26,600 2.6 tons 69,200 tons Corn 6 LIVESTOCK Ref Date Number Soybeans 3 All Cattle & Calves Jan 10 32,000 head Peanuts * Beef Cows Jan 10 14,200 head Hay 3 Broilers 2009 * thou birds Nursery/Sod 37Catfish Sales 2009 * thou dol All Cattle 10
CENSUS OF AGRI. 2007 Number CASH RECEIPTS - 2009 Thou Dol Beef Cows 10 Number of Farms 1,523 Crops 24,508 Broilers * Land in Farms (Acres) 242,850 Livestock & Poultry 85,744 Catfish Sales * Average Farm Size (Acres) 159 Total Farm Receipts 1/ 122,961
1/ Includes govt payments & other farm income.

60 USDA, NASS, Alabama Field Office
JEFFERSON COMMODITIES CROPS - 2009 Ac Hvst Yield Production
Cotton * * lbs * bales Corn * * bu * bu STATE RANKING Soybeans * * bu * bu Peanuts * * bu * lbs Cotton * Hay 7,800 1.6 tons 12,500 tons Corn * LIVESTOCK Ref Date Number Soybeans * All Cattle & Calves Jan 10 3,500 head Peanuts * Beef Cows Jan 10 2,000 head Hay 56Broilers 2009 * thou birds Nursery/Sod 28Catfish Sales 2009 * thou dol All Cattle 66
CENSUS OF AGRI. 2007 Number CASH RECEIPTS - 2009 Thou Dol Beef Cows 66 Number of Farms 470 Crops 1,527 Broilers * Land in Farms (Acres) 40,455 Livestock & Poultry 1,556 Catfish Sales * Average Farm Size (Acres) 86 Total Farm Receipts 1/ 3,422
1/ Includes govt payments & other farm income.
LAMAR COMMODITIES CROPS - 2009 Ac Hvst Yield Production
Cotton * * lbs * bales Corn 1,200 71 bu 85,000 bu STATE RANKING Soybeans * * bu * bu Peanuts * * bu * lbs Cotton * Hay 7,000 2.0 tons 13,500 tons Corn 42LIVESTOCK Ref Date Number Soybeans * All Cattle & Calves Jan 10 6,800 head Peanuts * Beef Cows Jan 10 3,600 head Hay 55Broilers 2009 * thou birds Nursery/Sod 60Catfish Sales 2009 * thou dol All Cattle 60
CENSUS OF AGRI. 2007 Number CASH RECEIPTS - 2009 Thou Dol Beef Cows 62 Number of Farms 422 Crops 1,998 Broilers * Land in Farms (Acres) 84,645 Livestock & Poultry 5,293 Catfish Sales * Average Farm Size (Acres) 201 Total Farm Receipts 1/ 8,371
1/ Includes govt payments & other farm income.
LAUDERDALE COMMODITIES CROPS - 2009 Ac Hvst Yield Production
Cotton 10,800 831 lbs 18,700 bales Corn 20,200 130 bu 2,620,000 bu STATE RANKING Soybeans 21,900 39.5 bu 863,000 bu Peanuts * * bu * lbs Cotton 6 Hay 29,300 2.0 tons 58,500 tons Corn 3 LIVESTOCK Ref Date Number Soybeans 8 All Cattle & Calves Jan 10 38,000 head Peanuts * Beef Cows Jan 10 20,200 head Hay 6 Broilers 2009 * thou birds Nursery/Sod 33Catfish Sales 2009 * thou dol All Cattle 5
CENSUS OF AGRI. 2007 Number CASH RECEIPTS - 2009 Thou Dol Beef Cows 4 Number of Farms 1,697 Crops 27,122 Broilers * Land in Farms (Acres) 227,692 Livestock & Poultry 27,712 Catfish Sales * Average Farm Size (Acres) 134 Total Farm Receipts 1/ 64,947
1/ Includes govt payments & other farm income.

USDA, NASS, Alabama Field Office 61
LAWRENCE COMMODITIES CROPS - 2009 Ac Hvst Yield Production
Cotton 4,300 692 lbs 6,200 bales Corn 34,700 112 bu 3,895,000 bu STATE RANKING Soybeans 23,900 44.0 bu 1,057,000 bu Peanuts * * bu * lbs Cotton 16Hay 22,200 2.1 tons 45,300 tons Corn 1 LIVESTOCK Ref Date Number Soybeans 4 All Cattle & Calves Jan 10 23,500 head Peanuts * Beef Cows Jan 10 11,800 head Hay 10Broilers 2009 38,073 thou birds Nursery/Sod 40Catfish Sales 2009 * thou dol All Cattle 19
CENSUS OF AGRI. 2007 Number CASH RECEIPTS - 2009 Thou Dol Beef Cows 20 Number of Farms 1,601 Crops 30,022 Broilers 8 Land in Farms (Acres) 222,401 Livestock & Poultry 113,366 Catfish Sales * Average Farm Size (Acres) 139 Total Farm Receipts 1/ 164,758
1/ Includes govt payments & other farm income.
LEE COMMODITIES CROPS - 2009 Ac Hvst Yield Production
Cotton * * lbs * bales Corn * * bu * bu STATE RANKING Soybeans * * bu * bu Peanuts * * bu * lbs Cotton * Hay 2,300 2.9 tons 6,500 tons Corn * LIVESTOCK Ref Date Number Soybeans * All Cattle & Calves Jan 10 7,100 head Peanuts * Beef Cows Jan 10 4,300 head Hay 65Broilers 2009 * thou birds Nursery/Sod 3 Catfish Sales 2009 * thou dol All Cattle 58
CENSUS OF AGRI. 2007 Number CASH RECEIPTS - 2009 Thou Dol Beef Cows 58 Number of Farms 356 Crops 27,004 Broilers * Land in Farms (Acres) 63,188 Livestock & Poultry 2,414 Catfish Sales * Average Farm Size (Acres) 177 Total Farm Receipts 1/ 32,914
1/ Includes govt payments & other farm income.
LIMESTONE COMMODITIES CROPS - 2009 Ac Hvst Yield Production
Cotton 11,000 711 lbs 16,300 bal Corn 23,100 142 bu 3,278,000 bu STATE RANKING Soybeans 63,900 44.5 bu 2,830,000 bu Peanuts * * bu * lbs Cotton 9 Hay 19,500 1.9 tons 36,000 ton Corn 2 LIVESTOCK Ref Date Number Soybeans 1 All Cattle & Calves Jan 10 22,900 head Peanuts * Beef Cows Jan 10 12,800 head Hay 17Broilers 2009 * thou birds Nursery/Sod 9 Catfish Sales 2009 * thou dol All Cattle 21
CENSUS OF AGRI. 2007 Number CASH RECEIPTS - 2009 Thou Dol Beef Cows 16 Number of Farms 1,352 Crops 61,291 Broilers * Land in Farms (Acres) 237,188 Livestock & Poultry 29,873 Catfish Sales * Average Farm Size (Acres) 175 Total Farm Receipts 1/ 109,624
1/ Includes govt payments & other farm income.
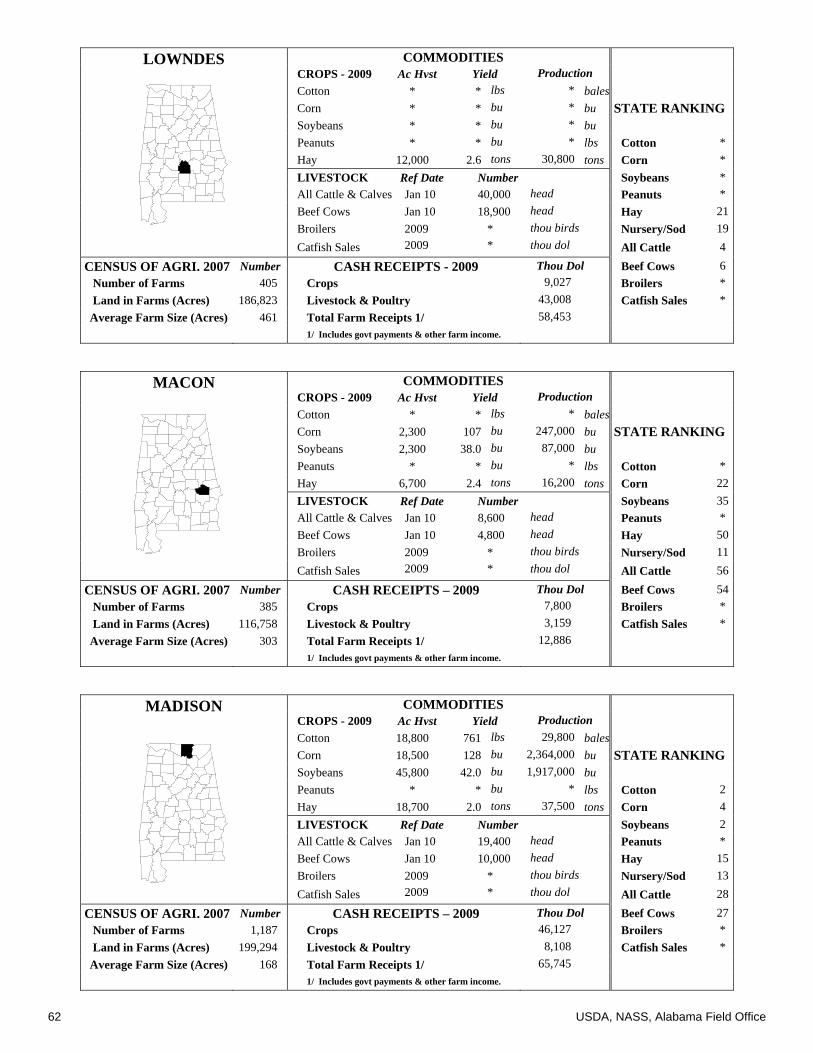
62 USDA, NASS, Alabama Field Office
LOWNDES COMMODITIES CROPS - 2009 Ac Hvst Yield Production
Cotton * * lbs * bales Corn * * bu * bu STATE RANKING Soybeans * * bu * bu Peanuts * * bu * lbs Cotton * Hay 12,000 2.6 tons 30,800 tons Corn * LIVESTOCK Ref Date Number Soybeans * All Cattle & Calves Jan 10 40,000 head Peanuts * Beef Cows Jan 10 18,900 head Hay 21Broilers 2009 * thou birds Nursery/Sod 19Catfish Sales 2009 * thou dol All Cattle 4
CENSUS OF AGRI. 2007 Number CASH RECEIPTS - 2009 Thou Dol Beef Cows 6 Number of Farms 405 Crops 9,027 Broilers * Land in Farms (Acres) 186,823 Livestock & Poultry 43,008 Catfish Sales * Average Farm Size (Acres) 461 Total Farm Receipts 1/ 58,453
1/ Includes govt payments & other farm income.
MACON COMMODITIES CROPS - 2009 Ac Hvst Yield Production
Cotton * * lbs * bales Corn 2,300 107 bu 247,000 bu STATE RANKING Soybeans 2,300 38.0 bu 87,000 bu Peanuts * * bu * lbs Cotton * Hay 6,700 2.4 tons 16,200 tons Corn 22LIVESTOCK Ref Date Number Soybeans 35All Cattle & Calves Jan 10 8,600 head Peanuts * Beef Cows Jan 10 4,800 head Hay 50Broilers 2009 * thou birds Nursery/Sod 11Catfish Sales 2009 * thou dol All Cattle 56
CENSUS OF AGRI. 2007 Number CASH RECEIPTS – 2009 Thou Dol Beef Cows 54 Number of Farms 385 Crops 7,800 Broilers * Land in Farms (Acres) 116,758 Livestock & Poultry 3,159 Catfish Sales * Average Farm Size (Acres) 303 Total Farm Receipts 1/ 12,886
1/ Includes govt payments & other farm income.
MADISON COMMODITIES CROPS - 2009 Ac Hvst Yield Production
Cotton 18,800 761 lbs 29,800 bales Corn 18,500 128 bu 2,364,000 bu STATE RANKING Soybeans 45,800 42.0 bu 1,917,000 bu Peanuts * * bu * lbs Cotton 2 Hay 18,700 2.0 tons 37,500 tons Corn 4 LIVESTOCK Ref Date Number Soybeans 2 All Cattle & Calves Jan 10 19,400 head Peanuts * Beef Cows Jan 10 10,000 head Hay 15Broilers 2009 * thou birds Nursery/Sod 13Catfish Sales 2009 * thou dol All Cattle 28
CENSUS OF AGRI. 2007 Number CASH RECEIPTS – 2009 Thou Dol Beef Cows 27 Number of Farms 1,187 Crops 46,127 Broilers * Land in Farms (Acres) 199,294 Livestock & Poultry 8,108 Catfish Sales * Average Farm Size (Acres) 168 Total Farm Receipts 1/ 65,745
1/ Includes govt payments & other farm income.

USDA, NASS, Alabama Field Office 63
MARENGO COMMODITIES CROPS - 2009 Ac Hvst Yield Production
Cotton * * lbs * bales Corn * * bu * bu STATE RANKING Soybeans * * bu * bu Peanuts * * bu * lbs Cotton * Hay 20,800 1.6 tons 32,600 tons Corn * LIVESTOCK Ref Date Number Soybeans * All Cattle & Calves Jan 10 22,300 head Peanuts * Beef Cows Jan 10 10,100 head Hay 20Broilers 2009 * thou birds Nursery/Sod 66Catfish Sales 2009 1,748 thou dol All Cattle 22
CENSUS OF AGRI. 2007 Number CASH RECEIPTS - 2009 Thou Dol Beef Cows 25 Number of Farms 555 Crops 3,389 Broilers * Land in Farms (Acres) 178,157 Livestock & Poultry 9,832 Catfish Sales 7 Average Farm Size (Acres) 321 Total Farm Receipts 1/ 15,831
1/ Includes govt payments & other farm income.
MARION COMMODITIES CROPS - 2009 Ac Hvst Yield Production
Cotton * * lbs * bales Corn * * bu * bu STATE RANKING Soybeans * * bu * bu Peanuts * * bu * lbs Cotton * Hay 9,000 2.5 tons 22,500 tons Corn * LIVESTOCK Ref Date Number Soybeans * All Cattle & Calves Jan 10 14,500 head Peanuts * Beef Cows Jan 10 8,600 head Hay 37Broilers 2009 23,918 thou birds Nursery/Sod 55Catfish Sales 2009 * thou dol All Cattle 38
CENSUS OF AGRI. 2007 Number CASH RECEIPTS - 2009 Thou Dol Beef Cows 35 Number of Farms 787 Crops 2,629 Broilers 16 Land in Farms (Acres) 117,206 Livestock & Poultry 67,846 Catfish Sales * Average Farm Size (Acres) 149 Total Farm Receipts 1/ 77,617
1/ Includes govt payments & other farm income.
MARSHALL COMMODITIES CROPS - 2009 Ac Hvst Yield Production
Cotton * * lbs * bales Corn 3,000 77 bu 232,000 bu STATE RANKING Soybeans 6,000 38.5 bu 232,000 bu Peanuts * * bu * lbs Cotton * Hay 20,000 2.9 tons 57,600 tons Corn 23LIVESTOCK Ref Date Number Soybeans 17All Cattle & Calves Jan 10 33,400 head Peanuts * Beef Cows Jan 10 20,300 head Hay 7 Broilers 2009 64,696 thou birds Nursery/Sod 27Catfish Sales 2009 * thou dol All Cattle 8
CENSUS OF AGRI. 2007 Number CASH RECEIPTS - 2009 Thou Dol Beef Cows 3 Number of Farms 1,731 Crops 6,183 Broilers 3 Land in Farms (Acres) 154,548 Livestock & Poultry 189,449 Catfish Sales * Average Farm Size (Acres) 89 Total Farm Receipts 1/ 215,181
1/ Includes govt payments & other farm income.
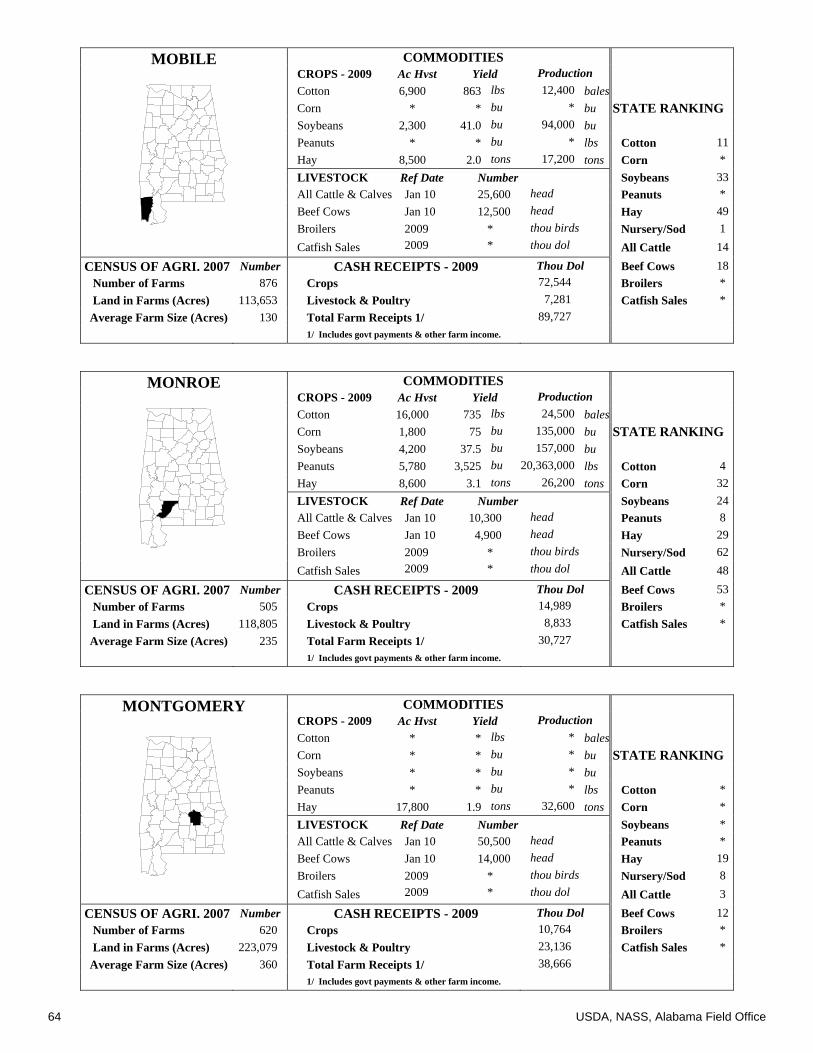
64 USDA, NASS, Alabama Field Office
MOBILE COMMODITIES CROPS - 2009 Ac Hvst Yield Production
Cotton 6,900 863 lbs 12,400 bales Corn * * bu * bu STATE RANKING Soybeans 2,300 41.0 bu 94,000 bu Peanuts * * bu * lbs Cotton 11Hay 8,500 2.0 tons 17,200 tons Corn * LIVESTOCK Ref Date Number Soybeans 33All Cattle & Calves Jan 10 25,600 head Peanuts * Beef Cows Jan 10 12,500 head Hay 49Broilers 2009 * thou birds Nursery/Sod 1 Catfish Sales 2009 * thou dol All Cattle 14
CENSUS OF AGRI. 2007 Number CASH RECEIPTS - 2009 Thou Dol Beef Cows 18 Number of Farms 876 Crops 72,544 Broilers * Land in Farms (Acres) 113,653 Livestock & Poultry 7,281 Catfish Sales * Average Farm Size (Acres) 130 Total Farm Receipts 1/ 89,727
1/ Includes govt payments & other farm income.
MONROE COMMODITIES CROPS - 2009 Ac Hvst Yield Production
Cotton 16,000 735 lbs 24,500 bales Corn 1,800 75 bu 135,000 bu STATE RANKING Soybeans 4,200 37.5 bu 157,000 bu Peanuts 5,780 3,525 bu 20,363,000 lbs Cotton 4 Hay 8,600 3.1 tons 26,200 tons Corn 32LIVESTOCK Ref Date Number Soybeans 24All Cattle & Calves Jan 10 10,300 head Peanuts 8 Beef Cows Jan 10 4,900 head Hay 29Broilers 2009 * thou birds Nursery/Sod 62Catfish Sales 2009 * thou dol All Cattle 48
CENSUS OF AGRI. 2007 Number CASH RECEIPTS - 2009 Thou Dol Beef Cows 53 Number of Farms 505 Crops 14,989 Broilers * Land in Farms (Acres) 118,805 Livestock & Poultry 8,833 Catfish Sales * Average Farm Size (Acres) 235 Total Farm Receipts 1/ 30,727
1/ Includes govt payments & other farm income.
MONTGOMERY COMMODITIES CROPS - 2009 Ac Hvst Yield Production
Cotton * * lbs * bales Corn * * bu * bu STATE RANKING Soybeans * * bu * bu Peanuts * * bu * lbs Cotton * Hay 17,800 1.9 tons 32,600 tons Corn * LIVESTOCK Ref Date Number Soybeans * All Cattle & Calves Jan 10 50,500 head Peanuts * Beef Cows Jan 10 14,000 head Hay 19Broilers 2009 * thou birds Nursery/Sod 8 Catfish Sales 2009 * thou dol All Cattle 3
CENSUS OF AGRI. 2007 Number CASH RECEIPTS - 2009 Thou Dol Beef Cows 12 Number of Farms 620 Crops 10,764 Broilers * Land in Farms (Acres) 223,079 Livestock & Poultry 23,136 Catfish Sales * Average Farm Size (Acres) 360 Total Farm Receipts 1/ 38,666
1/ Includes govt payments & other farm income.

USDA, NASS, Alabama Field Office 65
MORGAN COMMODITIES CROPS - 2009 Ac Hvst Yield Production
Cotton * * lbs * bales Corn 3,700 124 bu 458,000 bu STATE RANKING Soybeans 6,900 38.5 bu 264,000 bu Peanuts * * bu * lbs Cotton * Hay 19,800 2.2 tons 44,000 tons Corn 11LIVESTOCK Ref Date Number Soybeans 13All Cattle & Calves Jan 10 33,000 head Peanuts * Beef Cows Jan 10 16,300 head Hay 12Broilers 2009 25,047 thou birds Nursery/Sod 32Catfish Sales 2009 * thou dol All Cattle 9
CENSUS OF AGRI. 2007 Number CASH RECEIPTS - 2009 Thou Dol Beef Cows 8 Number of Farms 1,457 Crops 7,409 Broilers 14 Land in Farms (Acres) 161,531 Livestock & Poultry 77,995 Catfish Sales * Average Farm Size (Acres) 111 Total Farm Receipts 1/ 94,687
1/ Includes govt payments & other farm income.
PERRY COMMODITIES CROPS - 2009 Ac Hvst Yield Production
Cotton * * lbs * bales Corn * * bu * bu STATE RANKING Soybeans * * bu * bu Peanuts * * bu * lbs Cotton * Hay 9,300 2.1 tons 19,300 tons Corn * LIVESTOCK Ref Date Number Soybeans * All Cattle & Calves Jan 10 20,600 head Peanuts * Beef Cows Jan 10 10,500 head Hay 46Broilers 2009 * thou birds Nursery/Sod 67Catfish Sales 2009 9,556 thou dol All Cattle 25
CENSUS OF AGRI. 2007 Number CASH RECEIPTS - 2009 Thou Dol Beef Cows 24 Number of Farms 390 Crops 4,088 Broilers * Land in Farms (Acres) 165,773 Livestock & Poultry 14,813 Catfish Sales 4 Average Farm Size (Acres) 425 Total Farm Receipts 1/ 22,025
1/ Includes govt payments & other farm income.
PICKENS COMMODITIES CROPS - 2009 Ac Hvst Yield Production
Cotton * * lbs * bales Corn * * bu * bu STATE RANKING Soybeans * * bu * bu Peanuts * * bu * lbs Cotton * Hay 11,600 2.6 tons 30,400 tons Corn * LIVESTOCK Ref Date Number Soybeans * All Cattle & Calves Jan 10 17,700 head Peanuts * Beef Cows Jan 10 9,500 head Hay 22Broilers 2009 * thou birds Nursery/Sod 41Catfish Sales 2009 2,443 thou dol All Cattle 31
CENSUS OF AGRI. 2007 Number CASH RECEIPTS - 2009 Thou Dol Beef Cows 31 Number of Farms 503 Crops 3,778 Broilers * Land in Farms (Acres) 130,751 Livestock & Poultry 83,918 Catfish Sales 6 Average Farm Size (Acres) 260 Total Farm Receipts 1/ 96,523
1/ Includes govt payments & other farm income.

66 USDA, NASS, Alabama Field Office
PIKE COMMODITIES CROPS - 2009 Ac Hvst Yield Production
Cotton 4,100 527 lbs 4,500 bales Corn 4,900 86 bu 419,000 bu STATE RANKING Soybeans 1,500 47.5 bu 71,000 bu Peanuts 3,200 3,415 bu 10,930,000 lbs Cotton 20Hay 17,000 3.8 tons 64,700 tons Corn 12LIVESTOCK Ref Date Number Soybeans 40All Cattle & Calves Jan 10 20,800 head Peanuts 11Beef Cows Jan 10 12,000 head Hay 4 Broilers 2009 * thou birds Nursery/Sod 42Catfish Sales 2009 * thou dol All Cattle 24
CENSUS OF AGRI. 2007 Number CASH RECEIPTS - 2009 Thou Dol Beef Cows 19 Number of Farms 709 Crops 8,194 Broilers * Land in Farms (Acres) 179,175 Livestock & Poultry 89,000 Catfish Sales * Average Farm Size (Acres) 253 Total Farm Receipts 1/ 109,161
1/ Includes govt payments & other farm income.
RANDOLPH COMMODITIES CROPS - 2009 Ac Hvst Yield Production
Cotton * * lbs * bales Corn * * bu * bu STATE RANKING Soybeans * * bu * bu Peanuts * * bu * lbs Cotton * Hay 8,500 2.7 tons 22,500 tons Corn * LIVESTOCK Ref Date Number Soybeans * All Cattle & Calves Jan 10 20,000 head Peanuts * Beef Cows Jan 10 11,500 head Hay 38Broilers 2009 * thou birds Nursery/Sod 38Catfish Sales 2009 * thou dol All Cattle 27
CENSUS OF AGRI. 2007 Number CASH RECEIPTS - 2009 Thou Dol Beef Cows 23 Number of Farms 610 Crops 1,225 Broilers * Land in Farms (Acres) 114,717 Livestock & Poultry 79,917 Catfish Sales * Average Farm Size (Acres) 188 Total Farm Receipts 1/ 89,394
1/ Includes govt payments & other farm income.
RUSSELL COMMODITIES CROPS - 2009 Ac Hvst Yield Production
Cotton * * lbs * bales Corn * * bu * bu STATE RANKING Soybeans * * bu * bu Peanuts * * bu * lbs Cotton * Hay 2,600 2.3 tons 5,900 tons Corn * LIVESTOCK Ref Date Number Soybeans * All Cattle & Calves Jan 10 5,900 head Peanuts * Beef Cows Jan 10 3,800 head Hay 66Broilers 2009 * thou birds Nursery/Sod 12Catfish Sales 2009 * thou dol All Cattle 63
CENSUS OF AGRI. 2007 Number CASH RECEIPTS - 2009 Thou Dol Beef Cows 60 Number of Farms 303 Crops 8,649 Broilers * Land in Farms (Acres) 94,155 Livestock & Poultry 5,007 Catfish Sales * Average Farm Size (Acres) 311 Total Farm Receipts 1/ 16,459
1/ Includes govt payments & other farm income.
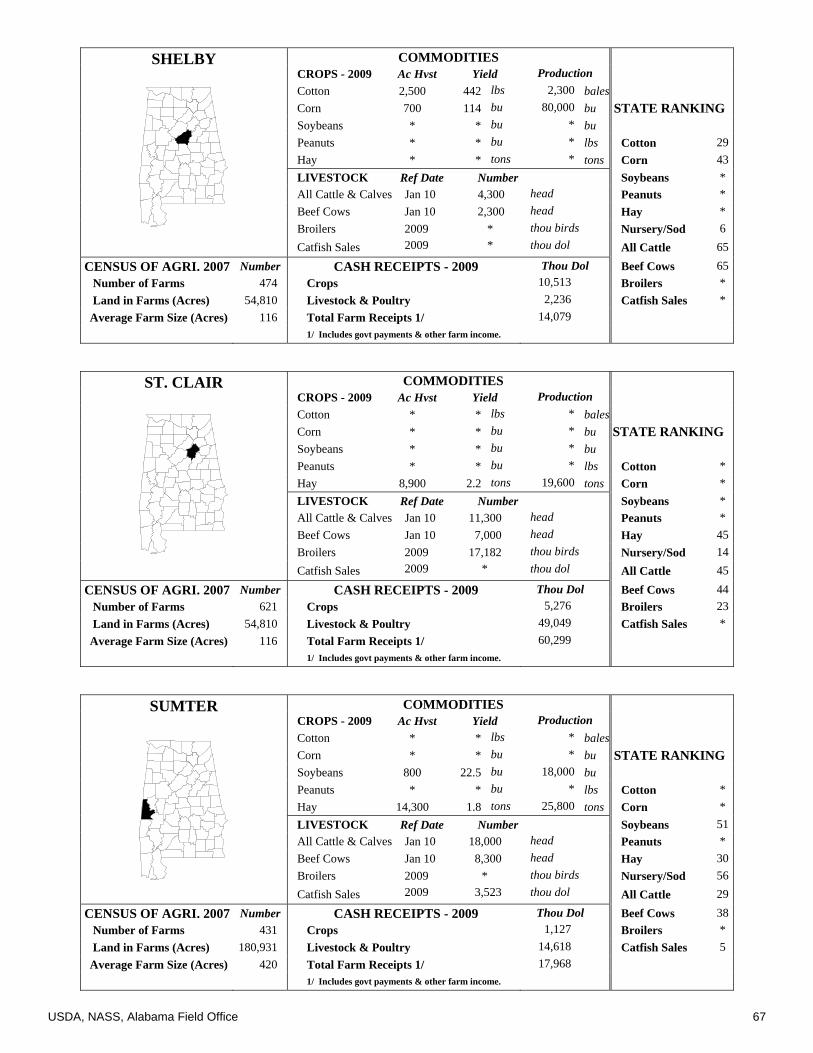
USDA, NASS, Alabama Field Office 67
SHELBY COMMODITIES CROPS - 2009 Ac Hvst Yield Production
Cotton 2,500 442 lbs 2,300 bales Corn 700 114 bu 80,000 bu STATE RANKING Soybeans * * bu * bu Peanuts * * bu * lbs Cotton 29Hay * * tons * tons Corn 43LIVESTOCK Ref Date Number Soybeans * All Cattle & Calves Jan 10 4,300 head Peanuts * Beef Cows Jan 10 2,300 head Hay * Broilers 2009 * thou birds Nursery/Sod 6 Catfish Sales 2009 * thou dol All Cattle 65
CENSUS OF AGRI. 2007 Number CASH RECEIPTS - 2009 Thou Dol Beef Cows 65 Number of Farms 474 Crops 10,513 Broilers * Land in Farms (Acres) 54,810 Livestock & Poultry 2,236 Catfish Sales * Average Farm Size (Acres) 116 Total Farm Receipts 1/ 14,079
1/ Includes govt payments & other farm income.
ST. CLAIR COMMODITIES CROPS - 2009 Ac Hvst Yield Production
Cotton * * lbs * bales Corn * * bu * bu STATE RANKING Soybeans * * bu * bu Peanuts * * bu * lbs Cotton * Hay 8,900 2.2 tons 19,600 tons Corn * LIVESTOCK Ref Date Number Soybeans * All Cattle & Calves Jan 10 11,300 head Peanuts * Beef Cows Jan 10 7,000 head Hay 45Broilers 2009 17,182 thou birds Nursery/Sod 14Catfish Sales 2009 * thou dol All Cattle 45
CENSUS OF AGRI. 2007 Number CASH RECEIPTS - 2009 Thou Dol Beef Cows 44 Number of Farms 621 Crops 5,276 Broilers 23 Land in Farms (Acres) 54,810 Livestock & Poultry 49,049 Catfish Sales * Average Farm Size (Acres) 116 Total Farm Receipts 1/ 60,299
1/ Includes govt payments & other farm income.
SUMTER COMMODITIES CROPS - 2009 Ac Hvst Yield Production
Cotton * * lbs * bales Corn * * bu * bu STATE RANKING Soybeans 800 22.5 bu 18,000 bu Peanuts * * bu * lbs Cotton * Hay 14,300 1.8 tons 25,800 tons Corn * LIVESTOCK Ref Date Number Soybeans 51All Cattle & Calves Jan 10 18,000 head Peanuts * Beef Cows Jan 10 8,300 head Hay 30Broilers 2009 * thou birds Nursery/Sod 56Catfish Sales 2009 3,523 thou dol All Cattle 29
CENSUS OF AGRI. 2007 Number CASH RECEIPTS - 2009 Thou Dol Beef Cows 38 Number of Farms 431 Crops 1,127 Broilers * Land in Farms (Acres) 180,931 Livestock & Poultry 14,618 Catfish Sales 5 Average Farm Size (Acres) 420 Total Farm Receipts 1/ 17,968
1/ Includes govt payments & other farm income.

68 USDA, NASS, Alabama Field Office
TALLADEGA COMMODITIES CROPS - 2009 Ac Hvst Yield Production
Cotton 2,810 581 lbs 3,400 bales Corn 7,250 121 bu 880,000 bu STATE RANKING Soybeans 10,000 39.5 bu 397,000 bu Peanuts * * bu * lbs Cotton 23Hay 9,800 2.3 tons 22,100 tons Corn 8 LIVESTOCK Ref Date Number Soybeans 11All Cattle & Calves Jan 10 17,000 head Peanuts * Beef Cows Jan 10 9,800 head Hay 39Broilers 2009 * thou birds Nursery/Sod 35Catfish Sales 2009 * thou dol All Cattle 33
CENSUS OF AGRI. 2007 Number CASH RECEIPTS - 2009 Thou Dol Beef Cows 29 Number of Farms 625 Crops 10,213 Broilers * Land in Farms (Acres) 119,042 Livestock & Poultry 15,133 Catfish Sales * Average Farm Size (Acres) 190 Total Farm Receipts 1/ 29,146
1/ Includes govt payments & other farm income.
TALLAPOOSA COMMODITIES CROPS - 2009 Ac Hvst Yield Production
Cotton * * lbs * bales Corn * * bu * bu STATE RANKING Soybeans * * bu * bu Peanuts * * bu * lbs Cotton * Hay 2,900 3.1 tons 9,000 tons Corn * LIVESTOCK Ref Date Number Soybeans * All Cattle & Calves Jan 10 8,700 head Peanuts * Beef Cows Jan 10 5,400 head Hay 61Broilers 2009 * thou birds Nursery/Sod 39Catfish Sales 2009 * thou dol All Cattle 55
CENSUS OF AGRI. 2007 Number CASH RECEIPTS - 2009 Thou Dol Beef Cows 52 Number of Farms 377 Crops 1,609 Broilers * Land in Farms (Acres) 64,078 Livestock & Poultry 6,177 Catfish Sales * Average Farm Size (Acres) 170 Total Farm Receipts 1/ 8,942
1/ Includes govt payments & other farm income.
TUSCALOOSA COMMODITIES CROPS - 2009 Ac Hvst Yield Production
Cotton * * lbs * bales Corn 2,650 99 bu 262,000 bu STATE RANKING Soybeans 5,000 40.0 bu 201,000 bu Peanuts * * bu * lbs Cotton * Hay 10,000 1.9 tons 19,100 tons Corn 20LIVESTOCK Ref Date Number Soybeans 20All Cattle & Calves Jan 10 9,600 head Peanuts * Beef Cows Jan 10 4,700 head Hay 47Broilers 2009 * thou birds Nursery/Sod 16Catfish Sales 2009 * thou dol All Cattle 52
CENSUS OF AGRI. 2007 Number CASH RECEIPTS - 2009 Thou Dol Beef Cows 56 Number of Farms 613 Crops 7,092 Broilers * Land in Farms (Acres) 110,588 Livestock & Poultry 18,718 Catfish Sales * Average Farm Size (Acres) 180 Total Farm Receipts 1/ 29,263
1/ Includes govt payments & other farm income.

USDA, NASS, Alabama Field Office 69
WALKER COMMODITIES CROPS - 2009 Ac Hvst Yield Production
Cotton * * lbs * bales Corn * * bu * bu STATE RANKING Soybeans * * bu * bu Peanuts * * bu * lbs Cotton * Hay 16,800 2.4 tons 39,400 tons Corn * LIVESTOCK Ref Date Number Soybeans * All Cattle & Calves Jan 10 11,000 head Peanuts * Beef Cows Jan 10 5,700 head Hay 14Broilers 2009 16,371 thou birds Nursery/Sod 44Catfish Sales 2009 * thou dol All Cattle 46
CENSUS OF AGRI. 2007 Number CASH RECEIPTS - 2009 Thou Dol Beef Cows 49 Number of Farms 629 Crops 2,107 Broilers 24 Land in Farms (Acres) 70,382 Livestock & Poultry 45,055 Catfish Sales * Average Farm Size (Acres) 112 Total Farm Receipts 1/ 51,658
1/ Includes govt payments & other farm income.
WASHINGTON COMMODITIES CROPS - 2009 Ac Hvst Yield Production
Cotton * * lbs * bales Corn 600 83 bu 50,000 bu STATE RANKING Soybeans * * bu * bu Peanuts 2,250 2,975 bu 6,696,000 lbs Cotton * Hay 3,000 2.0 tons 5,800 tons Corn 47LIVESTOCK Ref Date Number Soybeans * All Cattle & Calves Jan 10 6,600 head Peanuts 14Beef Cows Jan 10 4,200 head Hay 67Broilers 2009 * thou birds Nursery/Sod 46Catfish Sales 2009 * thou dol All Cattle 61
CENSUS OF AGRI. 2007 Number CASH RECEIPTS - 2009 Thou Dol Beef Cows 59 Number of Farms 473 Crops 2,383 Broilers * Land in Farms (Acres) 83,610 Livestock & Poultry 24,498 Catfish Sales * Average Farm Size (Acres) 177 Total Farm Receipts 1/ 29,896
1/ Includes govt payments & other farm income.
WILCOX COMMODITIES CROPS - 2009 Ac Hvst Yield Production
Cotton * * lbs * bales Corn * * bu * bu STATE RANKING Soybeans * * bu * bu Peanuts * * bu * lbs Cotton * Hay 9,800 2.2 tons 21,600 tons Corn * LIVESTOCK Ref Date Number Soybeans * All Cattle & Calves Jan 10 12,000 head Peanuts * Beef Cows Jan 10 6,000 head Hay 41Broilers 2009 * thou birds Nursery/Sod 54Catfish Sales 2009 * thou dol All Cattle 44
CENSUS OF AGRI. 2007 Number CASH RECEIPTS - 2009 Thou Dol Beef Cows 47 Number of Farms 368 Crops 2,076 Broilers * Land in Farms (Acres) 168,849 Livestock & Poultry 3,379 Catfish Sales * Average Farm Size (Acres) 459 Total Farm Receipts 1/ 7,154
1/ Includes govt payments & other farm income.
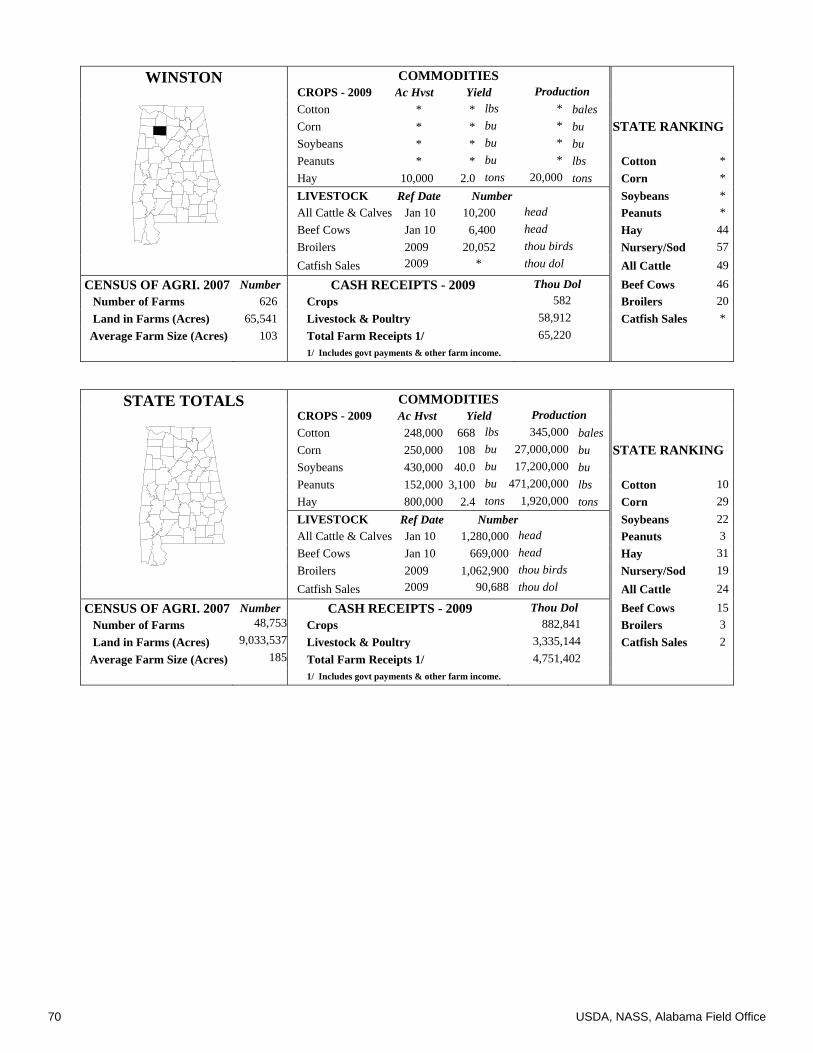
70 USDA, NASS, Alabama Field Office
WINSTON COMMODITIES
CROPS - 2009 Ac Hvst Yield Production Cotton * * lbs * bales Corn * * bu * bu STATE RANKING Soybeans * * bu * bu Peanuts * * bu * lbs Cotton * Hay 10,000 2.0 tons 20,000 tons Corn * LIVESTOCK Ref Date Number Soybeans * All Cattle & Calves Jan 10 10,200 head Peanuts * Beef Cows Jan 10 6,400 head Hay 44Broilers 2009 20,052 thou birds Nursery/Sod 57Catfish Sales 2009 * thou dol All Cattle 49
CENSUS OF AGRI. 2007 Number CASH RECEIPTS - 2009 Thou Dol Beef Cows 46 Number of Farms 626 Crops 582 Broilers 20 Land in Farms (Acres) 65,541 Livestock & Poultry 58,912 Catfish Sales * Average Farm Size (Acres) 103 Total Farm Receipts 1/ 65,220
1/ Includes govt payments & other farm income.
STATE TOTALS COMMODITIES CROPS - 2009 Ac Hvst Yield Production
Cotton 248,000 668 lbs 345,000 bales Corn 250,000 108 bu 27,000,000 bu STATE RANKING Soybeans 430,000 40.0 bu 17,200,000 bu Peanuts 152,000 3,100 bu 471,200,000 lbs Cotton 10Hay 800,000 2.4 tons 1,920,000 tons Corn 29LIVESTOCK Ref Date Number Soybeans 22All Cattle & Calves Jan 10 1,280,000 head Peanuts 3 Beef Cows Jan 10 669,000 head Hay 31Broilers 2009 1,062,900 thou birds Nursery/Sod 19Catfish Sales 2009 90,688 thou dol All Cattle 24
CENSUS OF AGRI. 2007 Number CASH RECEIPTS - 2009 Thou Dol Beef Cows 15 Number of Farms 48,753 Crops 882,841 Broilers 3 Land in Farms (Acres) 9,033,537 Livestock & Poultry 3,335,144 Catfish Sales 2 Average Farm Size (Acres) 185 Total Farm Receipts 1/ 4,751,402
1/ Includes govt payments & other farm income.

USDA, NASS, Alabama Field Office 71
1960 1967 1974 1981 1988 1995 2002 20090
50
100
150
200
250
300Million Dollars
GREENHOUSE/NURSERYCash Receipts, 1960-2009
1960 1967 1974 1981 1988 1995 2002 20090.0
0.5
1.0
1.5
2.0Million Acres
CORNAcres Planted, 1960-2009
1960 1967 1974 1981 1988 1995 2002 20090.00.10.20.30.40.50.60.70.80.91.0Million Acres
COTTONAcres Planted, 1960-2009
1960 1967 1974 1981 1988 1995 2002 20090
50
100
150
200
250
300Thousand Acres
PEANUTSAcres Planted, 1960-2009
1960 1967 1974 1981 1988 1995 2002 20090.0
0.5
1.0
1.5
2.0
2.5Million Acres
SOYBEANSAcres Planted, 1960-2009
Peanuts$104.6
Soybeans$146.9Cotton
$107.5
Vegetables$52.8
Greenhouse/Nursery $255.3 All Other Crops
$215.7
CROP RECEIPTS, 2009 Total: $882.8 Million
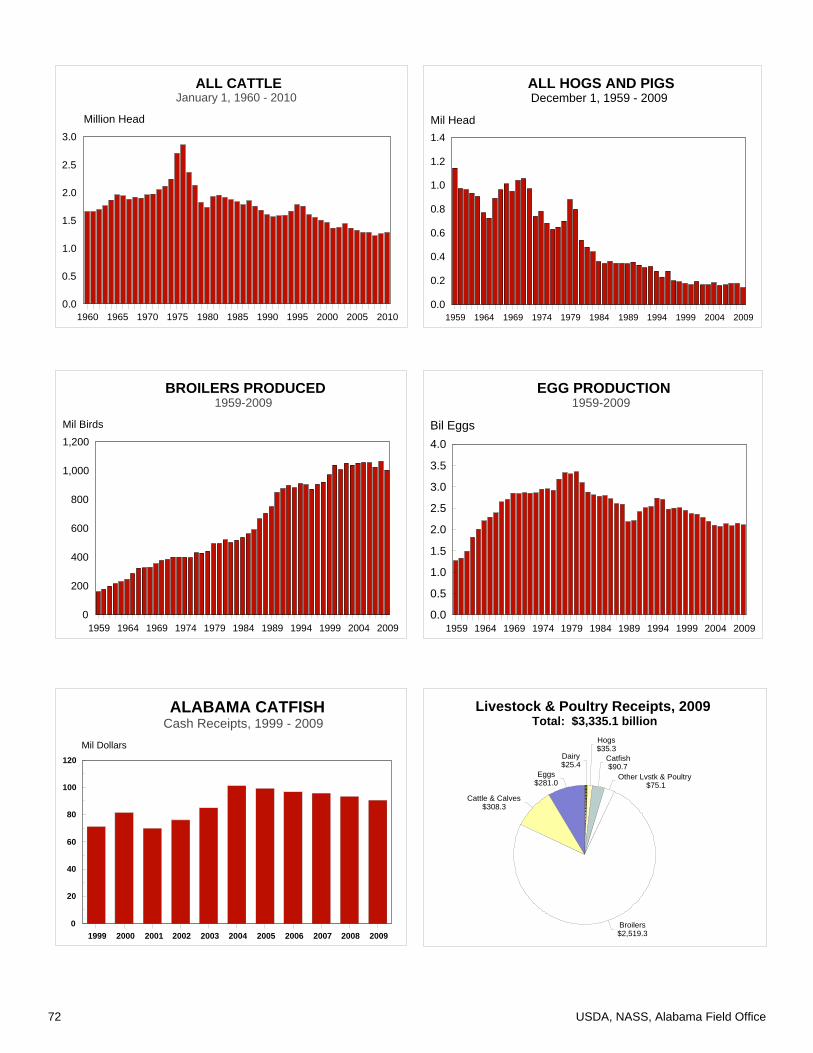
72 USDA, NASS, Alabama Field Office
1960 1965 1970 1975 1980 1985 1990 1995 2000 2005 20100.0
0.5
1.0
1.5
2.0
2.5
3.0
Million Head
ALL CATTLEJanuary 1, 1960 - 2010
1959 1964 1969 1974 1979 1984 1989 1994 1999 2004 20090.0
0.2
0.4
0.6
0.8
1.0
1.2
1.4Mil Head
ALL HOGS AND PIGSDecember 1, 1959 - 2009
1959 1964 1969 1974 1979 1984 1989 1994 1999 2004 20090
200
400
600
800
1,000
1,200Mil Birds
BROILERS PRODUCED1959-2009
1959 1964 1969 1974 1979 1984 1989 1994 1999 2004 20090.0
0.5
1.0
1.5
2.0
2.5
3.0
3.5
4.0Bil Eggs
EGG PRODUCTION1959-2009
1999 2000 2001 2002 2003 2004 2005 2006 2007 2008 20090
20
40
60
80
100
120
Mil Dollars
ALABAMA CATFISHCash Receipts, 1999 - 2009
Dairy$25.4
Hogs$35.3
Catfish$90.7
Other Lvstk & Poultry$75.1
Broilers$2,519.3
Cattle & Calves$308.3
Eggs$281.0
Livestock & Poultry Receipts, 2009Total: $3,335.1 billion

USDA, NASS, Alabama Field Office 73
Reports Issued by the Alabama Agricultural Statistics Service Alabama Farm News
A report containing statistics for a variety of commodities produced in Alabama and the Nation. Size of inventory, acreages, yields, production, and prices comprise the majority of the statistics.
Quarterly
Crop Weather Report
Crop condition and progress are reported during the growing season. Soil moisture supplies and other weather related information are included in the report.
Weekly: Apr - Nov
Broilers
Broiler eggs set and chicks placed are reported for Alabama and 15 major producing states.
Weekly (Each Wednesday)
Alabama County Data
Estimates for cattle, poultry, corn, cotton, peanuts, and soybeans are available at the county level.
Annually (Between April and June)
Alabama Agricultural Statistics A composite publication showing current and revised data for most reports issued during the year, including county data for major commodities.
Annually (September/October)
Census of Agriculture A publication that is the leading source of facts and figures about American agriculture. Conducted every five years, the Census provides a detailed picture of U.S. farms and ranches and the people who operate them. It is the only source of uniform, comprehensive agricultural data for every stateand county in the United States.
Every 5 years
To subscribe to these reports by mail, contact: (All reports are free to farmers who participate in our surveys.)
USDA, NASS, Alabama Field Office
P.O. Box 240578 Montgomery, AL 36124-0578
Or online at:
http://www.nass.usda.gov/al
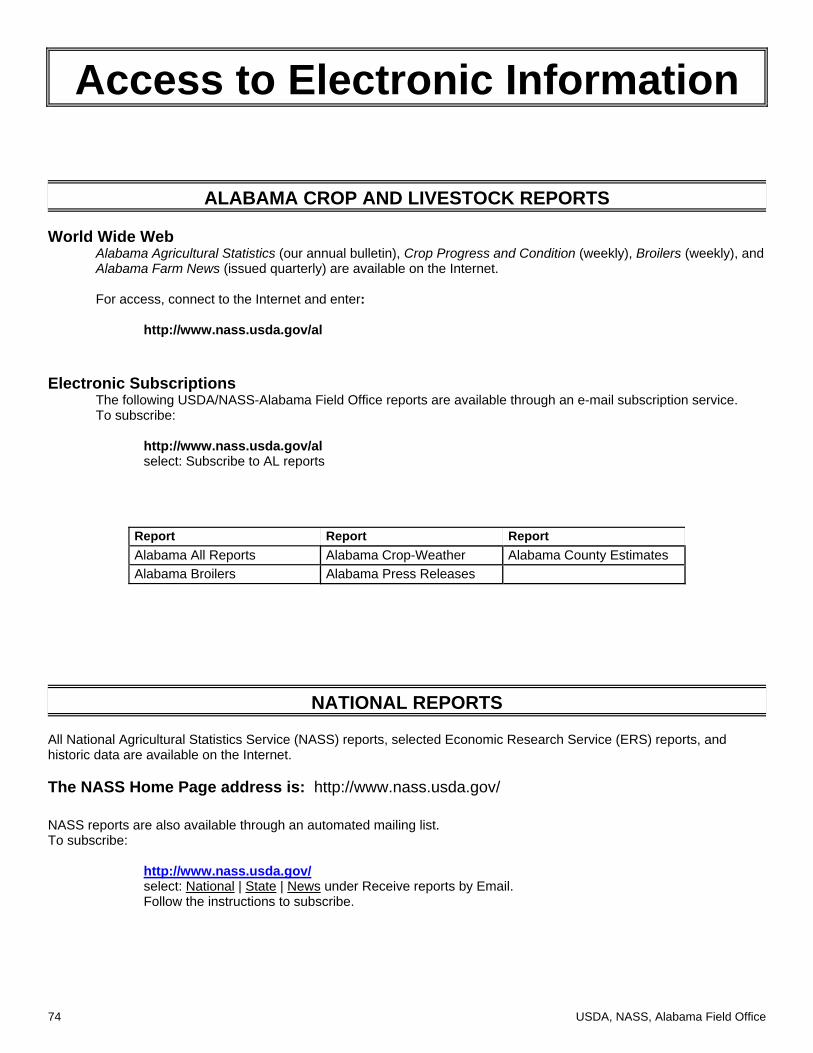
74 USDA, NASS, Alabama Field Office
Access to Electronic Information
ALABAMA CROP AND LIVESTOCK REPORTS World Wide Web
Alabama Agricultural Statistics (our annual bulletin), Crop Progress and Condition (weekly), Broilers (weekly), and Alabama Farm News (issued quarterly) are available on the Internet. For access, connect to the Internet and enter:
http://www.nass.usda.gov/al Electronic Subscriptions
The following USDA/NASS-Alabama Field Office reports are available through an e-mail subscription service. To subscribe:
http://www.nass.usda.gov/al
select: Subscribe to AL reports
Report Report Report Alabama All Reports Alabama Crop-Weather Alabama County Estimates Alabama Broilers Alabama Press Releases
NATIONAL REPORTS All National Agricultural Statistics Service (NASS) reports, selected Economic Research Service (ERS) reports, and historic data are available on the Internet. The NASS Home Page address is: http://www.nass.usda.gov/ NASS reports are also available through an automated mailing list. To subscribe:
http://www.nass.usda.gov/ select: National | State | News under Receive reports by Email. Follow the instructions to subscribe.
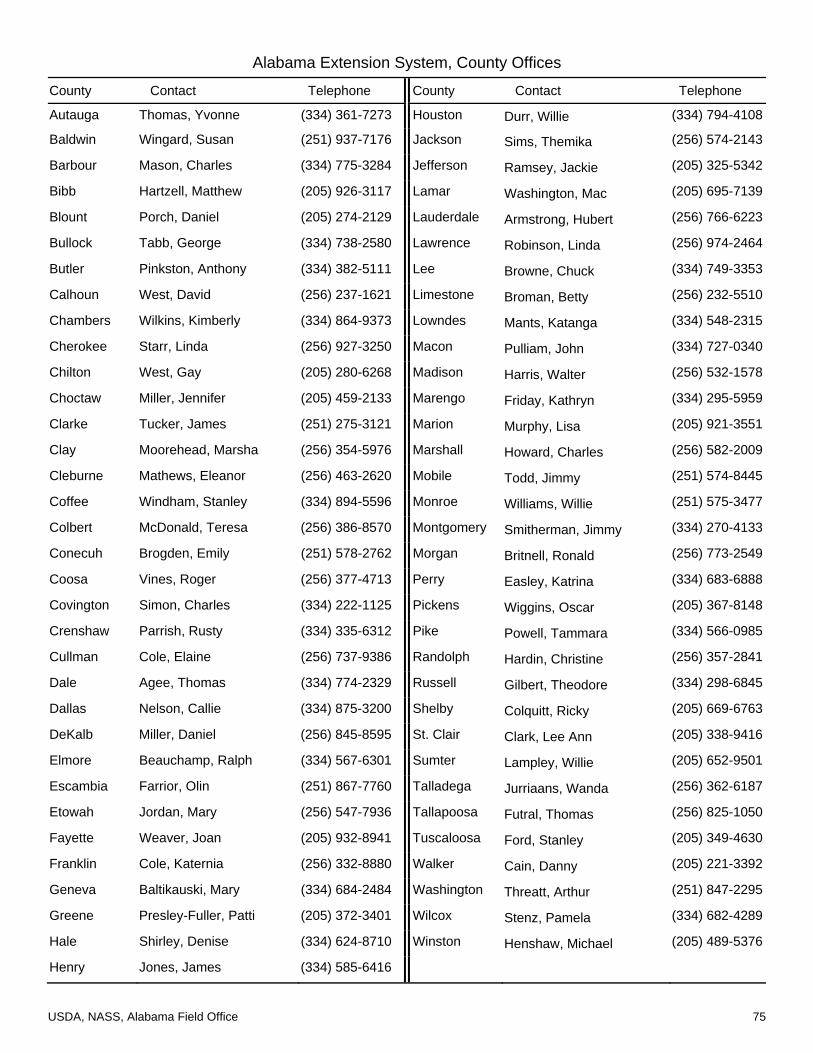
USDA, NASS, Alabama Field Office 75
Alabama Extension System, County Offices
County Contact Telephone County Contact Telephone
Autauga Thomas, Yvonne (334) 361-7273 Houston Durr, Willie (334) 794-4108
Baldwin Wingard, Susan (251) 937-7176 Jackson Sims, Themika (256) 574-2143
Barbour Mason, Charles (334) 775-3284 Jefferson Ramsey, Jackie (205) 325-5342
Bibb Hartzell, Matthew (205) 926-3117 Lamar Washington, Mac (205) 695-7139
Blount Porch, Daniel (205) 274-2129 Lauderdale Armstrong, Hubert (256) 766-6223
Bullock Tabb, George (334) 738-2580 Lawrence Robinson, Linda (256) 974-2464
Butler Pinkston, Anthony (334) 382-5111 Lee Browne, Chuck (334) 749-3353
Calhoun West, David (256) 237-1621 Limestone Broman, Betty (256) 232-5510
Chambers Wilkins, Kimberly (334) 864-9373 Lowndes Mants, Katanga (334) 548-2315
Cherokee Starr, Linda (256) 927-3250 Macon Pulliam, John (334) 727-0340
Chilton West, Gay (205) 280-6268 Madison Harris, Walter (256) 532-1578
Choctaw Miller, Jennifer (205) 459-2133 Marengo Friday, Kathryn (334) 295-5959
Clarke Tucker, James (251) 275-3121 Marion Murphy, Lisa (205) 921-3551
Clay Moorehead, Marsha (256) 354-5976 Marshall Howard, Charles (256) 582-2009
Cleburne Mathews, Eleanor (256) 463-2620 Mobile Todd, Jimmy (251) 574-8445
Coffee Windham, Stanley (334) 894-5596 Monroe Williams, Willie (251) 575-3477
Colbert McDonald, Teresa (256) 386-8570 Montgomery Smitherman, Jimmy (334) 270-4133
Conecuh Brogden, Emily (251) 578-2762 Morgan Britnell, Ronald (256) 773-2549
Coosa Vines, Roger (256) 377-4713 Perry Easley, Katrina (334) 683-6888
Covington Simon, Charles (334) 222-1125 Pickens Wiggins, Oscar (205) 367-8148
Crenshaw Parrish, Rusty (334) 335-6312 Pike Powell, Tammara (334) 566-0985
Cullman Cole, Elaine (256) 737-9386 Randolph Hardin, Christine (256) 357-2841
Dale Agee, Thomas (334) 774-2329 Russell Gilbert, Theodore (334) 298-6845
Dallas Nelson, Callie (334) 875-3200 Shelby Colquitt, Ricky (205) 669-6763
DeKalb Miller, Daniel (256) 845-8595 St. Clair Clark, Lee Ann (205) 338-9416
Elmore Beauchamp, Ralph (334) 567-6301 Sumter Lampley, Willie (205) 652-9501
Escambia Farrior, Olin (251) 867-7760 Talladega Jurriaans, Wanda (256) 362-6187
Etowah Jordan, Mary (256) 547-7936 Tallapoosa Futral, Thomas (256) 825-1050
Fayette Weaver, Joan (205) 932-8941 Tuscaloosa Ford, Stanley (205) 349-4630
Franklin Cole, Katernia (256) 332-8880 Walker Cain, Danny (205) 221-3392
Geneva Baltikauski, Mary (334) 684-2484 Washington Threatt, Arthur (251) 847-2295
Greene Presley-Fuller, Patti (205) 372-3401 Wilcox Stenz, Pamela (334) 682-4289
Hale Shirley, Denise (334) 624-8710 Winston Henshaw, Michael (205) 489-5376
Henry Jones, James (334) 585-6416
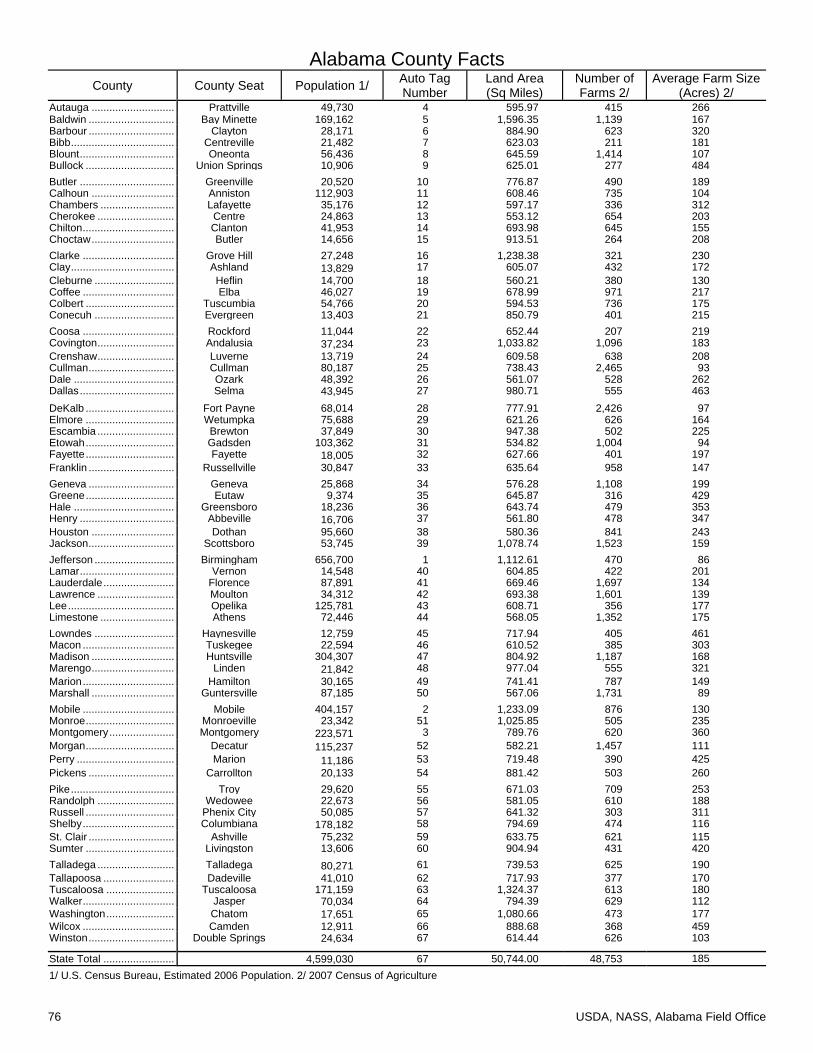
76 USDA, NASS, Alabama Field Office
Alabama County Facts County County Seat Population 1/ Auto Tag
Number Land Area (Sq Miles)
Number of Farms 2/
Average Farm Size (Acres) 2/
Autauga ............................ Prattville 49,730 4 595.97 415 266Baldwin ............................. Bay Minette 169,162 5 1,596.35 1,139 167Barbour ............................. Clayton 28,171 6 884.90 623 320Bibb ................................... Centreville 21,482 7 623.03 211 181Blount ................................ Oneonta 56,436 8 645.59 1,414 107Bullock .............................. Union Springs 10,906 9 625.01 277 484Butler ................................ Greenville 20,520 10 776.87 490 189Calhoun ............................ Anniston 112,903 11 608.46 735 104Chambers ......................... Lafayette 35,176 12 597.17 336 312Cherokee .......................... Centre 24,863 13 553.12 654 203Chilton ............................... Clanton 41,953 14 693.98 645 155Choctaw ............................ Butler 14,656 15 913.51 264 208Clarke ............................... Grove Hill 27,248 16 1,238.38 321 230Clay ................................... Ashland 13,829 17 605.07 432 172 Cleburne ........................... Heflin 14,700 18 560.21 380 130Coffee ............................... Elba 46,027 19 678.99 971 217Colbert .............................. Tuscumbia 54,766 20 594.53 736 175Conecuh ........................... Evergreen 13,403 21 850.79 401 215Coosa ............................... Rockford 11,044 22 652.44 207 219Covington .......................... Andalusia 37,234 23 1,033.82 1,096 183 Crenshaw .......................... Luverne 13,719 24 609.58 638 208Cullman ............................. Cullman 80,187 25 738.43 2,465 93Dale .................................. Ozark 48,392 26 561.07 528 262Dallas ................................ Selma 43,945 27 980.71 555 463 DeKalb .............................. Fort Payne 68,014 28 777.91 2,426 97Elmore .............................. Wetumpka 75,688 29 621.26 626 164Escambia .......................... Brewton 37,849 30 947.38 502 225Etowah .............................. Gadsden 103,362 31 534.82 1,004 94Fayette .............................. Fayette 18,005 32 627.66 401 197 Franklin ............................. Russellville 30,847 33 635.64 958 147Geneva ............................. Geneva 25,868 34 576.28 1,108 199Greene .............................. Eutaw 9,374 35 645.87 316 429Hale .................................. Greensboro 18,236 36 643.74 479 353Henry ................................ Abbeville 16,706 37 561.80 478 347 Houston ............................ Dothan 95,660 38 580.36 841 243Jackson ............................. Scottsboro 53,745 39 1,078.74 1,523 159Jefferson ........................... Birmingham 656,700 1 1,112.61 470 86Lamar ................................ Vernon 14,548 40 604.85 422 201Lauderdale ........................ Florence 87,891 41 669.46 1,697 134Lawrence .......................... Moulton 34,312 42 693.38 1,601 139Lee .................................... Opelika 125,781 43 608.71 356 177Limestone ......................... Athens 72,446 44 568.05 1,352 175Lowndes ........................... Haynesville 12,759 45 717.94 405 461Macon ............................... Tuskegee 22,594 46 610.52 385 303Madison ............................ Huntsville 304,307 47 804.92 1,187 168Marengo ............................ Linden 21,842 48 977.04 555 321 Marion ............................... Hamilton 30,165 49 741.41 787 149Marshall ............................ Guntersville 87,185 50 567.06 1,731 89Mobile ............................... Mobile 404,157 2 1,233.09 876 130Monroe .............................. Monroeville 23,342 51 1,025.85 505 235Montgomery ...................... Montgomery 223,571 3 789.76 620 360 Morgan .............................. Decatur 115,237 52 582.21 1,457 111 Perry ................................. Marion 11,186 53 719.48 390 425 Pickens ............................. Carrollton 20,133 54 881.42 503 260Pike ................................... Troy 29,620 55 671.03 709 253Randolph .......................... Wedowee 22,673 56 581.05 610 188Russell .............................. Phenix City 50,085 57 641.32 303 311Shelby ............................... Columbiana 178,182 58 794.69 474 116 St. Clair ............................. Ashville 75,232 59 633.75 621 115Sumter .............................. Livingston 13,606 60 904.94 431 420Talladega .......................... Talladega 80,271 61 739.53 625 190 Tallapoosa ........................ Dadeville 41,010 62 717.93 377 170Tuscaloosa ....................... Tuscaloosa 171,159 63 1,324.37 613 180Walker ............................... Jasper 70,034 64 794.39 629 112 Washington ....................... Chatom 17,651 65 1,080.66 473 177 Wilcox ............................... Camden 12,911 66 888.68 368 459Winston ............................. Double Springs 24,634 67 614.44 626 103
State Total ........................ 4,599,030 67 50,744.00 48,753 185 1/ U.S. Census Bureau, Estimated 2006 Population. 2/ 2007 Census of Agriculture
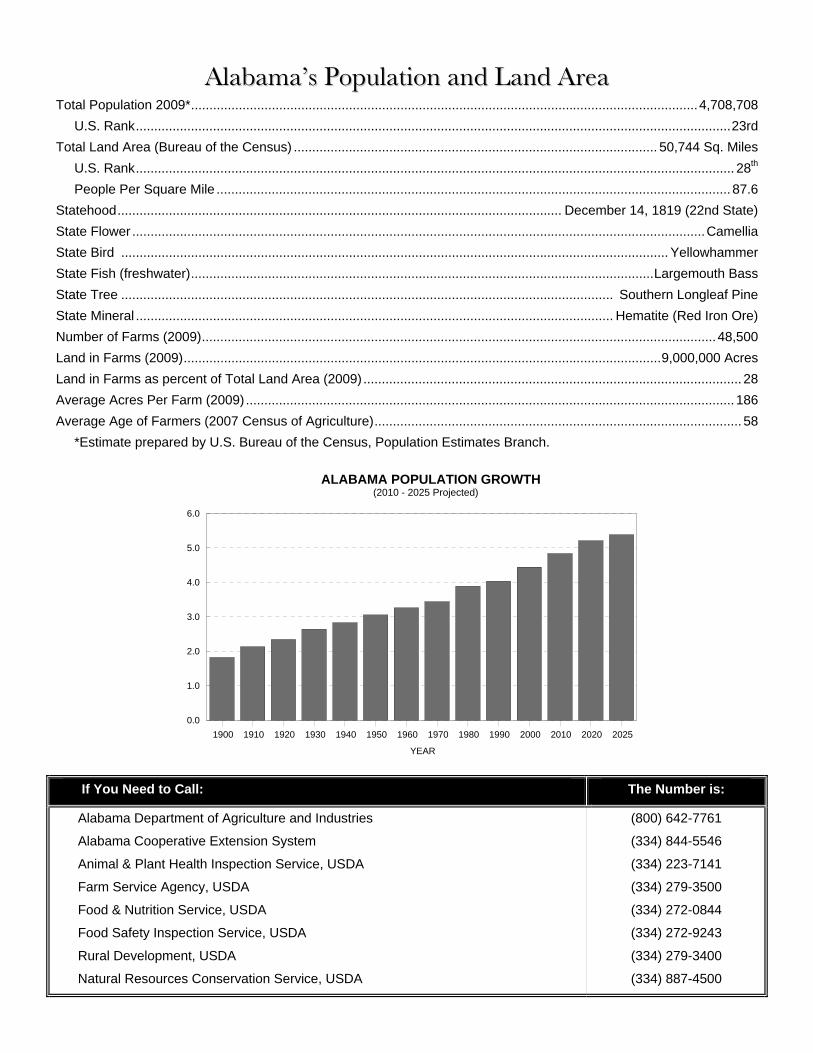
AAllaabbaammaa’’ss PPooppuullaattiioonn aanndd LLaanndd AArreeaa
Total Population 2009* .......................................................................................................................................... 4,708,708 U.S. Rank .................................................................................................................................................................. 23rd Total Land Area (Bureau of the Census) ................................................................................................... 50,744 Sq. Miles U.S. Rank ................................................................................................................................................................... 28th People Per Square Mile ............................................................................................................................................ 87.6 Statehood ......................................................................................................................... December 14, 1819 (22nd State) State Flower ............................................................................................................................................................ Camellia State Bird ..................................................................................................................................................... Yellowhammer State Fish (freshwater) .............................................................................................................................. Largemouth Bass State Tree ...................................................................................................................................... Southern Longleaf Pine State Mineral .................................................................................................................................. Hematite (Red Iron Ore) Number of Farms (2009) ............................................................................................................................................ 48,500 Land in Farms (2009) .................................................................................................................................. 9,000,000 Acres Land in Farms as percent of Total Land Area (2009) ....................................................................................................... 28 Average Acres Per Farm (2009) ..................................................................................................................................... 186 Average Age of Farmers (2007 Census of Agriculture) .................................................................................................... 58 *Estimate prepared by U.S. Bureau of the Census, Population Estimates Branch.
If You Need to Call: The Number is:
Alabama Department of Agriculture and Industries
Alabama Cooperative Extension System
Animal & Plant Health Inspection Service, USDA
Farm Service Agency, USDA
Food & Nutrition Service, USDA
Food Safety Inspection Service, USDA
Rural Development, USDA
Natural Resources Conservation Service, USDA
(800) 642-7761
(334) 844-5546
(334) 223-7141
(334) 279-3500
(334) 272-0844
(334) 272-9243
(334) 279-3400
(334) 887-4500
1900 1910 1920 1930 1940 1950 1960 1970 1980 1990 2000 2010 2020 2025
YEAR
0.0
1.0
2.0
3.0
4.0
5.0
6.0
ALABAMA POPULATION GROWTH(2010 - 2025 Projected)

PRESORTED STANDARD U.S. POSTAGE PAID
MAILED FROM ZIP 36124 PERMIT NO. G-38
Alabama A&M University
Auburn University Tuskegee University
UNITED STATES DEPARTMENT OF AGRICULTURE NATIONAL AGRICULTURAL STATISTICS SERVICE ALABAMA FIELD OFFICE POST OFFICE BOX 240578 MONTGOMERY, ALABAMA 36124-0578 _____________ OFFICIAL BUSINESS ADDRESS SERVICE REQUESTED
__________ * _____ * _____ * __________
Alabama A&M University, Auburn University, and Tuskegee University play integral roles in training and preparing young women and men for careers in agriculture. These land grant universities work together through the Alabama Agricultural Land Grant Alliance to leverage resources for important research, outreach, and extension activities. Over the years, this Alliance has worked closely with the Alabama Department of Agriculture and Industries to better support and preserve Alabama agriculture and natural resources.