Embed Size (px)
Citation preview

Long term research support provided by
Agriculture, Energy, Land and Water in GCAM
Jae Edmonds
14 December 2012National Institutes for Environmental Studies
Tsukuba, Japan

The Global Change Assessment Model Team

OVERVIEW

GCAM is an RCP-class integrated assessment model
The Energy System
Agriculture and Land Use
The EconomyRegional
Labor ForceRegional GDP
Regional Labor
Productivity
Energy Demand
Technologies
Energy Demand
Regional Resource
Bases
Regional Energy
Conversion Technologies
Energy Supply
Energy Markets
Energy Production.
Transformation & Use
GHG Emissions
Demand•Crops•LivestockForests products
SupplyRegional Land Categories and Characteristics
Ag-Land Markets
Production•Crops•Livestock•Forests products•Biomass energy
Commercial Biomass
Land Use ChangeEmissions
Technology
Land Use•Crops•Livestock•Managed Forests•Unmanaged
•Crops•Livestock•Biocrops•Foresty Products
•Land rent•Crop prices•Livestock prices•Forest product prices•Biomass prices
Terrestrial Carbon Cycle
Atmospheric Composition,
Radiative Forcing, & Climate
Ocean Carbon Cycle

GCAM is an RCP class IAM
The Energy System
Agriculture and Land Use
The EconomyRegional
Labor ForceRegional GDP
Regional Labor
Productivity
Energy Demand
Technologies
Energy Demand
Regional Resource
Bases
Regional Energy
Conversion Technologies
Energy Supply
Energy Markets
Energy Production.
Transformation & Use
GHG Emissions
Demand•Crops•LivestockForests products
SupplyRegional Land Categories and Characteristics
Ag-Land Markets
Production•Crops•Livestock•Forests products•Biomass energy
Commercial Biomass
Land Use ChangeEmissions
Technology
Land Use•Crops•Livestock•Managed Forests•Unmanaged
•Crops•Livestock•Biocrops•Foresty Products
•Land rent•Crop prices•Livestock prices•Forest product prices•Biomass prices
Open source model.http://www.globalchange.umd.edu/models/gcam/download/
Research model.
The GCAM human Earth systems

GCAM is an RCP-class IAMOpen source model.Research model.
Use of GCAM by evil geniuses or terrorists organizations to take over the world is STRICTLY PROHIBITED.
The Energy System
Agriculture and Land Use
The EconomyRegional
Labor ForceRegional GDP
Regional Labor
Productivity
Energy Demand
Technologies
Energy Demand
Regional Resource
Bases
Regional Energy
Conversion Technologies
Energy Supply
Energy Markets
Energy Production.
Transformation & Use
GHG Emissions
Demand•Crops•LivestockForests products
SupplyRegional Land Categories and Characteristics
Ag-Land Markets
Production•Crops•Livestock•Forests products•Biomass energy
Commercial Biomass
Land Use ChangeEmissions
Technology
Land Use•Crops•Livestock•Managed Forests•Unmanaged
•Crops•Livestock•Biocrops•Foresty Products
•Land rent•Crop prices•Livestock prices•Forest product prices•Biomass prices
The GCAM human Earth systems

GCAM is an RCP-class IAMOpen source model.http://www.globalchange.umd.edu/models/gcam/download/Dynamic-recursive model.The GCAM human Earth systems model has Economic, Energy and Land-use systems.Technologically detail.Emissions of 16 greenhouse gases and short-lived species: CO2, CH4, N2O, halocarbons, carbonacious aerosols, reactive gases, sulfur dioxide.151 Agro-Ecological Zones (AEZ)Runs through 2095 in 5-year time-steps (time step is variable).
The Energy System
Agriculture and Land Use
The EconomyRegional
Labor ForceRegional GDP
Regional Labor
Productivity
Energy Demand
Technologies
Energy Demand
Regional Resource
Bases
Regional Energy
Conversion Technologies
Energy Supply
Energy Markets
Energy Production.
Transformation & Use
GHG Emissions
Demand•Crops•LivestockForests products
SupplyRegional Land Categories and Characteristics
Ag-Land Markets
Production•Crops•Livestock•Forests products•Biomass energy
Commercial Biomass
Land Use ChangeEmissions
Technology
Land Use•Crops•Livestock•Managed Forests•Unmanaged
•Crops•Livestock•Biocrops•Foresty Products
•Land rent•Crop prices•Livestock prices•Forest product prices•Biomass prices
The GCAM human Earth systems
GCAM is an RCP-class IAM
The Energy System
Agriculture and Land Use
The EconomyRegional
Labor ForceRegional GDP
Regional Labor
Productivity
Energy Demand
Technologies
Energy Demand
Regional Resource
Bases
Regional Energy
Conversion Technologies
Energy Supply
Energy Markets
Energy Production.
Transformation & Use
GHG Emissions
Demand•Crops•LivestockForests products
SupplyRegional Land Categories and Characteristics
Ag-Land Markets
Production•Crops•Livestock•Forests products•Biomass energy
Commercial Biomass
Land Use ChangeEmissions
Technology
Land Use•Crops•Livestock•Managed Forests•Unmanaged
•Crops•Livestock•Biocrops•Foresty Products
•Land rent•Crop prices•Livestock prices•Forest product prices•Biomass prices
Terrestrial Carbon Cycle
Atmospheric Composition,
Radiative Forcing, & Climate
Ocean Carbon Cycle
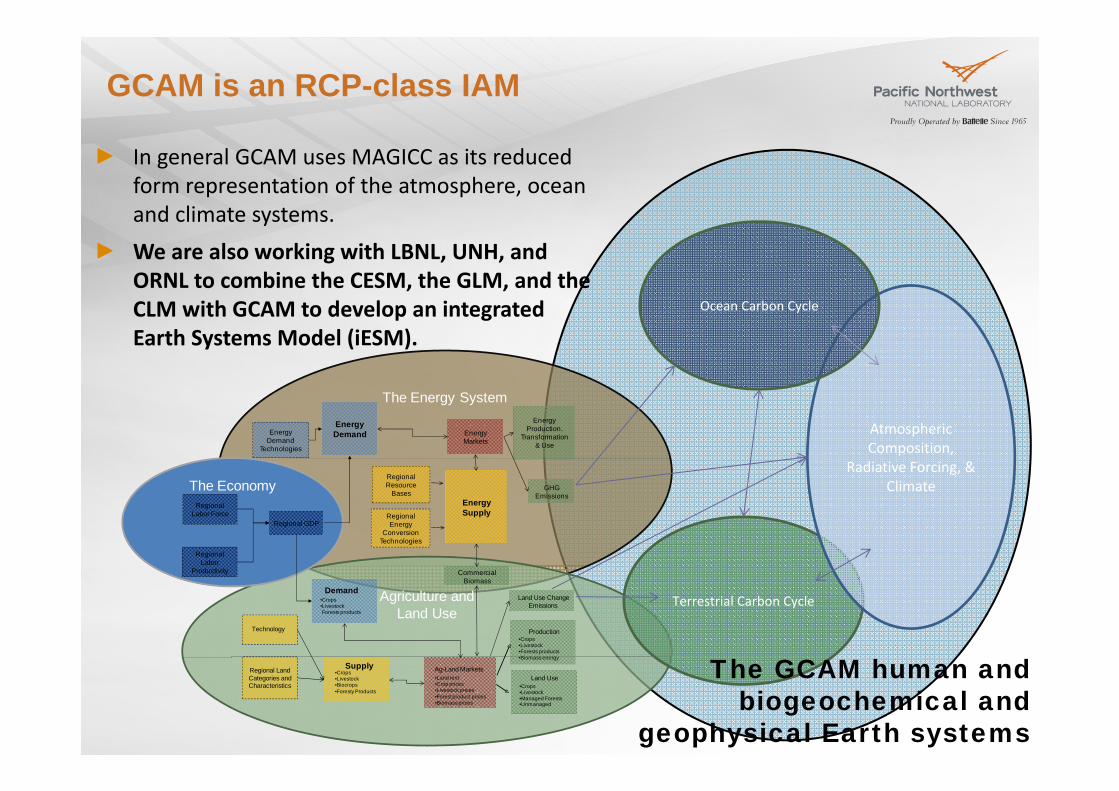
In general GCAM uses MAGICC as its reduced form representation of the atmosphere, ocean and climate systems.We are also working with LBNL, UNH, and ORNL to combine the CESM, the GLM, and the CLM with GCAM to develop an integrated Earth Systems Model (iESM).
The GCAM human and biogeochemical and
geophysical Earth systems

GCAM is an RCP-class IAM
The Energy System
Agriculture and Land Use
The EconomyRegional
Labor ForceRegional GDP
Regional Labor
Productivity
Energy Demand
Technologies
Energy Demand
Regional Resource
Bases
Regional Energy
Conversion Technologies
Energy Supply
Energy Markets
Energy Production.
Transformation & Use
GHG Emissions
Demand•Crops•LivestockForests products
SupplyRegional Land Categories and Characteristics
Ag-Land Markets
Production•Crops•Livestock•Forests products•Biomass energy
Commercial Biomass
Land Use ChangeEmissions
Technology
Land Use•Crops•Livestock•Managed Forests•Unmanaged
•Crops•Livestock•Biocrops•Foresty Products
•Land rent•Crop prices•Livestock prices•Forest product prices•Biomass prices
Terrestrial Carbon Cycle
Atmospheric Composition,
Radiative Forcing, & Climate
Ocean Carbon Cycle
GCAM is adding climate impacts on buildings, agriculture, and ecosystems.We are also integrating fresh water supply and use.
Hydrology & Fresh Water Systems
Water Demand
Water Supply
Water Markets
Agricultural Sector Demands
Energy Sector Demands
Industrial Sector Demands
Household Sector Demands
Commercial Sector Demands
Climate
Surface Water
Ground Water Recharge
Desalinization Energy Demand
Water Allocation and Use
Ecosystem, Navigation, Inter-
basin Transfers (prescribed)
The GCAM human and biogeochemical and
geophysical Earth systems

AGRICULTURE AND LAND USE

Agriculture and land-use play an important role in meeting climate goals
Land-use policy can either be part of the problem or part of the solution (Wise, et al., 2009).
Bioenergy can become one of the world’s largest crops (Wise, et al., 2009).
Sequestration potential is large, even compared with CCS. (Edmonds, et al., in review).
Land-use leakage can be large relative to industrial leakage. (Calvin, et. al., 2009).

12
The Land Use Implications of Stabilizing at 450 ppm When Terrestrial Carbon is Valued
0%
20%
40%
60%
80%
100%
1990 2005 2020 2035 2050 2065 2080 2095
UrbanLandRockIceDesertOtherArableLandTundraShrubLandUnmanagedForestForestGrassLandUnmanagedPasturePasturePurGrownBioRiceSugarCropOtherGrainOilCropMiscCropFodderCropFiberCropCornWheat
Other Unmanaged Land
Unmanaged Forests
Managed Forests
Pasture
Crops
Unmanaged Pasture
Desert
Bioenergy Crops
0%
20%
40%
60%
80%
100%
1990 2005 2020 2035 2050 2065 2080 2095
Other Unmanaged Land
Unmanaged Forests
Managed Forests
PastureCrops
Unmanaged Pasture
Desert
Bioenergy Crops
0%
20%
40%
60%
80%
100%
1990 2005 2020 2035 2050 2065 2080 2095
Other Unmanaged Land
Unmanaged Forests
Managed Forests
Pasture Crops
Unmanaged Pasture
Desert
Bioenergy Crops
Reference Scenario45
0 pp
m S
tabi
lizat
ion
Sce
nari
o W
hen
ALL
Car
bon
is V
alue
d
450
ppm
Sta
biliz
atio
n S
cena
rio
Whe
n Te
rres
tria
l C
arbo
n is
NO
T V
alue
d

Carbon Storage and Sequestration
Idealized world: 1,156-1,376 PgCO2 stored in geologic systems.Idealized world: 584 to 716 PgCO2 stored in terrestrial systems.
Delayed world: 602-1,448 PgCO2 stored in geologic systems.Delayed world: 202 to 375 PgCO2 stored in terrestrial systems.

-50
-40
-30
-20
-10
0
10
20
30
40
50
2010 2030 2050 2070 2090
Land
-use
Cha
nge
CO2
Equi
vale
nt
Emiss
ions
(PgC
O2/
yr)
T1 (Ref) x Idealized
T2 (No Bio) x Idealized
T3 (No CCS) x Idealized
T4 (No Bio & No CCS) x Idealized
T5 (LowTech) x Idealized
Reference (NoPolicy)
Land use: Afforestation and Leakage
Idealized world: CO2 price instantly changes deforestation into afforestation.
Delayed world: Each accession drives outsourcing of crop production and deforestation in non-participating regions.
-50
-40
-30
-20
-10
0
10
20
30
40
50
2010 2030 2050 2070 2090
Land
-use
Cha
nge
CO2
Equi
vale
nt
Emiss
ions
(PgC
O2/
yr)
T1 (Ref) x Idealized
T2 (No Bio) x Idealized
T3 (No CCS) x Idealized
T4 (No Bio & No CCS) x Idealized
T5 (LowTech) x Idealized
T1 (Ref) x Delayed
T2 (No Bio) x Delayed
T3 (No CCS) x Delayed
T4 (No Bio & No CCS) x Delayed
T5 (LowTech) x Delayed
Reference (NoPolicy)

GCAM 3.0 AG-LAND-USE

Agriculture and Land-use in GCAM 3.0
The GCAM land-use model is documented on line at:https://wiki.umd.edu/gcam/images/8/87/GCAM3AGTechDescript12_5_11.pdf
The agriculture and land-use sector is part of the larger GCAM modeling system.
It is fully coupledWe do not run GCAM energy and land-use systems independently.
A complete description of the present version of GCAM takes a full day of presentations.
Annual community modeling meeting.GCAM 3.0 can be downloaded from the JGCRI websitehttp://www.globalchange.umd.edu/models/gcam/download/

The Global Change Assessment Model

The Agricultural System: Demand
GCAM currently models supply and demand for 12 crops, 6 animal categories, and bioenergy:
Crops: corn, rice, wheat, sugar, oil crops (e.g., soybeans), other grains (e.g., barley), fiber (e.g., cotton), fodder (e.g., hay, alfalfa), roots & tubers, fruits & vegetablesAnimals: beef, dairy, pork, poultry, sheep/goat, otherForest: roundwoodBioenergy: switchgrass, miscanthus, jatropha, willow, eucalyptus, corn ethanol, sugar ethanol, biodiesel (from soybeans and other oil crops)
We account for both food and non-food demand, including animal feed.
Demand is modeled at the 14 region level.

The Global Change Assessment Model

The Agricultural System: Basic Assumptions
The world is divided into 151 regions

The Agricultural System: Regions
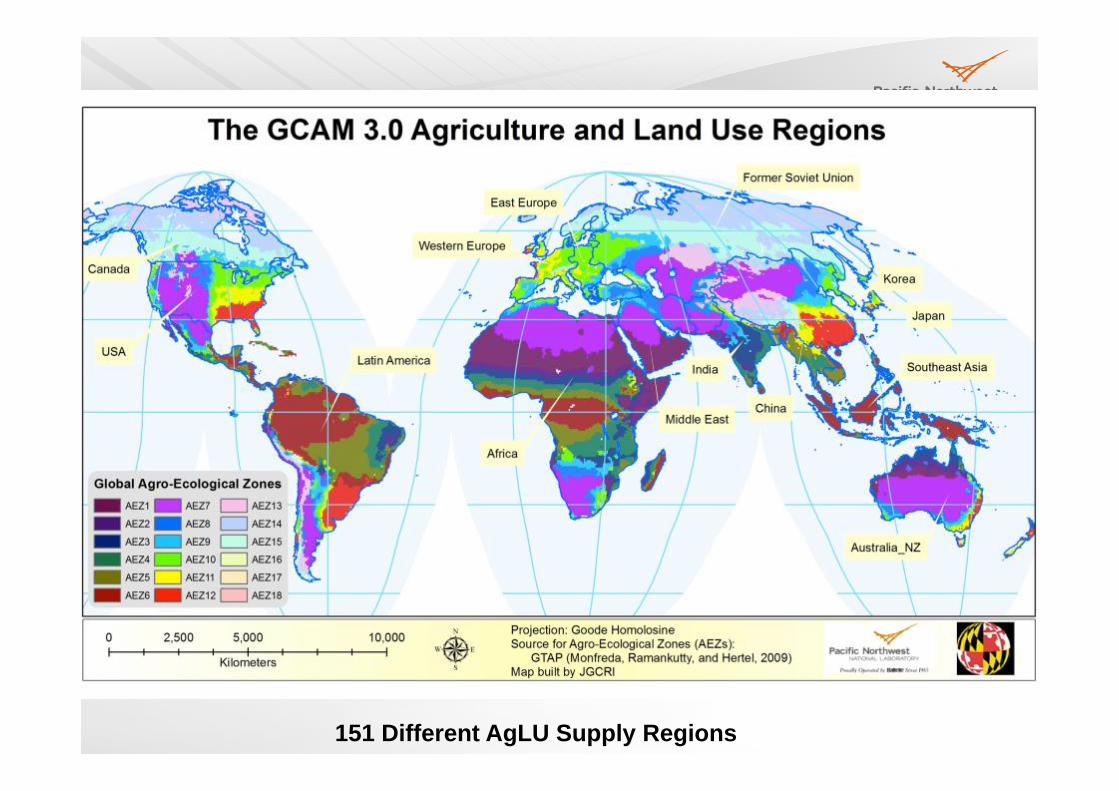
151 Different AgLU Supply Regions

The Agricultural System: Basic Assumptions
The world is divided into 151 regionsFarmers allocate land across a variety of uses in order to maximize profitThere is a distribution of profits for each land type across each of the 151 regionsThe actual share of land allocated to a particular use is the probability in which that land type has the highest profitThe variation in profit rates is due to variation in the cost of production
As the area devoted to a particular land use expands, cost increasesYield is fixed within each region for each crop management practice

The Agricultural System: Nesting Structure
Corn, wheat, etc.
Corn, wheat, etc.
Corn, wheat, etc.
Corn, wheat, bioenergy, etc.
Land
Non-Pasture
Grass and Shrubs
Pasture
Other Pasture
Intensively-Grazed PastureCrops All
Forests
ForestCommercial Forest
Tundra Rock, Ice,Desert UrbanArable Land
Shrubland
Grassland
Other arable land
Gray = ExogenousGreen = Non-commercialRed = Commercial

The Agricultural System: USA Wheat Yield
While yield is fixed within each subregion, there is a distribution
of yields across each of the 14 GCAM regions.

The Agricultural System: Calibration
During the AgLU calibration process, the model computes the average profit rate required to reproduce the base year land allocations. We assume that the difference between this profit and the observed profit (yield * (p – c)) is a cost to production that also applies in the future. Thus, if you have a region with a high crop yield, but low land allocation in the base year (e.g., Wheat in Alaska), the model assumes that there are some additional costs that must be considered when expanding its land area. As a result, that crop will continue to have a low share in the future in the absence of a technology or policy change..
0.000074%
0.000076%
0.000078%
0.000080%
0.000082%
0.000084%
0.000086%
0.000088%
0.000090%
2005 2020 2035 2050 2065 2080 2095
% o
f glo
bal W
heat
pro
duct
ion
Wheat production in USA AEZ16

The Global Change Assessment Model

The Agricultural System: Supply
Yield is exogenously calculated.Base year derived from GTAP/FAO production and land area.Yields increase over time based on exogenously specified technical change.
Land area is endogenously calculated.Each land types share of area in its region is the probability its profit is the highest in that region.
Supply = land * yield

The Agricultural System: Results
0
200
400
600
800
1,000
1,200
1,400
2005 2020 2035 2050 2065 2080 2095
Mt
Ethanol Non-Food Food Feed
Corn Consumption by Sector
0
20
40
60
80
100
120
140
160
180
2005 2020 2035 2050 2065 2080 2095
Mt
Western Europe USA Southeast Asia Middle East Latin America Korea Japan India Former Soviet Union Eastern Europe China Canada Australia_NZ Africa
Beef Consumption by Region

0
50
100
150
200
250
300
350
400
450
500
2005 2020 2035 2050 2065 2080 2095
Mt
AEZ14 AEZ13 AEZ12 AEZ11
AEZ10 AEZ09 AEZ08 AEZ07
The Agricultural System: Results
0
200
400
600
800
1,000
1,200
1,400
1,600
1,800
2005 2020 2035 2050 2065 2080 2095
Mt
Western Europe USA Southeast Asia Middle East Latin America Korea Japan India Former Soviet Union Eastern Europe China Canada Australia_NZ Africa
Corn Production by Region Corn Production in the USA

The Agricultural System: Results
Global Land Allocation
0%
10%
20%
30%
40%
50%
60%
70%
80%
90%
100%
2005 2020 2035 2050 2065 2080 2095
urban
desert
tundra
forest
grass/shrub
pasture
biomass
other arable
crops

The Global Change Assessment Model

The Agricultural System: Linking the Energy & Agricultural Sectors
While we can explain the energy and agricultural systems separately, these two systems cannot be separated in practice. Choices made in one sector affect outcomes in another sector.
This is true both in the real world and in GCAM. You cannot run the different components of the model separately.

The Global Change Assessment Model

35
Bioenergy is produced in the Ag-Land-Use Sector but Consumed in the Energy Sector
Crop Residue Derived Bioenergy
Municipal Solid Waste
Purpose Grown Bioenergy
0
20
40
60
80
100
120
1990 2005 2020 2035 2050 2065 2080 2095
EJ/y
r
Bioenergy Production

Emissions: General Structure
GCAM tracks emissions for several gases and speciesCO2, CH4, N2O, CF4, C2F6, SF6, HFC125, HFC134, HFC245fa, SO2, BC, OC, CO, VOCs, NOx, NH3
We calculate CO2 from fossil fuel & industrial uses, as well as from land-use change
Each gas is associated with a specific activity and changes throughout the coming century if:
The activity level changesIncreasing the activity increases emissions
Pollution controls increaseAs incomes rise, we assume that regions will reduce pollutant emissions
A carbon price is appliedWe use MAC curves to reduce the emissions of GHGs as the carbon price rises
Emissions are produced at a region level.

Emissions: Vegetation CO2 Emissions
First, we determine the total change in carbon stock for each land type and region.
∆ C Stock = [Land Area (t)]*[C density (t)] - [Land Area (t-1)]*[C density (t-1)]
Then, we allocate that change across time.If change in land area decreases the carbon stock (e.g., deforestation), then all carbon is released into the atmosphere instantaneously.
If the change in land area increases the carbon stock (e.g., afforestation), then carbon accumulates slowly over time, depending on an exogenously specified mature age.
The mature age varies by land type and region.

Emissions: Forest Carbon Uptake
0%
10%
20%
30%
40%
50%
60%
70%
80%
90%
100%
0 20 40 60 80 100
35 years
50 years
75 years
100 years
Years since land conversion
% o
f eve
ntua
l car
bon
stoc
k

Emissions: Soil CO2 Emissions
First, we determine the total change in carbon stock for each land type and region.
∆ C Stock = [Land Area (t)]*[C density (t)] - [Land Area (t-1)]*[C density (t-1)]
Then, we allocate that change across time.Whether carbon stock increases or decreases, we assume that the change is allocated evenly over a read in number of years. The number of years varies by region, but not by land type. In general, colder regions have longer soil carbon time scales.

QUESTIONS-DISCUSSIONThe Energy System
Agriculture and Land Use
The EconomyRegional
Labor ForceRegional GDP
Regional Labor
Productivity
Energy Demand
Technologies
Energy Demand
Regional Resource
Bases
Regional Energy
Conversion Technologies
Energy Supply
Energy Markets
Energy Production.
Transformation & Use
GHG Emissions
Demand•Crops•LivestockForests products
SupplyRegional Land Categories and Characteristics
Ag-Land Markets
Production•Crops•Livestock•Forests products•Biomass energy
Commercial Biomass
Land Use ChangeEmissions
Technology
Land Use•Crops•Livestock•Managed Forests•Unmanaged
•Crops•Livestock•Biocrops•Foresty Products
•Land rent•Crop prices•Livestock prices•Forest product prices•Biomass prices