Embed Size (px)
Citation preview
agrir
egio
nie
urop
a
A metafrontier approach to measuring technical
efficiencyThe case of UK dairy farms
Andrew Barnes*, Cesar Reverado-Giha*, Johannes Sauer+
• Land Economy and Environment Group, SAC, Edinburgh• +Department of Economics, University of Manchester
122nd European Association of Agricultural Economists Seminar
Evidence-Based Agricultural and Rural Policy MakingMethodological and Empirical Challenges of Policy Evaluation
February 17th – 18th, 2011, Ancona (Italy)
associazioneAlessandroBartola studi e ricerche di economia e di politica agraria
Centro Studi Sulle Politiche Economiche, Rurali e AmbientaliUniversità Politecnica delle Marche

agrir
egio
nie
urop
a
122nd EAAE Seminar, February 17th – 18th , 2011, Ancona (Italy)
Why is important
Accurate measurement indicates efficient resource use and hence enters debates regarding food production, climate change, wider sustainability issues
2
agrir
egio
nie
urop
a
122nd EAAE Seminar, February 17th – 18th , 2011, Ancona (Italy)
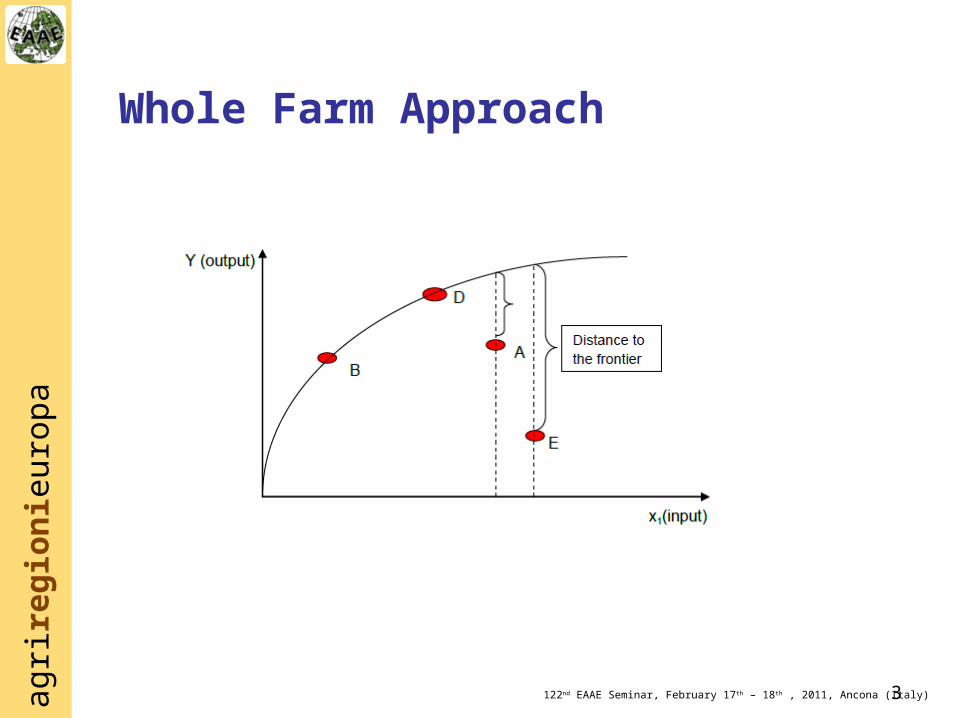
Whole Farm Approach
3
agrir
egio
nie
urop
a
122nd EAAE Seminar, February 17th – 18th , 2011, Ancona (Italy)
Measuring Technical Efficiency
Frontier is drawn using parametric, semi-parametric or non-parametric approaches
Stochastic production frontier technique assumes that the noise can be disaggregated from the technical efficiency effect. Hence the SPF technique is the most commonly used in agricultural studies to compensate for some of the noise in agricultural production
So, though reduces statistical noise it infers that like should be compared with like. However, all farms are different – structures, behaviours, access to resources, quality of resources
One key factor is region....
agrir
egio
nie
urop
a
122nd EAAE Seminar, February 17th – 18th , 2011, Ancona (Italy)
The Role of Regions in technical efficiency measurementPrevious work
– Use region as means to explain some of the deviation from the frontier
– We argue in agriculture, region should be a defining characteristic of the area to be studied
– Comparison between regions is difficult because of a different production technology

agrir
egio
nie
urop
a
122nd EAAE Seminar, February 17th – 18th , 2011, Ancona (Italy)
How do we compare?
6
agrir
egio
nie
urop
a
122nd EAAE Seminar, February 17th – 18th , 2011, Ancona (Italy)
Meta frontier
An overarching function that encompasses the different technologies involved across regions
The model enables the calculation of comparable efficiencies for production under different technologies relative to the potential technology available in the economy as a whole
agrir
egio
nie
urop
a
122nd EAAE Seminar, February 17th – 18th , 2011, Ancona (Italy)
Data Requirements and Issues
We take Dairy farms for the UK as an example of the metafrontier approach
Collected by separate administrative regions– England and Wales– Scotland– Northern Ireland
Some differences in attribution of inputs in these data sets, e.g. V&M in E FBS, compiled into other livestock expenses in S FBS.
agrir
egio
nie
urop
a
122nd EAAE Seminar, February 17th – 18th , 2011, Ancona (Italy)
C u m b r i a
N o r t h u m b e r l a n d
D u r h a m
N o r t h Y o r k s h i r e
L a n c a s h i r e W e s t
Y o r k s h i r e S o u t h
Y o r k s h i r e M e r s e y s i d e
C h e s h i r e
E a s t R i d i n g o f Y o r k s h i r e
D e r b y s h i r e L i n c o l n s h i r e N o t t s
T y n e & W e a r
N o r f o l k
S u f f o l k
E s s e x
S t a f f s
S h r o p s h i r e
L e i c s
N o r t h a n t s
B e d s B u c k s
G w y n e d d
P o w y s
G l o u c s
C a m b s
C o r n w a l l
D e v o n
S o m e r s e t
D o r s e t
W i l t s h i r e
H a m p s h i r e W e s t
S u s s e x E a s t S u s s e x
K e n t S u r r e y
C o n w y
O x f o r d s h i r e H e r t s
1 2 3
4 5
6
8 9
1 0
1 1 1 2
1 3 1 6
1 7 1 5
1 4
3 1 3 2
1 8
1 9 2 0 2 1
2 2 2 3 2 4
7
2 5
2 6 2 7 2 8
2 9 3 0
3 3 3 4 3 5
3 6
3 7 3 8
3 9
4 0 4 1
4 2 4 3
4 4
4 5
4 7
4 8 4 6
4 9
5 0 5 1 5 3 5 4
5 5
5 7 5 8 5 9
6 0 6 1
6 2 6 3
6 4
6 5 6 6
6 7
5 6
5 2
1 D a r l i n g t o n 2 S t o c k t o n - o n - T e e s 3 H a r t l e p o o l 4 M i d d l e s b r o u g h 5 R e d c a r & C l e v e l a n d 6 Y o r k 7 C i t y o f K i n g s t o n u p o n H u l l 8 N o r t h L i n c o l n s h i r e 9 N o r t h E a s t L i n c o l n s h i r e 1 0 B l a c k b u r n 1 1 G r e a t e r M a n c h e s t e r 1 2 W a r r i n g t o n 1 3 H a l t o n 1 4 I s l e o f A n g l e s e y 1 5 D e n b i g h 1 6 F l i n t s h i r e 1 7 W r e x h a m 1 8 T h e W r e k i n 1 9 C i t y o f S t o k e - o n - T r e n t 2 0 C i t y o f D e r b y 2 1 C i t y o f N o t t i n g h a m 2 2 W e s t M i d l a n d s 2 3 C i t y o f L e i c e s t e r 2 4 R u t l a n d 2 5 C i t y o f P e t e r b o r o u g h 2 6 H e r e f o r d s h i r e 2 7 W o r c e s t e r 2 8 W a r w i c k s h i r e 2 9 M i l t o n K e y n e s 3 0 L u t o n 3 1 P e m b r o k e s h i r e 3 2 C a r m a r t h e n s h i r e 3 3 S w a n s e a 3 4 N e a t h P o r t T a l b o t 3 5 B r i d g e n d 3 6 R h o n d d a , C y n o n , T a f f 3 7 M e r t h y r T y d f i l 3 8 B l a e n a u G w e n t 3 9 C a e r p h i l l y 4 0 T o r f a e n 4 1 M o n m o u t h s h i r e 4 2 T h e V a l e o f G l a m o r g a n 4 3 C a r d i f f 4 4 N e w p o r t 4 5 N o r t h S o m e r s e t 4 6 C i t y o f B r i s t o l 4 7 S o u t h G l o u c e s t e r s h i r e 4 8 B a t h & N E S o m e r s e t 4 9 S w i n d o n 5 0 W e s t B e r k s h i r e 5 1 R e a d i n g 5 2 W o k i n g h a m 5 3 W i n d s o r & M a i d e n h e a d 5 4 S l o u g h 5 5 B r a c k n e l l F o r e s t 5 6 G r e a t e r L o n d o n 5 7 T h u r r o c k 5 8 S o u t h e n d - o n - S e a 5 9 M e d w a y T o w n s 6 0 C i t y o f P l y m o u t h 6 1 T o r b a y 6 2 P o o l e 6 3 B o u r n e m o u t h 6 4 C i t y o f S o u t h a m p t o n 6 5 C i t y o f P o r t s m o u t h 6 6 I s l e o f W i g h t 6 7 B r i g h t o n & H o v e
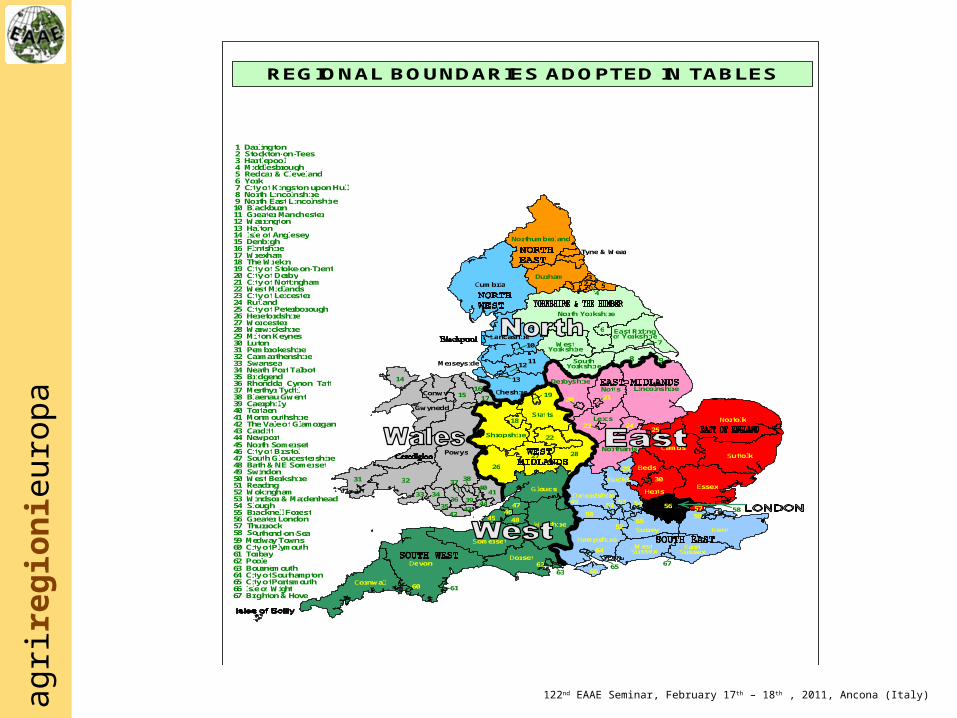
REGIONAL BOUNDARIES ADOPTED IN TABLES
agrir
egio
nie
urop
a
122nd EAAE Seminar, February 17th – 18th , 2011, Ancona (Italy)
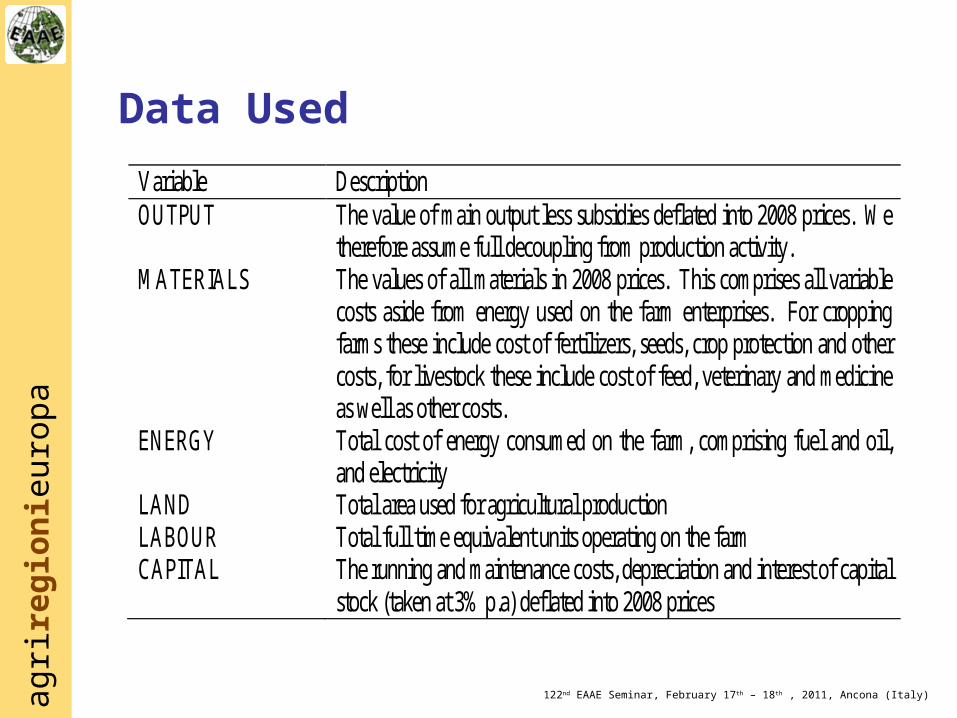
Data Used
Variable Description OUTPUT The value of main output less subsidies deflated into 2008 prices. We
therefore assume full decoupling from production activity. MATERIALS The values of all materials in 2008 prices. This comprises all variable
costs aside from energy used on the farm enterprises. For cropping farms these include cost of fertilizers, seeds, crop protection and other costs, for livestock these include cost of feed, veterinary and medicine as well as other costs.
ENERGY Total cost of energy consumed on the farm, comprising fuel and oil, and electricity
LAND Total area used for agricultural production LABOUR Total full time equivalent units operating on the farm CAPITAL The running and maintenance costs, depreciation and interest of capital
stock (taken at 3% p.a) deflated into 2008 prices

agrir
egio
nie
urop
a
122nd EAAE Seminar, February 17th – 18th , 2011, Ancona (Italy)
Process...of MF
k'x'xt.s
'xmin8
1) Run separate frontiers for each region (k)
2) Solve an optimisation problem that minimises the absolute deviations between the metafrontier and the group frontiers for all the observations constrained by the fact that the output at the metafrontier is always greater or equal than the output from the k regions
ki
ki
kki
ki UV'xUVk ee;xfy6
The metatechnology ratio (MTR) can then be estimated by using the coefficient from (8) in (9):
'x
'xki
i
ki
e
eMTRy,xMTR9
agrir
egio
nie
urop
a
122nd EAAE Seminar, February 17th – 18th , 2011, Ancona (Italy)
Process..
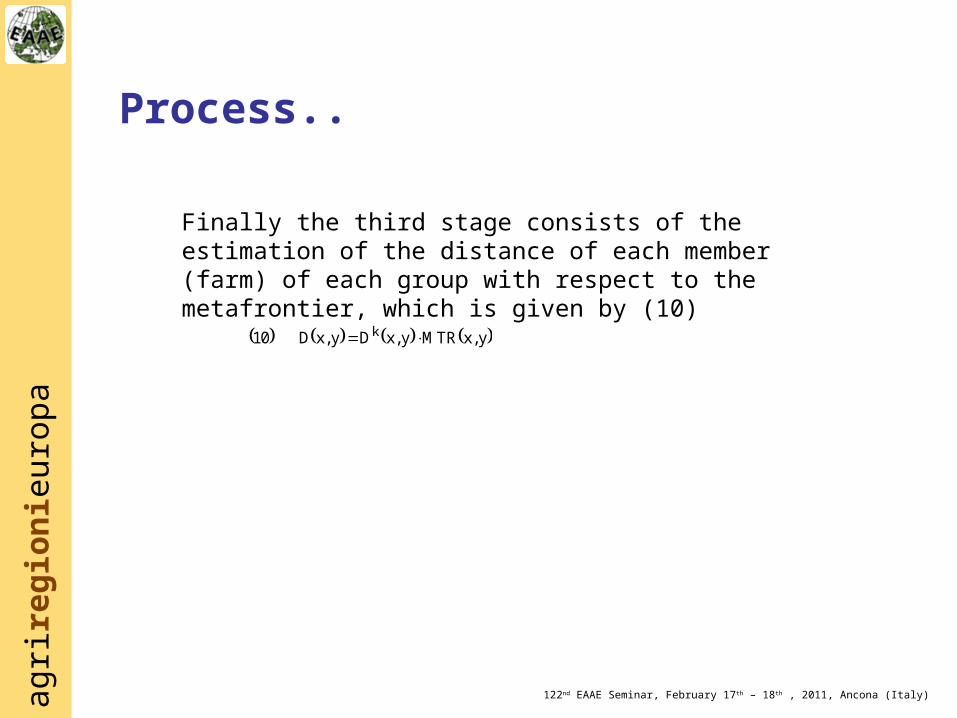
y,xMTRy,xDy,xD10 k
Finally the third stage consists of the estimation of the distance of each member (farm) of each group with respect to the metafrontier, which is given by (10)
agrir
egio
nie
urop
a
122nd EAAE Seminar, February 17th – 18th , 2011, Ancona (Italy)
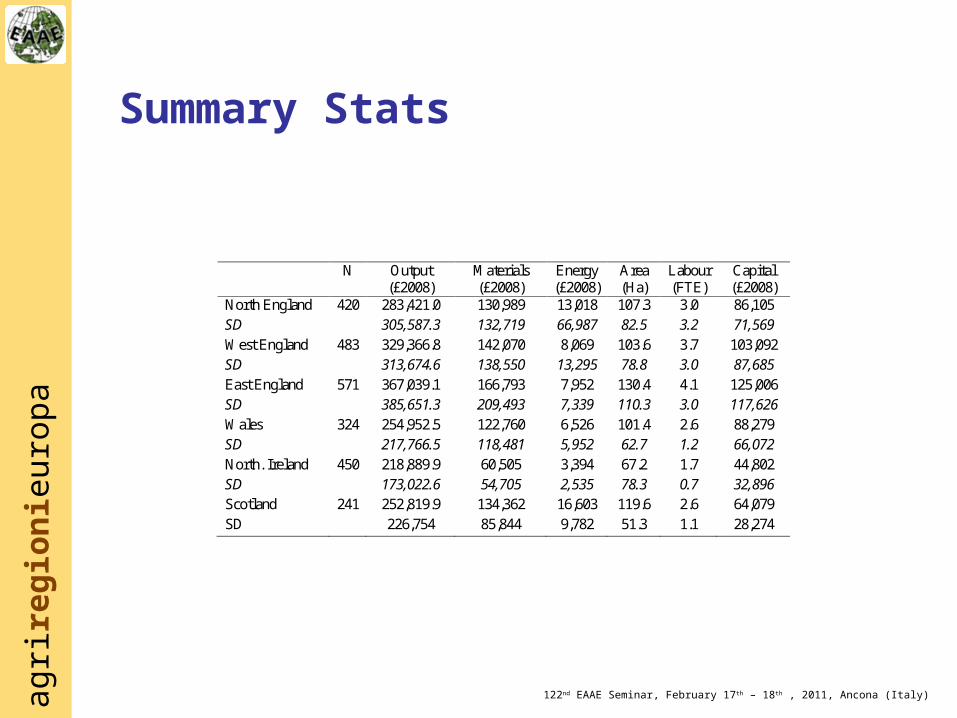
Summary Stats
N Output (£2008)
Materials (£2008)
Energy (£2008)
Area (Ha)
Labour (FTE)
Capital (£2008)
North England 420 283,421.0 130,989 13,018 107.3 3.0 86,105 SD 305,587.3 132,719 66,987 82.5 3.2 71,569 West England 483 329,366.8 142,070 8,069 103.6 3.7 103,092 SD 313,674.6 138,550 13,295 78.8 3.0 87,685 East England 571 367,039.1 166,793 7,952 130.4 4.1 125,006 SD 385,651.3 209,493 7,339 110.3 3.0 117,626 Wales 324 254,952.5 122,760 6,526 101.4 2.6 88,279 SD 217,766.5 118,481 5,952 62.7 1.2 66,072 North. Ireland 450 218,889.9 60,505 3,394 67.2 1.7 44,802 SD 173,022.6 54,705 2,535 78.3 0.7 32,896 Scotland 241 252,819.9 134,362 16,603 119.6 2.6 64,079 SD 226,754 85,844 9,782 51.3 1.1 28,274

agrir
egio
nie
urop
a
122nd EAAE Seminar, February 17th – 18th , 2011, Ancona (Italy)
Individual TE scores
0.78
0.80
0.82
0.84
0.86
0.88
0.90
0.92
0.94
2005 2006 2007 2008
North
Wales
West
East
NI
Scot
agrir
egio
nie
urop
a
122nd EAAE Seminar, February 17th – 18th , 2011, Ancona (Italy)
Testing for different production technologiesLR test on sum of individual regions
compared to pooled data set (UK):– Strongly rejects the null hypothesis and
indicates that regional frontiers are not the same
– Less strong but also rejects using English analysis
– Found by all other studies...– Means that bias in country level studies
exists...?
agrir
egio
nie
urop
a
122nd EAAE Seminar, February 17th – 18th , 2011, Ancona (Italy)
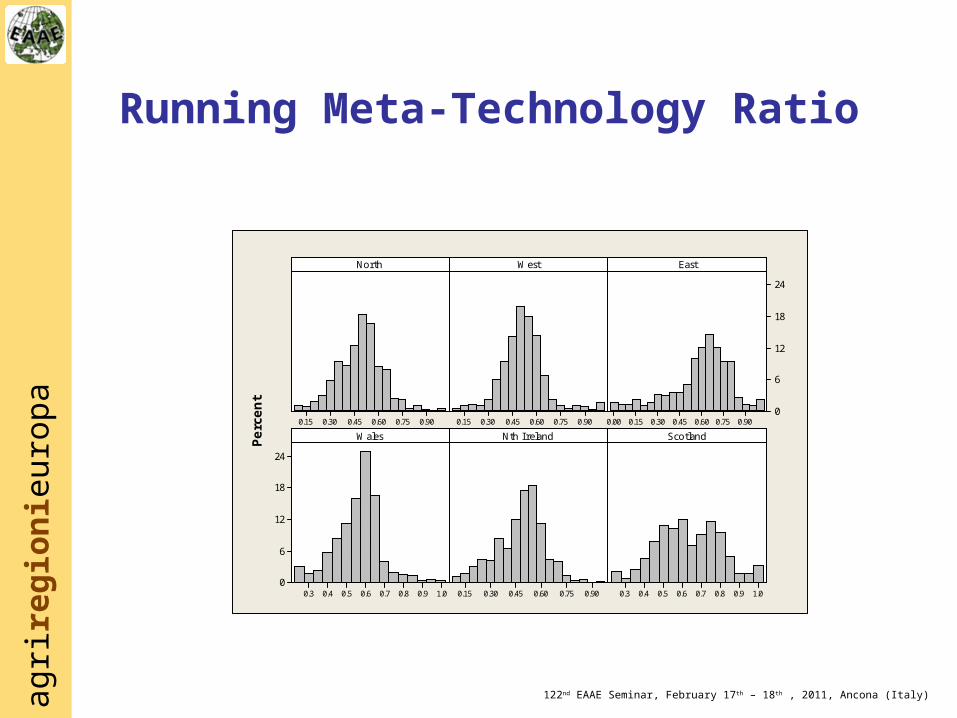
Running Meta-Technology Ratio
0.900.750.600.450.300.15 0.900.750.600.450.300.15 0.900.750.600.450.300.150.00
24
18
12
6
0
1.00.90.80.70.60.50.40.3
24
18
12
6
00.900.750.600.450.300.15 1.00.90.80.70.60.50.40.3
NorthPerc
ent
West East
Wales Nth Ireland Scotland
agrir
egio
nie
urop
a
122nd EAAE Seminar, February 17th – 18th , 2011, Ancona (Italy)
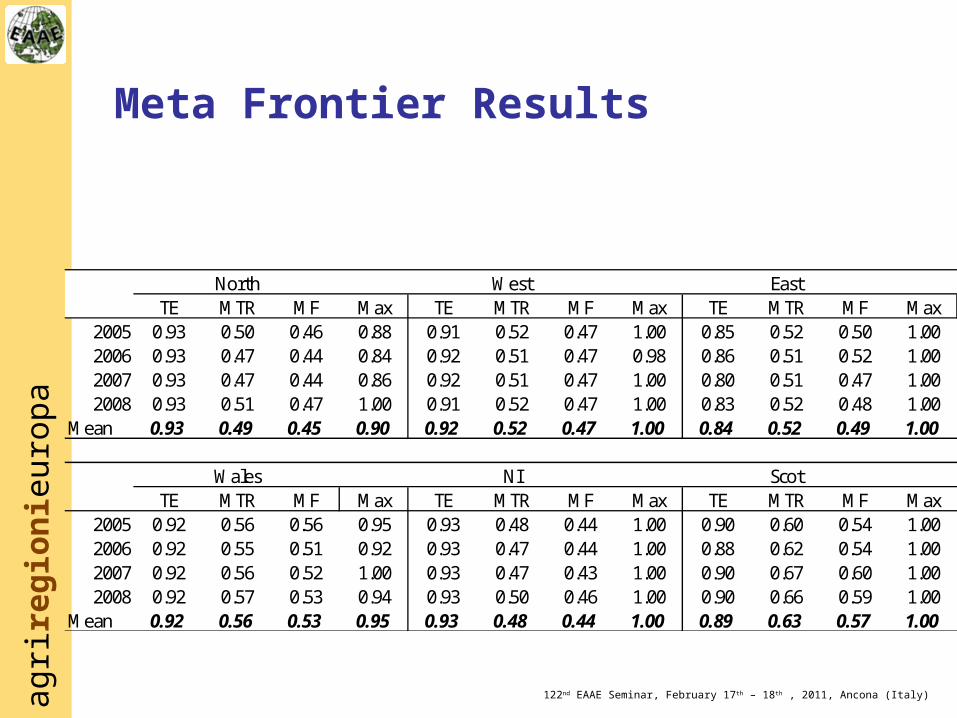
Meta Frontier Results
TE MTR MF Max TE MTR MF Max TE MTR MF Max2005 0.93 0.50 0.46 0.88 0.91 0.52 0.47 1.00 0.85 0.52 0.50 1.002006 0.93 0.47 0.44 0.84 0.92 0.51 0.47 0.98 0.86 0.51 0.52 1.002007 0.93 0.47 0.44 0.86 0.92 0.51 0.47 1.00 0.80 0.51 0.47 1.002008 0.93 0.51 0.47 1.00 0.91 0.52 0.47 1.00 0.83 0.52 0.48 1.00
Mean 0.93 0.49 0.45 0.90 0.92 0.52 0.47 1.00 0.84 0.52 0.49 1.00
TE MTR MF Max TE MTR MF Max TE MTR MF Max2005 0.92 0.56 0.56 0.95 0.93 0.48 0.44 1.00 0.90 0.60 0.54 1.002006 0.92 0.55 0.51 0.92 0.93 0.47 0.44 1.00 0.88 0.62 0.54 1.002007 0.92 0.56 0.52 1.00 0.93 0.47 0.43 1.00 0.90 0.67 0.60 1.002008 0.92 0.57 0.53 0.94 0.93 0.50 0.46 1.00 0.90 0.66 0.59 1.00
Mean 0.92 0.56 0.53 0.95 0.93 0.48 0.44 1.00 0.89 0.63 0.57 1.00
Wales NI Scot
North West East
agrir
egio
nie
urop
a
122nd EAAE Seminar, February 17th – 18th , 2011, Ancona (Italy)
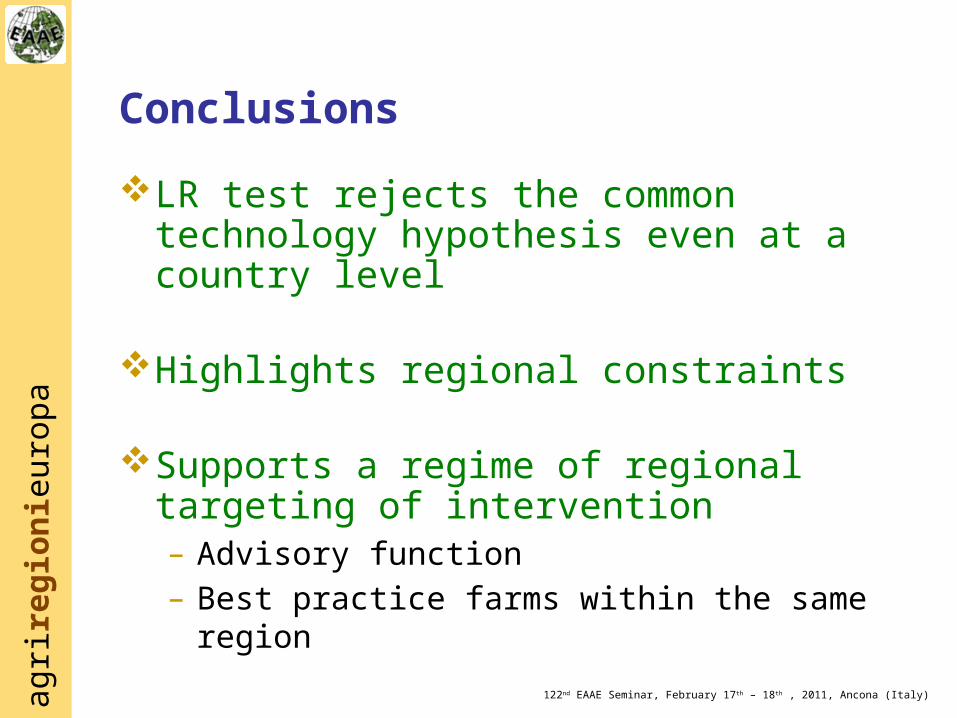
Conclusions
LR test rejects the common technology hypothesis even at a country level
Highlights regional constraints
Supports a regime of regional targeting of intervention– Advisory function– Best practice farms within the same region
agrir
egio
nie
urop
a
122nd EAAE Seminar, February 17th – 18th , 2011, Ancona (Italy)
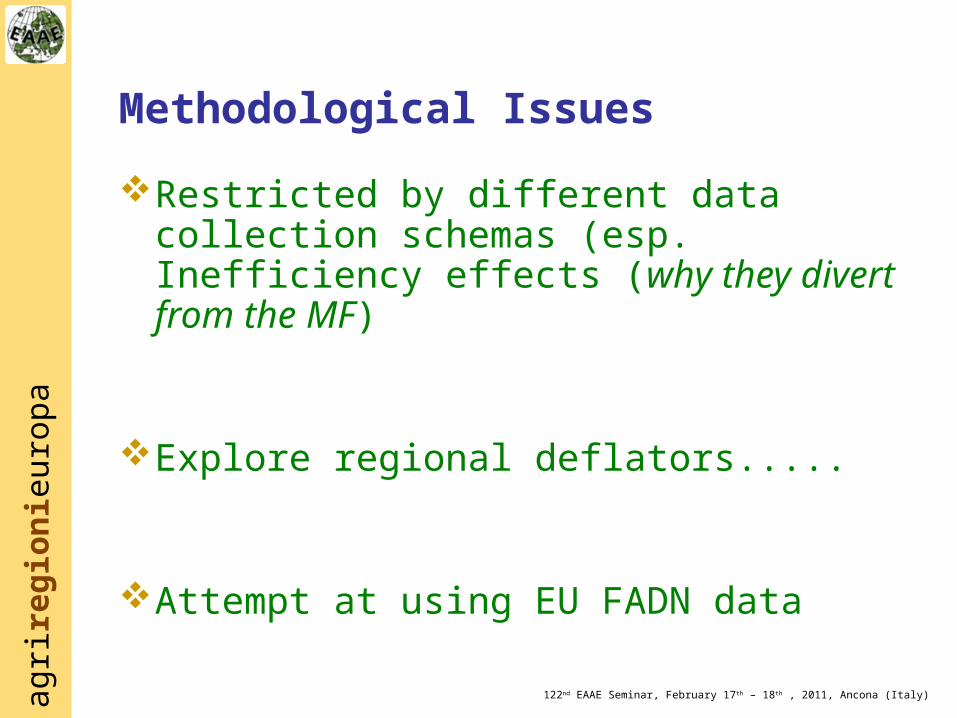
Methodological Issues
Restricted by different data collection schemas (esp. Inefficiency effects (why they divert from the MF)
Explore regional deflators.....
Attempt at using EU FADN data
agrir
egio
nie
urop
a
122nd EAAE Seminar, February 17th – 18th , 2011, Ancona (Italy)
End

agrir
egio
nie
urop
a
122nd EAAE Seminar, February 17th – 18th , 2011, Ancona (Italy)
Meta frontiers
0.400
0.450
0.500
0.550
0.600
0.650
2005 2006 2007 2008
North
West
East
Wales
NI
Scot