Embed Size (px)
Citation preview
Agro Enterprise Centre Federation of Nepalese Chamber of Commerce and Industry
Export Potentiality of Fresh Fruits and Vegetables in bordering cities of Uttar Pradesh
PO Box 7651 FNCCI Building
Kathmandu, Nepal Ph.: 4262245,4262260,4267005
Fax: +977-1-4261671 e-mail: [email protected]
ULR: www.aec-fncci.org
November 2009
1
Table of Contents
1. Introduction....................................................................................................................... 2
2. Horticulture in Uttar Pradesh.......................................................................................... 3
3. Marketing of Horticultural Produce ............................................................................... 5
4. Price Situation of some selected horticultural produce ................................................. 6
4.1. Cabbage....................................................................................................................... 6
4.2. Cauliflower ................................................................................................................. 8
4.3. Tomato ...................................................................................................................... 10
5. Possible Indian markets for Butwal-Bhairahawa Region ........................................... 13
6. Recommendations ........................................................................................................... 15
Annex 1: List of Traders Interviewed ....................................................................................... 16
Annex 2: Checklist prepared for information collection......................................................... 17
Annex: 3 Photographs ................................................................................................................ 19
Annex 4: Some of the Schemes Under National Horticulture Mission .................................. 21
2
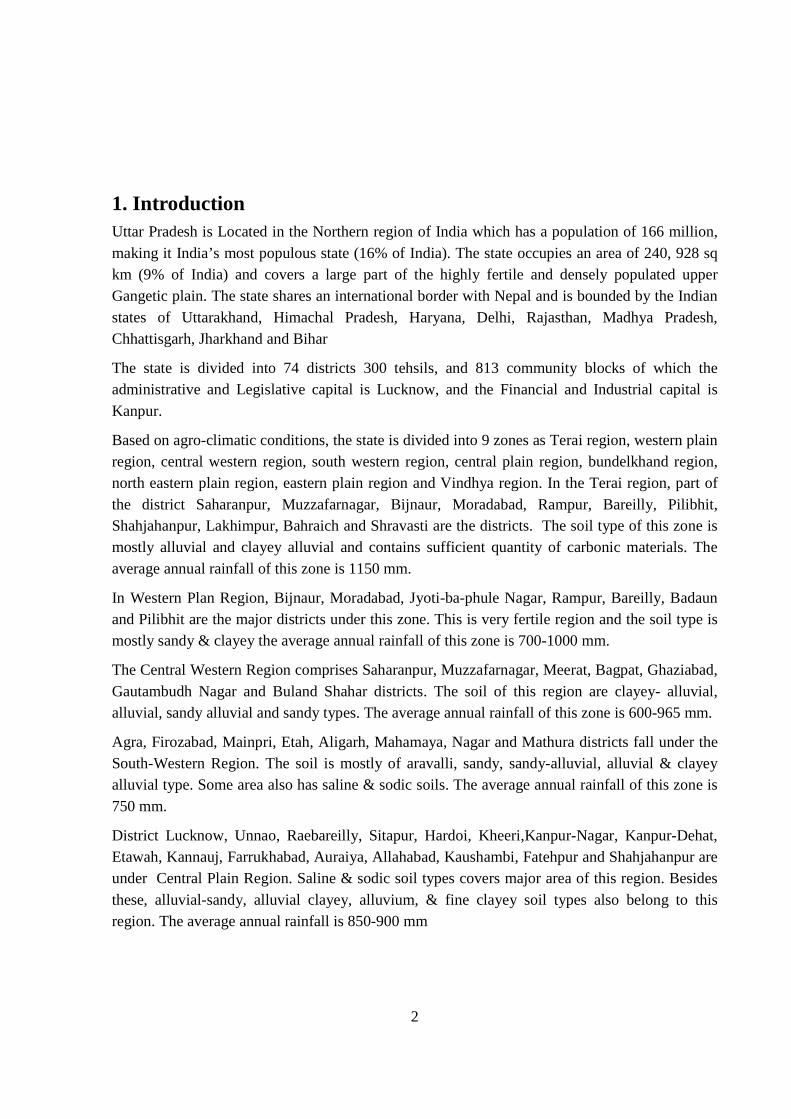
1. Introduction Uttar Pradesh is Located in the Northern region of India which has a population of 166 million, making it India’s most populous state (16% of India). The state occupies an area of 240, 928 sq km (9% of India) and covers a large part of the highly fertile and densely populated upper Gangetic plain. The state shares an international border with Nepal and is bounded by the Indian states of Uttarakhand, Himachal Pradesh, Haryana, Delhi, Rajasthan, Madhya Pradesh, Chhattisgarh, Jharkhand and Bihar
The state is divided into 74 districts 300 tehsils, and 813 community blocks of which the administrative and Legislative capital is Lucknow, and the Financial and Industrial capital is Kanpur.
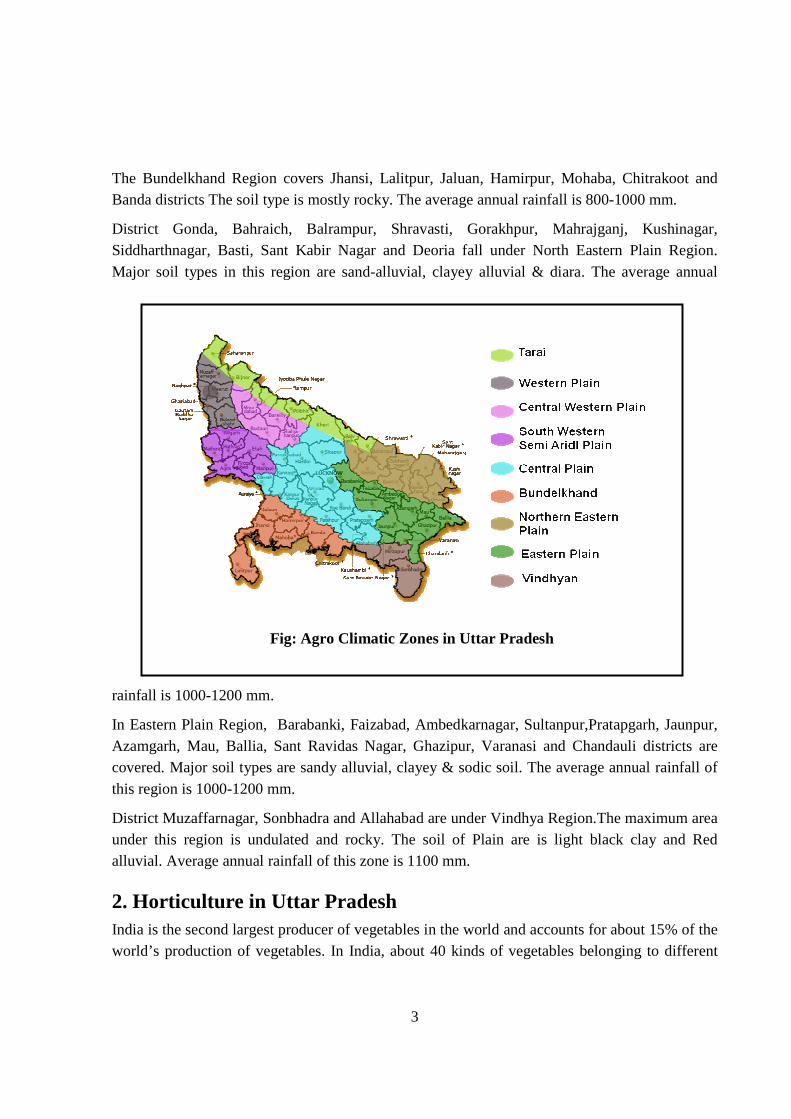
Based on agro-climatic conditions, the state is divided into 9 zones as Terai region, western plain region, central western region, south western region, central plain region, bundelkhand region, north eastern plain region, eastern plain region and Vindhya region. In the Terai region, part of the district Saharanpur, Muzzafarnagar, Bijnaur, Moradabad, Rampur, Bareilly, Pilibhit, Shahjahanpur, Lakhimpur, Bahraich and Shravasti are the districts. The soil type of this zone is mostly alluvial and clayey alluvial and contains sufficient quantity of carbonic materials. The average annual rainfall of this zone is 1150 mm.
In Western Plan Region, Bijnaur, Moradabad, Jyoti-ba-phule Nagar, Rampur, Bareilly, Badaun and Pilibhit are the major districts under this zone. This is very fertile region and the soil type is mostly sandy & clayey the average annual rainfall of this zone is 700-1000 mm.
The Central Western Region comprises Saharanpur, Muzzafarnagar, Meerat, Bagpat, Ghaziabad, Gautambudh Nagar and Buland Shahar districts. The soil of this region are clayey- alluvial, alluvial, sandy alluvial and sandy types. The average annual rainfall of this zone is 600-965 mm.
Agra, Firozabad, Mainpri, Etah, Aligarh, Mahamaya, Nagar and Mathura districts fall under the South-Western Region. The soil is mostly of aravalli, sandy, sandy-alluvial, alluvial & clayey alluvial type. Some area also has saline & sodic soils. The average annual rainfall of this zone is 750 mm.
District Lucknow, Unnao, Raebareilly, Sitapur, Hardoi, Kheeri,Kanpur-Nagar, Kanpur-Dehat, Etawah, Kannauj, Farrukhabad, Auraiya, Allahabad, Kaushambi, Fatehpur and Shahjahanpur are under Central Plain Region. Saline & sodic soil types covers major area of this region. Besides these, alluvial-sandy, alluvial clayey, alluvium, & fine clayey soil types also belong to this region. The average annual rainfall is 850-900 mm
3
The Bundelkhand Region covers Jhansi, Lalitpur, Jaluan, Hamirpur, Mohaba, Chitrakoot and Banda districts The soil type is mostly rocky. The average annual rainfall is 800-1000 mm.
District Gonda, Bahraich, Balrampur, Shravasti, Gorakhpur, Mahrajganj, Kushinagar, Siddharthnagar, Basti, Sant Kabir Nagar and Deoria fall under North Eastern Plain Region. Major soil types in this region are sand-alluvial, clayey alluvial & diara. The average annual
rainfall is 1000-1200 mm.
In Eastern Plain Region, Barabanki, Faizabad, Ambedkarnagar, Sultanpur,Pratapgarh, Jaunpur, Azamgarh, Mau, Ballia, Sant Ravidas Nagar, Ghazipur, Varanasi and Chandauli districts are covered. Major soil types are sandy alluvial, clayey & sodic soil. The average annual rainfall of this region is 1000-1200 mm.
District Muzaffarnagar, Sonbhadra and Allahabad are under Vindhya Region.The maximum area under this region is undulated and rocky. The soil of Plain are is light black clay and Red alluvial. Average annual rainfall of this zone is 1100 mm.
2. Horticulture in Uttar Pradesh India is the second largest producer of vegetables in the world and accounts for about 15% of the world’s production of vegetables. In India, about 40 kinds of vegetables belonging to different
Fig: Agro Climatic Zones in Uttar Pradesh
4
groups are cultivated. These include solanaceous, cucurbitaceous, leguminous, cruciferous (Cole crops), root crops and leafy vegetables. Major vegetable crops grown in the country are tomato, onion, brinjal, cabbage, cauliflower, okra and peas. Potato, tomato, onion, cabbage and cauliflower account for around 60% of the total vegetable production in the country.
The economy of Uttar Pradesh is predominantly agrarian and performance of agriculture and allied activities such as horticulture, animal husbandry, dairying and fisheries are critical in determining the growth rate of the State.
There has been tremendous increase in production of vegetables in UP but the production of fruits is not significantly increasing. In fruits production; UP ranks fifth among all states. UP is the leading state in India for mango production and it ranks fourth in guava production. The other major fruits grown in this state are Litchi, Banana and Aonla.
In vegetable production, UP ranks second among all states after West Bengal. Vegetables are grown all over the state on an area of more than 13 lakh hectares producing more than 248 lakh tons. Major vegetables are potato, tomato and peas (leading state), sweet potato (second among states), cabbage (sixth among states).
As per the statistics in horticultural production UP contributes 18% to the National Basket which is 37% in Vegetables, 11 % in Fruits, 44% in Potato. The total land under horticultural production in the UP is more than 30 lakh hectares which is 12% of the total cultivated area of the State
The major pocket areas for fruits and vegetable production in Uttar Pradesh are Saharanpur, Meerut, Gaziabad, Agra, Mathura, Mainpuri, Etawah, Farrukhabad, Kannauj, Lucknow, Unnao, Sultanpur, Allahabad, Kaushambi, Pratapgarh, Varanasi, Jaunpur, Ghazipur, Basti, Sant Kabir Nagar, Sidharth Nagar, Ballia, Gorakhpur, Kushinagar and Maharajganj
Under the horticulture mission, UP has targeted to produce 145 Lakh MT of Potato, 380 Lakh MT of fruits and 131 Lakh metric tones of vegetables in the year 2009/10. The total per capita consumption of fruits in UP is around 2 kg and for vegetable it is 7 kg.
Table 1: Present production scenario and targeted quantity under horticulture mission.
Items Unit 2008-9 Target
2009-10
% increase
Potato Lakh MT 125.42 144.45 17.03
Fruits Lakh MT 332.0 380.0 14.45
Vegetables Lakh MT 123.50 131.00 6.07
5
Source: National horticulture mission
3. Marketing of Horticultural Produce Marketing of Horticultural Agri-produce in UP is regulated by the Krishi Utpadan Mandi Adhiniyam, 1964. Under this act, there is one state owned Rajya Krishi Utpadan Mandi Parishad. Rajya Krishi Utpadan mandi Parishad was established at the state level in the year of 1973 to organize, control & guide various activities & Welfare Schemes of Mandi Samities. Mandi Parishad plays a very important role in implementing various acts in an impressive manner & to get fair behavior & appropriate support prices for their crops to the farmers. For every Mandi Area, one Mandi Samiti is established and there are 247 such mandi samatis within the state. The major duties and responsibilities of these mandi samitis are as follows-
� To ensure impartial behavior between Farmers & Traders.
� To categorize saleable agricultural produces & to sell the produces by Auction
� To get weighing of the produces as per Metric scale & to pay for the produces immediately
� To gather information regarding market prices & other useful trends & to publicize them
� To ensure the availability of the necessary stuff in Mandi areas
� To play the role of negotiator In case of disputes between Farmers & Traders & to resolve their problems
The flow of fresh fruits and vegetable in the market from farmer to market varies with the type of produce and the distance to the market. There are at least 5-6 levels in the marketing chain within the state which can be stated as-
i. Small / Marginal farmer
ii. Village level trader
iii. Market level Commission Agent
iv. Wholesaler
v. Sub-wholesaler
vi. Retailer
6
4. Price Situation of some selected horticultural produce
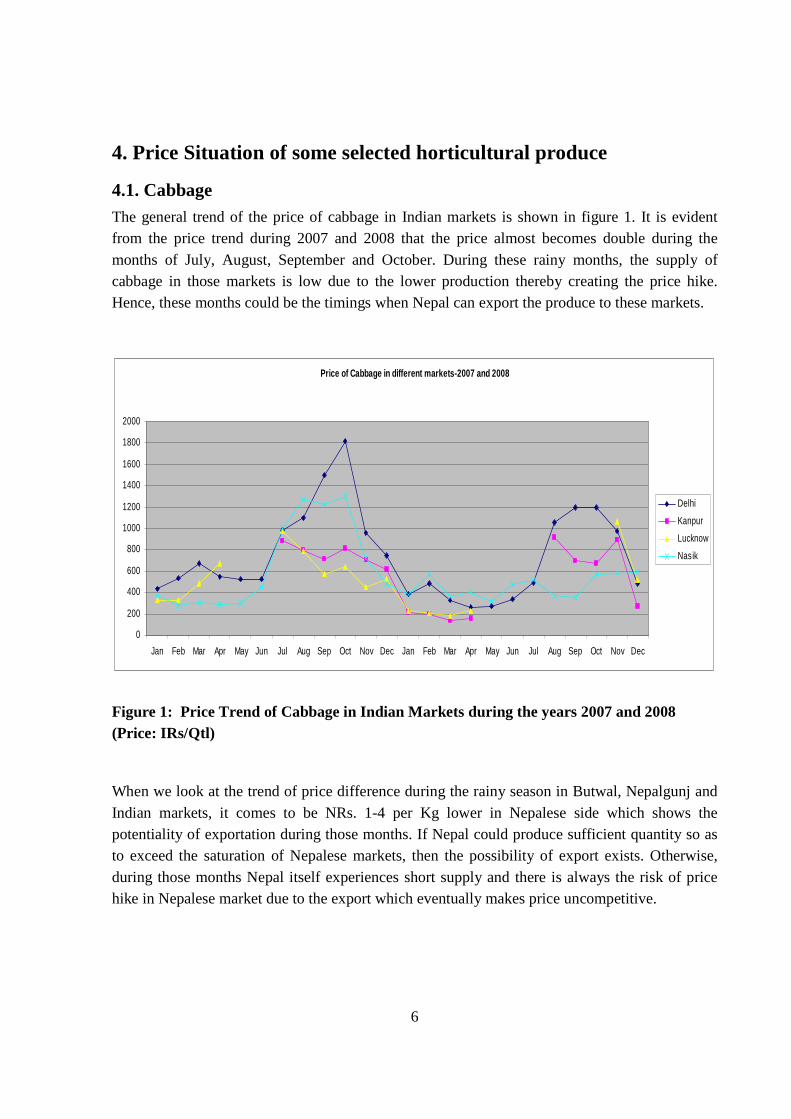
4.1. Cabbage The general trend of the price of cabbage in Indian markets is shown in figure 1. It is evident from the price trend during 2007 and 2008 that the price almost becomes double during the months of July, August, September and October. During these rainy months, the supply of cabbage in those markets is low due to the lower production thereby creating the price hike. Hence, these months could be the timings when Nepal can export the produce to these markets.
Figure 1: Price Trend of Cabbage in Indian Markets during the years 2007 and 2008 (Price: IRs/Qtl)
When we look at the trend of price difference during the rainy season in Butwal, Nepalgunj and Indian markets, it comes to be NRs. 1-4 per Kg lower in Nepalese side which shows the potentiality of exportation during those months. If Nepal could produce sufficient quantity so as to exceed the saturation of Nepalese markets, then the possibility of export exists. Otherwise, during those months Nepal itself experiences short supply and there is always the risk of price hike in Nepalese market due to the export which eventually makes price uncompetitive.
Price of Cabbage in different markets-2007 and 2008
0
200
400
600
800
1000
1200
1400
1600
1800
2000
Jan Feb Mar Apr May Jun Jul Aug Sep Oct Nov Dec Jan Feb Mar Apr May Jun Jul Aug Sep Oct Nov Dec
Delhi
Kanpur
Lucknow
Nasik
7
Price Difference between Indian Markets and Butwal
-15
-10
-5
0
5
10
15
Jan Feb Mar Apr May Jun Jul Aug Sep Oct Nov Dec Jan Feb Mar Apr May Jun Jul Aug Sep Oct Nov Dec
2007 2008
Pri
ce D
iffe
ren
ce (
NR
s/K
g)
Delhi Kanpur Lucknow Nasik
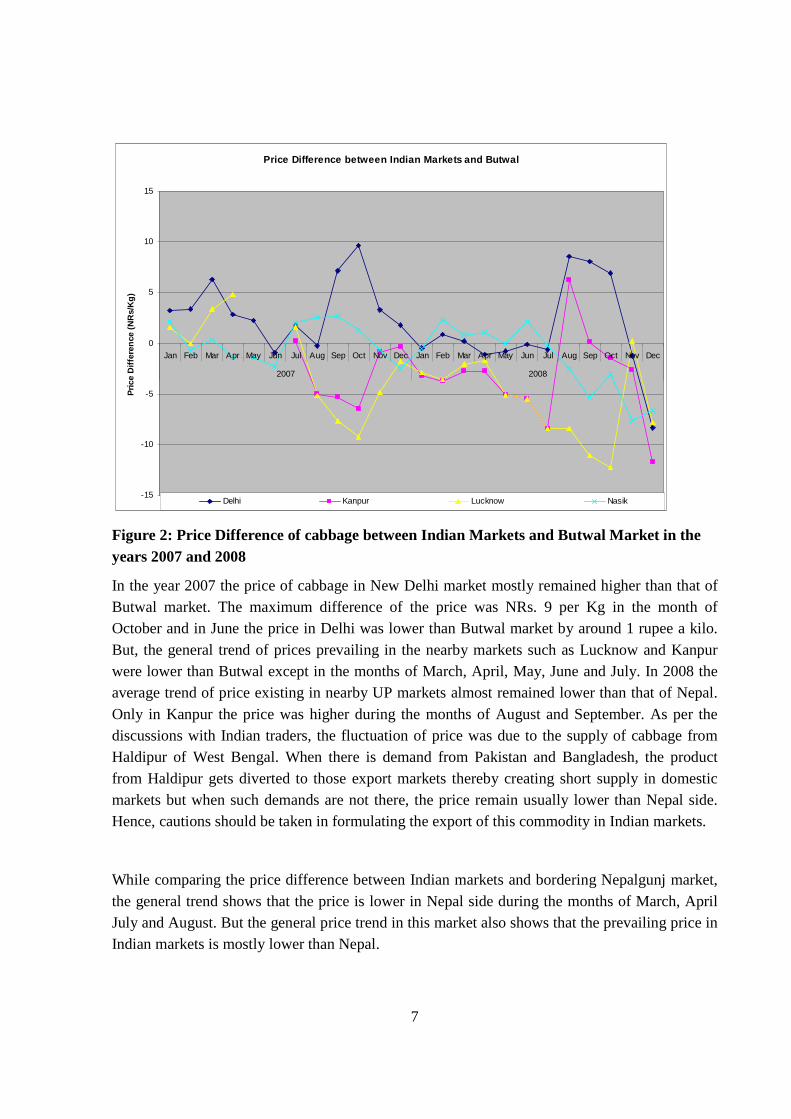
Figure 2: Price Difference of cabbage between Indian Markets and Butwal Market in the years 2007 and 2008
In the year 2007 the price of cabbage in New Delhi market mostly remained higher than that of Butwal market. The maximum difference of the price was NRs. 9 per Kg in the month of October and in June the price in Delhi was lower than Butwal market by around 1 rupee a kilo. But, the general trend of prices prevailing in the nearby markets such as Lucknow and Kanpur were lower than Butwal except in the months of March, April, May, June and July. In 2008 the average trend of price existing in nearby UP markets almost remained lower than that of Nepal. Only in Kanpur the price was higher during the months of August and September. As per the discussions with Indian traders, the fluctuation of price was due to the supply of cabbage from Haldipur of West Bengal. When there is demand from Pakistan and Bangladesh, the product from Haldipur gets diverted to those export markets thereby creating short supply in domestic markets but when such demands are not there, the price remain usually lower than Nepal side. Hence, cautions should be taken in formulating the export of this commodity in Indian markets.
While comparing the price difference between Indian markets and bordering Nepalgunj market, the general trend shows that the price is lower in Nepal side during the months of March, April July and August. But the general price trend in this market also shows that the prevailing price in Indian markets is mostly lower than Nepal.
8
Price Difference between Indian Markets and Nepalgunj
-15
-10
-5
0
5
10
15
20
Jan Feb Mar Apr May Jun Jul Aug Sep Oct Nov Dec Jan Feb Mar Apr May Jun Jul Aug Sep Oct Nov Dec
2007 2008Pri
ce D
iffe
ren
ce (
NR
s/K
g)
Delhi Kanpur Lucknow Nasik
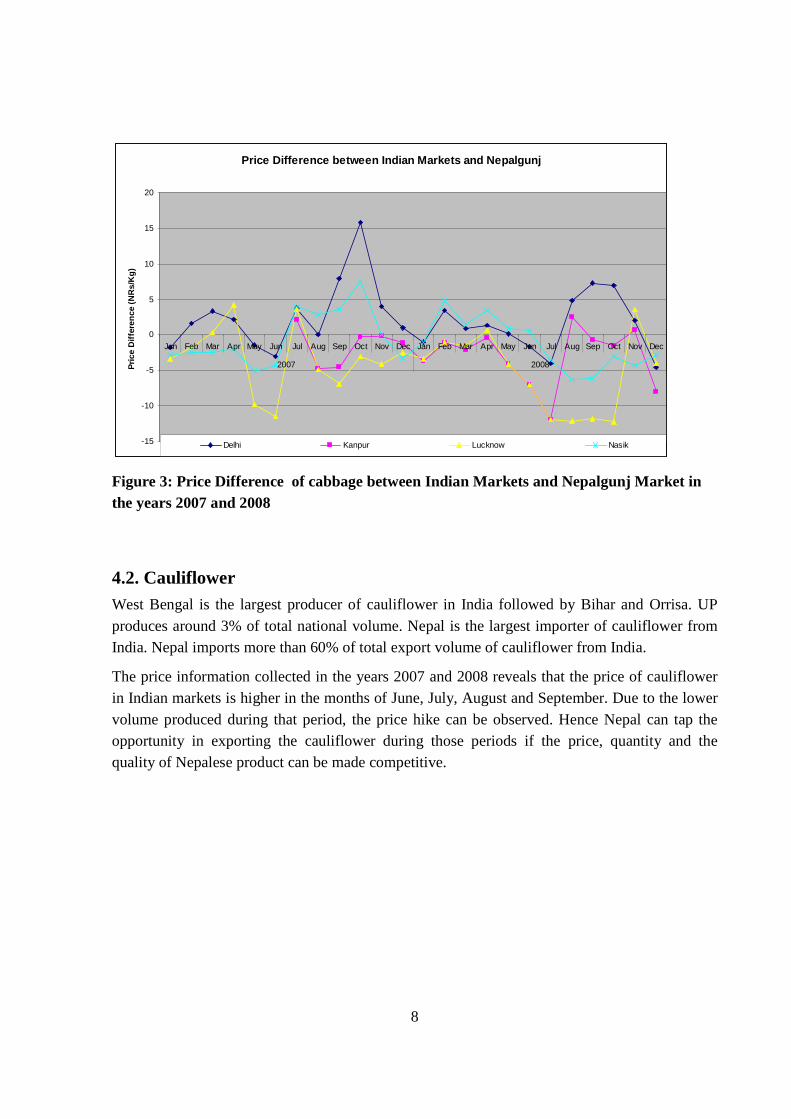
Figure 3: Price Difference of cabbage between Indian Markets and Nepalgunj Market in the years 2007 and 2008
4.2. Cauliflower West Bengal is the largest producer of cauliflower in India followed by Bihar and Orrisa. UP produces around 3% of total national volume. Nepal is the largest importer of cauliflower from India. Nepal imports more than 60% of total export volume of cauliflower from India.
The price information collected in the years 2007 and 2008 reveals that the price of cauliflower in Indian markets is higher in the months of June, July, August and September. Due to the lower volume produced during that period, the price hike can be observed. Hence Nepal can tap the opportunity in exporting the cauliflower during those periods if the price, quantity and the quality of Nepalese product can be made competitive.
9
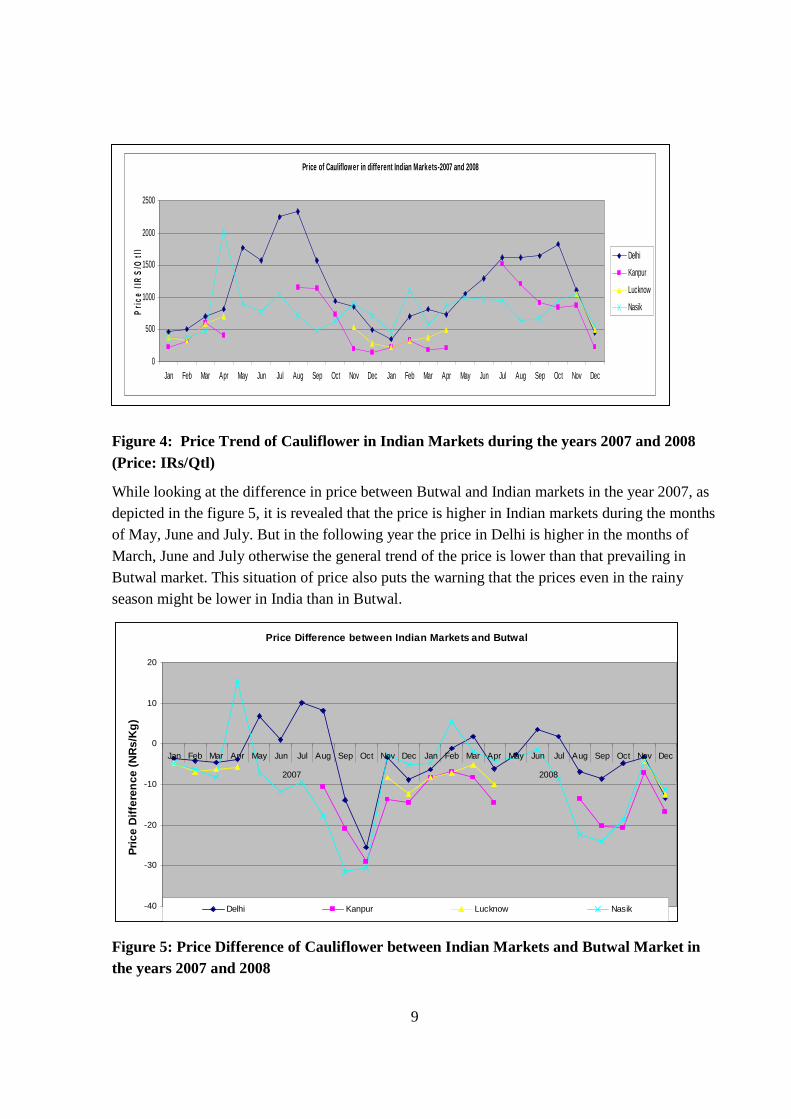
Figure 4: Price Trend of Cauliflower in Indian Markets during the years 2007 and 2008 (Price: IRs/Qtl)
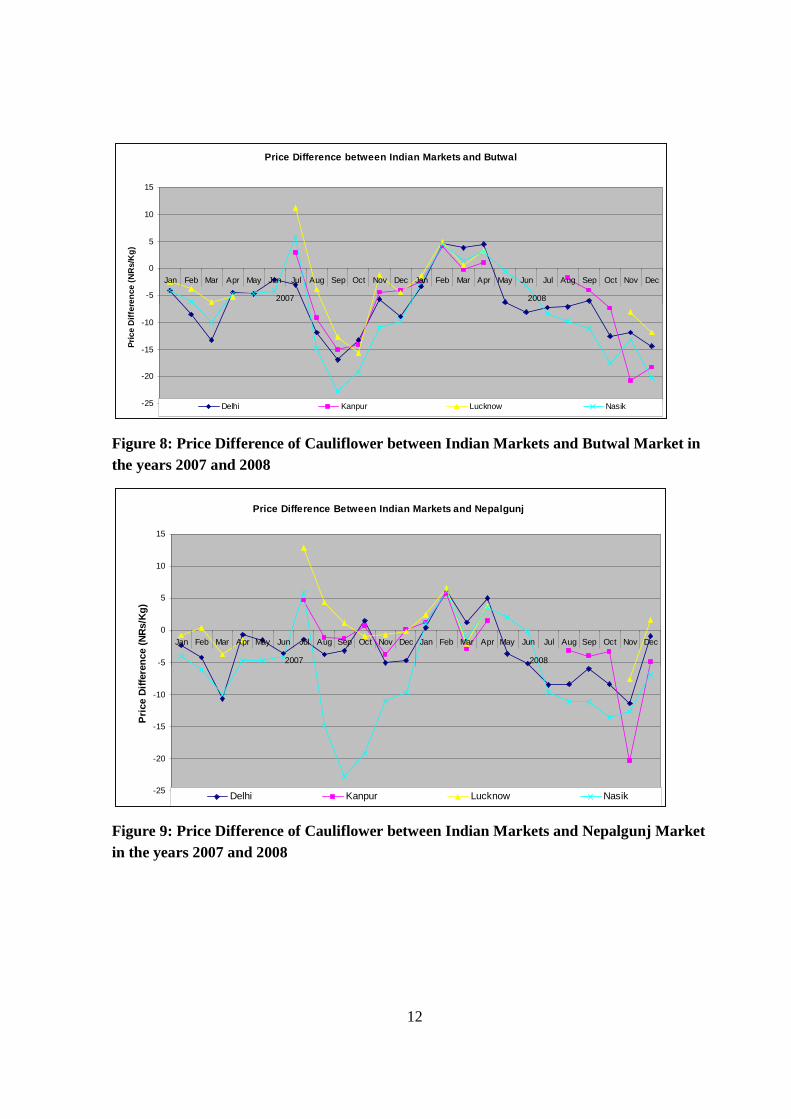
While looking at the difference in price between Butwal and Indian markets in the year 2007, as depicted in the figure 5, it is revealed that the price is higher in Indian markets during the months of May, June and July. But in the following year the price in Delhi is higher in the months of March, June and July otherwise the general trend of the price is lower than that prevailing in Butwal market. This situation of price also puts the warning that the prices even in the rainy season might be lower in India than in Butwal.
Price Difference between Indian Markets and Butwal
-40
-30
-20
-10
0
10
20
Jan Feb Mar Apr May Jun Jul Aug Sep Oct Nov Dec Jan Feb Mar Apr May Jun Jul Aug Sep Oct Nov Dec
2007 2008
Pri
ce D
iffe
ren
ce (
NR
s/K
g)
Delhi Kanpur Lucknow Nasik
Figure 5: Price Difference of Cauliflower between Indian Markets and Butwal Market in the years 2007 and 2008
Price of Cauliflower in different Indian Markets-2007 and 2008
0
500
1000
1500
2000
2500
Jan Feb Mar Apr May Jun Jul Aug Sep Oct Nov Dec Jan Feb Mar Apr May Jun Jul Aug Sep Oct Nov Dec
Pri
ce (
IRS
/Qtl
)
Delhi
Kanpur
Lucknow
Nasik

10
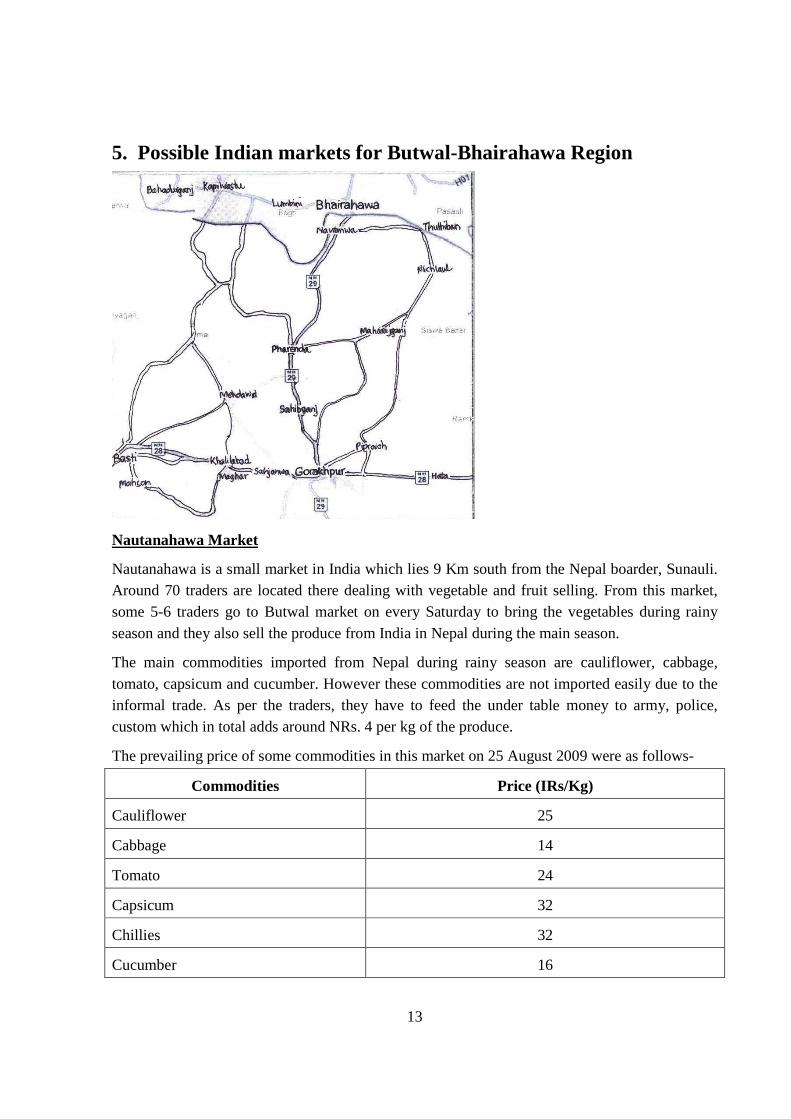
In relation to Nepalgunj market price too the price of Delhi and Nasik is higher during April to July however the nearby markets Lucknow and Kanpur have mostly the lower prices than existing in Nepalgunj throughout the year. The situation of lower price in Indian markets indicates the possibility of importation of Indian cauliflower rather than exporting. Hence, there seems a lot to do in getting the competitiveness for exportation of cauliflower from Nepal to India during rainy seasons. In the areas like Surkhet, where off season production of cauliflower can be done, should be expanded and strengthened in order to be able to tap the Indian markets during off season. However, the question of quantity, price and quality also remains the major determining factor for doing these all things. Till date, India has not allowed cauliflower in PRA approved list hence the efforts are needed to facilitate the export.
Price Difference between Indian Markets and Nepalgunj
-40
-30
-20
-10
0
10
20
30
Jan Feb Mar Apr May Jun Jul Aug Sep Oct Nov Dec Jan Feb Mar Apr May Jun Jul Aug Sep Oct Nov Dec
2007 2008
Pri
ce D
iffer
ence
(NR
s/K
g)
Delhi Kanpur Lucknow Nasik
Figure 6: Price Difference of Cauliflower between Indian Markets and Nepalgunj Market in the years 2007 and 2008
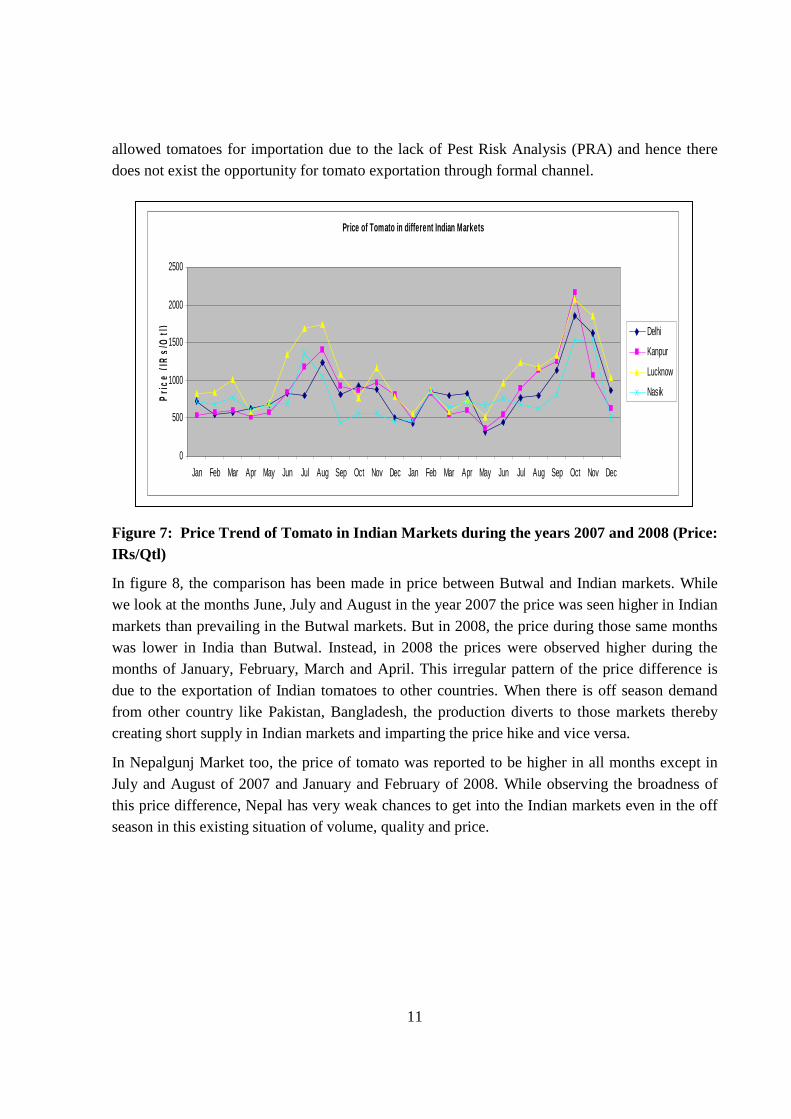
4.3. Tomato Uttar Pradesh is the largest producer of tomato in the India which is followed by West Bengal and Bihar. During the main seasons, India exports tomato to Pakistan, UAE, Bangladesh, Maldives, Nepal and Tanzania. In the year 2007, Nepal imported NRs 11.4 million worth tomato from India.
While looking at the price of tomato in major Indian markets, it can be clearly seen that the prices go high during the months of June, July, August and September. This shows the possibility of exporting tomatoes to India during rainy season. However, presently India has not
11
Price of Tomato in different Indian Markets
0
500
1000
1500
2000
2500
Jan Feb Mar Apr May Jun Jul Aug Sep Oct Nov Dec Jan Feb Mar Apr May Jun Jul Aug Sep Oct Nov Dec
Pri
ce (
IRs/
Qtl
)
Delhi
Kanpur
Lucknow
Nasik
allowed tomatoes for importation due to the lack of Pest Risk Analysis (PRA) and hence there does not exist the opportunity for tomato exportation through formal channel.
Figure 7: Price Trend of Tomato in Indian Markets during the years 2007 and 2008 (Price: IRs/Qtl)
In figure 8, the comparison has been made in price between Butwal and Indian markets. While we look at the months June, July and August in the year 2007 the price was seen higher in Indian markets than prevailing in the Butwal markets. But in 2008, the price during those same months was lower in India than Butwal. Instead, in 2008 the prices were observed higher during the months of January, February, March and April. This irregular pattern of the price difference is due to the exportation of Indian tomatoes to other countries. When there is off season demand from other country like Pakistan, Bangladesh, the production diverts to those markets thereby creating short supply in Indian markets and imparting the price hike and vice versa.
In Nepalgunj Market too, the price of tomato was reported to be higher in all months except in July and August of 2007 and January and February of 2008. While observing the broadness of this price difference, Nepal has very weak chances to get into the Indian markets even in the off season in this existing situation of volume, quality and price.
12
Price Difference between Indian Markets and Butwal
-25
-20
-15
-10
-5
0
5
10
15
Jan Feb Mar Apr May Jun Jul Aug Sep Oct Nov Dec Jan Feb Mar Apr May Jun Jul Aug Sep Oct Nov Dec
2007 2008
Pri
ce D
iffe
ren
ce (
NR
s/K
g)
Delhi Kanpur Lucknow Nasik
Figure 8: Price Difference of Cauliflower between Indian Markets and Butwal Market in the years 2007 and 2008
Price Difference Between Indian Markets and Nepalgunj
-25
-20
-15
-10
-5
0
5
10
15
Jan Feb Mar Apr May Jun Jul Aug Sep Oct Nov Dec Jan Feb Mar Apr May Jun Jul Aug Sep Oct Nov Dec
2007 2008
Pri
ce D
iffe
ren
ce (
NR
s/K
g)
Delhi Kanpur Lucknow Nasik
Figure 9: Price Difference of Cauliflower between Indian Markets and Nepalgunj Market in the years 2007 and 2008
13
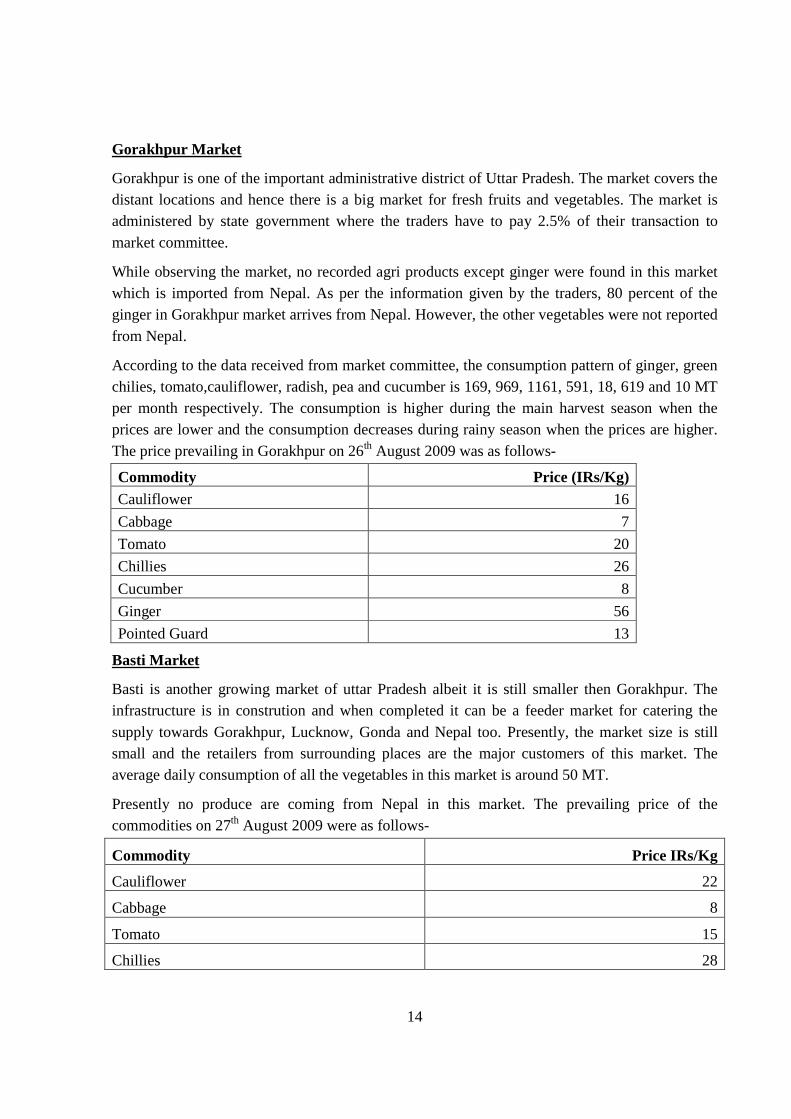
5. Possible Indian markets for Butwal-Bhairahawa Region
Nautanahawa Market
Nautanahawa is a small market in India which lies 9 Km south from the Nepal boarder, Sunauli. Around 70 traders are located there dealing with vegetable and fruit selling. From this market, some 5-6 traders go to Butwal market on every Saturday to bring the vegetables during rainy season and they also sell the produce from India in Nepal during the main season.
The main commodities imported from Nepal during rainy season are cauliflower, cabbage, tomato, capsicum and cucumber. However these commodities are not imported easily due to the informal trade. As per the traders, they have to feed the under table money to army, police, custom which in total adds around NRs. 4 per kg of the produce.
The prevailing price of some commodities in this market on 25 August 2009 were as follows-
Commodities Price (IRs/Kg)
Cauliflower 25
Cabbage 14
Tomato 24
Capsicum 32
Chillies 32
Cucumber 16
14
Gorakhpur Market
Gorakhpur is one of the important administrative district of Uttar Pradesh. The market covers the distant locations and hence there is a big market for fresh fruits and vegetables. The market is administered by state government where the traders have to pay 2.5% of their transaction to market committee.
While observing the market, no recorded agri products except ginger were found in this market which is imported from Nepal. As per the information given by the traders, 80 percent of the ginger in Gorakhpur market arrives from Nepal. However, the other vegetables were not reported from Nepal.
According to the data received from market committee, the consumption pattern of ginger, green chilies, tomato,cauliflower, radish, pea and cucumber is 169, 969, 1161, 591, 18, 619 and 10 MT per month respectively. The consumption is higher during the main harvest season when the prices are lower and the consumption decreases during rainy season when the prices are higher. The price prevailing in Gorakhpur on 26th August 2009 was as follows-
Commodity Price (IRs/Kg) Cauliflower 16
Cabbage 7
Tomato 20
Chillies 26
Cucumber 8
Ginger 56
Pointed Guard 13
Basti Market
Basti is another growing market of uttar Pradesh albeit it is still smaller then Gorakhpur. The infrastructure is in constrution and when completed it can be a feeder market for catering the supply towards Gorakhpur, Lucknow, Gonda and Nepal too. Presently, the market size is still small and the retailers from surrounding places are the major customers of this market. The average daily consumption of all the vegetables in this market is around 50 MT.
Presently no produce are coming from Nepal in this market. The prevailing price of the commodities on 27th August 2009 were as follows-
Commodity Price IRs/Kg
Cauliflower 22
Cabbage 8
Tomato 15
Chillies 28
15
6. Recommendations 1. From the case study done on some potential vegetables, it has been found that it is almost
impossible to export the vegetables in Indian markets during main season of production. Since the quantity produced is in commercial scale and there are many incentives for vegetable growers from Indian government both from the state and central level, the produce has lower price than Nepal during that season. Hence, the focus should be given for the off season vegetable production that could be fulfilled in the short supplied nearby Indian markets with good price.
2. The vegetable demand in India during off season is high and this has not been fully met yet. So, Nepal could tap opportunity during this period. But while analyzing the price of some vegetables prevailing in 2007 and 2008 between Indian and Nepalese markets , it was found that either the price is low in India or the difference margin is quite low. This has indicated that the production volume is quite low in Nepalese side which makes the product costlier than India.
3. During off season periods, the vegetable is short supplied in Nepal side too. When one attempts to export during this period, this will cause the lack of supply in Nepalese side thereby imparting the price hike within Nepal, which will again not functional for sustainable exportation. Hence, prior to formulating the export strategy, the focus should be given for massive production of potential vegetables so that the production cost is lower, Nepalese side demand is saturated and the formal exportation could take place.
4. India does not permit for importation of almost all important vegetables (except cabbage, cucumber, radish and tomato) to their country. Only the products that have been approved PRAs are allowed to enter into India. And there are still many vegetables that have not received the PRA approval from India. Hence, the concerned authority of Nepal should push on their Indian counterpart for listing the exportable vegetables in approval list first by creating produce competitiveness and then attracting Indian buyers to be keen to import Nepalese vegetables.
16
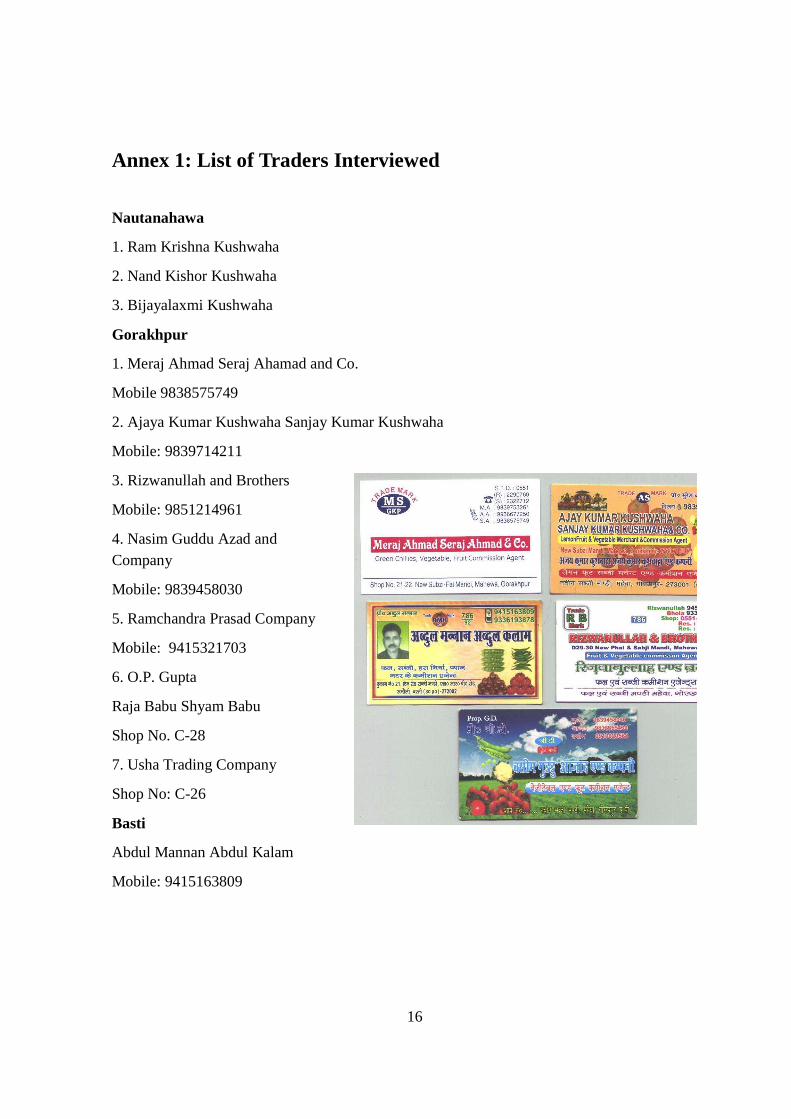
Annex 1: List of Traders Interviewed
Nautanahawa
1. Ram Krishna Kushwaha
2. Nand Kishor Kushwaha
3. Bijayalaxmi Kushwaha
Gorakhpur
1. Meraj Ahmad Seraj Ahamad and Co.
Mobile 9838575749
2. Ajaya Kumar Kushwaha Sanjay Kumar Kushwaha
Mobile: 9839714211
3. Rizwanullah and Brothers
Mobile: 9851214961
4. Nasim Guddu Azad and Company
Mobile: 9839458030
5. Ramchandra Prasad Company
Mobile: 9415321703
6. O.P. Gupta
Raja Babu Shyam Babu
Shop No. C-28
7. Usha Trading Company
Shop No: C-26
Basti
Abdul Mannan Abdul Kalam
Mobile: 9415163809
17
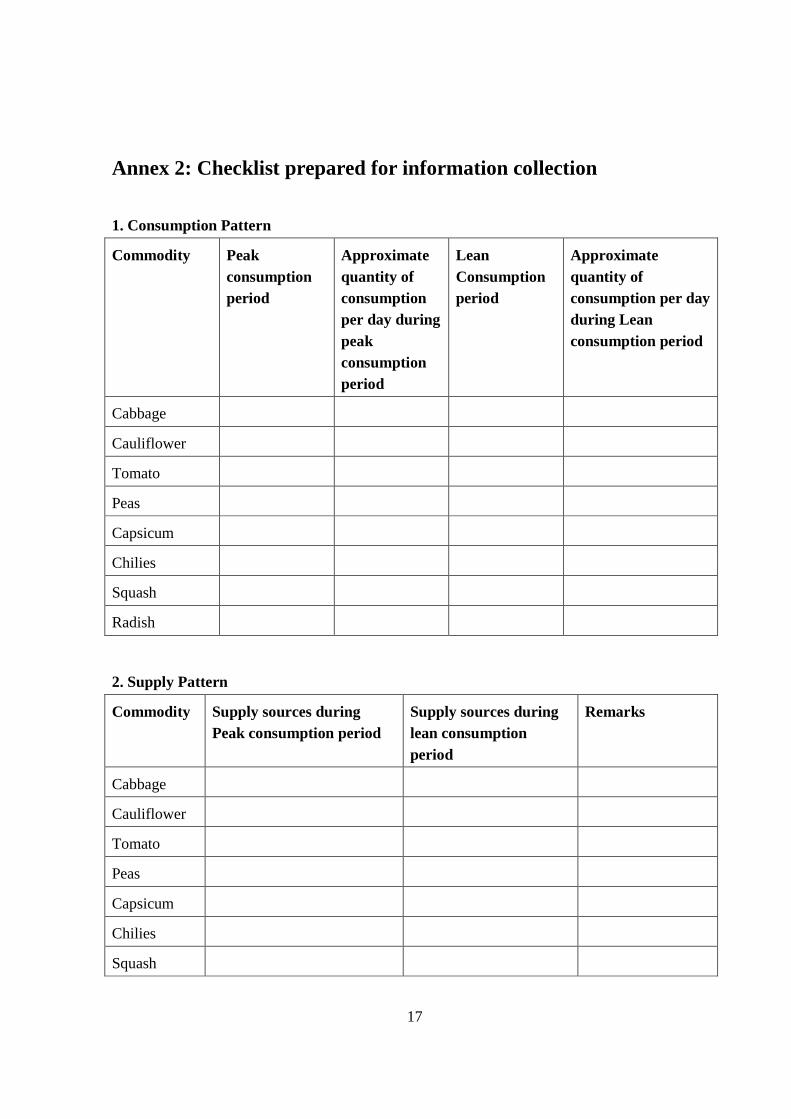
Annex 2: Checklist prepared for information collection
1. Consumption Pattern
Commodity Peak consumption period
Approximate quantity of consumption per day during peak consumption period
Lean Consumption period
Approximate quantity of consumption per day during Lean consumption period
Cabbage
Cauliflower
Tomato
Peas
Capsicum
Chilies
Squash
Radish
2. Supply Pattern
Commodity Supply sources during Peak consumption period
Supply sources during lean consumption period
Remarks
Cabbage
Cauliflower
Tomato
Peas
Capsicum
Chilies
Squash
18
Radish
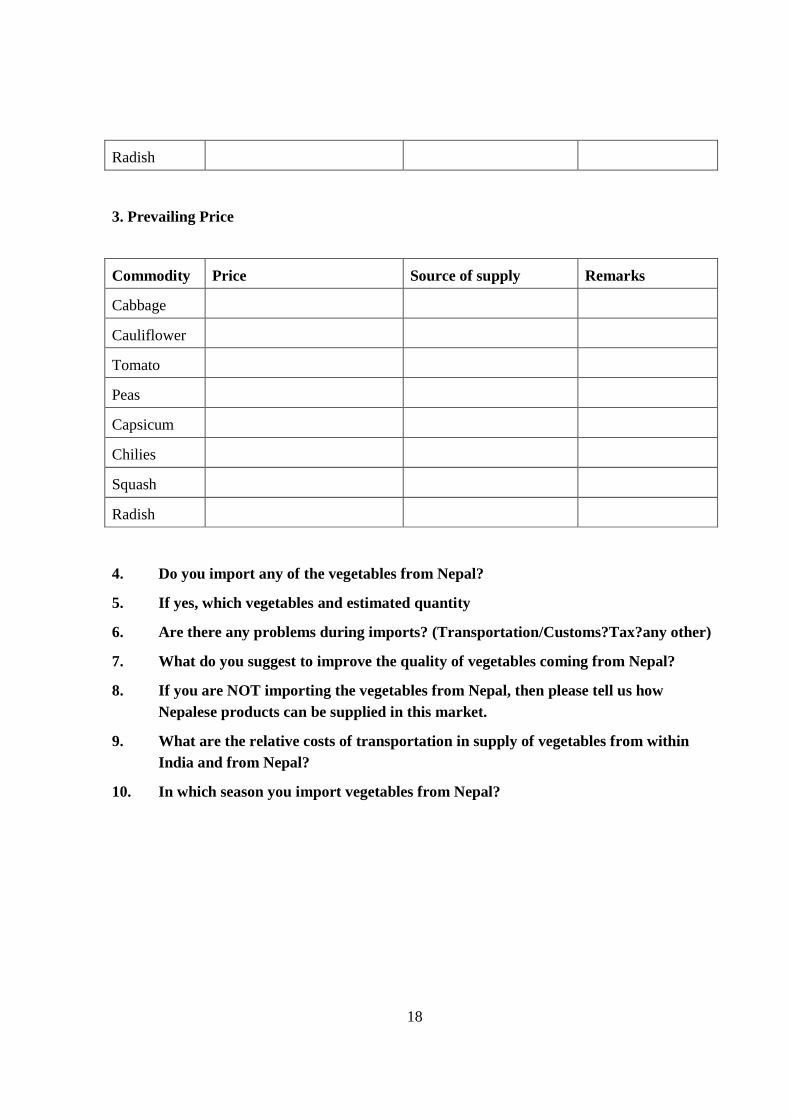
3. Prevailing Price
Commodity Price Source of supply Remarks
Cabbage
Cauliflower
Tomato
Peas
Capsicum
Chilies
Squash
Radish
4. Do you import any of the vegetables from Nepal?
5. If yes, which vegetables and estimated quantity
6. Are there any problems during imports? (Transportation/Customs?Tax?any other)
7. What do you suggest to improve the quality of vegetables coming from Nepal?
8. If you are NOT importing the vegetables from Nepal, then please tell us how Nepalese products can be supplied in this market.
9. What are the relative costs of transportation in supply of vegetables from within India and from Nepal?
10. In which season you import vegetables from Nepal?
19
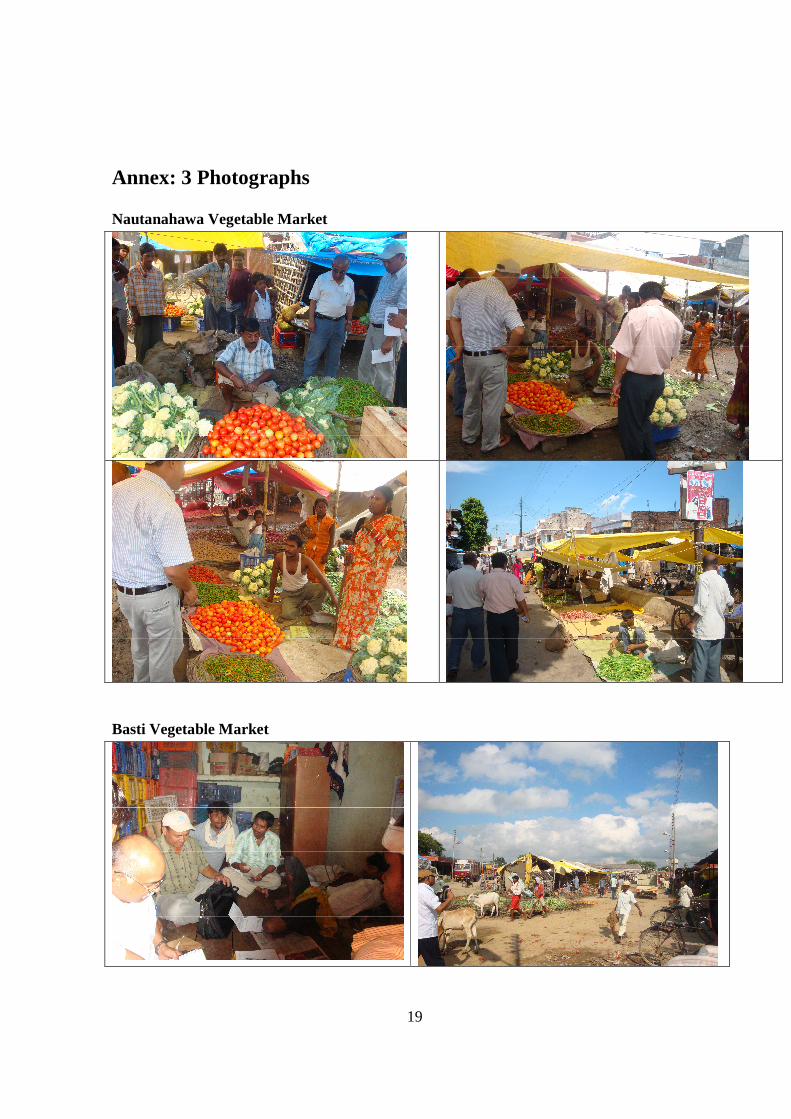
Annex: 3 Photographs
Nautanahawa Vegetable Market
Basti Vegetable Market

20
Gorakhpur Vegetable Market

ERROR: ioerrorOFFENDING COMMAND: image
STACK: