Embed Size (px)
Citation preview

AgroKarta
Extension to ArcGIS
© XTools, LLC
2010-2018
About AgroKartaAgroKarta is a solution for performing analysis of agrochemical soils inspection. The AgroKarta functionality has been developed based on regulatory documents applicable in the agrochemical industry and requirements from federal management bodies. AgroKarta is an extension to ArcGIS, provided for automating the agrochemical data processing, particularly the data related to the chemical elements content in soils.
With the AgroKarta toolset your field and chemical elements data can be:
synchronized;integrated to a detailed, informative, and editable map;used to generate statistics on the agricultural features to further analyze it and to plan the future sowing campaigns;generated as summary tables to provide reports to the management bodies.
All AgroKarta tools are versatile and can be used with any data. At the same time the AgroKarta users can parametrize the extension's functionality by modifying the appropriate extension's settings depending on the agricultural data specifications.
What's new in AgroKartaWhat’s new in AgroKarta 3.4
Support for ArcGIS 10.6. What’s new in AgroKarta 3.3
Added support for older ArcGIS Desktop versions starting from 9.3, and the most recent 10.5.Added capability for work with "Configurator" without administrator rights.
What’s new in AgroKarta 3.2
Support for ArcGIS 10.4New registration form for trial version
What’s new in AgroKarta 3.1
Support for ArcGIS 10.3 - AgroKarta 3.1 is a new minor update addressing the ArcGIS 10.3 compatibility issue.
What’s new in AgroKarta 3.0
Following new tools and features have been implemented in the new version:
A new “Automatic polygon features separating” tool has been added;- Setting precision parameters option has been added in the “Import attribute data to layers and tables” tool;- Setting precision parameters option for area measurement units and chemical elements content has been added in the “Generate reports” tool;
A new option allowing to generate “Agrochemical map of farmlands” report in *.doc format has been added in the “Generate reports” tool.
What’s new in AgroKarta 2.0
A new Configurator tool provided for setting user parameters based on the agrochemical characteristics of the specified region has been addedSupport for ArcGIS 10.x
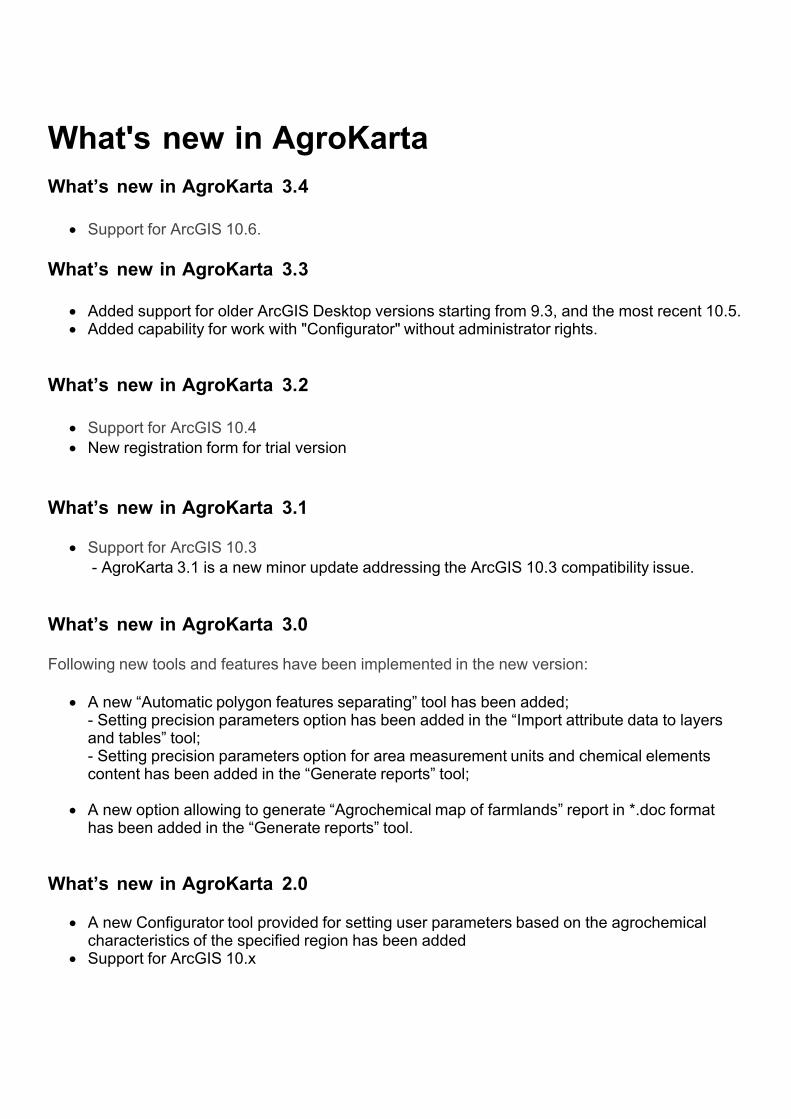
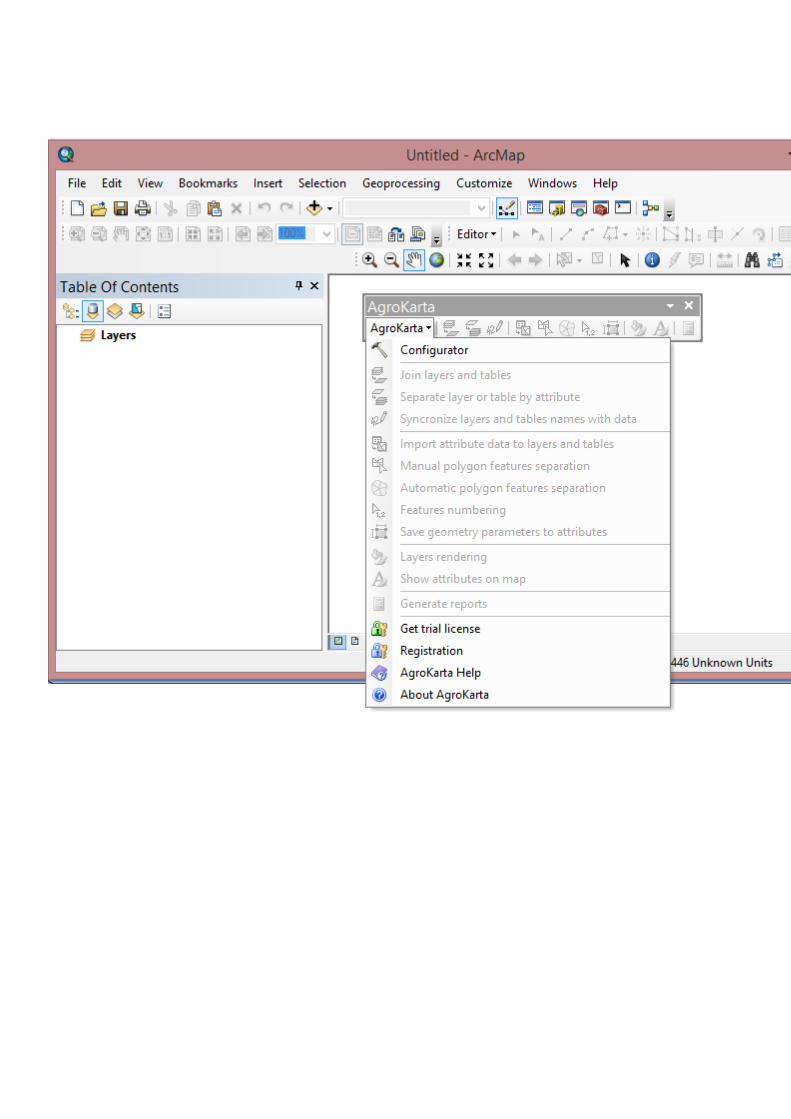
Adding AgroKarta toolbar1. Select Customize option on the standard ArcMap toolbar. Select Toolbars from the drop-down list and check the box near the AgroKarta extension.
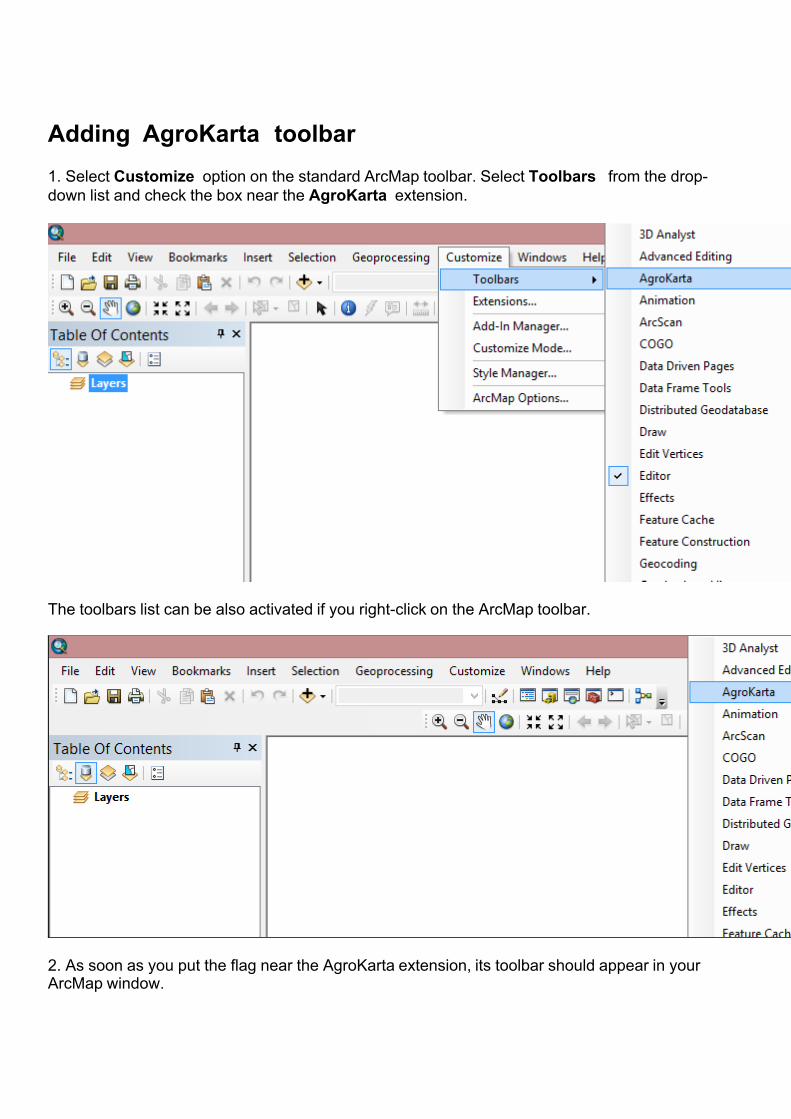
The toolbars list can be also activated if you right-click on the ArcMap toolbar.
2. As soon as you put the flag near the AgroKarta extension, its toolbar should appear in your ArcMap window.
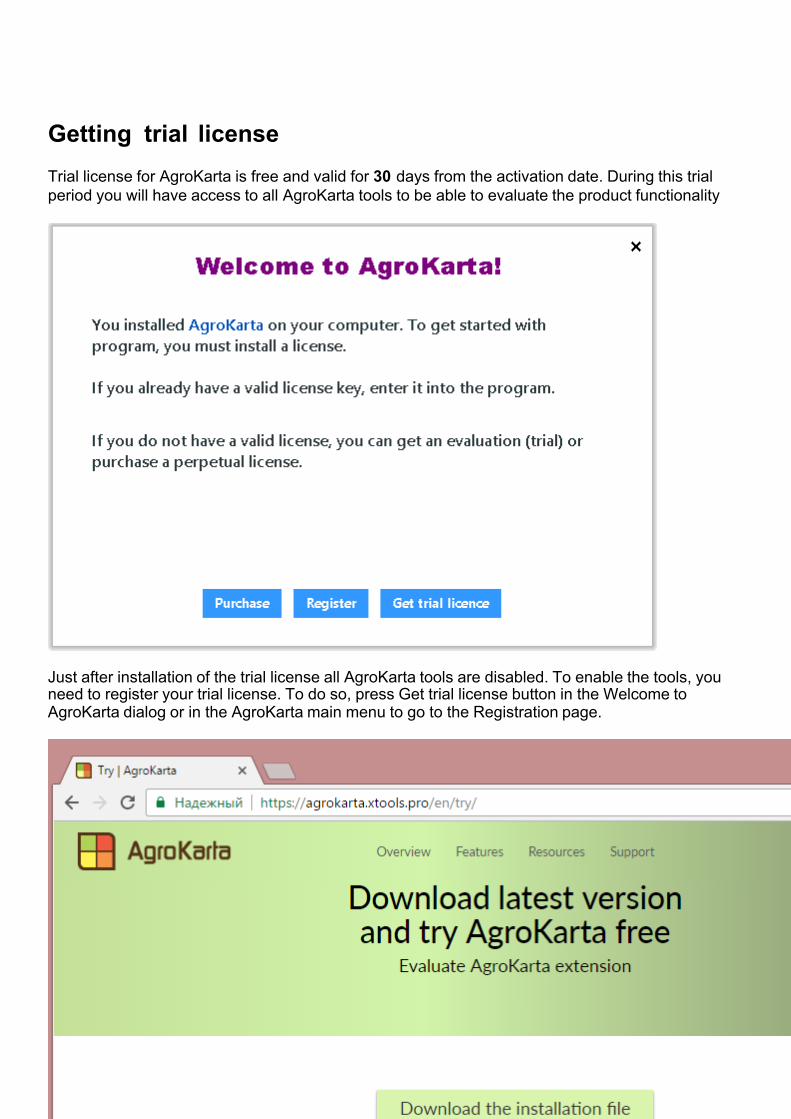
Getting trial licenseTrial license for AgroKarta is free and valid for 30 days from the activation date. During this trial period you will have access to all AgroKarta tools to be able to evaluate the product functionality
Just after installation of the trial license all AgroKarta tools are disabled. To enable the tools, you need to register your trial license. To do so, press Get trial license button in the Welcome to AgroKarta dialog or in the AgroKarta main menu to go to the Registration page.
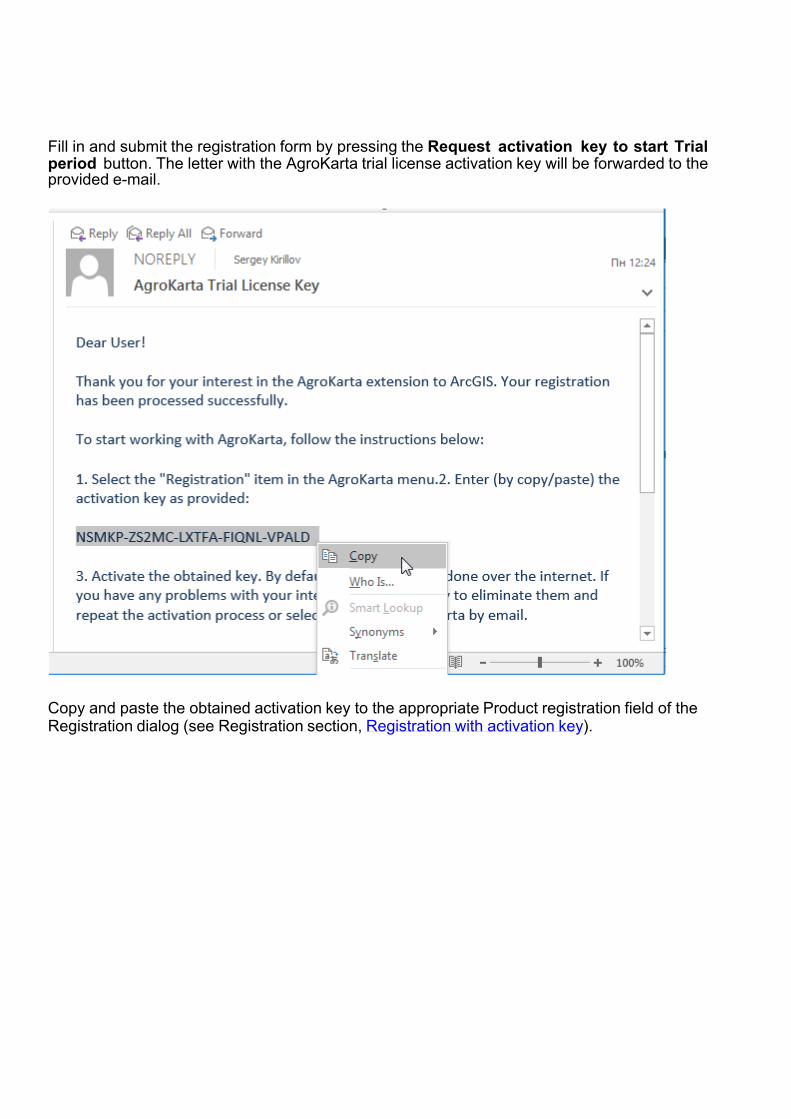
Fill in and submit the registration form by pressing the Request activation key to start Trial period button. The letter with the AgroKarta trial license activation key will be forwarded to the provided e-mail.
Copy and paste the obtained activation key to the appropriate Product registration field of the Registration dialog (see Registration section, Registration with activation key).
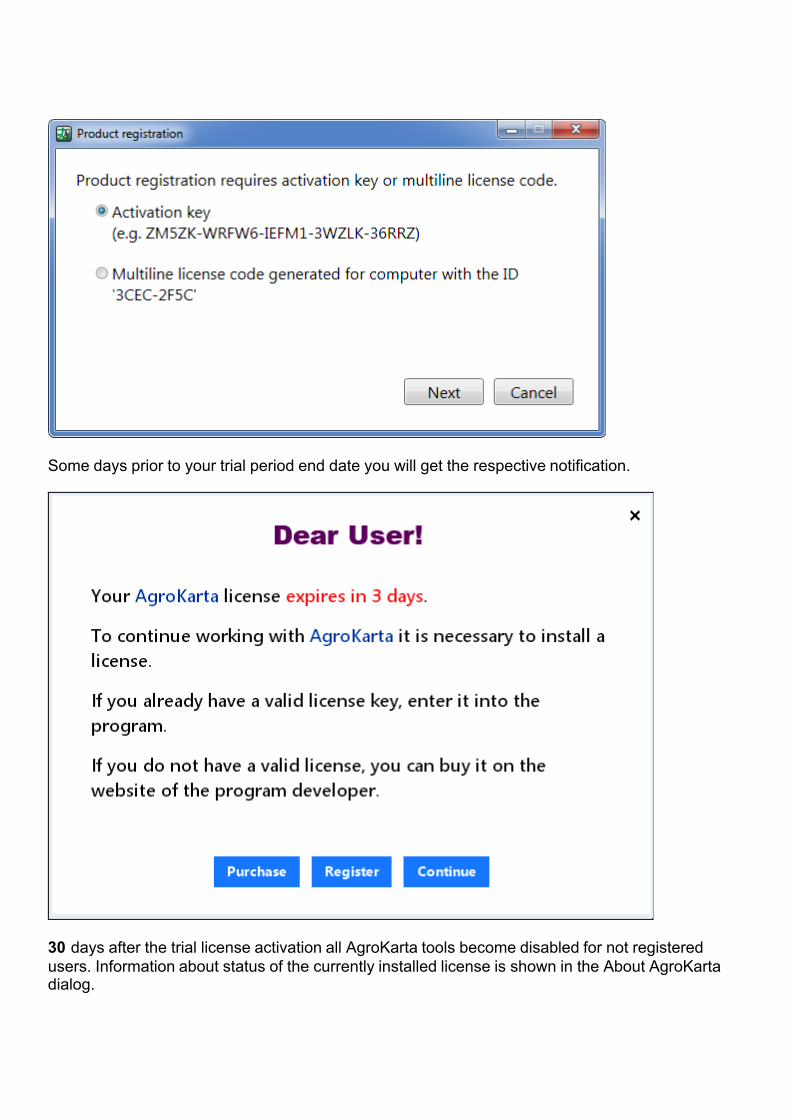
Some days prior to your trial period end date you will get the respective notification.
30 days after the trial license activation all AgroKarta tools become disabled for not registered users. Information about status of the currently installed license is shown in the About AgroKarta dialog.
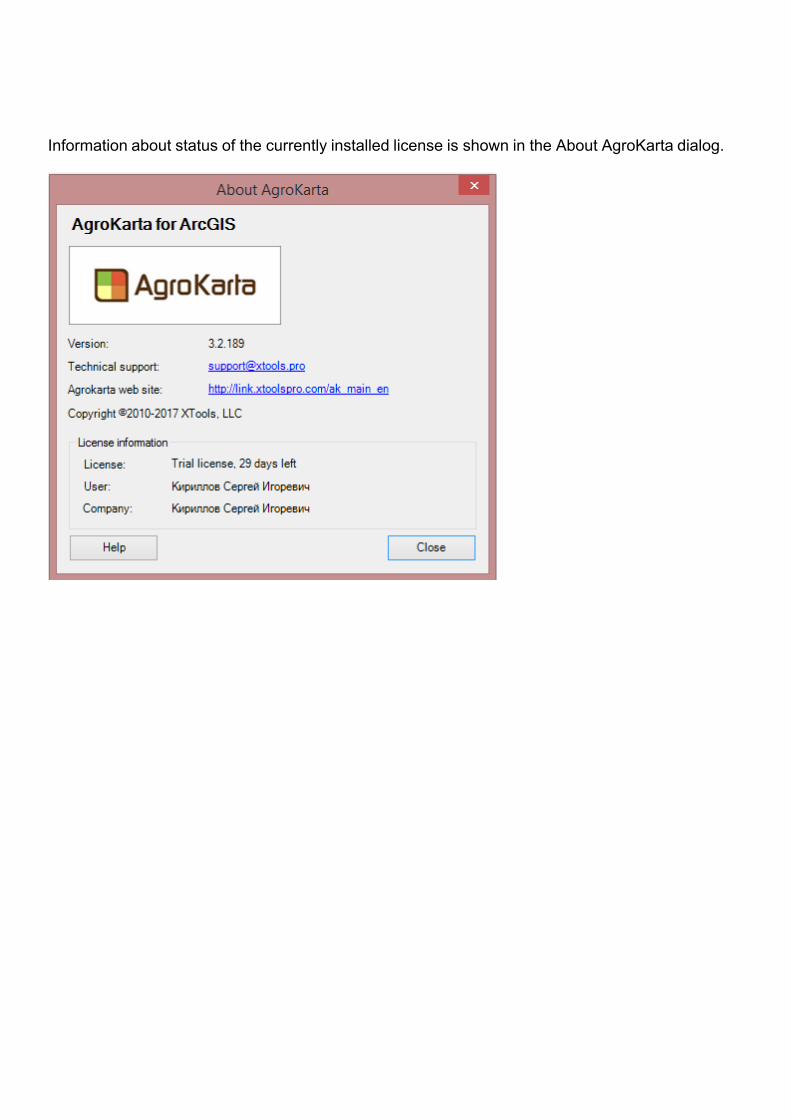
Information about status of the currently installed license is shown in the About AgroKarta dialog.
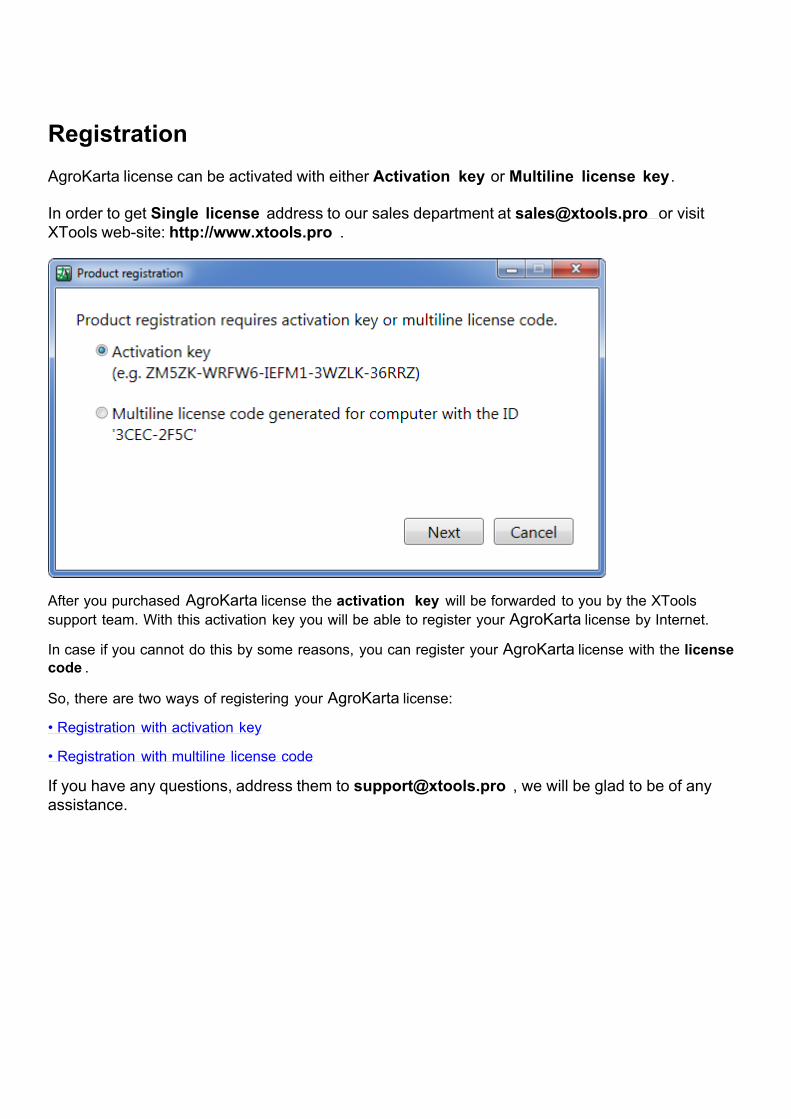
RegistrationAgroKarta license can be activated with either Activation key or Multiline license key. In order to get Single license address to our sales department at [email protected] or visit XTools web-site: http://www.xtools.pro .
After you purchased AgroKarta license the activation key will be forwarded to you by the XTools support team. With this activation key you will be able to register your AgroKarta license by Internet.
In case if you cannot do this by some reasons, you can register your AgroKarta license with the license code .
So, there are two ways of registering your AgroKarta license:
• Registration with activation key
• Registration with multiline license code
If you have any questions, address them to [email protected] , we will be glad to be of any assistance.
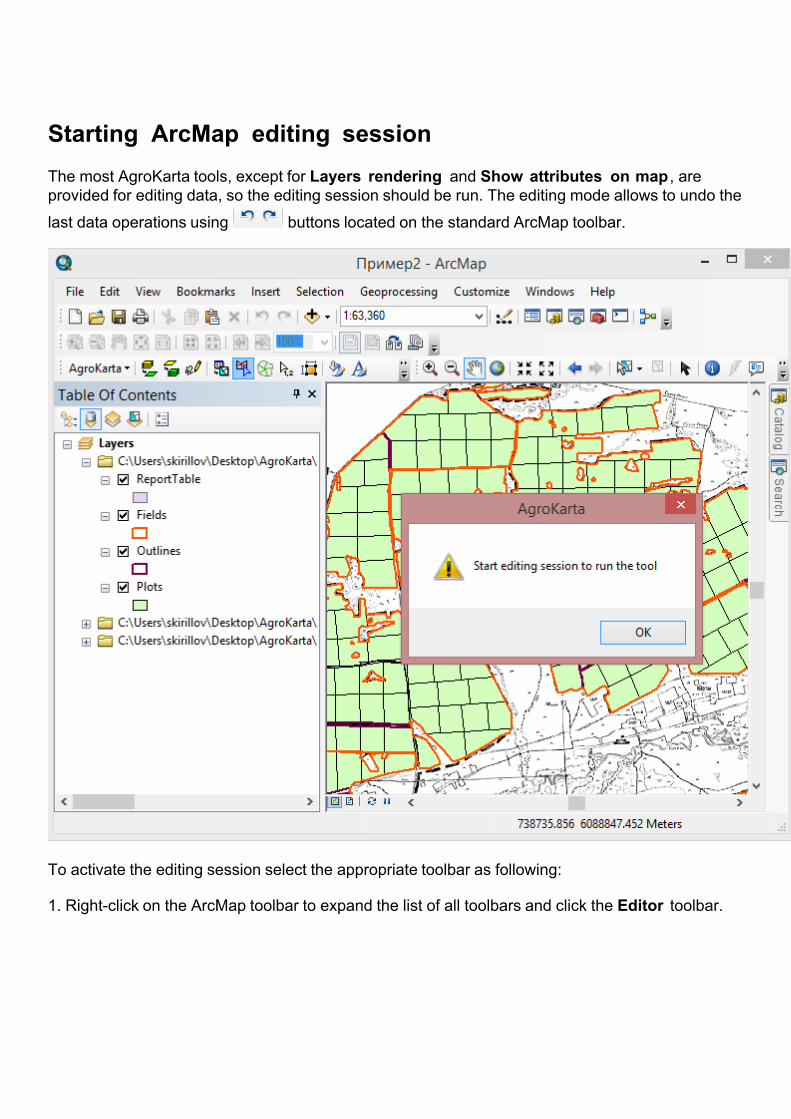
Starting ArcMap editing sessionThe most AgroKarta tools, except for Layers rendering and Show attributes on map , are provided for editing data, so the editing session should be run. The editing mode allows to undo the last data operations using buttons located on the standard ArcMap toolbar.
To activate the editing session select the appropriate toolbar as following: 1. Right-click on the ArcMap toolbar to expand the list of all toolbars and click the Editor toolbar.
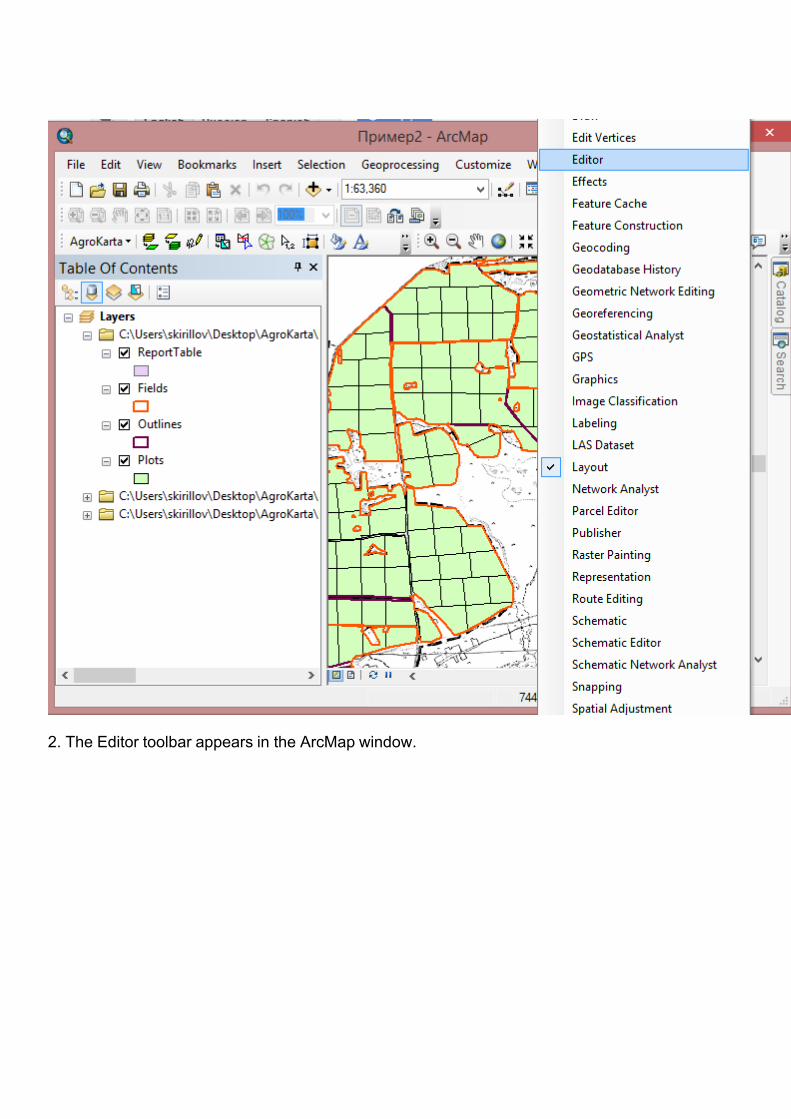
2. The Editor toolbar appears in the ArcMap window.
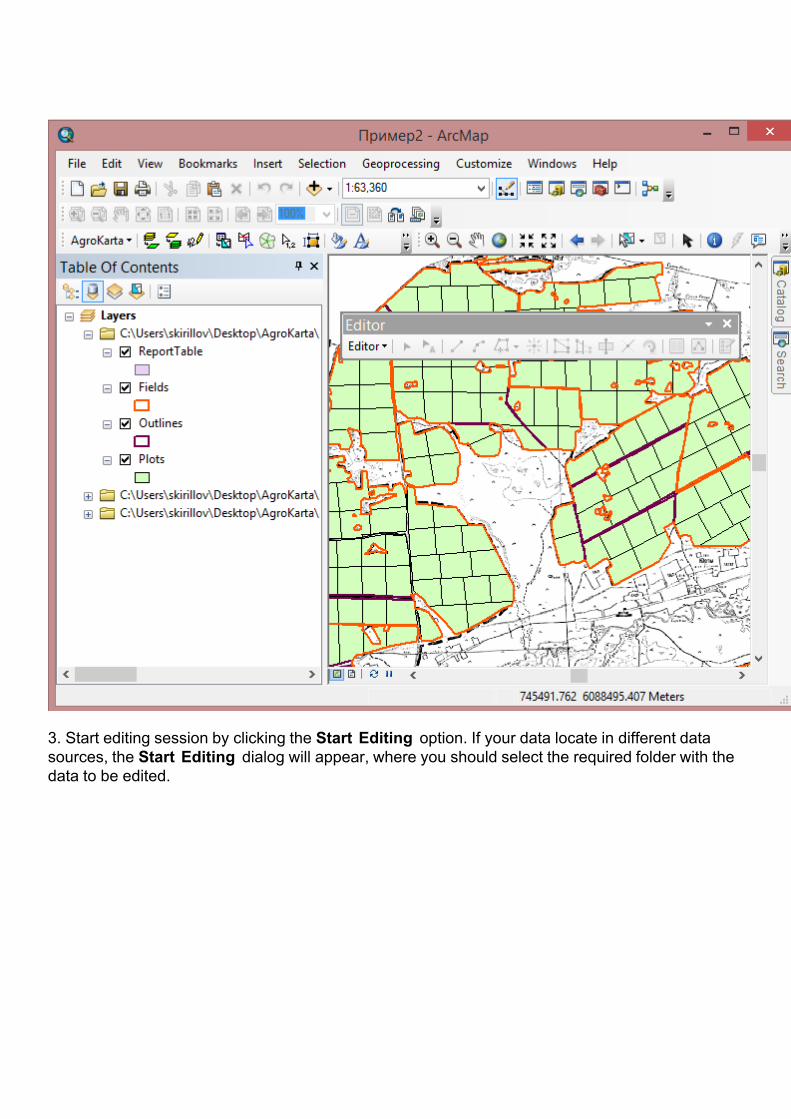
3. Start editing session by clicking the Start Editing option. If your data locate in different data sources, the Start Editing dialog will appear, where you should select the required folder with the data to be edited.
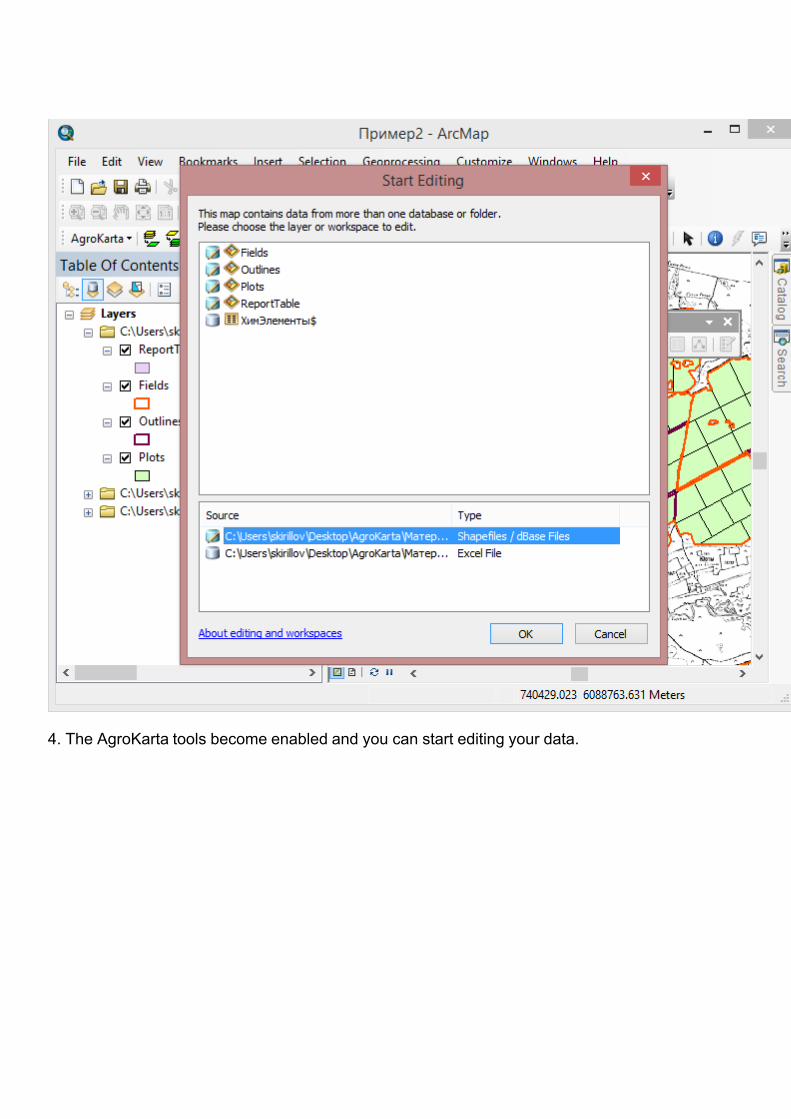
4. The AgroKarta tools become enabled and you can start editing your data.
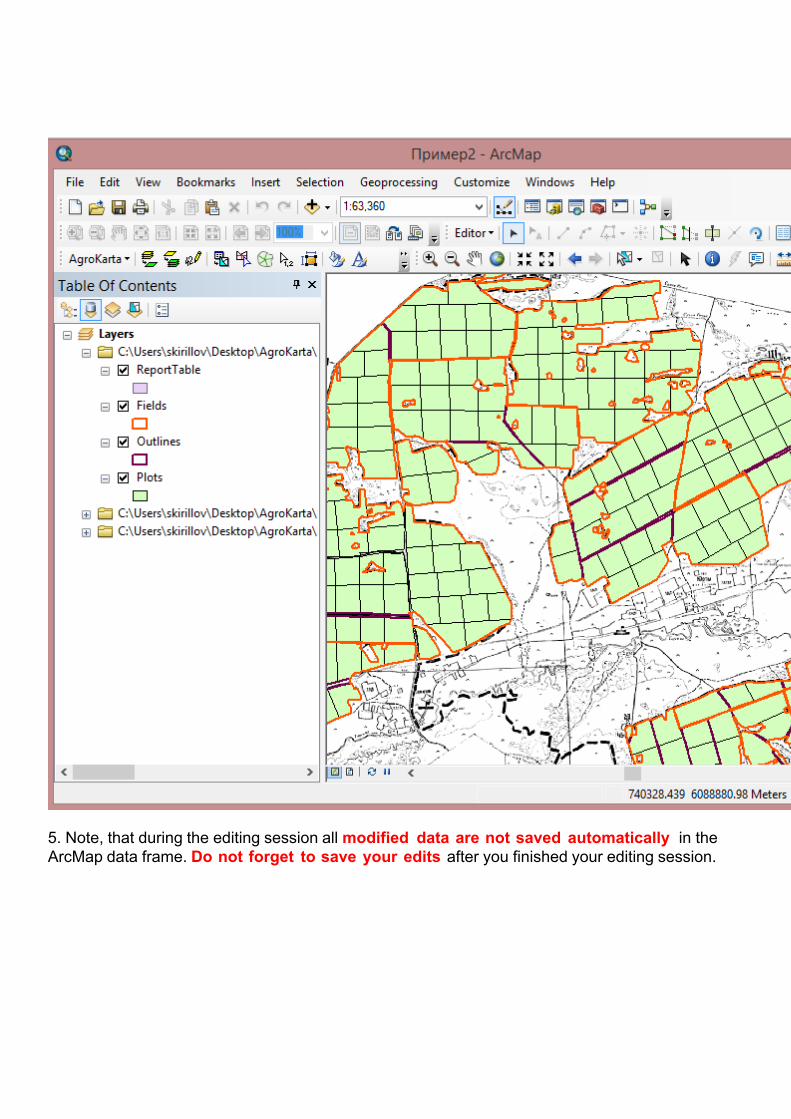
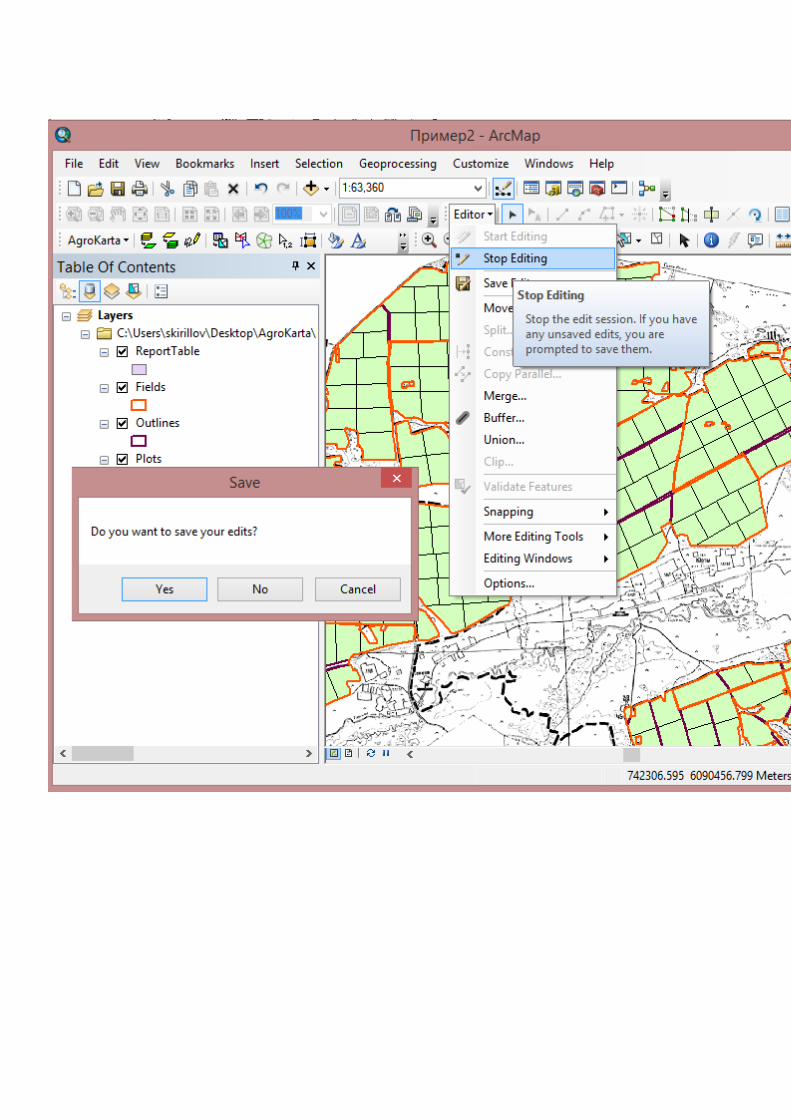
5. Note, that during the editing session all modified data are not saved automatically in the ArcMap data frame. Do not forget to save your edits after you finished your editing session.
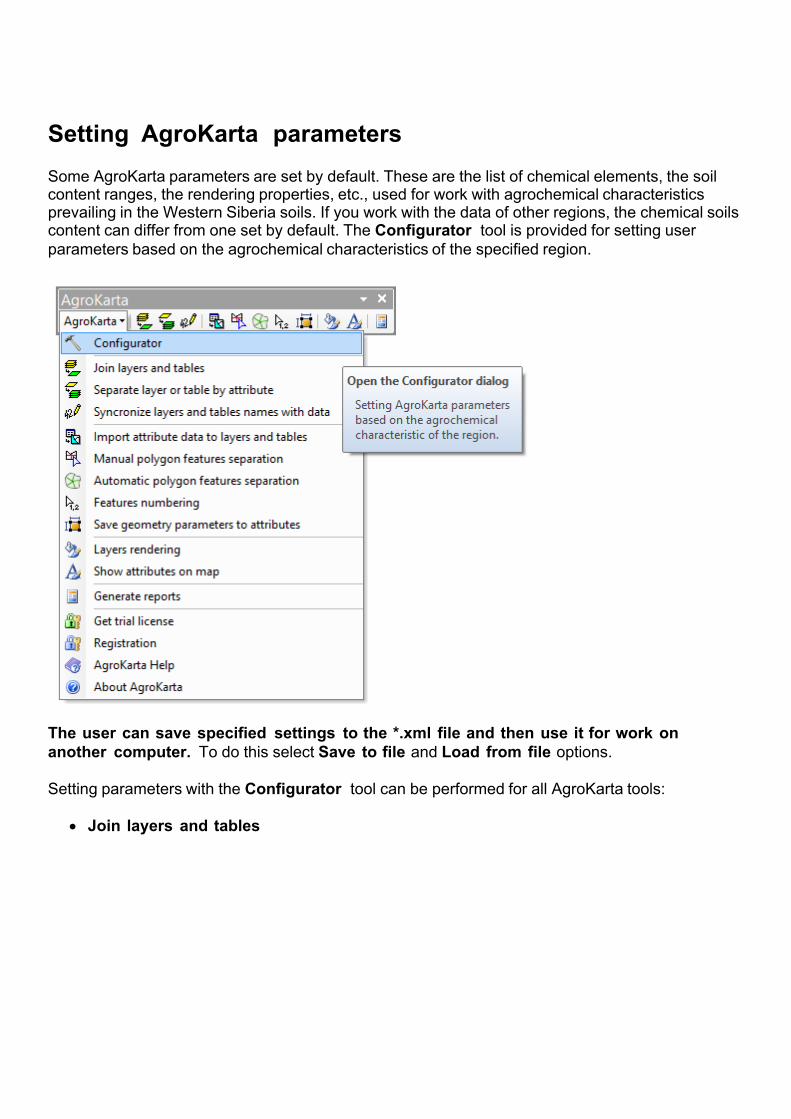
Setting AgroKarta parametersSome AgroKarta parameters are set by default. These are the list of chemical elements, the soil content ranges, the rendering properties, etc., used for work with agrochemical characteristics prevailing in the Western Siberia soils. If you work with the data of other regions, the chemical soils content can differ from one set by default. The Configurator tool is provided for setting user parameters based on the agrochemical characteristics of the specified region.
The user can save specified settings to the *.xml file and then use it for work on another computer. To do this select Save to file and Load from file options. Setting parameters with the Configurator tool can be performed for all AgroKarta tools:
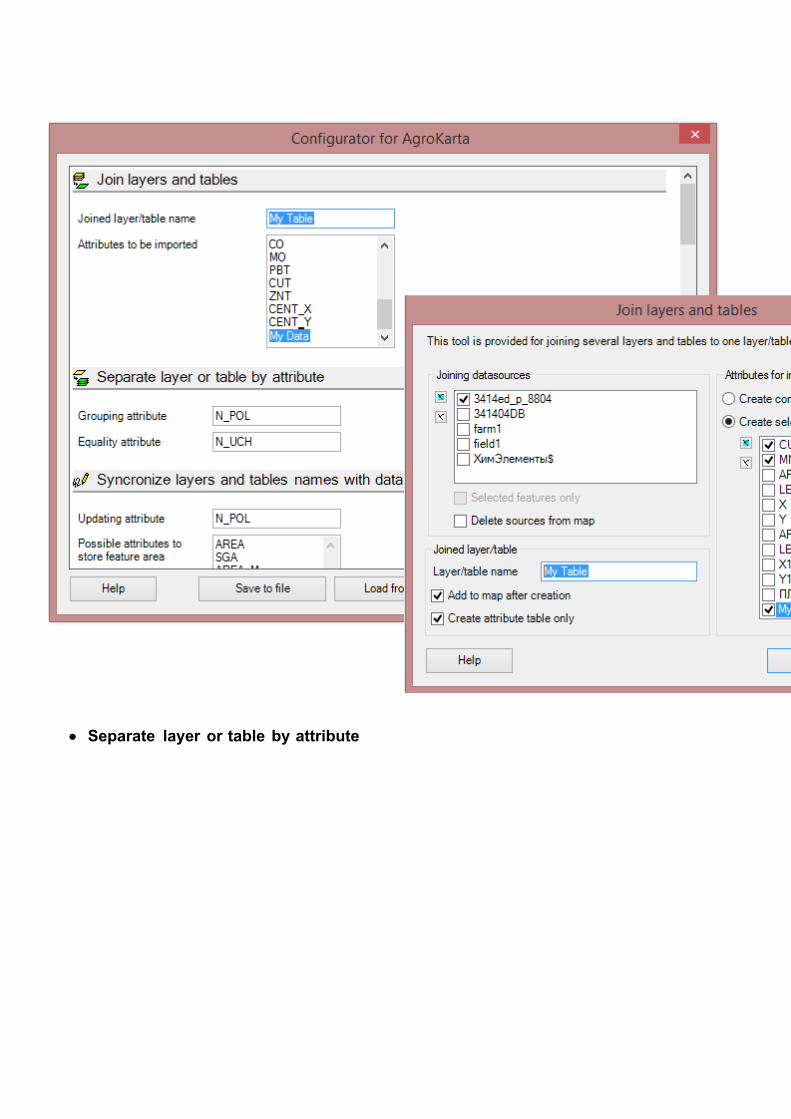
Join layers and tables
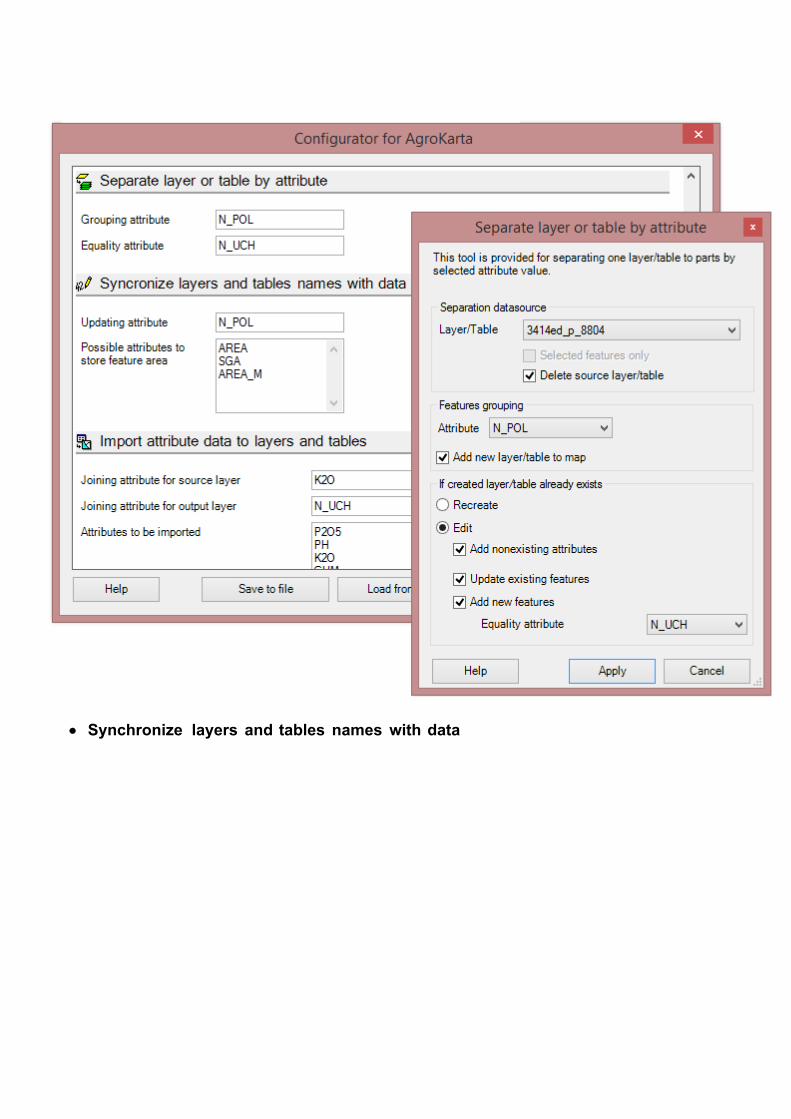
Separate layer or table by attribute
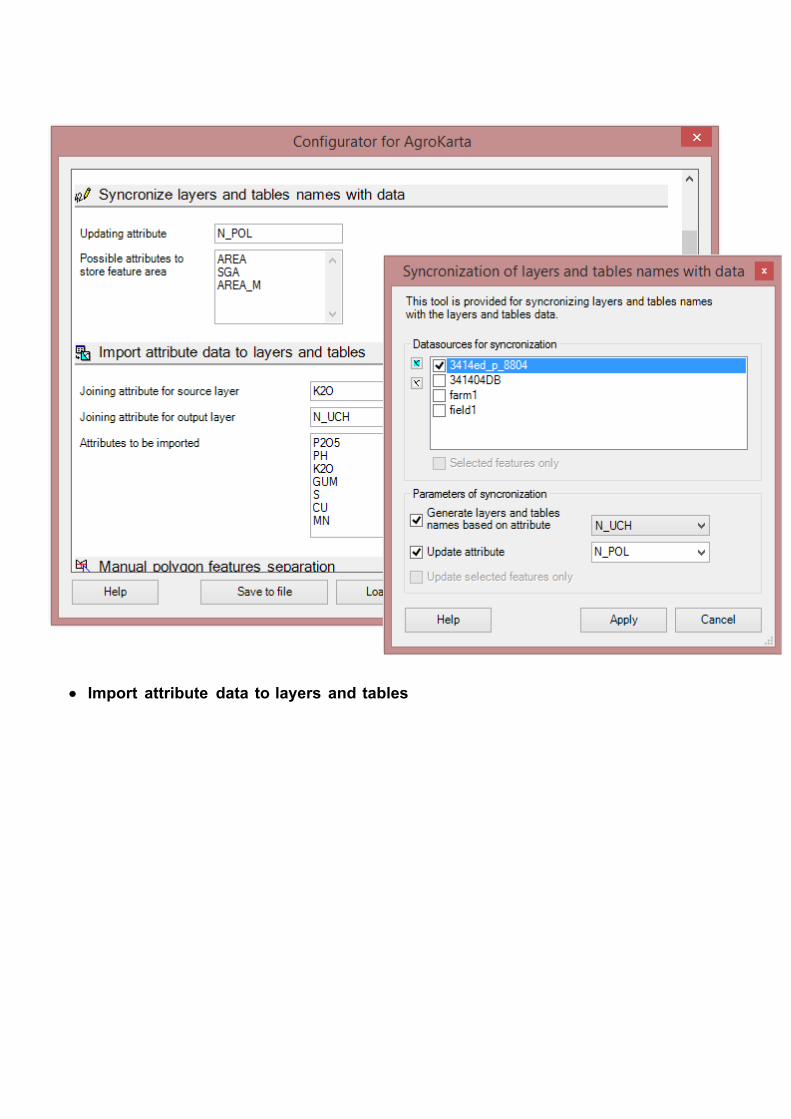
Synchronize layers and tables names with data
Import attribute data to layers and tables
Manual polygon features separation
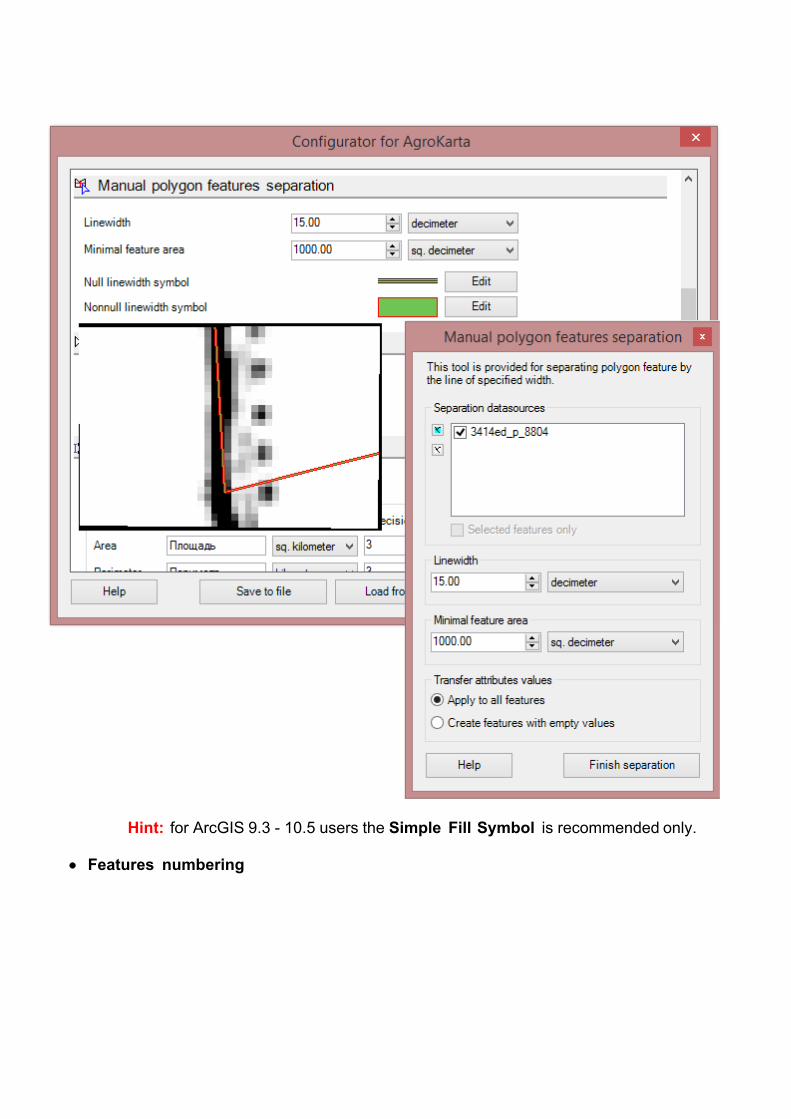
Hint: for ArcGIS 9.3 - 10.5 users the Simple Fill Symbol is recommended only.
Features numbering
Save geometry parameters to attributes
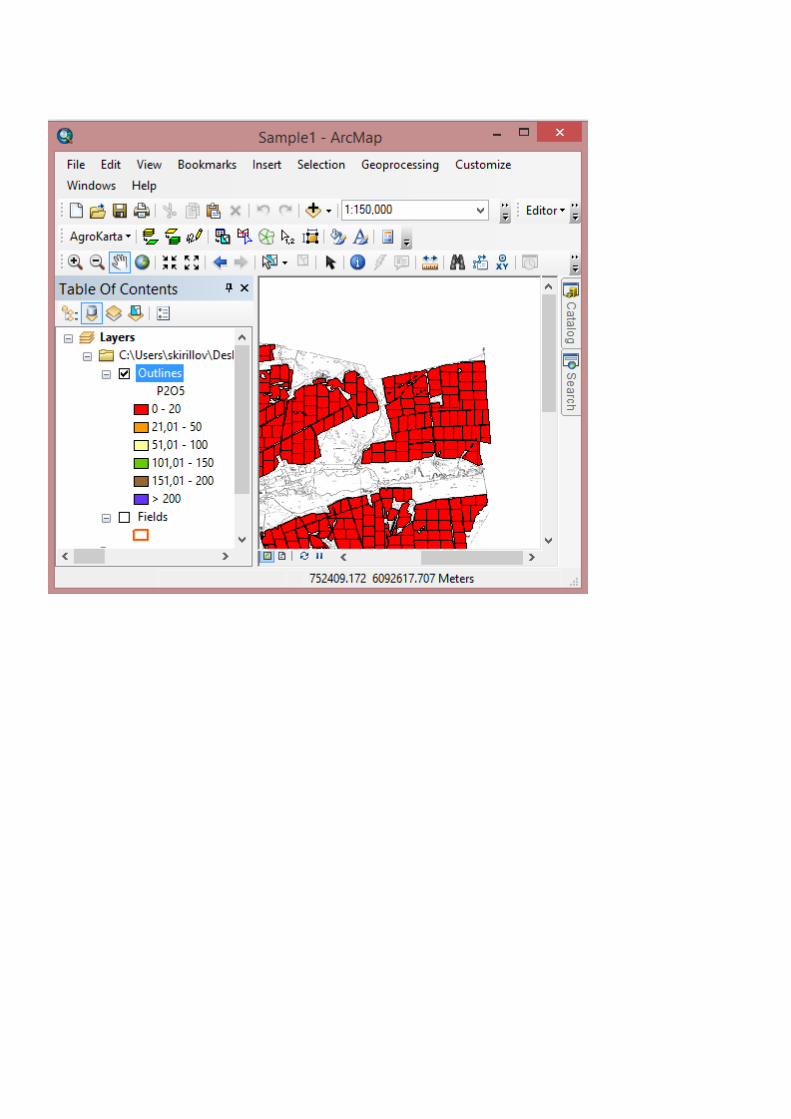
Layers rendering
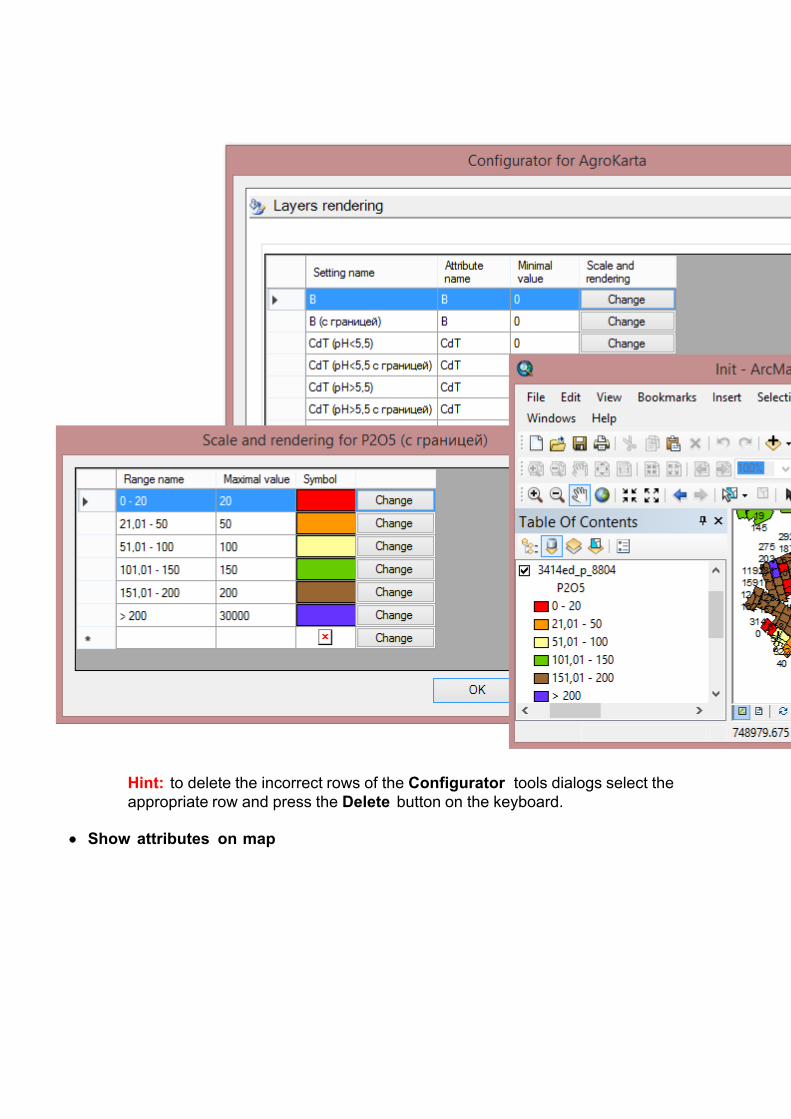
Hint: to delete the incorrect rows of the Configurator tools dialogs select the appropriate row and press the Delete button on the keyboard.
Show attributes on map
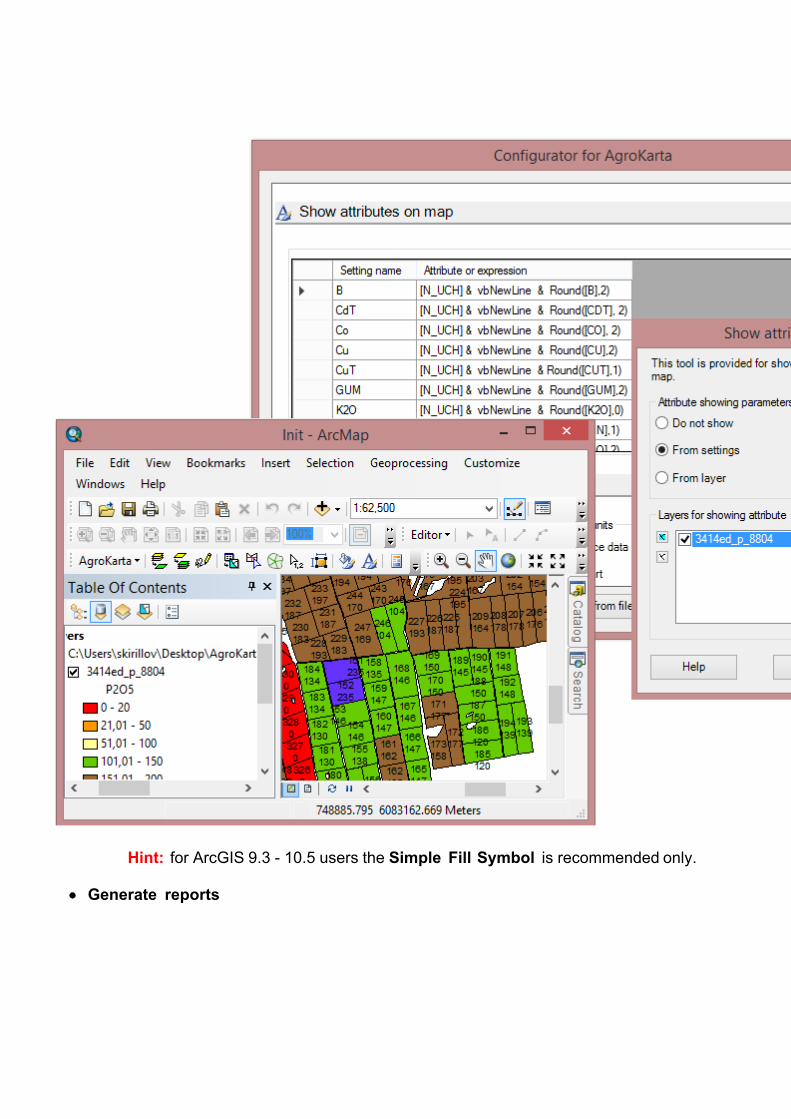
Hint: for ArcGIS 9.3 - 10.5 users the Simple Fill Symbol is recommended only.
Generate reports
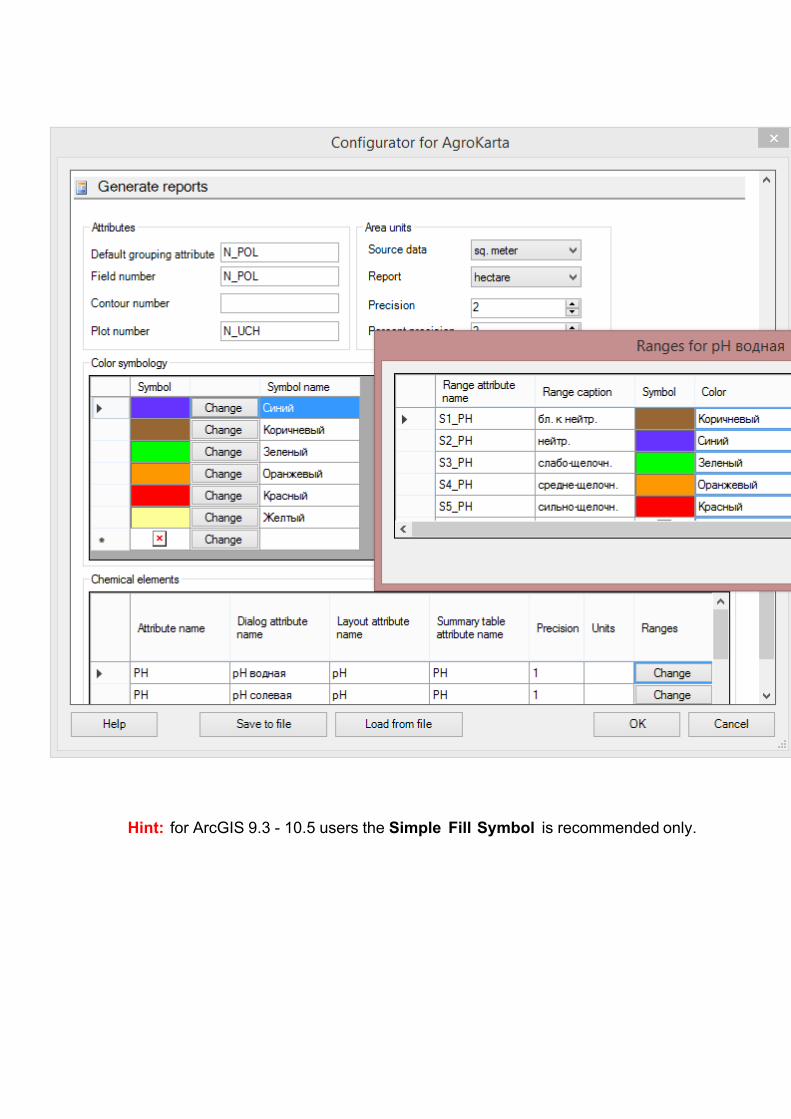
Hint: for ArcGIS 9.3 - 10.5 users the Simple Fill Symbol is recommended only.
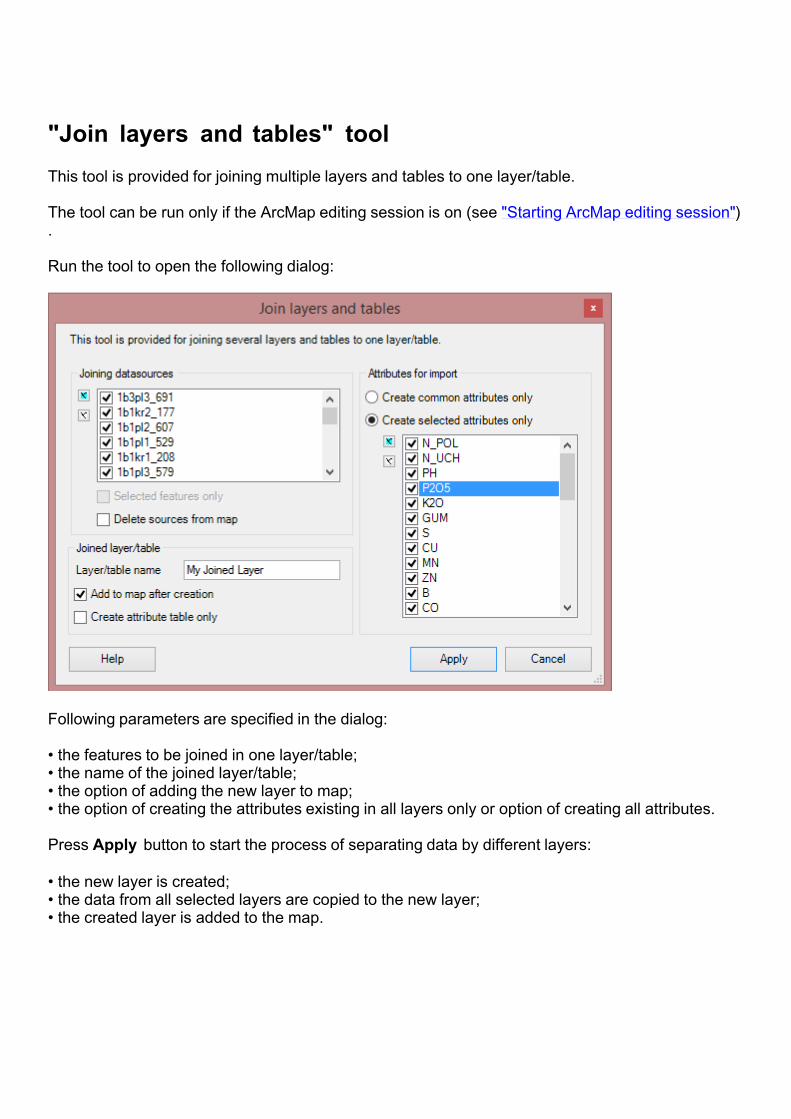
"Join layers and tables" toolThis tool is provided for joining multiple layers and tables to one layer/table. The tool can be run only if the ArcMap editing session is on (see "Starting ArcMap editing session"). Run the tool to open the following dialog:
Following parameters are specified in the dialog: • the features to be joined in one layer/table;• the name of the joined layer/table;• the option of adding the new layer to map;• the option of creating the attributes existing in all layers only or option of creating all attributes. Press Apply button to start the process of separating data by different layers: • the new layer is created;• the data from all selected layers are copied to the new layer;• the created layer is added to the map.
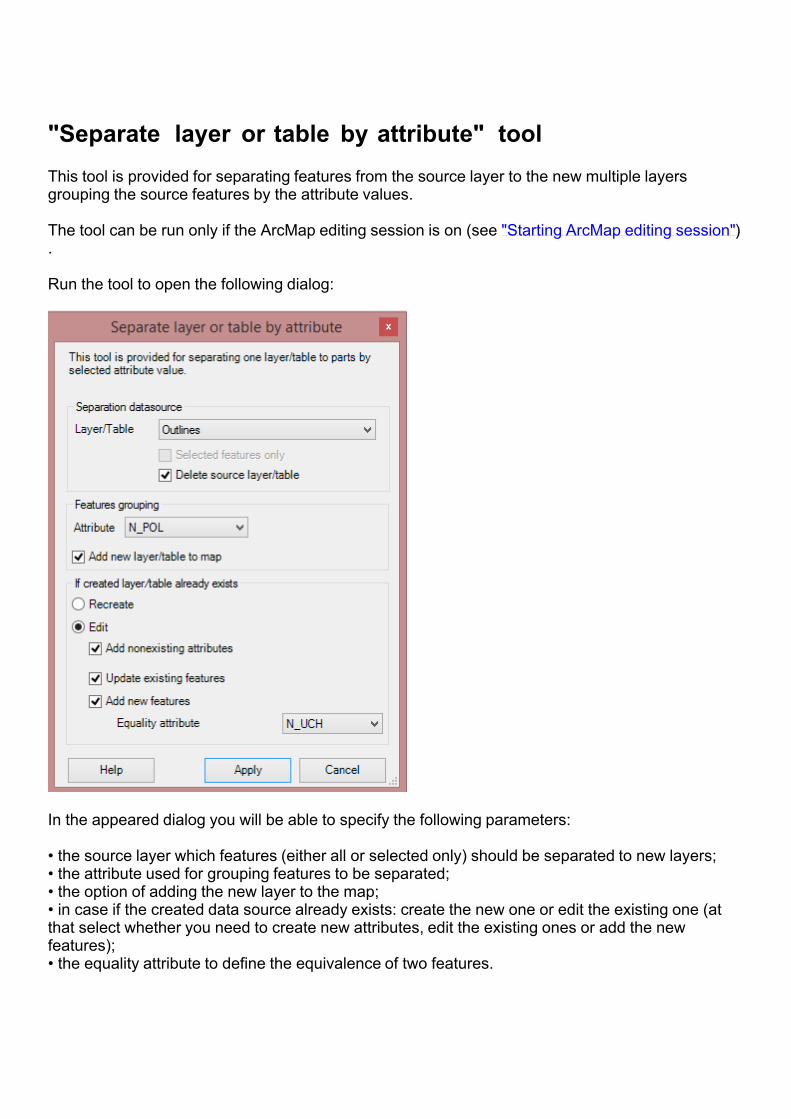
"Separate layer or table by attribute" toolThis tool is provided for separating features from the source layer to the new multiple layers grouping the source features by the attribute values. The tool can be run only if the ArcMap editing session is on (see "Starting ArcMap editing session"). Run the tool to open the following dialog:
In the appeared dialog you will be able to specify the following parameters: • the source layer which features (either all or selected only) should be separated to new layers;• the attribute used for grouping features to be separated;• the option of adding the new layer to the map;• in case if the created data source already exists: create the new one or edit the existing one (at that select whether you need to create new attributes, edit the existing ones or add the new features);• the equality attribute to define the equivalence of two features.
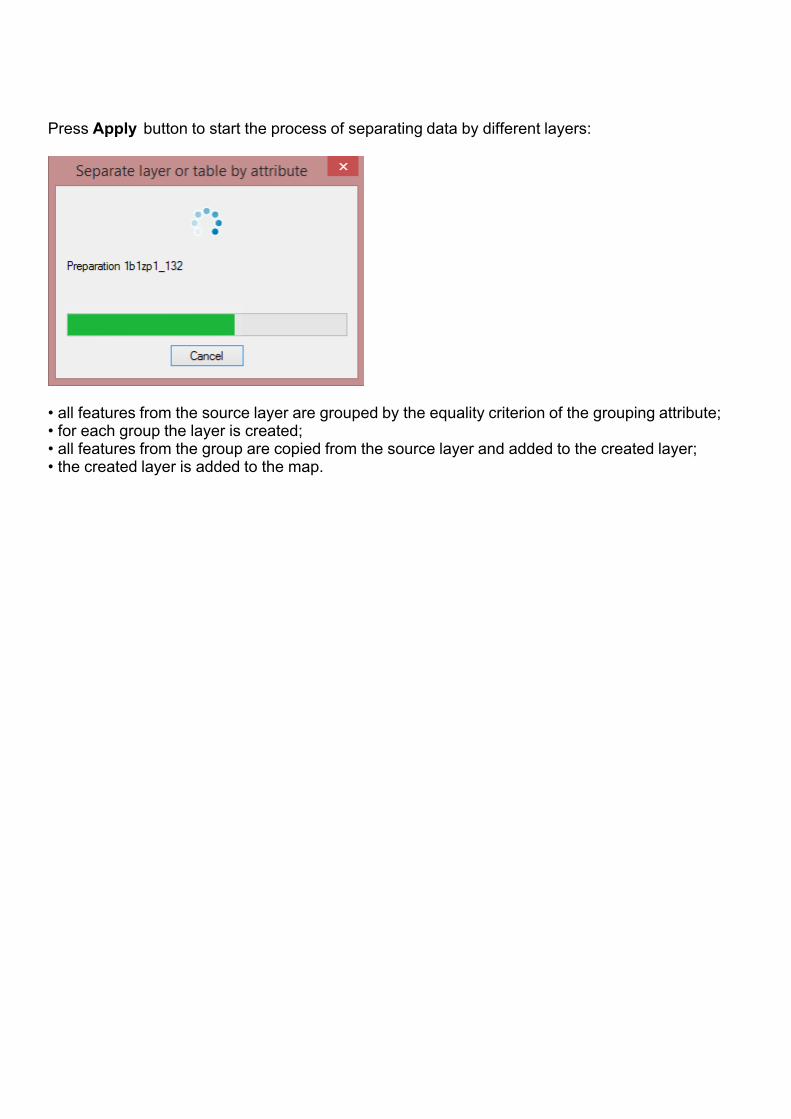
Press Apply button to start the process of separating data by different layers:
• all features from the source layer are grouped by the equality criterion of the grouping attribute;• for each group the layer is created;• all features from the group are copied from the source layer and added to the created layer;• the created layer is added to the map.
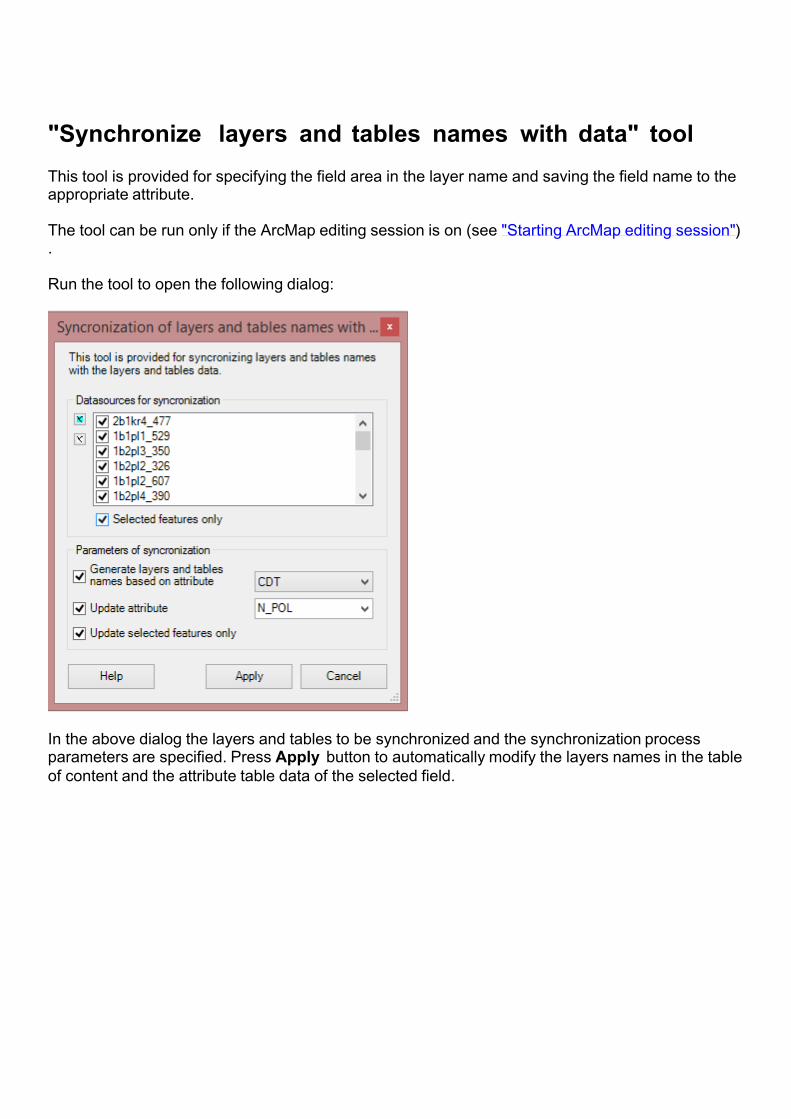
"Synchronize layers and tables names with data" toolThis tool is provided for specifying the field area in the layer name and saving the field name to the appropriate attribute. The tool can be run only if the ArcMap editing session is on (see "Starting ArcMap editing session"). Run the tool to open the following dialog:
In the above dialog the layers and tables to be synchronized and the synchronization process parameters are specified. Press Apply button to automatically modify the layers names in the table of content and the attribute table data of the selected field.

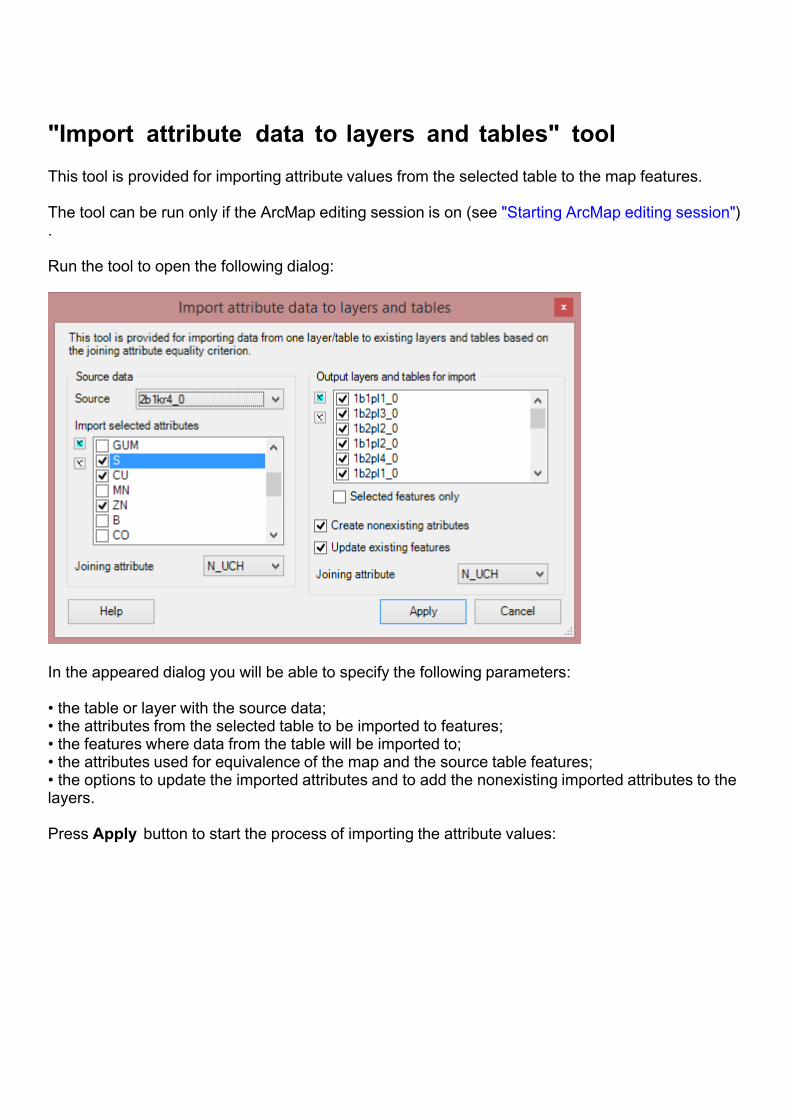
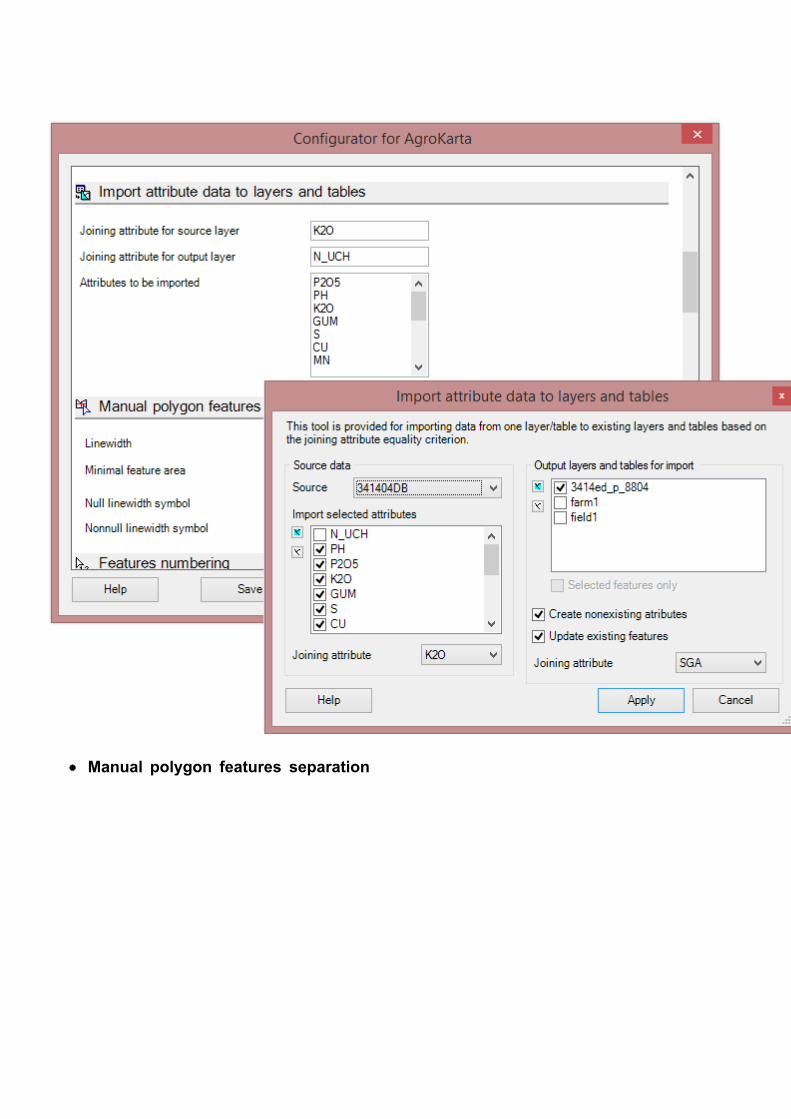
"Import attribute data to layers and tables" toolThis tool is provided for importing attribute values from the selected table to the map features. The tool can be run only if the ArcMap editing session is on (see "Starting ArcMap editing session"). Run the tool to open the following dialog:
In the appeared dialog you will be able to specify the following parameters: • the table or layer with the source data;• the attributes from the selected table to be imported to features;• the features where data from the table will be imported to;• the attributes used for equivalence of the map and the source table features;• the options to update the imported attributes and to add the nonexisting imported attributes to the layers. Press Apply button to start the process of importing the attribute values:
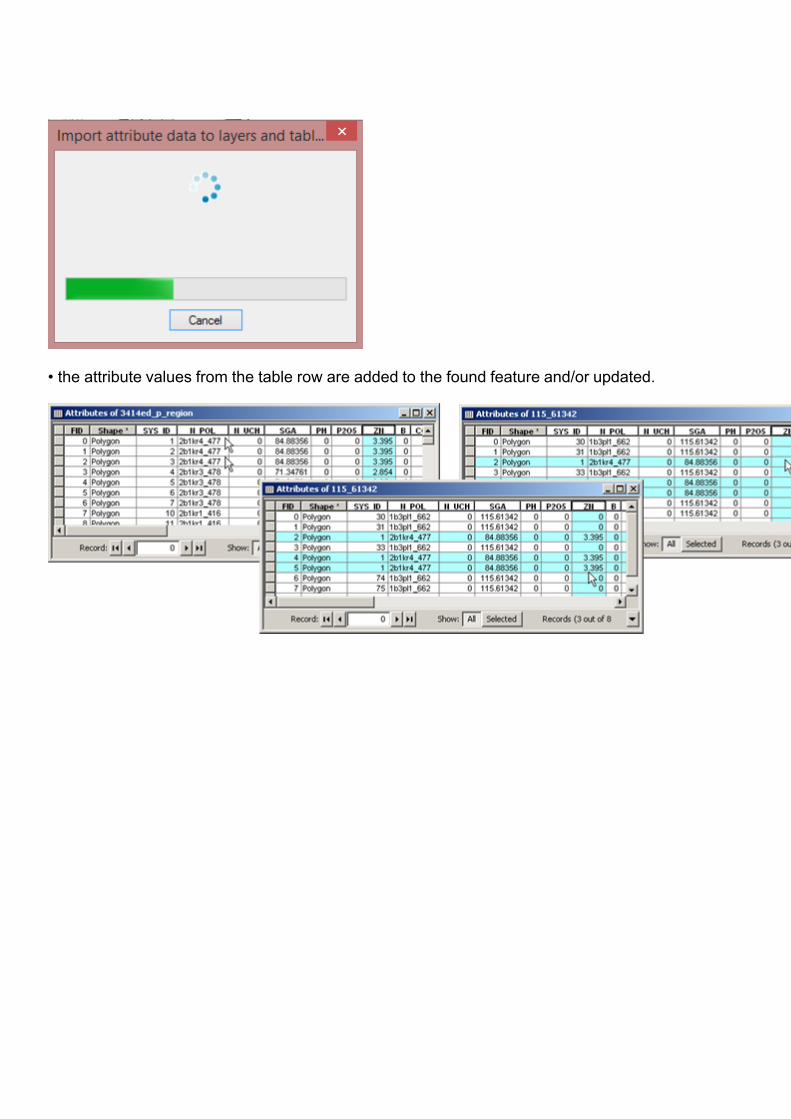
• the attribute values from the table row are added to the found feature and/or updated.
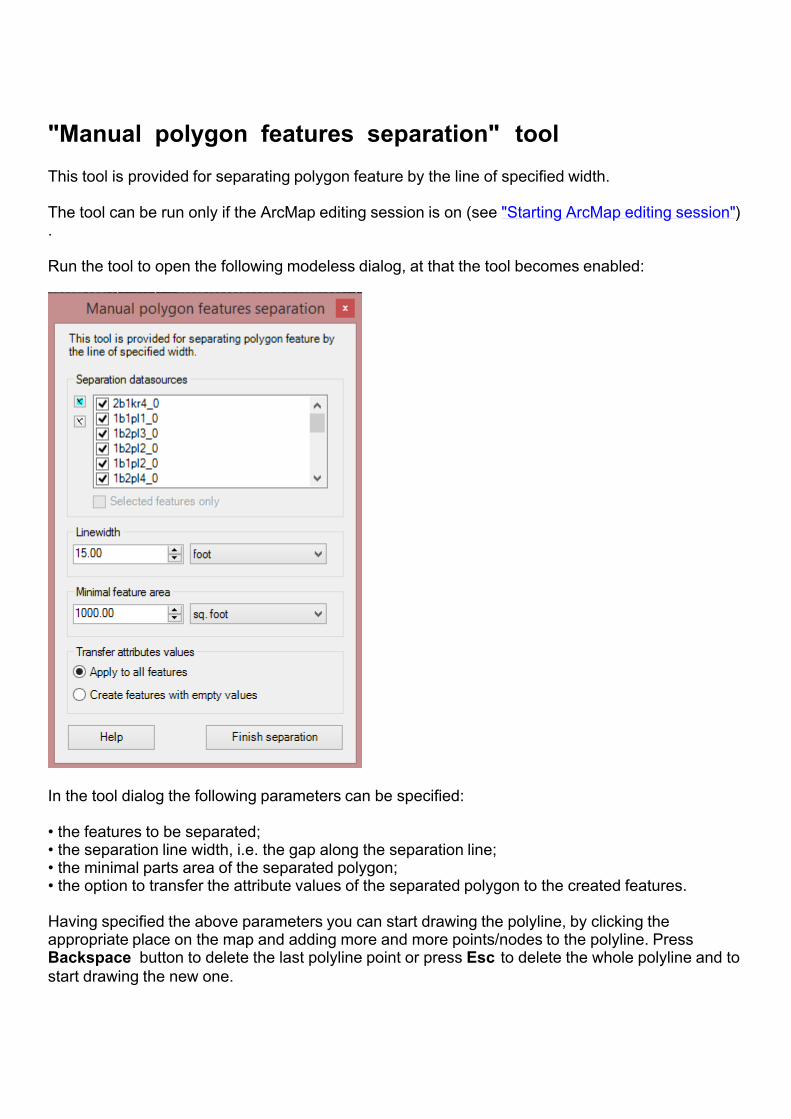
"Manual polygon features separation" toolThis tool is provided for separating polygon feature by the line of specified width. The tool can be run only if the ArcMap editing session is on (see "Starting ArcMap editing session"). Run the tool to open the following modeless dialog, at that the tool becomes enabled:
In the tool dialog the following parameters can be specified: • the features to be separated;• the separation line width, i.e. the gap along the separation line;• the minimal parts area of the separated polygon;• the option to transfer the attribute values of the separated polygon to the created features. Having specified the above parameters you can start drawing the polyline, by clicking the appropriate place on the map and adding more and more points/nodes to the polyline. Press Backspace button to delete the last polyline point or press Esc to delete the whole polyline and to start drawing the new one.
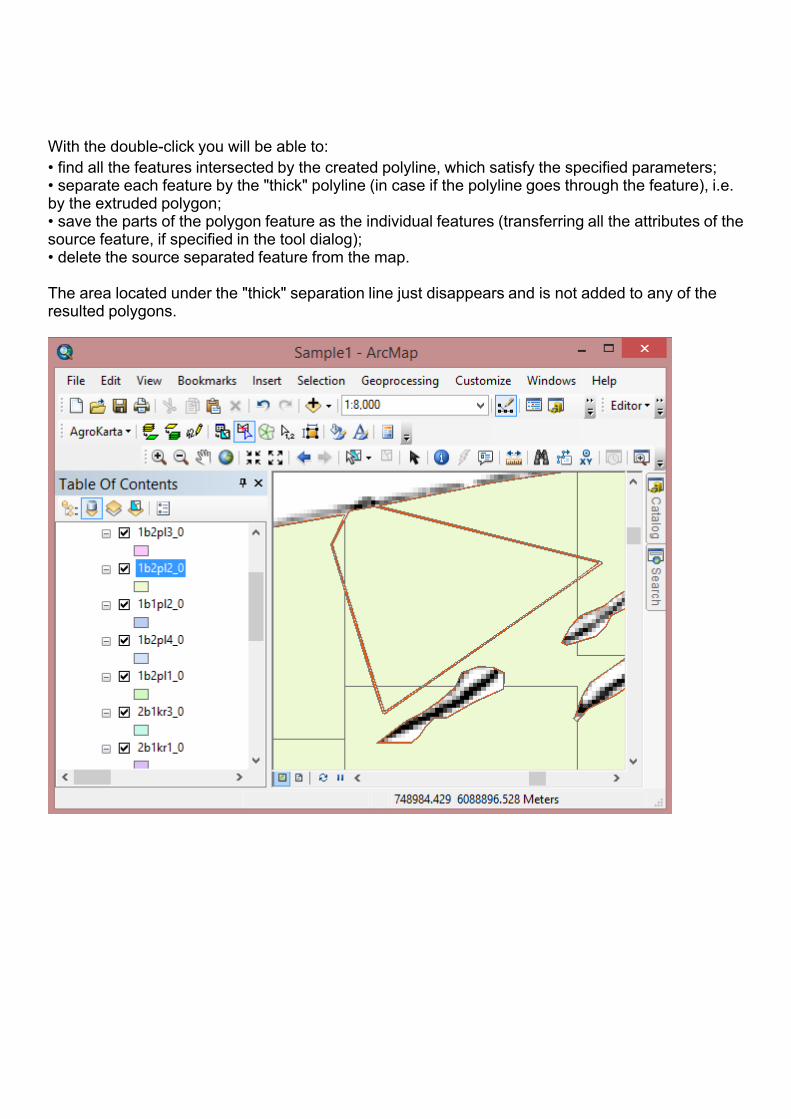
With the double-click you will be able to:• find all the features intersected by the created polyline, which satisfy the specified parameters;• separate each feature by the "thick" polyline (in case if the polyline goes through the feature), i.e. by the extruded polygon;• save the parts of the polygon feature as the individual features (transferring all the attributes of the source feature, if specified in the tool dialog);• delete the source separated feature from the map. The area located under the "thick" separation line just disappears and is not added to any of the resulted polygons.
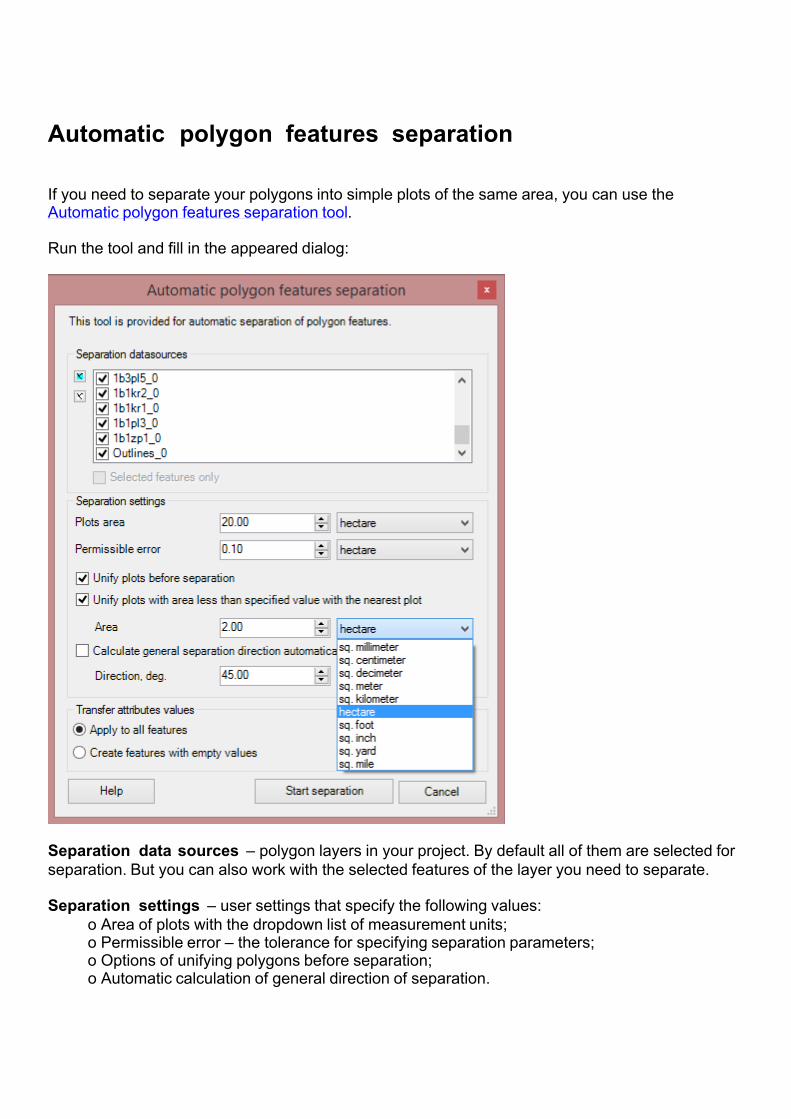
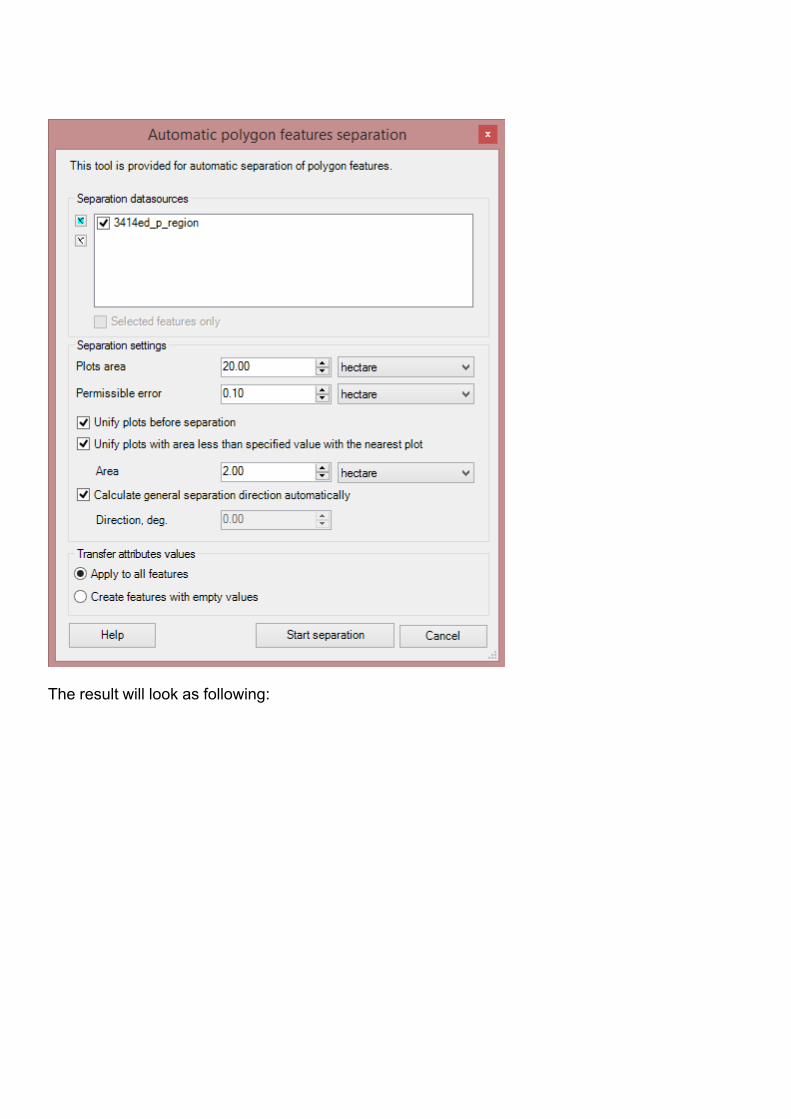
Automatic polygon features separation If you need to separate your polygons into simple plots of the same area, you can use the Automatic polygon features separation tool. Run the tool and fill in the appeared dialog:
Separation data sources – polygon layers in your project. By default all of them are selected for separation. But you can also work with the selected features of the layer you need to separate. Separation settings – user settings that specify the following values:
o Area of plots with the dropdown list of measurement units;o Permissible error – the tolerance for specifying separation parameters;o Options of unifying polygons before separation;o Automatic calculation of general direction of separation.
Transfer attributes values:
o Apply to all features – an option provided for transferring the source attribute table values to the output polygons;o Create features with empty values: if you enable this option, then the attribute tables of the selected layers will be empty.
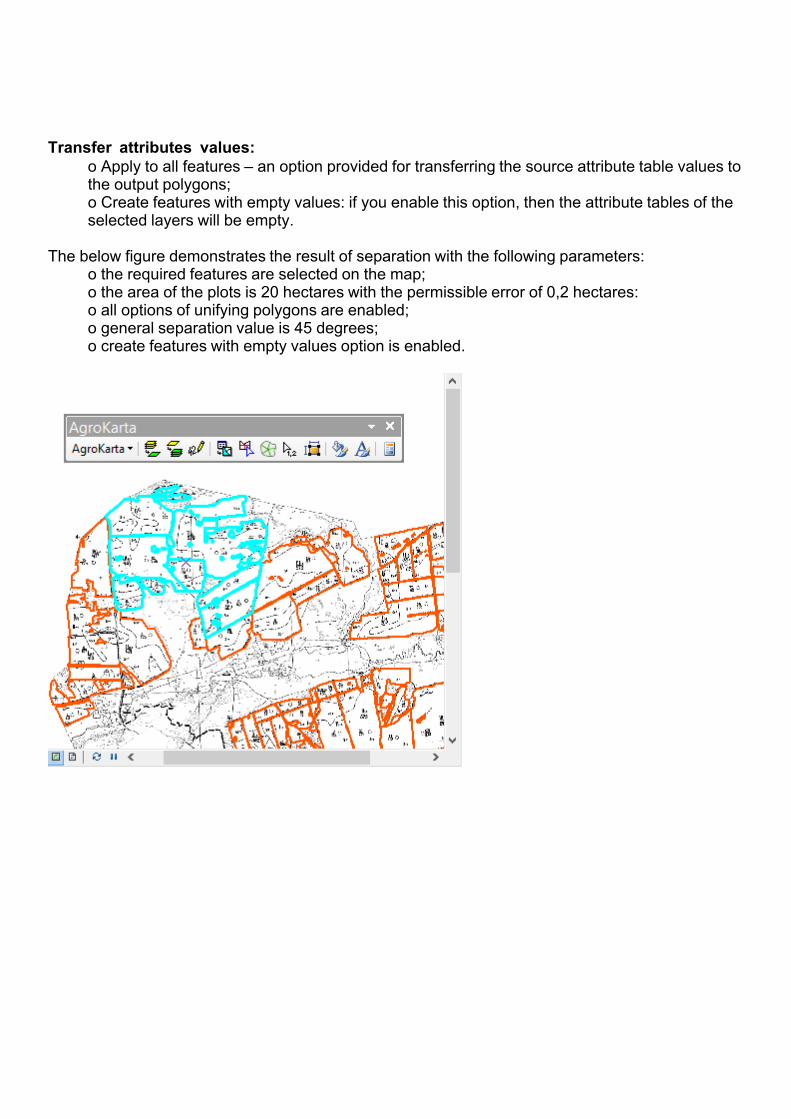
The below figure demonstrates the result of separation with the following parameters:
o the required features are selected on the map;o the area of the plots is 20 hectares with the permissible error of 0,2 hectares:o all options of unifying polygons are enabled;o general separation value is 45 degrees;o create features with empty values option is enabled.
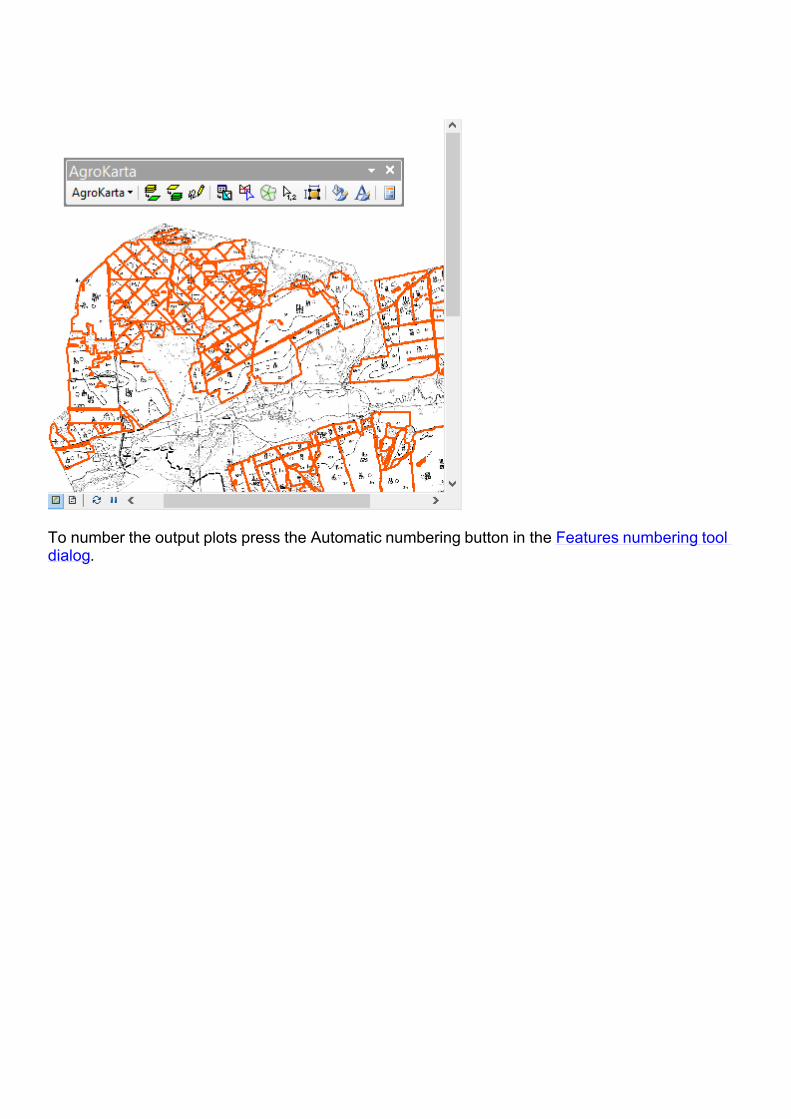
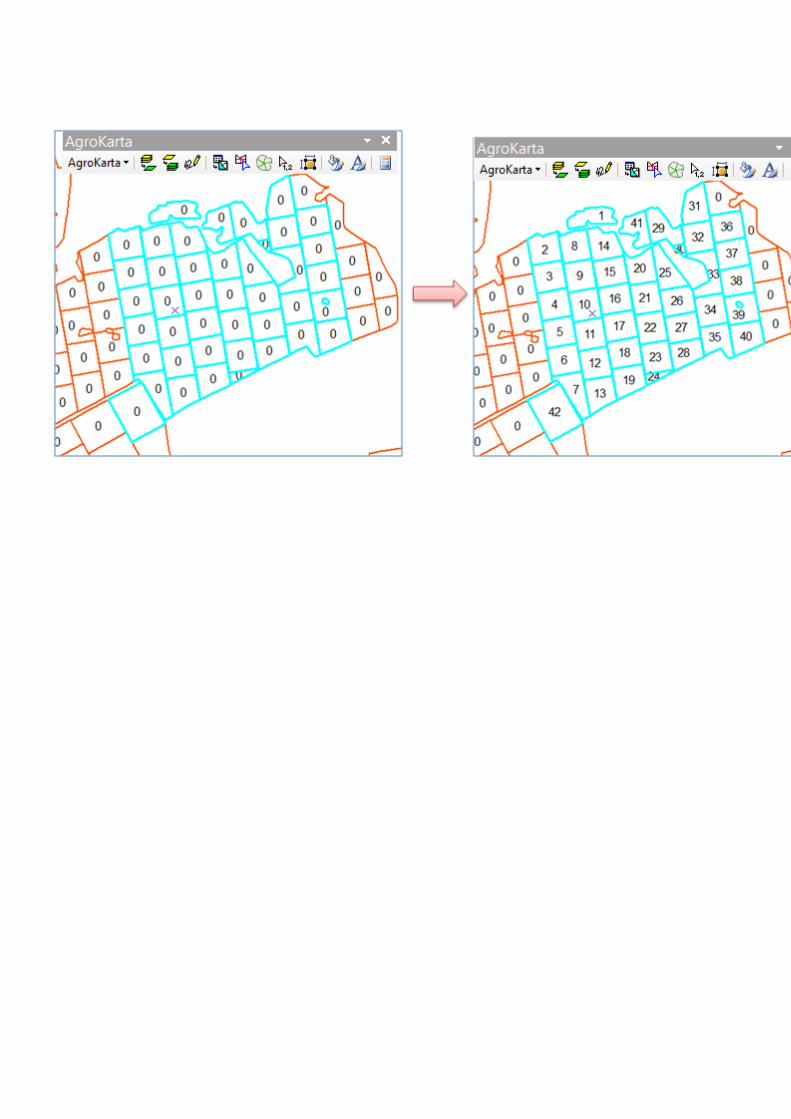
To number the output plots press the Automatic numbering button in the Features numbering tool dialog.
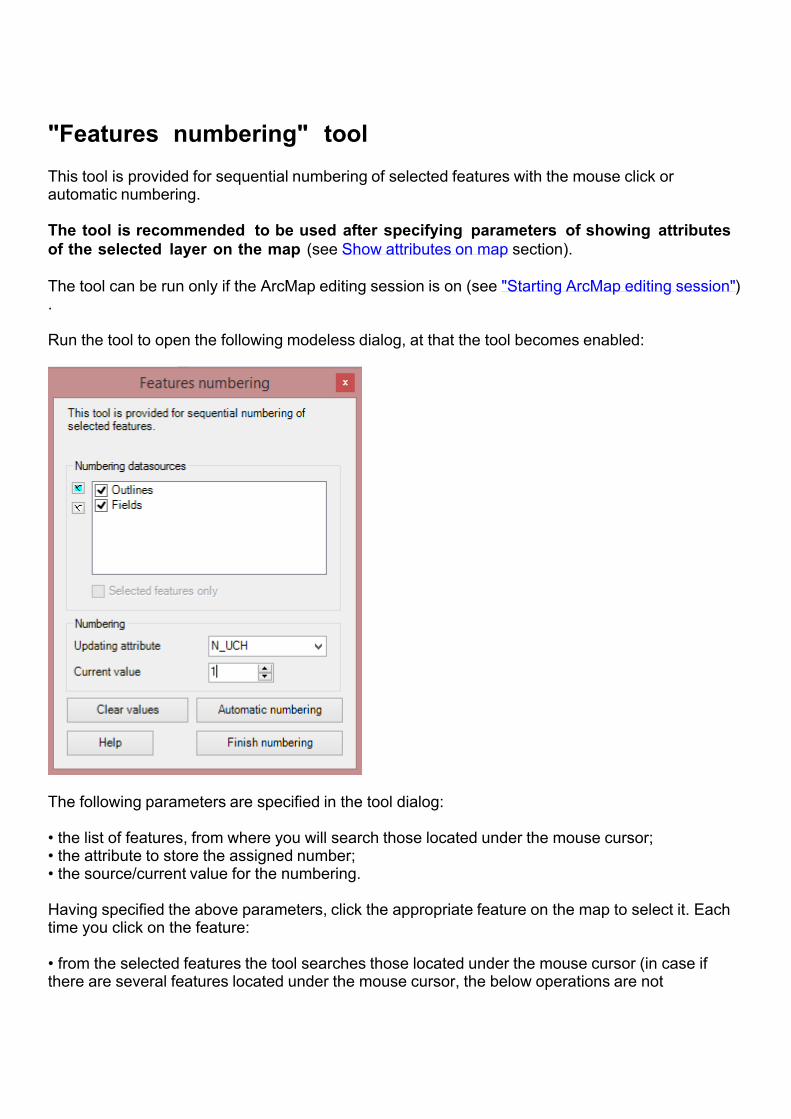
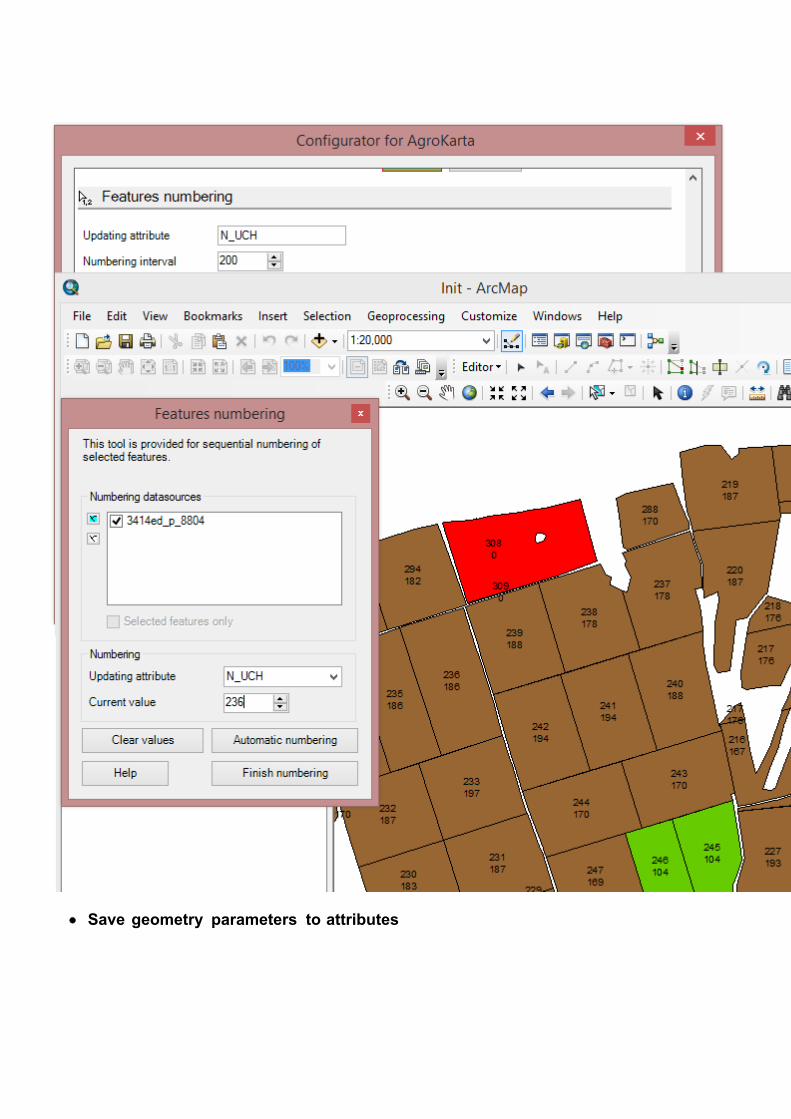
"Features numbering" toolThis tool is provided for sequential numbering of selected features with the mouse click or automatic numbering. The tool is recommended to be used after specifying parameters of showing attributes of the selected layer on the map (see Show attributes on map section). The tool can be run only if the ArcMap editing session is on (see "Starting ArcMap editing session"). Run the tool to open the following modeless dialog, at that the tool becomes enabled:
The following parameters are specified in the tool dialog: • the list of features, from where you will search those located under the mouse cursor;• the attribute to store the assigned number;• the source/current value for the numbering. Having specified the above parameters, click the appropriate feature on the map to select it. Each time you click on the feature: • from the selected features the tool searches those located under the mouse cursor (in case if there are several features located under the mouse cursor, the below operations are not
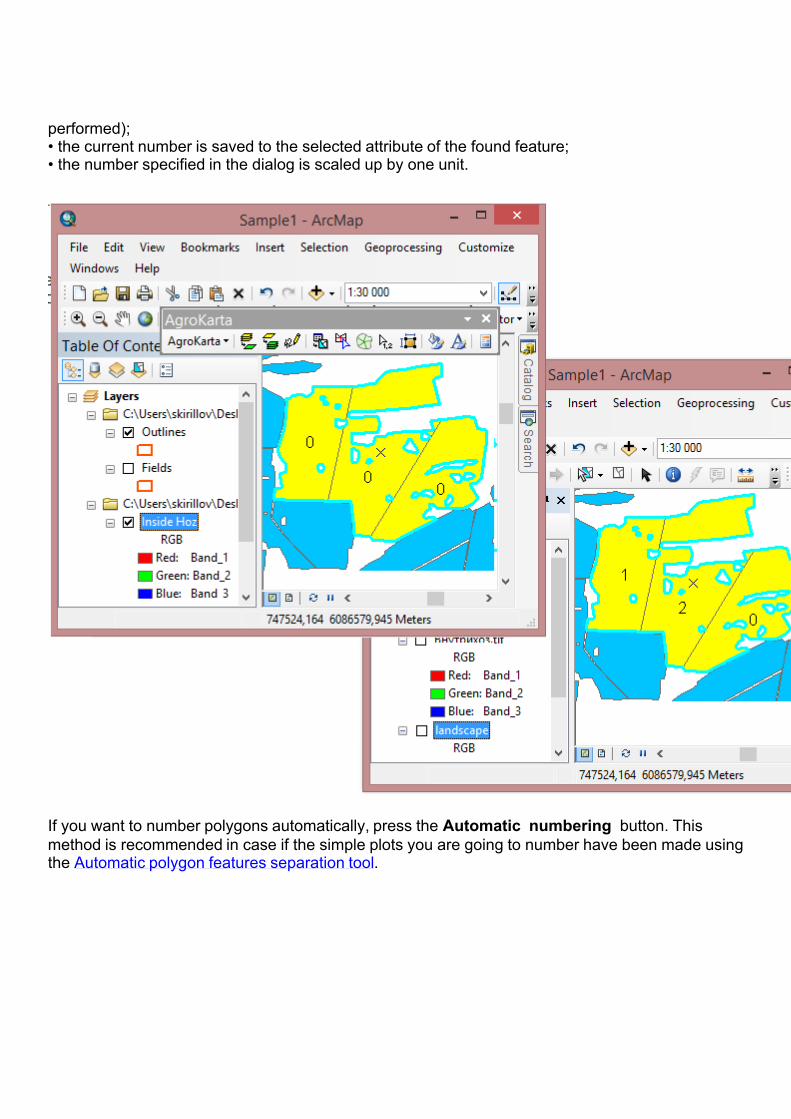
performed);• the current number is saved to the selected attribute of the found feature;• the number specified in the dialog is scaled up by one unit.
If you want to number polygons automatically, press the Automatic numbering button. This method is recommended in case if the simple plots you are going to number have been made using the Automatic polygon features separation tool.
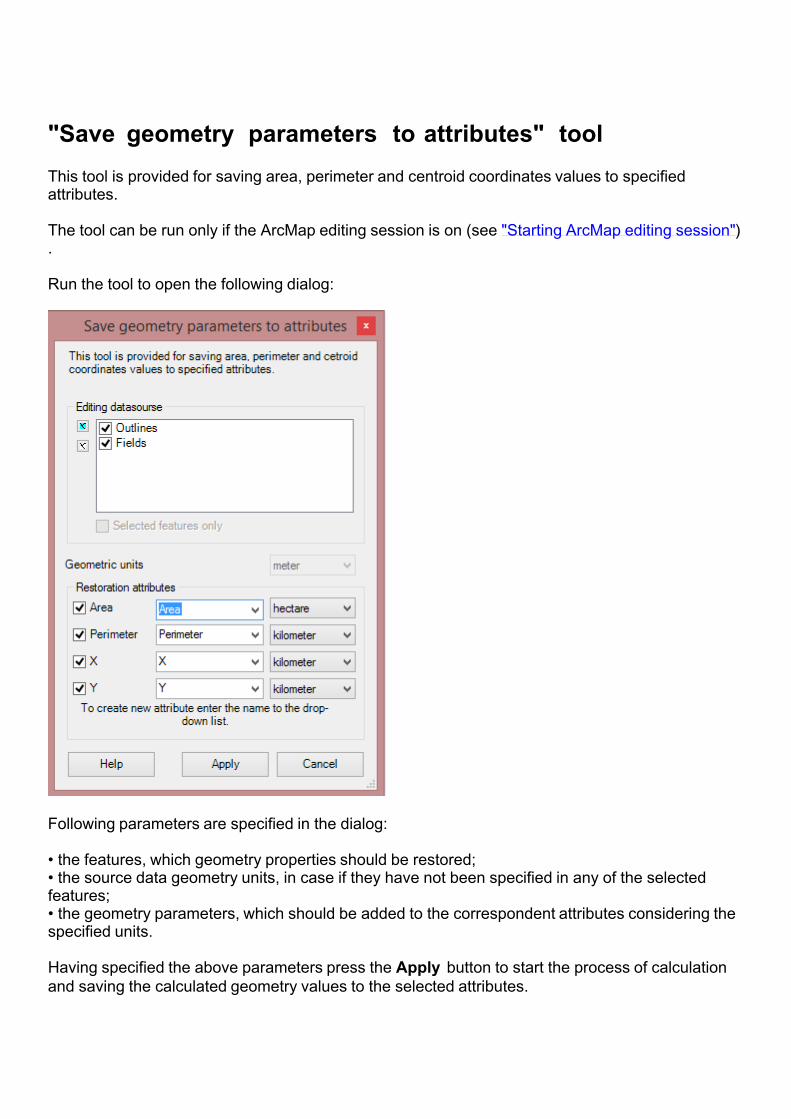
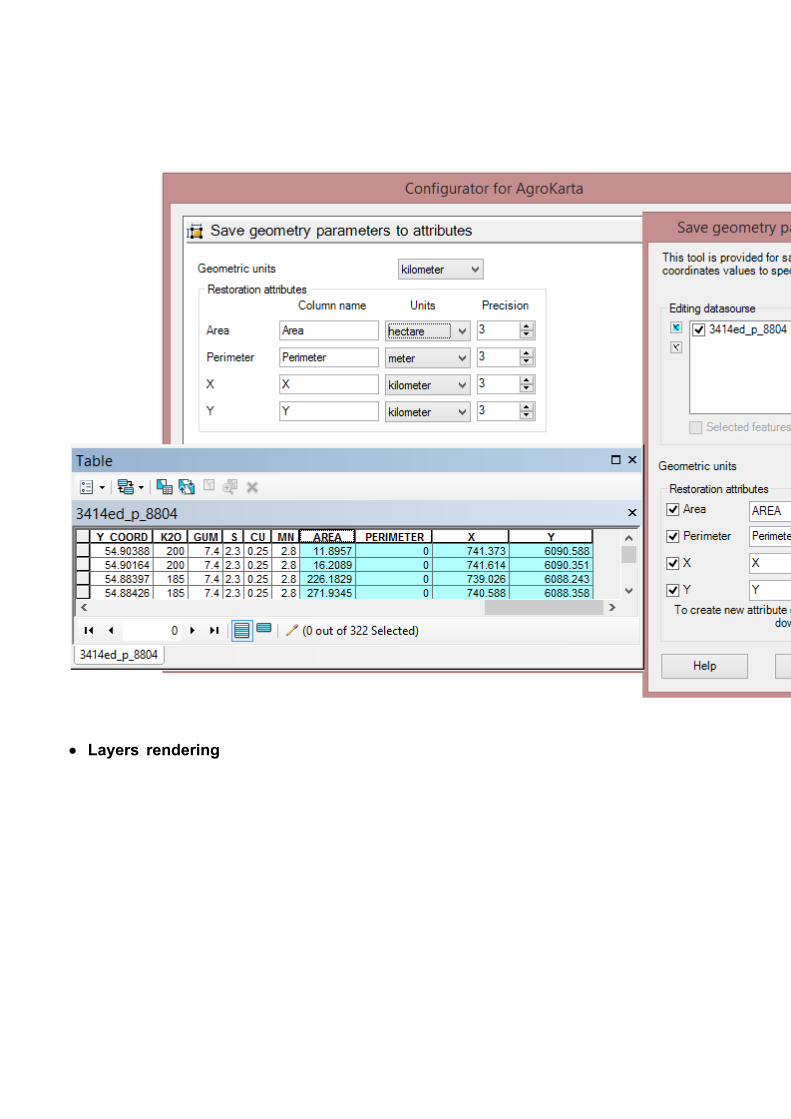
"Save geometry parameters to attributes" toolThis tool is provided for saving area, perimeter and centroid coordinates values to specified attributes. The tool can be run only if the ArcMap editing session is on (see "Starting ArcMap editing session"). Run the tool to open the following dialog:
Following parameters are specified in the dialog: • the features, which geometry properties should be restored;• the source data geometry units, in case if they have not been specified in any of the selected features;• the geometry parameters, which should be added to the correspondent attributes considering the specified units. Having specified the above parameters press the Apply button to start the process of calculation and saving the calculated geometry values to the selected attributes.
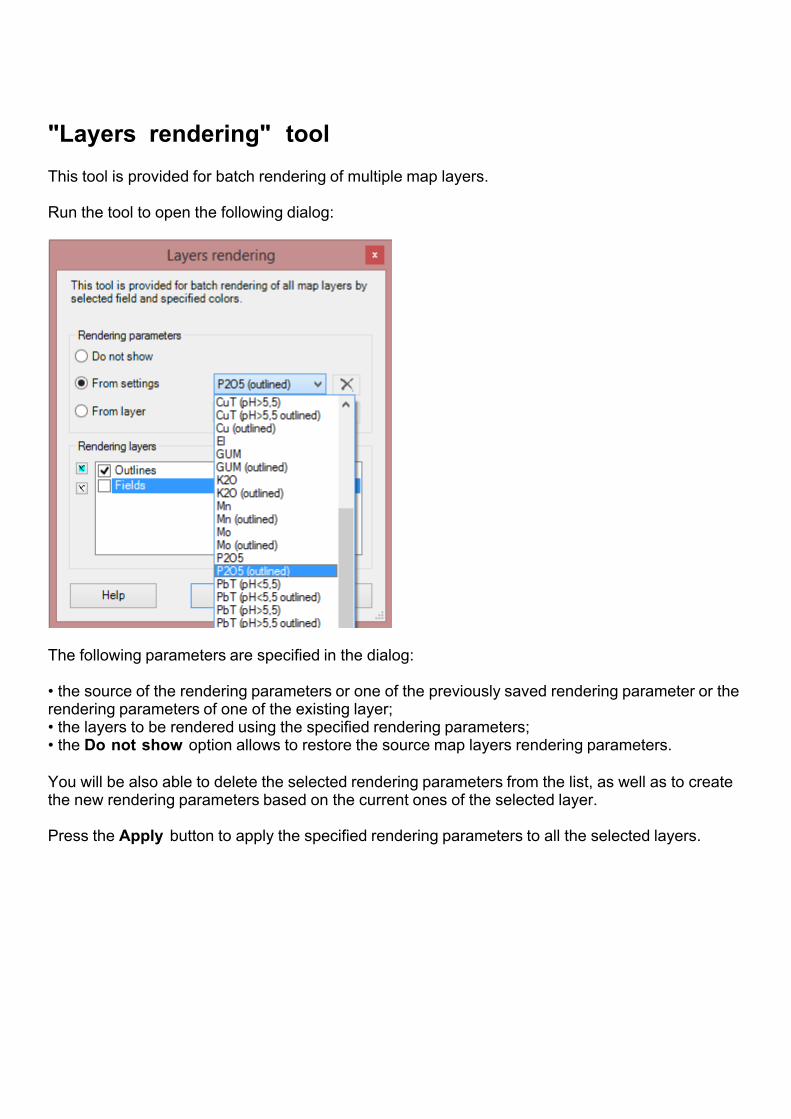
"Layers rendering" toolThis tool is provided for batch rendering of multiple map layers. Run the tool to open the following dialog:
The following parameters are specified in the dialog: • the source of the rendering parameters or one of the previously saved rendering parameter or the rendering parameters of one of the existing layer;• the layers to be rendered using the specified rendering parameters;• the Do not show option allows to restore the source map layers rendering parameters. You will be also able to delete the selected rendering parameters from the list, as well as to create the new rendering parameters based on the current ones of the selected layer. Press the Apply button to apply the specified rendering parameters to all the selected layers.
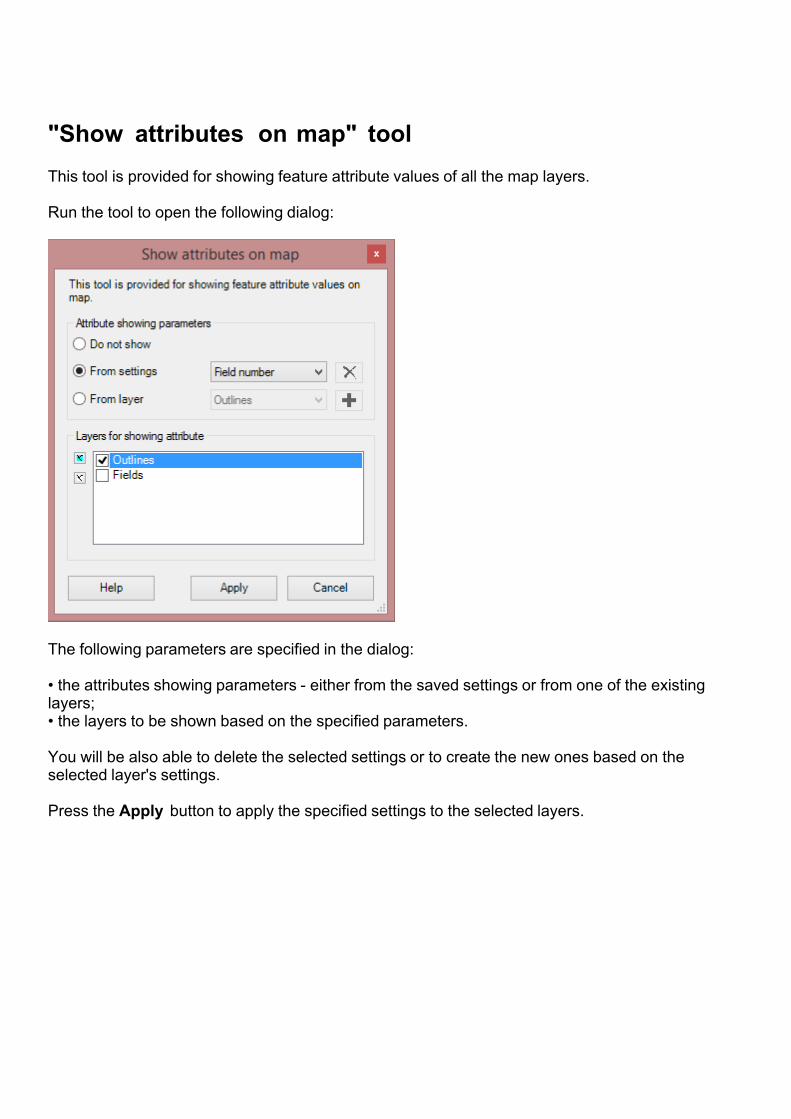
"Show attributes on map" toolThis tool is provided for showing feature attribute values of all the map layers. Run the tool to open the following dialog:
The following parameters are specified in the dialog: • the attributes showing parameters - either from the saved settings or from one of the existing layers;• the layers to be shown based on the specified parameters. You will be also able to delete the selected settings or to create the new ones based on the selected layer's settings. Press the Apply button to apply the specified settings to the selected layers.
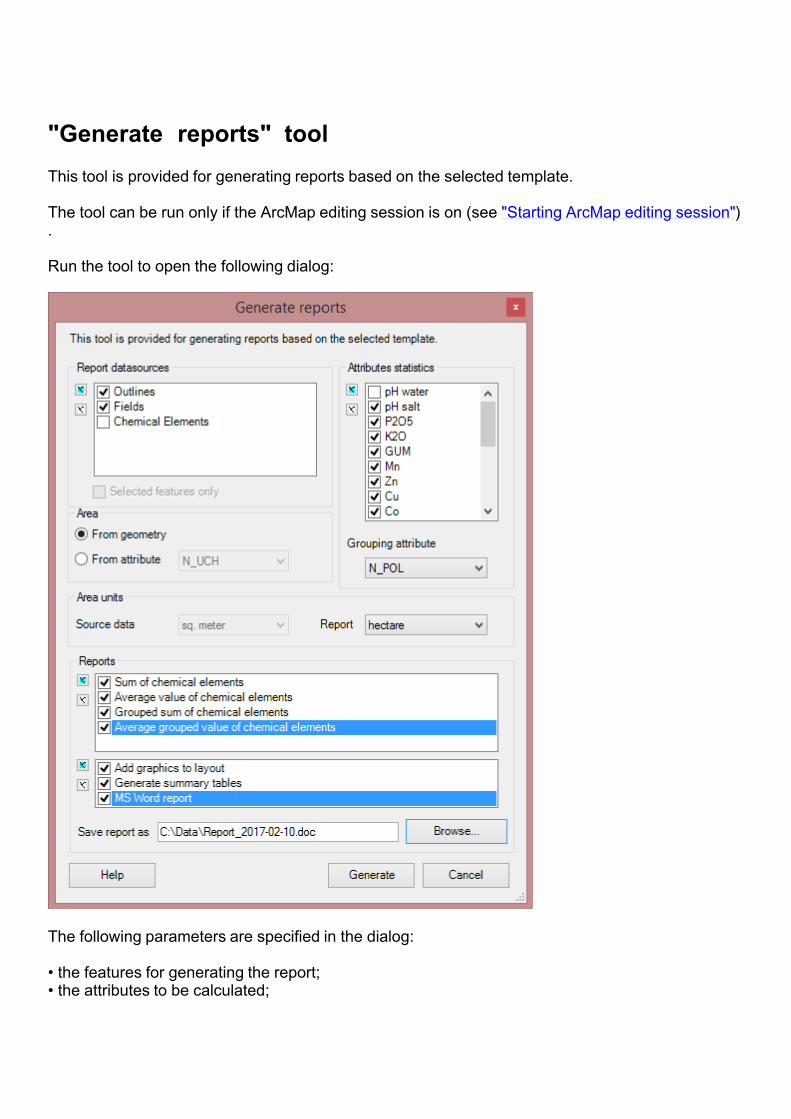
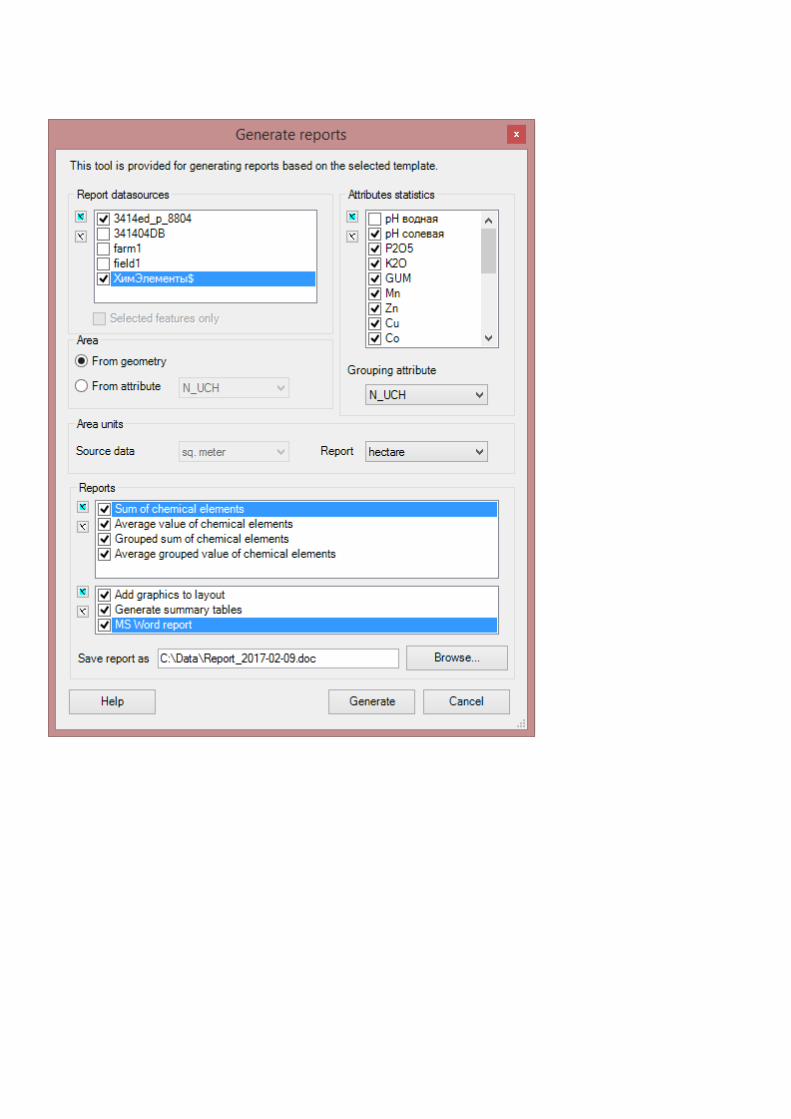
"Generate reports" toolThis tool is provided for generating reports based on the selected template. The tool can be run only if the ArcMap editing session is on (see "Starting ArcMap editing session"). Run the tool to open the following dialog:
The following parameters are specified in the dialog: • the features for generating the report;• the attributes to be calculated;
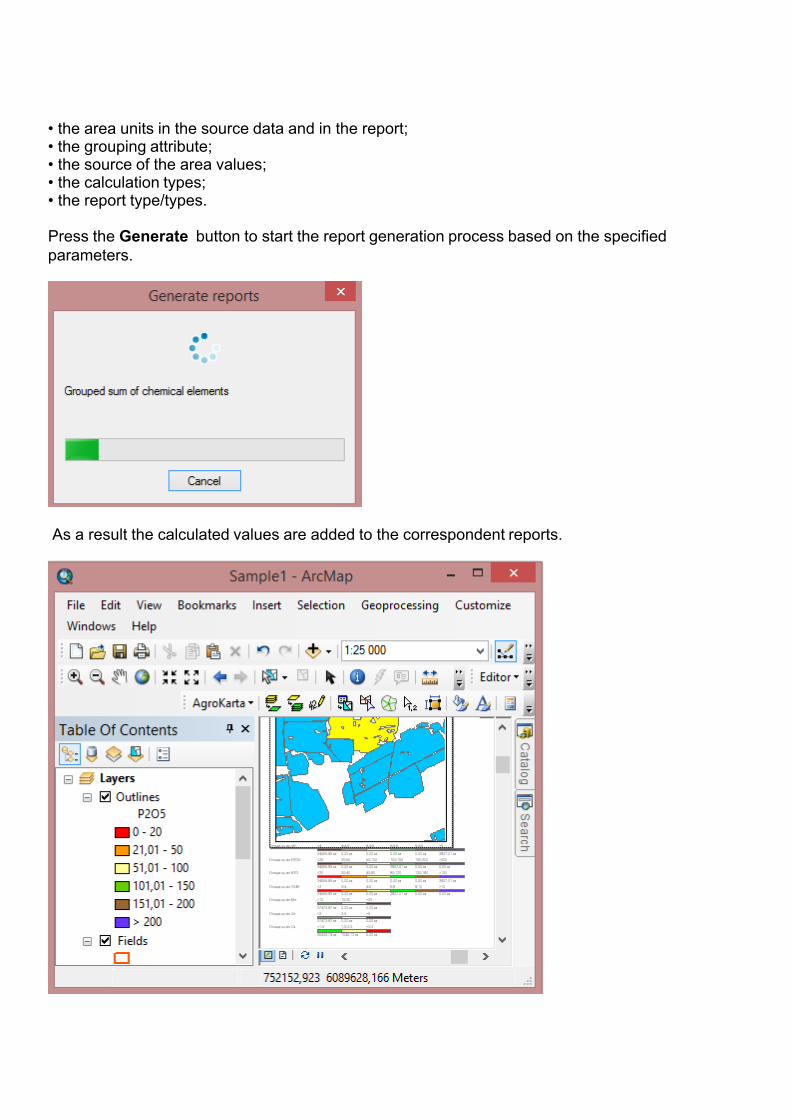
• the area units in the source data and in the report;• the grouping attribute;• the source of the area values;• the calculation types;• the report type/types. Press the Generate button to start the report generation process based on the specified parameters.
As a result the calculated values are added to the correspondent reports.
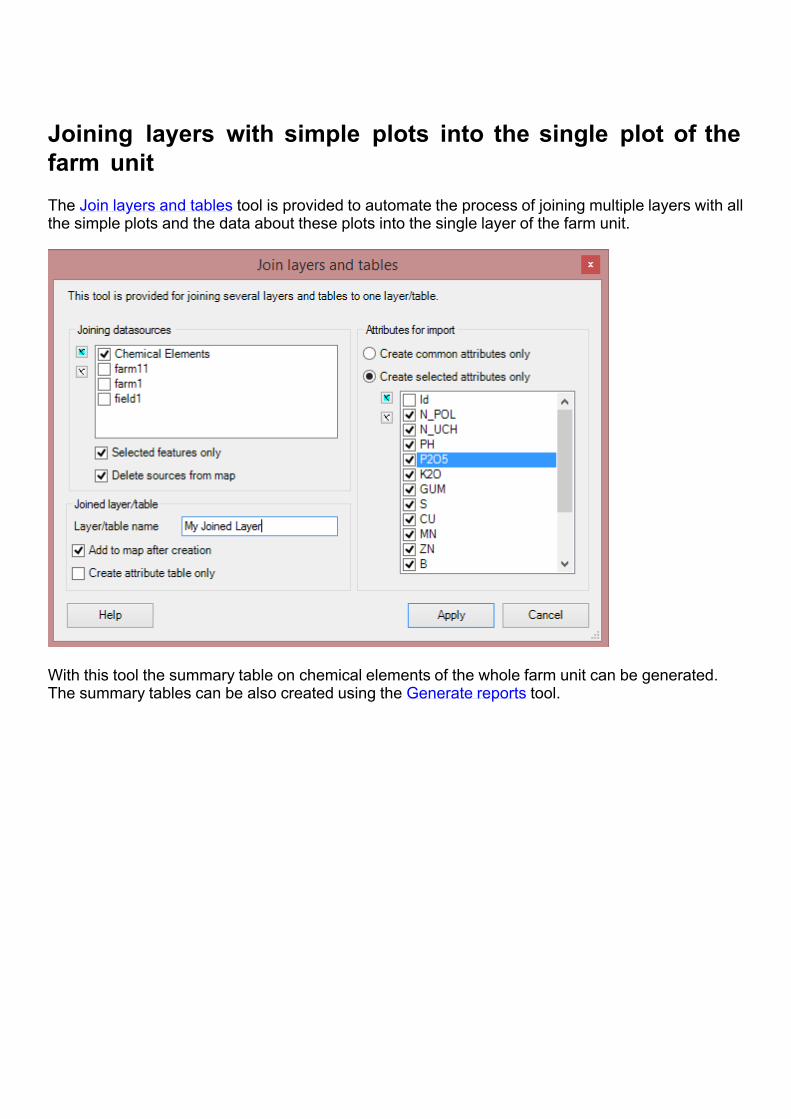
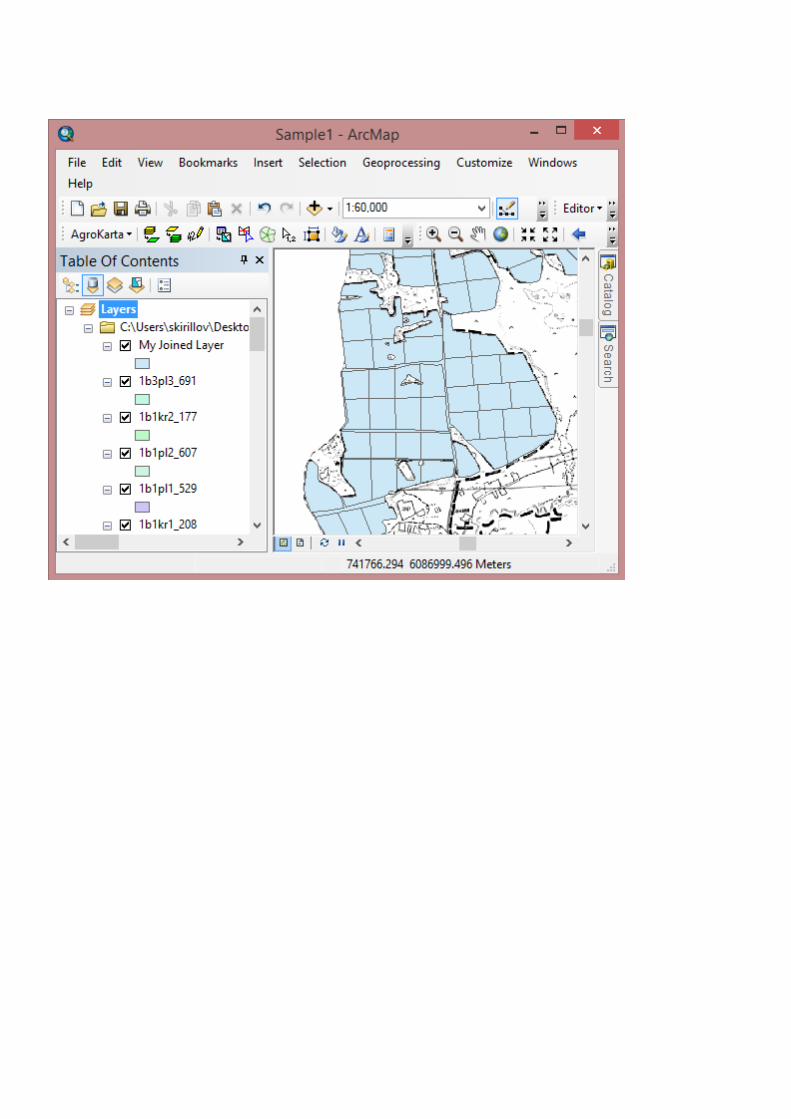
Joining layers with simple plots into the single plot of the farm unitThe Join layers and tables tool is provided to automate the process of joining multiple layers with all the simple plots and the data about these plots into the single layer of the farm unit.
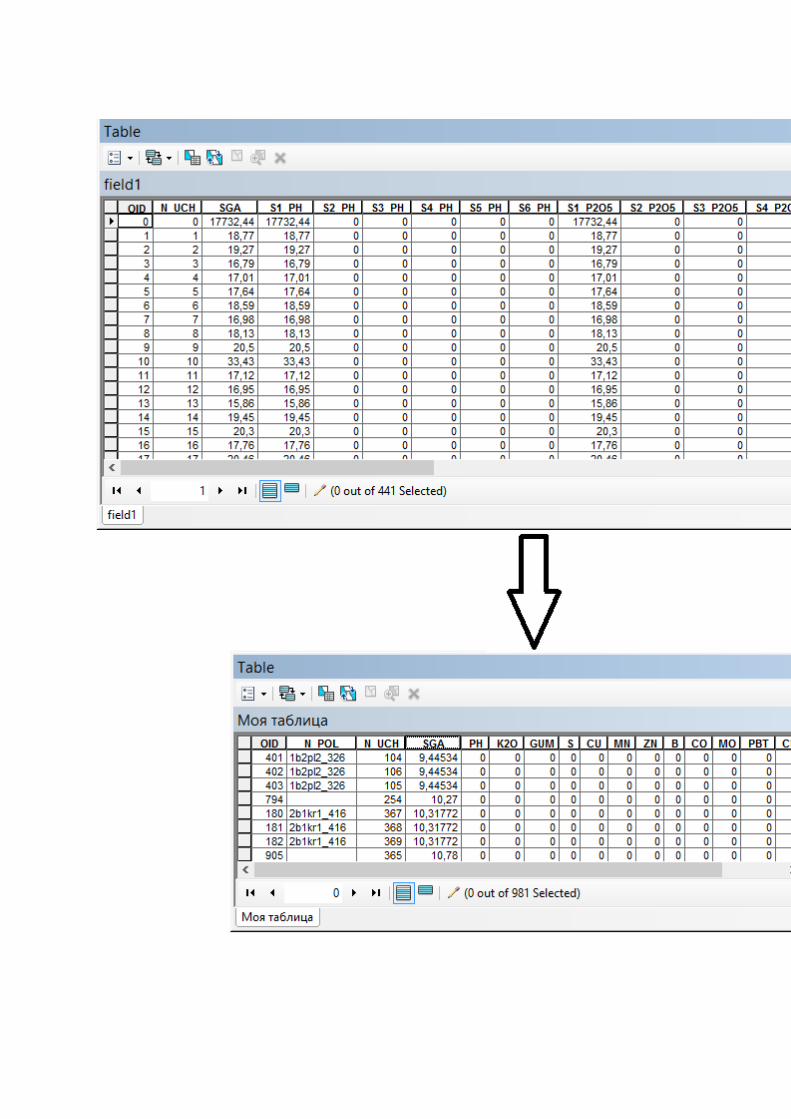
With this tool the summary table on chemical elements of the whole farm unit can be generated. The summary tables can be also created using the Generate reports tool.
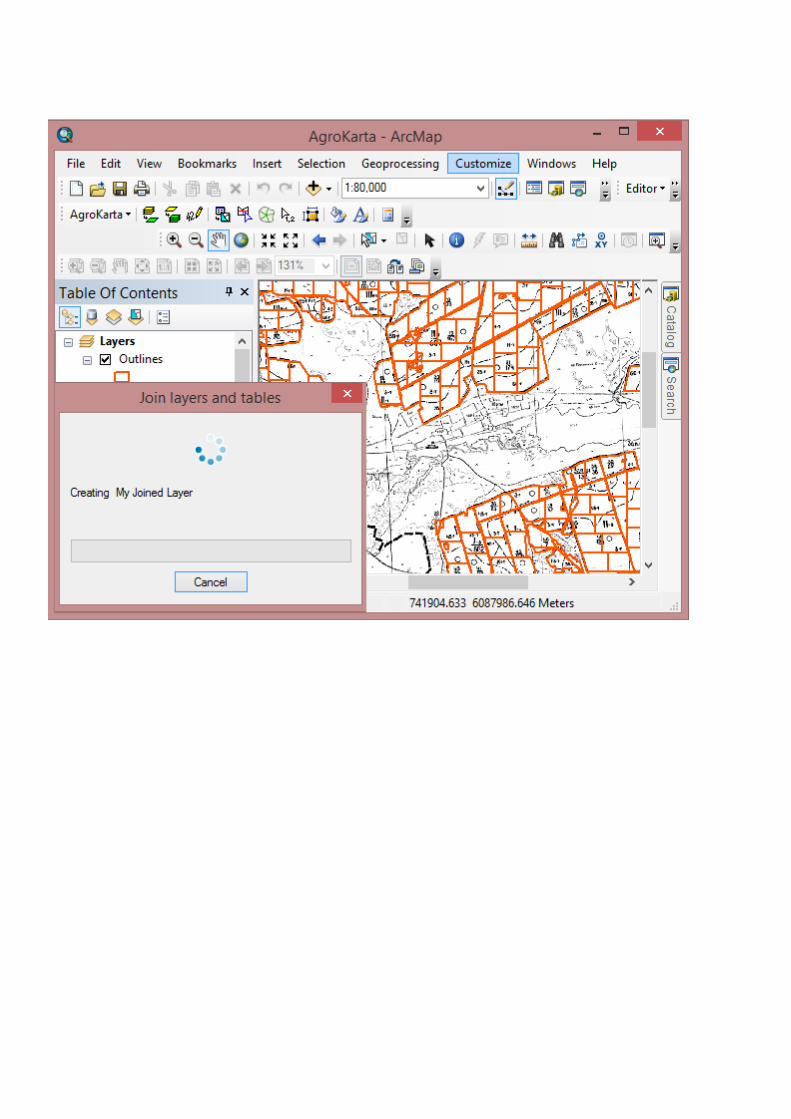
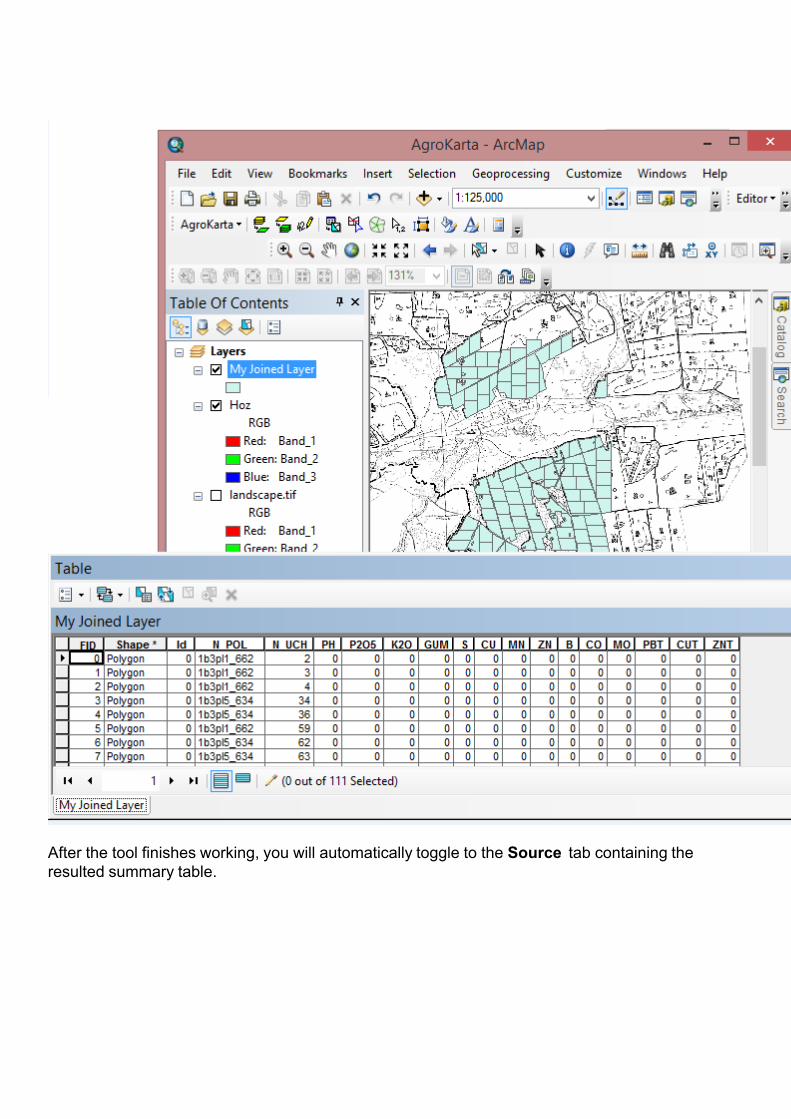
After the tool finishes working, you will automatically toggle to the Source tab containing the resulted summary table.
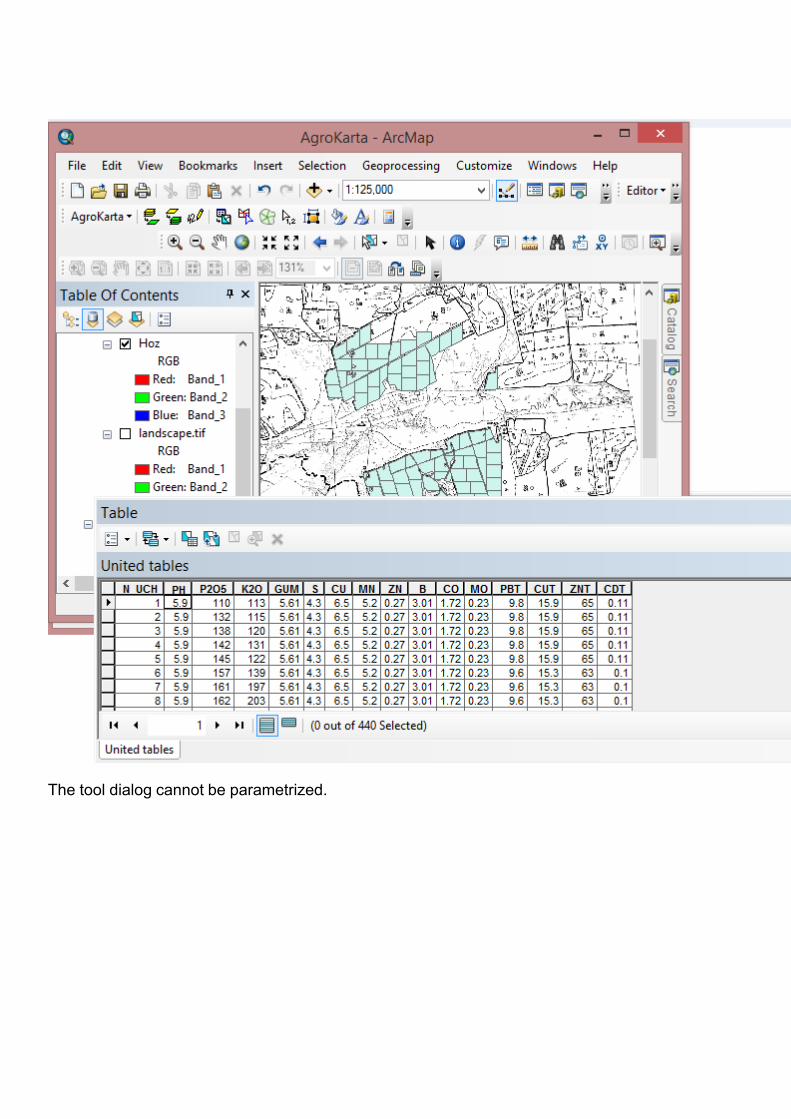
The tool dialog cannot be parametrized.
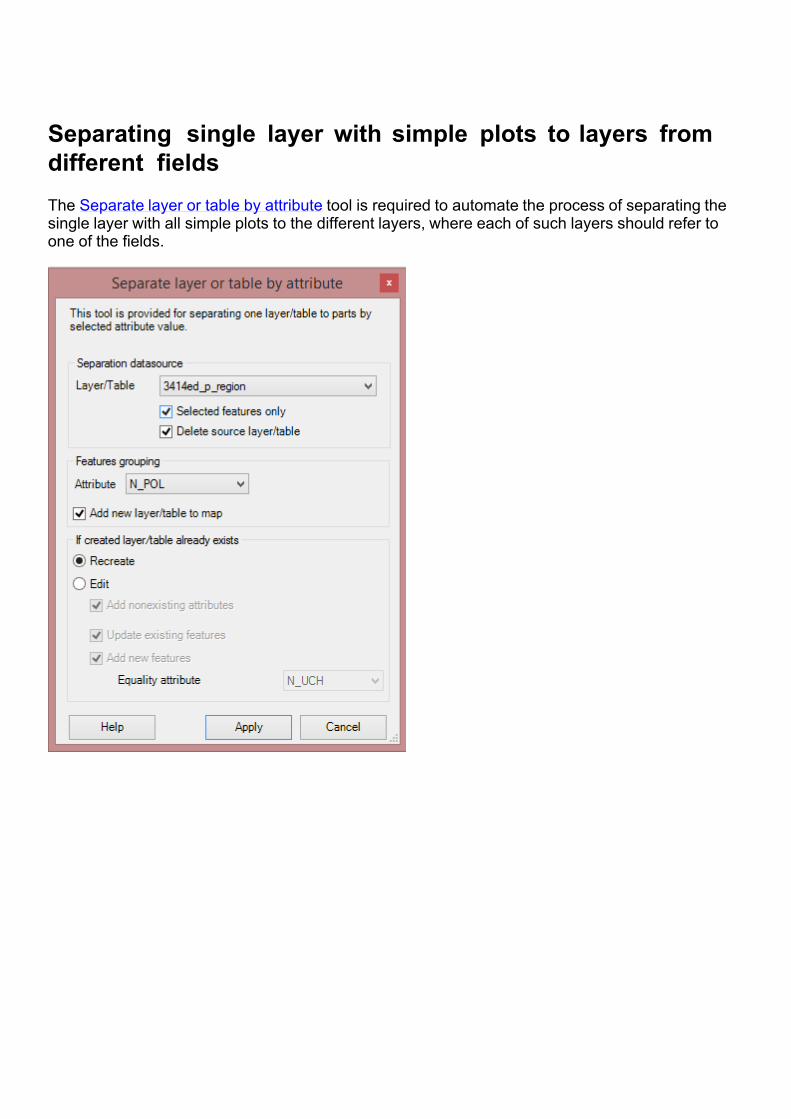
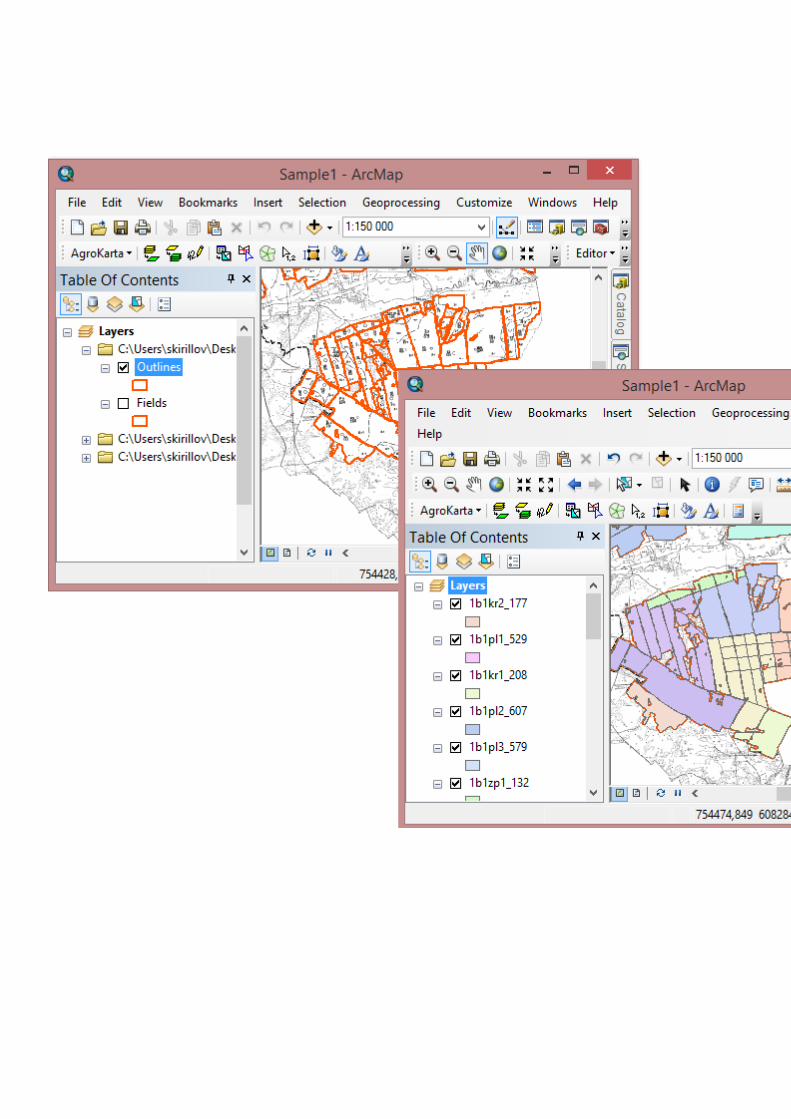
Separating single layer with simple plots to layers from different fieldsThe Separate layer or table by attribute tool is required to automate the process of separating the single layer with all simple plots to the different layers, where each of such layers should refer to one of the fields.
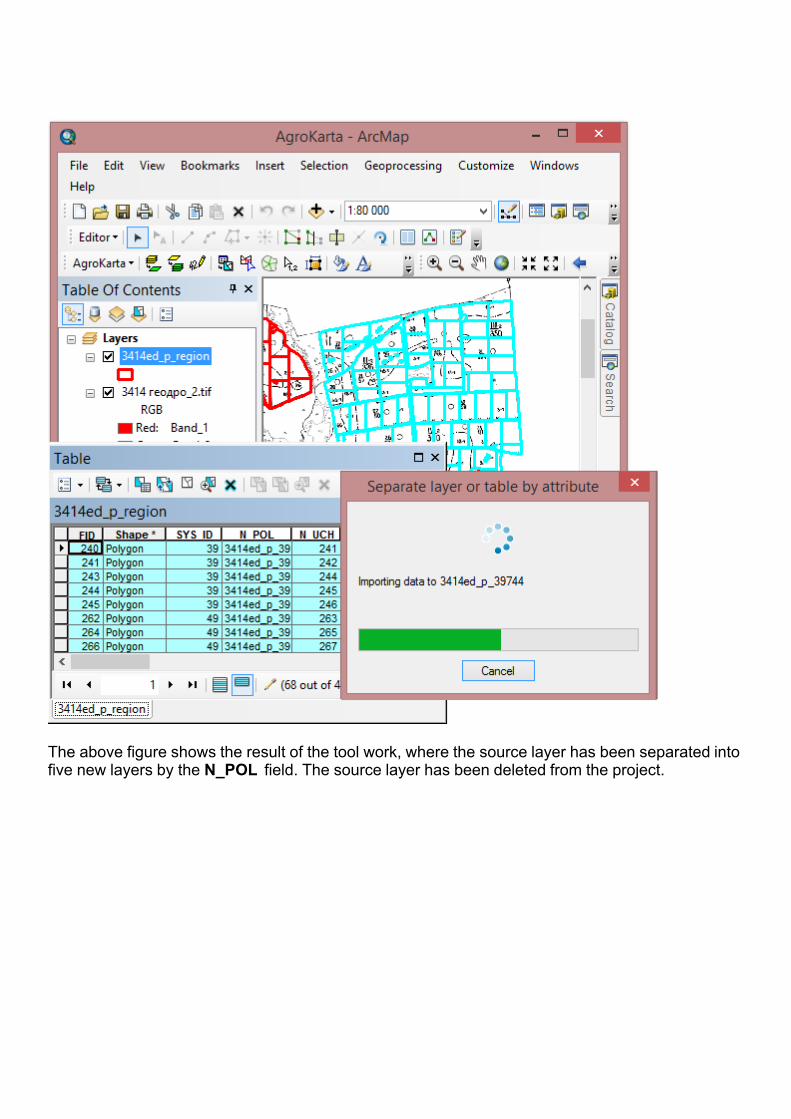
The above figure shows the result of the tool work, where the source layer has been separated into five new layers by the N_POL field. The source layer has been deleted from the project.
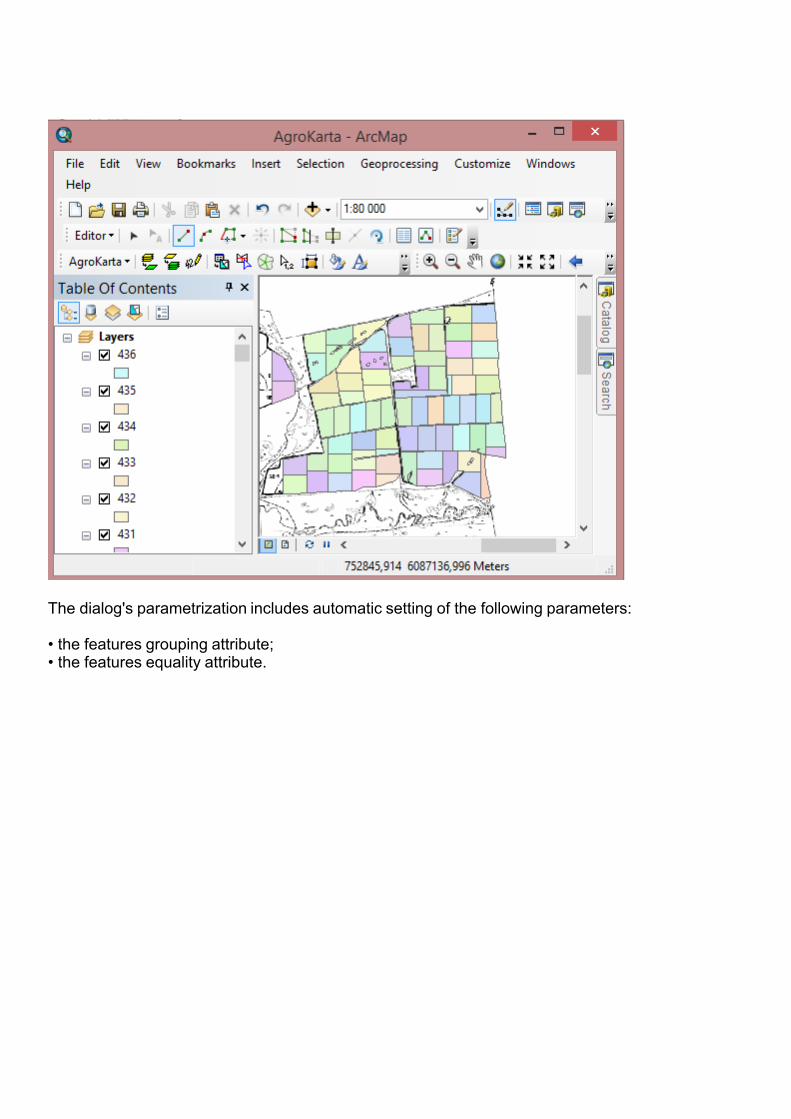
The dialog's parametrization includes automatic setting of the following parameters: • the features grouping attribute;• the features equality attribute.
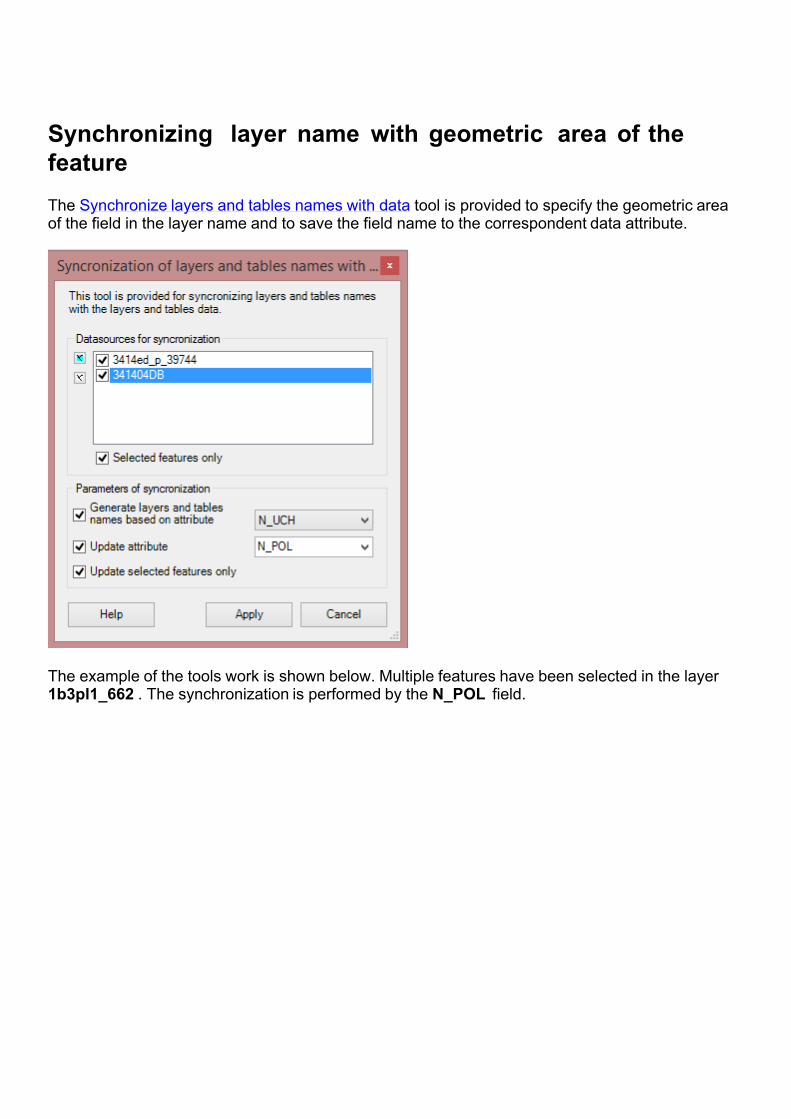
Synchronizing layer name with geometric area of the feature The Synchronize layers and tables names with data tool is provided to specify the geometric area of the field in the layer name and to save the field name to the correspondent data attribute.
The example of the tools work is shown below. Multiple features have been selected in the layer 1b3pl1_662 . The synchronization is performed by the N_POL field.
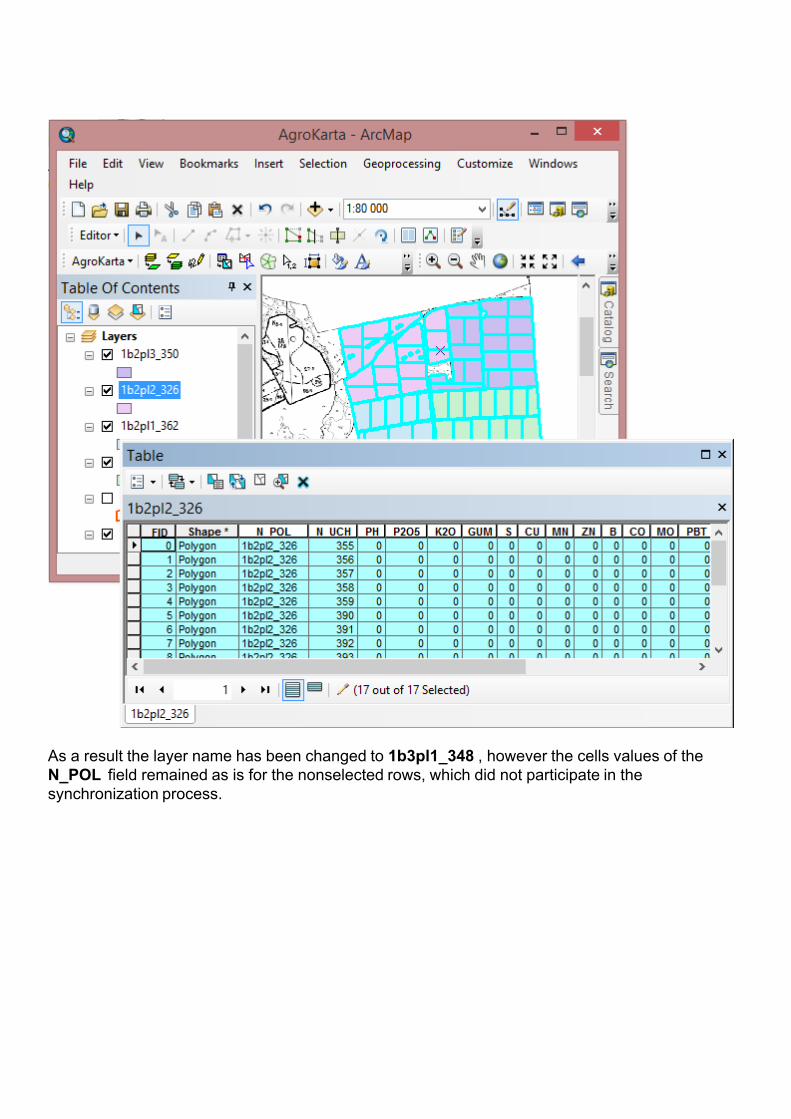
As a result the layer name has been changed to 1b3pl1_348 , however the cells values of the N_POL field remained as is for the nonselected rows, which did not participate in the synchronization process.
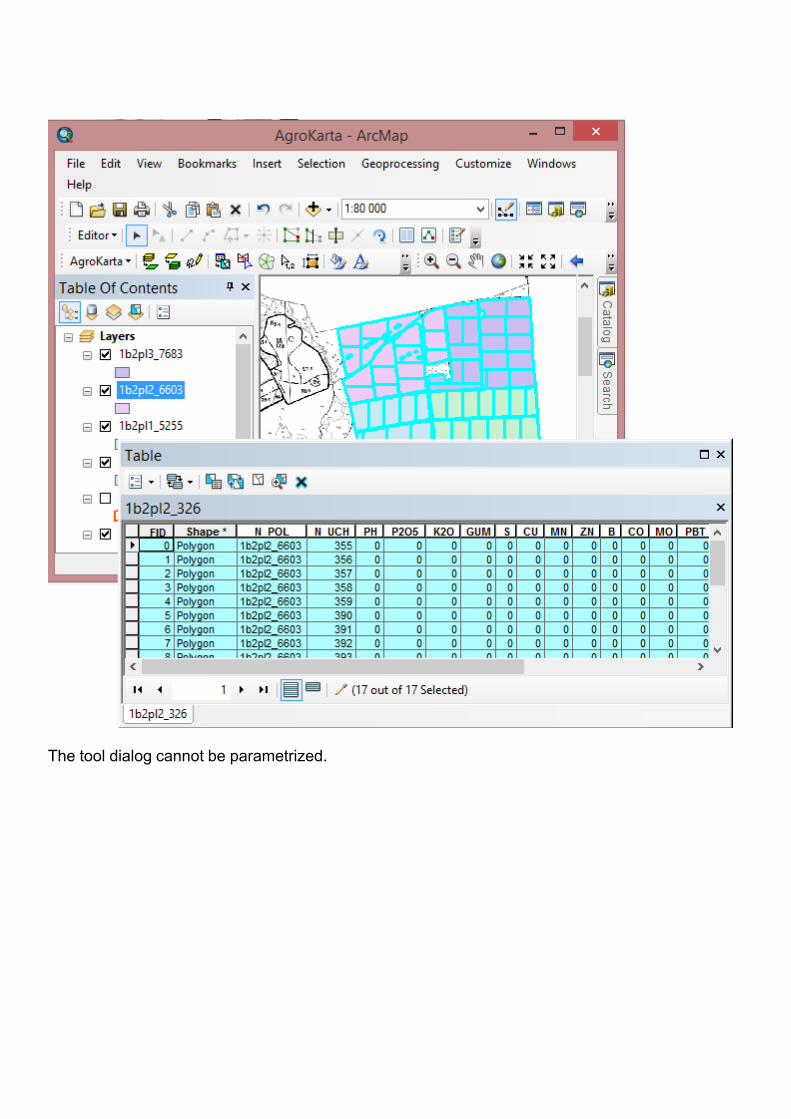
The tool dialog cannot be parametrized.
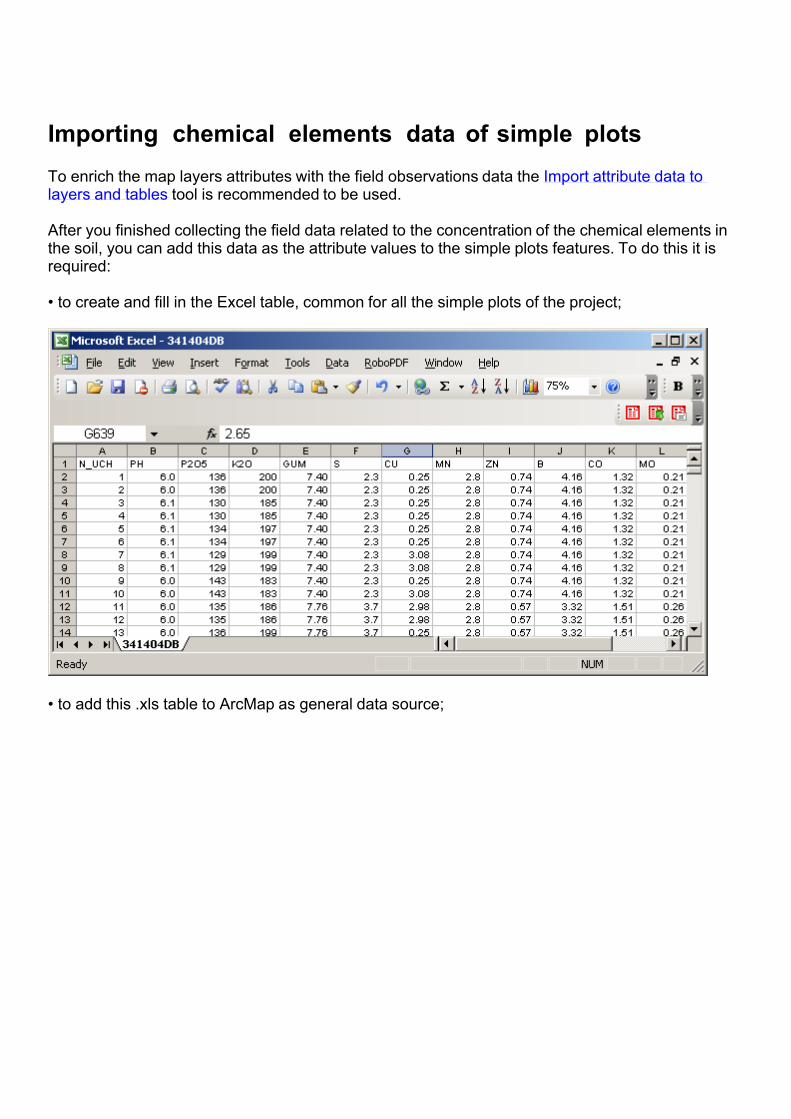
Importing chemical elements data of simple plotsTo enrich the map layers attributes with the field observations data the Import attribute data to layers and tables tool is recommended to be used. After you finished collecting the field data related to the concentration of the chemical elements in the soil, you can add this data as the attribute values to the simple plots features. To do this it is required: • to create and fill in the Excel table, common for all the simple plots of the project;
• to add this .xls table to ArcMap as general data source;
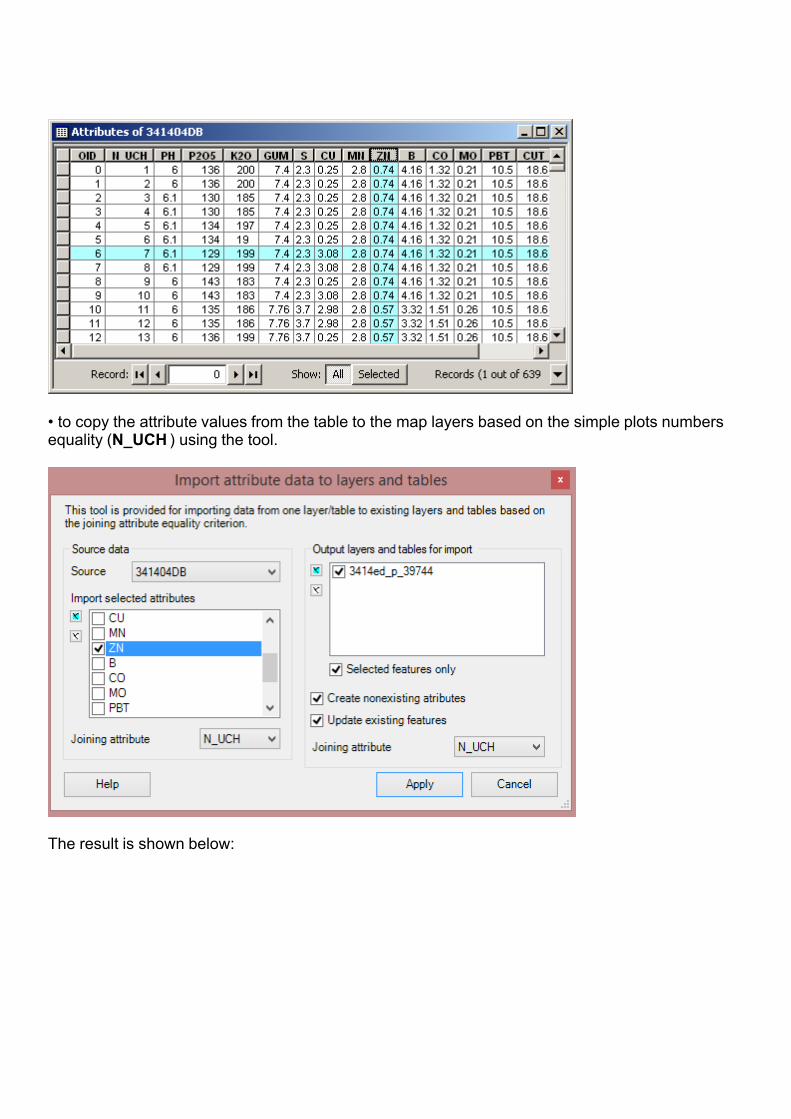
• to copy the attribute values from the table to the map layers based on the simple plots numbers equality (N_UCH ) using the tool.
The result is shown below:
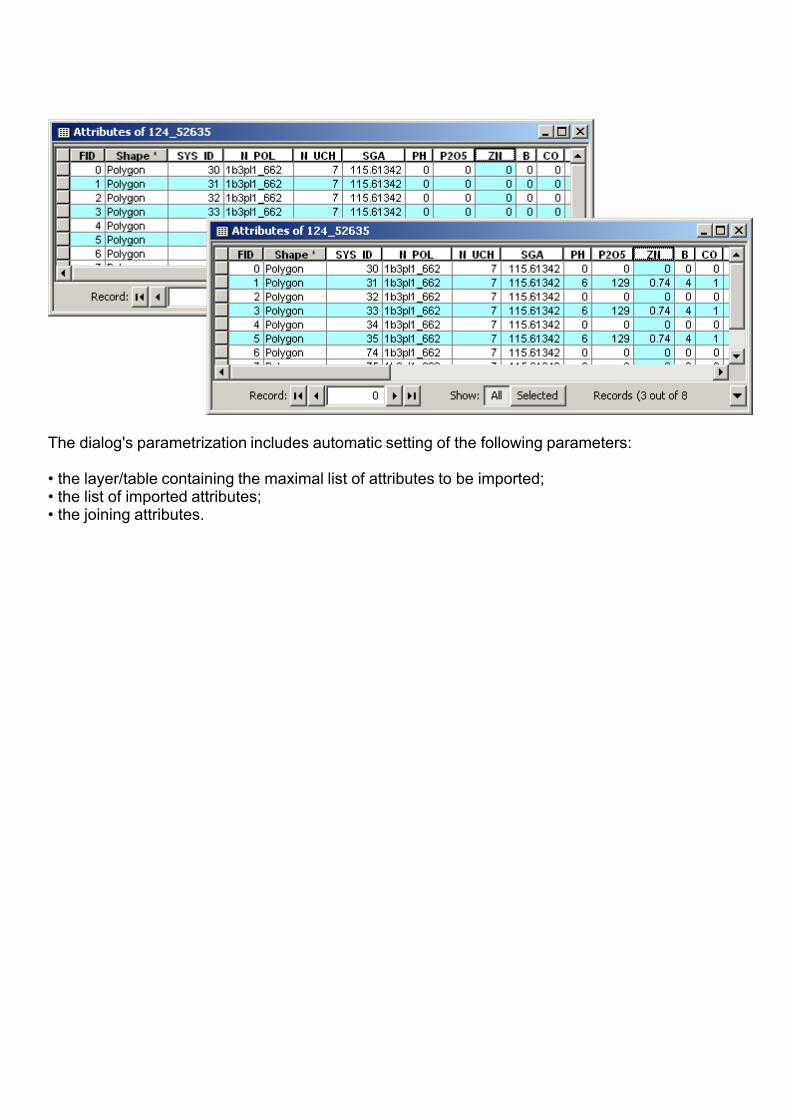
The dialog's parametrization includes automatic setting of the following parameters: • the layer/table containing the maximal list of attributes to be imported;• the list of imported attributes;• the joining attributes.
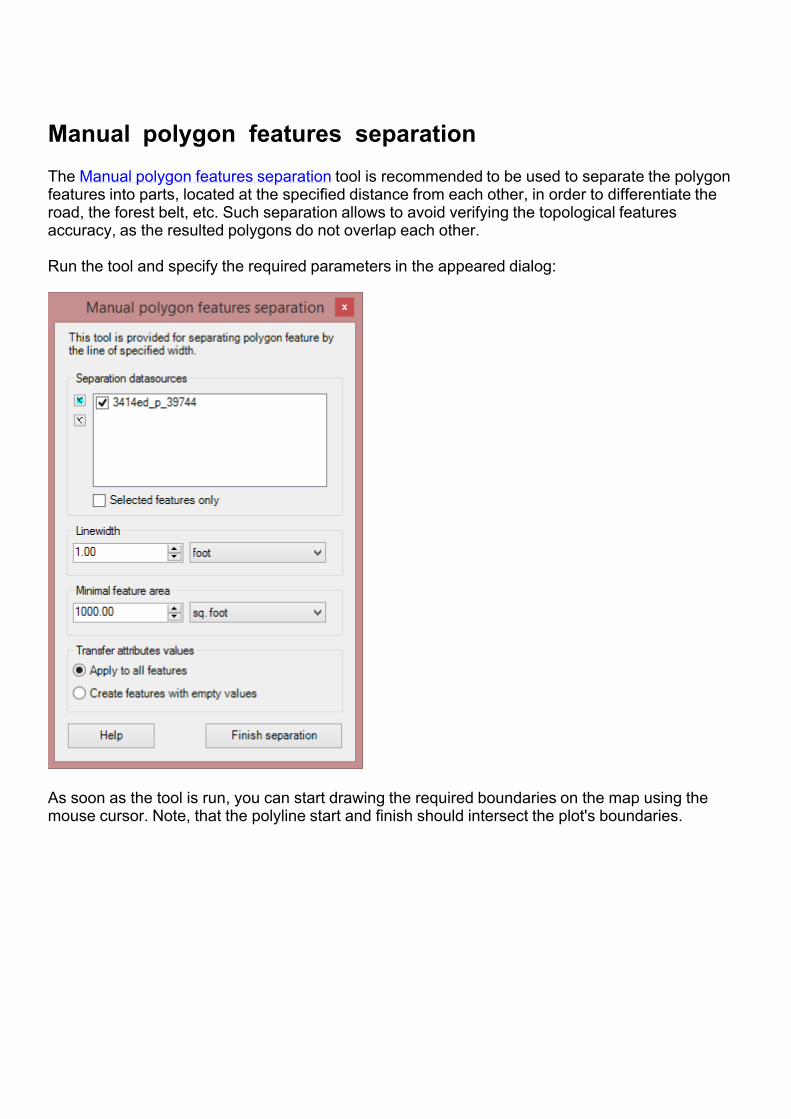
Manual polygon features separationThe Manual polygon features separation tool is recommended to be used to separate the polygon features into parts, located at the specified distance from each other, in order to differentiate the road, the forest belt, etc. Such separation allows to avoid verifying the topological features accuracy, as the resulted polygons do not overlap each other. Run the tool and specify the required parameters in the appeared dialog:
As soon as the tool is run, you can start drawing the required boundaries on the map using the mouse cursor. Note, that the polyline start and finish should intersect the plot's boundaries.
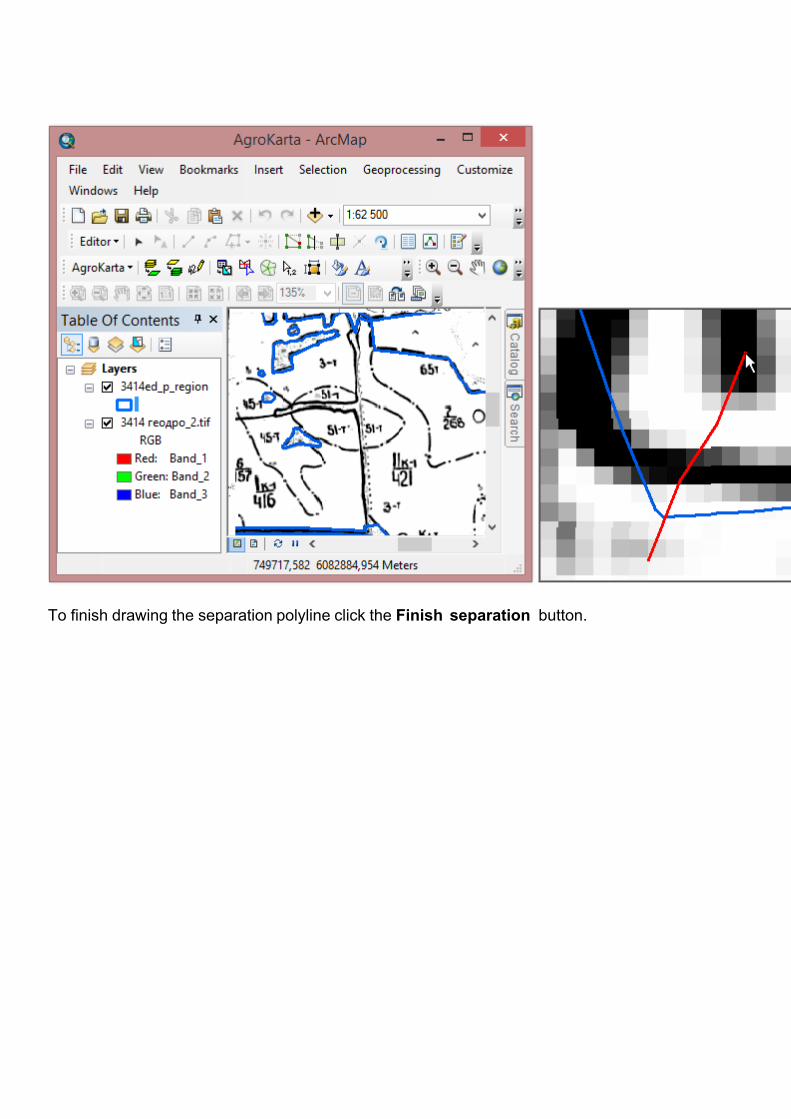
To finish drawing the separation polyline click the Finish separation button.
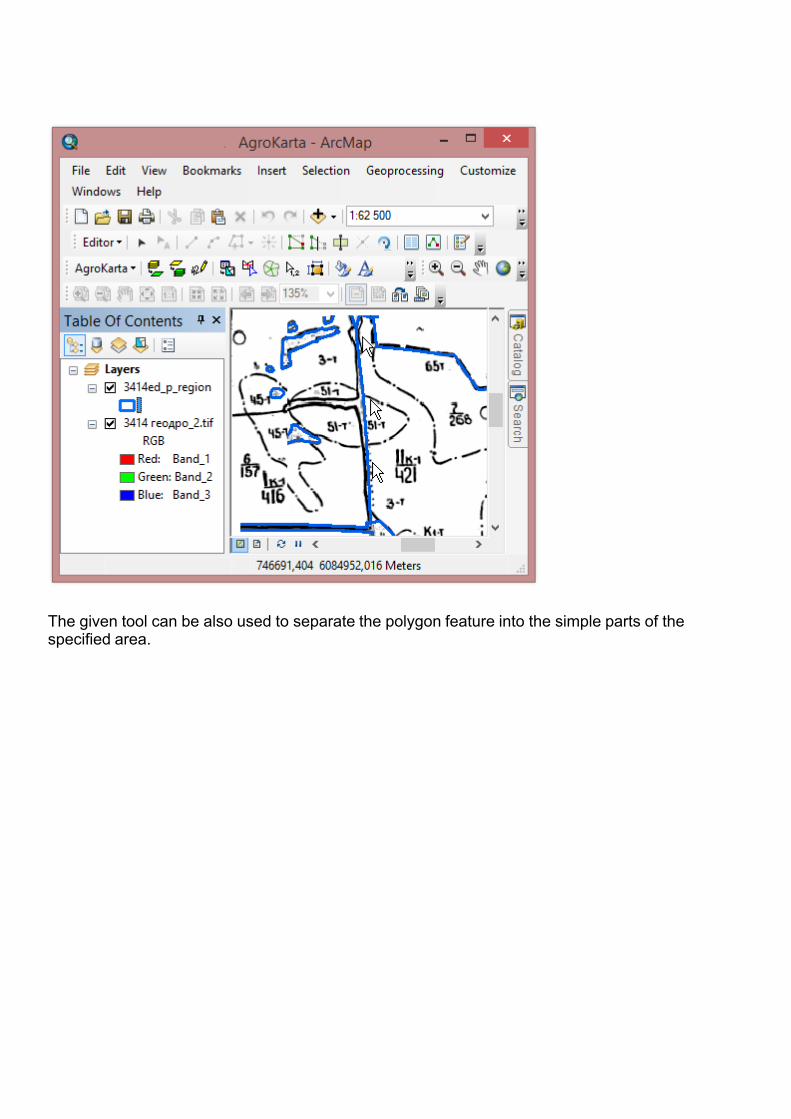
The given tool can be also used to separate the polygon feature into the simple parts of the specified area.
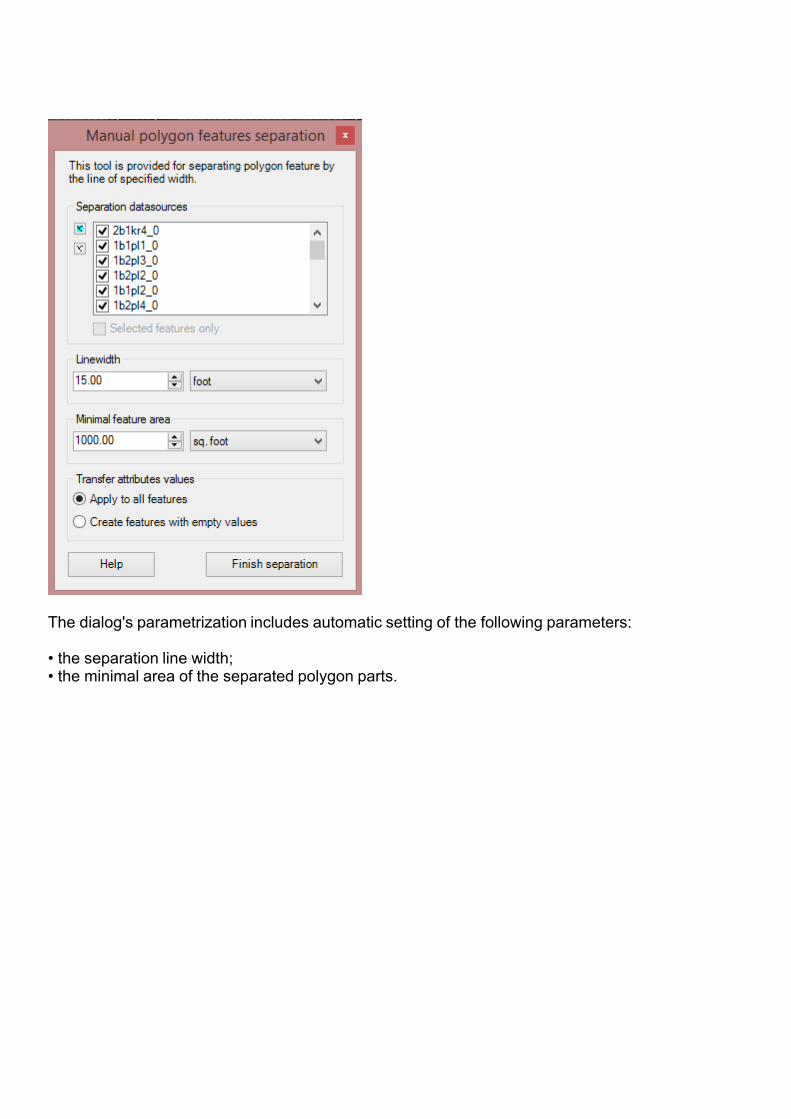
The dialog's parametrization includes automatic setting of the following parameters: • the separation line width;• the minimal area of the separated polygon parts.
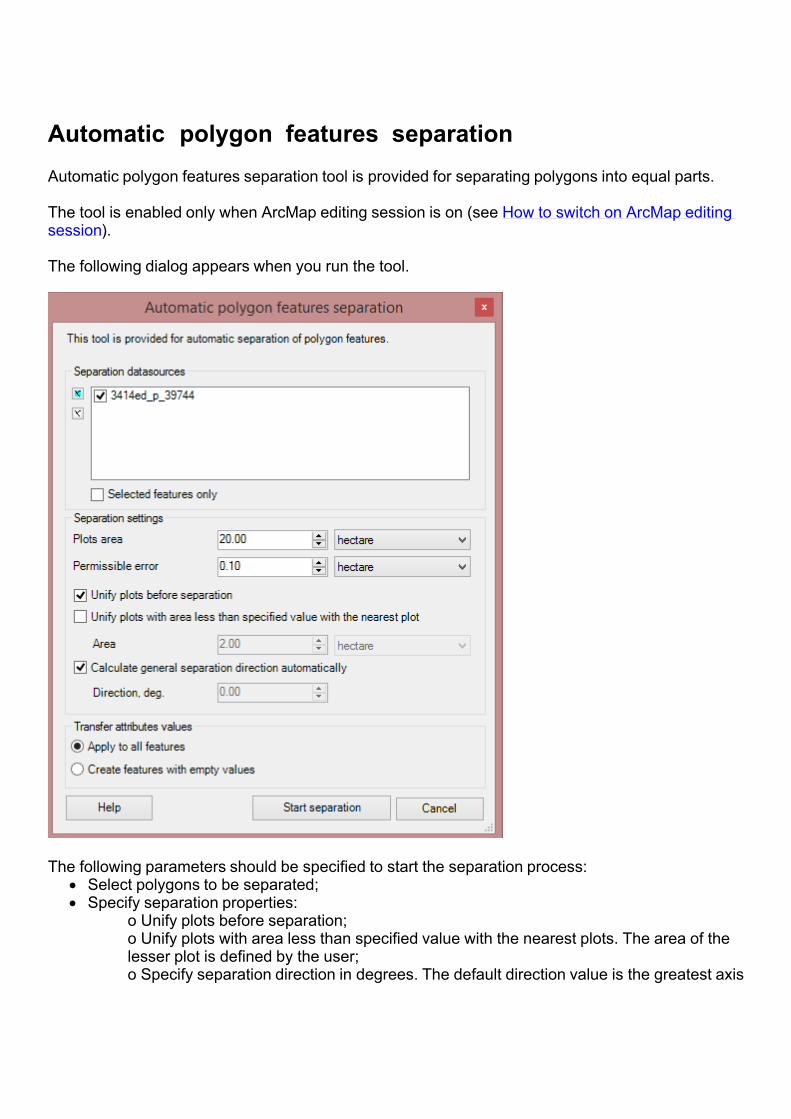
Automatic polygon features separationAutomatic polygon features separation tool is provided for separating polygons into equal parts. The tool is enabled only when ArcMap editing session is on (see How to switch on ArcMap editing session). The following dialog appears when you run the tool.
The following parameters should be specified to start the separation process:
Select polygons to be separated;Specify separation properties:
o Unify plots before separation;o Unify plots with area less than specified value with the nearest plots. The area of the lesser plot is defined by the user;o Specify separation direction in degrees. The default direction value is the greatest axis
of the separated polygon.Specify the attribute values transfer type:Copy attribute values for all features. Note that if the source attribute table contains values in the Area and Perimeter columns, then after the tool work has been completed, these values would not be automatically recalculated for the output polygons. Create features with empty values.
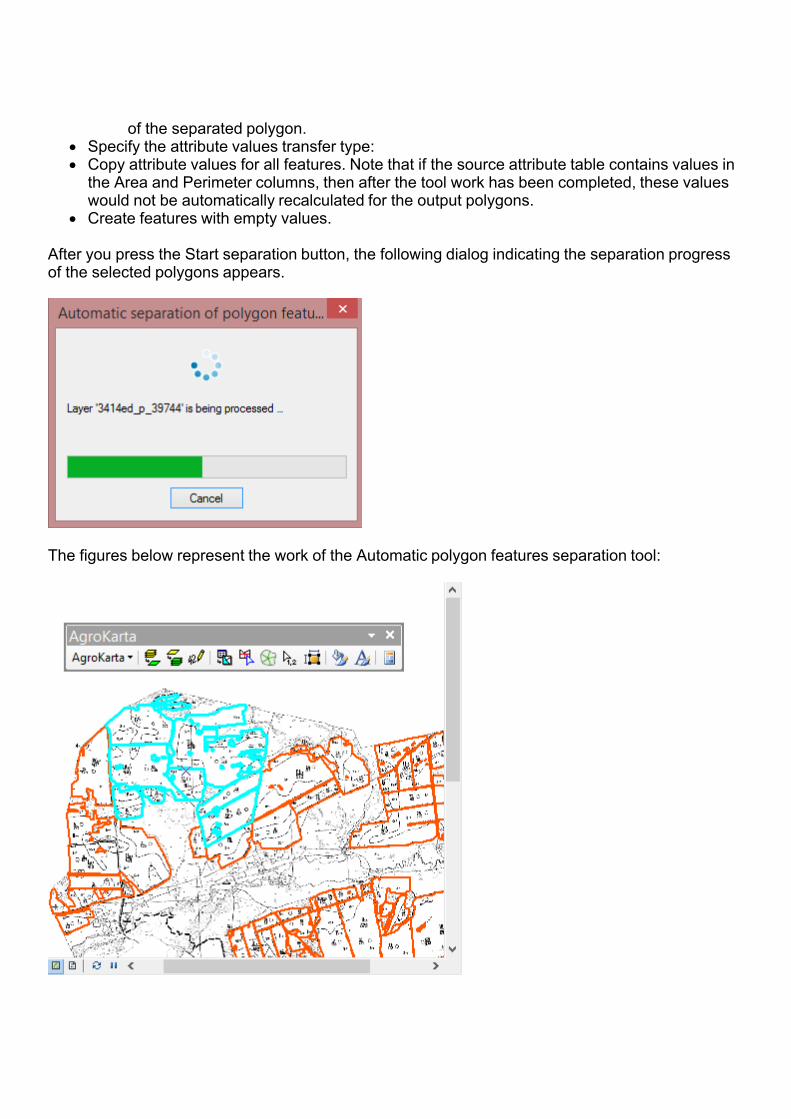
After you press the Start separation button, the following dialog indicating the separation progress of the selected polygons appears.
The figures below represent the work of the Automatic polygon features separation tool:
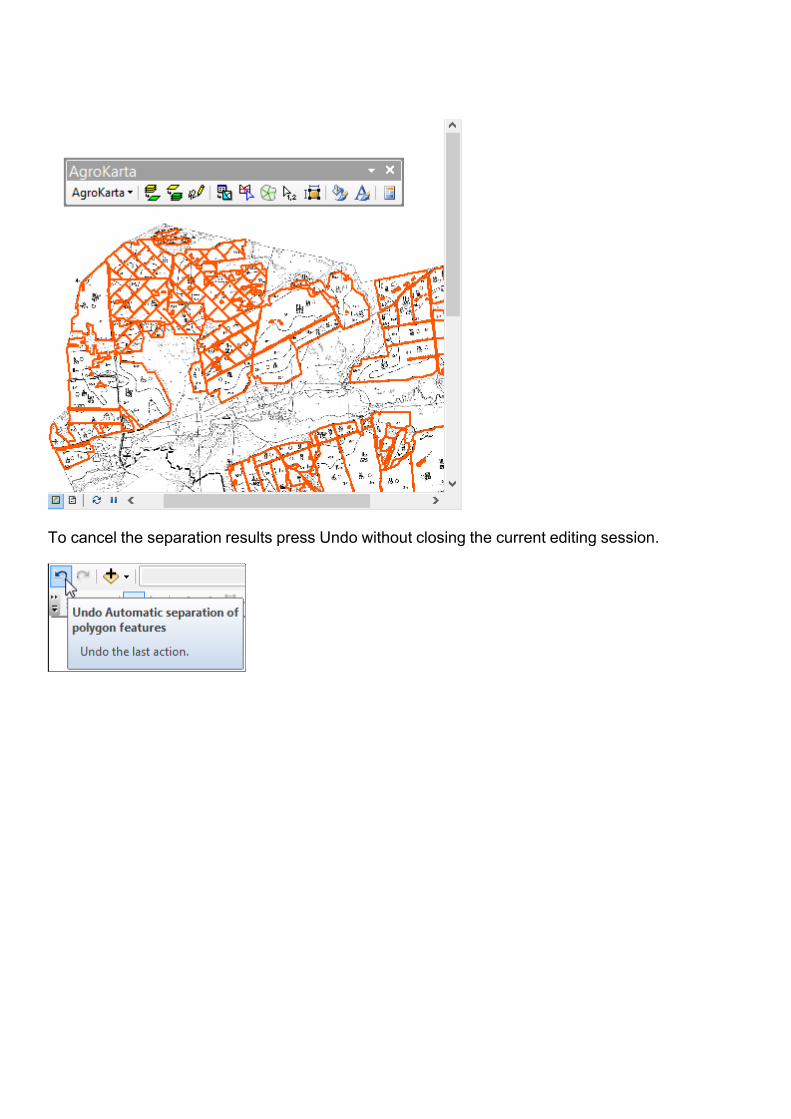
To cancel the separation results press Undo without closing the current editing session.
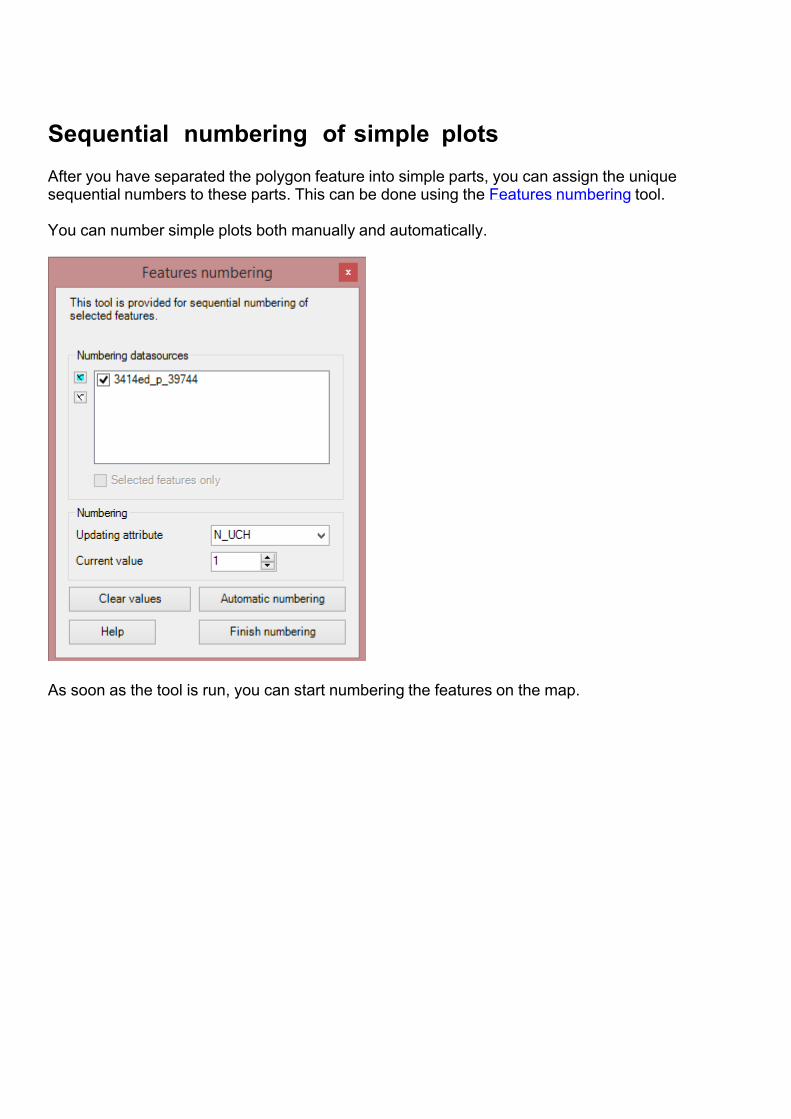
Sequential numbering of simple plotsAfter you have separated the polygon feature into simple parts, you can assign the unique sequential numbers to these parts. This can be done using the Features numbering tool. You can number simple plots both manually and automatically.
As soon as the tool is run, you can start numbering the features on the map.

To do this in the manual mode click on the required plot on the map and the number will appear automatically.

If you want to number polygons automatically , press the Automatic numbering button. This method is recommended in case if the simple plots you are going to number have been made using the Automatic polygon features separation tool. The tool can be used with either point or linear features.
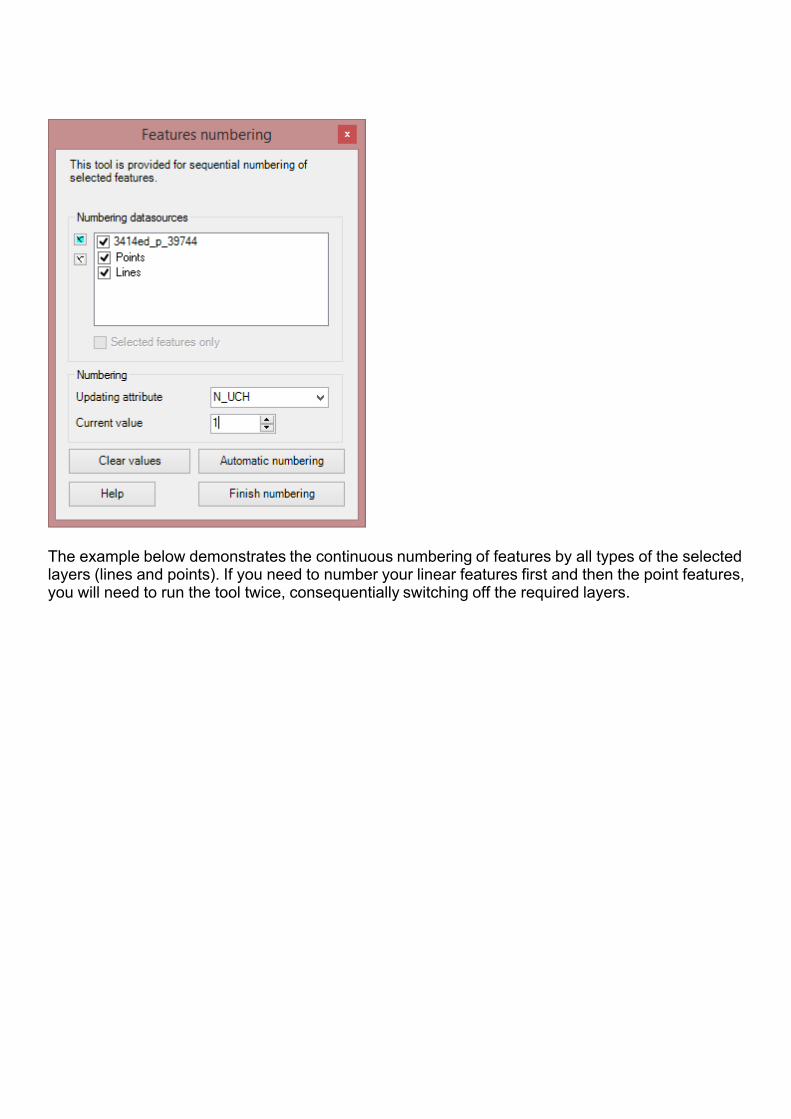
The example below demonstrates the continuous numbering of features by all types of the selected layers (lines and points). If you need to number your linear features first and then the point features, you will need to run the tool twice, consequentially switching off the required layers.
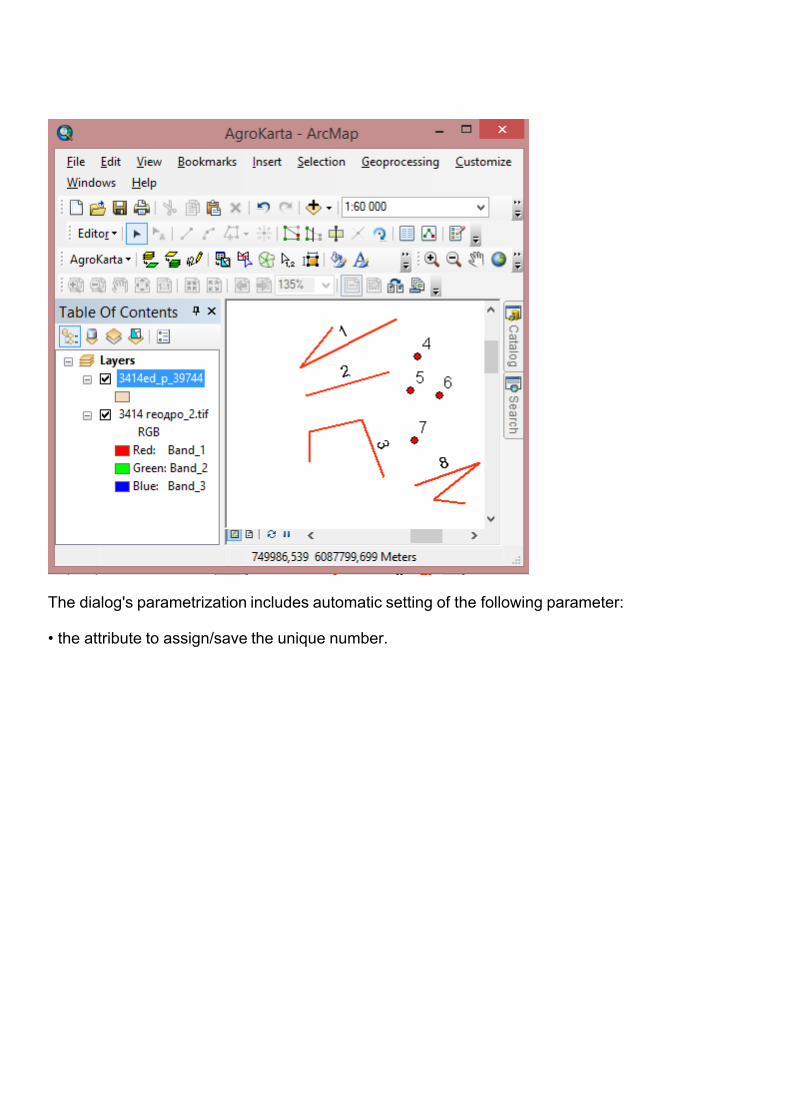
The dialog's parametrization includes automatic setting of the following parameter: • the attribute to assign/save the unique number.
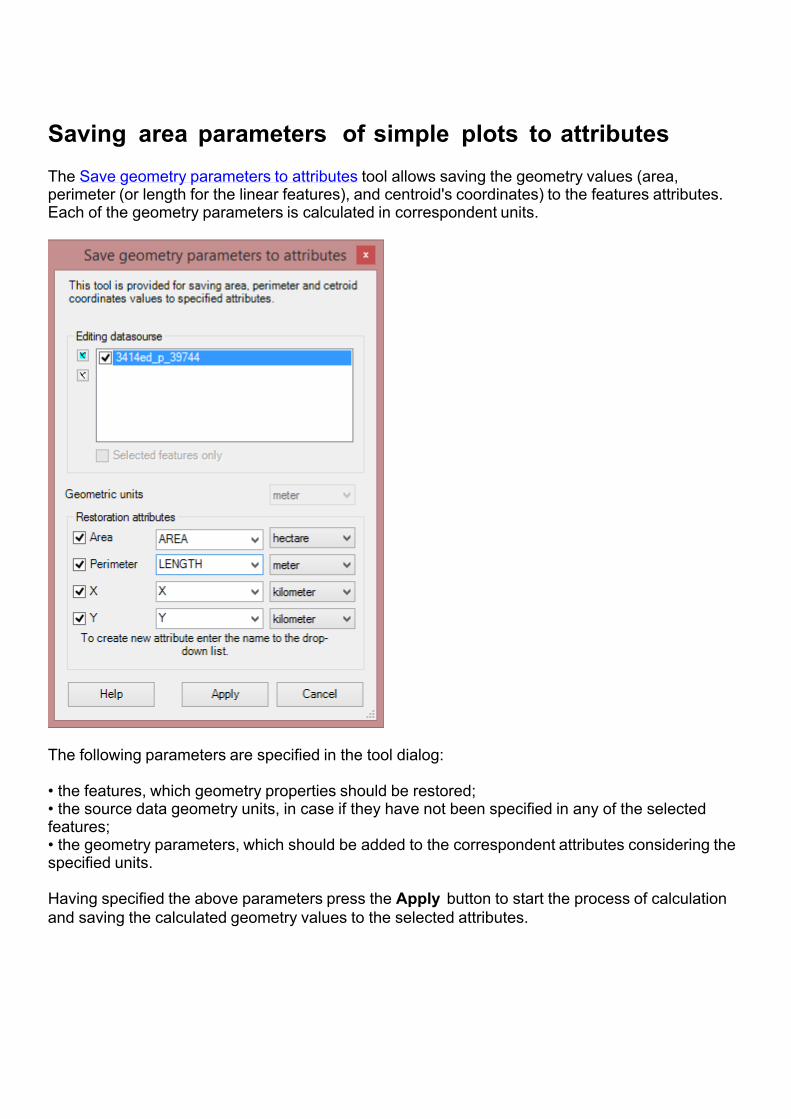
Saving area parameters of simple plots to attributesThe Save geometry parameters to attributes tool allows saving the geometry values (area, perimeter (or length for the linear features), and centroid's coordinates) to the features attributes. Each of the geometry parameters is calculated in correspondent units.
The following parameters are specified in the tool dialog: • the features, which geometry properties should be restored;• the source data geometry units, in case if they have not been specified in any of the selected features;• the geometry parameters, which should be added to the correspondent attributes considering the specified units. Having specified the above parameters press the Apply button to start the process of calculation and saving the calculated geometry values to the selected attributes.
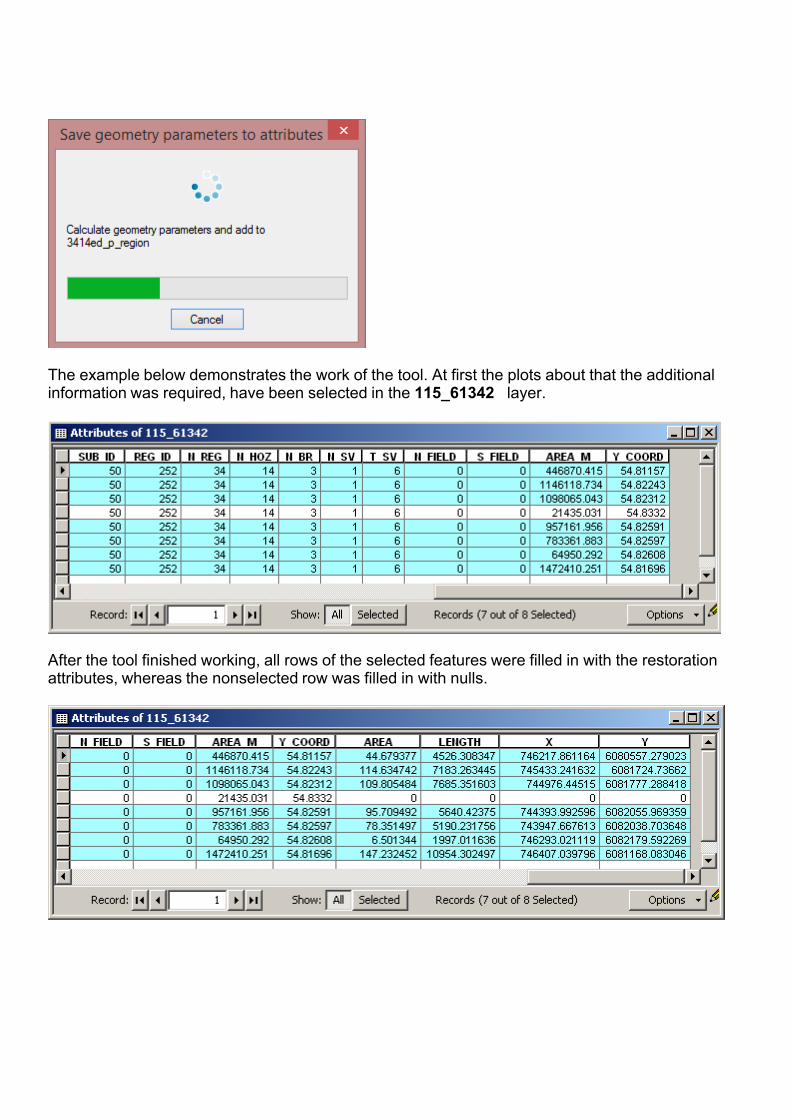
The example below demonstrates the work of the tool. At first the plots about that the additional information was required, have been selected in the 115_61342 layer.
After the tool finished working, all rows of the selected features were filled in with the restoration attributes, whereas the nonselected row was filled in with nulls.
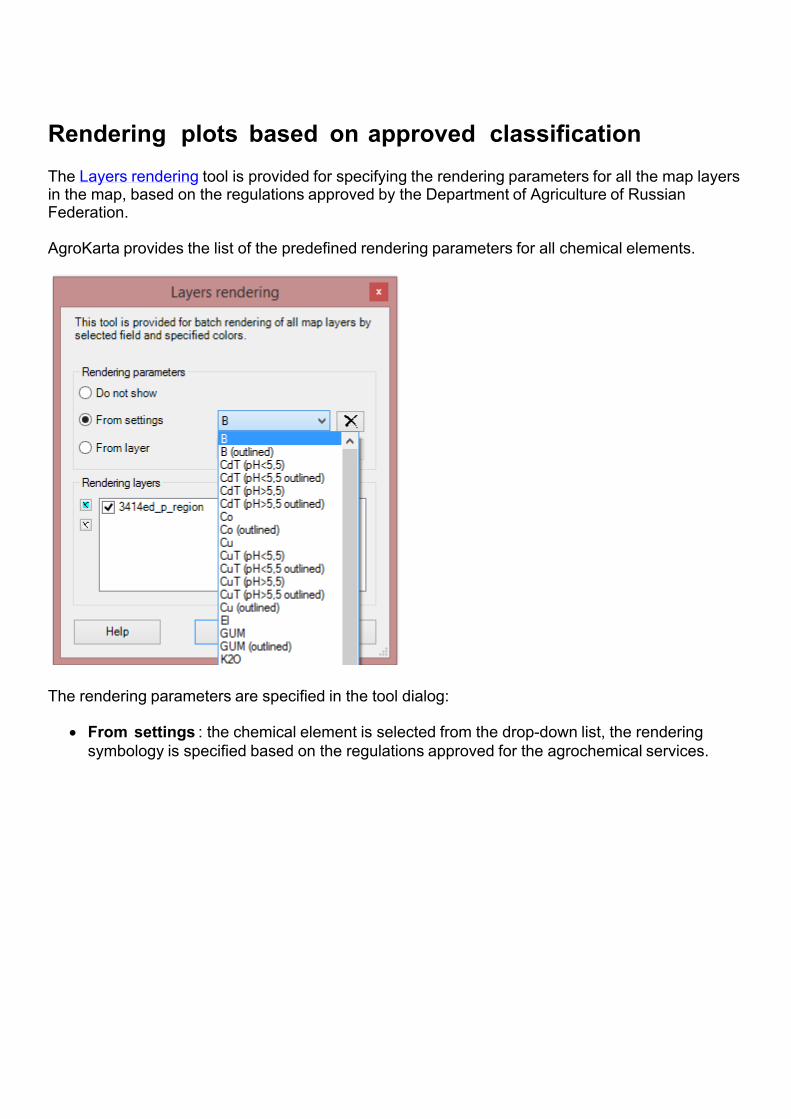
Rendering plots based on approved classificationThe Layers rendering tool is provided for specifying the rendering parameters for all the map layers in the map, based on the regulations approved by the Department of Agriculture of Russian Federation. AgroKarta provides the list of the predefined rendering parameters for all chemical elements.
The rendering parameters are specified in the tool dialog:
From settings : the chemical element is selected from the drop-down list, the rendering symbology is specified based on the regulations approved for the agrochemical services.
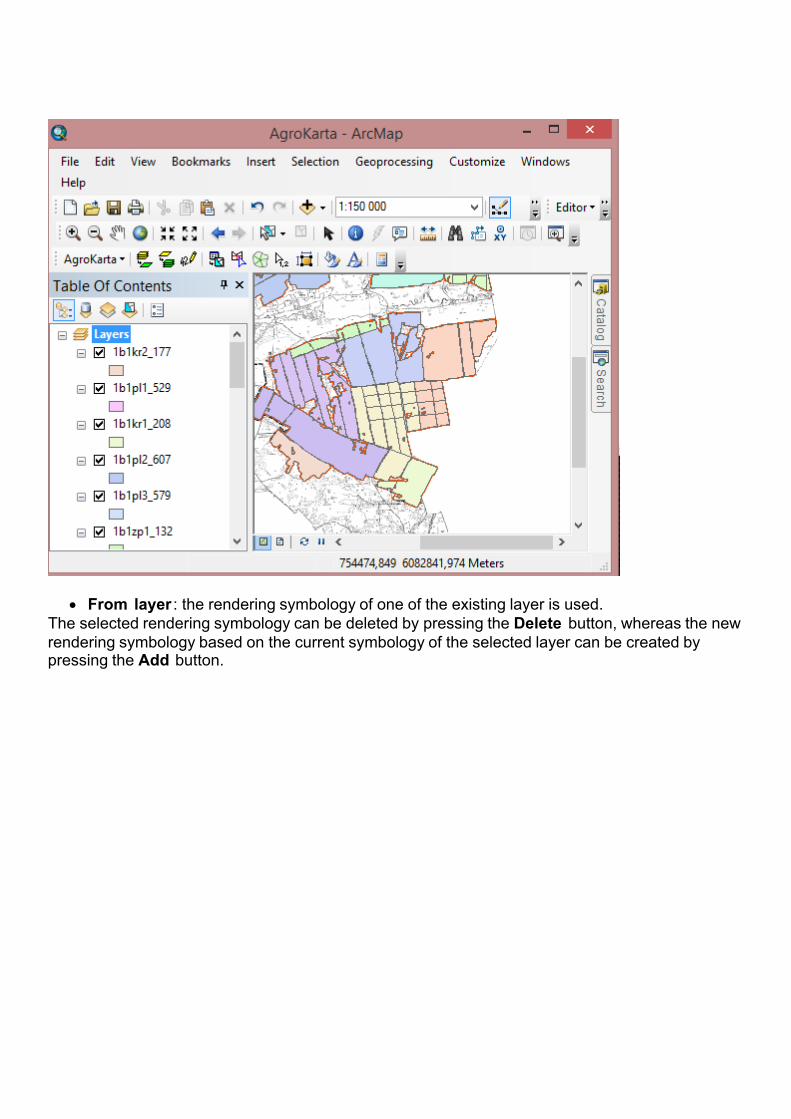
From layer : the rendering symbology of one of the existing layer is used.
The selected rendering symbology can be deleted by pressing the Delete button, whereas the new rendering symbology based on the current symbology of the selected layer can be created by pressing the Add button.
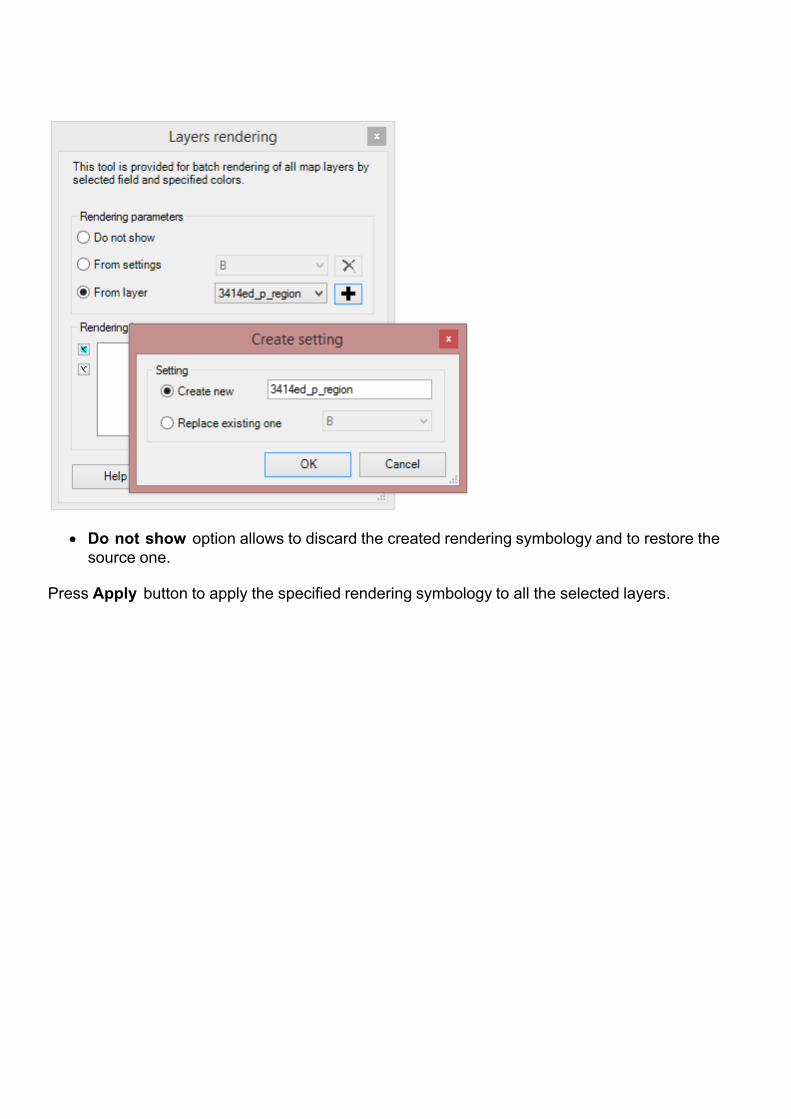
Do not show option allows to discard the created rendering symbology and to restore the source one.
Press Apply button to apply the specified rendering symbology to all the selected layers.
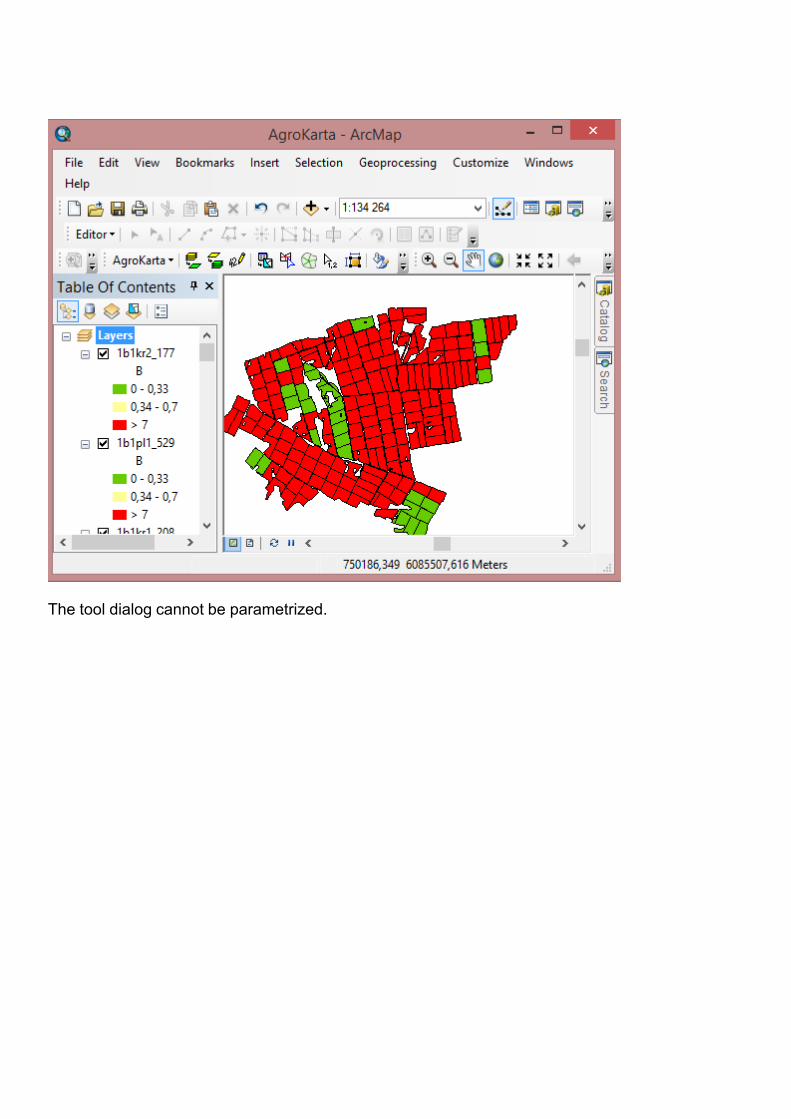
The tool dialog cannot be parametrized.
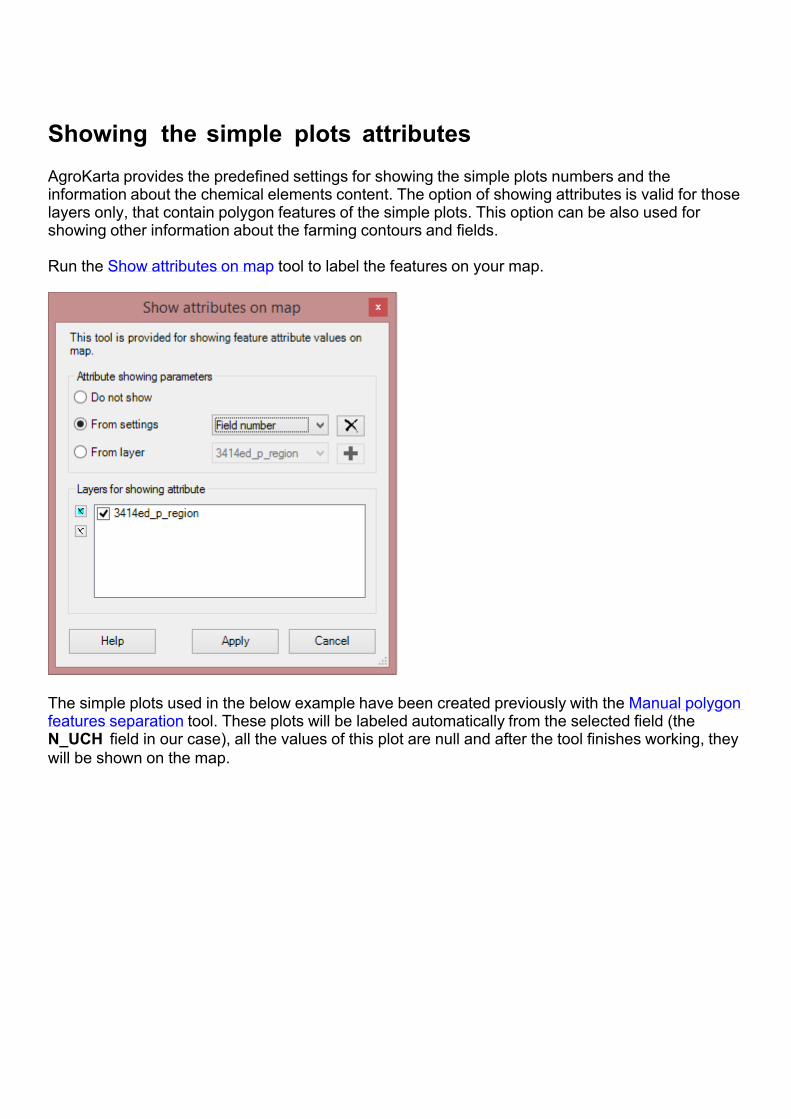
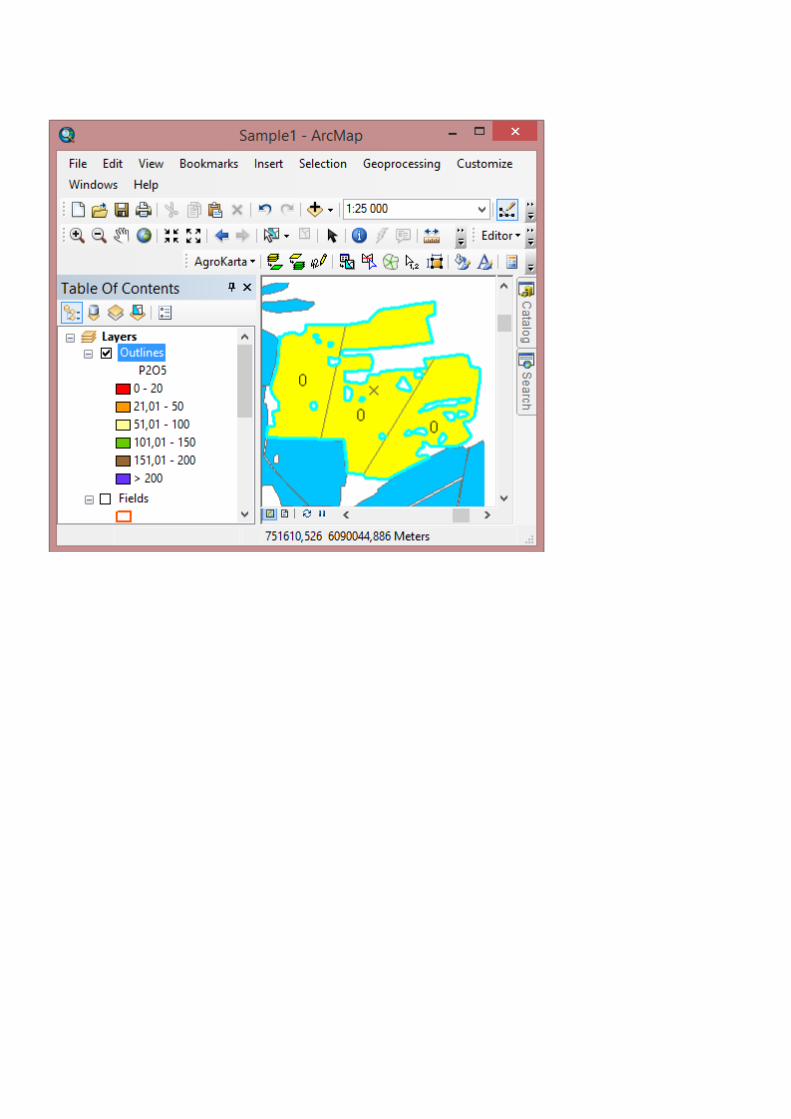
Showing the simple plots attributesAgroKarta provides the predefined settings for showing the simple plots numbers and the information about the chemical elements content. The option of showing attributes is valid for those layers only, that contain polygon features of the simple plots. This option can be also used for showing other information about the farming contours and fields. Run the Show attributes on map tool to label the features on your map.
The simple plots used in the below example have been created previously with the Manual polygon features separation tool. These plots will be labeled automatically from the selected field (the N_UCH field in our case), all the values of this plot are null and after the tool finishes working, they will be shown on the map.
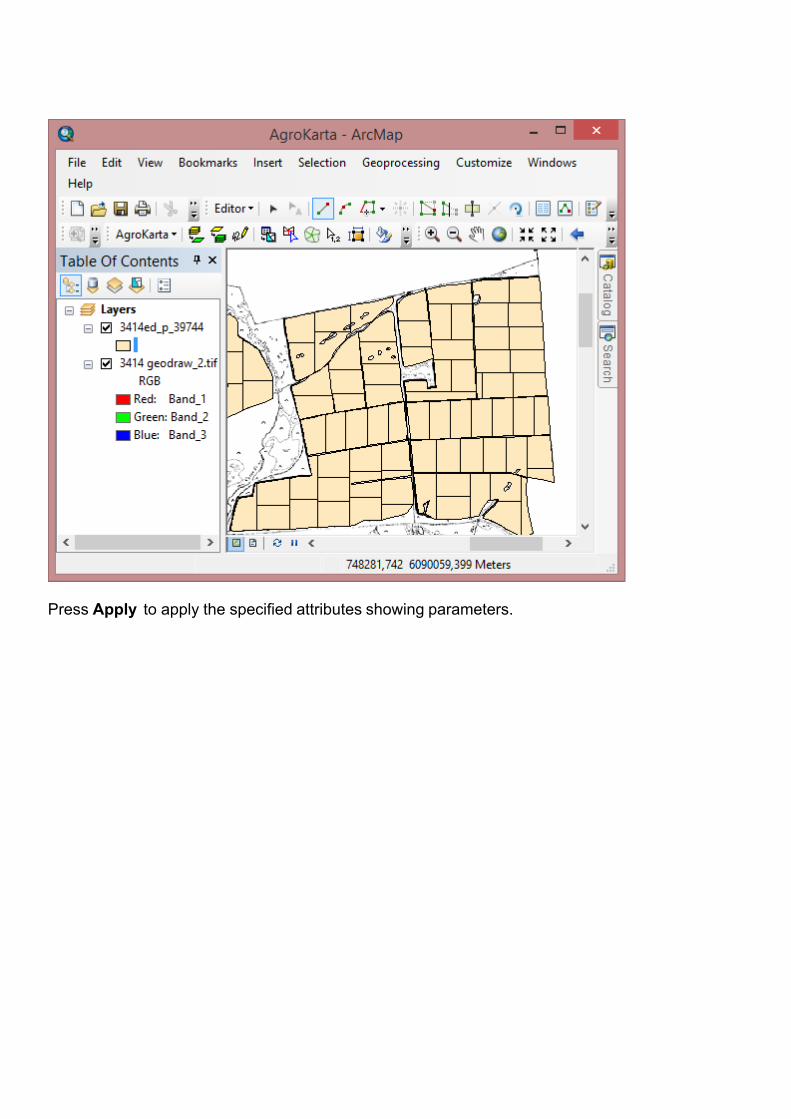
Press Apply to apply the specified attributes showing parameters.
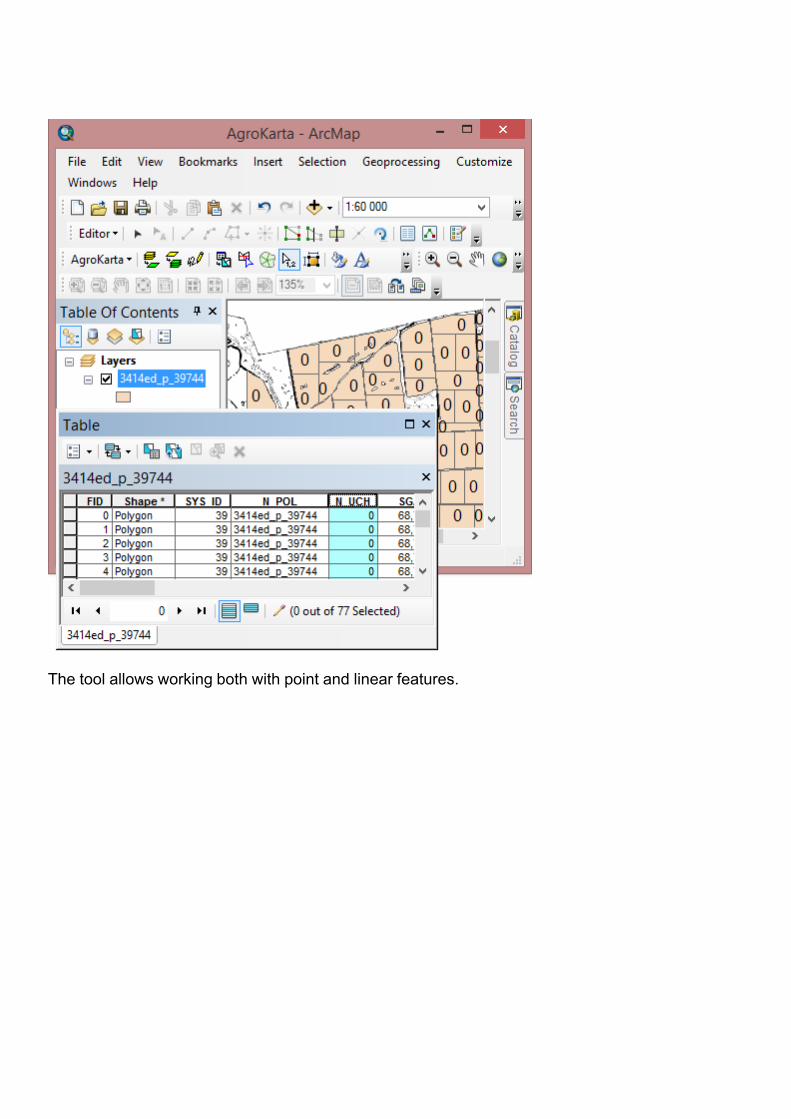
The tool allows working both with point and linear features.
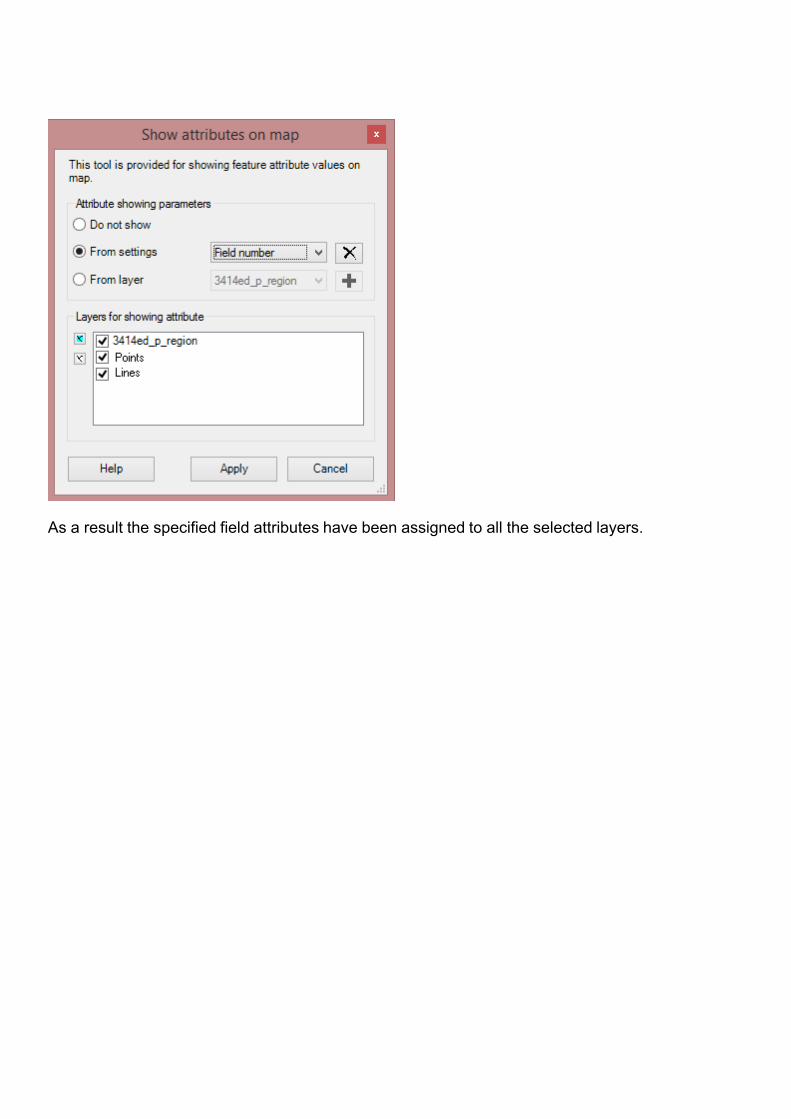
As a result the specified field attributes have been assigned to all the selected layers.
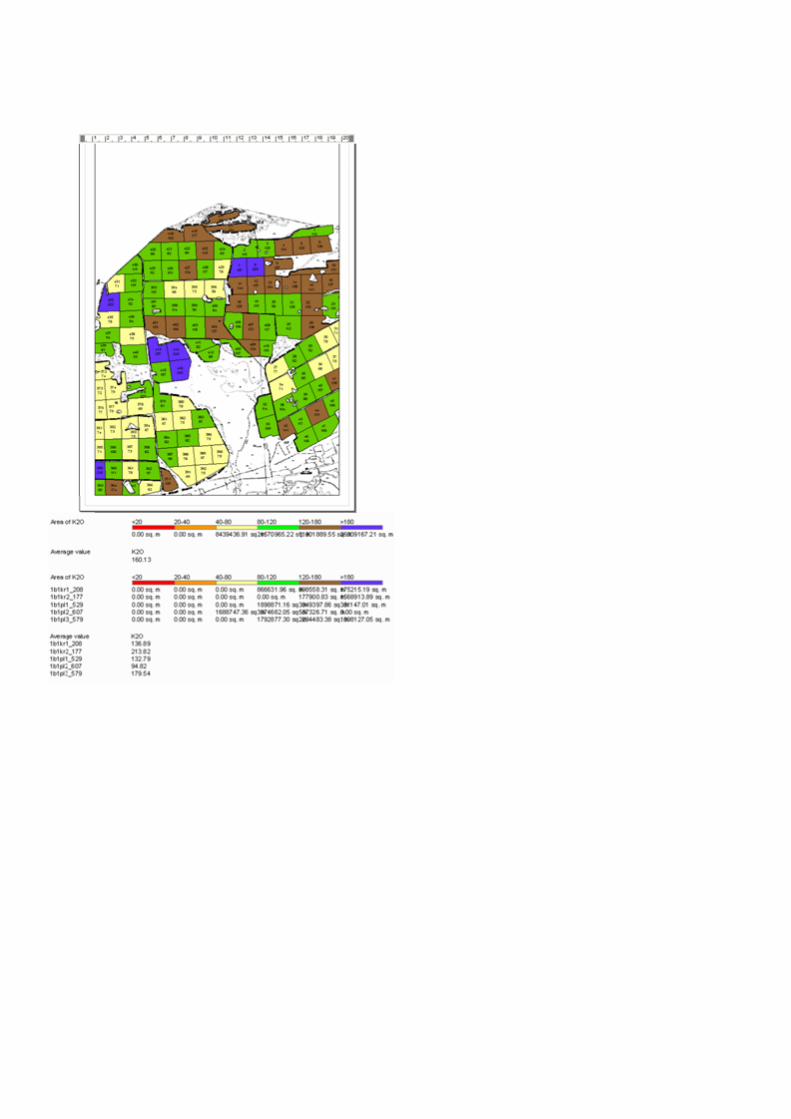
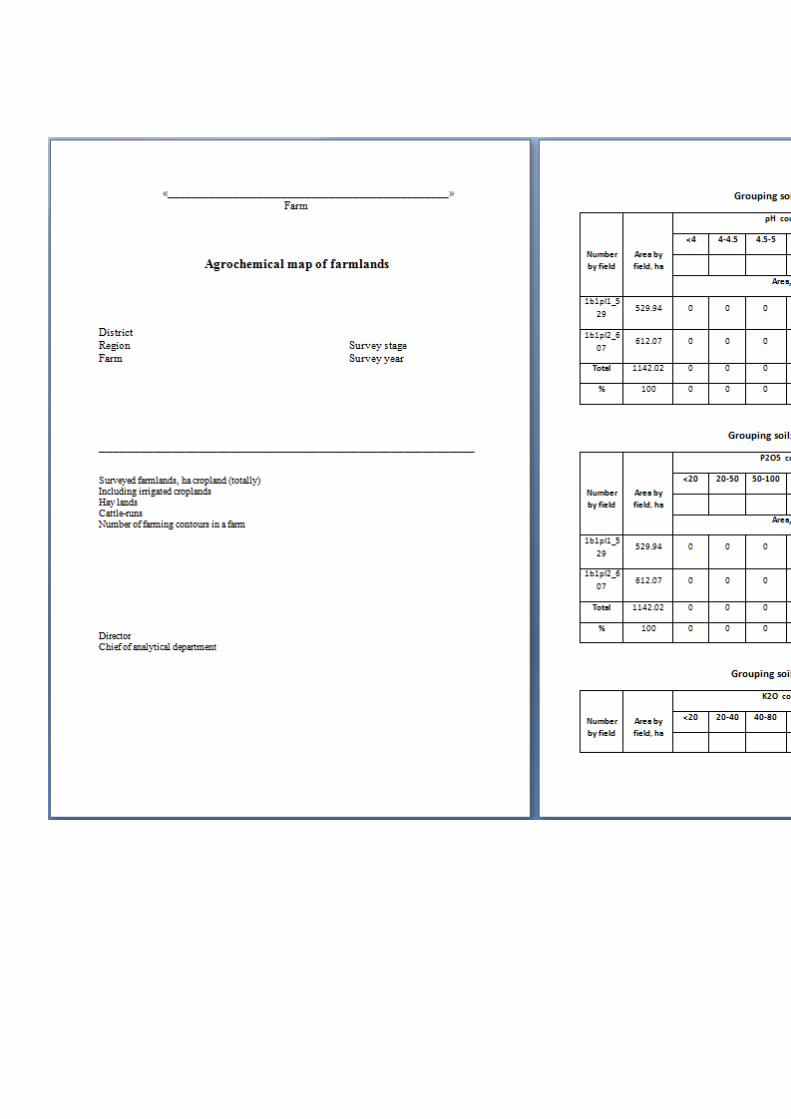
Generating reportsThe Generate reports tool allows performing the following calculations: • total features area by chemical elements;• total features area by chemical elements, grouped by fields;• average chemical elements values;• average chemical elements values, grouped by fields. The total area is calculated based on the chemical elements scale approved by the Department of Agriculture of Russian Federation. The tool allows to generate the "Agrochemical map of farmlands" report in *.doc format.

Press Generate to start the process of generating selected reports based on the specified data.
The resulted reports will be added to the current ArcMap document layout.

Following parameters are represented in the report: • total features area by chemical elements
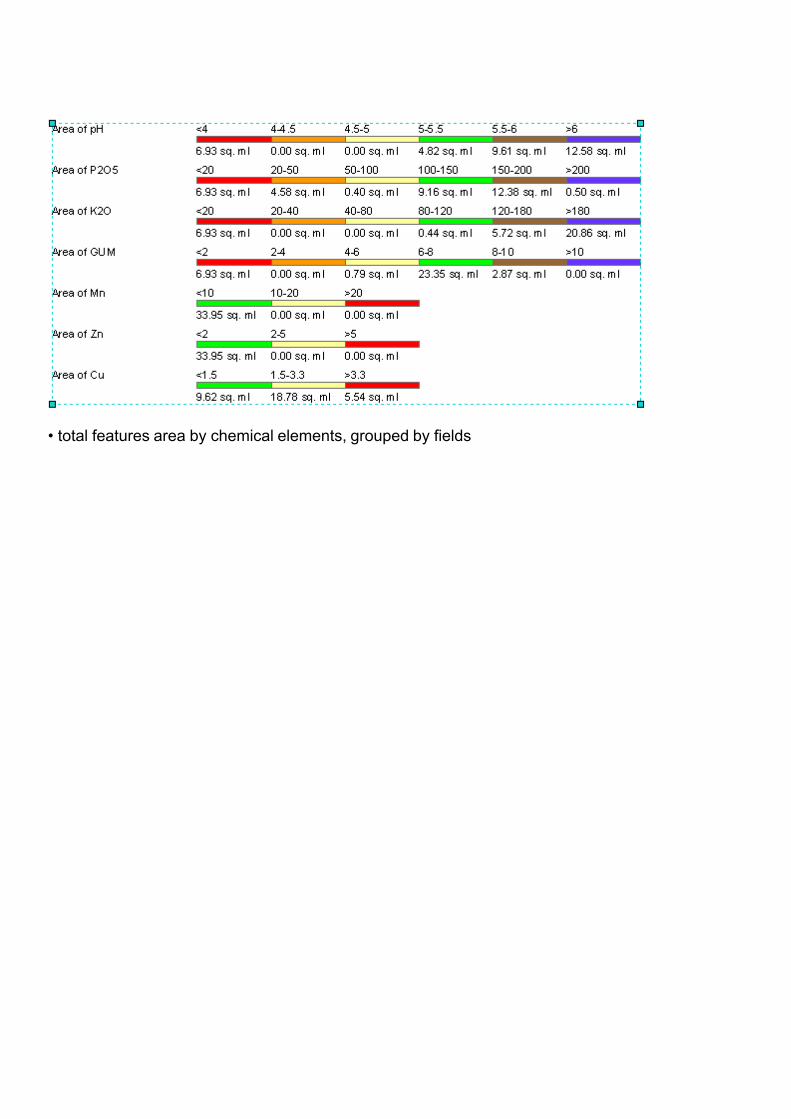
• total features area by chemical elements, grouped by fields
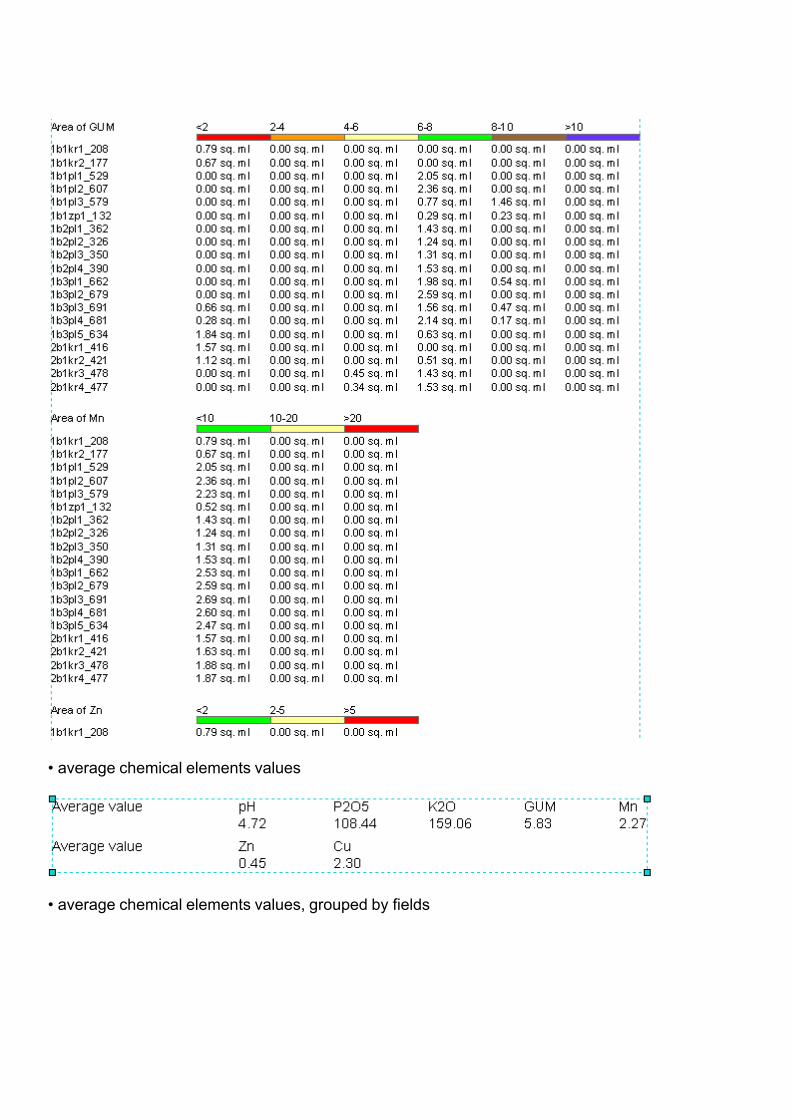
• average chemical elements values
• average chemical elements values, grouped by fields
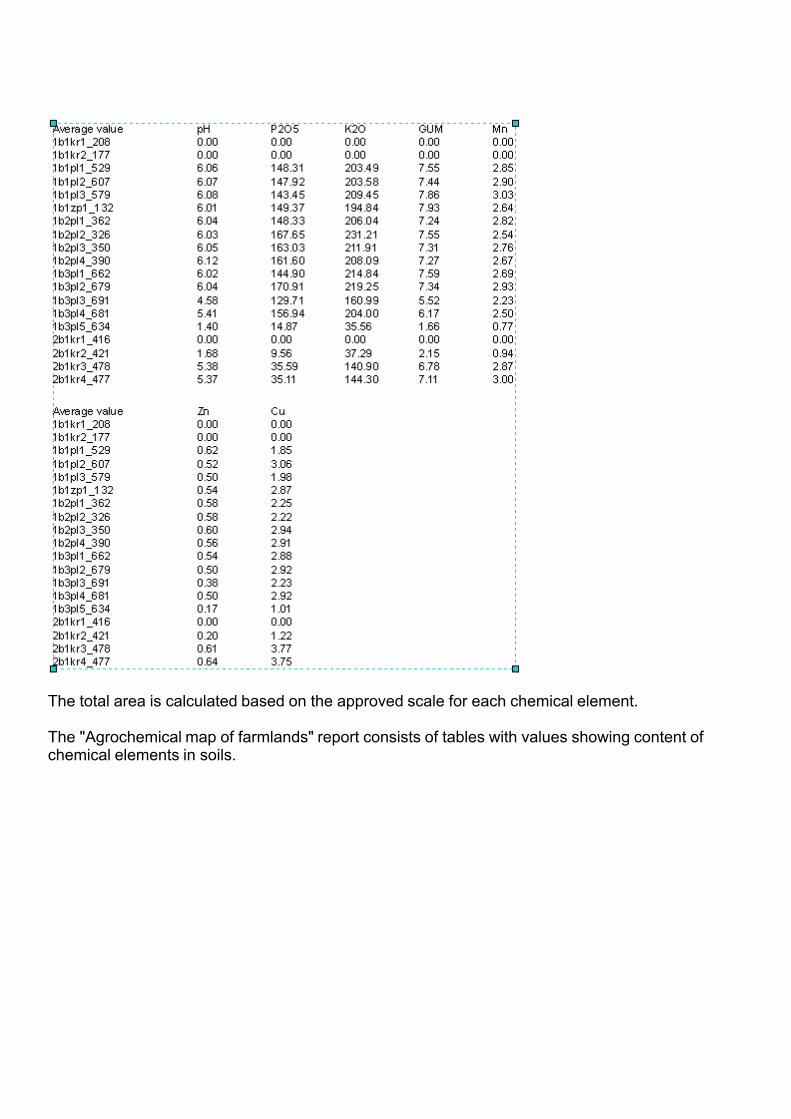
The total area is calculated based on the approved scale for each chemical element. The "Agrochemical map of farmlands" report consists of tables with values showing content of chemical elements in soils.
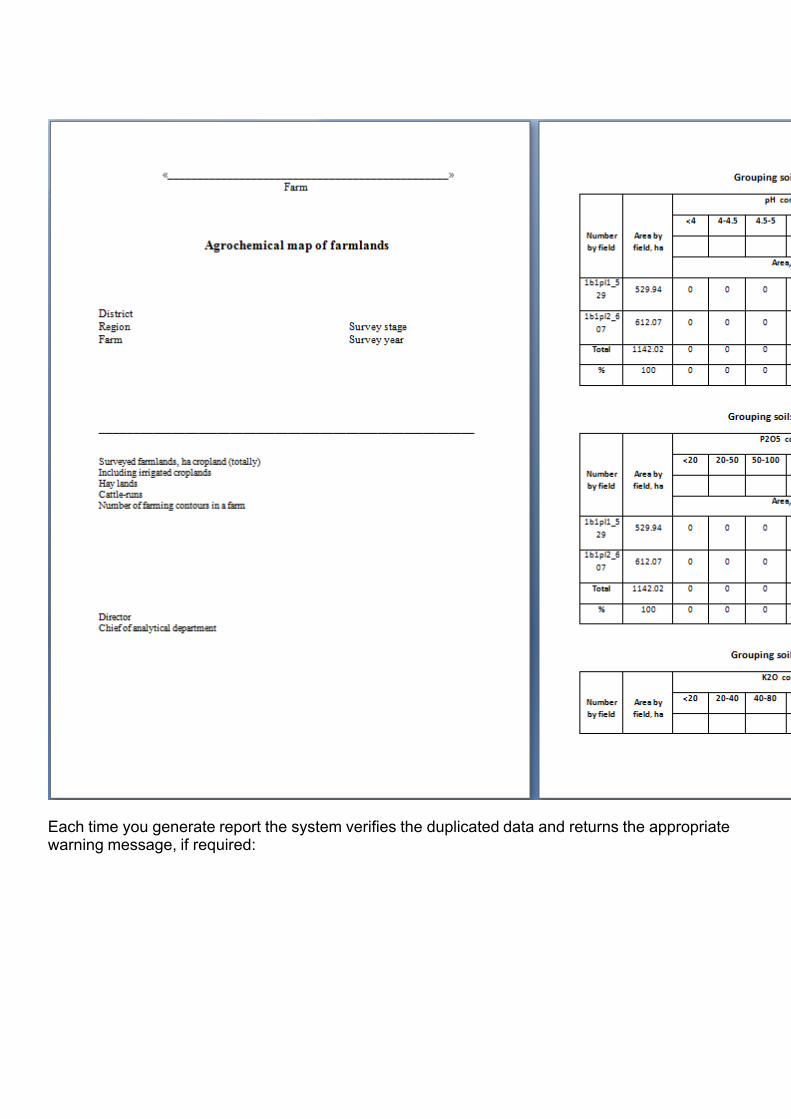
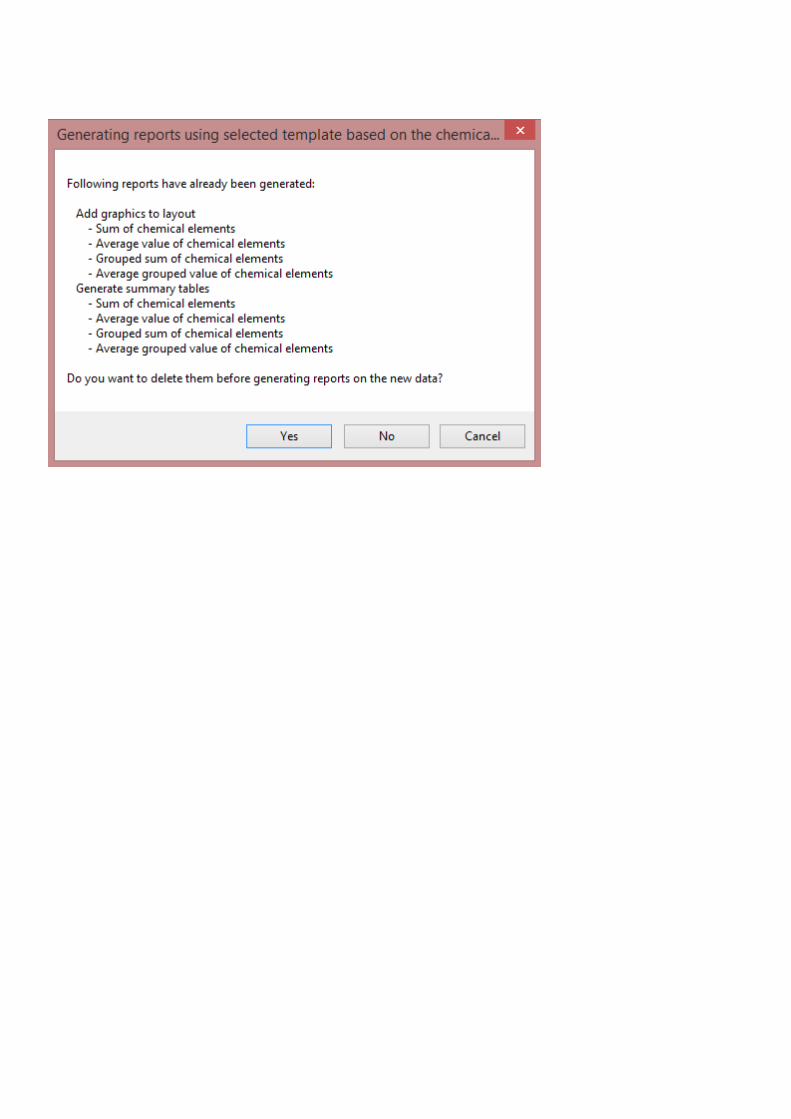
Each time you generate report the system verifies the duplicated data and returns the appropriate warning message, if required:
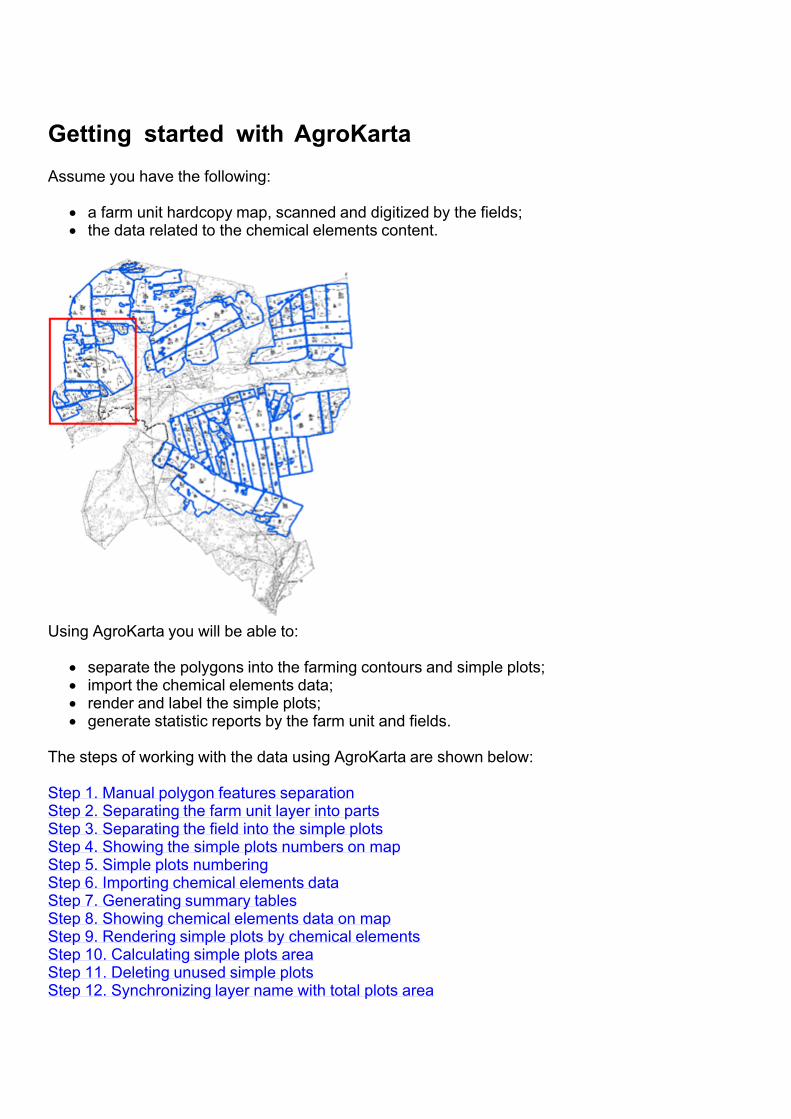
Getting started with AgroKartaAssume you have the following:
a farm unit hardcopy map, scanned and digitized by the fields;the data related to the chemical elements content.
Using AgroKarta you will be able to:
separate the polygons into the farming contours and simple plots;import the chemical elements data;render and label the simple plots;generate statistic reports by the farm unit and fields.
The steps of working with the data using AgroKarta are shown below: Step 1. Manual polygon features separationStep 2. Separating the farm unit layer into partsStep 3. Separating the field into the simple plots Step 4. Showing the simple plots numbers on map Step 5. Simple plots numbering Step 6. Importing chemical elements data Step 7. Generating summary tables Step 8. Showing chemical elements data on map Step 9. Rendering simple plots by chemical elements Step 10. Calculating simple plots area Step 11. Deleting unused simple plots Step 12. Synchronizing layer name with total plots area

Step 13. Generating report by chemical elements
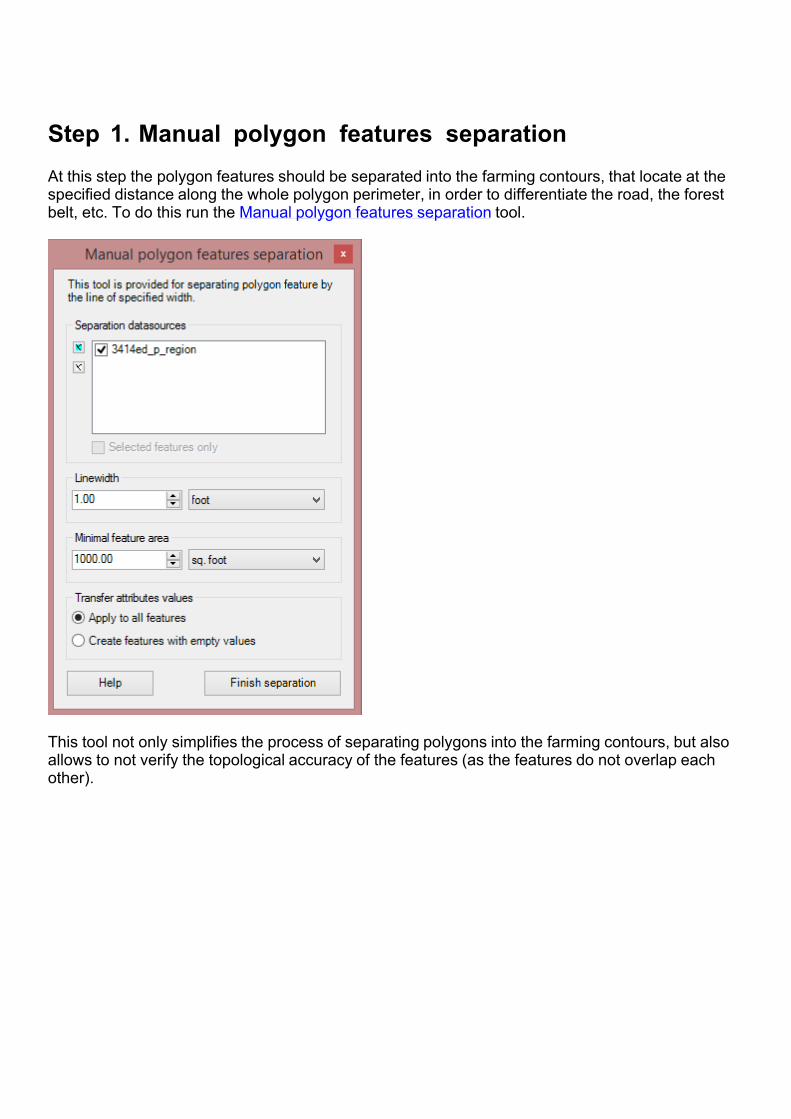
Step 1. Manual polygon features separationAt this step the polygon features should be separated into the farming contours, that locate at the specified distance along the whole polygon perimeter, in order to differentiate the road, the forest belt, etc. To do this run the Manual polygon features separation tool.
This tool not only simplifies the process of separating polygons into the farming contours, but also allows to not verify the topological accuracy of the features (as the features do not overlap each other).
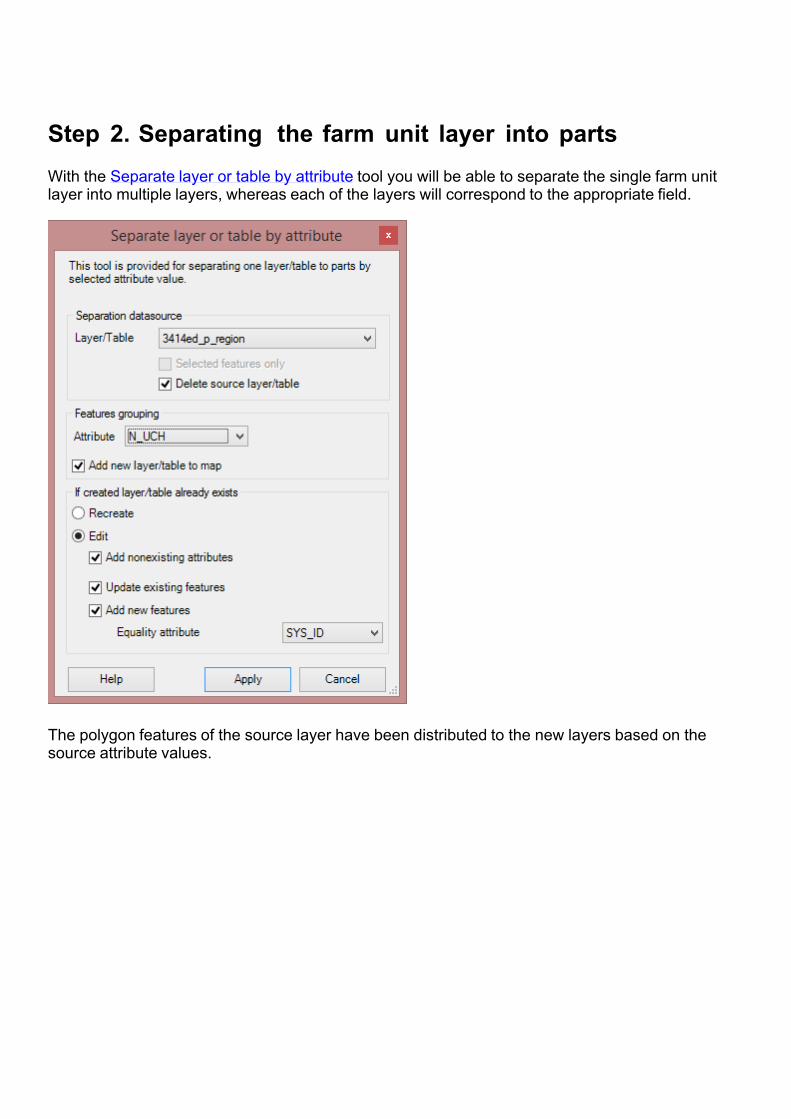
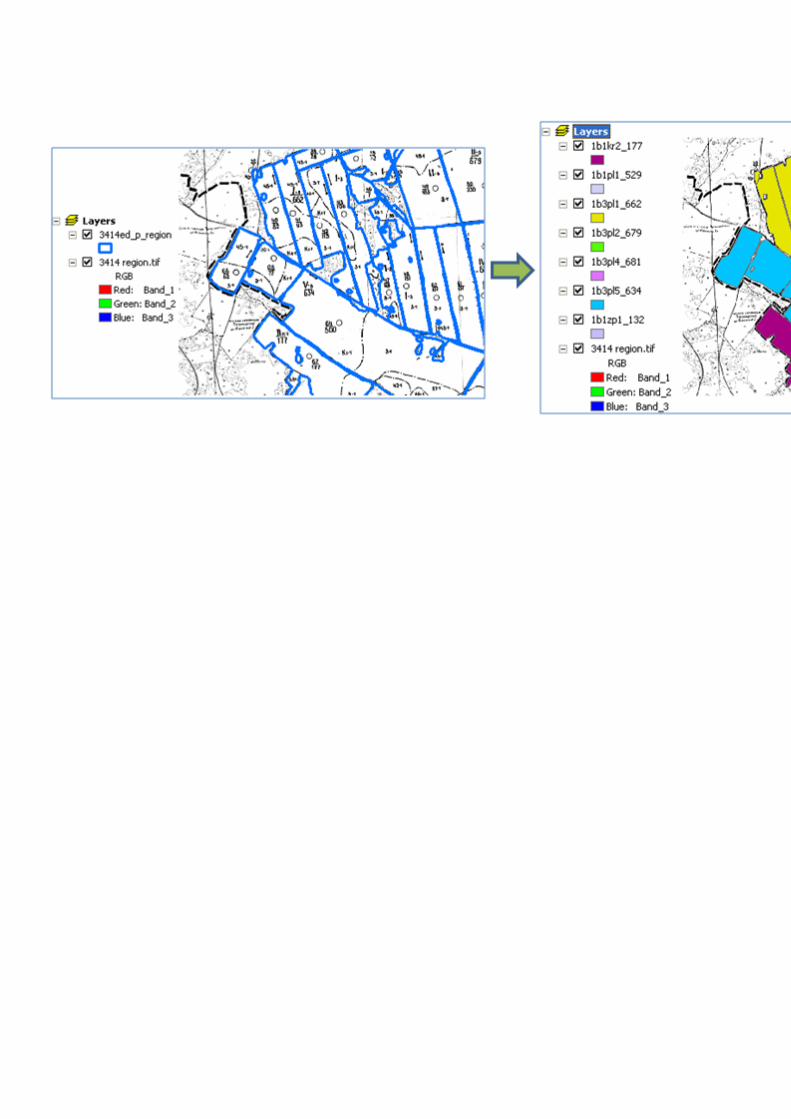
Step 2. Separating the farm unit layer into parts With the Separate layer or table by attribute tool you will be able to separate the single farm unit layer into multiple layers, whereas each of the layers will correspond to the appropriate field.
The polygon features of the source layer have been distributed to the new layers based on the source attribute values.
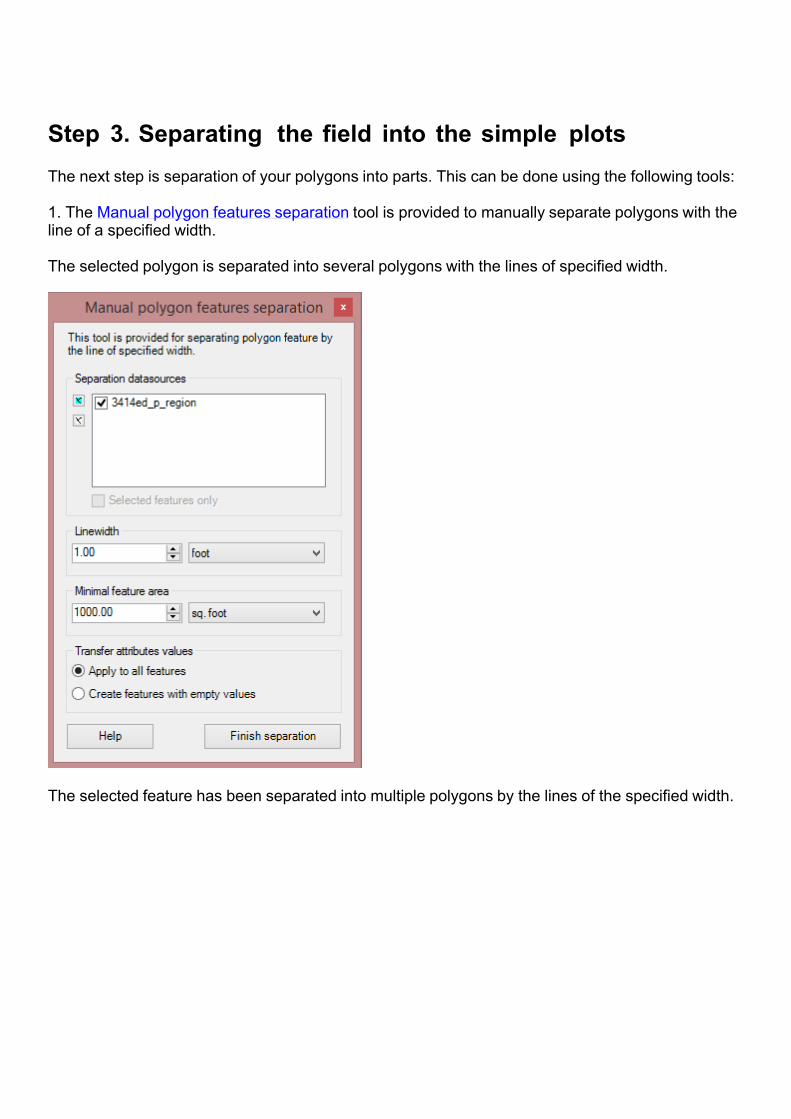
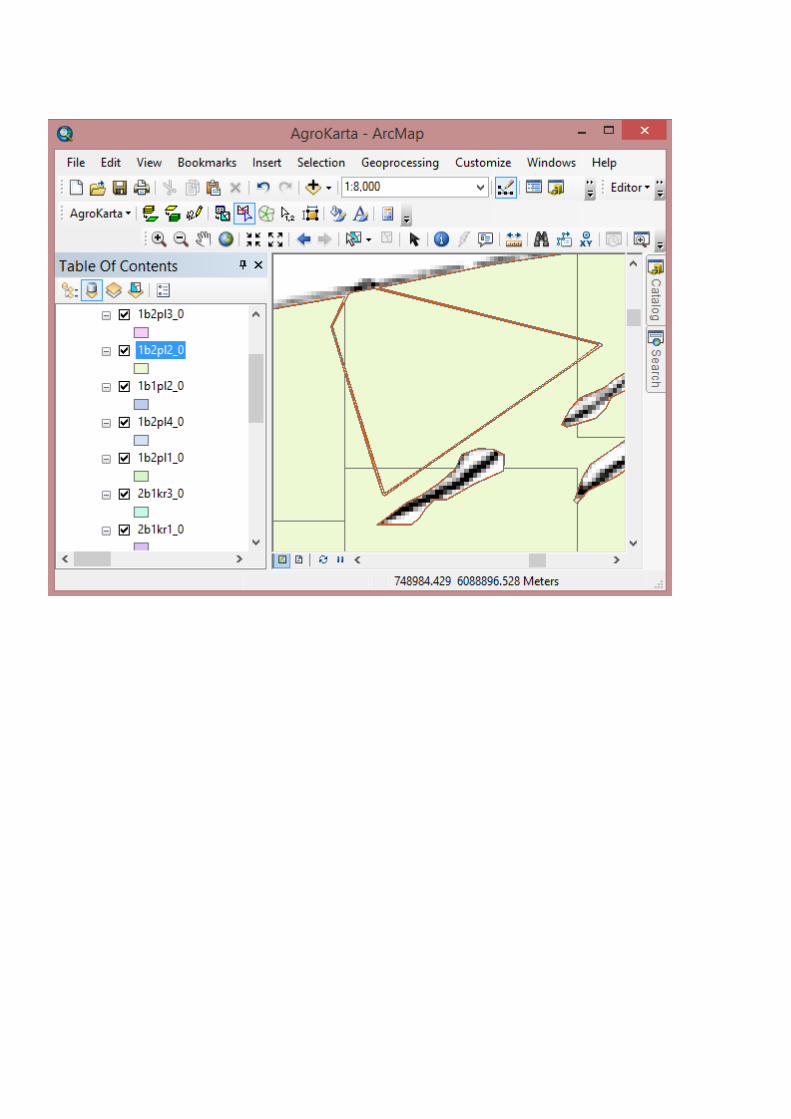
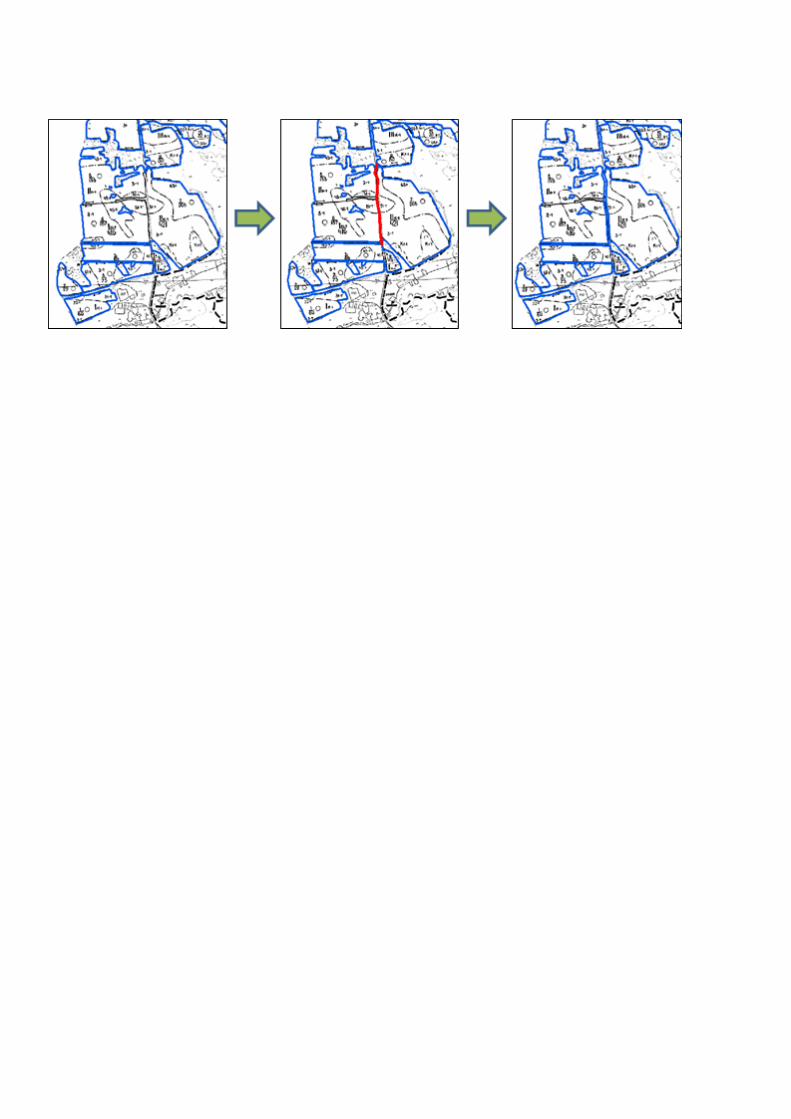
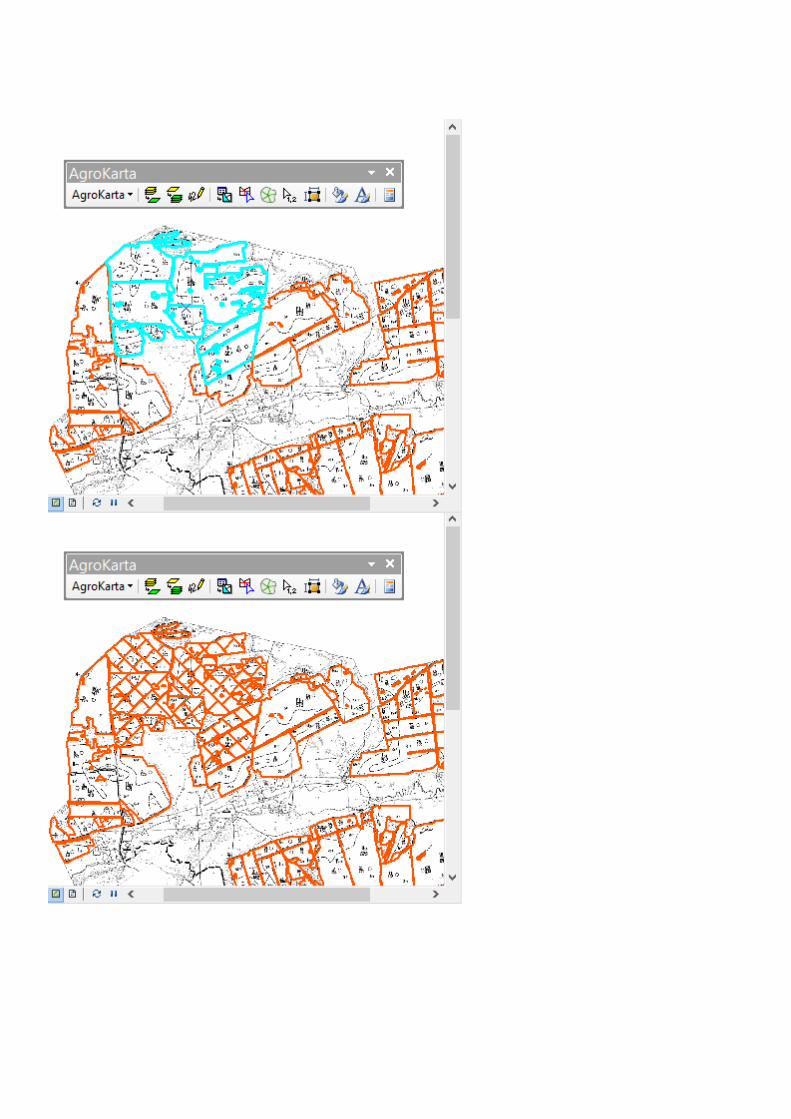
Step 3. Separating the field into the simple plotsThe next step is separation of your polygons into parts. This can be done using the following tools: 1. The Manual polygon features separation tool is provided to manually separate polygons with the line of a specified width. The selected polygon is separated into several polygons with the lines of specified width.
The selected feature has been separated into multiple polygons by the lines of the specified width.
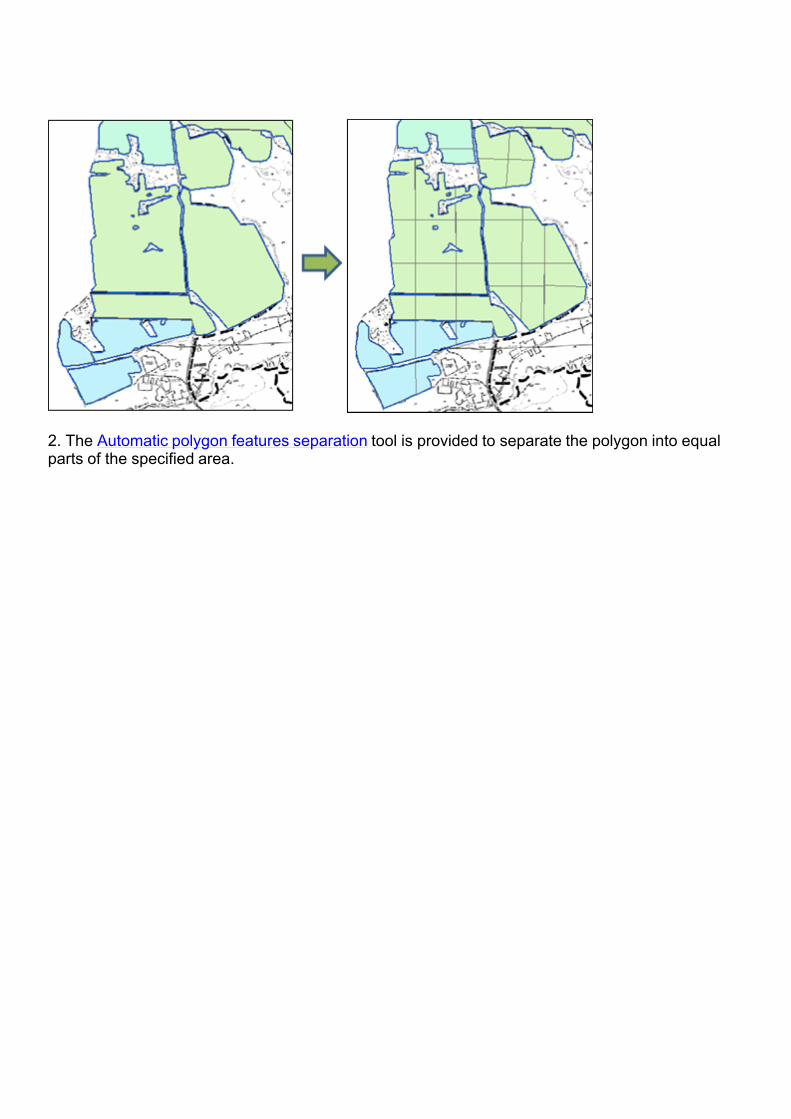
2. The Automatic polygon features separation tool is provided to separate the polygon into equal parts of the specified area.
The result will look as following:

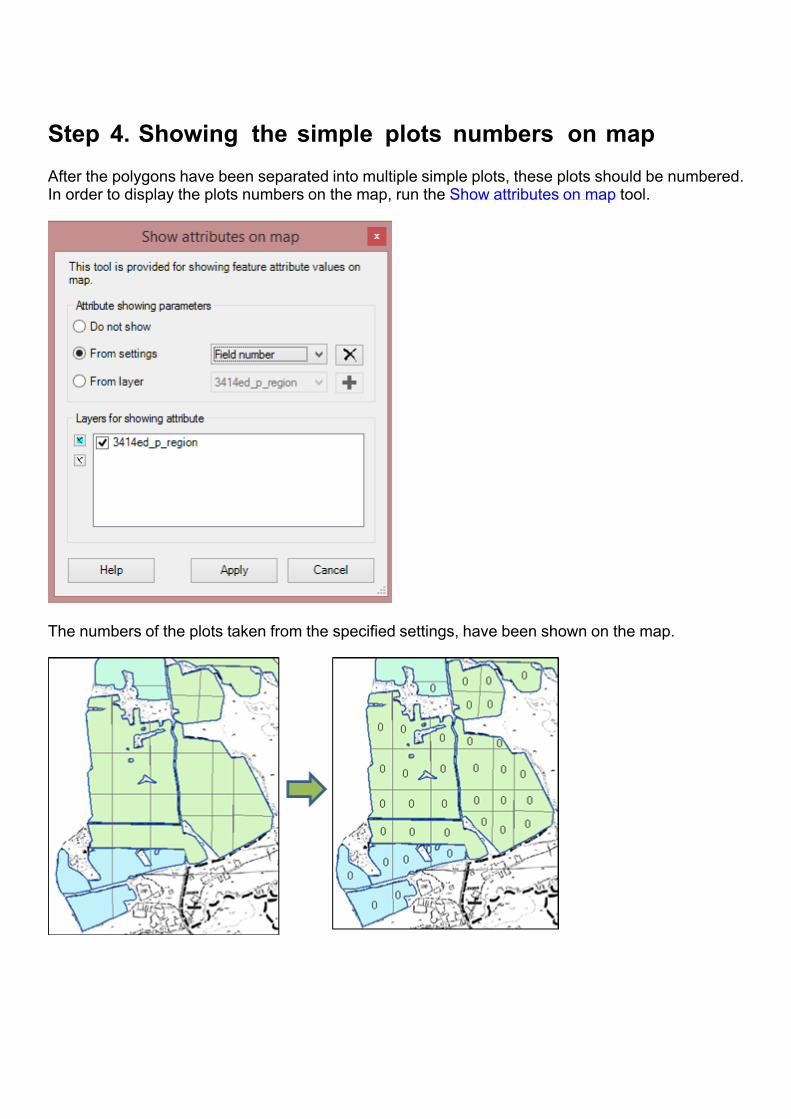
Step 4. Showing the simple plots numbers on mapAfter the polygons have been separated into multiple simple plots, these plots should be numbered. In order to display the plots numbers on the map, run the Show attributes on map tool.
The numbers of the plots taken from the specified settings, have been shown on the map.
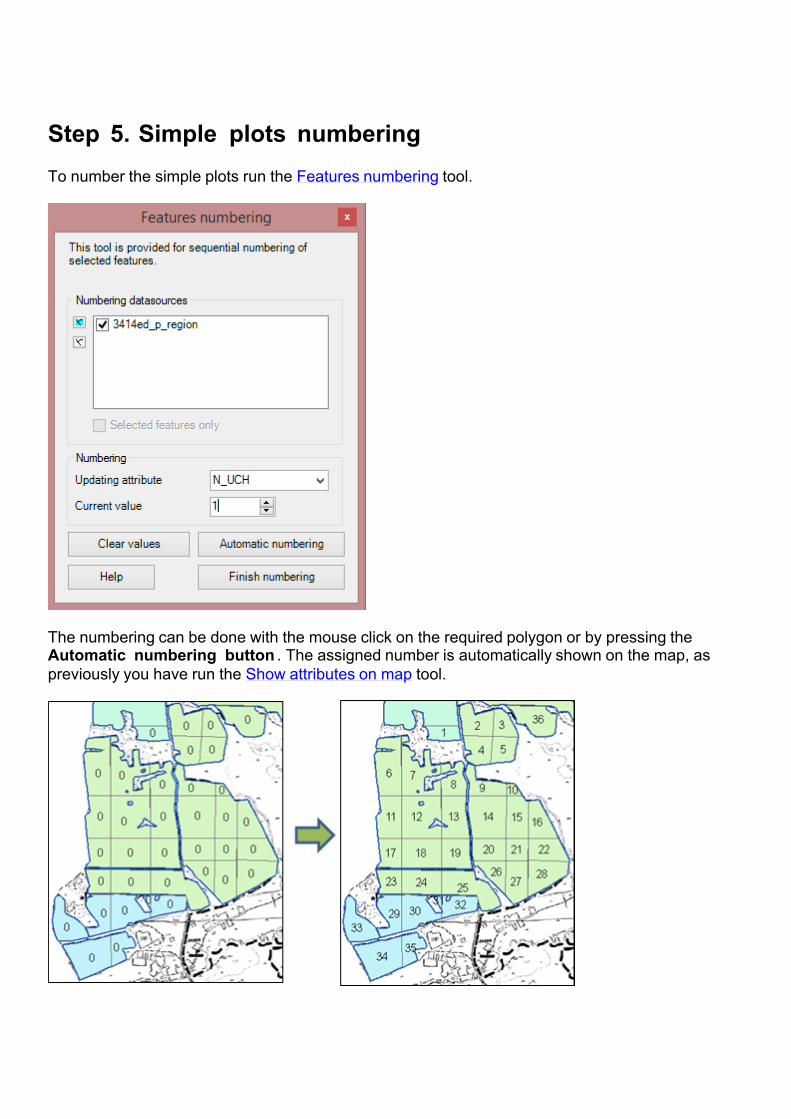
Step 5. Simple plots numberingTo number the simple plots run the Features numbering tool.
The numbering can be done with the mouse click on the required polygon or by pressing the Automatic numbering button . The assigned number is automatically shown on the map, as previously you have run the Show attributes on map tool.
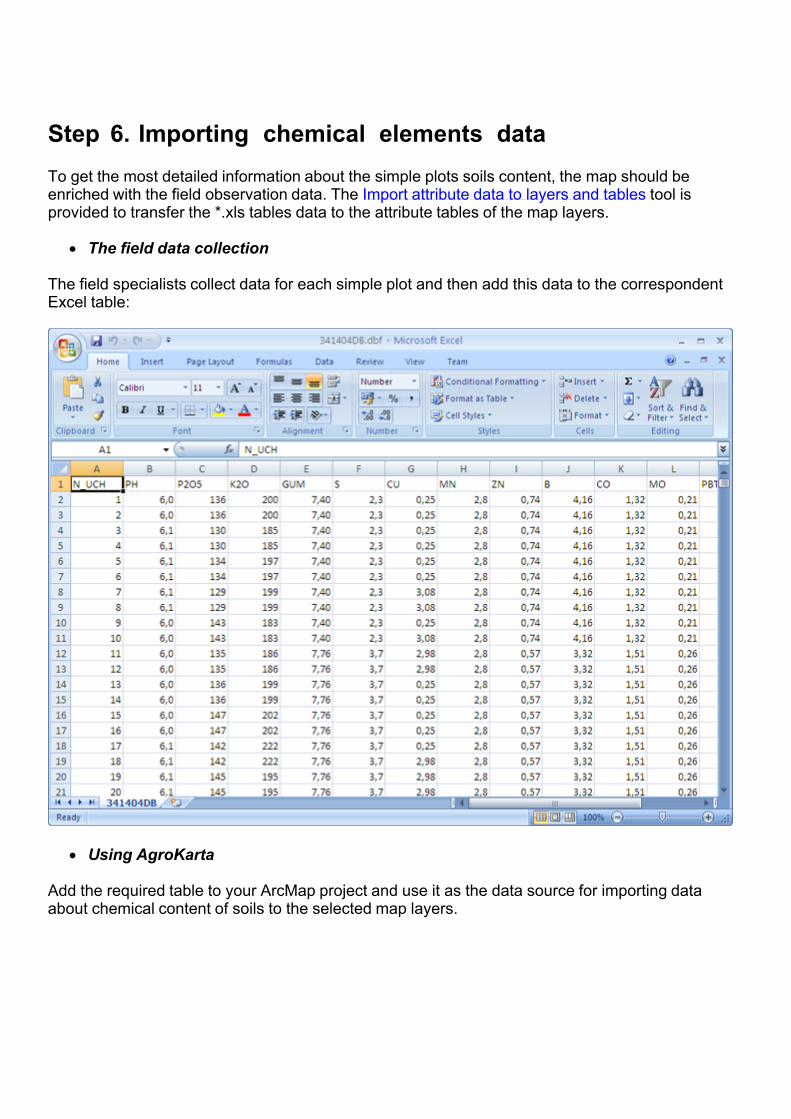
Step 6. Importing chemical elements dataTo get the most detailed information about the simple plots soils content, the map should be enriched with the field observation data. The Import attribute data to layers and tables tool is provided to transfer the *.xls tables data to the attribute tables of the map layers.
The field data collection The field specialists collect data for each simple plot and then add this data to the correspondent Excel table:
Using AgroKarta
Add the required table to your ArcMap project and use it as the data source for importing data about chemical content of soils to the selected map layers.
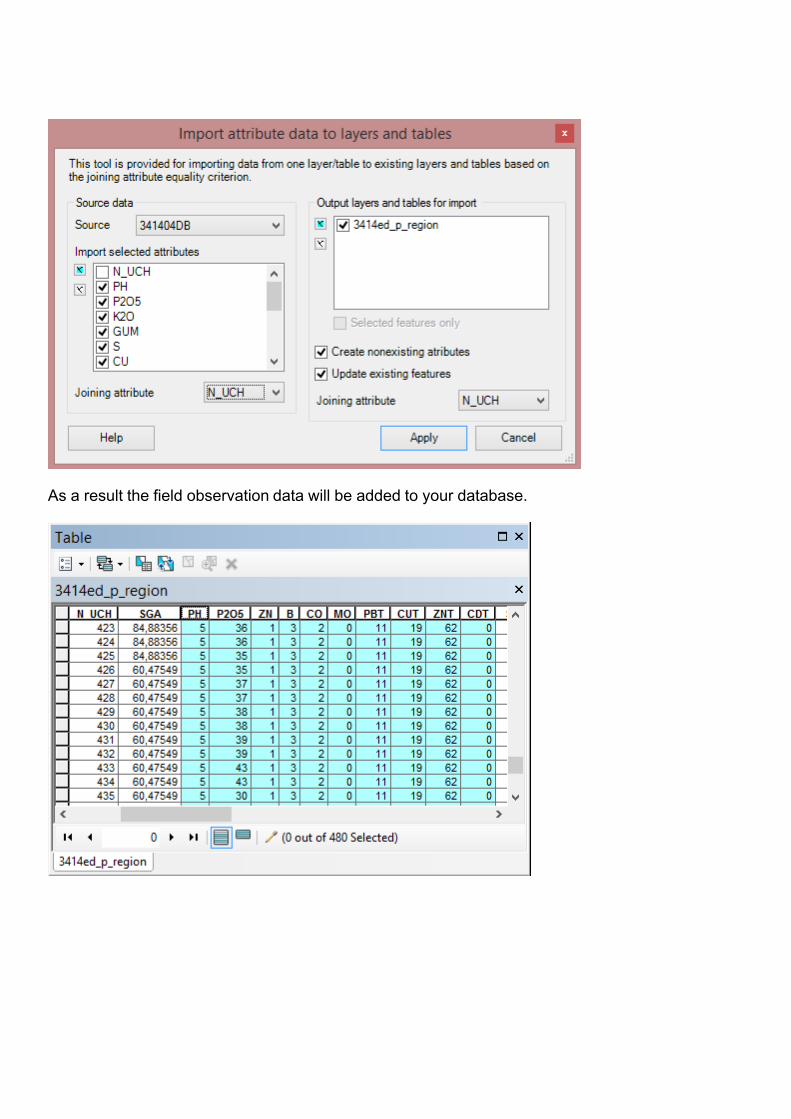
As a result the field observation data will be added to your database.
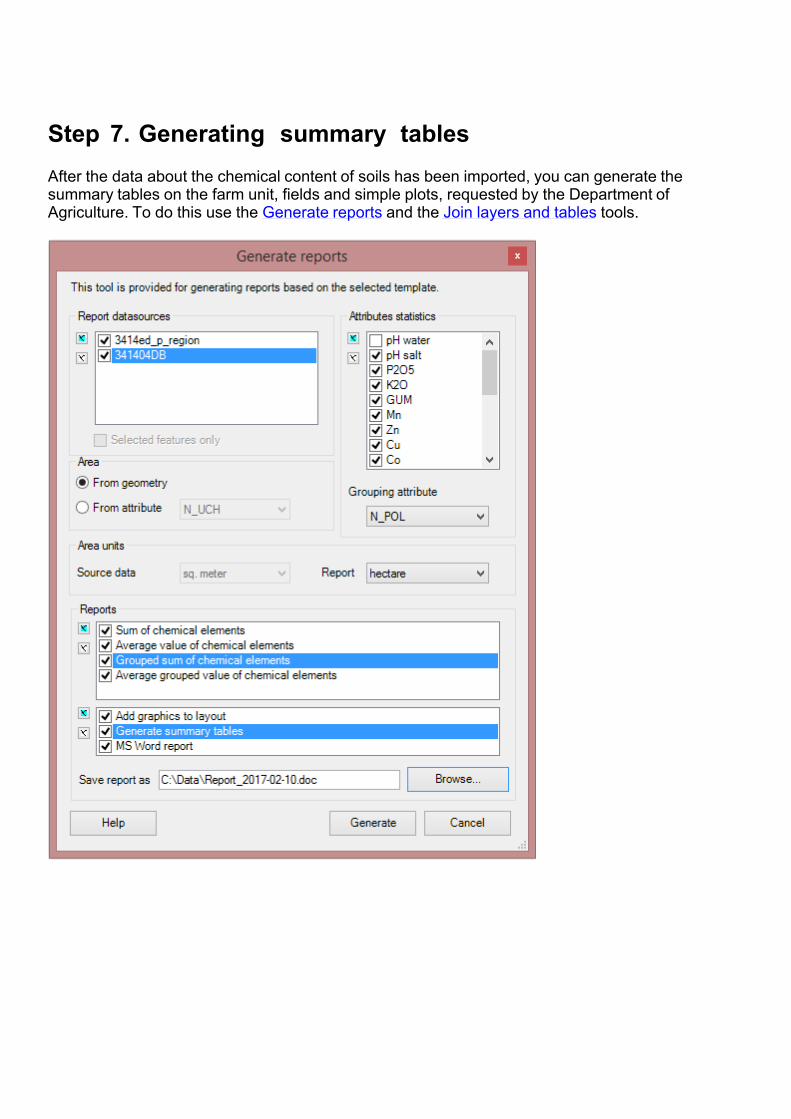
Step 7. Generating summary tablesAfter the data about the chemical content of soils has been imported, you can generate the summary tables on the farm unit, fields and simple plots, requested by the Department of Agriculture. To do this use the Generate reports and the Join layers and tables tools.
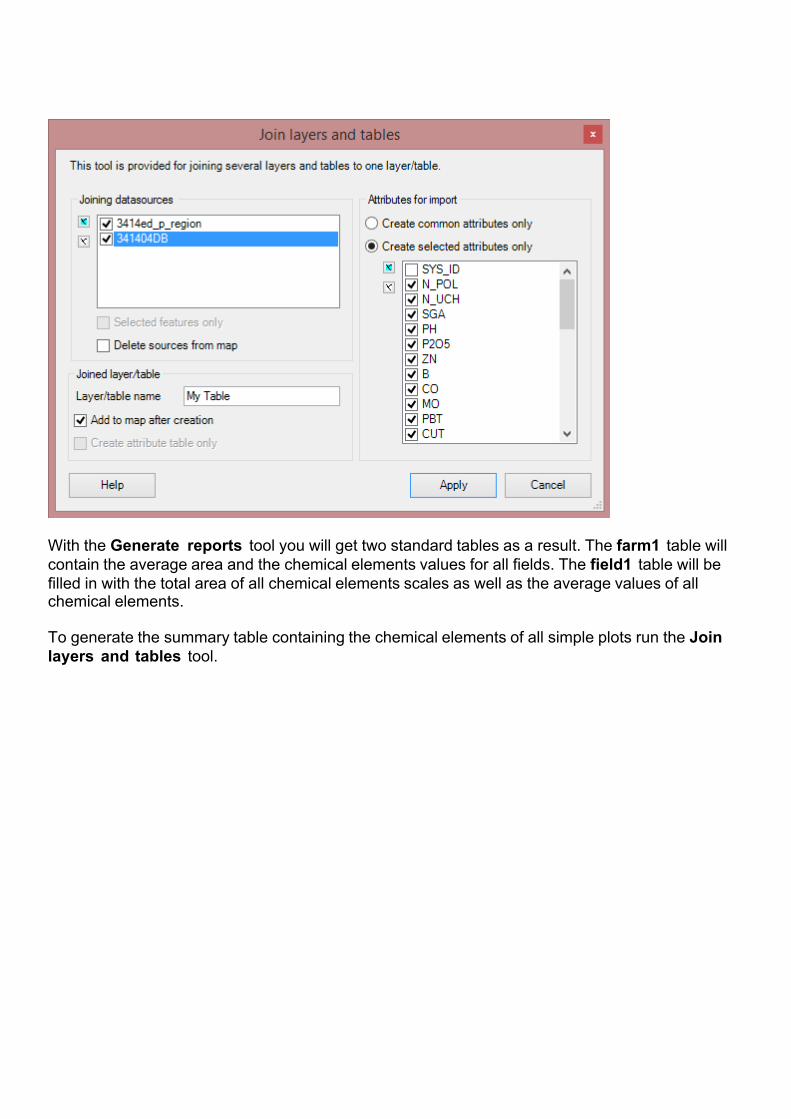
With the Generate reports tool you will get two standard tables as a result. The farm1 table will contain the average area and the chemical elements values for all fields. The field1 table will be filled in with the total area of all chemical elements scales as well as the average values of all chemical elements. To generate the summary table containing the chemical elements of all simple plots run the Join layers and tables tool.

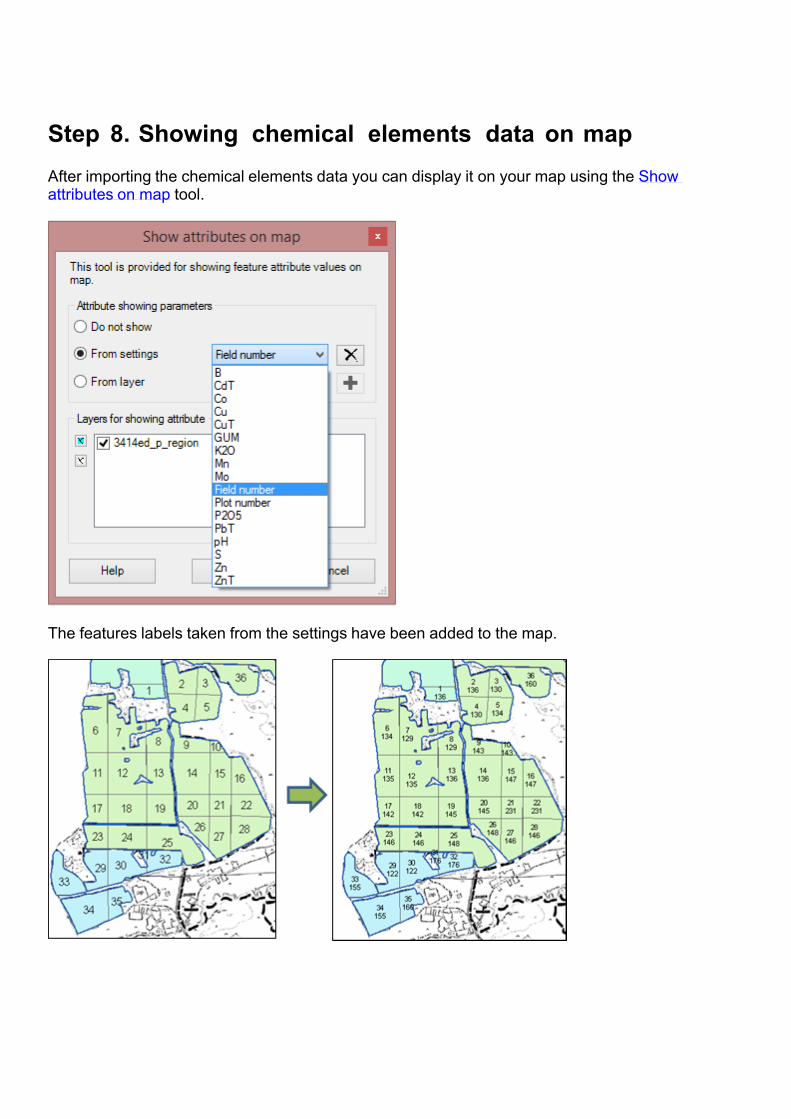
Step 8. Showing chemical elements data on mapAfter importing the chemical elements data you can display it on your map using the Show attributes on map tool.
The features labels taken from the settings have been added to the map.
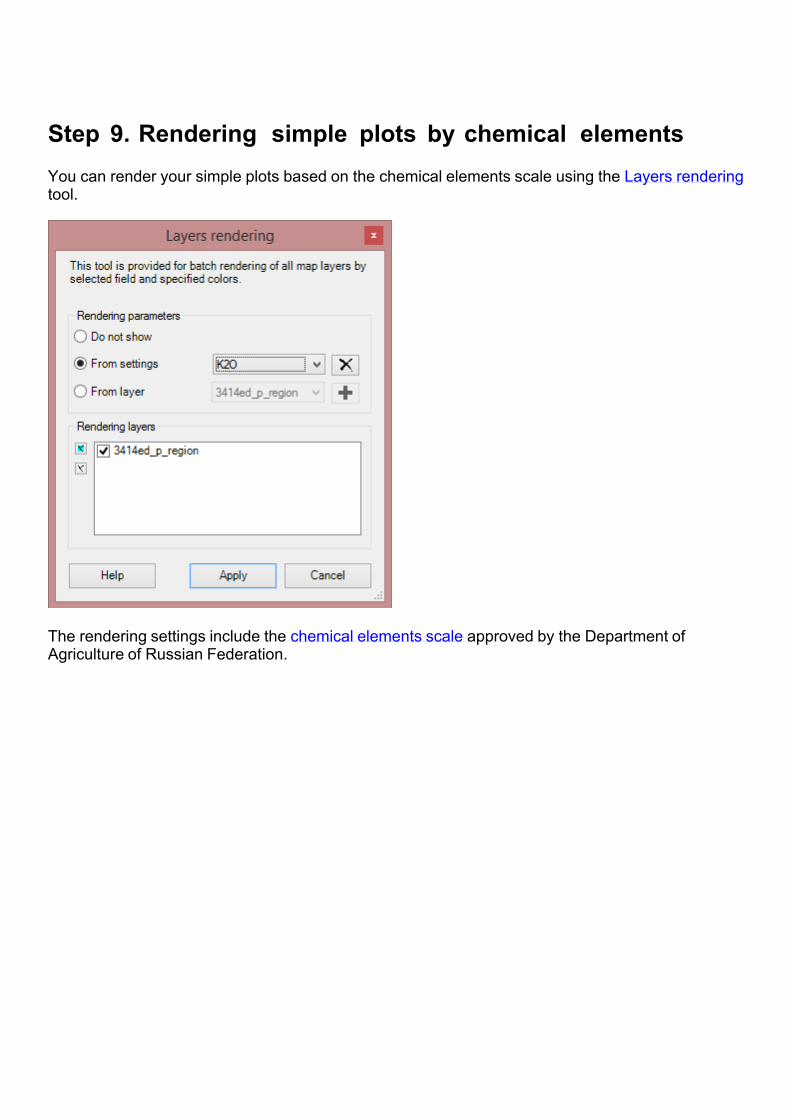
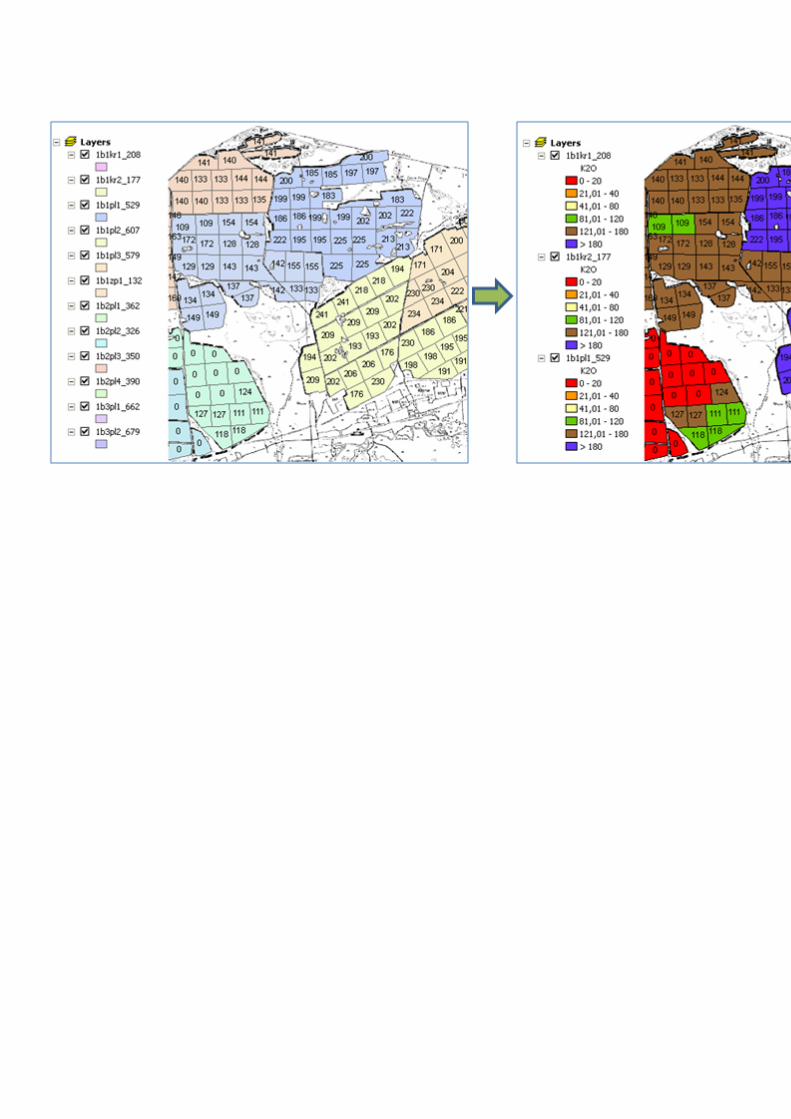
Step 9. Rendering simple plots by chemical elementsYou can render your simple plots based on the chemical elements scale using the Layers rendering tool.
The rendering settings include the chemical elements scale approved by the Department of Agriculture of Russian Federation.
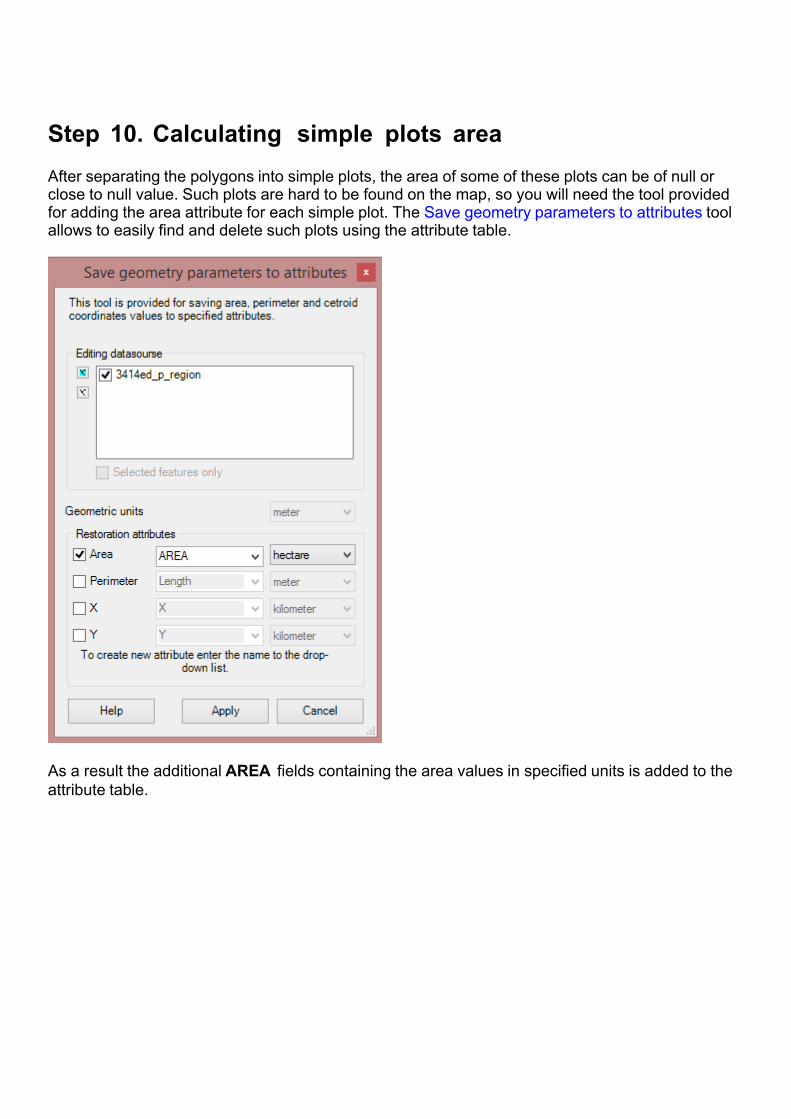
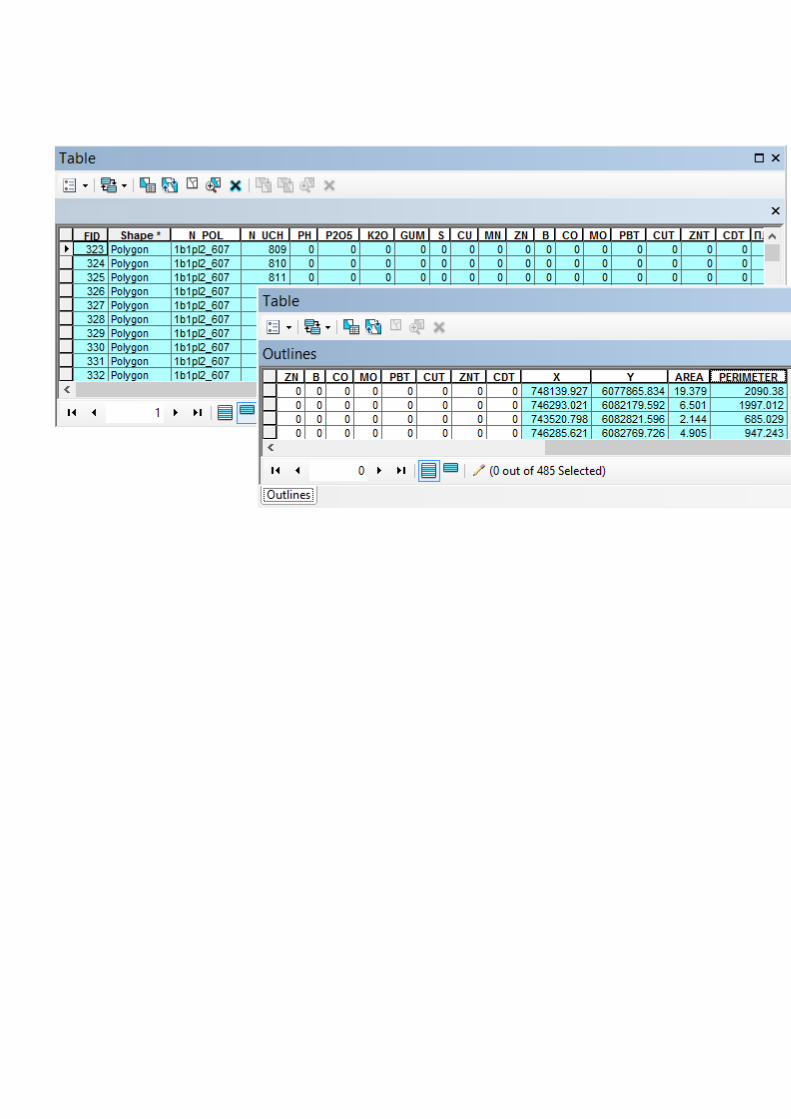
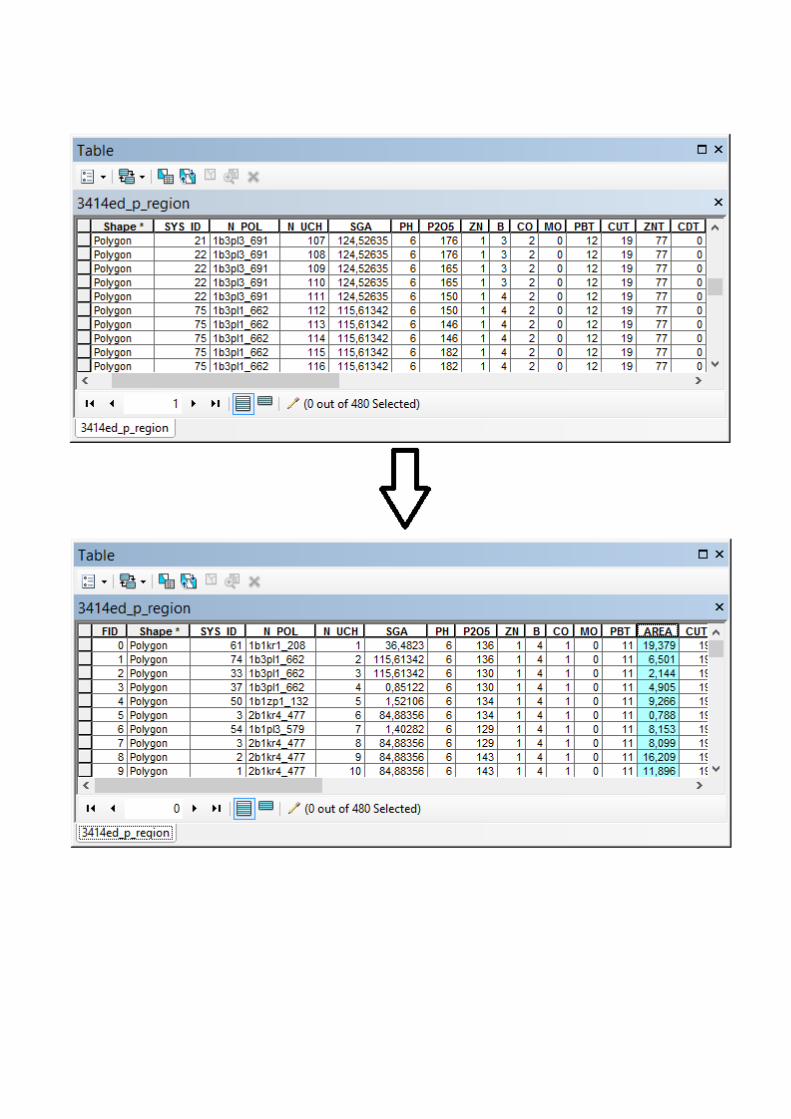
Step 10. Calculating simple plots areaAfter separating the polygons into simple plots, the area of some of these plots can be of null or close to null value. Such plots are hard to be found on the map, so you will need the tool provided for adding the area attribute for each simple plot. The Save geometry parameters to attributes tool allows to easily find and delete such plots using the attribute table.
As a result the additional AREA fields containing the area values in specified units is added to the attribute table.
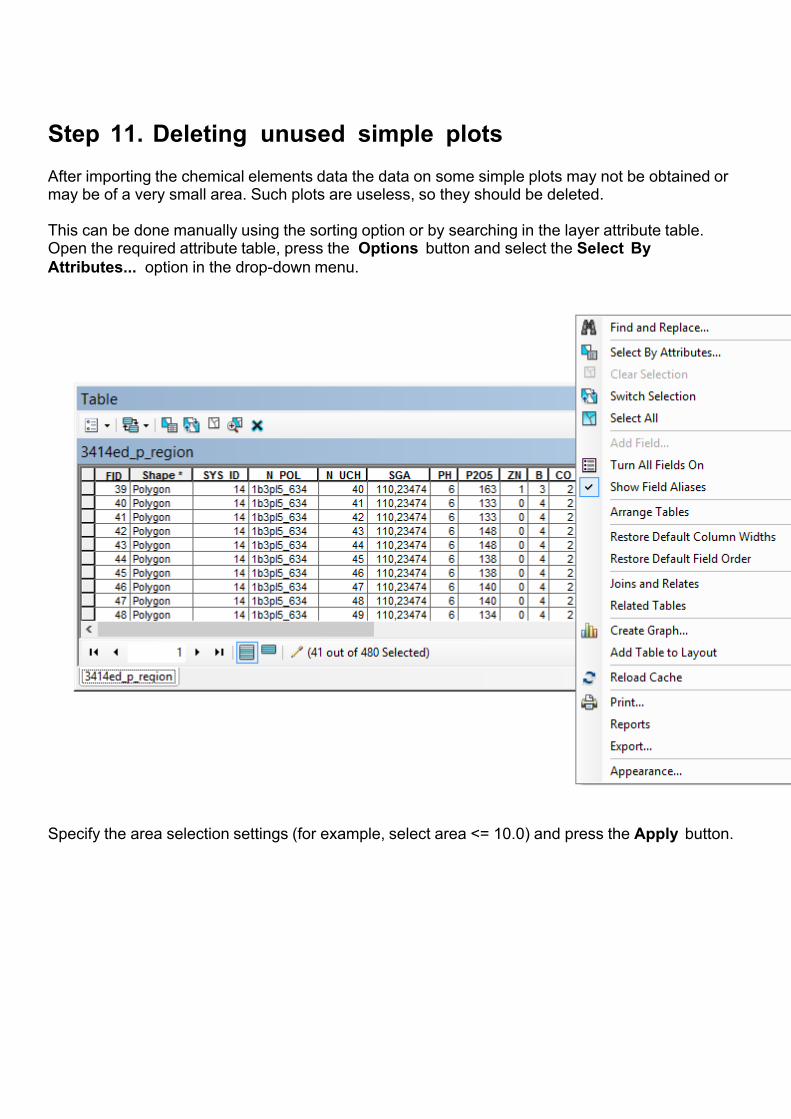
Step 11. Deleting unused simple plotsAfter importing the chemical elements data the data on some simple plots may not be obtained or may be of a very small area. Such plots are useless, so they should be deleted. This can be done manually using the sorting option or by searching in the layer attribute table. Open the required attribute table, press the Options button and select the Select By Attributes... option in the drop-down menu.
Specify the area selection settings (for example, select area <= 10.0) and press the Apply button.
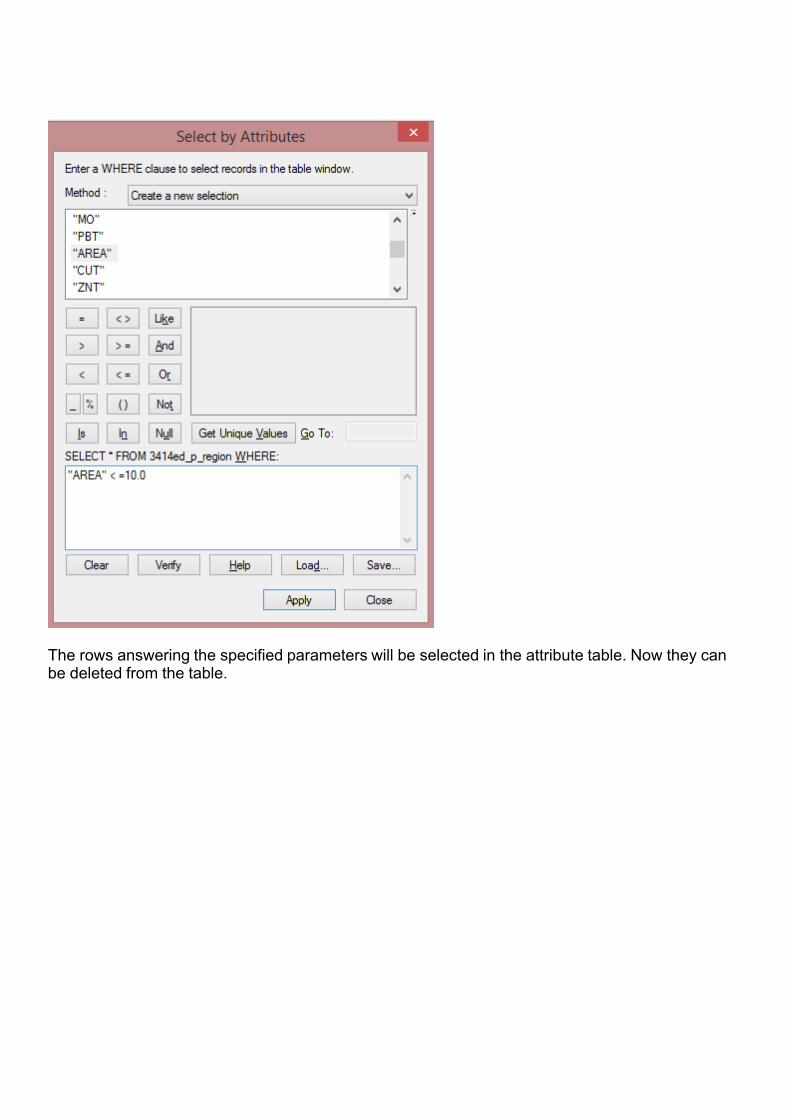
The rows answering the specified parameters will be selected in the attribute table. Now they can be deleted from the table.
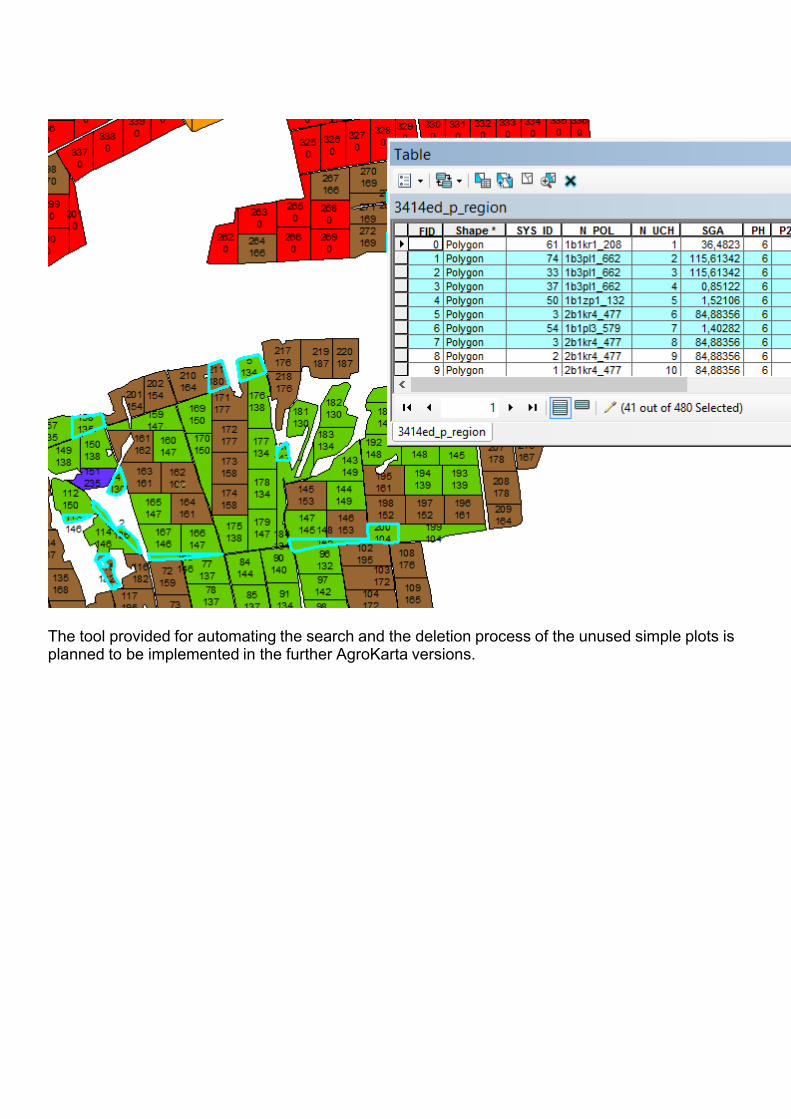
The tool provided for automating the search and the deletion process of the unused simple plots is planned to be implemented in the further AgroKarta versions.
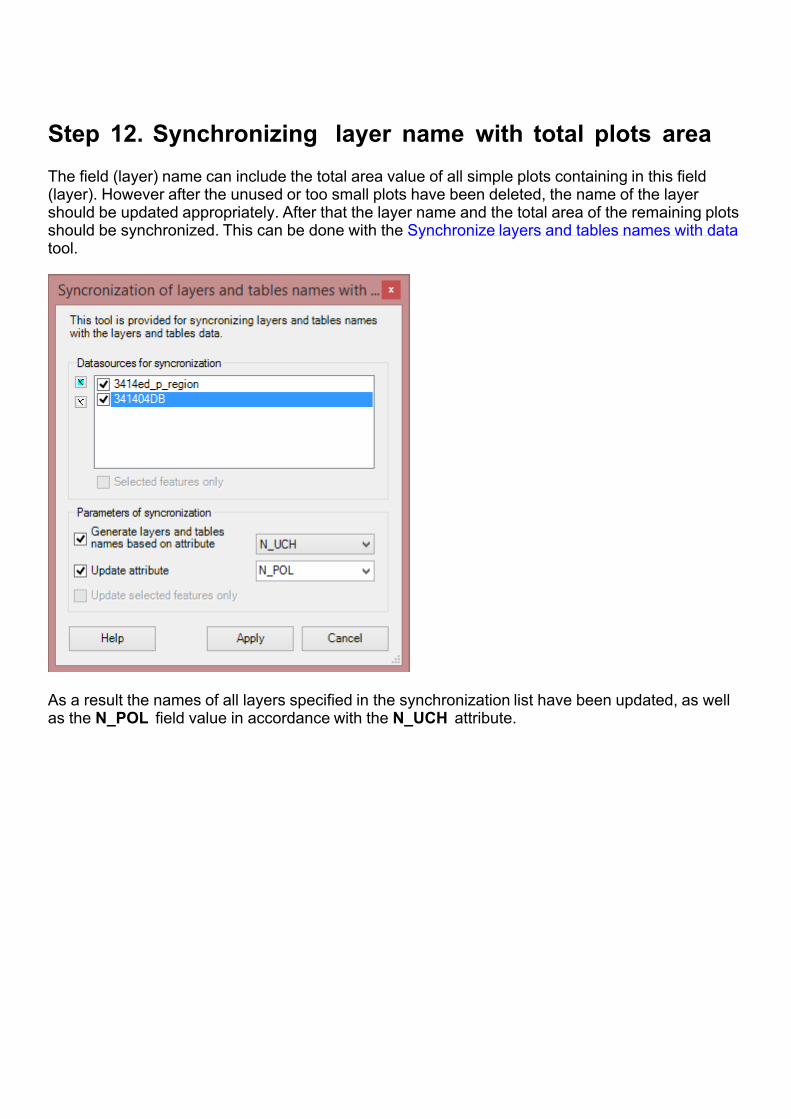
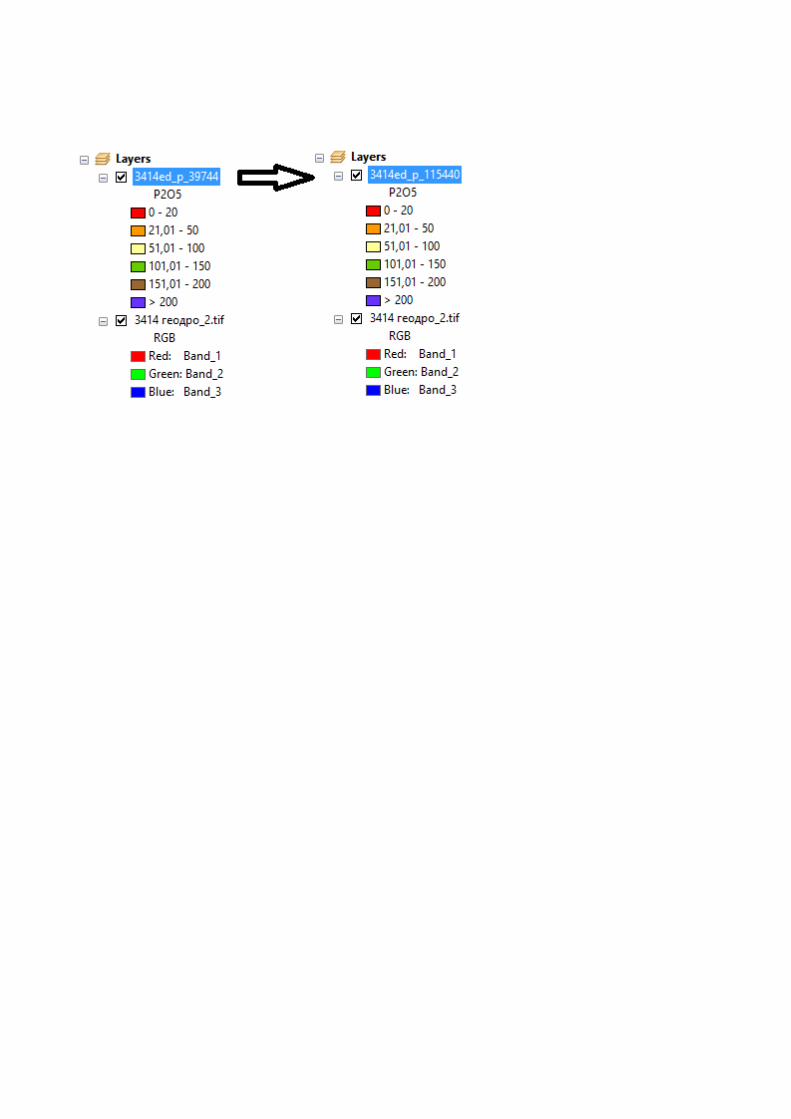
Step 12. Synchronizing layer name with total plots areaThe field (layer) name can include the total area value of all simple plots containing in this field (layer). However after the unused or too small plots have been deleted, the name of the layer should be updated appropriately. After that the layer name and the total area of the remaining plots should be synchronized. This can be done with the Synchronize layers and tables names with data tool.
As a result the names of all layers specified in the synchronization list have been updated, as well as the N_POL field value in accordance with the N_UCH attribute.
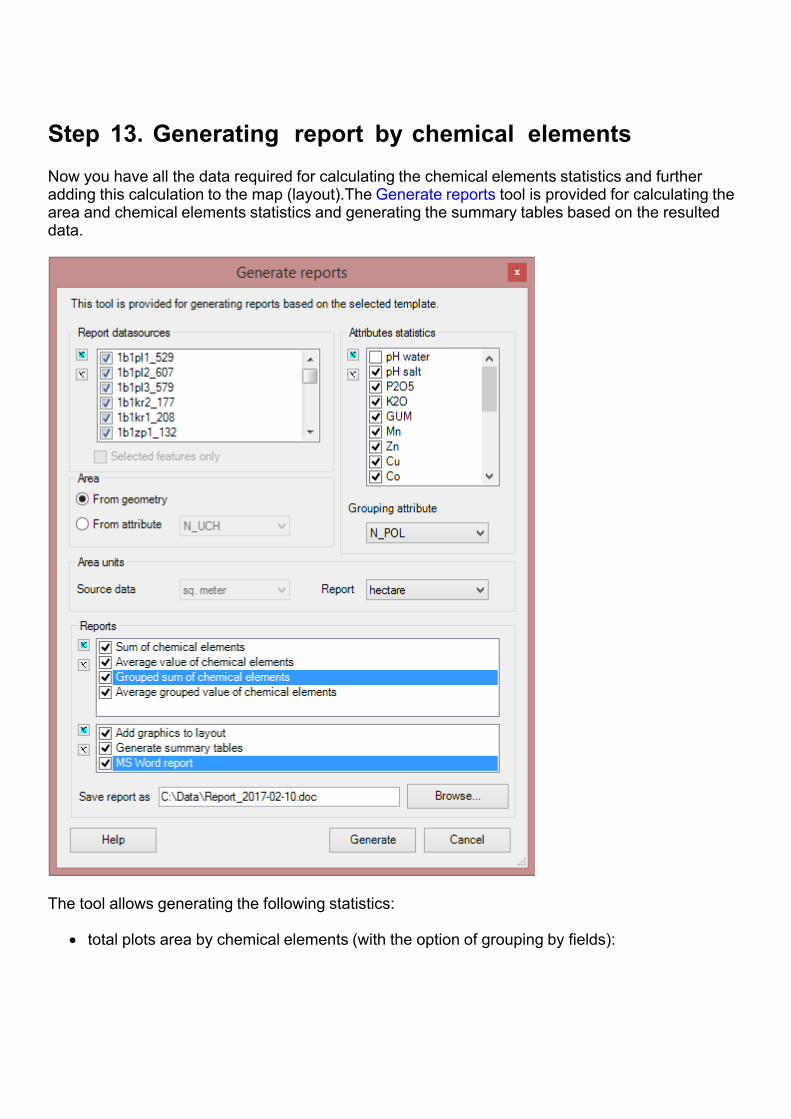
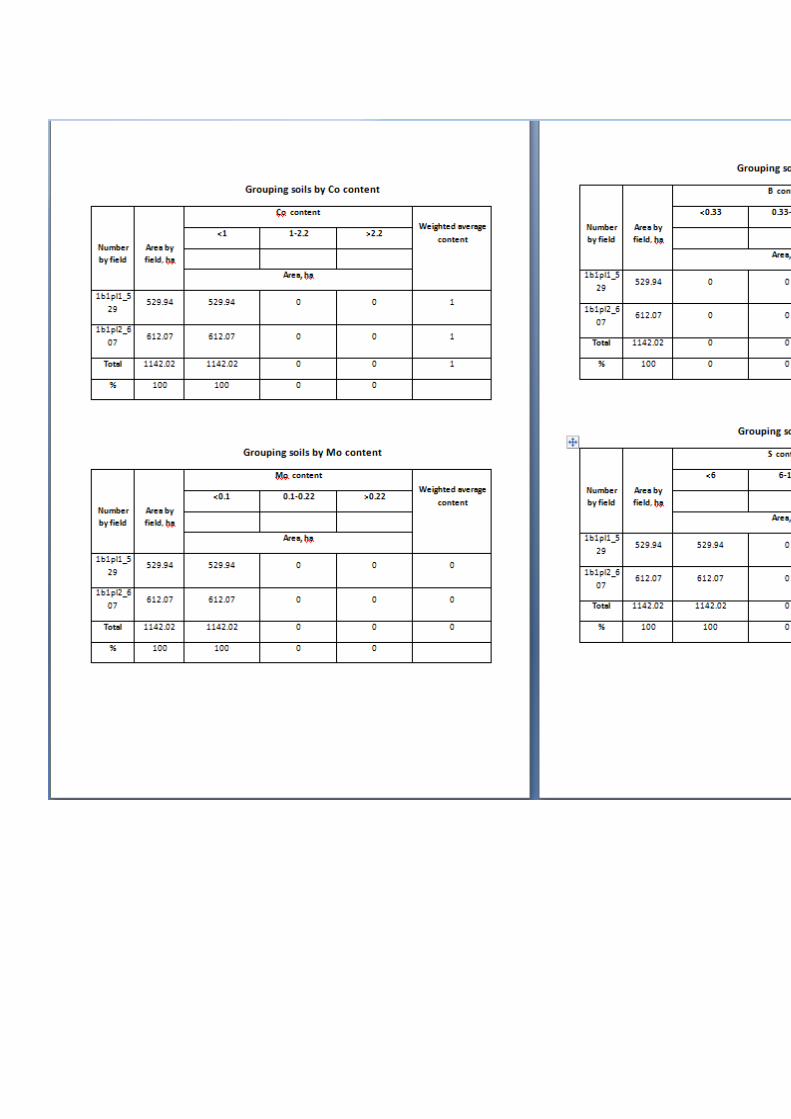
Step 13. Generating report by chemical elementsNow you have all the data required for calculating the chemical elements statistics and further adding this calculation to the map (layout).The Generate reports tool is provided for calculating the area and chemical elements statistics and generating the summary tables based on the resulted data.
The tool allows generating the following statistics:
total plots area by chemical elements (with the option of grouping by fields):
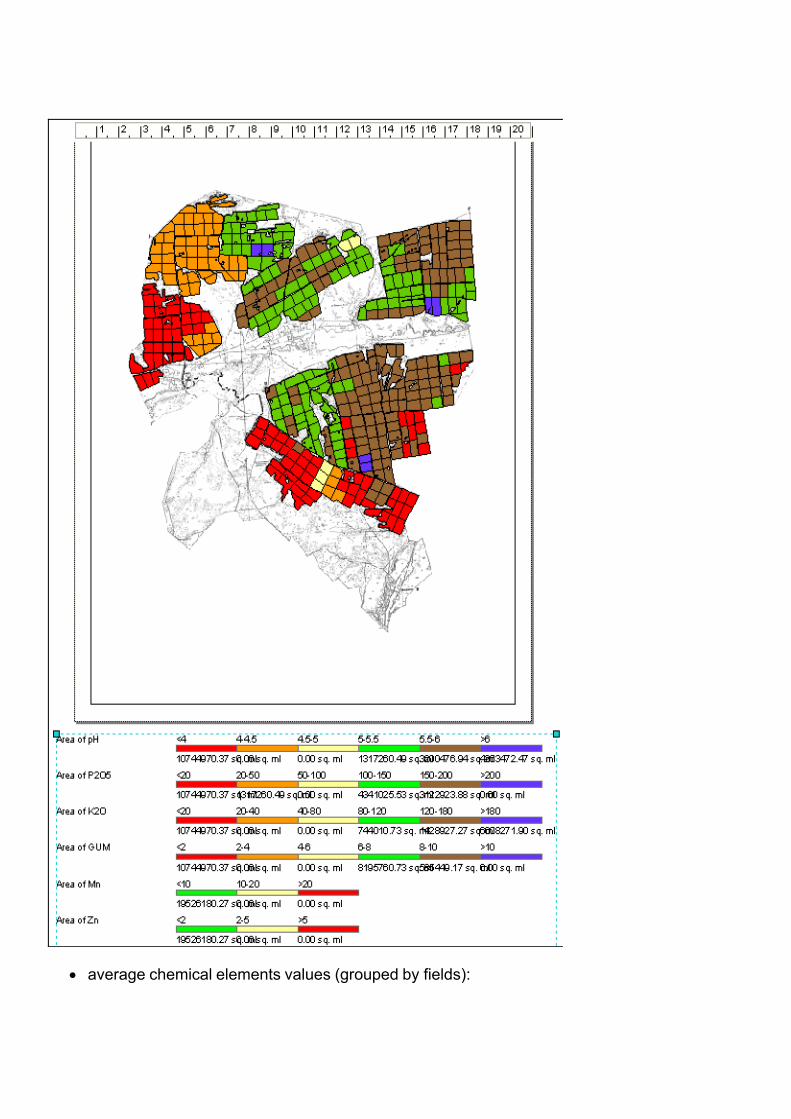
average chemical elements values (grouped by fields):
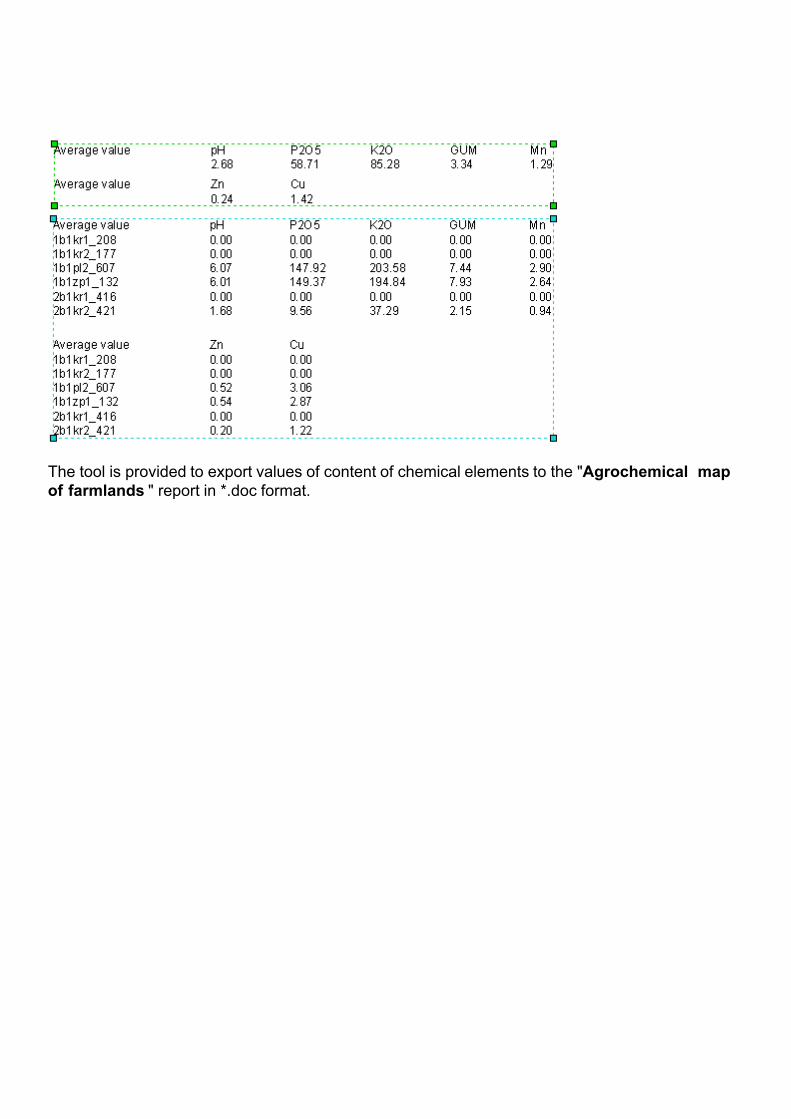
The tool is provided to export values of content of chemical elements to the "Agrochemical map of farmlands " report in *.doc format.