Embed Size (px)
DESCRIPTION
AGSA SCoAG 2009. Annual report presentation October 2009. Mission. - PowerPoint PPT Presentation
Citation preview
Page 1
AGSA SCoAG 2009
Annual report presentation
October 2009
2
Mission
The Auditor-General of South Africa has a constitutional mandate and, as the Supreme Audit Institution (SAI) of South
Africa, it exists to strengthen our country’s democracy by enabling oversight, accountability and governance in the public
sector through auditing, thereby building public confidence.
This is our reputation promise.
3
Table of contents
Overview
Key highlights
Simplicity
Visibility of leadership
Strengthen human resources
Funding
Lead by Example
Conclusion
4
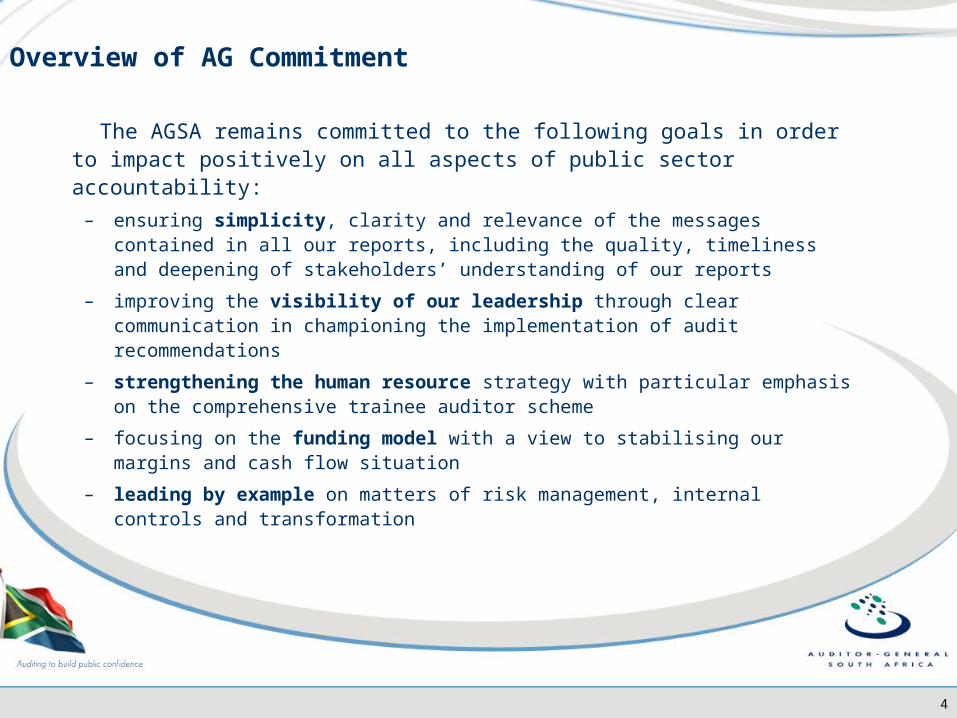
Overview of AG Commitment
The AGSA remains committed to the following goals in order to impact positively on all aspects of public sector accountability:
– ensuring simplicity, clarity and relevance of the messages contained in all our reports, including the quality, timeliness and deepening of stakeholders’ understanding of our reports
– improving the visibility of our leadership through clear communication in championing the implementation of audit recommendations
– strengthening the human resource strategy with particular emphasis on the comprehensive trainee auditor scheme
– focusing on the funding model with a view to stabilising our margins and cash flow situation
– leading by example on matters of risk management, internal controls and transformation
5
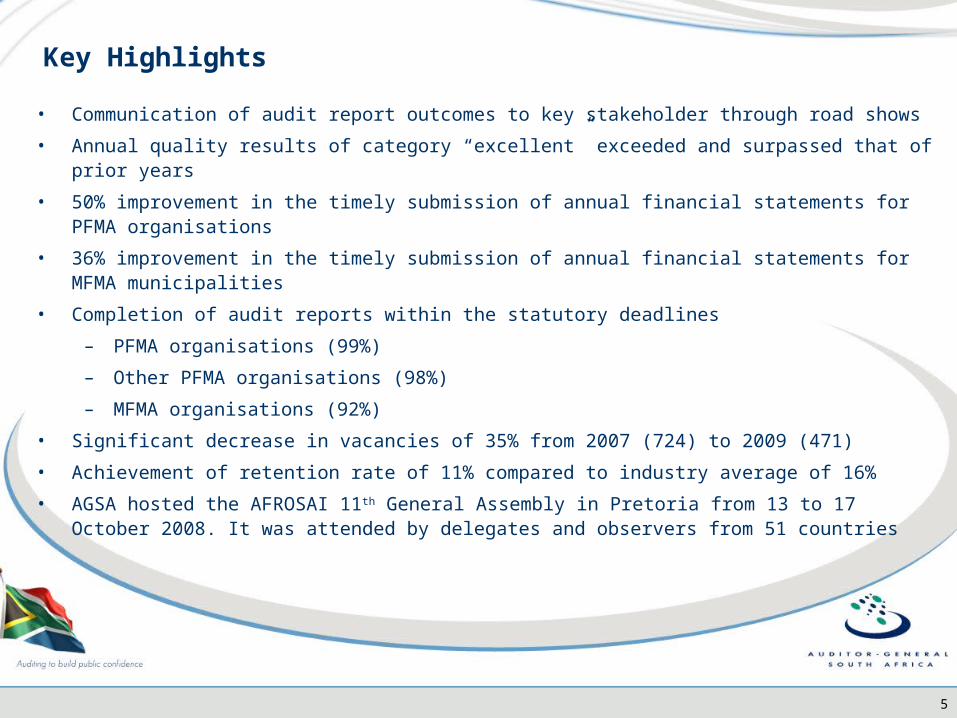
• Communication of audit report outcomes to key stakeholder through road shows
• Annual quality results of category “excellent” exceeded and surpassed that of prior years
• 50% improvement in the timely submission of annual financial statements for PFMA organisations
• 36% improvement in the timely submission of annual financial statements for MFMA municipalities
• Completion of audit reports within the statutory deadlines
– PFMA organisations (99%)
– Other PFMA organisations (98%)
– MFMA organisations (92%)
• Significant decrease in vacancies of 35% from 2007 (724) to 2009 (471)
• Achievement of retention rate of 11% compared to industry average of 16%
• AGSA hosted the AFROSAI 11th General Assembly in Pretoria from 13 to 17 October 2008. It was attended by delegates and observers from 51 countries
Key Highlights
6
Simplicity and clarity of our reports
Key Achievements
• Continued our efforts to influence the achievement of unqualified reports in all spheres of government, which is central to the realisation of our constitutional mandate
• Communicated with simplicity, clarity and relevance to our stakeholders through road shows and door-to-door visits
• Continued focus on the quality and timeliness of our products including audit reports
• Streamlined performance auditing function
• Continued our contribution in international auditing to the United Nations Board of Auditors
• Tabled to Parliament 38 performance audits reports, 6 of national departments, 2 of public entities, 30 provincial departments.
7
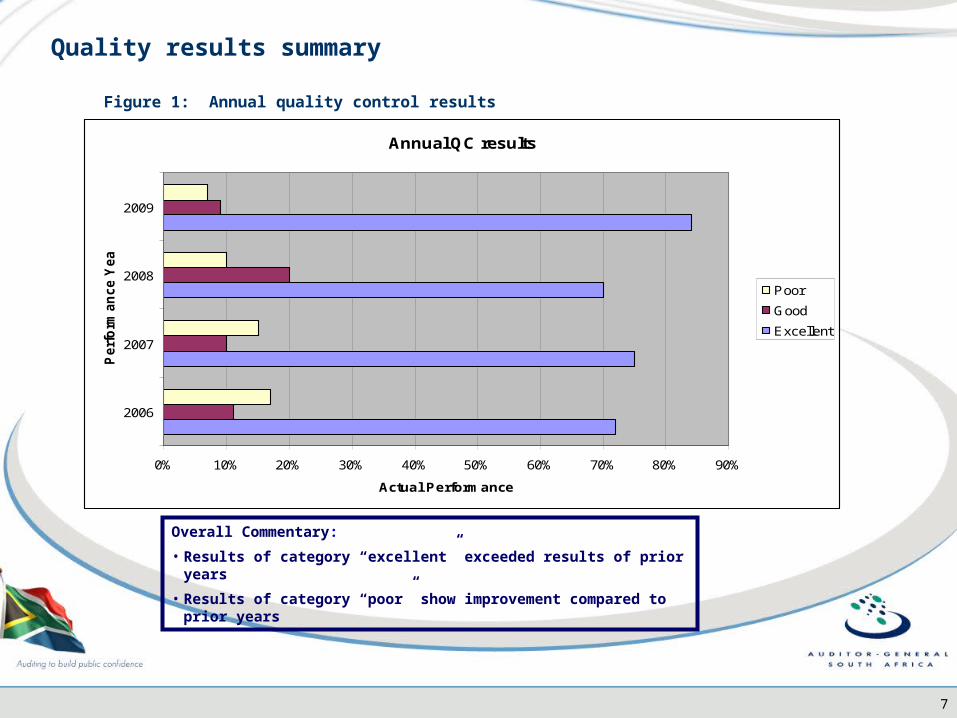
Figure 1: Annual quality control results
Annual QC results
0% 10% 20% 30% 40% 50% 60% 70% 80% 90%
2006
2007
2008
2009
Perf
orm
an
ce Y
ear
Actual Performance
Poor
Good
Excellent
Overall Commentary:
• Results of category “excellent” exceeded results of prior years
• Results of category “poor” show improvement compared to prior years
Quality results summary
8
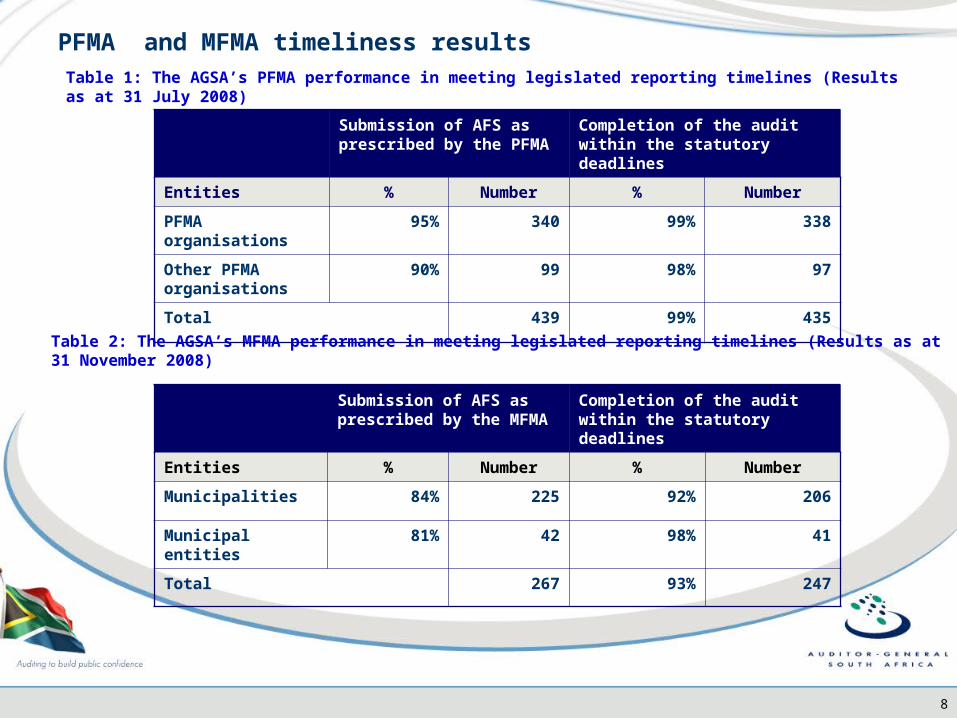
Submission of AFS as prescribed by the PFMA
Completion of the audit within the statutory deadlines
Entities % Number % Number
PFMA organisations 95% 340 99% 338
Other PFMA organisations
90% 99 98% 97
Total 439 99% 435
Table 1: The AGSA’s PFMA performance in meeting legislated reporting timelines (Results as at 31 July 2008)
PFMA and MFMA timeliness results
Submission of AFS as prescribed by the MFMA
Completion of the audit within the statutory deadlines
Entities % Number % Number
Municipalities 84% 225 92% 206
Municipal entities 81% 42 98% 41
Total 267 93% 247
Table 2: The AGSA’s MFMA performance in meeting legislated reporting timelines (Results as at 31 November 2008)
9
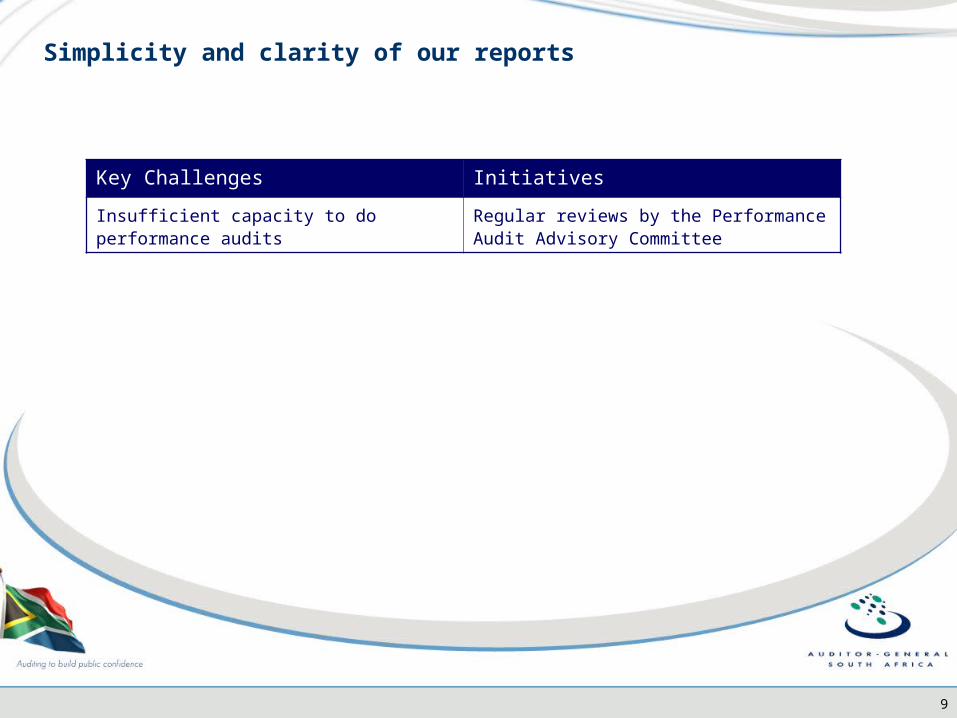
Simplicity and clarity of our reports
Key Challenges Initiatives
Insufficient capacity to do performance audits Regular reviews by the Performance Audit Advisory Committee
10
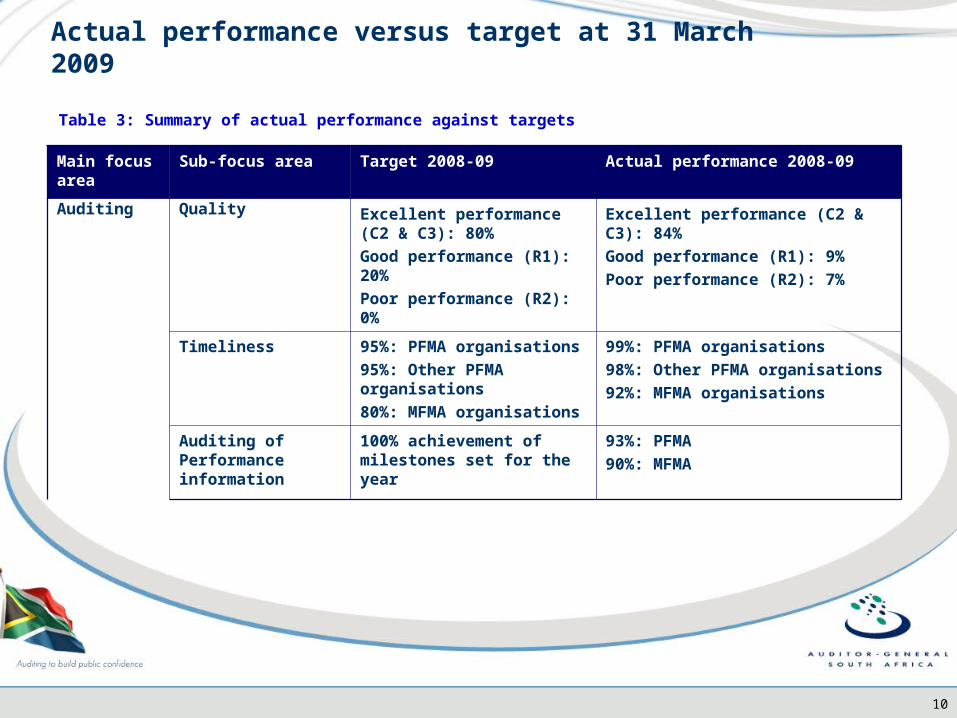
Main focus area
Sub-focus area Target 2008-09 Actual performance 2008-09
Auditing Quality Excellent performance (C2 & C3): 80%
Good performance (R1): 20%
Poor performance (R2): 0%
Excellent performance (C2 & C3): 84%
Good performance (R1): 9%
Poor performance (R2): 7%
Timeliness 95%: PFMA organisations
95%: Other PFMA organisations
80%: MFMA organisations
99%: PFMA organisations
98%: Other PFMA organisations
92%: MFMA organisations
Auditing of Performance information
100% achievement of milestones set for the year
93%: PFMA
90%: MFMA
Table 3: Summary of actual performance against targets
Actual performance versus target at 31 March 2009
11
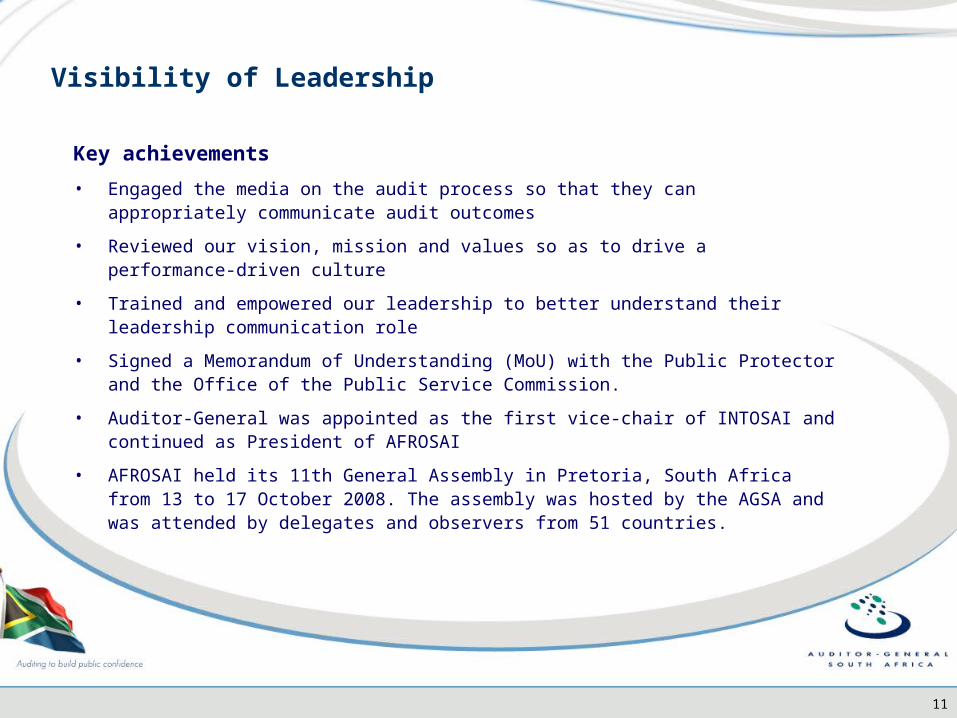
Key achievements
• Engaged the media on the audit process so that they can appropriately communicate audit outcomes
• Reviewed our vision, mission and values so as to drive a performance-driven culture
• Trained and empowered our leadership to better understand their leadership communication role
• Signed a Memorandum of Understanding (MoU) with the Public Protector and the Office of the Public Service Commission.
• Auditor-General was appointed as the first vice-chair of INTOSAI and continued as President of AFROSAI
• AFROSAI held its 11th General Assembly in Pretoria, South Africa from 13 to 17 October 2008. The assembly was hosted by the AGSA and was attended by delegates and observers from 51 countries.
Visibility of Leadership
12
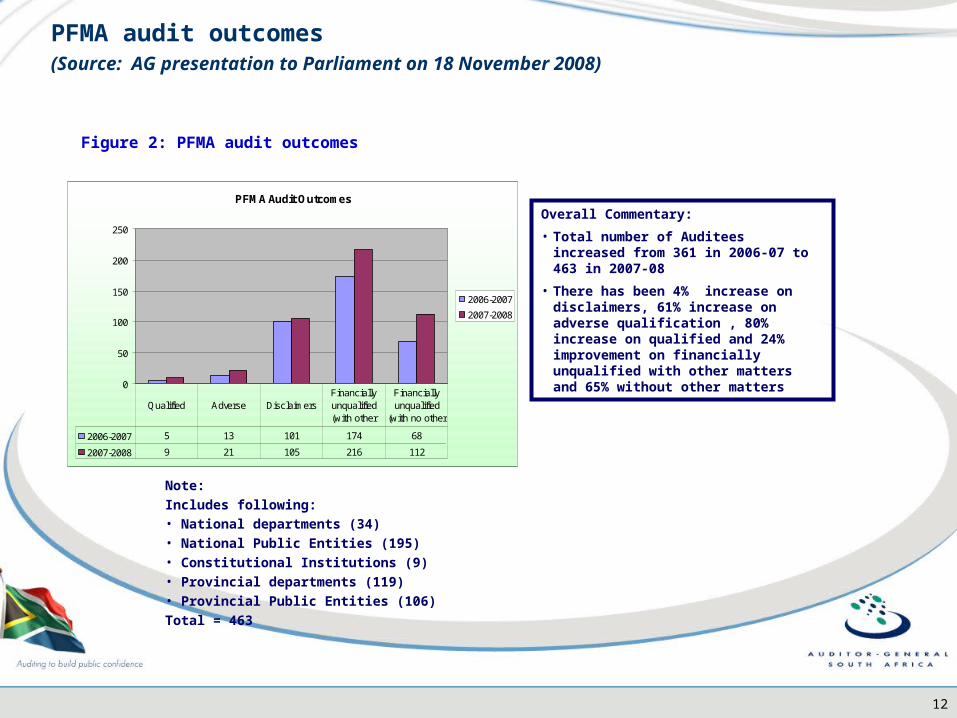
PFMA audit outcomes (Source: AG presentation to Parliament on 18 November 2008)
Overall Commentary:
• Total number of Auditees increased from 361 in 2006-07 to 463 in 2007-08
• There has been 4% increase on disclaimers, 61% increase on adverse qualification , 80% increase on qualified and 24% improvement on financially unqualified with other matters and 65% without other matters
Figure 2: PFMA audit outcomes
PFMA Audit Outcomes
0
50
100
150
200
250
2006-2007
2007-2008
2006-2007 5 13 101 174 68
2007-2008 9 21 105 216 112
Qualified Adverse DisclaimersFinancially unqualified (with other
Financially unqualified
(with no other
Note:
Includes following:• National departments (34)• National Public Entities (195)• Constitutional Institutions (9)• Provincial departments (119)• Provincial Public Entities (106)
Total = 463
13
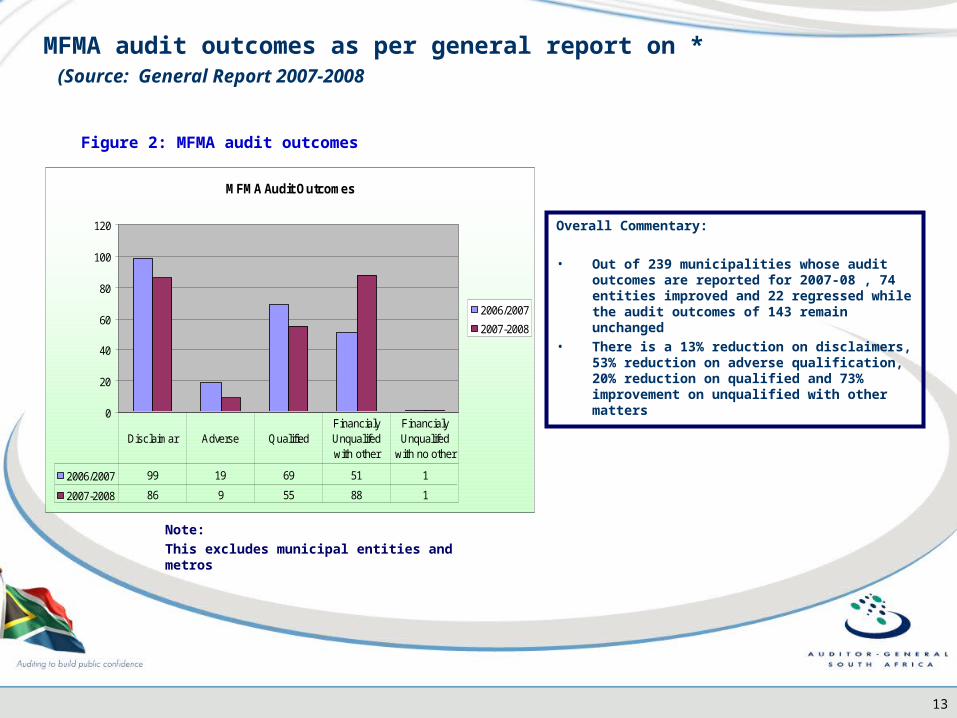
MFMA audit outcomes as per general report on * (Source: General Report 2007-2008
Figure 2: MFMA audit outcomes
MFMA Audit Outcomes
0
20
40
60
80
100
120
2006/2007
2007-2008
2006/2007 99 19 69 51 1
2007-2008 86 9 55 88 1
Disclaimar Adverse QualifiedFinancialy Unqualifed with other
Financialy Unqualifed
with no other
Overall Commentary:
• Out of 239 municipalities whose audit outcomes are reported for 2007-08 , 74 entities improved and 22 regressed while the audit outcomes of 143 remain unchanged
• There is a 13% reduction on disclaimers, 53% reduction on adverse qualification, 20% reduction on qualified and 73% improvement on unqualified with other matters
Note:
This excludes municipal entities and metros
14
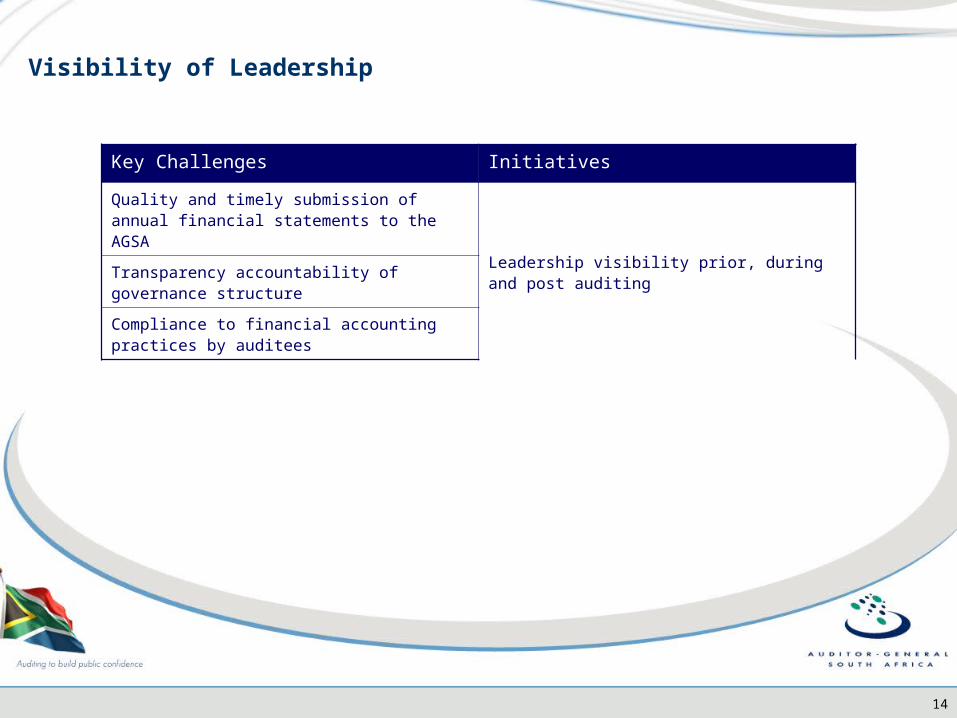
Visibility of Leadership
Key Challenges Initiatives
Quality and timely submission of annual financial statements to the AGSA
Leadership visibility prior, during and post auditingTransparency accountability of governance structure
Compliance to financial accounting practices by auditees
15
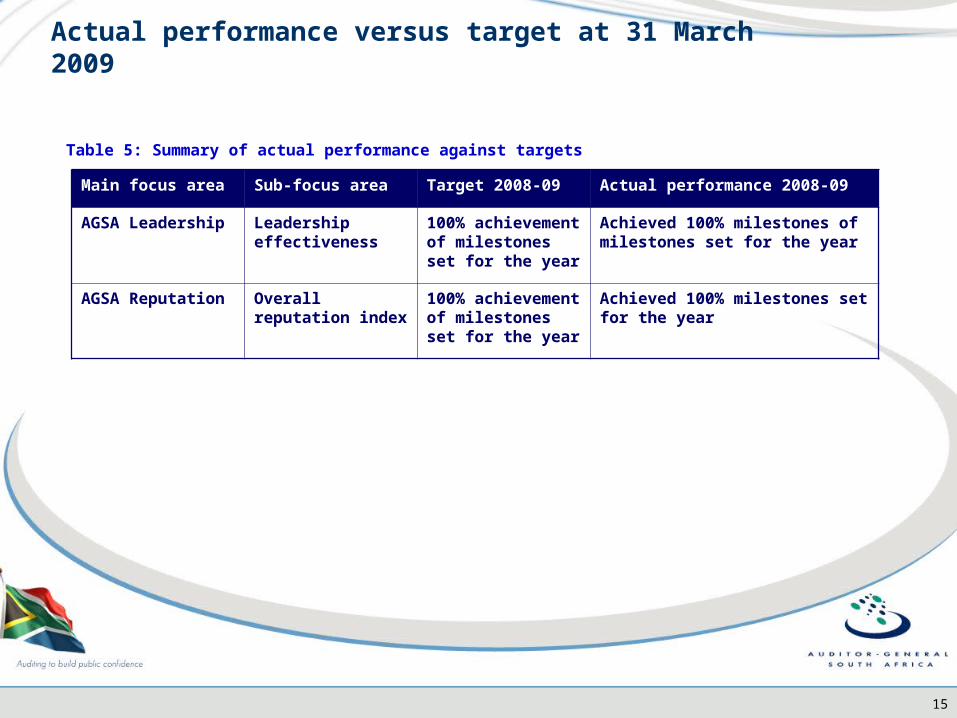
Main focus area Sub-focus area Target 2008-09 Actual performance 2008-09
AGSA Leadership Leadership effectiveness
100% achievement of milestones set for the year
Achieved 100% milestones of milestones set for the year
AGSA Reputation Overall reputation index
100% achievement of milestones set for the year
Achieved 100% milestones set for the year
Table 5: Summary of actual performance against targets
Actual performance versus target at 31 March 2009
16
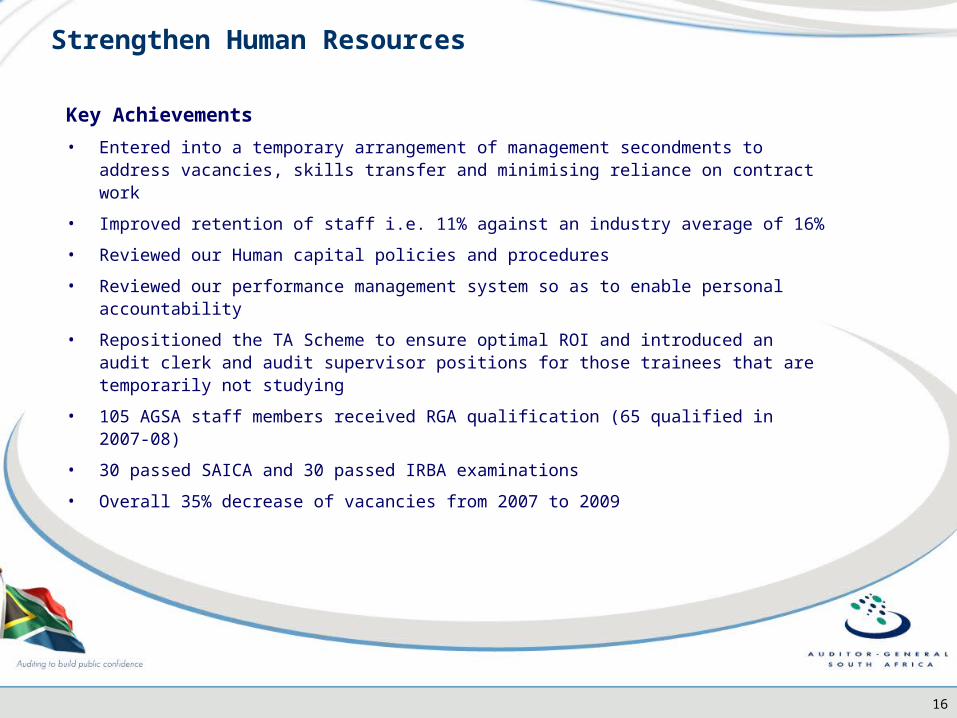
Key Achievements
• Entered into a temporary arrangement of management secondments to address vacancies, skills transfer and minimising reliance on contract work
• Improved retention of staff i.e. 11% against an industry average of 16%
• Reviewed our Human capital policies and procedures
• Reviewed our performance management system so as to enable personal accountability
• Repositioned the TA Scheme to ensure optimal ROI and introduced an audit clerk and audit supervisor positions for those trainees that are temporarily not studying
• 105 AGSA staff members received RGA qualification (65 qualified in 2007-08)
• 30 passed SAICA and 30 passed IRBA examinations
• Overall 35% decrease of vacancies from 2007 to 2009
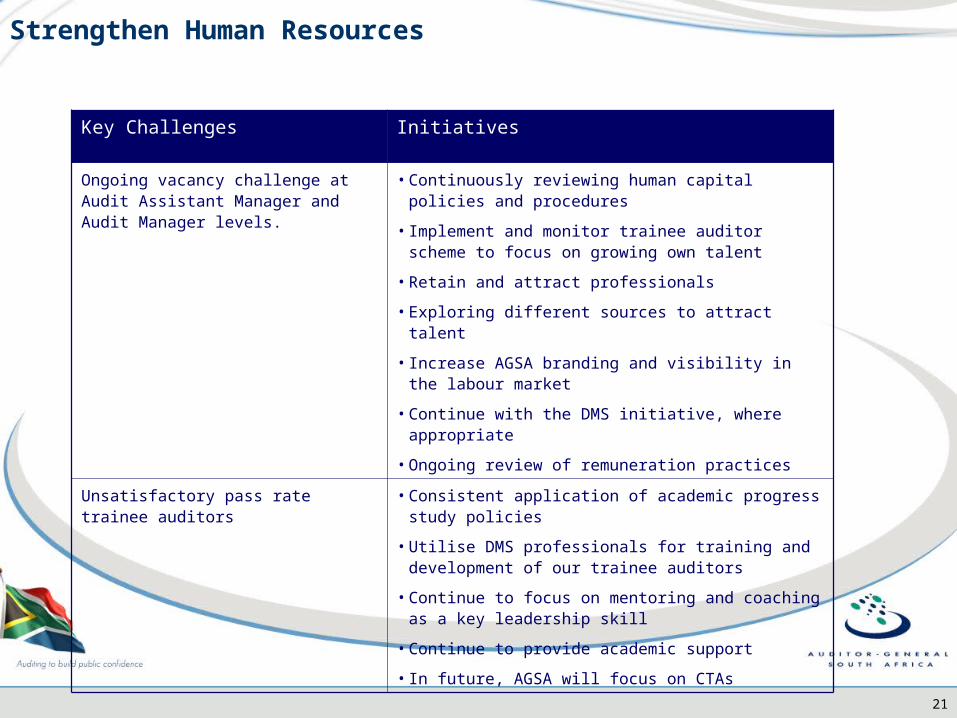
Strengthen Human Resources
17
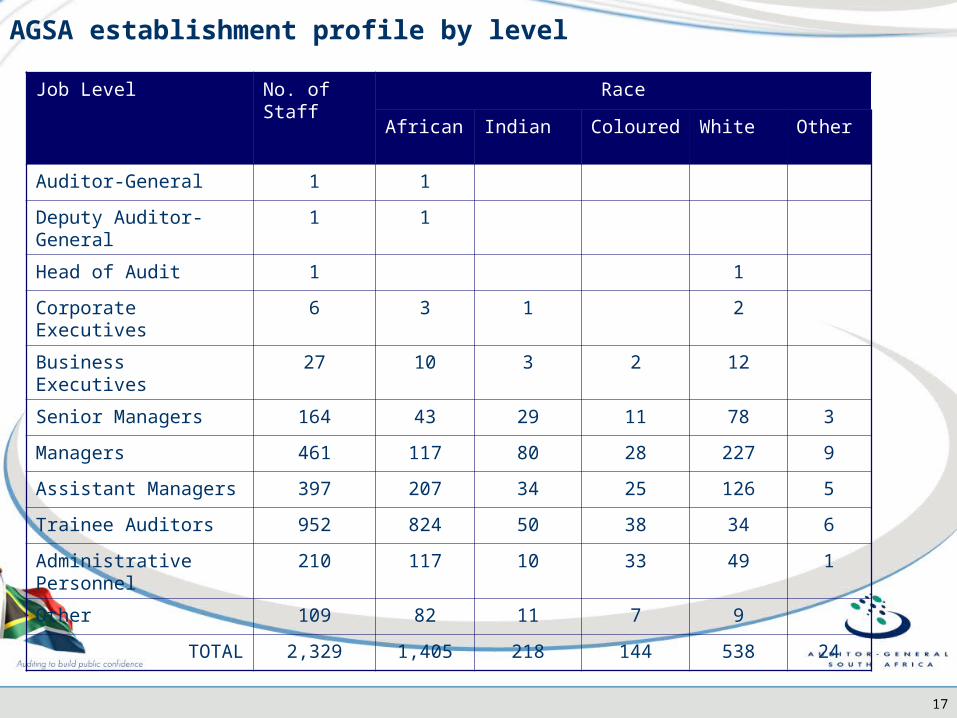
AGSA establishment profile by level
Job Level No. of Staff Race
African Indian Coloured White Other
Auditor-General 1 1
Deputy Auditor-General 1 1
Head of Audit 1 1
Corporate Executives 6 3 1 2
Business Executives 27 10 3 2 12
Senior Managers 164 43 29 11 78 3
Managers 461 117 80 28 227 9
Assistant Managers 397 207 34 25 126 5
Trainee Auditors 952 824 50 38 34 6
Administrative Personnel 210 117 10 33 49 1
Other 109 82 11 7 9
TOTAL 2,329 1,405 218 144 538 24
18
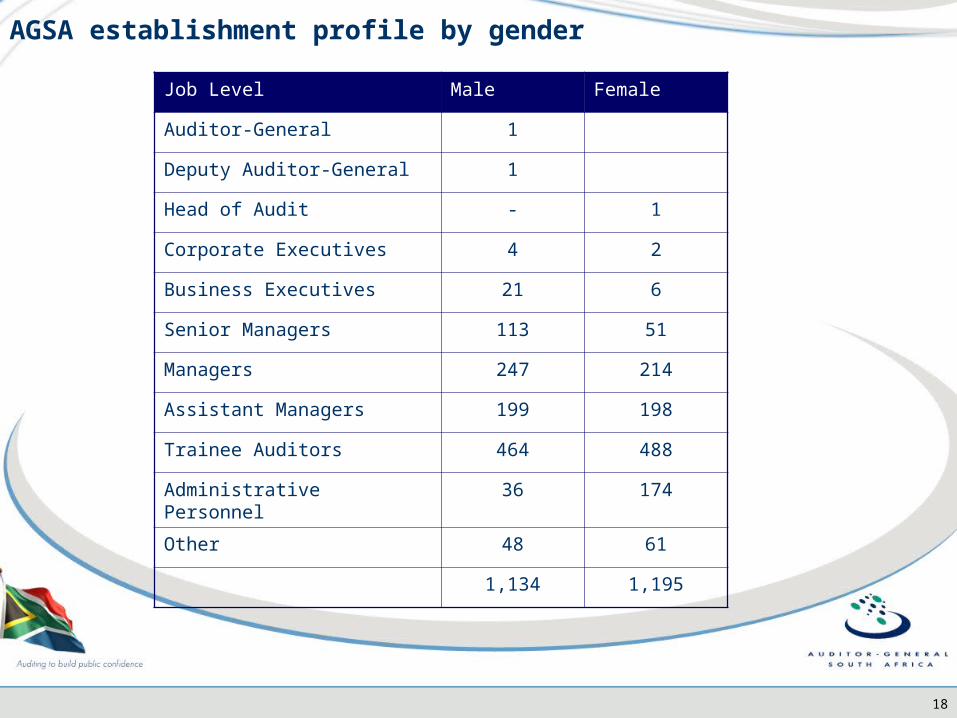
Job Level Male Female
Auditor-General 1
Deputy Auditor-General 1
Head of Audit - 1
Corporate Executives 4 2
Business Executives 21 6
Senior Managers 113 51
Managers 247 214
Assistant Managers 199 198
Trainee Auditors 464 488
Administrative Personnel 36 174
Other 48 61
1,134 1,195
AGSA establishment profile by gender
19
Overall commentary:
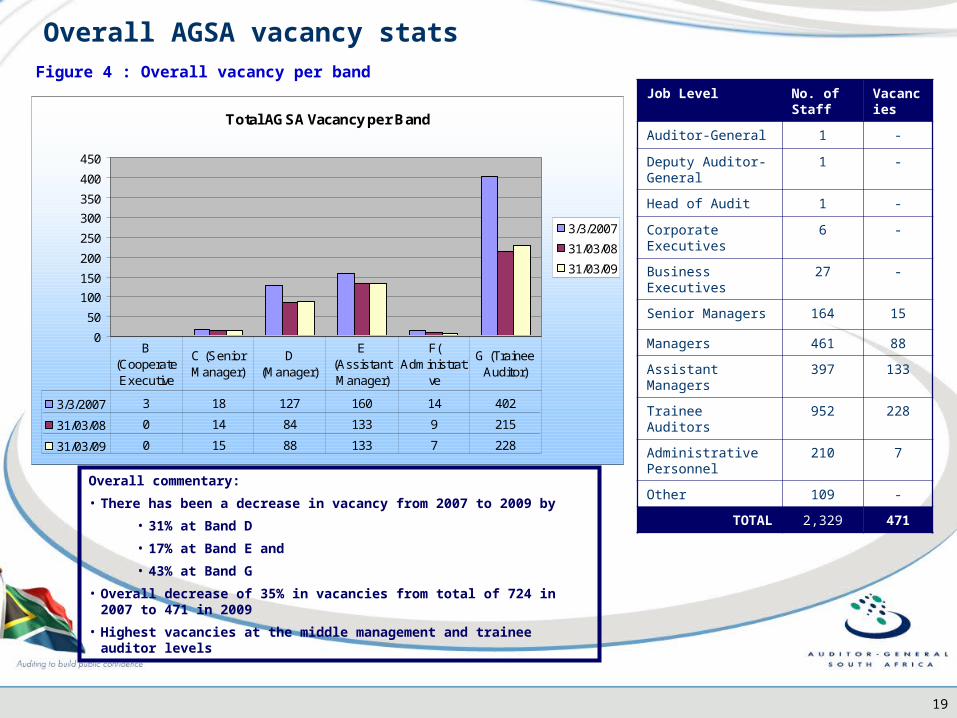
• There has been a decrease in vacancy from 2007 to 2009 by
• 31% at Band D
• 17% at Band E and
• 43% at Band G
• Overall decrease of 35% in vacancies from total of 724 in 2007 to 471 in 2009
• Highest vacancies at the middle management and trainee auditor levels
Figure 4 : Overall vacancy per band
Overall AGSA vacancy stats
Total AGSA Vacancy per Band
0
50
100
150
200
250
300
350
400
450
3/3/2007
31/03/08
31/03/09
3/3/2007 3 18 127 160 14 402
31/03/08 0 14 84 133 9 215
31/03/09 0 15 88 133 7 228
B (Cooperate Executive
C (Senior Manager)
D (Manager)
E (Assistant Manager)
F( Administrati
ve
G (Trainee Auditor)
Job Level No. of Staff
Vacancies
Auditor-General 1 -
Deputy Auditor-General
1 -
Head of Audit 1 -
Corporate Executives
6 -
Business Executives 27 -
Senior Managers 164 15
Managers 461 88
Assistant Managers 397 133
Trainee Auditors 952 228
Administrative Personnel
210 7
Other 109 -
TOTAL 2,329 471
20
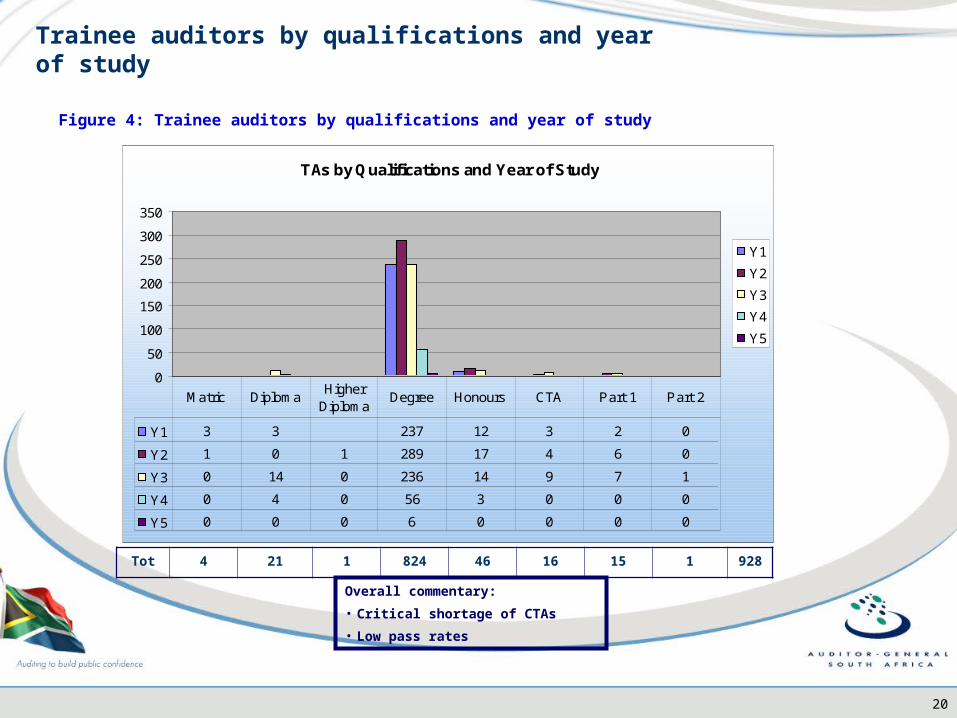
Trainee auditors by qualifications and year of study
Figure 4: Trainee auditors by qualifications and year of study
Tot 4 21 1 824 46 16 15 1 928
TAs by Qualifications and Year of Study
0
50
100
150
200
250
300
350
Y1
Y2
Y3
Y4
Y5
Y1 3 3 237 12 3 2 0
Y2 1 0 1 289 17 4 6 0
Y3 0 14 0 236 14 9 7 1
Y4 0 4 0 56 3 0 0 0
Y5 0 0 0 6 0 0 0 0
Matric DiplomaHigher
DiplomaDegree Honours CTA Part 1 Part 2
Overall commentary:
• Critical shortage of CTAs
• Low pass rates
21
Strengthen Human Resources
Key Challenges Initiatives
Ongoing vacancy challenge at Audit Assistant Manager and Audit Manager levels.
• Continuously reviewing human capital policies and procedures
• Implement and monitor trainee auditor scheme to focus on growing own talent
• Retain and attract professionals
• Exploring different sources to attract talent
• Increase AGSA branding and visibility in the labour market
• Continue with the DMS initiative, where appropriate
• Ongoing review of remuneration practices
Unsatisfactory pass rate trainee auditors • Consistent application of academic progress study policies
• Utilise DMS professionals for training and development of our trainee auditors
• Continue to focus on mentoring and coaching as a key leadership skill
• Continue to provide academic support
• In future, AGSA will focus on CTAs
22
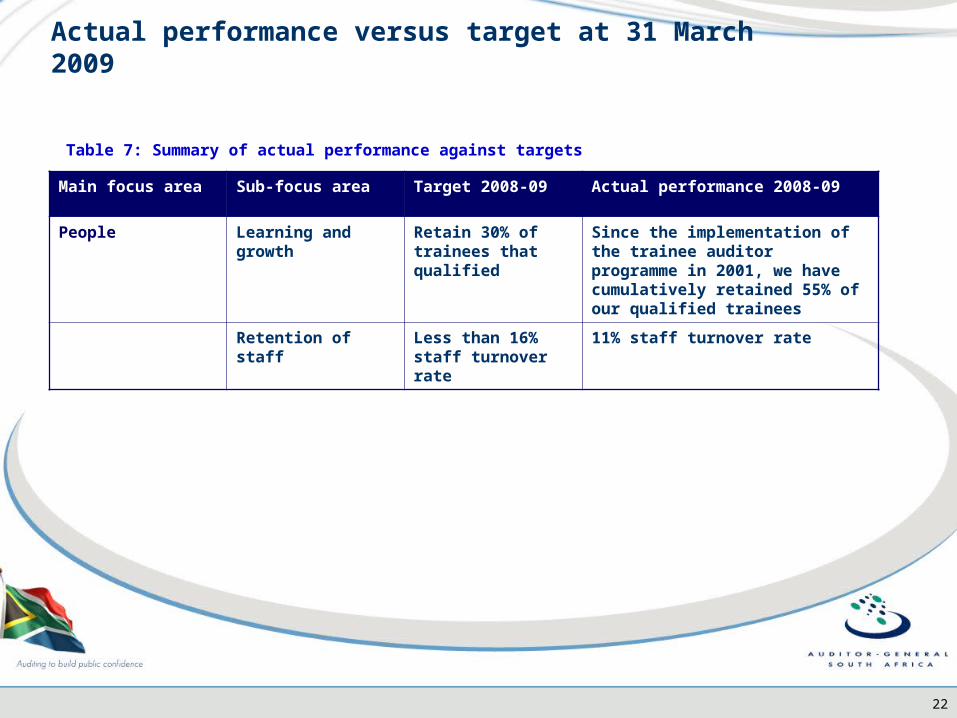
Main focus area Sub-focus area Target 2008-09 Actual performance 2008-09
People Learning and growth Retain 30% of trainees that qualified
Since the implementation of the trainee auditor programme in 2001, we have cumulatively retained 55% of our qualified trainees
Retention of staff Less than 16% staff turnover rate
11% staff turnover rate
Table 7: Summary of actual performance against targets
Actual performance versus target at 31 March 2009
23
Key achievements
• Completed financial turnaround plan
• Amended AGSA funding model
Funding
24
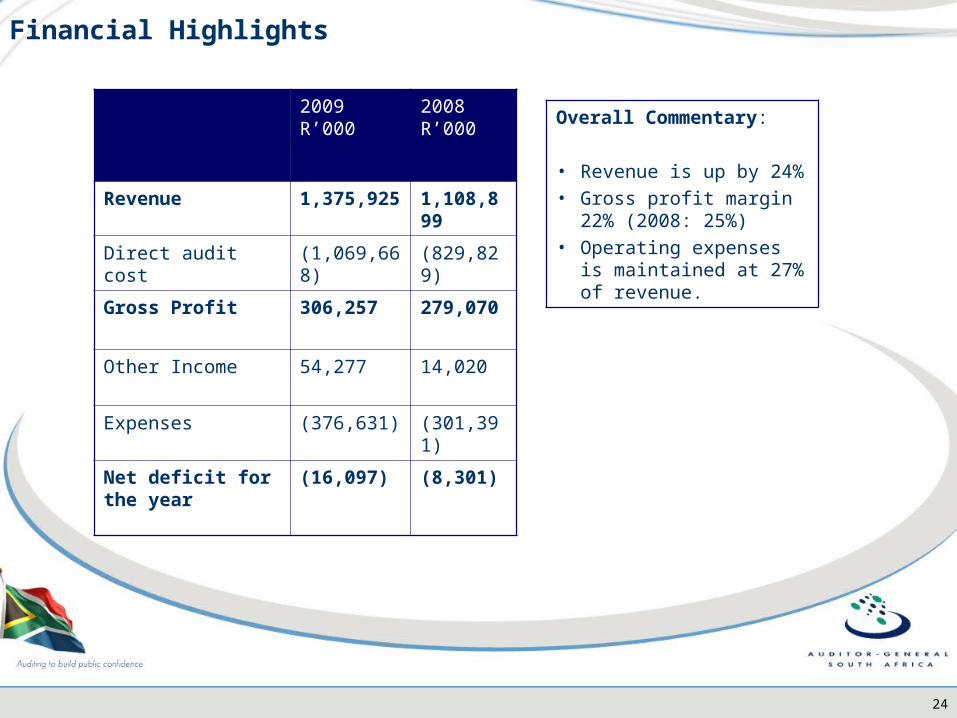
Financial Highlights
2009 R’000
2008 R’000
Revenue 1,375,925 1,108,899
Direct audit cost (1,069,668) (829,829)
Gross Profit 306,257 279,070
Other Income 54,277 14,020
Expenses (376,631) (301,391)
Net deficit for the year
(16,097) (8,301)
Overall Commentary:
• Revenue is up by 24%• Gross profit margin 22%
(2008: 25%)• Operating expenses is
maintained at 27% of revenue.
25
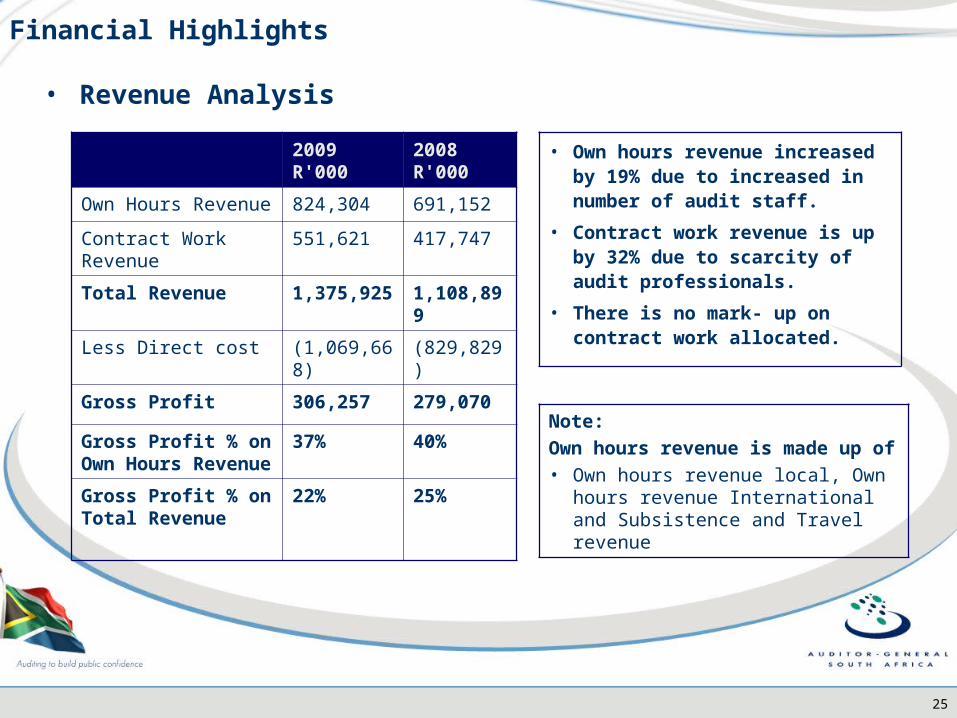
Financial Highlights
• Revenue Analysis
2009 R'000
2008 R'000
Own Hours Revenue 824,304 691,152
Contract Work Revenue
551,621 417,747
Total Revenue 1,375,925 1,108,899
Less Direct cost (1,069,668) (829,829)
Gross Profit 306,257 279,070
Gross Profit % on Own Hours Revenue
37% 40%
Gross Profit % on Total Revenue
22% 25%
• Own hours revenue increased by 19% due to increased in number of audit staff.
• Contract work revenue is up by 32% due to scarcity of audit professionals.
• There is no mark- up on contract work allocated.
Note:
Own hours revenue is made up of • Own hours revenue local, Own hours
revenue International and Subsistence and Travel revenue
26
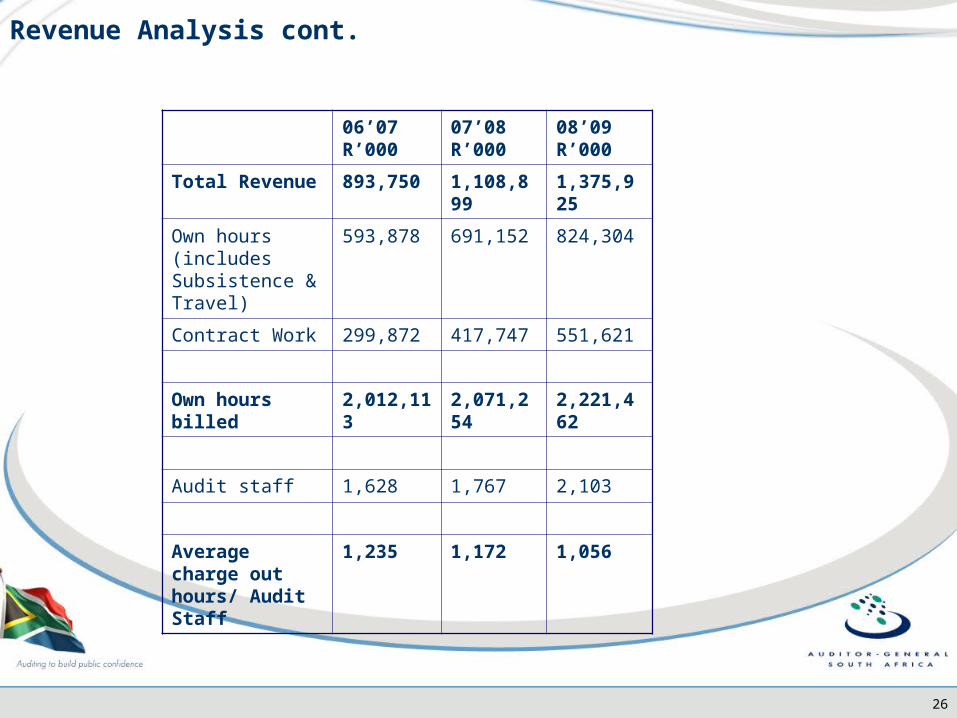
Revenue Analysis cont.
06’07 R’000
07’08 R’000
08’09 R’000
Total Revenue 893,750 1,108,899 1,375,925
Own hours (includes Subsistence & Travel)
593,878 691,152 824,304
Contract Work 299,872 417,747 551,621
Own hours billed 2,012,113 2,071,254 2,221,462
Audit staff 1,628 1,767 2,103
Average charge out hours/ Audit Staff
1,235 1,172 1,056
27
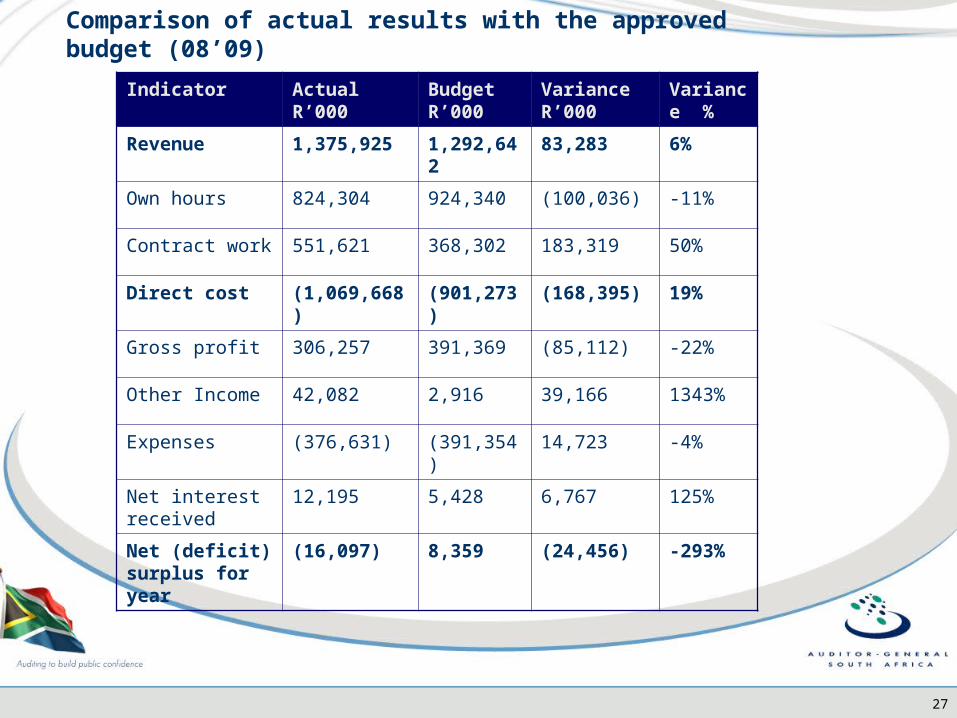
Comparison of actual results with the approved budget (08’09)
Indicator Actual R’000
Budget R’000
Variance R’000
Variance %
Revenue 1,375,925 1,292,642 83,283 6%
Own hours 824,304 924,340 (100,036) -11%
Contract work 551,621 368,302 183,319 50%
Direct cost (1,069,668) (901,273) (168,395) 19%
Gross profit 306,257 391,369 (85,112) -22%
Other Income 42,082 2,916 39,166 1343%
Expenses (376,631) (391,354) 14,723 -4%
Net interest received
12,195 5,428 6,767 125%
Net (deficit) surplus for year
(16,097) 8,359 (24,456) -293%
28
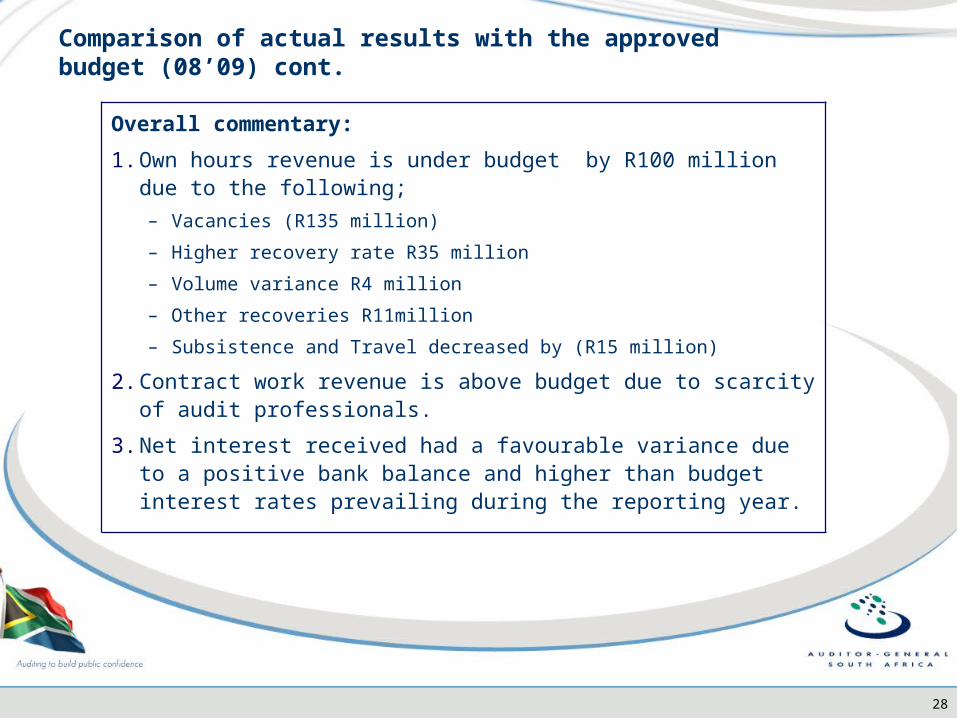
Comparison of actual results with the approved budget (08’09) cont.
Overall commentary:
1. Own hours revenue is under budget by R100 million due to the following;
– Vacancies (R135 million)
– Higher recovery rate R35 million
– Volume variance R4 million
– Other recoveries R11million
– Subsistence and Travel decreased by (R15 million)
2. Contract work revenue is above budget due to scarcity of audit professionals.
3. Net interest received had a favourable variance due to a positive bank balance and higher than budget interest rates prevailing during the reporting year.
29
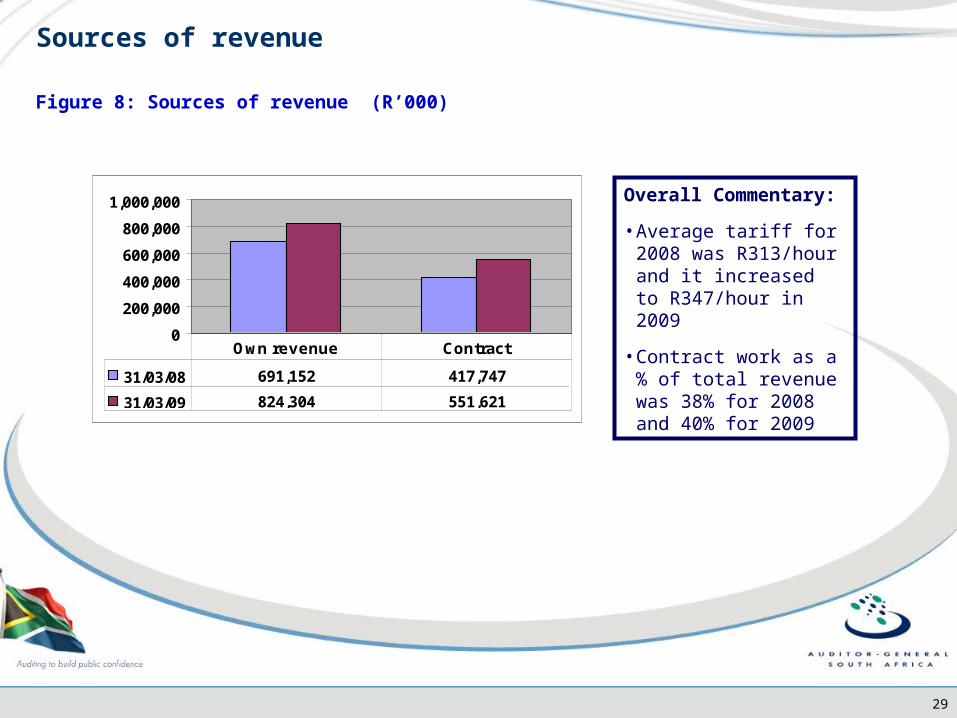
Figure 8: Sources of revenue (R’000)
Sources of revenue
0
200,000
400,000
600,000
800,000
1,000,000
31/03/08 691,152 417,747
31/03/09 824,304 551,621
Own revenue Contract
Overall Commentary:
• Average tariff for 2008 was R313/hour and it increased to R347/hour in 2009
• Contract work as a % of total revenue was 38% for 2008 and 40% for 2009
30
Financial Highlights
Total cost is R1.446 billion. The major cost drivers for AGSA are Contract work - R551.621 million (38%), Recoverable staff cost – R464.644 million (32%) and Support staff cost – R198.998 million (14%)
Expense Analysis - 31 March 2009
Contract work recoverable38.1%
Amortization expense0.2%
Retirement benefit obligations
0.0%
Other operational expenditure
10.2%
Subsistence and travel3.7%
AFROSAI - Conference0.6%Depreciation expense
1.2%
Support staff cost13.8%
Recoverable staff cost32.1%
Contract work recoverable
Recoverable staff cost
Support staff cost
Other operational expenditure
Subsistence and travel
Depreciation expense
AFROSAI - Conference
Amortization expense
Retirement benefit obligations
31
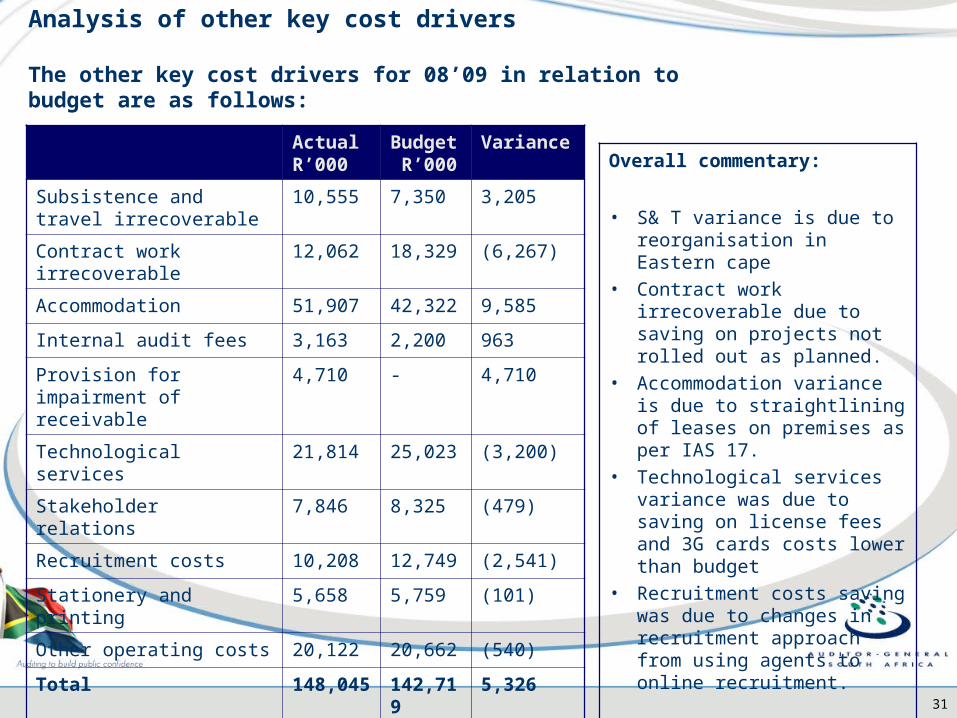
Analysis of other key cost drivers
The other key cost drivers for 08’09 in relation to budget are as follows:
Actual R’000
Budget R’000
Variance
Subsistence and travel irrecoverable
10,555 7,350 3,205
Contract work irrecoverable 12,062 18,329 (6,267)
Accommodation 51,907 42,322 9,585
Internal audit fees 3,163 2,200 963
Provision for impairment of receivable
4,710 - 4,710
Technological services 21,814 25,023 (3,200)
Stakeholder relations 7,846 8,325 (479)
Recruitment costs 10,208 12,749 (2,541)
Stationery and printing 5,658 5,759 (101)
Other operating costs 20,122 20,662 (540)
Total 148,045 142,719 5,326
Overall commentary:
• S& T variance is due to reorganisation in Eastern cape
• Contract work irrecoverable due to saving on projects not rolled out as planned.
• Accommodation variance is due to straightlining of leases on premises as per IAS 17.
• Technological services variance was due to saving on license fees and 3G cards costs lower than budget
• Recruitment costs saving was due to changes in recruitment approach from using agents to online recruitment.
32
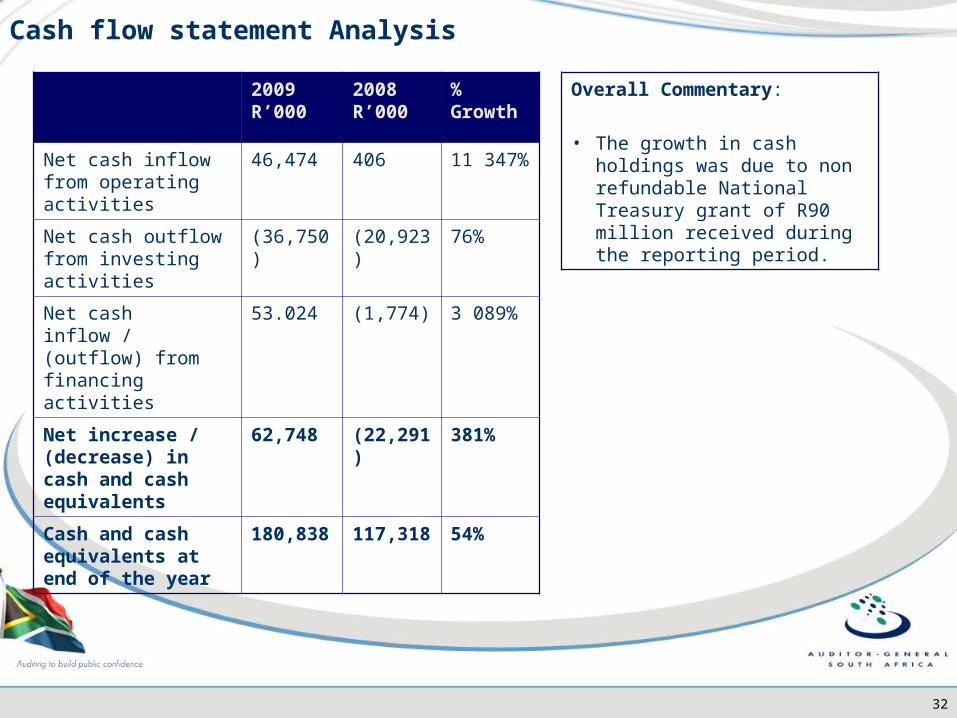
Cash flow statement Analysis
2009 R’000
2008 R’000
% Growth
Net cash inflow from operating activities
46,474 406 11 347%
Net cash outflow from investing activities
(36,750) (20,923) 76%
Net cash inflow / (outflow) from financing activities
53.024 (1,774) 3 089%
Net increase / (decrease) in cash and cash equivalents
62,748 (22,291) 381%
Cash and cash equivalents at end of the year
180,838 117,318 54%
Overall Commentary:
• The growth in cash holdings was due to non refundable National Treasury grant of R90 million received during the reporting period.
33
Debtors Ageing Analysis – 31 March 2009
Current R’000
30 days R’000
60 Days R’000
90 Days R’000
120 Days R’000
120 Days R’000
Total R’000
National 52,235 7,213 4,547 (695) 49 1,293 64,642
Provincial 70,472 2,073 1,500 550 873 7,427 82,895
Local 45,123 8,047 4,438 14,304 9,725 23,014 104,651
Statutory 28,054 1,450 972 2,704 1,470 6,293 40,943
Other 25,285 390 842 325 293 3,039 30,174
Total 221,169 19,173 12,299 17,188 12,410 41,066 323,305
% 68% 6% 4% 5% 4% 13% 100%
Note: Total balance excludes provision for impairment of receivables amounting to R25 million.
34
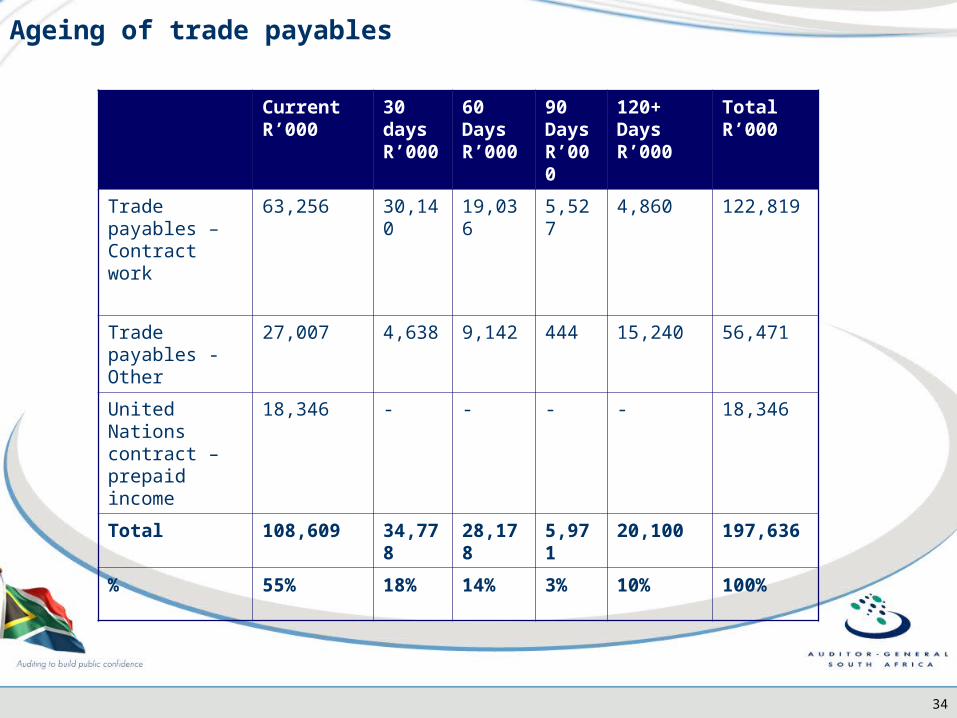
Ageing of trade payables
Current R’000
30 days R’000
60 Days R’000
90 Days R’000
120+ Days R’000
Total R’000
Trade payables – Contract work
63,256 30,140 19,036 5,527 4,860 122,819
Trade payables - Other
27,007 4,638 9,142 444 15,240 56,471
United Nations contract – prepaid income
18,346 - - - - 18,346
Total 108,609 34,778 28,178 5,971 20,100 197,636
% 55% 18% 14% 3% 10% 100%
35
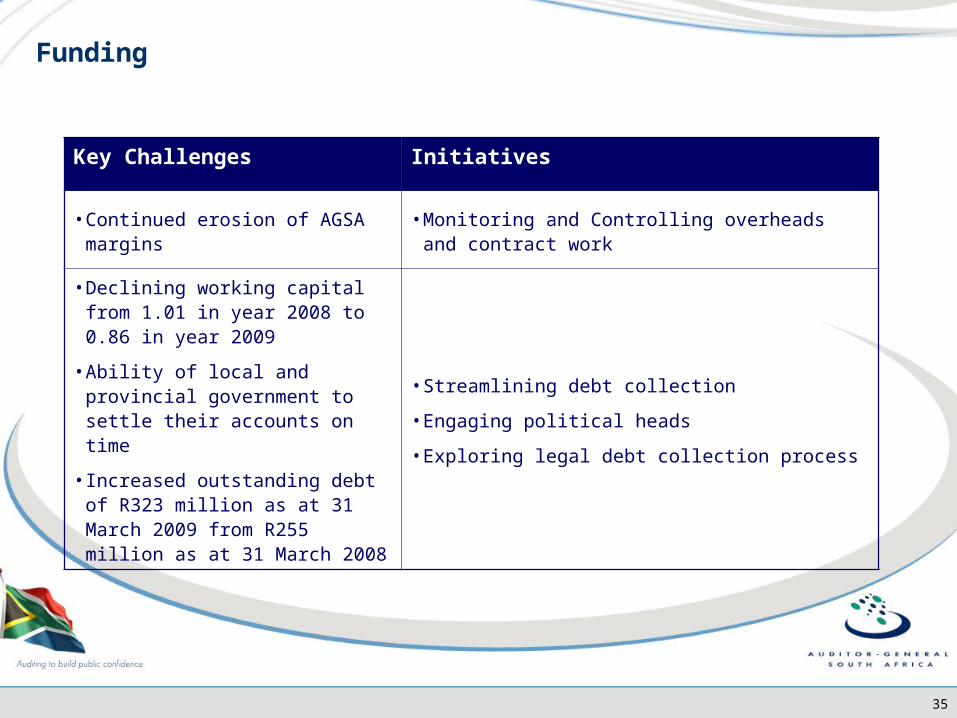
Funding
Key Challenges Initiatives
• Continued erosion of AGSA margins • Monitoring and Controlling overheads and contract
work
• Declining working capital from 1.01 in year 2008 to 0.86 in year 2009
• Ability of local and provincial government to settle their accounts on time
• Increased outstanding debt of R323 million as at 31 March 2009 from R255 million as at 31 March 2008
• Streamlining debt collection
• Engaging political heads
• Exploring legal debt collection process
36
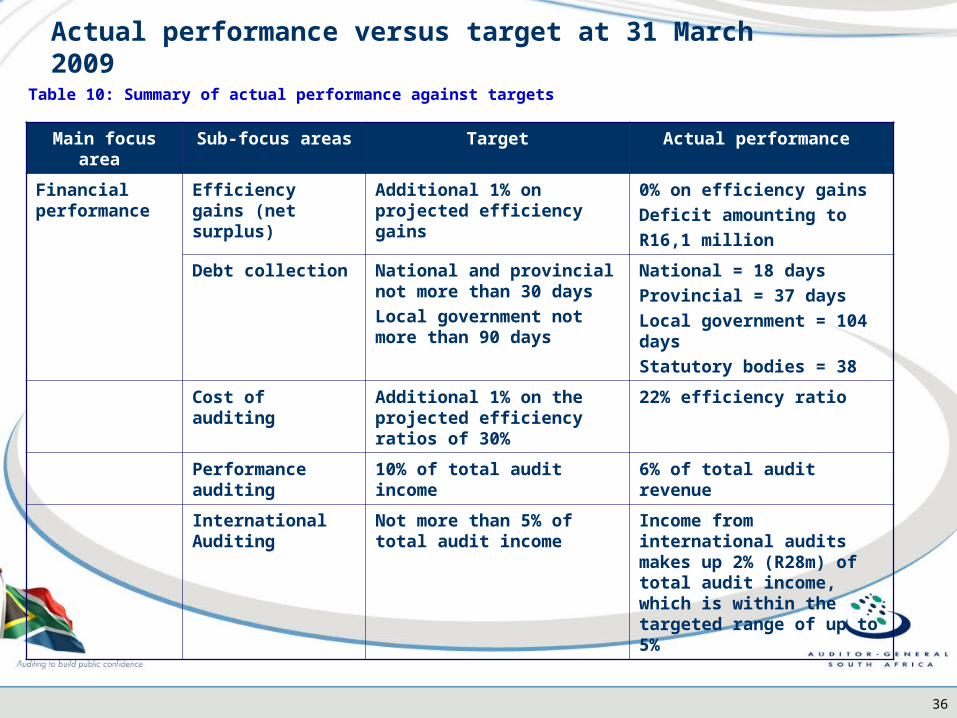
Main focus area Sub-focus areas Target Actual performance
Financial performance
Efficiency gains (net surplus)
Additional 1% on projected efficiency gains
0% on efficiency gains
Deficit amounting to
R16,1 million
Debt collection National and provincial not more than 30 days
Local government not more than 90 days
National = 18 days
Provincial = 37 days
Local government = 104 days
Statutory bodies = 38
Cost of auditing Additional 1% on the projected efficiency ratios of 30%
22% efficiency ratio
Performance auditing
10% of total audit income 6% of total audit revenue
International Auditing
Not more than 5% of total audit income
Income from international audits makes up 2% (R28m) of total audit income, which is within the targeted range of up to 5%
Table 10: Summary of actual performance against targets
Actual performance versus target at 31 March 2009
37
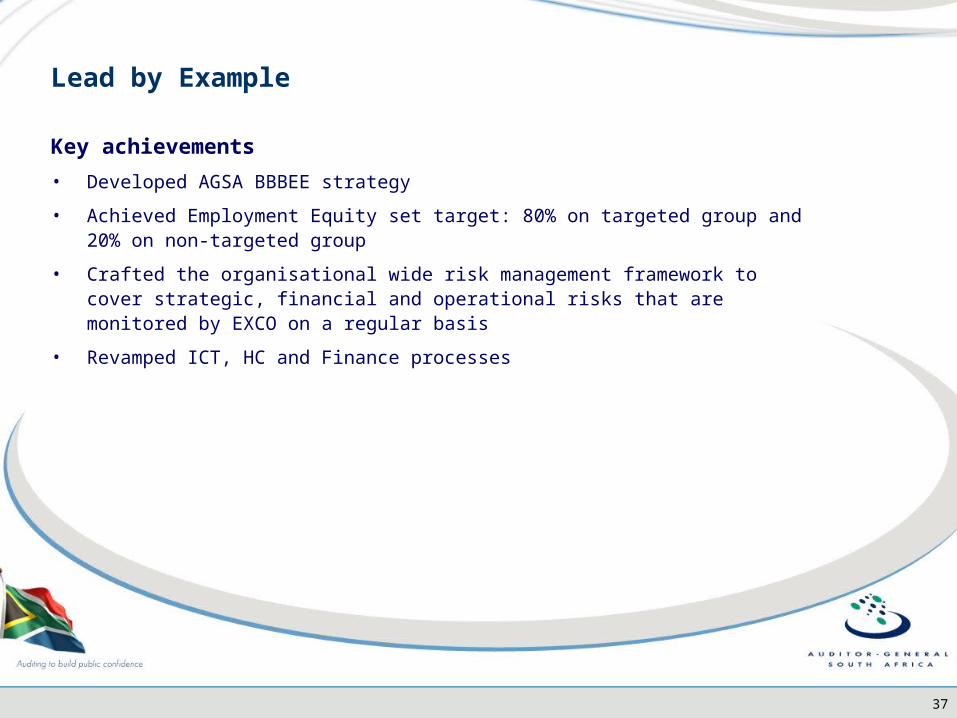
Key achievements
• Developed AGSA BBBEE strategy
• Achieved Employment Equity set target: 80% on targeted group and 20% on non-targeted group
• Crafted the organisational wide risk management framework to cover strategic, financial and operational risks that are monitored by EXCO on a regular basis
• Revamped ICT, HC and Finance processes
Lead by Example
38
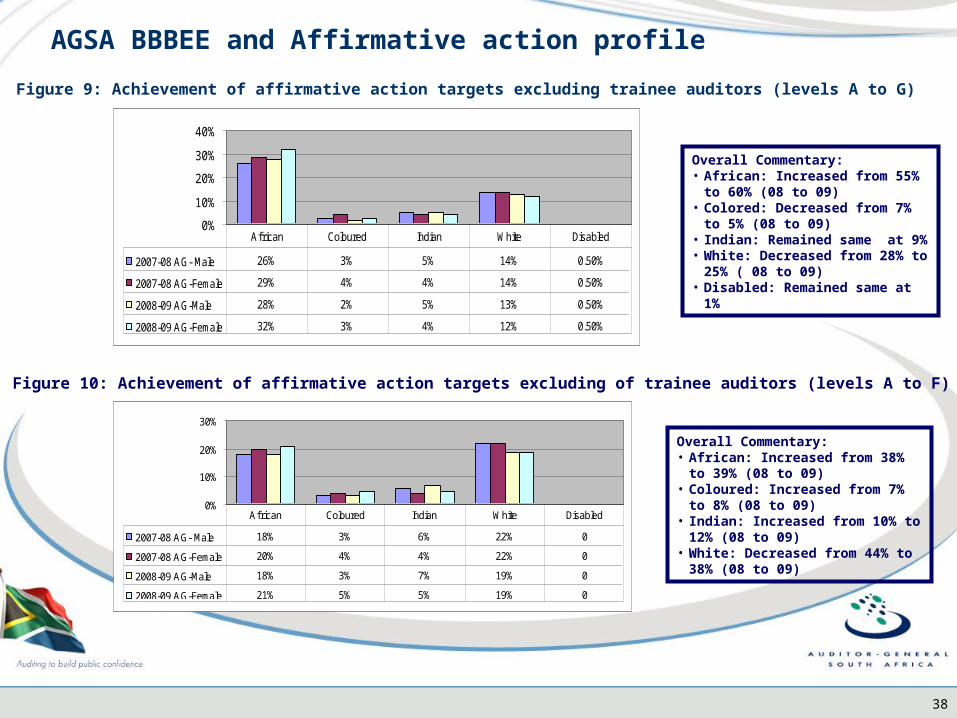
Figure 9: Achievement of affirmative action targets excluding trainee auditors (levels A to G)
Figure 10: Achievement of affirmative action targets excluding of trainee auditors (levels A to F)
Overall Commentary:• African: Increased from 55% to 60%
(08 to 09)• Colored: Decreased from 7% to 5%
(08 to 09)• Indian: Remained same at 9%• White: Decreased from 28% to 25%
( 08 to 09)• Disabled: Remained same at 1%
Overall Commentary:• African: Increased from 38% to 39%
(08 to 09)• Coloured: Increased from 7% to 8%
(08 to 09)• Indian: Increased from 10% to 12%
(08 to 09)• White: Decreased from 44% to 38%
(08 to 09)
AGSA BBBEE and Affirmative action profile
0%
10%
20%
30%
40%
2007-08 AG- Male 26% 3% 5% 14% 0.50%
2007-08 AG-Female 29% 4% 4% 14% 0.50%
2008-09 AG-Male 28% 2% 5% 13% 0.50%
2008-09 AG-Female 32% 3% 4% 12% 0.50%
African Coloured Indian White Disabled
0%
10%
20%
30%
2007-08 AG- Male 18% 3% 6% 22% 0
2007-08 AG-Female 20% 4% 4% 22% 0
2008-09 AG-Male 18% 3% 7% 19% 0
2008-09 AG-Female 21% 5% 5% 19% 0
African Coloured Indian White Disabled

39
Size of firms Allocation target
( % )
Budget
( RM )
% of budget total
Actual
( RM )
% of Actual
total
Big and large 45% 101 45% 146 47%
Medium 35% 78 35% 107 34%
Small 20% 45 20% 58 19%
100% 224 100% 311* 10%
BBBEE audit work allocation
Table 12: Allocation of audit work to private audit firms
*Note: The reporting is based on 20% allocation only
40
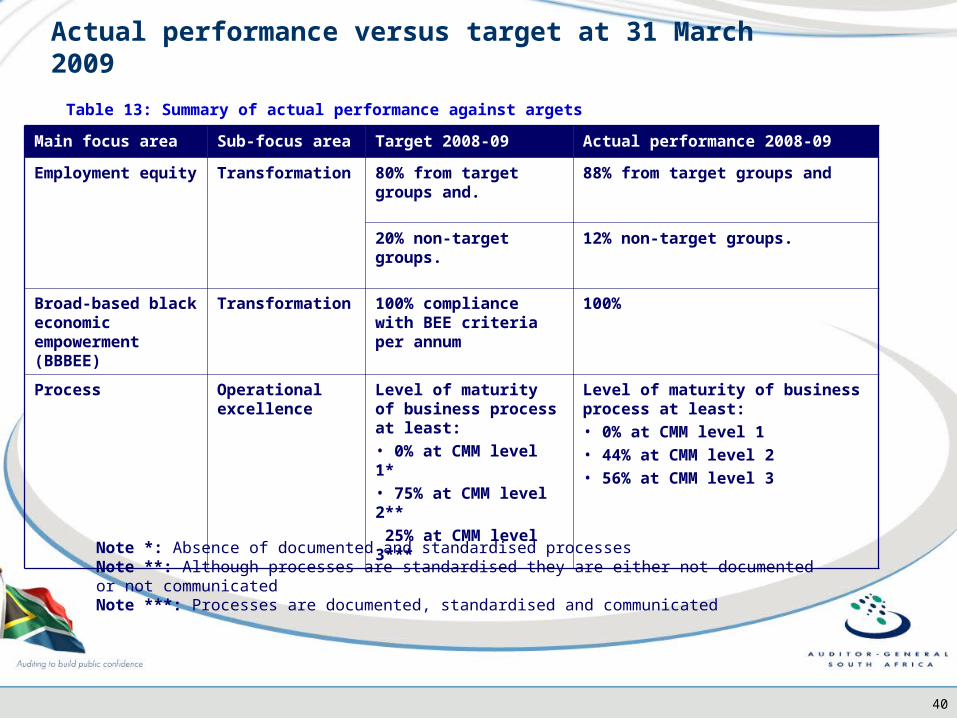
Main focus area Sub-focus area Target 2008-09 Actual performance 2008-09
Employment equity Transformation 80% from target groups and.
88% from target groups and
20% non-target groups. 12% non-target groups.
Broad-based black economic empowerment (BBBEE)
Transformation 100% compliance with BEE criteria per annum
100%
Process Operational excellence
Level of maturity of business process at least:• 0% at CMM level 1*• 75% at CMM level 2**
25% at CMM level 3***
Level of maturity of business process at least:• 0% at CMM level 1• 44% at CMM level 2• 56% at CMM level 3
Note *: Absence of documented and standardised processesNote **: Although processes are standardised they are either not documented or not communicatedNote ***: Processes are documented, standardised and communicated
Table 13: Summary of actual performance against argets
Actual performance versus target at 31 March 2009
41
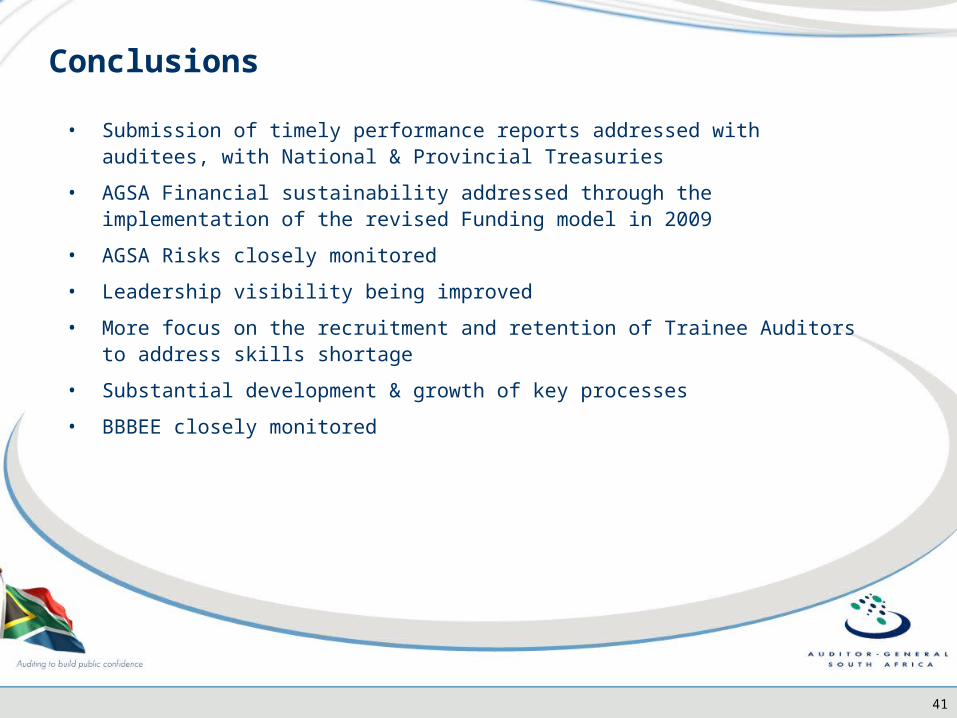
Conclusions
• Submission of timely performance reports addressed with auditees, with National & Provincial Treasuries
• AGSA Financial sustainability addressed through the implementation of the revised Funding model in 2009
• AGSA Risks closely monitored
• Leadership visibility being improved
• More focus on the recruitment and retention of Trainee Auditors to address skills shortage
• Substantial development & growth of key processes
• BBBEE closely monitored