Embed Size (px)
Citation preview
Ahlers AG, herfordInterim Report Q3 2009/10

32
AhleRs Ag
InteRIm RepoRt Q3 2009/10
32
AhleRs AgInterIm report Q3 2009/10(December 1, 2009 to August 31, 2010)
BusIness performance In the fIrst nIne months of fIscal 2009/10
Q3 2009/10 - hIghlIghts
- Earnings position improves significantly in the first nine months
- Sales rise in third quarter
- Premium brands grow by 4 percent
- Premium brands account for 52.5 percent of total sales, up from 49.6 percent in previous year
- Sound financial situation with high equity ratio
- Retail management team to be expanded swiftly
1. BusIness and general condItIons
The world economy continued to improve in the third quarter of the fiscal year 2009/10.
While growth in most European markets has been moderate and in line with expectations,
Germany’s GDP increased robustly.
Positive economic news and the declining jobless rate have led to positive consumer
sentiment and growing sales in the German fashion retail sector. In conjunction with cau-
tious pre-orders from retailers for the current season, this has resulted in lower inventories
and good intra-seasonal sales as well as rising pre-orders for the coming spring/summer
season 2011.
Retail sales also picked up in many other European markets such as France, Swit-
zerland, Poland, Austria, the Netherlands and Russia, albeit at a more moderate pace. Only
those countries that were hit hard by the crisis, i.e. Italy, Greece, the UK, Spain and the Baltic
countries, remain difficult sales markets.
2. earnIngs, fInancIal and net worth posItIon
Increased sales in the third quarter
Based on stable order figures for the second half of 2010, menswear manufacturer Ahlers achie-
ved a moderate 0.7 percent increase in sales revenues in the third quarter. As a result, the decli-
ne in sales for the total nine-month period of 2009/10 was reduced to 1.9 percent (H1 2009/10:
-3.4 percent). Total sales for the nine-month period amounted to EUR 186.2 million (previous
year: EUR 189.9 million).
54
AhleRs Ag
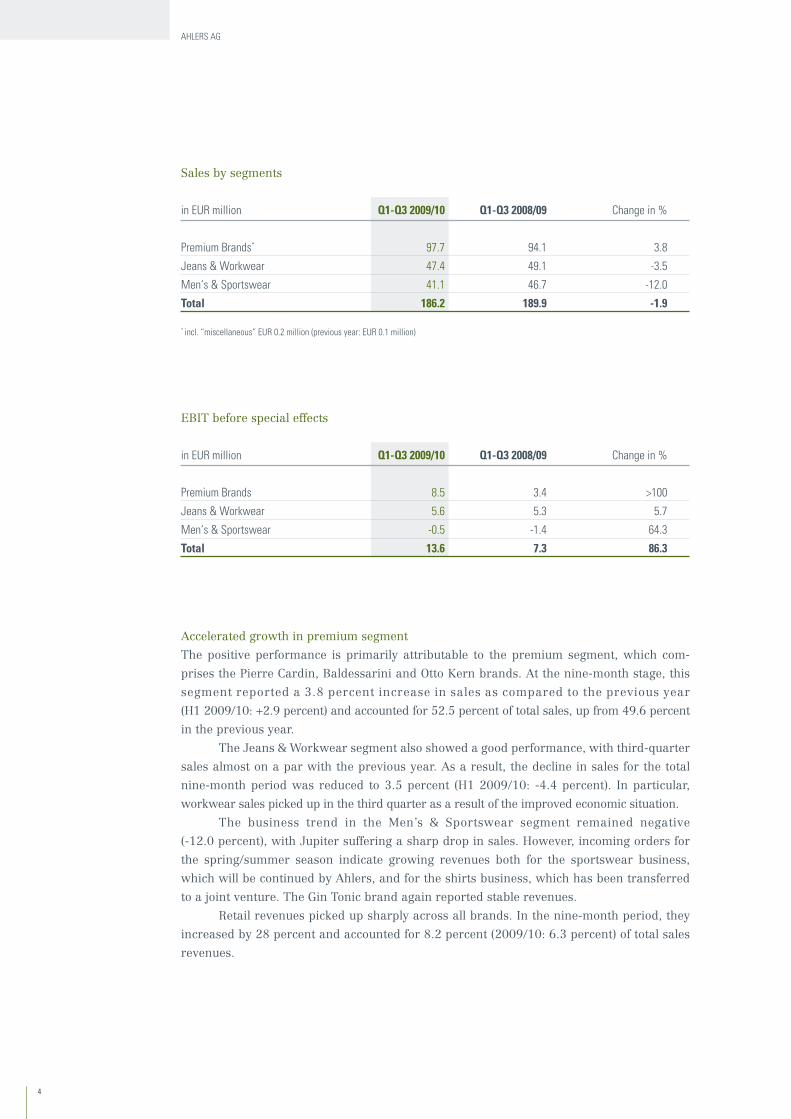
Sales by segments
in eUR million Q1-Q3 2009/10 Q1-Q3 2008/09 Change in %
premium Brands* 97.7 94.1 3.8
Jeans & Workwear 47.4 49.1 -3.5
men‘s & sportswear 41.1 46.7 -12.0
Total 186.2 189.9 -1.9
* incl. “miscellaneous” eUR 0.2 million (previous year: eUR 0.1 million)
EBIT before special effects
in eUR million Q1-Q3 2009/10 Q1-Q3 2008/09 Change in %
premium Brands 8.5 3.4 >100
Jeans & Workwear 5.6 5.3 5.7
men‘s & sportswear -0.5 -1.4 64.3
Total 13.6 7.3 86.3
Accelerated growth in premium segment
The positive performance is primarily attributable to the premium segment, which com-
prises the Pierre Cardin, Baldessarini and Otto Kern brands. At the nine-month stage, this
segment reported a 3.8 percent increase in sales as compared to the previous year
(H1 2009/10: +2.9 percent) and accounted for 52.5 percent of total sales, up from 49.6 percent
in the previous year.
The Jeans & Workwear segment also showed a good performance, with third-quarter
sales almost on a par with the previous year. As a result, the decline in sales for the total
nine-month period was reduced to 3.5 percent (H1 2009/10: -4.4 percent). In particular,
workwear sales picked up in the third quarter as a result of the improved economic situation.
The business trend in the Men’s & Sportswear segment remained negative
(-12.0 percent), with Jupiter suffering a sharp drop in sales. However, incoming orders for
the spring/summer season indicate growing revenues both for the sportswear business,
which will be continued by Ahlers, and for the shirts business, which has been transferred
to a joint venture. The Gin Tonic brand again reported stable revenues.
Retail revenues picked up sharply across all brands. In the nine-month period, they
increased by 28 percent and accounted for 8.2 percent (2009/10: 6.3 percent) of total sales
revenues.
InteRIm RepoRt Q3 2009/10
54
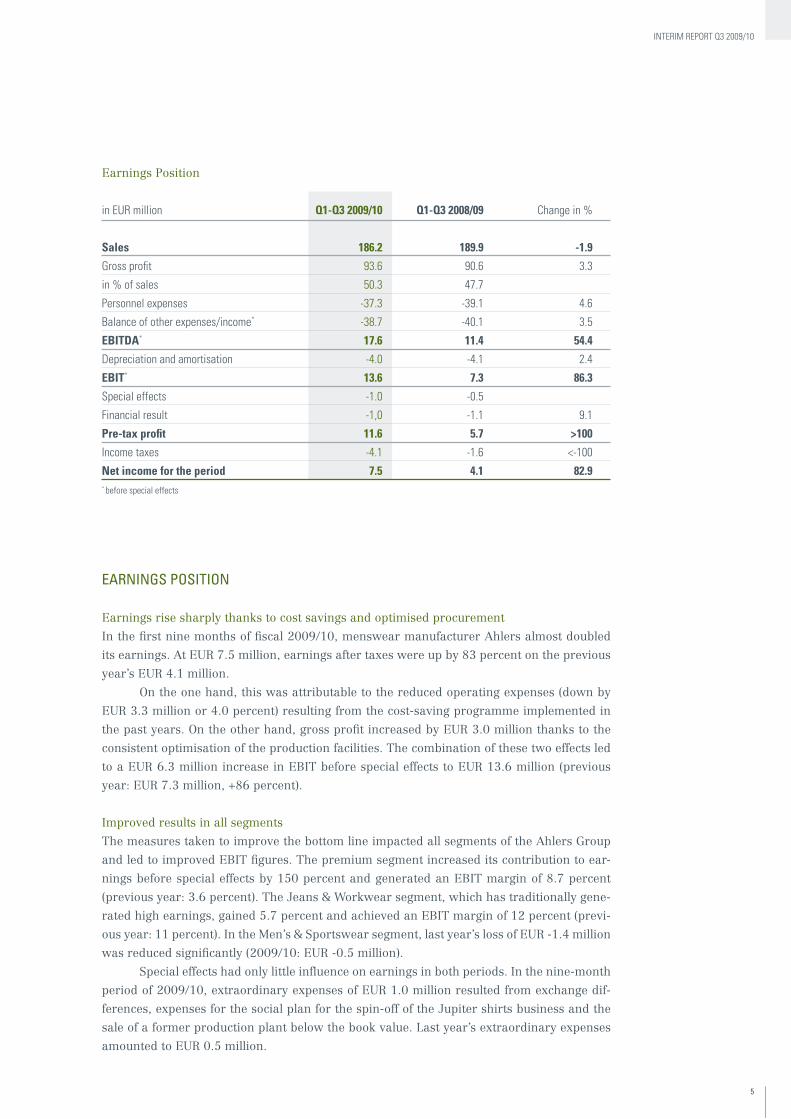
Earnings Position
in eUR million Q1-Q3 2009/10 Q1-Q3 2008/09 Change in %
sales 186.2 189.9 -1.9
gross profit 93.6 90.6 3.3
in % of sales 50.3 47.7
personnel expenses -37.3 -39.1 4.6
Balance of other expenses/income* -38.7 -40.1 3.5
eBITdA* 17.6 11.4 54.4
Depreciation and amortisation -4.0 -4.1 2.4
eBIT* 13.6 7.3 86.3
special effects -1.0 -0.5
Financial result -1,0 -1.1 9.1
Pre-tax profit 11.6 5.7 >100
Income taxes -4.1 -1.6 <-100
Net income for the period 7.5 4.1 82.9* before special effects
earnIngs posItIon
Earnings rise sharply thanks to cost savings and optimised procurement
In the first nine months of fiscal 2009/10, menswear manufacturer Ahlers almost doubled
its earnings. At EUR 7.5 million, earnings after taxes were up by 83 percent on the previous
year’s EUR 4.1 million.
On the one hand, this was attributable to the reduced operating expenses (down by
EUR 3.3 million or 4.0 percent) resulting from the cost-saving programme implemented in
the past years. On the other hand, gross profit increased by EUR 3.0 million thanks to the
consistent optimisation of the production facilities. The combination of these two effects led
to a EUR 6.3 million increase in EBIT before special effects to EUR 13.6 million (previous
year: EUR 7.3 million, +86 percent).
Improved results in all segments
The measures taken to improve the bottom line impacted all segments of the Ahlers Group
and led to improved EBIT figures. The premium segment increased its contribution to ear-
nings before special effects by 150 percent and generated an EBIT margin of 8.7 percent
(previous year: 3.6 percent). The Jeans & Workwear segment, which has traditionally gene-
rated high earnings, gained 5.7 percent and achieved an EBIT margin of 12 percent (previ-
ous year: 11 percent). In the Men’s & Sportswear segment, last year’s loss of EUR -1.4 million
was reduced significantly (2009/10: EUR -0.5 million).
Special effects had only little influence on earnings in both periods. In the nine-month
period of 2009/10, extraordinary expenses of EUR 1.0 million resulted from exchange dif-
ferences, expenses for the social plan for the spin-off of the Jupiter shirts business and the
sale of a former production plant below the book value. Last year’s extraordinary expenses
amounted to EUR 0.5 million.
76
AhleRs Ag
In fiscal 2009/2010, the tax ratio climbed from 28 to 36 percent due to special effects, name-
ly the non-deductible book loss from the sale of the production building as well as off-period
tax expenses resulting from a tax audit. Due to the low debt level, net financial expenses
declined moderately from EUR 1.1 million to EUR 1.0 million.
This report contains a consolidated statement of comprehensive income (page 12),
which shows the additional impact of amounts recorded in equity on comprehensive income
besides Group net income. This statement of comprehensive income primarily reflects the
effects of currency fluctuations in both periods. On the one hand, currency hedges for pro-
curement processes in USD and foreign currencies received from international activities
increased equity by EUR 0.6 million in the current fiscal year, compared to a reduction by
EUR 0.7 million in the previous year. On the other hand, the depreciation of the Polish zloty
in the previous year resulted in book losses of EUR 1.7 million due to exchange differences,
which have now been reversed on account of the currency’s recovery (+EUR 1.2 million).
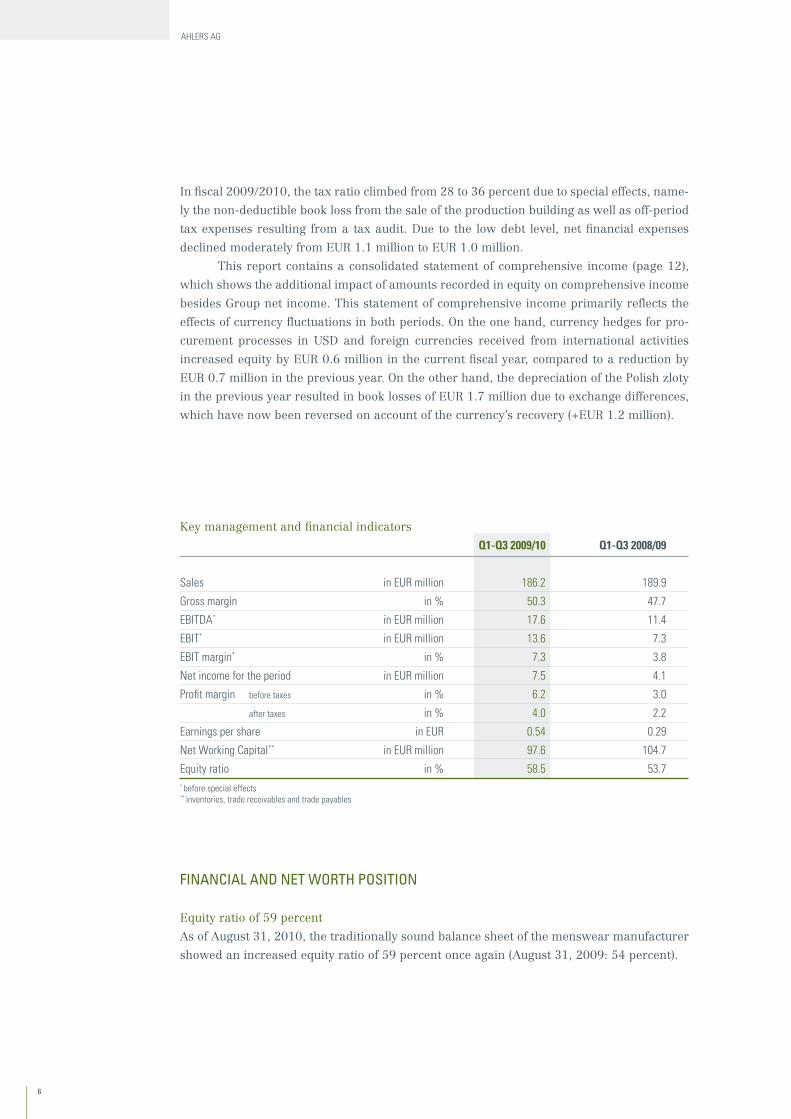
fInancIal and net worth posItIon
Equity ratio of 59 percent
As of August 31, 2010, the traditionally sound balance sheet of the menswear manufacturer
showed an increased equity ratio of 59 percent once again (August 31, 2009: 54 percent).
Key management and financial indicators
Q1-Q3 2009/10 Q1-Q3 2008/09
sales in eUR million 186.2 189.9
gross margin in % 50.3 47.7
eBItDA* in eUR million 17.6 11.4
eBIt* in eUR million 13.6 7.3
eBIt margin* in % 7.3 3.8
net income for the period in eUR million 7.5 4.1
profit margin before taxes in % 6.2 3.0
after taxes in % 4.0 2.2
earnings per share in eUR 0.54 0.29
net Working Capital** in eUR million 97.6 104.7
equity ratio in % 58.5 53.7* before special effects** inventories, trade receivables and trade payables
InteRIm RepoRt Q3 2009/10
76
Reduced net working capital tie-up
Due to the increased results, equity was strengthened in the reporting period and accounted
for a higher percentage of total assets. At the same time, net working capital was reduced by
EUR 7.1 million through strict receivables management. This led to a decline in total assets
and an increase in the equity ratio. Inventories rose moderately due to the fact that seasonal
goods were delivered a bit later.
Greatly improved cash flow
The Q1 and Q3 balance sheets of fashion manufacturers are characterised by a high seaso-
nal tie-up of capital in inventories and receivables. This is due to the fact that these balance
sheets are prepared in the middle of the main delivery periods of the seasonal goods, when
inventories and receivables tend to be higher. This is why the cash flow from operating acti-
vities is negative in both periods. This year, the cash flow from operating activities improved
by EUR 7.7 million to EUR -1.0 million (2008/09: EUR -8.7 million) due to the improved
earnings position and lower receivables.
At the same time, cash flow from investing activities climbed from EUR -3.9 million to
EUR -1.8 million. This is attributable to the fact that last year saw the company make high
investments in the expansion of the production facility in Sri Lanka. At the bottom line, the
financial position of the Ahlers Group continued to improve.
3. post Balance sheet events
No events of special significance occurred between the end of the third quarter and the pu-
blication of the interim report.
4. rIsk report
No changes with respect to risks related to future developments have occurred since the
start of the new fiscal year. The statements made in the risk report of the 2008/09 con-
solidated financial statements remain valid.
5. employees
As of August 31, 2010, the Ahlers Group employed 2,209 people, 224 more than in the previ-
ous year (August 31, 2009: 1,985). This is primarily attributable to the fact that the capacity
of our Sri Lankan production facility was increased and we now employ 808 people at this
plant, 228 more than in the previous year. In the context of the expansion of our own Retail
activities, the headcount in this division increased by 50 people, while the headcount in the
other divisions declined by 54. In Germany, 614 people (previous year: 649) work for the
Ahlers Group.
98
AhleRs Ag
6. performance of the ahlers shares
On August 31, 2010, Ahlers shares were trading at EUR 7.50 (common share) and EUR 7.45
(preferred share), which was 10 percent and 24 percent, respectively, above the previous
year‘s level. Including the dividend, which was paid out in May 2010, the share prices were
up by as much as 14 percent and 29 percent, respectively, on the previous year.
Since the end of the past fiscal year on November 30, 2009, Ahlers shares have gai-
ned 8 percent and 9 percent, respectively, taking the dividend payment into account.
7. forecast report
The Management Board of Ahlers AG assumes that the economic environment will remain
favourable in the final three months of the fiscal year. The positive employment situation in
Germany will continue to support retail turnover and is nurturing hopes of good Christmas
sales. The economic situation in Ahlers’ most important foreign markets, i.e. France, Po-
land, Russia, Austria, the Netherlands and Switzerland, is also likely to improve beyond the
turn of the year 2010/2011.
Significantly improved result expected
In view of the favourable environment, the Management Board of Ahlers AG again confirms
its projections for the full fiscal year. Stable or moderately rising sales revenues are projec-
ted for the second half of 2009/10. Earnings after taxes for the full fiscal year should clearly
exceed the previous year’s level.
Sound financial position projected for year-end
Management will continue its efforts to reduce the net working capital. In conjunction with
capital expenditures that will not exceed the level of depreciation, the financial situation of
the Group should continue to show a positive trend towards the end of the year.
Based on the improved earnings position, the high cash flow and the good financial
position, a higher dividend should be possible, which would once more demonstrate the
dividend strength of the Ahlers shares.
Higher incoming orders for spring/summer 2011
Pre-sales for the spring/summer season 2011 are underway. At this stage, incoming orders
are up by a low double-digit percentage in the premium segment and by a medium single-
digit percentage for all brands of the Ahlers Group, adjusted for the Jupiter shirts business,
which has been spun off. We therefore see good chances for the company to continue its
positive performance in the next fiscal year. In the short term, the Management Board aims
to expand the Retail activities and is therefore looking for suitable store locations as well as
for employees to manage the company’s Retail operations out of the Herford head office.

InteRIm RepoRt Q3 2009/10
98
1110
AhleRs Ag
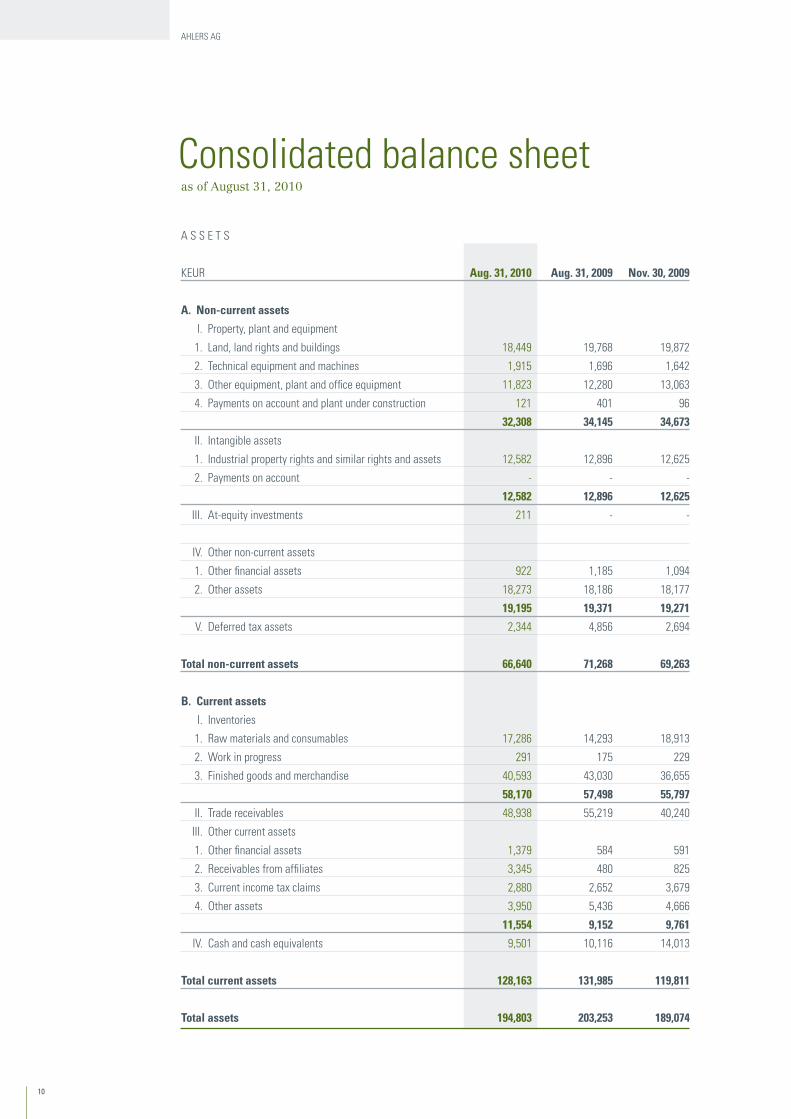
A s s e t s
KeUR Aug. 31, 2010 Aug. 31, 2009 Nov. 30, 2009
A. Non-current assets
I. property, plant and equipment
1. land, land rights and buildings 18,449 19,768 19,872
2. technical equipment and machines 1,915 1,696 1,642
3. other equipment, plant and office equipment 11,823 12,280 13,063
4. payments on account and plant under construction 121 401 96
32,308 34,145 34,673
II. Intangible assets
1. Industrial property rights and similar rights and assets 12,582 12,896 12,625
2. payments on account - - -
12,582 12,896 12,625
III. At-equity investments 211 - -
IV. other non-current assets
1. other financial assets 922 1,185 1,094
2. other assets 18,273 18,186 18,177
19,195 19,371 19,271
V. Deferred tax assets 2,344 4,856 2,694
Total non-current assets 66,640 71,268 69,263
B. Current assets
I. Inventories
1. Raw materials and consumables 17,286 14,293 18,913
2. Work in progress 291 175 229
3. Finished goods and merchandise 40,593 43,030 36,655
58,170 57,498 55,797
II. trade receivables 48,938 55,219 40,240
III. other current assets
1. other financial assets 1,379 584 591
2. Receivables from affiliates 3,345 480 825
3. Current income tax claims 2,880 2,652 3,679
4. other assets 3,950 5,436 4,666
11,554 9,152 9,761
IV. Cash and cash equivalents 9,501 10,116 14,013
Total current assets 128,163 131,985 119,811
Total assets 194,803 203,253 189,074
Consolidated balance sheet as of August 31, 2010
InteRIm RepoRt Q3 2009/10
1110
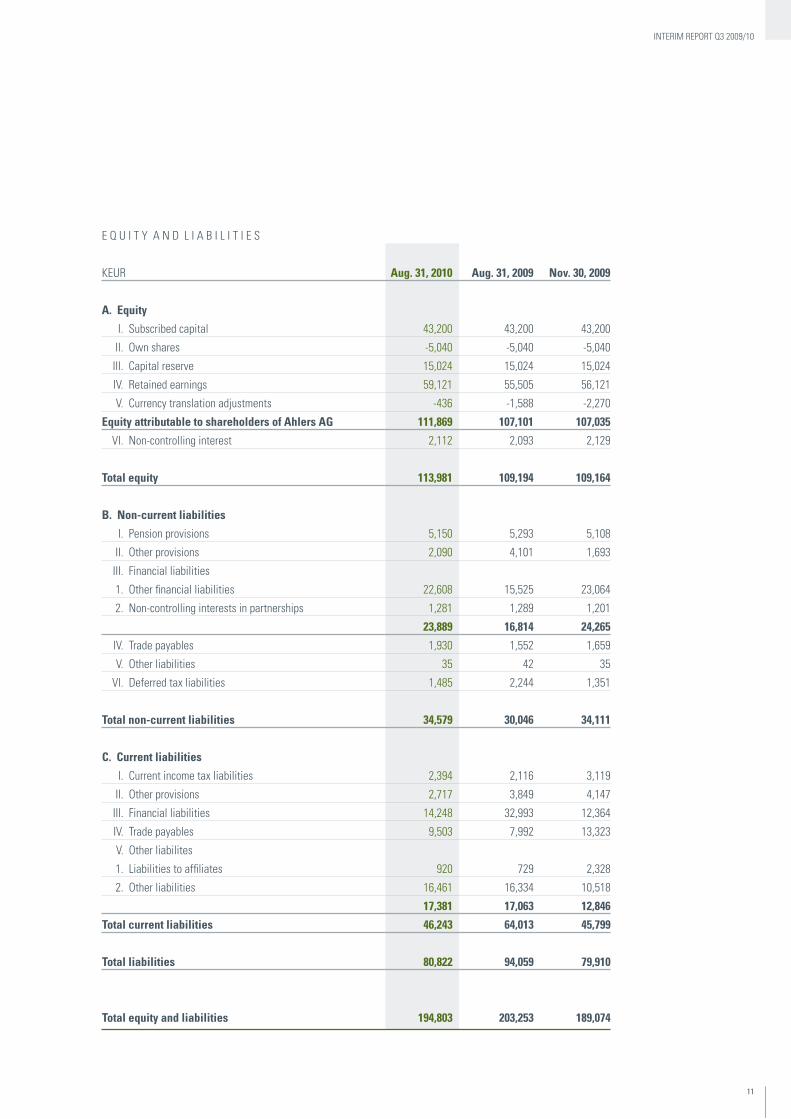
e Q U I t Y A n D l I A B I l I t I e s
KeUR Aug. 31, 2010 Aug. 31, 2009 Nov. 30, 2009
A. equity
I. subscribed capital 43,200 43,200 43,200
II. own shares -5,040 -5,040 -5,040
III. Capital reserve 15,024 15,024 15,024
IV. Retained earnings 59,121 55,505 56,121
V. Currency translation adjustments -436 -1,588 -2,270
equity attributable to shareholders of Ahlers AG 111,869 107,101 107,035
VI. non-controlling interest 2,112 2,093 2,129
Total equity 113,981 109,194 109,164
B. Non-current liabilities
I. pension provisions 5,150 5,293 5,108
II. other provisions 2,090 4,101 1,693
III. Financial liabilities
1. other financial liabilities 22,608 15,525 23,064
2. non-controlling interests in partnerships 1,281 1,289 1,201
23,889 16,814 24,265
IV. trade payables 1,930 1,552 1,659
V. other liabilities 35 42 35
VI. Deferred tax liabilities 1,485 2,244 1,351
Total non-current liabilities 34,579 30,046 34,111
C. Current liabilities
I. Current income tax liabilities 2,394 2,116 3,119
II. other provisions 2,717 3,849 4,147
III. Financial liabilities 14,248 32,993 12,364
IV. trade payables 9,503 7,992 13,323
V. other liabilites
1. liabilities to affiliates 920 729 2,328
2. other liabilities 16,461 16,334 10,518
17,381 17,063 12,846
Total current liabilities 46,243 64,013 45,799
Total liabilities 80,822 94,059 79,910
Total equity and liabilities 194,803 203,253 189,074
1312
AhleRs Ag
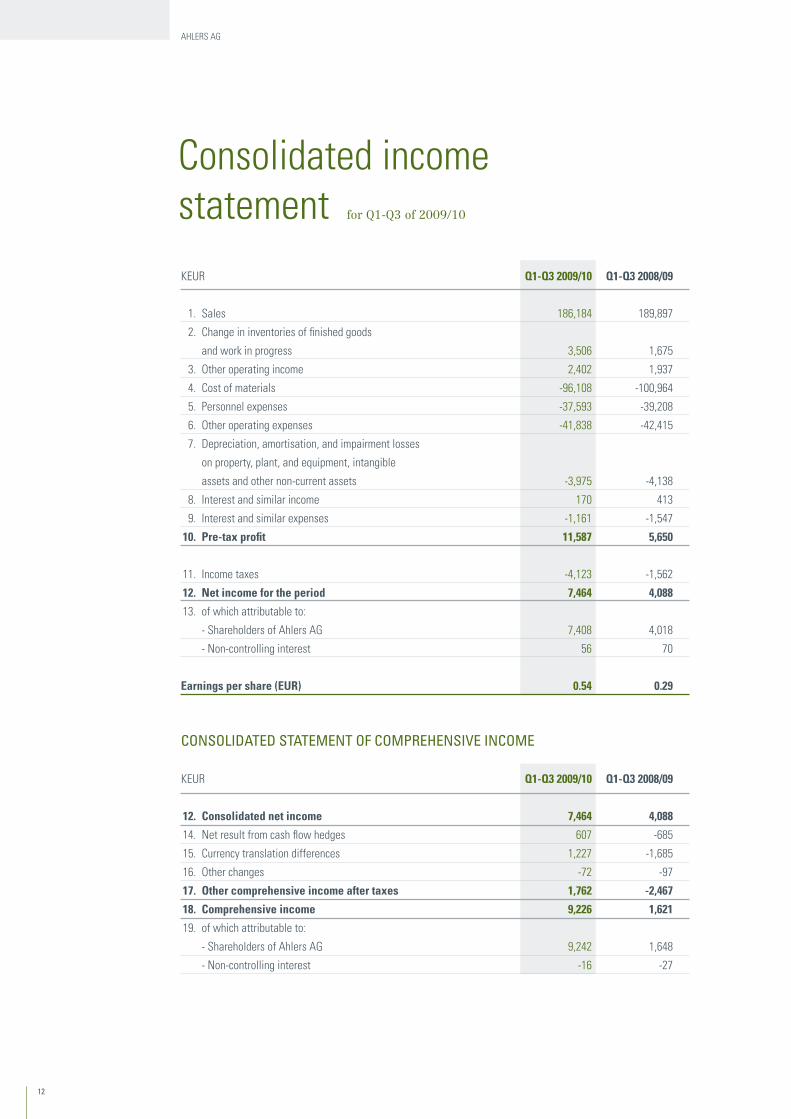
KeUR Q1-Q3 2009/10 Q1-Q3 2008/09
1. sales 186,184 189,897
2. Change in inventories of finished goods
and work in progress 3,506 1,675
3. other operating income 2,402 1,937
4. Cost of materials -96,108 -100,964
5. personnel expenses -37,593 -39,208
6. other operating expenses -41,838 -42,415
7. Depreciation, amortisation, and impairment losses
on property, plant, and equipment, intangible
assets and other non-current assets -3,975 -4,138
8. Interest and similar income 170 413
9. Interest and similar expenses -1,161 -1,547
10. Pre-tax profit 11,587 5,650
11. Income taxes -4,123 -1,562
12. Net income for the period 7,464 4,088
13. of which attributable to:
- shareholders of Ahlers Ag 7,408 4,018
- non-controlling interest 56 70
earnings per share (eUr) 0.54 0.29
consolIdated statement of comprehensIve Income
KeUR Q1-Q3 2009/10 Q1-Q3 2008/09
12. Consolidated net income 7,464 4,088
14. net result from cash flow hedges 607 -685
15. Currency translation differences 1,227 -1,685
16. other changes -72 -97
17. other comprehensive income after taxes 1,762 -2,467
18. Comprehensive income 9,226 1,621
19. of which attributable to:
- shareholders of Ahlers Ag 9,242 1,648
- non-controlling interest -16 -27
Consolidated income statement for Q1-Q3 of 2009/10
InteRIm RepoRt Q3 2009/10
1312
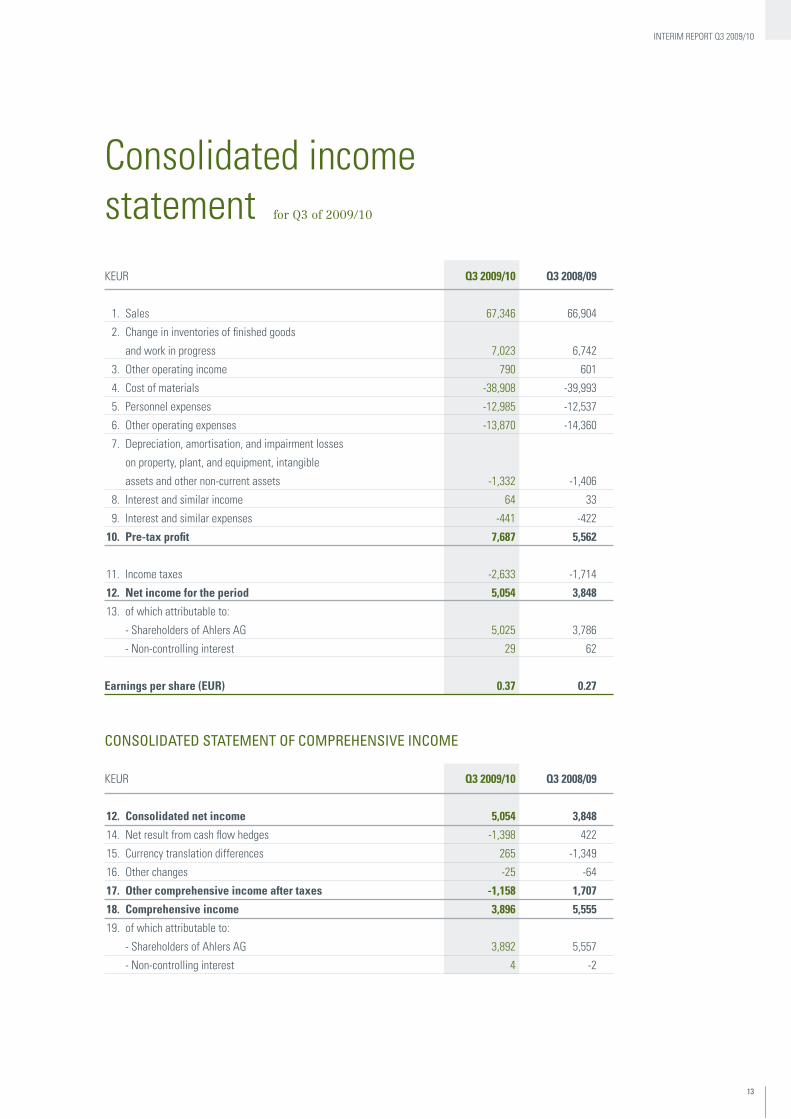
KeUR Q3 2009/10 Q3 2008/09
1. sales 67,346 66,904
2. Change in inventories of finished goods
and work in progress 7,023 6,742
3. other operating income 790 601
4. Cost of materials -38,908 -39,993
5. personnel expenses -12,985 -12,537
6. other operating expenses -13,870 -14,360
7. Depreciation, amortisation, and impairment losses
on property, plant, and equipment, intangible
assets and other non-current assets -1,332 -1,406
8. Interest and similar income 64 33
9. Interest and similar expenses -441 -422
10. Pre-tax profit 7,687 5,562
11. Income taxes -2,633 -1,714
12. Net income for the period 5,054 3,848
13. of which attributable to:
- shareholders of Ahlers Ag 5,025 3,786
- non-controlling interest 29 62
earnings per share (eUr) 0.37 0.27
consolIdated statement of comprehensIve Income
KeUR Q3 2009/10 Q3 2008/09
12. Consolidated net income 5,054 3,848
14. net result from cash flow hedges -1,398 422
15. Currency translation differences 265 -1,349
16. other changes -25 -64
17. other comprehensive income after taxes -1,158 1,707
18. Comprehensive income 3,896 5,555
19. of which attributable to:
- shareholders of Ahlers Ag 3,892 5,557
- non-controlling interest 4 -2
Consolidated income statement for Q3 of 2009/10
1514
AhleRs Ag
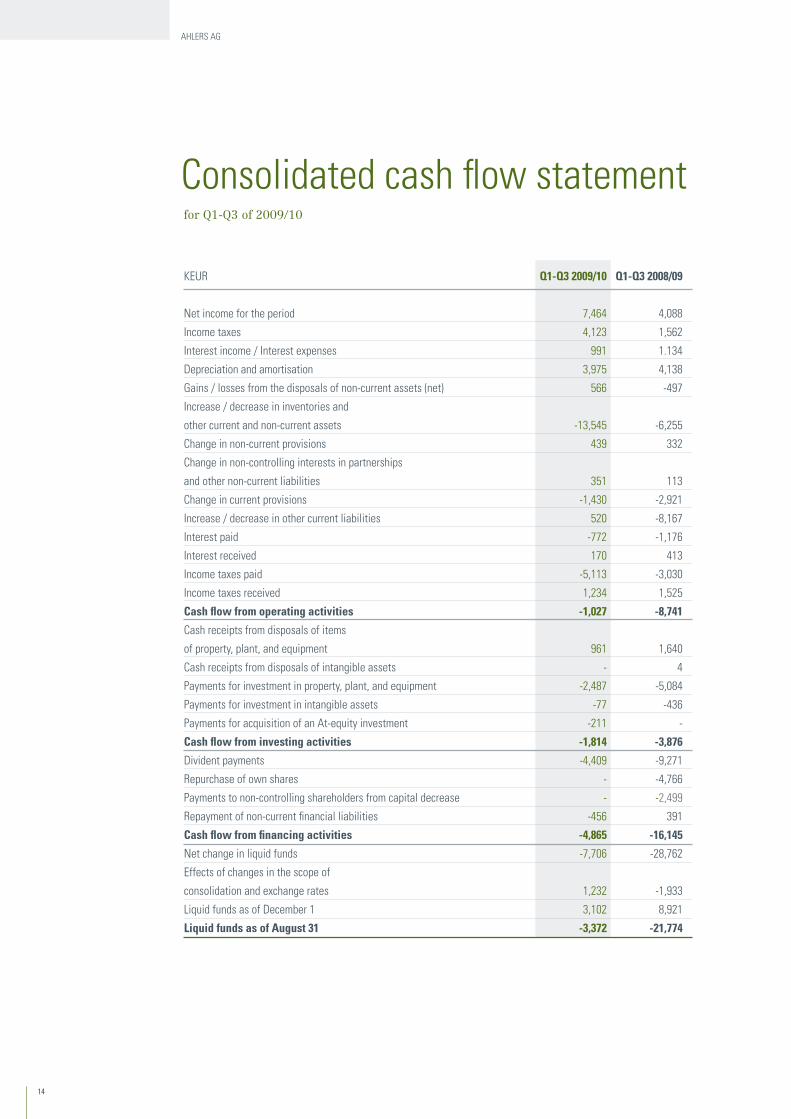
KeUR Q1-Q3 2009/10 Q1-Q3 2008/09
net income for the period 7,464 4,088
Income taxes 4,123 1,562
Interest income / Interest expenses 991 1.134
Depreciation and amortisation 3,975 4,138
gains / losses from the disposals of non-current assets (net) 566 -497
Increase / decrease in inventories and
other current and non-current assets -13,545 -6,255
Change in non-current provisions 439 332
Change in non-controlling interests in partnerships
and other non-current liabilities 351 113
Change in current provisions -1,430 -2,921
Increase / decrease in other current liabilities 520 -8,167
Interest paid -772 -1,176
Interest received 170 413
Income taxes paid -5,113 -3,030
Income taxes received 1,234 1,525
Cash flow from operating activities -1,027 -8,741
Cash receipts from disposals of items
of property, plant, and equipment 961 1,640
Cash receipts from disposals of intangible assets - 4
payments for investment in property, plant, and equipment -2,487 -5,084
payments for investment in intangible assets -77 -436
payments for acquisition of an At-equity investment -211 -
Cash flow from investing activities -1,814 -3,876
Divident payments -4,409 -9,271
Repurchase of own shares - -4,766
payments to non-controlling shareholders from capital decrease - -2,499
Repayment of non-current financial liabilities -456 391
Cash flow from financing activities -4,865 -16,145
net change in liquid funds -7,706 -28,762
effects of changes in the scope of
consolidation and exchange rates 1,232 -1,933
liquid funds as of December 1 3,102 8,921
liquid funds as of August 31 -3,372 -21,774
Consolidated cash flow statementfor Q1-Q3 of 2009/10

InteRIm RepoRt Q3 2009/10
1514
1716
AhleRs Ag
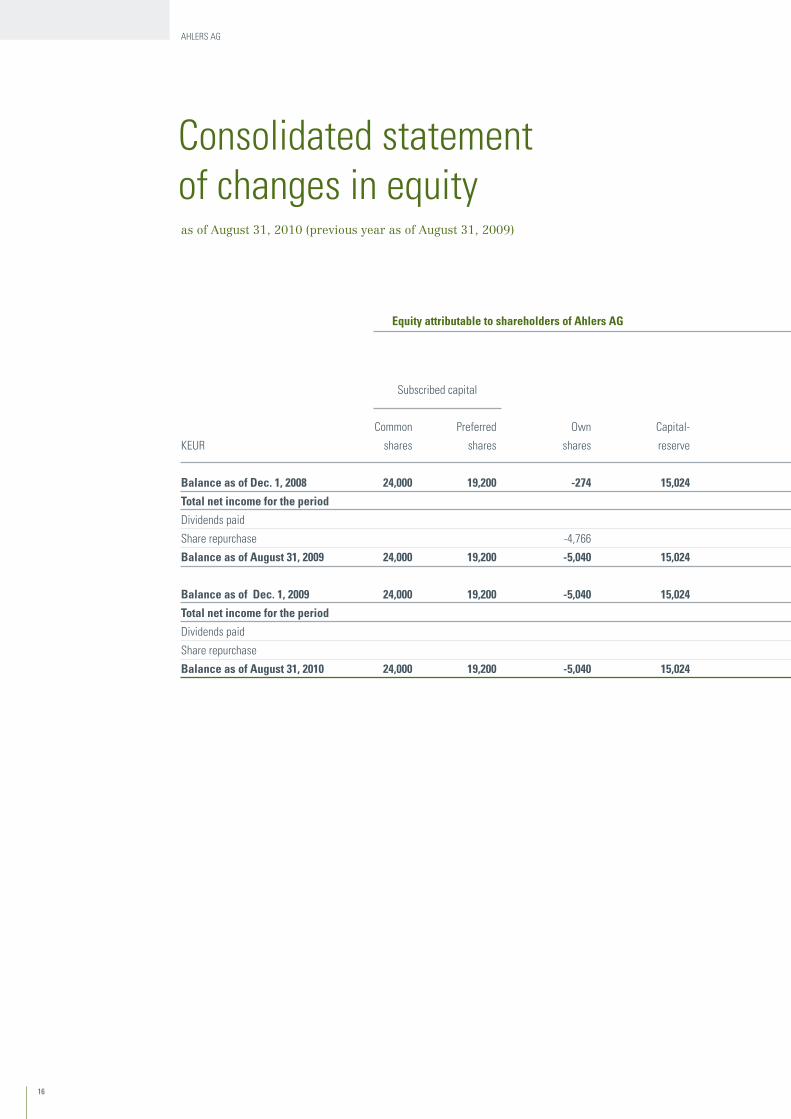
KeUR
Balance as of dec. 1, 2008
Total net income for the period
Dividends paid
share repurchase
Balance as of August 31, 2009
Balance as of dec. 1, 2009
Total net income for the period
Dividends paid
share repurchase
Balance as of August 31, 2010
equity attributable to shareholders of Ahlers AG
Common
shares
24,000
24,000
24,000
24,000
preferred
shares
19,200
19,200
19,200
19,200
own
shares
-274
-4,766
-5,040
-5,040
-5,040
Capital-
reserve
15,024
15,024
15,024
15,024
subscribed capital
Consolidated statement of changes in equityas of August 31, 2010 (previous year as of August 31, 2009)
InteRIm RepoRt Q3 2009/10
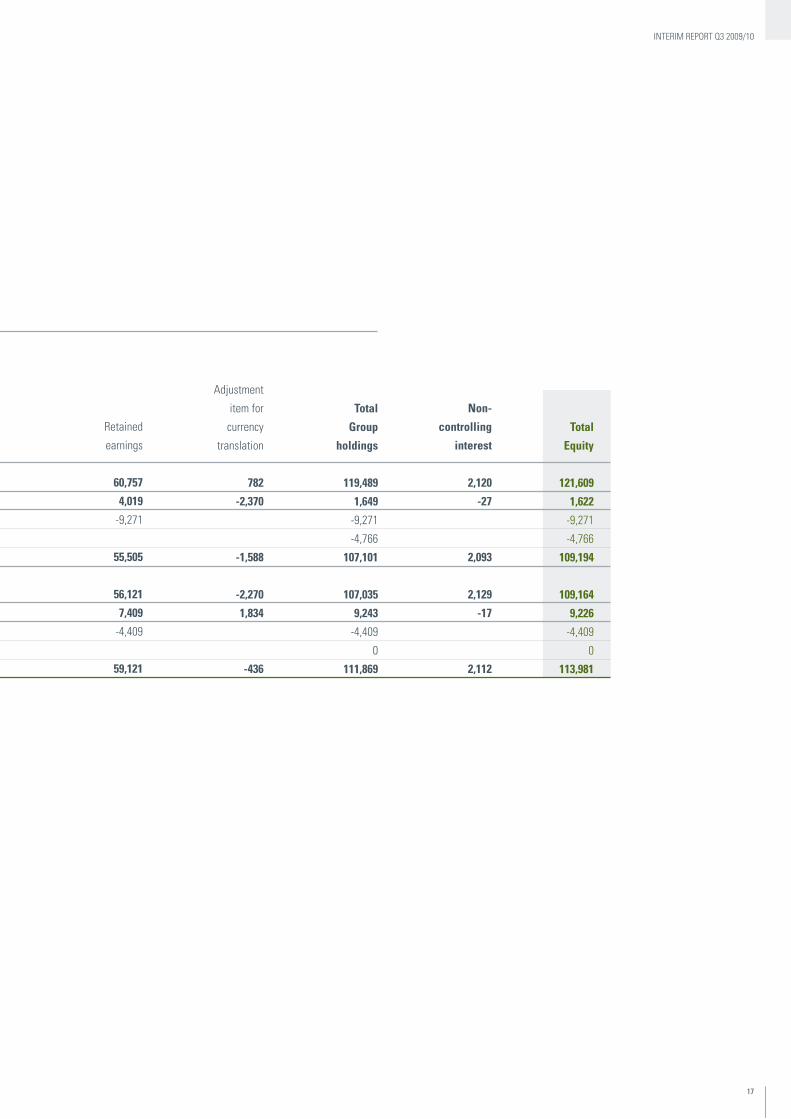
1716
equity attributable to shareholders of Ahlers AG
Non-
controlling
interest
2,120
-27
2,093
2,129
-17
2,112
Retained
earnings
60,757
4,019
-9,271
55,505
56,121
7,409
-4,409
59,121
Adjustment
item for
currency
translation
782
-2,370
-1,588
-2,270
1,834
-436
Total
Group
holdings
119,489
1,649
-9,271
-4,766
107,101
107,035
9,243
-4,409
0
111,869
Total
equity
121,609
1,622
-9,271
-4,766
109,194
109,164
9,226
-4,409
0
113,981
1918
AhleRs Ag
2009/10
45,519
72,082
29,609
8,851
22,400
24,020
2009/10
32,436
16,741
10,797
10,933
4,213
5,713
2008/09
43,481
68,818
27,861
8,974
22,641
25,424
2008/09
34,143
13,668
10,702
9,588
4,251
5,993
2009/10
47,446
-
5,300
911
156
30
243
33,387
658
17,266
2008/09
49,096
-
5,308
930
291
109
275
29,249
1,121
17,749
2009/10
97,528
-
7,314
1,999
327
100
733
104,953
1,431
43,371
2008/09
93,983
-
3,038
1,770
266
207
660
103,216
2,417
44,722
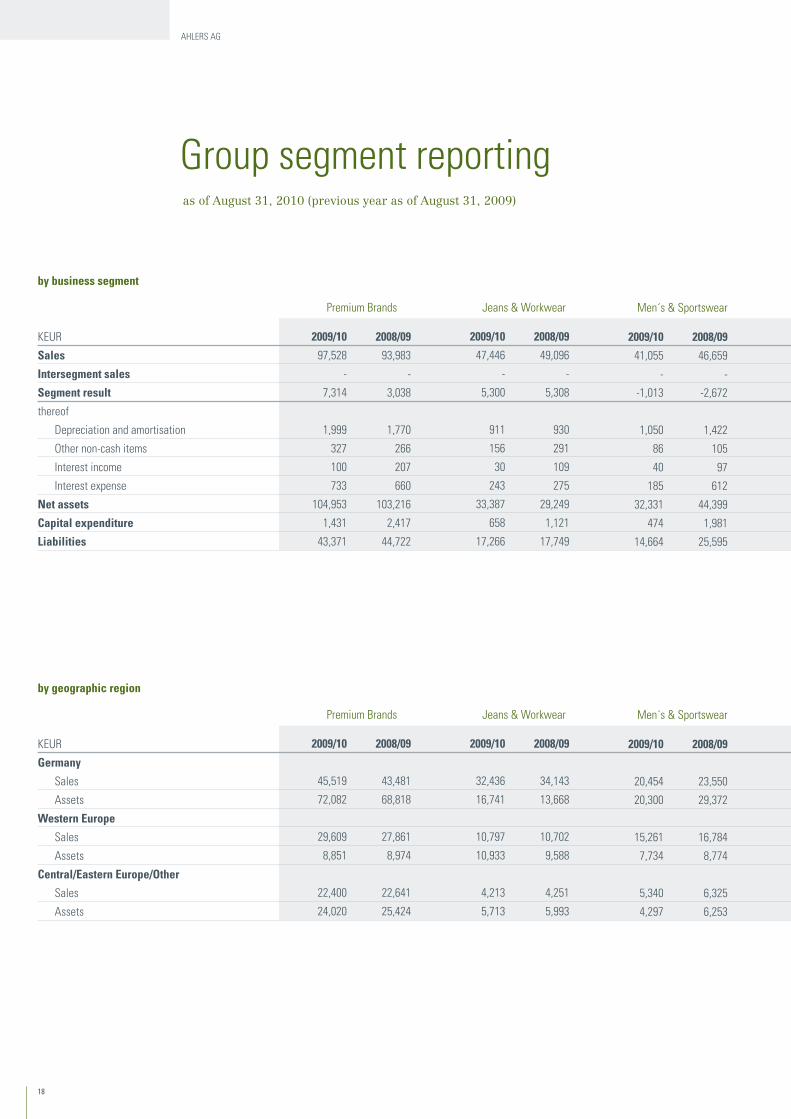
by business segment
KeUR
sales
Intersegment sales
segment result
thereof
Depreciation and amortisation
other non-cash items
Interest income
Interest expense
Net assets
Capital expenditure
liabilities
by geographic region
KeUR
Germany
sales
Assets
Western europe
sales
Assets
Central/eastern europe/other
sales
Assets
premium Brands
premium Brands
Jeans & Workwear
Jeans & Workwear
2009/10
41,055
-
-1,013
1,050
86
40
185
32,331
474
14,664
2009/10
20,454
20,300
15,261
7,734
5,340
4,297
2008/09
46,659
-
-2,672
1,422
105
97
612
44,399
1,981
25,595
2008/09
23,550
29,372
16,784
8,774
6,325
6,253
men´s & sportswear
men´s & sportswear
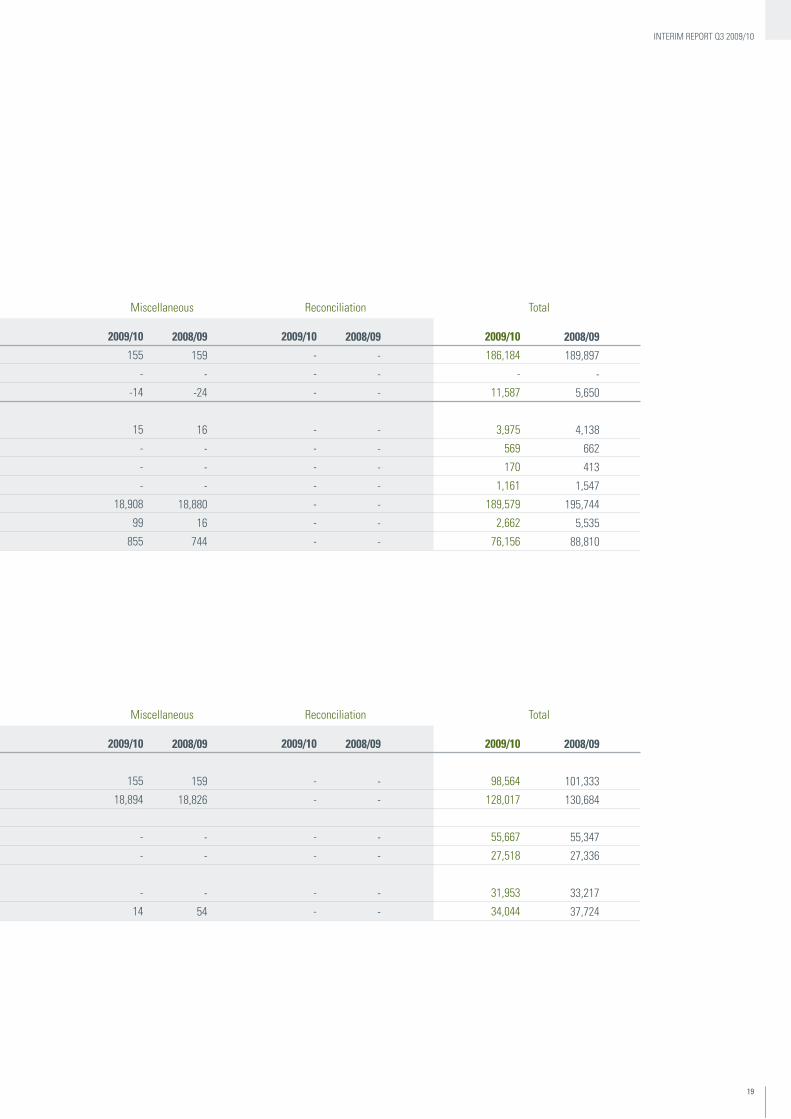
group segment reportingas of August 31, 2010 (previous year as of August 31, 2009)
InteRIm RepoRt Q3 2009/10
1918
2009/10
155
-
-14
15
-
-
-
18,908
99
855
2009/10
-
-
-
-
-
-
-
-
-
-
2009/10
155
18,894
-
-
-
14
2009/10
-
-
-
-
-
-
2009/10
186,184
-
11,587
3,975
569
170
1,161
189,579
2,662
76,156
2009/10
98,564
128,017
55,667
27,518
31,953
34,044
2008/09
159
-
-24
16
-
-
-
18,880
16
744
2008/09
-
-
-
-
-
-
-
-
-
-
2008/09
159
18,826
-
-
-
54
2008/09
-
-
-
-
-
-
2008/09
189,897
-
5,650
4,138
662
413
1,547
195,744
5,535
88,810
2008/09
101,333
130,684
55,347
27,336
33,217
37,724
miscellaneous Reconciliation
miscellaneous Reconciliation
total
total
2120
AhleRs Ag
8. notes to the fInancIal statements
Accounting and valuation principles
The interim financial statements for the first nine months of fiscal 2009/10 have been pre-
pared in accordance with the International Financial Reporting Standards (IFRS) of the In-
ternational Accounting Standards Board (IASB) and the International Financial Reporting
Interpretation Committee‘s interpretations of the IFRS (IFRIC). The interim statements for
the first nine months of fiscal 2009/10 comply in particular with the provisions of IAS 34
-Interim financial reporting.
The accounting and valuation principles and principles of consolidation are consistent with
those applied in the preparation of the consolidated financial statements as of November
30, 2009. A detailed explanation of these principles has been published in the notes to the
consolidated financial statements of the 2008/09 Annual Report.
The changes to the presentation of the financial statements pursuant to IAS 1 “Presentation
of Financial Statements” (2007), which the Ahlers Group is obliged to apply with effect from
the current fiscal year, were implemented with effect from December 1, 2009. Pursuant to
IAS 1.81(b), comprehensive income is shown in two statements, i.e. a separate income state-
ment and a statement of comprehensive income. The first-time application had no effect on
the interim financial statements.
The interim report is prepared in euros and all figures are given in thousands of euros
(KEUR). Due to the fact that the report is prepared in EUR thousands, rounding differences
can arise, since computations of individual items are based on figures in euros.
Own shares
During the first nine months of the current fiscal year, Ahlers AG did not buy back any own
shares. Accordingly, the number of own shares held by Ahlers AG remained unchanged
from November 30, 2009, which means that the Company held 399,686 common shares and
318,794 preferred shares, i.e. a total of 718,480 own shares, as of August 31, 2010. These
represent 5.0 percent (rounded up) of the total share capital.
Earnings per share
Earnings per share are defined as net income (attributable to the shareholders of the Ahlers
AG) divided by the weighted average number of shares outstanding during the reporting
period. No shares existed either as of August 31, 2010, or August 31, 2009, that would have
a diluting effect on earnings per share.
Contingent liabilities
Contingent liabilities have not changed materially since the last balance sheet date on
November 30, 2009.
InteRIm RepoRt Q3 2009/10
2120
Segment reporting
With effect from the beginning of the fiscal year 2009/10, the segment report is prepared
in accordance with IFRS 8 “Operating Segments” (2006), which is now compulsory for the
Ahlers Group. As in the past, the Ahlers Group defines its reporting segments by the type of
products. This primarily reflects the internal reporting system as well as the internal decis-
ion-making processes. Application of this standard did not entail any changes as compared
to the previous year.
The Group’s reporting segments are Premium Brands, Jeans & Workwear and Men’s
& Sportswear. Expenses for central functions are charged to the segments with due conside-
ration to the arm’s length principle and based on actual usage. Due to the different positio-
nings of the segments, no inter-segment revenues are generated. Where a clear allocation of
assets and liabilities is not possible, these are allocated using appropriate distribution ratios.
The segment result is the result before taxes, as income taxes are not segmented due to the
central management. For the same reason, assets and liabilities do not include deferred or
current tax assets and liabilities.
The valuation principles for the segment report are the same as for the consolidated
financial statements.
Herford, October 2010
The Management Board
Forward-looking statements
This report contains forward-looking statements, which are subject to a number of uncer-
tainties that could cause actual results to differ materially from expectations of future deve-
lopments should one or more of these uncertainties, whether specified or not, materialise or
if the assumptions underlying the statements above prove to be incorrect.
2322
AhleRs Ag
dates
october 7, 2010 Interim report Q3 2009/10
october 26, 2010 Analysts’ conference in Frankfurt/main
november 22, 2010 german equity Forum in Frankfurt/main
may 4, 2011 Annual shareholders’ meeting in Düsseldorf
Financial calendar
InteRIm RepoRt Q3 2009/10
2322
If you have any questions regarding
this interim report, please contact:
ahlers agaBteIlung Investor relatIons
elverdIsser str. 313d-32052 herford
phone: +49 52 21/ 979-202fax: +49 52 21/ 712 22
ISIN DE0005009708 und DE0005009732
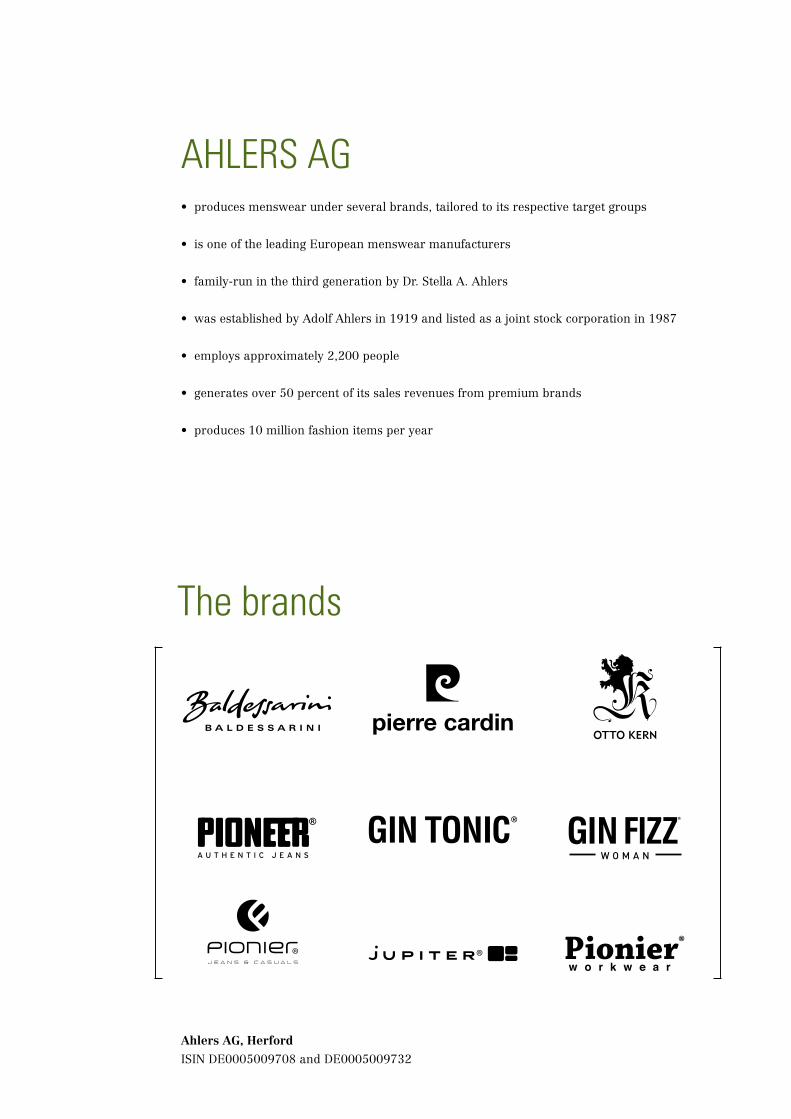
AhleRs Ag• producesmenswearunderseveralbrands,tailoredtoitsrespectivetargetgroups
• isoneoftheleadingEuropeanmenswearmanufacturers
• family-runinthethirdgenerationbyDr.StellaA.Ahlers
• wasestablishedbyAdolfAhlersin1919andlistedasajointstockcorporationin1987
• employsapproximately2,200people
• generatesover50percentofitssalesrevenuesfrompremiumbrands
• produces10millionfashionitemsperyear
the brands
Ahlers AG, Herford
ISIN DE0005009708 and DE0005009732