Embed Size (px)
Citation preview

AHRQ Quality Indicators
Program Update
OECD Health Care Quality Indicators
Expert Group
May 22, 2014
Patrick S. Romano, MD MPH
UC Davis Center for Healthcare Policy and Research
1

1. To produce evidence to improve
health care quality
2. To produce evidence to make
health care safer
3. To produce evidence to increase
access to health care
4. To produce evidence to improve
health care affordability,
efficiency and cost transparency
AHRQ’s New Mission

Voluntary all-payer data partnership (HCUP)
3
RI
AZ
CA
UT
CT
FL
GA
IA
IL
KS
MA
MD
MO
NJ
NY
OR
PA
SC
TN
CO
WA
WI
VA
ME
MN
MI
NC
TX
KY
WV
NE
VT
NV OH
SD
AR
IN
NH
MT
ID
WY
ND
NM OK
LA
MS AL
DE
Partners Providing
Inpatient Data Only
Partners Providing
Inpatient & Ambulatory
Surgery Data
Partners Providing
Inpatient, Ambulatory
Surgery,
& Emergency
Department Data
Non-participating
Partners Providing
Inpatient & Emergency
Department Data
HI

Inpatient Quality
Indicators
Risk-adjusted Mortality
Utilization
Volume
AHRQ Quality Indicators
Prevention QIs
(Area Level)
Avoidable
Hospitalizations /
Other Avoidable
Conditions
Patient Safety
Indicators
Complications,
Unexpected Death
Pediatric Quality
Indicators
Neonatal
QIs
4

Increasing usability of AHRQ QIs
• Hospital-level composite measures (PSI, PDI, IQI
diagnoses, IQI procedures)
• Area-level composite measures (PQI)
• Toolkit to help hospitals use QIs to improve care
► www.ahrq.gov/qual/qitoolkit
• My Own Network by AHRQ (MONAHRQ)
► http://monahrq.ahrq.gov
• National Quality Forum endorsement
• Medicare and Medicaid programs
► http://www.medicare.gov/hospitalcompare/search.html
► Hospital Value-Based Purchasing

MONAHRQ
5. Output a healthcare
reporting website
1. Download MONAHRQ
from MONAHRQ.ahrq.gov
4. Select website and
reporting
customization options
Steps to Using MONAHRQ
2. Load your local
inpatient discharge
data/ED data if
available
3. Load other
measure results

States Using AHRQ QIs
in their Public Reports
HI
AK AK
Key: Public reports include AHRQ QIs
Does not publicly report AHRQ QIs
AZ
CA
UT
CT
FL
GA
IA
IL
KS
MA
MD
MO
NJ
NY
OR
PA
SC
TN
CO
WA
WI
VA
ME
MN
MI
NC
TX
KY WV
RI
NE
VT
NV OH
SD
AR
IN
NH
MT
ID
WY
ND
NM OK
LA
MS AL
DE
AHRQ QIs appear in public reports
in 32 states
8

Construct validity: Case control study of
PSI 12 (Postoperative DVT/PE)
• Cases (up to 20/hosp): ► Unilateral or Bilateral TKA
► Oct 2008 to Mar 2010
► >40 yrs, nonpregnant
► PSI-12 code for VTE within 90 days
• Controls (up to 40/hosp): ► Unilateral or Bilateral TKA
► Oct 2008 to Mar 2010
► >40 yrs, nonpregnant
► NO PSI-12 code for VTE within 90 days
Classified FDA-approved pharmacologic prophylaxis as receipt of the
recommended dose at the recommended starting time (per package
insert) before or after surgery, continued until at least day of discharge
Patients who were diagnosed with VTE on the day of surgery or the day
after surgery were not included in the case control analysis
Risk factors: age, obesity (BMI), type of TKA, race/ethnicity, date of
ambulation, personal or family history of VTE, and comorbid conditions
Adjusted for conditional stratified sampling of controls
Sadeghi et al., J Hosp Med 2013

10
Multivariable analyses of process factors:
where are opportunities for improvement?
Multivariate adjusted odds ratios and 95% confidence intervals
• Outcome: Any VTE event diagnosed Day 2 of surgery or later
• Excluded one hospital that screened TKA patients routinely for VTE
Predictive Factor Odds Ratio (95% CI) P value
Age 1.02 (0.99 – 1.05) 0.20
Gender (ref: male) 1.7 (0.9 – 2.9) 0.90
Ambulation (ref: no ambulation)
Taking steps day 1 or 2
Taking steps after day 2
0.3 (0.1 – 0.9)
0.7 (0.2 – 2.1)
0.005
0.56
Type of TKA (ref: unilateral TKA)
Bilateral TKR
4.2 (1.9 – 9.1)
0.004
Recommended pharmacologic
prophylaxis (ref: only mechanical)
0.5 (0.3 – 0.8) 0.01
BMI ≥ 35 (ref: BMI < 35) 0.9 (0.5 – 1.6) 0.66

AHRQ QI enhancements
• ICD-10-CM/PCS conversion ► Postponed from 1 October 2014 to 1 October 2015
► Testing on dual coded data
► Opportunities for improved performance (“enhanced”)
• Emergency Department Prevention Quality Indicators (some require data linkage)
• Enhanced risk-adjustment
• Ambulatory Surgery or ED Indicators and/or ED-enhanced PSIs? (require data linkage)
• Reconsider exclusions that are no longer necessary with Present on Admission reporting?
11

Number of Codes
2013 Diagnosis Diagnosis Procedure Procedure
Code Set ICD-9-CM ICD-10-CM ICD-9-CM ICD-10-PCS
Approx. Total 13,000 79,502 4,000 71,920
12
0
10000
20000
30000
40000
50000
60000
70000
80000
ICD-9-CM ICD-10-CM ICD-9-CM ICD-10-PCS
Diagnosis
Procedure

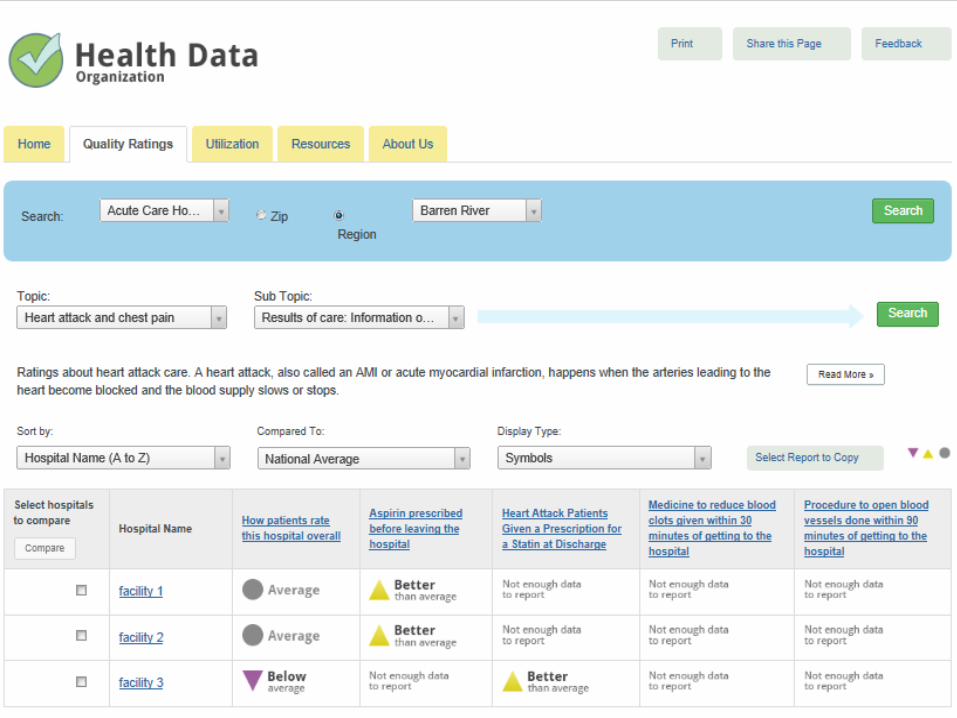
ICD-10-PCS (International Classification of Diseases, 10th Revision, Procedure Coding System)
Inpatient Procedure
13
1 2 3 4 5 6 7
Section
Body
System
Root
Operation
Body
Part
Approach
Device
Qualifier
What’s not here:
Diagnosis for which procedure is performed (e.g., hernia)
Combination or eponymic procedures (e.g., Whipple)

ICD-10-PCS Root Operations
14
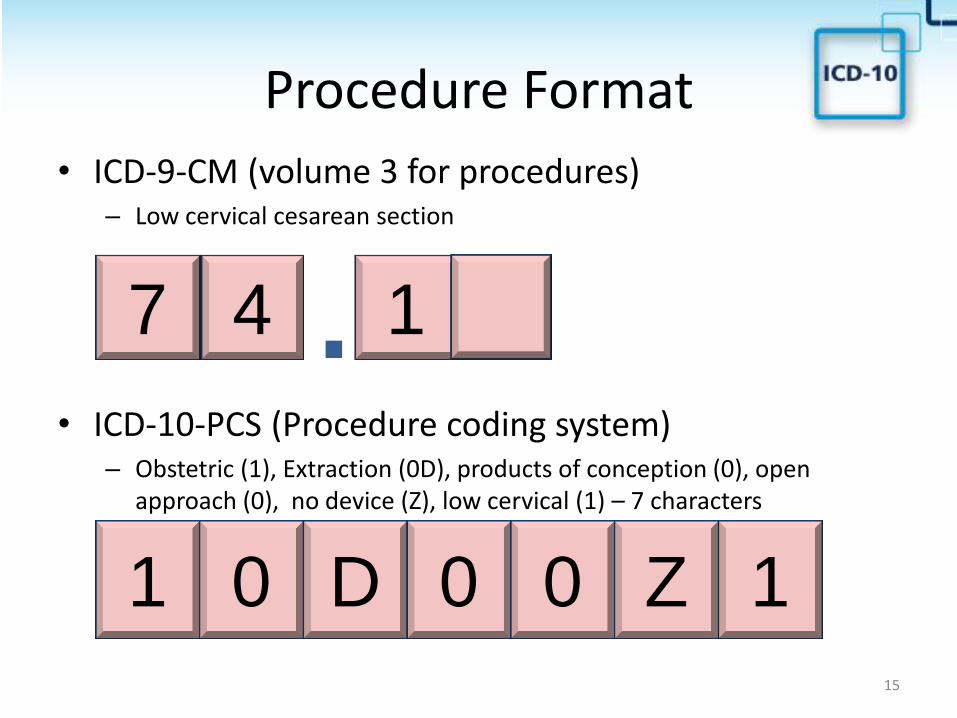
Procedure Format
15
• ICD-9-CM (volume 3 for procedures) – Low cervical cesarean section
• ICD-10-PCS (Procedure coding system) – Obstetric (1), Extraction (0D), products of conception (0), open
approach (0), no device (Z), low cervical (1) – 7 characters
. 7 4 1
1 0 D 1 0 0 Z

Building Blocks of AHRQ QIs
Set names provide the basic foundation or building blocks for 91 Quality Indicators:
• Denominator inclusions
• Denominator exclusions
• Numerator inclusions
• Risk adjustors
Set Names Number of Set Names Number of ICD-9 codes
Diagnosis Set Names 160 7,925
Procedure Set Names 68 1,769
Totals 228 9,694

10 Expert Work Groups Experts Number Cross-cut of U.S.
Physicians 27 6=Pacific, 2=Mountain, 5=Central, 14=East
Nurses 22 0=Pacific, 1=Mountain, 5=Central, 16=East
Coding Professionals 26 4=Pacific, 1=Mountain, 7=Central, 14=East
QI Data Users 9 2=Pacific, 0=Mountain, 0=Central, 6 =East
Cancer, Cardiac, Critical Care/Pulmonary, Infection, Internal Medicine, Neonatal/Pediatric, Neurology, Obstetrics and gynecology, Orthopedics, General and trauma surgery
Clinical and nursing expertise:
Are ICD-9-CM and ICD-10-CM/PCS codes clinical equivalents? Or do any contradict the intent of the set name?
Coding expertise:
Are there coding guidelines that should be considered?
Are there missing codes that were not captured?
Quality measurement expertise:
Are there combinations of codes that warrant changes to the logic of the indicators?

Potential impact on time series analysis
18

Simulation based on dual coded data
19

Emergency Department
Prevention Quality Indicators (In development)
• Collaborative effort to develop and validate community health
indicators using ED administrative data
• ED data are being used as a “window” into social and
community factors that impact health1,2,3
• Why measure community health?
► Identify concerns and target resources
► Identify emerging trends
► Evaluate public health interventions/best practices
• Example Metrics:
► Non-traumatic dental conditions in the emergency department
► Non-psychotic mental health conditions in the emergency department
► ED re-visits for substance abuse
20

Reconsider exclusions
Example: PSI 3, Pressure ulcer
Exclusion Criterion Related to POA
Related to Preventability
Little or No Risk
Related to Face
Validity
Inherent in QI
Definition
Exclusion 1 (Exclude if debridement or pedicle graft is the only major procedure)
X
Exclusion 2 (Exclude if debridement or pedicle graft occurs before or same day as 1st major procedure)
X
Exclusion 3 (Exclude Hemiplegia and Paraplegia and Quadriplegia)
X
Exclusion 4 (Exclude Spina Bifida and Anoxic Brain Damage)
X
Exclusion 5 (Exclude MDC 9) (Principal diagnosis of Skin, Subcutaneous Tissue, and Breast)
X
Exclusion 6 (Exclude MDC 14) (Principal diagnosis of pregnancy, childbirth, and puerperium)
X
Exclusion 7 (Exclude length of stay <5 days)
X X
Exclusion 8 (Exclude Admitted from Acute Care Facility or LTC)
X

Enhanced risk-adjustment
• Socioeconomic characteristics (for some users) ► Insurance status, neighborhood education/income
• ICD-10-CM/PCS enhanced risk factors ► Procedure subtypes, unilateral vs. bilateral
• Population prevalence of chronic disease (for relevant PQI and PDI, e.g., diabetes, HF) ► Bayesian small area estimates based on CDC
telephone survey data (BRFSS)
• Interaction effects ► Age, multiple comorbidities
• Laboratory data from electronic health records

US Hospitals’ Adoption of Electronic Health Record Systems, 2008–2012
DesRoches C M et al. Health Aff 2013;32:1478-1485
©2013 by Project HOPE - The People-to-People Health Foundation, Inc.

For Additional Information…
• www.qualityindicators.ahrq.gov
• http://www.qualityindicators.ahrq.gov/icd10/
• Pamela Owens, PhD
• Patrick S. Romano, MD MPH
24