Embed Size (px)
Citation preview
For permission to copy or republish, contact the American Institute of Aeronautics and Astronautics, 1801 Alexander Bell Drive, Suite 500, Reston, Virginia 20191-4344.
41st Aerospace Sciences Meeting & Exhibit 6-9 January 2003
Reno, Nevada
AIAA-2003-0750
Free-To-Roll Analysis of Abrupt Wing Stall on Military Aircraft at Transonic Speeds D. Bruce Owens Francis J. Capone Robert M. Hall Jay M. Brandon Kevin Cunningham NASA Langley Research Center Hampton, VA Joseph R. Chambers Ball Aerospace Systems Division Fairborn, OH
AIAA-2003-0750
FREE-TO-ROLL ANALYSIS OF ABRUPT WING STALL ON MILITARY AIRCRAFT AT TRANSONIC SPEEDS
D. Bruce Owens*, Francis J. Capone†, Robert M. Hall‡, Jay M. Brandon‡, Kevin Cunningham*
NASA Langley Research Center Hampton, Virginia
Joseph R. Chambers§
Ball Aerospace Systems Division Fairborn, Ohio
Abstract LE leading edge Transonic free-to-roll and static wind tunnel tests
for four military aircraft – the AV-8B, the F/A-18C, the pre-production F/A-18E, and the F-16C – have been analyzed. These tests were conducted in the NASA Langley 16-Foot Transonic Tunnel as a part of the NASA/Navy/Air Force Abrupt Wing Stall Program. The objectives were to evaluate the utility of the free-to-roll test technique as a tool for predicting areas of significant uncommanded lateral motions and for gaining insight into the wing-drop and wing-rock behavior of military aircraft at transonic conditions. The analysis indicated that the free-to-roll results had good agreement with flight data on all four models. A wide range of motions - limit cycle wing rock, occasional and frequent damped wing drop/rock and wing rock divergence - were observed. The analysis shows the effects that the static and dynamic lateral stability can have on the wing drop/rock behavior. In addition, a free-to-roll figure of merit was developed to assist in the interpretation of results and assessment of the severity of the motions.
LERX Leading edge root extension M Mach number n geometric scale factor p roll rate
VPp − free-to-roll figure of merit PID parameter identification q pitch rate q∞ freestream dynamic pressure r yaw rate Re Reynolds Number based on cref S reference surface area t time TE trailing edge TDT Transonic Dynamics Tunnel V∞ freestream velocity α angle of attack β angle of sideslip δht differential horizontal tail deflection φ roll angle φ& roll rate, time derivative of the roll
angle Symbols and Abbreviations φ&& roll acceleration, time derivative of
the roll rate 16-ft TT 16-Foot Transonic Tunnel a speed of sound
ρ∞ freestream density AWS Abrupt Wing Stall θ pitch angle b reference wing span ω oscillatory frequency in radians per
second (ω= 2πf) CL lift coefficient
lC rolling moment coefficient ∞Vpb 2 reduced angular rate cref reference wing chord (mean
geometric chord) ∞Vb 2ω Strouhal number f frequency in cycles per second, Hz
Subscripts FOM figure of merit a airplane FTR free-to-roll m model xI inertia about the roll axis
Derivatives
∂
∂=
∂
∂=
∂
∂=
∂∂
=∂∂
=
∞∞∞ Vb
CC
VpbC
C
Vb
CC
CC
CC
ll
lpl
ll
ll
ll
2
,
2
,
2
, ,
βφ
φβ
βφ
φβ
&& &&
1 American Institute of Aeronautics and Astronautics
*Aerospace Engineer, Senior Member AIAA †Senior Research Engineer ‡Senior Research Engineer, Associate Fellow AIAA §Senior Consultant
This paper is declared a work of the U.S. Government and is not subject to copyright protection in the United States.
AIAA-2003-0750
Introduction Many high-performance military aircraft have
experienced abrupt, uncommanded lateral motion during transonic maneuvers1. One of the most recent aircraft experiences with such problems occurred for the pre-production F/A-18E/F when wing drop was encountered during the flight test program. The problem was eventually mitigated by modifications to the wing automatic leading-edge flap schedule and by the addition of a porous fairing at the wing fold location. Production versions of the aircraft incorporate these fixes and do not exhibit the problem. It was recognized that the fundamental understanding and engineering design methods for the mitigation of wing drop at transonic speeds was severely lacking. To obtain a better understanding of the cause of the uncommanded lateral motions of the F/A-18E/F during transonic wind-up turns and to offer design guidelines for future aircraft, the Abrupt Wing Stall (AWS) Program was developed. The details and results to date of this national program involving the NASA, Navy, Air Force, and Universities are discussed in refs. 1 - 17. This paper discusses the analysis of transonic free-to-roll (FTR) wind-tunnel tests that were conducted as a part of the AWS program.
The FTR test technique has been used by NASA at the Langley Research Center to assess the low-speed, high angle-of-attack characteristics of high-performance aircraft configurations for several decades. These tests have been used to successfully predict and analyze uncommanded rolling motions for generic and scaled models. With the exception of a semi-free-to-roll test conducted by Northrop and NASA Ames for the F-5A18, the use of the FTR test technique in the transonic regime has not been utilized to study uncommanded lateral motions. The “Historical Review of Uncommanded Lateral-Directional Motions at Transonic Conditions” paper1 states that a loss in roll damping was the cause for many of the high performance military aircraft to develop wing rock/drop. Inherently, the FTR test technique assesses the impact of roll damping. In general, the FTR test technique allows rolling motion to develop that is a response to the unsteady, non-linear aerodynamics of the model. As pointed out in ref. 1, the FTR test technique was not readily available for use in transonic stability and control tests.
As a part of the AWS Program, an exploratory transonic FTR test was conducted with a 9% pre-production F/A-18E model in the NASA Langley Transonic Dynamics Tunnel in the fall of 2000. This highly successful pathfinder test proved the utility of the FTR test technique in evaluating the uncommanded lateral motions of the pre-production F/A-18E. Based on the success of this pathfinder study, an operational test apparatus and technique was developed for the
NASA Langley 16-Foot Transonic Tunnel to permit FTR studies for other military aircraft configurations. The tests were designed to evaluate the FTR test technique as a tool during normal transonic stability and control static force tests. Therefore, the FTR rig was designed with the objectives of using existing transonic wind tunnel models and rapid transition from the static test technique to the dynamic test technique with the same model in the same tunnel entry10.
The analysis of the FTR tests will be presented by first discussing the FTR test technique. Next, the scope and approach of the tests will be discussed. Finally, the results and discussion will be presented. The results and discussion section will present the interpretation of the rolling motions, the definition of the FTR FOM, and then individual discussions of the lateral motion (activity) for each aircraft. In order to obtain approval for releasing this paper to the public, quantitative information has been removed from most vertical scales as per guidelines from the Department of Defense.
Free-To-Roll Test Technique The FTR test technique is a single degree-of-
freedom test method in which the model is free to roll about the longitudinal body axis. The overall objective of FTR testing is an early identification of potential uncommanded lateral motion problems (or lack thereof). If the results of static force and moment tests indicate that a potential exists for wing rock/drop, the FTR method can then be used to study the dynamic behavior. Inherently, the FTR technique evaluates unsteady, non-linear aerodynamics. The technique allows for an estimation of the roll damping derivative,
. In addition to estimates of aerodynamic
parameters, if the model and test conditions are appropriately dynamically scaled, estimates of full-scale motions (e.g., amplitudes, frequencies, and accelerations) could be made. Since the FTR tests are designed to be conducted with the same models, and even during the same test entry used for traditional static force and moment measurements, the models do not usually incorporate an active control system to stabilize the motions or duplicate the effects of the stabilization system of the full-scale aircraft.
plC
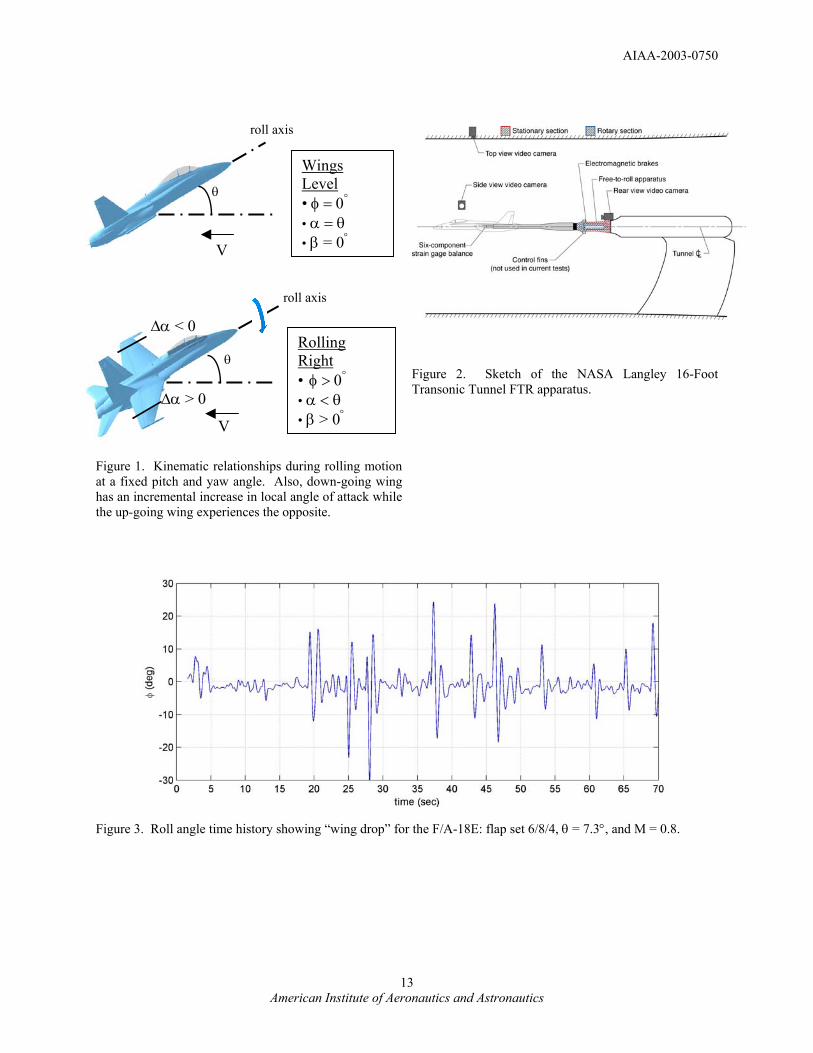
Figure 1 shows kinematic relationships during the rolling motion. For a given pitch angle, θ, as the model rolls from a wings-level condition, the angle of attack, α, decreases and angle of sideslip, β, increases in magnitude. The mathematical representations of the kinematics are given as and ( )θφα tancostan 1−=
( )θφβ sinsinsin 1−=
φ&=p
. Also, note that for the FTR
technique: , 0=q , and As shown in figure 1, the down-going wing experiences an incremental increase in α. At the wing tips, this
.0=r
2 American Institute of Aeronautics and Astronautics
AIAA-2003-0750
increment is equal to ( ∞− Vpb 2tan 1
plC
) . In a similar fashion, the up-going wing experiences an incremental decrease in α. If the model is in wing stall conditions, the rolling motion may result in undesirable dynamic behavior. Specifically, at a value of θ in the stall region, the local sectional lift characteristics of the down-going wing might experience a greater loss in lift than the up-going wing. This lift differential would then propel the motion rather than damp the motion and the model would exhibit a loss in roll damping. In other words, the value of would become positive.
Vb
∞
φ2
&
φ φ&
Governing Equation The equation of motion for the FTR technique can
be represented as:
olllx CCC
qSbI
=−− φφ
φφ
&&
&
The governing equation was cast in terms of the Euler angle φ since this directly models the FTR motion about the longitudinal body axis. This differential equation can be non-linear because the aerodynamic coefficients can be functions of θ , , , , time, Mach number, etc. The foregoing equation is in the form of the classical mass-spring-damper system where: C
represents an aerodynamic forcing function for φ = 0°; represents the spring constant which, along with
the inertia, determines the frequency of oscillation; and represents the damping coefficient. Note that
friction in the system can be accounted for in the damping term. In addition, the use of C and C is
kinematically equivalent.
φ&&
ol
pl
φlC
φ&lC
φ&l
Since the governing equation for the FTR method contains the static derivative instead of C , it is
advantageous to make φ-sweep runs during the static force portion of the test. This allows for a clearer understanding of the static lateral stability that the model experiences while it rolls between some φ-range. The C vs. φ curve will define the steady-state value of
, the non-linearity of the spring, the frequency of
the motion, and nominal range of φ that the model will oscillate within. If hysteresis is present, then φ-sweeps in both directions must be made in order to capture the full non-linearity of the spring.
φlC βl
l
olC
Dynamic Scaling If the roll angle, roll rate and roll accelerations that
the wind tunnel model experiences are to be scaled to flight then certain specific dynamic similitude requirements must be met19. Obviously, for transonic testing, Mach scaling must be used as in conventional
static tests. However, additional similitude requirements exist for FTR testing. “In Mach scaling, ability to satisfy attitude (e.g., α) scaling is dependent on satisfying Froude number similitude.”19 A static test requires model attitude, control deflection, Mach number, and Reynolds number similitude. In addition to these requirements, the FTR test also requires freestream velocity, dynamic pressure, inertia, reduced angular rate, ∞Vpb 2 , and Strouhal number, ∞Vb 2ω (if the motion of the model is oscillatory) similitude. The ability to Froude scale and Mach scale simultaneously is practically impossible in wind tunnel testing. Details of these similitude requirements are given in ref. 19. An example of the impact of these requirements is given in ref. 20. Dynamic scaling issues for the specific models tested will be addressed in a following section.
Roll Damping Derivative Estimation Method The character of the roll damping derivative, C ,
is instructive for understanding and mathematically representing the wing rock motions. Estimations of
from the FTR tests can be made using PID
methods. The method used in the current analysis utilized linear regression. The software used for computing is a package of MATLAB
pl
plC
plC
plC
αsin
® scripts
developed at NASA Langley called SIDPAC21. The FTR motions are modeled in this approach using the governing equation given above assuming constant coefficients over a specified range of φ. Also, note that the actual parameter that is being computed is
. β&lC+
Test Approach and Scope of Tests Airplane configurations were chosen to evaluate
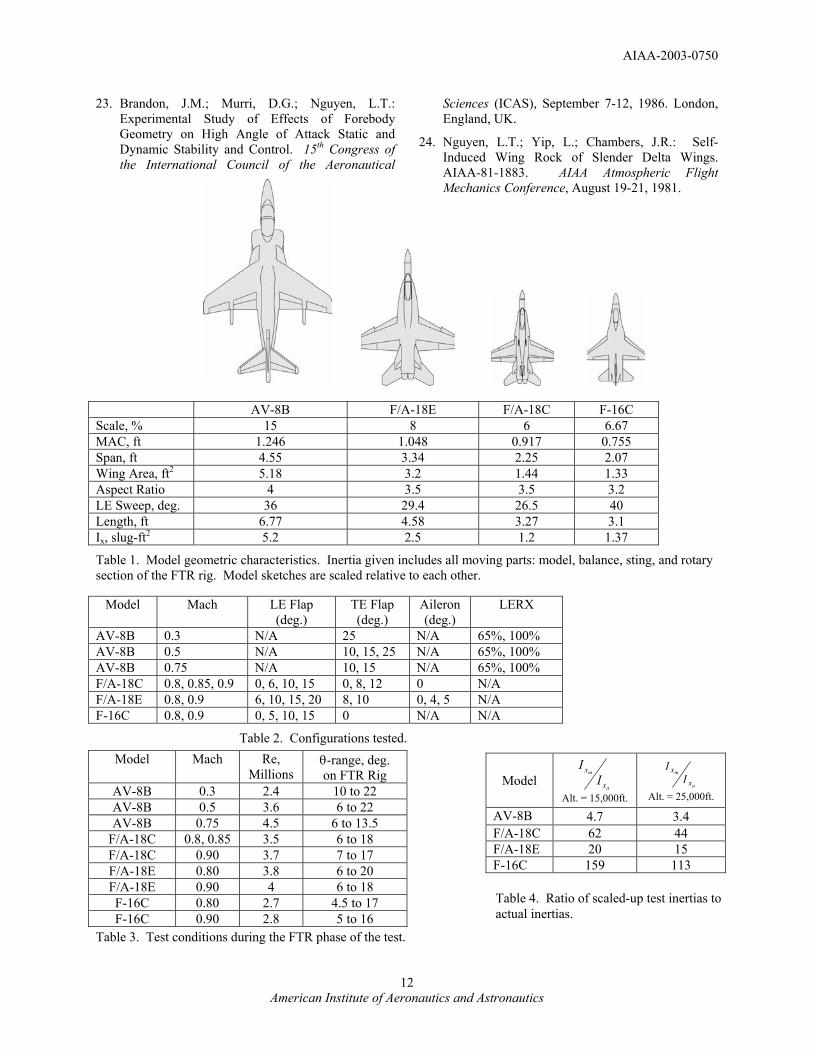
the FTR test technique in identification of dynamic lateral characteristics compared to flight results. Two configurations (pre-production F/A-18E and AV-8B) are known to have wing drop/rock characteristics over some of the flight envelope. Two others (F-16C and F/A-18C) do not exhibit such behavior in flight. This selection of flight vehicles allowed for evaluation of the FTR test technique to be used to discriminate between configurations with desirable and undesirable flight characteristics. Details of the models, test conditions, and FTR rig are given in a companion paper (ref. 10). A short synopsis will be given here for convenience. The models were tested on a FTR rig in the NASA Langley 16-ft TT. The geometric characteristics of the models are given in table 1. The sketches of the models are to the same scale in order to convey the relative model sizes used in the test. Note that the pre-production F/A-18E model did not contain the porous wing fold fairing. The flap configurations tested,
3 American Institute of Aeronautics and Astronautics
AIAA-2003-0750
corresponding to those used in representative flight maneuvers, are given in table 2. In the figures and discussion the flap sets for the F/A-18C and pre-production F/A-18E are abbreviated with the notation: LE Flap/TE Flap/Aileron. The abbreviation for the F-16C is LE Flap/TE Flap. θ is used as the independent variable in the FTR tests because when the model rolls θ remains constant while α varies. The Mach numbers, Reynolds numbers, and θ-ranges that were used are given in table 3. Note from this table that the AV-8B was also tested at subsonic Mach numbers.
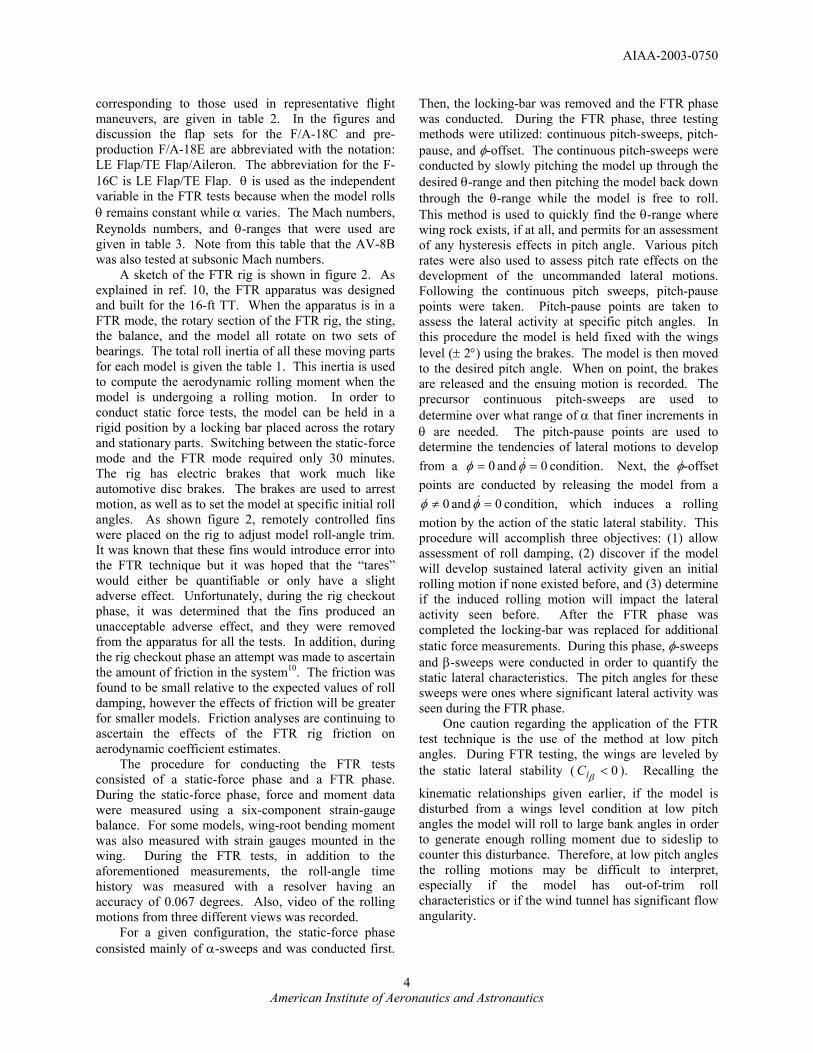
A sketch of the FTR rig is shown in figure 2. As explained in ref. 10, the FTR apparatus was designed and built for the 16-ft TT. When the apparatus is in a FTR mode, the rotary section of the FTR rig, the sting, the balance, and the model all rotate on two sets of bearings. The total roll inertia of all these moving parts for each model is given the table 1. This inertia is used to compute the aerodynamic rolling moment when the model is undergoing a rolling motion. In order to conduct static force tests, the model can be held in a rigid position by a locking bar placed across the rotary and stationary parts. Switching between the static-force mode and the FTR mode required only 30 minutes. The rig has electric brakes that work much like automotive disc brakes. The brakes are used to arrest motion, as well as to set the model at specific initial roll angles. As shown figure 2, remotely controlled fins were placed on the rig to adjust model roll-angle trim. It was known that these fins would introduce error into the FTR technique but it was hoped that the “tares” would either be quantifiable or only have a slight adverse effect. Unfortunately, during the rig checkout phase, it was determined that the fins produced an unacceptable adverse effect, and they were removed from the apparatus for all the tests. In addition, during the rig checkout phase an attempt was made to ascertain the amount of friction in the system10. The friction was found to be small relative to the expected values of roll damping, however the effects of friction will be greater for smaller models. Friction analyses are continuing to ascertain the effects of the FTR rig friction on aerodynamic coefficient estimates.
The procedure for conducting the FTR tests consisted of a static-force phase and a FTR phase. During the static-force phase, force and moment data were measured using a six-component strain-gauge balance. For some models, wing-root bending moment was also measured with strain gauges mounted in the wing. During the FTR tests, in addition to the aforementioned measurements, the roll-angle time history was measured with a resolver having an accuracy of 0.067 degrees. Also, video of the rolling motions from three different views was recorded.
For a given configuration, the static-force phase consisted mainly of α-sweeps and was conducted first.
Then, the locking-bar was removed and the FTR phase was conducted. During the FTR phase, three testing methods were utilized: continuous pitch-sweeps, pitch-pause, and φ-offset. The continuous pitch-sweeps were conducted by slowly pitching the model up through the desired θ-range and then pitching the model back down through the θ-range while the model is free to roll. This method is used to quickly find the θ-range where wing rock exists, if at all, and permits for an assessment of any hysteresis effects in pitch angle. Various pitch rates were also used to assess pitch rate effects on the development of the uncommanded lateral motions. Following the continuous pitch sweeps, pitch-pause points were taken. Pitch-pause points are taken to assess the lateral activity at specific pitch angles. In this procedure the model is held fixed with the wings level (± 2°) using the brakes. The model is then moved to the desired pitch angle. When on point, the brakes are released and the ensuing motion is recorded. The precursor continuous pitch-sweeps are used to determine over what range of α that finer increments in θ are needed. The pitch-pause points are used to determine the tendencies of lateral motions to develop from a condition. Next, the φ-offset points are conducted by releasing the model from a
condition, which induces a rolling motion by the action of the static lateral stability. This procedure will accomplish three objectives: (1) allow assessment of roll damping, (2) discover if the model will develop sustained lateral activity given an initial rolling motion if none existed before, and (3) determine if the induced rolling motion will impact the lateral activity seen before. After the FTR phase was completed the locking-bar was replaced for additional static force measurements. During this phase, φ-sweeps and β-sweeps were conducted in order to quantify the static lateral characteristics. The pitch angles for these sweeps were ones where significant lateral activity was seen during the FTR phase.
0 and 0 == φφ &
0 =φ&and 0≠φ
One caution regarding the application of the FTR test technique is the use of the method at low pitch angles. During FTR testing, the wings are leveled by the static lateral stability ( C ). Recalling the
kinematic relationships given earlier, if the model is disturbed from a wings level condition at low pitch angles the model will roll to large bank angles in order to generate enough rolling moment due to sideslip to counter this disturbance. Therefore, at low pitch angles the rolling motions may be difficult to interpret, especially if the model has out-of-trim roll characteristics or if the wind tunnel has significant flow angularity.
0<βl
4 American Institute of Aeronautics and Astronautics
AIAA-2003-0750
Results and Discussion
Interpretation of Results During the FTR tests, a wide variety of rolling
motions were observed. Based on a review of the static-force data, time history traces of the roll angle, and estimations of C , the following discussion
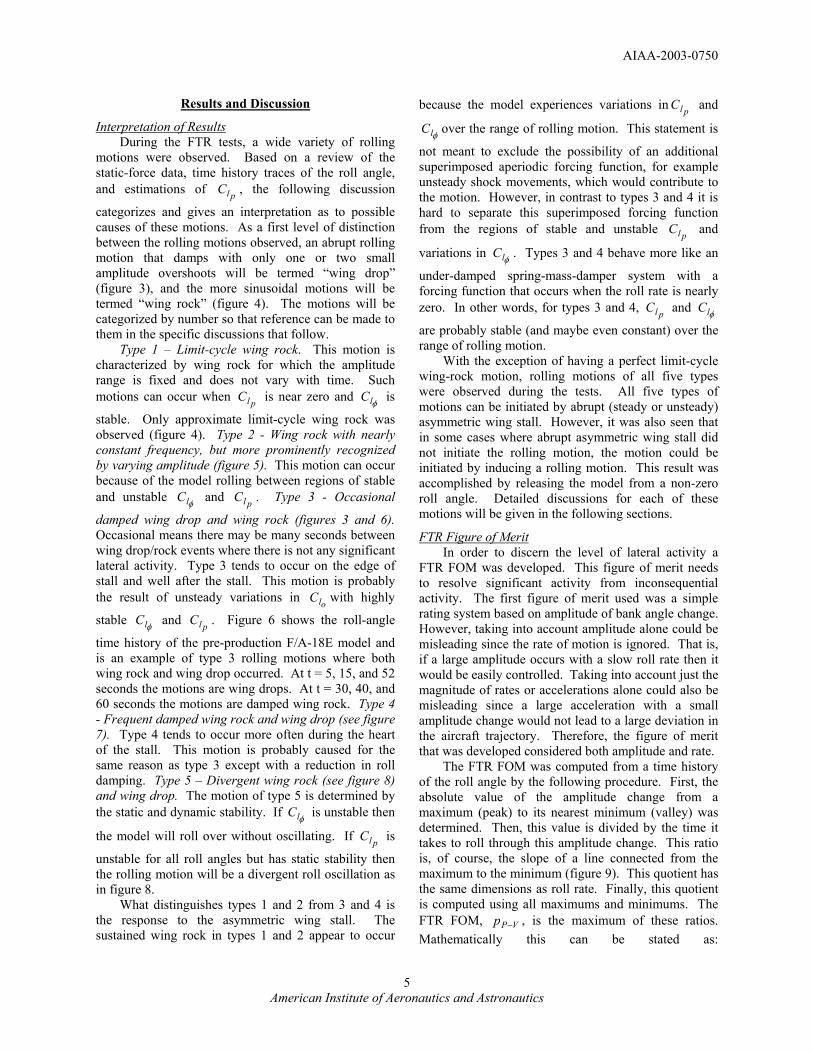
categorizes and gives an interpretation as to possible causes of these motions. As a first level of distinction between the rolling motions observed, an abrupt rolling motion that damps with only one or two small amplitude overshoots will be termed “wing drop” (figure 3), and the more sinusoidal motions will be termed “wing rock” (figure 4). The motions will be categorized by number so that reference can be made to them in the specific discussions that follow.
pl
Type 1 – Limit-cycle wing rock. This motion is characterized by wing rock for which the amplitude range is fixed and does not vary with time. Such motions can occur when C is near zero and is
stable. Only approximate limit-cycle wing rock was observed (figure 4). Type 2 - Wing rock with nearly constant frequency, but more prominently recognized by varying amplitude (figure 5). This motion can occur because of the model rolling between regions of stable and unstable C and C . Type 3 - Occasional
damped wing drop and wing rock (figures 3 and 6). Occasional means there may be many seconds between wing drop/rock events where there is not any significant lateral activity. Type 3 tends to occur on the edge of stall and well after the stall. This motion is probably the result of unsteady variations in C with highly
stable and C . Figure 6 shows the roll-angle
time history of the pre-production F/A-18E model and is an example of type 3 rolling motions where both wing rock and wing drop occurred. At t = 5, 15, and 52 seconds the motions are wing drops. At t = 30, 40, and 60 seconds the motions are damped wing rock. Type 4 - Frequent damped wing rock and wing drop (see figure 7). Type 4 tends to occur more often during the heart of the stall. This motion is probably caused for the same reason as type 3 except with a reduction in roll damping. Type 5 – Divergent wing rock (see figure 8) and wing drop. The motion of type 5 is determined by the static and dynamic stability. If is unstable then
the model will roll over without oscillating. If is
unstable for all roll angles but has static stability then the rolling motion will be a divergent roll oscillation as in figure 8.
pl
pl
φlC
plC
φl
ol
φlC pl
φlC
What distinguishes types 1 and 2 from 3 and 4 is the response to the asymmetric wing stall. The sustained wing rock in types 1 and 2 appear to occur
because the model experiences variations in and
over the range of rolling motion. This statement is
not meant to exclude the possibility of an additional superimposed aperiodic forcing function, for example unsteady shock movements, which would contribute to the motion. However, in contrast to types 3 and 4 it is hard to separate this superimposed forcing function from the regions of stable and unstable C and
variations in . Types 3 and 4 behave more like an
under-damped spring-mass-damper system with a forcing function that occurs when the roll rate is nearly zero. In other words, for types 3 and 4, and C
are probably stable (and maybe even constant) over the range of rolling motion.
plC
pl
φlC
φlC
plC φl
With the exception of having a perfect limit-cycle wing-rock motion, rolling motions of all five types were observed during the tests. All five types of motions can be initiated by abrupt (steady or unsteady) asymmetric wing stall. However, it was also seen that in some cases where abrupt asymmetric wing stall did not initiate the rolling motion, the motion could be initiated by inducing a rolling motion. This result was accomplished by releasing the model from a non-zero roll angle. Detailed discussions for each of these motions will be given in the following sections.
FTR Figure of Merit In order to discern the level of lateral activity a
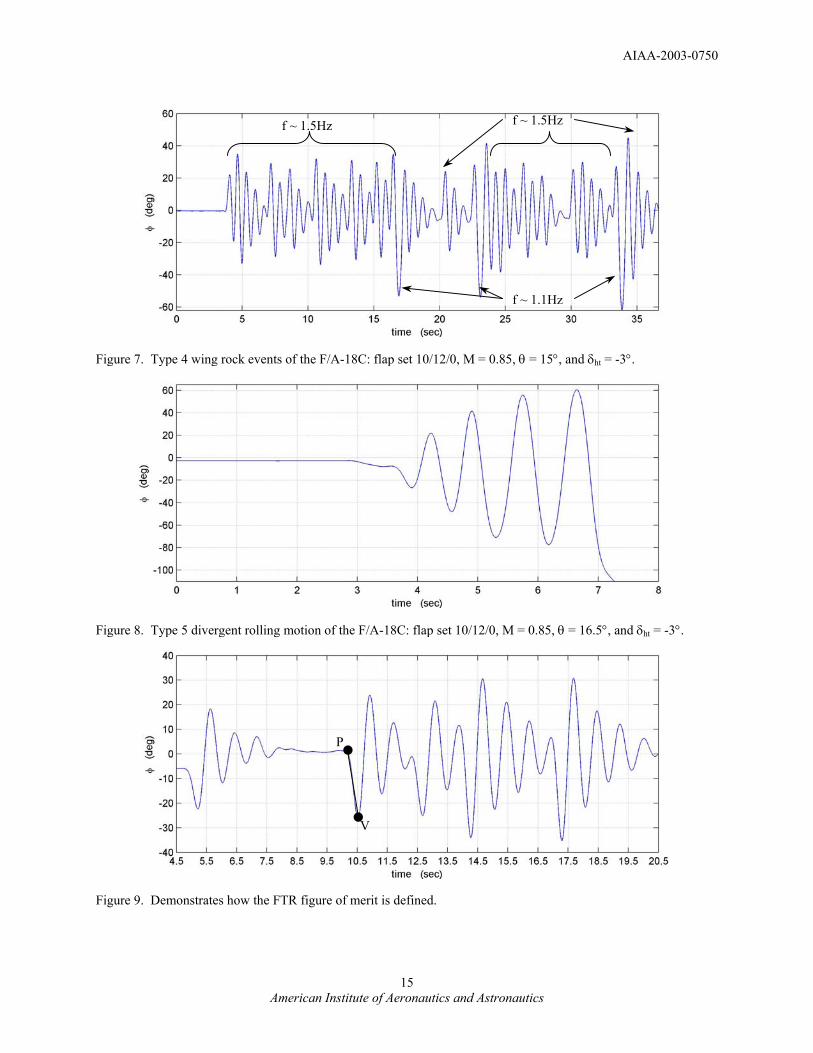
FTR FOM was developed. This figure of merit needs to resolve significant activity from inconsequential activity. The first figure of merit used was a simple rating system based on amplitude of bank angle change. However, taking into account amplitude alone could be misleading since the rate of motion is ignored. That is, if a large amplitude occurs with a slow roll rate then it would be easily controlled. Taking into account just the magnitude of rates or accelerations alone could also be misleading since a large acceleration with a small amplitude change would not lead to a large deviation in the aircraft trajectory. Therefore, the figure of merit that was developed considered both amplitude and rate.
The FTR FOM was computed from a time history of the roll angle by the following procedure. First, the absolute value of the amplitude change from a maximum (peak) to its nearest minimum (valley) was determined. Then, this value is divided by the time it takes to roll through this amplitude change. This ratio is, of course, the slope of a line connected from the maximum to the minimum (figure 9). This quotient has the same dimensions as roll rate. Finally, this quotient is computed using all maximums and minimums. The FTR FOM, , is the maximum of these ratios. Mathematically this can be stated as:
VPp −
5 American Institute of Aeronautics and Astronautics
AIAA-2003-0750
Dynamic pressure must also be scaled properly. For Froude scaling, dynamic pressure is scaled by ( )n
am ρρ . For Mach scaling, it is scaled by
( ) 2)( amam aaρρ . Fortunately, at transonic Mach numbers in the 16-ft TT the density altitude is about 15,000 ft. Therefore at a flight altitude of 15,000 ft., dynamic pressure scaling is closely matched for Froude scaling and off by approximately 20% for Mach scaling.
max
∆∆
≡− tp VP
φ . A FOM that uses the acceleration
(i.e., the rolling moment) is also being investigated and may replace the present FOM.
The level of lateral activity for each of the models will mainly be shown using this FTR FOM. All FTR FOM shown in the paper are computed from pitch-pause FTR points. The range on the vertical scale of the FTR FOM plots are identical for plots of a given airplane. The same range was not used for all the models because there was no expectation that the level of lateral activity should be the same for all airplanes given their different sizes and inertias. The FTR FOM plots present the amount of lateral activity as the dependent variable and the pitch angle as the independent variable. The parameters in the plot are the flap sets that correspond to those used in representative flight maneuvers (e.g. wind-up turn). Therefore, a relative measure of the lateral activity predicted by the FTR test technique that the aircraft would experience in flight is shown by plotting a symbol on the curve at the α where the aircraft flap schedule most closely matches the flap setting tested in the wind tunnel.
Achieving inertia similitude is the same for Mach and Froude scaling and is given by:
axa
m
a
mmx I
bb
I5
=
ρρ
. Of course, since the model is
only free to roll about the longitudinal axis then only the inertia scaling about this axis is required. This equation shows that the inertia is scaled by the fifth power of the geometric scale factor. In order to give an indication of how close this requirement was met, the model’s roll inertia was scaled-up to full-scale aircraft values at altitudes of 15,000 ft and 25,000 ft. Table 4 shows the ratio of the scaled inertia to the real airplane’s inertia (for a nominal loading). The table shows that the AV-8B, the model with the greatest roll inertia, scaled more closely because of the larger span. The F-16C was furthest from proper dynamic scaling. Although the F/A-18C and the F-16C are close in model inertia and span, the full-scale roll inertia for the F-16C is much less than the F/A-18C. The general effect of the higher inertia on the rolling motion is to act like a low-pass filter on the accelerations. For example, if the aerodynamic forcing function is broadband in nature5 then the model’s inertia might not allow it to react to the higher frequency content of the forcing function.
The FTR test technique is a single-degree-of-freedom method where the model is constrained to roll about the longitudinal body axis. In addition, it does not incorporate an active control system. Therefore, these considerations must be recognized when comparing the lateral activity observed on the FTR apparatus to those experienced by full-scale aircraft. In addition, similitude effects must be taken into account if the models are not dynamically scaled.
Effect of Dynamic Scaling As mentioned in the Dynamic Scaling section,
Froude and Mach scaling are both important in transonic FTR tests. Froude scaling assures that the model attitudes are correct. In other words, the wing sectional angle-of-attack is correct. The reduced angular velocity, Strouhal number, and freestream scaling requirements depend heavily on the geometric scale factor. The 16-ft TT is an atmospheric tunnel so the ratio of tunnel-to-flight freestream velocity is on the order of 1.1 for a flight altitude of 25,000 ft. Unfortunately, the reduced angular velocity and Strouhal number are much lower than required to match flight. The effect is that the change in local wing sectional angle-of-attack due to roll rate will not be as large as it should. Therefore, if the wing rock motions occur in a highly non-linear flow region the model will not experience as large a deviation in wing flow-field structure as the full-scale aircraft. This, in turn, could impact the amount of roll damping.
The importance of the dynamic scaling is determined by the non-linear dependence in the
, , and C terms on olC φlCφ&l φ , , , time, hysteresis,
etc. If the aerodynamics vary nonlinearly then a general assessment of the impact of improper dynamic scaling is not possible.
φ& φ&&
Hysteresis It is not uncommon for aerodynamic hysteresis to
be present especially in the stall region. Hysteresis was present in the static rolling moment vs. φ data. The hysteresis in this static data was measured using pitch-pause points where the model was sweep from φ = -90° to 90° then back to φ = -90° for a specified θ. In addition, hysteresis was observed during the FTR test phase when the model was continuously pitched up then back down. All of the FTR pitch-pause points were conducted with θ increasing. Detailed analysis of the hysteresis effect is not complete but the possibility
6 American Institute of Aeronautics and Astronautics
AIAA-2003-0750
of its affect on the rolling motions should be considered.
Results for the Four Aircraft
AV-8B The measured lateral activity of the AV-8B will be
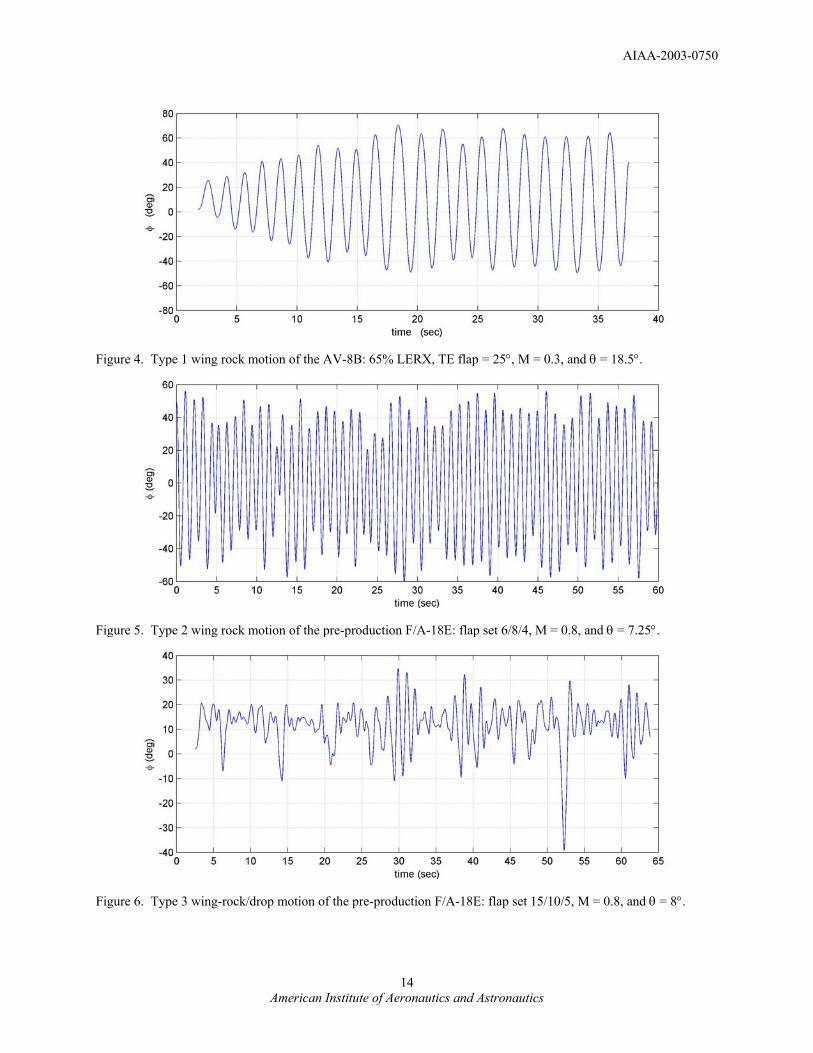
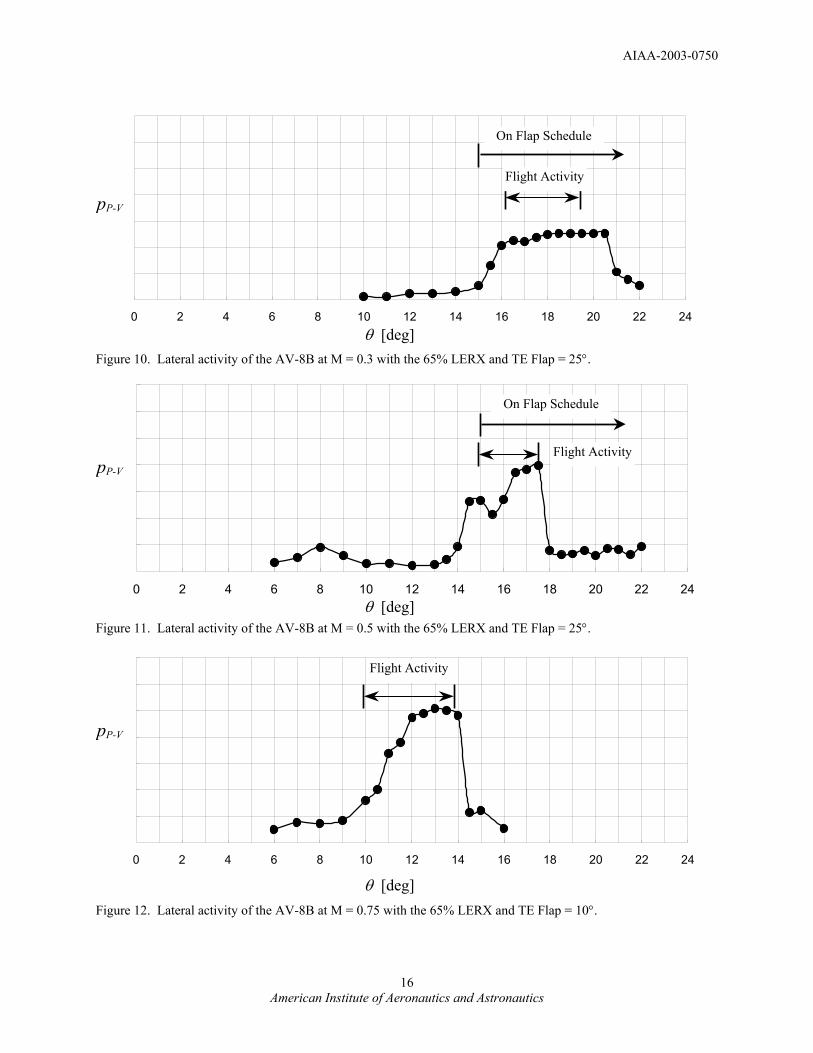
presented mainly using the FTR FOM. The FTR FOM for the AV-8B with the 65% LERX at M = 0.3 is shown in figure 10. The TE flap deflection is 25° which the aircraft control system schedules for angles of attack above 15°. The rise in lateral activity occurs just after θ = 15° reaching a plateau around 16°. Type 1 wing rock motions occurred in the range of θ from 16° to 19°. Figure 4 shows an example of the wing rock motion observed in this θ-range. The figure shows that rolling motions increase in amplitude, finally reaching an approximate limit-cycle oscillation. The wing rock has a frequency of 0.6 Hz with approximately φ = ± 50° amplitude about a φ = 10° offset. In flight, lateral activity was observed in approximately the same α-range at Mach numbers close to 0.25. The model exhibited wing rock divergence (type 5) in the range 19.5° < θ < 20.5°.
Figure 11 shows the lateral activity for the AV-8B at M = 0.5 with the 65% LERX and TE flap = 25°. This flap setting is on schedule for the α-range above 15°. The plot shows the onset of lateral activity at θ = 14.5° but peaks with a larger magnitude between θ = 16.5° and 17.5°. This is in good agreement with the α-range observed in flight which occurred between α = 15° and 18°. For the θ = 14.5° to 16° range, the lateral activity were of the type 4 motions. In the θ = 16.0° to 17.5° range the events were of the type 1 and 2 wing rock. The roll damping derivative, , was
estimated using the PID method in the θ = 16.0° to 17.5° range and found to be neutrally stable. This is in agreement with C estimates reported in ref. 22 that
were computed using flight data at M = 0.6.
plC
pl
The FTR FOM plot in figure 12 shows that at M = 0.75 for the AV-8B with the 65% LERX, TE flap = 10° configuration that again the θ-range of lateral activity on the FTR rig and flight has good agreement. Note that the actual TE flap schedule for the α-range above 8.5° is about 12.5°. The lateral activity observed in the FTR tests in the θ = 10.5° to 11.5° range was the type 4 wing rock. The wing rock in the θ = 12° to 14° range was the type 2 motion.
By comparing the three FTR FOM plots it is observed that the FOM rating increases significantly with Mach number. The rating at M = 0.5 is 50% higher than that at M = 0.3. The rating at M = 0.75 is 20% higher than at M = 0.5 and 100% higher than at M = 0.3. This rise in the rating is probably caused by the
dynamic pressure increase from M = 0.3 to M = 0.75. This result points out the need for the FTR FOM to account for q∞. As mentioned in the FTR Figure of Merit section, the present FTR FOM is still under development.
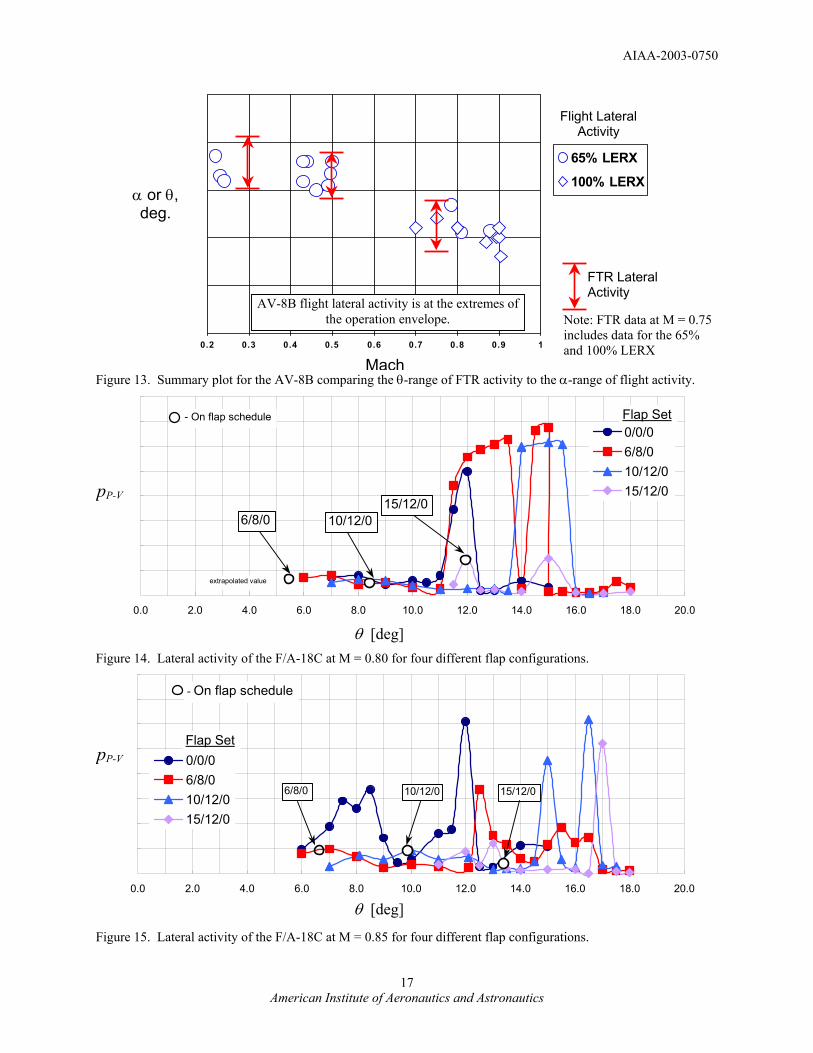
Figure 13 shows a summary comparison of the FTR lateral activity compared to flight lateral activity. The FTR FOM was not presented for the 100% LERX configuration but the results as compared to flight are also shown in this figure. The comparison is only of the θ-range and Mach range of unacceptable lateral activity, not the type of lateral activity. The θ-range of wing rock events that were captured by the FTR test technique show good agreement with flight data at all three Mach numbers – 0.3, 0.5, and 0.75.
F/A-18C The F/A-18C model did not experience any
significant lateral activity on flap schedule but did exhibit wing rock/drop events significantly off flap schedule. The following summarizes the lateral activity observed using the FTR FOM. Two detailed analyses are given. Note that during the FTR phase of the test that the horizontal tails were deflected differentially to trim out an inherent rolling moment offset. During the initial static force phase the tails were not deflected. During the FTR phase static force runs were made with the tails deflected. The static data with the tails in both positions are utilized in the following discussions.
Figure 14 shows the FTR FOM plot for the F/A-18C at M = 0.80 for the four flap sets tested. In agreement with flight, no significant lateral activity occurred on flap schedule. There is a rise in activity where the aircraft is on schedule at θ = 12° but this is considered very mild. The data show significant lateral activity off flap schedule. The lateral activity observed for the 0/0/0 flap configuration at θ = 11.5° and 12° was of the type 2 wing rock motion. The 6/8/0 flap configuration showed type 2 wing rock motion for the θ = 11.5° to 13.5° range. At θ = 14.5° and 15° the model actually diverged in roll. The lack of lateral activity at θ = 14° when there is such severe activity within a degree underscores the sensitivity to θ. The 10/12/0 flap configuration exhibited type 2 wing rock in the θ = 14° area but actually diverged at θ = 15° and 15.5°. In general, the 15/12/0 set did not show any significant lateral activity over the θ-range. The rolling motion that was observed at θ = 12° and 15° could be classified as low activity type 3 wing rock.
Figure 15 shows the FTR FOM results for M = 0.85 with the four flap configurations tested. In agreement with flight, the F/A-18C model did not experience lateral activity on flap schedule. As at M = 0.80, there was lateral activity when significantly off flap schedule. The 0/0/0 flap configuration showed
7 American Institute of Aeronautics and Astronautics
AIAA-2003-0750
type 2 wing rock events in the θ = 7.5° to 8.5° range. At θ = 12°, the F/A-18C experienced type 2 wing rock events with mild type 3 just prior to this θ. The 6/8/0 flap set only experienced significant type 4 wing rock activity at θ = 12.5°. There was only very mild type 3 wing rock at θ = 13°. The 10/12/0 flap configuration exhibited type 4 wing rock at θ = 15°. At θ = 16.5° the model experienced roll divergence (type 5). A detailed analysis of the two points at θ = 15° and 16.5° will follow. The only significant activity for the 15/12/0 flap configuration was a divergent wing rock (type 5) at θ = 17°. There was very mild type 3 wing rock at θ = 13°.
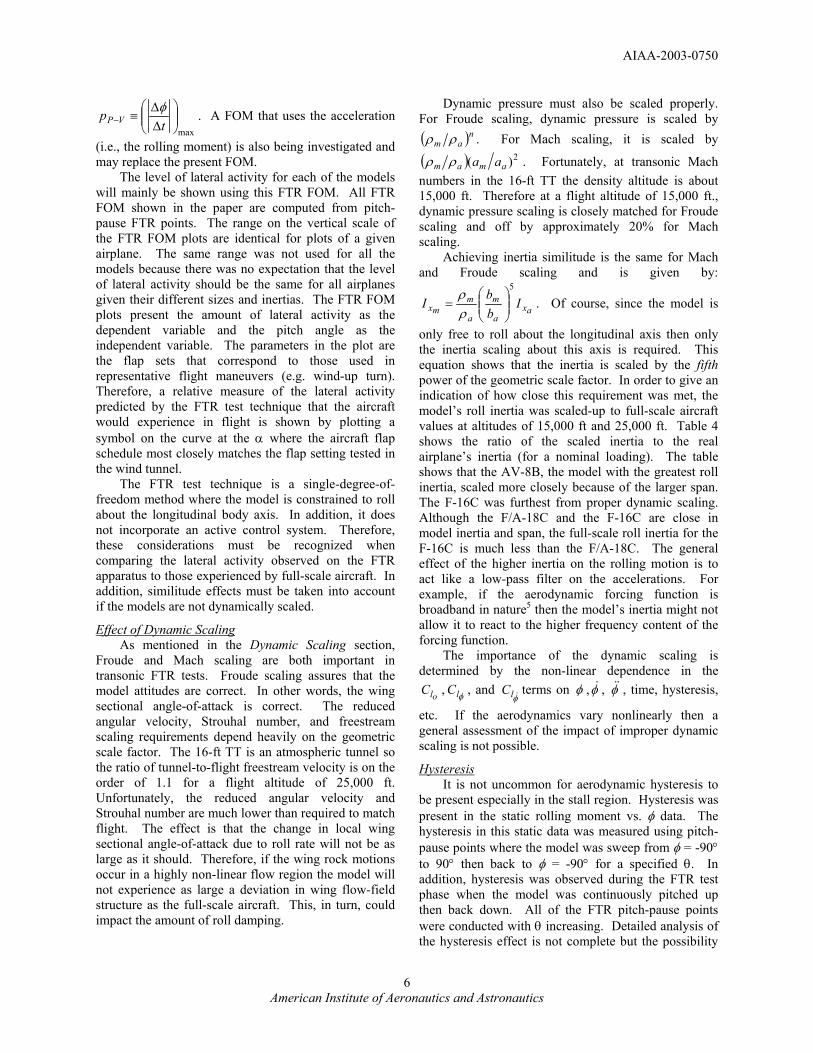
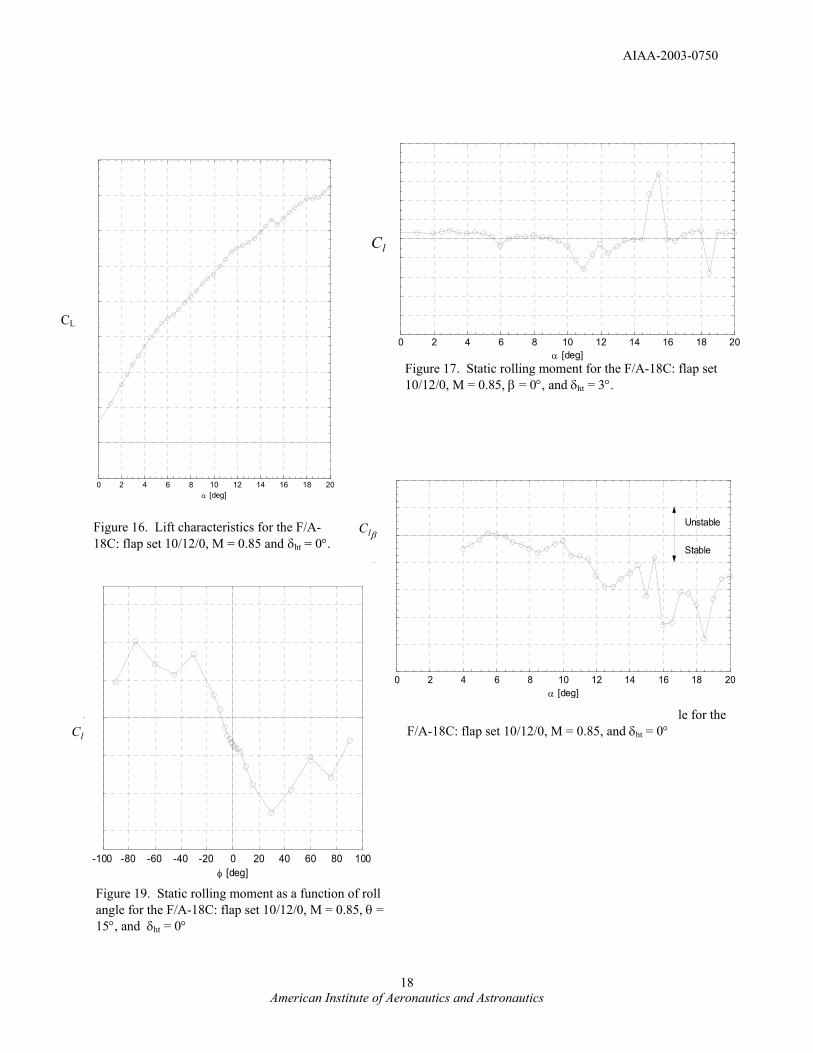
The wing rock behavior for the 10/12/0 flap configuration at M = 0.85 and θ = 15° is shown as a time history plot of the roll angle in figure 7. The model is released from a wings level condition at approximately 4 seconds. Immediately the model experiences a wing rock event probably caused by the asymmetric stall of the wings. The ensuing lateral activity is the frequent damped wing rock (type 4). The static lift, rolling moment, and lateral stability curves as a function of α are shown in figures 16, 17, and 18, respectively. The static lateral stability curve was computed using α-sweeps at β = ±2° and with no differential deflection in the horizontal tails. Looking at the α = 15° point on these curves, the wing rock event occurred where there is a negative break in the lift curve, a positive spike in the rolling moment curve and rapid increase in static lateral stability. These are all classical indications that lateral activity could occur in the α-region. Lamar9 gives detailed analysis of static FOMs for predicting lateral activity for all four aircraft. In addition, Capone10 compares the static FOMs against the FTR FOM. Estimations of C by the PID method
shows that it is nearly constant with a value of -0.3 over the φ = ±30° range.
pl
The model reacts to the abrupt asymmetric wing stall by a damped wing rock motion of near constant frequency (~1.5Hz). The wing rock damps out in about 3 to 4 oscillations. As the motion comes to a stop the wings abruptly and asymmetrically stall again and the motion repeats itself. The first oscillation of most of the wing rock events occurs over a ±30°-amplitude range. When the model stays within this amplitude range the oscillation frequency is nearly constant at 1.5Hz. However, when the abrupt asymmetric wing stall is severe enough to cause the oscillation to exceed this amplitude there is a significant change in frequency of this oscillation (~1.1Hz).
Insight into the understanding for this frequency change and the ±30° amplitude range can be gained by observing the static rolling moment values over this range of φ. Figure 19 shows the static rolling moment
as a function of φ for θ = 15° and the horizontal tails undeflected. As a side note, the in this curve is of the opposite direction than in figure 17. A number of repeat α-sweeps (β = 0°) were made for this configuration. Around α = 15° the rolling moment spiked both with positive and negative values of almost equal magnitude. This indicates the unsteadiness in the flow field and points out the importance of repeat runs to the complete understanding of the wing rock motions. Figure 19 shows a relatively linear slope
in the φ = ±30° range. Beyond φ = ±30°, is
reduced. Recall that acts as a spring constant and,
therefore, affects the frequency. When the abrupt asymmetric wing stall causes the model to roll into the non-linear spring range then the resulting motion will change frequencies. As can be seen in the roll angle time history plot the frequency decreases when the model oscillates past φ = ±30°. Note that the model rolling motion will be an integrated effect of having a non-linear spring force. An example in the pre-production F/A-18E section will show the resulting motion when C and C are both varying over the φ-
range.
olC
φlC
C φl
φlC
lφl p
The other insight to be gained from this example is that the amplitude of the rolling motions mainly stayed in the φ-range of where the local slope of C is equal
to or less than 0. This was generally true for all of the models tested when they exhibited type 1-4 wing rock/drop motions. This result has been observed before in low-speed high angle-of-attack research (for example, see ref. 23). Therefore, a rough rule-of-thumb is that the shape of the vs. φ curve can be used to predict the steady state frequency and approximate maximum range of wing rock amplitude for type 1 – 4 motions.
φl
lC
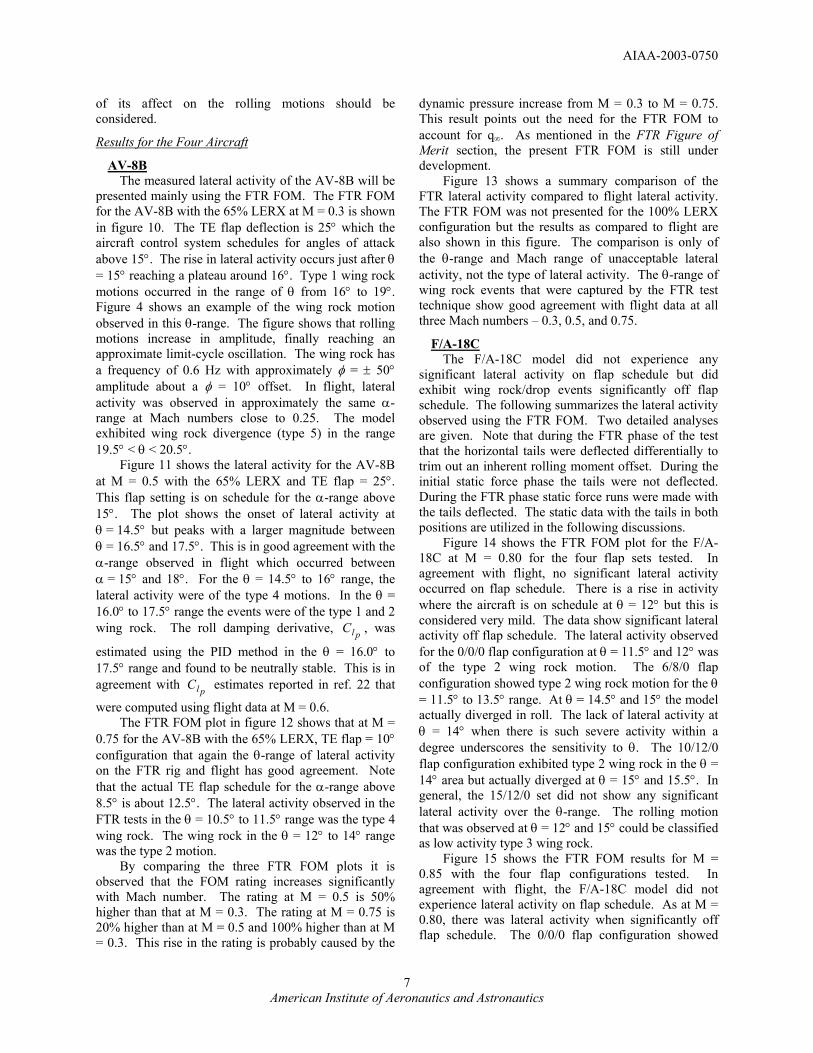
Figure 8 shows an example of wing rock divergence (type 5). The roll angle time history for the 10/12/0 flap configuration at approximately θ = 16.5° is shown in this figure. The estimated value of C is
+0.3. Figure 18 shows that the model has stable static lateral stability near φ = 0°. The motion is started due to an initial asymmetry with the growth in amplitude caused by the propelling value of C . Furthermore,
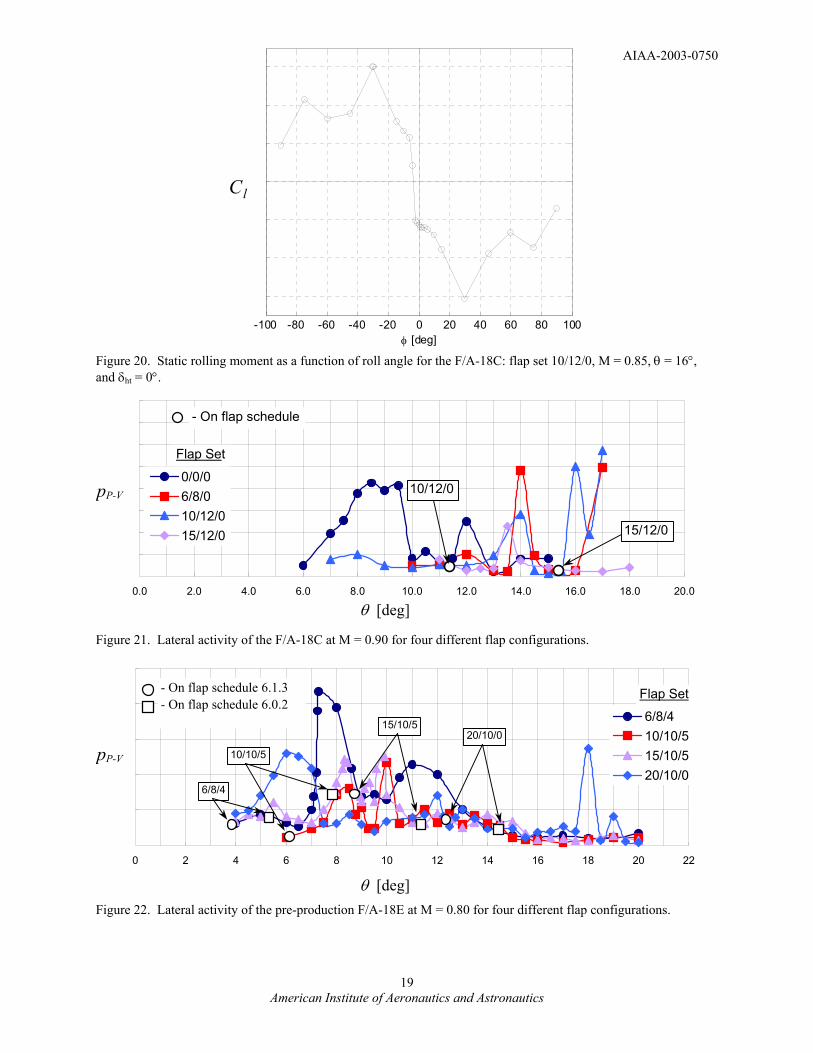
figure 20 shows the static rolling moment versus φ data for θ = 16° and the horizontal tails undeflected. Although this curve is not for the exact same θ under discussion the general nature of this curve is probably representative at θ = 16.5°. The frequency changes from 1.5 Hz for the first oscillation to 1.1 Hz for the final oscillation. This frequency change is caused by
pl
pl
8 American Institute of Aeronautics and Astronautics
AIAA-2003-0750
the non-linearity in across the φ-range. An
unstable trim point probably exists in the range of the φ = 95° to 115°. Therefore, once the model’s bank angle exceeds the amplitude at this unstable trim point it drove itself into the soft limit set by the brakes.
φlC
Figure 21 shows the FTR FOM plot for M = 0.90. As with M = 0.80 and 0.85 no significant lateral activity was experienced by the model on flap schedule which is in agreement with flight. There was however significant wing rock/drop off flap schedule. The 0/0/0 flap configuration showed significant type 2 lateral activity in the θ = 8° to 9.5° range. The milder activity at θ = 12° was type 3 wing rock motions. The 6/8/0 flap configuration experienced severe type 2 wing rock motions at θ = 14° and type 3 wing rock at θ = 17°. The 10/12/0 flap set showed type 3 wing rock at θ = 14° and experienced severe type 2 wing rock at θ = 16°. The 15/12/0 only experienced a mild type 3 wing rock at θ = 13.5°.
Pre-production F/A-18E The pre-production F/A-18E model was tested on
the FTR rig at M = 0.8 and 0.9 with four different flap configurations. In the discussion reference is made to the v6.0.2 flap schedule and the v6.1.3 flap schedule. The v6.0.2 flap schedule was in place during the flight test program when the wing drop problem was discovered. The v6.1.3 flap schedule was the flap set that gave an “80%” solution to the wing drop problem. The FTR results showed significant lateral activity for both flap schedules.
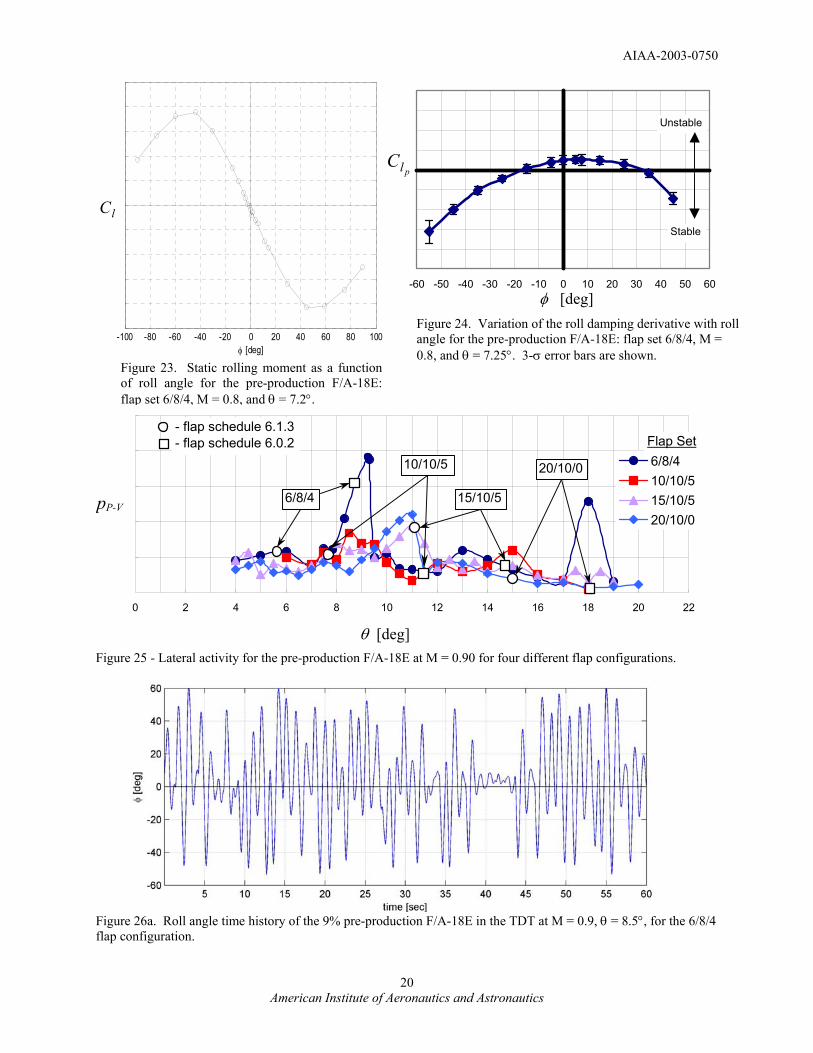
The lateral activity experienced by the pre-production F/A-18E model at M = 0.80 for four different flap configurations is shown by the FTR FOM plot in figure 22. The plot shows that there was significant lateral activity on the v6.0.2 flap schedule at θ = 8° (10/10/5 flap set) and on the v6.1.3 flap schedule at θ = 9° (15/10/5 flap set). There were also significant wing rock/drop events off schedule as well. The 6/8/4 flap configuration exhibited type 3 wing drop around θ = 7° and again around θ = 11°. The model exhibited severe type 2 wing rock in between θ = 7.25° and 8° range. A detailed look at the θ = 7.25° point will be shown subsequently. In the range of θ = 8° to 12° the rolling motions were of type 3 and type 4. The 10/10/5 and 15/10/5 configurations exhibited type 3 and type 4 wing rock and wing drop when they became active. The lateral activity experienced by the 20/10/0 configuration was mainly type 2 wing rock in the θ = 5.5° to 7° range while the activity observed at θ = 18° was type 3 wing drop.
The model undergoing severe type 2 wing rock is shown by a roll angle time history plot in figure 5 for the 6/8/4 configuration at M = 0.8, θ = 7.25°. The time history is characterized by a rolling motion with
amplitude and frequency varying between ±10° at 1.1Hz to ±50° at 0.95Hz. Most of the energy in the signal is at the 0.95Hz frequency. Data of the static rolling moment, C , and dynamic damping derivative,
, versus φ, given in figures 23 and 24 respectively,
are employed to understand this motion. The C vs. φ curve shows that the spring constant, C , is nearly
constant in the φ = ±35 degree range. Beyond φ = 35°, is reduced. As pointed out in the first F/A-18C
example above, when the oscillations exceed the range of
l
plC
φlC
l
φl
0<φl
0
C the frequency changes due to the integrated
value of the non-linear spring constant. Also, as observed in the F/A-18C example, the maximum range of amplitude is roughly determined by range of
≤φlC . In contrast to the F/A-18C example, the
motion does not fully damp to near zero roll rate. This can be explained by the C versus φ curve in figure
24. This curve shows that the roll damping varies significantly with φ. is propelling between -15° <
φ < 30°. Outside of this φ-range the model exhibits a significant increase in damping. This character has been observed before in the low-speed research (for example, see ref. 22). This C character is in contrast
to the F/A-18C example where C was always
damping and nearly constant with φ.
pl
l
plC
p
pl
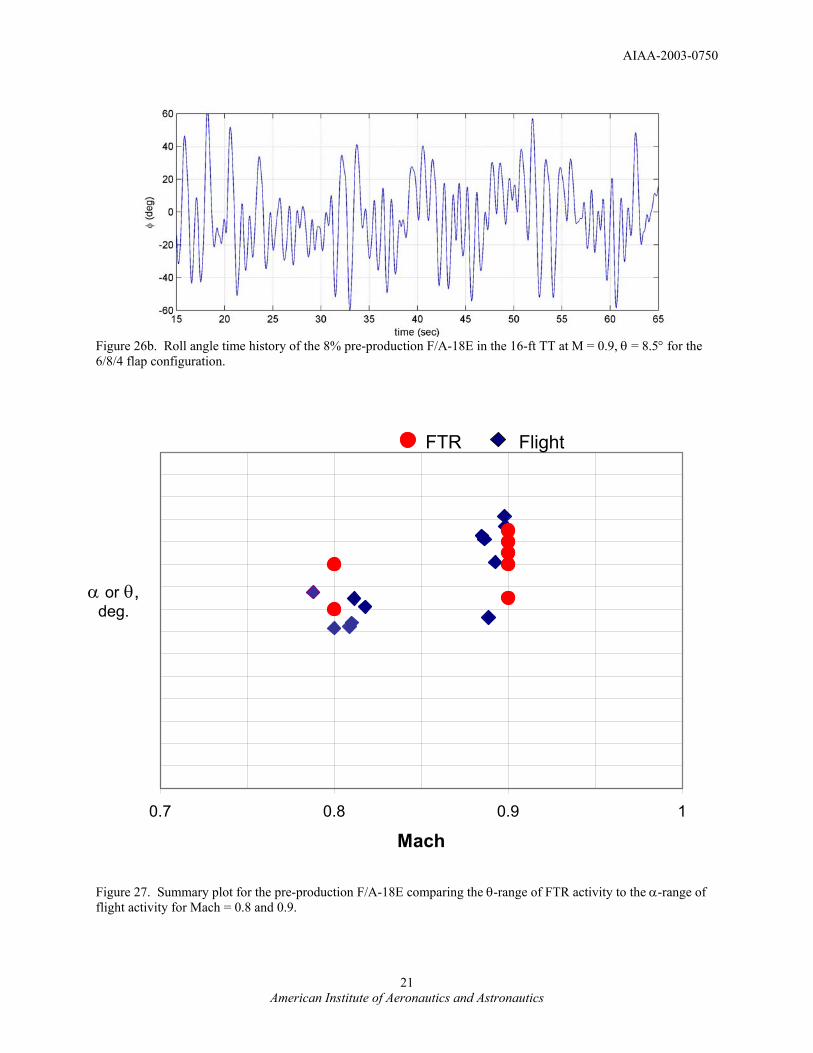
Figure 25 shows the FTR FOM plot for M = 0.9. The plot shows that there is significant lateral activity on the v6.0.2 flap schedule at θ = 8.5° (6/8/4 flap set) and on the v6.1.3 flap schedule at θ = 11° (15/10/5 flap set). The lateral activity for all four flap configurations consisted only of the type 3 and type 4 wing drop events. In other words, at M = 0.9 the model never showed a tendency to develop limit-cycle wing rock which is in contrast to M = 0.8. This result is in agreement with the wing rock behavior found with the 9% F/A-18E model at M = 0.9 in the FTR test conducted in the Transonic Dynamics Tunnel. As an example, time history traces of the rolling motion from the TDT test and the 16-ft TT test for the same conditions are shown in figure 26a and 26b, respectively. It is known (see ref. 9) that C is weaker
at M = 0.9 than at M = 0.8 and may explain this behavior.
βl
A summary of the θ and Mach range of FTR activity compared to flight data is shown in figure 27 for Mach numbers of 0.8 and 0.9. The data shown is where the airplane and the model had approximately the same flap deflection and Mach number at the time of a lateral activity event. As with the AV-8B flight
9 American Institute of Aeronautics and Astronautics
AIAA-2003-0750
comparison, the correlation is only of the θ and Mach range of unacceptable lateral activity, not the type of lateral activity. This figure shows good agreement between the FTR results and the flight data.
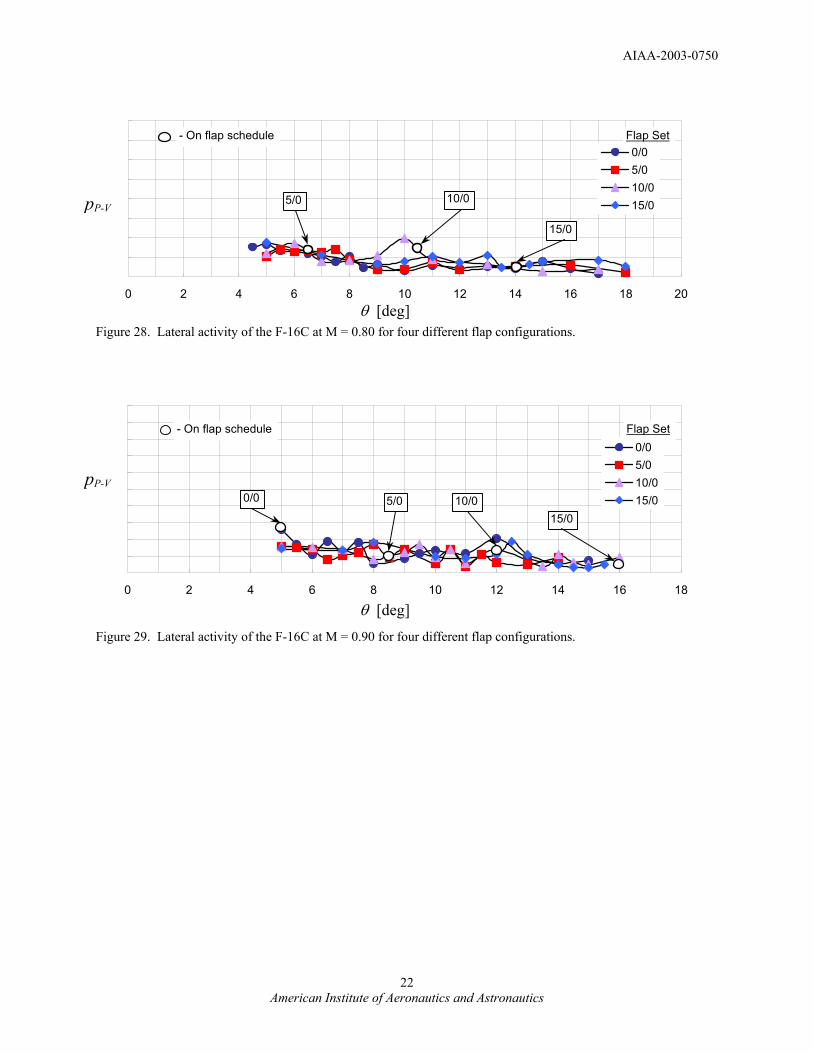
F-16C The level of lateral activity at M = 0.80 for the F-
16C model is depicted in Figure 28 using the FTR FOM. In agreement with flight there is no significant lateral activity. What is unique about the F-16C compared to the other airplanes was that it exhibited no significant lateral events across the entire θ-range. There is more lateral activity at the lower pitch angles but this is primarily caused by the model responding to turbulence in the tunnel under the influence of a weak spring constant, . Figure 29 shows the FTR FOM
plot for M = 0.90. The amount of lateral activity is slightly different from that at M = 0.80 but overall there is no significant lateral activity or changes in lateral activity over the θ-range. The behavior of the F-16C model at both Mach numbers is in agreement with flight.
φlC
Lessons Learned The following is a list of lessons learned from these
FTR tests: 1. A better understanding of the wing rock/drop
motions was achieved by having static C vs. φ data.
l
2. Static repeat runs were required to capture unsteady variations in the static rolling moment curve.
3. Pitch-sweeps, pitch-pause, and φ-offset type FTR runs were necessary to assess the conditions for which the model would develop lateral activity.
4. During the pitch-pause points, sometimes it was required to stay on condition for more than 30 seconds before the model experienced an uncommanded lateral motion.
5. The ability to start each pitch-pause point at zero roll angle and zero roll rate provided a more rigorous assessment of potential lateral activity.
Summary Transonic free-to-roll and static wind tunnel tests
for four military aircraft – the AV-8B, the F/A-18C, the pre-production F/A-18E, and the F-16C – have been analyzed. These tests were conducted in the NASA Langley 16-Foot Transonic Tunnel as a part of the NASA/Navy/Air Force Abrupt Wing Stall Program. The objectives were to demonstrate the utility of the free-to-roll test technique as a tool for identifying areas of significant uncommanded lateral activity during ground testing and for gaining insight into the wing-drop and wing-rock behavior of military aircraft at
transonic conditions. The analysis can be summarized as follows: 1. A figure of merit was developed to assist in
discerning the severity of lateral motions. Using this FOM, it was shown that the FTR test technique identified conditions where lateral activity occurred for the AV-8B and pre-production F/A-18E in an α-range that correlates with flight. The FOM predicted no significant lateral activity for the F/A-18C and F-16C on flap schedule, which is in agreement with flight. This figure of merit is still under investigation and other FOMs may be developed.
2. The lateral activity observed during the tests was categorized into five different types. Analyses of some of these types were given and showed the relationship between the lateral activity behavior, the static data, the static lateral stability derivative,
, and dynamic damping derivative, C . φlC pl
3. It was observed that the vs. φ curve indicated the non-linearity of the spring constant, the frequency of the wing rock motion, and the approximate φ - range of damped or limit-cycle wing rock/drop.
lC
4. Hysteresis was present in the static vs. φ curve and in the free-to-roll continuous pitch-sweeps. The effect of hysteresis is still under analysis.
lC
5. Dynamic scaling issues are of concern and are being investigated. Even so, with the FTR results showing good agreement with flight, it can be concluded that the models do not have to be dynamically scaled to make predictions of wing rock/drop susceptibility.
Future Research Recommendations • Flow visualization and unsteady pressure
measurements on both wings to identify which regions of the wing are stalling and reattaching during the rolling motion and help identify forcing functions.
• Study the effects of dynamical scaling analytically and experimentally.
• Conduct forced oscillation tests at various frequencies and amplitudes so that the functional dependence of roll damping can be identified.
• Using wind tunnel and CFD data (static and dynamic) further develop techniques for modeling the abrupt asymmetric wing stall for use in simulation studies.
• Conduct flight tests with an aircraft that has fixed control surfaces during the wing rock/drop events so that the FTR results can be better compared to flight.
10 American Institute of Aeronautics and Astronautics
AIAA-2003-0750
11. Roesch, M, and Randall, B.: Flight Test Assessment Of Lateral Activity. AIAA-2003-0748, January 2003.
• Develop guidelines to assess impact of FTR test results on airplane flying qualities.
Acknowledgements 12. Green, B, and Ott, J.: F/A-18C to E Wing Morphing Study for the Abrupt Wing Stall Program. AIAA-2003-0925, January 2003.
Messrs Steve Cook and Alex Kokolios of Naval Air Systems Command (NAVAIR), Patuxent River provided flight test data for comparison to the wind tunnel results. The Boeing Company and the Lockheed Martin Company provided the models used in the tests.
13. Kokolios, A., and Cook, S.: Use of Piloted Simulation for Evaluation of Abrupt Wing Stall Characteristics. AIAA-2003-0924, January 2003.
References 14. Capone, F.; Hall, B.; Owens, B.; Lamar, J.; and McMillin, N.: Recommended Experimental Procedures for Evaluation of Abrupt Wing Stall Characteristics. AIAA-2003-0922, January 2003.
1. Chambers, J.; and Hall, R.: Historical Review of Uncommanded Lateral-Directional Motions at Transonic Conditions. AIAA-2003-0590 January 2003.
15. Woodson, S.; Green, B.; Chung, J; Grove, D.; Parikh, P; and Forsythe, J.: Recommendations for CFD Procedures for Predicting Abrupt Wing Stall (AWS). AIAA-2003-0923, January 2003.
2. Hall, R., and Woodson, S: Introduction to the Abrupt Wing Stall (AWS) Program. AIAA-2003-0589, January 2003.
3. McMillin, N; Hall, R.; and Lamar, J.: Understanding Abrupt Wing Stall with Experimental Methods. AIAA-2003-0591, January 2003.
16. Cook, S.; Chambers, J.; Kokolios, A.; Niewoehner, R.; Owens, B.; Page, A.; and Roesch, M.: An Integrated Approach to Assessment of Abrupt Wing Stall for Advanced Aircraft. AIAA-2003-0926, January 2003. 4. Woodson, S.; Green, B; Chung, J.; Grove, D.;
Parikh, P.; and Forsythe, J.: Understanding Abrupt Wing Stall (AWS) with CFD. AIAA-2003-0592, January 2003.
17. Hall, R.; Woodson, S.; and Chambers, J.: Accomplishments of the AWS Program and Future Requirements. AIAA-2003-0927, January 2003.
5. Schuster, D., and Byrd, J.: Transonic Unsteady Aerodynamics of the F/A-18E at Conditions Promoting Abrupt Wing Stall. AIAA-2003-0593, January 2003.
18. Hwang, C.; and Pi, W.S.: “Some Observations on the Mechanism of Aircraft Wing Rock.” AIAA Paper 78-1456, AIAA Aircraft Systems and Technology Conference. Los Angeles, CA. August 21-23, 1978. 6. Forsythe, J., and Woodson, S.: Unsteady CFD
Calculations of Abrupt Wing Stall Using Detached- Eddy Simulation. AIAA-2003-0594, January 2003.
19. Wolowicz, C. H.; Bowman, J. S.; Gilbert, W. P.: Similitude Requirements and Scaling Relationships as Applied to Model Testing. NASA TP 1435, 1979. 7. Parikh, P, and Chung, J.: A Computational Study
of the AWS Characteristics for Various Fighter Jets: Part I, F/A-18E & F-16C. AIAA-2003-0746, January 2003.
20. Brandon, J. M.; Foster, J. V.: Recent Dynamic Measurements And Considerations For Aerodynamic Modeling Of Fighter Airplane Configurations. AIAA-98-4447. August 1998. 8. Chung, J., and Parikh, P.: A Computational Study
of the Abrupt Wing Stall (AWS) Characteristics for Various Fighter Jets: Part II, AV-8B and F/A-18C. AIAA-2003-0747, January 2003.
21. Morelli, E.A.: “System IDentification Programs for AirCraft (SIDPAC),” AIAA paper AIAA-2002-4704, AIAA Atmospheric Flight Mechanics Conference, Monterey, California, August 2002. 9. Lamar, J., and Hall, R.: AWS Figure of Merit
(FOM) Developed Parameters from Static, Transonic Model Tests. AIAA-2003-0745, January 2003.
22. Stevenson, S. W.; Holl, D.; Roman, A.: Parameter Identification of AV-8B Wingborne Aerodynamics for Flight Simulator Model Updates. AIAA-92-4506-CP. 1992 10. Capone, F; Owens, B.; and Hall, R.: Development
of a Free- To- Roll Transonic Test Capability. AIAA-2003-0749, January 2003.
11 American Institute of Aeronautics and Astronautics
AIAA-2003-0750
23. Brandon, J.M.; Murri, D.G.; Nguyen, L.T.: Experimental Study of Effects of Forebody Geometry on High Angle of Attack Static and Dynamic Stability and Control. 15th Congress of the International Council of the Aeronautical
Sciences (ICAS), September 7-12, 1986. London, England, UK.
24. Nguyen, L.T.; Yip, L.; Chambers, J.R.: Self-Induced Wing Rock of Slender Delta Wings. AIAA-81-1883. AIAA Atmospheric Flight Mechanics Conference, August 19-21, 1981.
AV-8B F/A-18E F/A-18C F-16C Scale, % 15 8 6 6.67 MAC, ft 1.246 1.048 0.917 0.755 Span, ft 4.55 3.34 2.25 2.07 Wing Area, ft2 5.18 3.2 1.44 1.33 Aspect Ratio 4 3.5 3.5 3.2 LE Sweep, deg. 36 29.4 26.5 40 Length, ft 6.77 4.58 3.27 3.1 Ix, slug-ft2 5.2 2.5 1.2 1.37
Table 1. Model geometric characteristics. Inertia given includes all moving parts: model, balance, sting, and rotary section of the FTR rig. Model sketches are scaled relative to each other.
Model Mach LE Flap (deg.)
TE Flap (deg.)
Aileron (deg.)
LERX
AV-8B 0.3 N/A 25 N/A 65%, 100% AV-8B 0.5 N/A 10, 15, 25 N/A 65%, 100% AV-8B 0.75 N/A 10, 15 N/A 65%, 100% F/A-18C 0.8, 0.85, 0.9 0, 6, 10, 15 0, 8, 12 0 N/A F/A-18E 0.8, 0.9 6, 10, 15, 20 8, 10 0, 4, 5 N/A F-16C 0.8, 0.9 0, 5, 10, 15 0 N/A N/A
Table 2. Configurations tested.
Model Mach Re, Millions
θ-range, deg. on FTR Rig
AV-8B 0.3 2.4 10 to 22 AV-8B 0.5 3.6 6 to 22 AV-8B 0.75 4.5 6 to 13.5
F/A-18C 0.8, 0.85 3.5 6 to 18 F/A-18C 0.90 3.7 7 to 17 F/A-18E 0.80 3.8 6 to 20 F/A-18E 0.90 4 6 to 18 F-16C 0.80 2.7 4.5 to 17 F-16C 0.90 2.8 5 to 16
Model a
m
x
xI
I
Alt. = 15,000ft. a
m
x
xI
I
Alt. = 25,000ft.
AV-8B 4.7 3.4 F/A-18C 62 44 F/A-18E 20 15 F-16C 159 113
Table 4. Ratio of scaled-up test inertias to actual inertias.
Table 3. Test conditions during the FTR phase of the test.
12 American Institute of Aeronautics and Astronautics
AIAA-2003-0750
Figure 1. Kinematic relationships during rolling motion at a fixed pitch and yaw angle. Also, down-going wing has an incremental increase in local angle of attack while the up-going wing experiences the opposite.
roll axis
• β = 0°
• β > 0°
Wings Level • φ = 0° • α = θ
θ
V
roll axis
∆α < 0 Rolling Right • φ > 0° • α < θ
θ
Figure 2. Sketch of the NASA Langley 16-Foot Transonic Tunnel FTR apparatus.
∆α > 0 V
Figure 3. Roll angle time history showing “wing drop” for the F/A-18E: flap set 6/8/4, θ = 7.3°, and M = 0.8.
13 American Institute of Aeronautics and Astronautics
AIAA-2003-0750
Figure 4. Type 1 wing rock motion of the AV-8B: 65% LERX, TE flap = 25°, M = 0.3, and θ = 18.5°.
Figure 5. Type 2 wing rock motion of the pre-production F/A-18E: flap set 6/8/4, M = 0.8, and θ = 7.25°.
Figure 6. Type 3 wing-rock/drop motion of the pre-production F/A-18E: flap set 15/10/5, M = 0.8, and θ = 8°.
14 American Institute of Aeronautics and Astronautics
AIAA-2003-0750
f ~ 1.5Hzf ~ 1.5Hz
f ~ 1.1Hz
Figure 7. Type 4 wing rock events of the F/A-18C: flap set 10/12/0, M = 0.85, θ = 15°, and δht = -3°.
Figure 8. Type 5 divergent rolling motion of the F/A-18C: flap set 10/12/0, M = 0.85, θ = 16.5°, and δht = -3°.
P
V
Figure 9. Demonstrates how the FTR figure of merit is defined.
15 American Institute of Aeronautics and Astronautics
AIAA-2003-0750
0 2 4 6 8 10 12 14 16 18 20 22 24
Flight Activity
On Flap Schedule
pP-V
θ [deg] Figure 10. Lateral activity of the AV-8B at M = 0.3 with the 65% LERX and TE Flap = 25°.
Flight Activity
On Flap Schedule
pP-V
0 2 4 6 8 10 12 14 16 18 20 22 24
Figure 11. Lateral activity of the AV-8B at M = 0.5 with the 65% LERX and TE Flap = 25°. θ [deg]
Flight Activity
pP-V
0 2 4 6 8 10 12 14 16 18 20 22 24
θ [deg] Figure 12. Lateral activity of the AV-8B at M = 0.75 with the 65% LERX and TE Flap = 10°.
16 American Institute of Aeronautics and Astronautics
AIAA-2003-0750
17 American Institute of Aeronautics and Astronautics
Figure 13. Summary plot for the AV-8B comparing the θ-range of FTR activity to the α-range of flight activity.
0.2 0.3 0.4 0.5 0.6 0.7 0.8 0.9 1
65% LERX100% LERX
AV-8B flight lateral activity is at the extremes of the operation envelope. Note: FTR data at M = 0.75
includes data for the 65% and 100% LERX
FTR Lateral Activity
Mach
Flight Lateral Activity
α or θ, deg.
0.0 2.0 4.0 6.0 8.0 10.0 12.0 14.0 16.0 18.0 20.0
0/0/06/8/010/12/015/12/0
- On flap schedule
extrapolated value
6/8/0 10/12/015/12/0
Flap Set
pP-V
θ [deg] Figure 14. Lateral activity of the F/A-18C at M = 0.80 for four different flap configurations.
0.0 2.0 4.0 6.0 8.0 10.0 12.0 14.0 16.0 18.0 20.0
0/0/06/8/010/12/015/12/0
- On flap schedule
6/8/0 15/12/010/12/0
Flap Set
pP-V
θ [deg]
Figure 15. Lateral activity of the F/A-18C at M = 0.85 for four different flap configurations.
AIAA-2003-0750
0 2 4 6 8 10 12 14 16 18 20α [deg]
Cl
0 2 4 6 8 10 12 14 16 18 20α [deg]
Cl
lC
CL
Figure 17. Static rolling moment for the F/A-18C: flap set 10/12/0, M = 0.85, β = 0°, and δht = 3°.
0 2 4 6 8 10 12 14 16 18 20
Cl β [per degree]
Unstable
Stable
Figure 16. Lift characteristics for the F/A-18C: flap set 10/12/0, M = 0.85 and δht = 0°.
α [deg]
Figure 18. Static lateral stability near zero roll angCllC
βlC
le for the F/A-18C: flap set 10/12/0, M = 0.85, and δht = 0°
Figure 19. Static rolling moment as a function of angle for the F/A-18C: flap set 10/12/0, M = 0.8515°, and δht = 0°
-100 -80 -60 -40 -20 0 20 40 60 80 1φ [deg]
American Institu
roll , θ =
00
18 te of Aeronautics and Astronautics
l
AIAA-2003-0750
Figure 20. Static rollinand δht = 0°.
0.0 2.0
0/0/06/8/010/12/15/12/
- On
Flap Se
pP-V
Figure 21. Lateral acti
0 2
- On flap s- On flap s
6/8/
pP-V
Figure 22. Lateral acti
-100 -80 -60 -40 -20 0 20 40 60 80 100φ [deg]
ClC
g moment as a function of roll angle for the F/A-18C: flap set 10/12/0, M = 0.85, θ = 16°,
4.0 6.0 8.0 10.0 12.0 14.0 16.0 18.0 20.0
00
flap schedule
10/12/0
15/12/0
t
θ [deg]
vity of the F/A-18C at M = 0.90 for four different flap configurations.
4 6 8 10 12 14 16 18 20 22
6/8/410/10/515/10/520/10/0
chedule 6.1.3chedule 6.0.2
4
10/10/5
15/10/520/10/0
Flap Set
θ [deg]
vity of the pre-production F/A-18E at M = 0.80 for four different flap configurations.
19 American Institute of Aeronautics and Astronautics
AIAA-2003-0750
lClC
-100 -80 -60 -40 -20 0 20 40 60 80 100φ [deg]
CllC
Unstable
C
Figure 23. Static rolling moment as a functionof roll angle for the pre-production F/A-18E:flap set 6/8/4, M = 0.8, and θ = 7.2°.
0 2 4 6 8 1
- flap schedule 6.1.3- flap schedule 6.0.2
6/8/4pP-V
θ [dFigure 25 - Lateral activity for the pre-production F/A
Figure 26a. Roll angle time history of the 9% pre-prodflap configuration.
American Institute of
-60 -50 -40 -30 -20 -10 0 10 20 30 40 50 60
Stable
pl
φ [deg] Figure 24. Variation of the roll damping derivative with roll angle for the pre-production F/A-18E: flap set 6/8/4, M = 0.8, and θ = 7.25°. 3-σ error bars are shown.
0 12 14 16 18 20 22
6/8/410/10/515/10/520/10/0
10/10/5
15/10/5
20/10/0
Flap Set
eg]
-18E at M = 0.90 for four different flap configurations.
uction F/A-18E in the TDT at M = 0.9, θ = 8.5°, for the 6/8/4
20 Aeronautics and Astronautics
AIAA-2003-0750
Figure 26b. Roll angle time history of the 8% pre-production F/A-18E in the 16-ft TT at M = 0.9, θ = 8.5° for the 6/8/4 flap configuration.
0.7 0.8 0.9 1
Mach
FTR Flight
α or θ, deg.
Figure 27. Summary plot for the pre-production F/A-18E comparing the θ-range of FTR activity to the α-range of flight activity for Mach = 0.8 and 0.9.
21 American Institute of Aeronautics and Astronautics
AIAA-2003-0750
22 American Institute of Aeronautics and Astronautics
0 2 4 6 8 10 12 14 16 18 20
0/05/010/015/0
- On flap schedule
5/0 10/0
15/0
Flap Set
pP-V
Figure 28. Lateral activity of the F-16C at M = 0.80 for four different flap configurations. θ [deg]
0 2 4 6 8 10 12 14 16 18
0/05/010/015/0
- On flap schedule
0/0 5/0 10/015/0
Flap Set
pP-V
θ [deg] Figure 29. Lateral activity of the F-16C at M = 0.90 for four different flap configurations.