Embed Size (px)
Citation preview
The Educational Progress of Looked After Children in England: Technical Report 2: Relating Care to Educational Attainment and ProgressNikki Luke, Ian Sinclair and Aoife O’Higgins
University of Oxford, Department of Education
Funded by The Nuffield Foundation February 2014 – May 2015
Research Team: Professor Judy Sebba, Professor David Berridge, Professor Steve Strand, Professor Sally Thomas, Dr Nikki Luke, Dr John Fletcher, Dr Karen Bell, Professor Ian Sinclair, Aoife O’Higgins
Table of Contents
Aim and Objectives.................................................................................................5
The Data.................................................................................................................6
Part 1: Descriptive analysis.....................................................................................7How do the outcomes of children in care differ from those of children in the general population?............................................................................................................................................................ 7
Table 1.1: KS4 Points by Need Group...................................................................................................8Figure 1.1 The Distribution of KS4 Scores in Four Distinct Need Groups............................9
Age and Gender.................................................................................................................................................10Table 1.2: Mean KS4 Points (and SD), by Need Group and Gender.......................................10
Ethnicity............................................................................................................................................................... 11Table 1.3: Mean KS4 Points (and SD), by Need Group and Ethnicity...................................12
Free School Meals (FSM)...............................................................................................................................12Table 1.4: Mean KS4 points (and SD), by Need Group and FSM Eligibility at KS4.........13Table 1.5: Mean KS4 points (and SD), by Need Group and FSM Eligibility at KS1.........13Table 1.6: Mean points (and SD) at KS1-KS4, for Young People in the Longer-Stay Group who were in Care at KS4 but Not in Care at a Previous Key Stage, by FSM Eligibility at KS1.......................................................................................................................................... 14
Indicators of Deprivation Affecting Children Index (IDACI).........................................................14Table 1.7: Correlation Coefficients between IDACI and KS4 Results...................................14
Level of Special Educational Need............................................................................................................14Table 1.8: Mean KS4 points (and SD), by Need Group and Highest Ever Level of SEN Provision (2004-2013).............................................................................................................................15
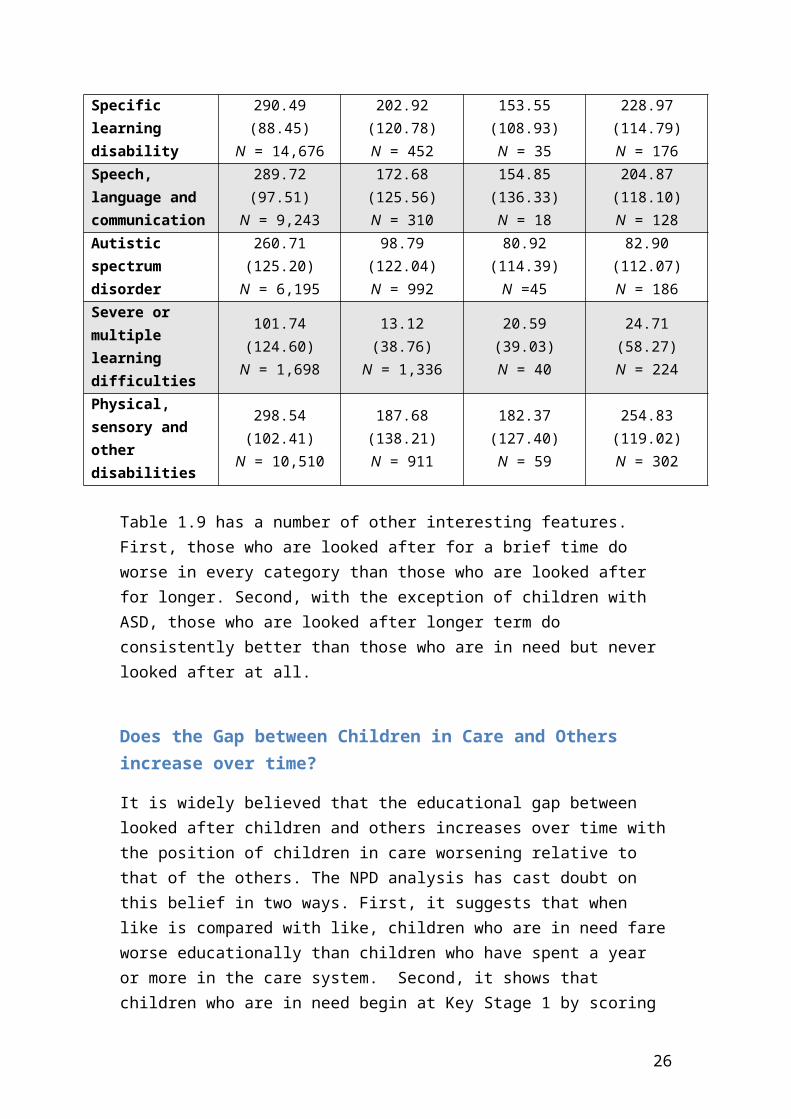
Type of Special Educational Need.............................................................................................................15Table 1.9: Mean KS4 points (and SD) by Need Group and Primary SEN Type at Time of Greatest Provision......................................................................................................................................16
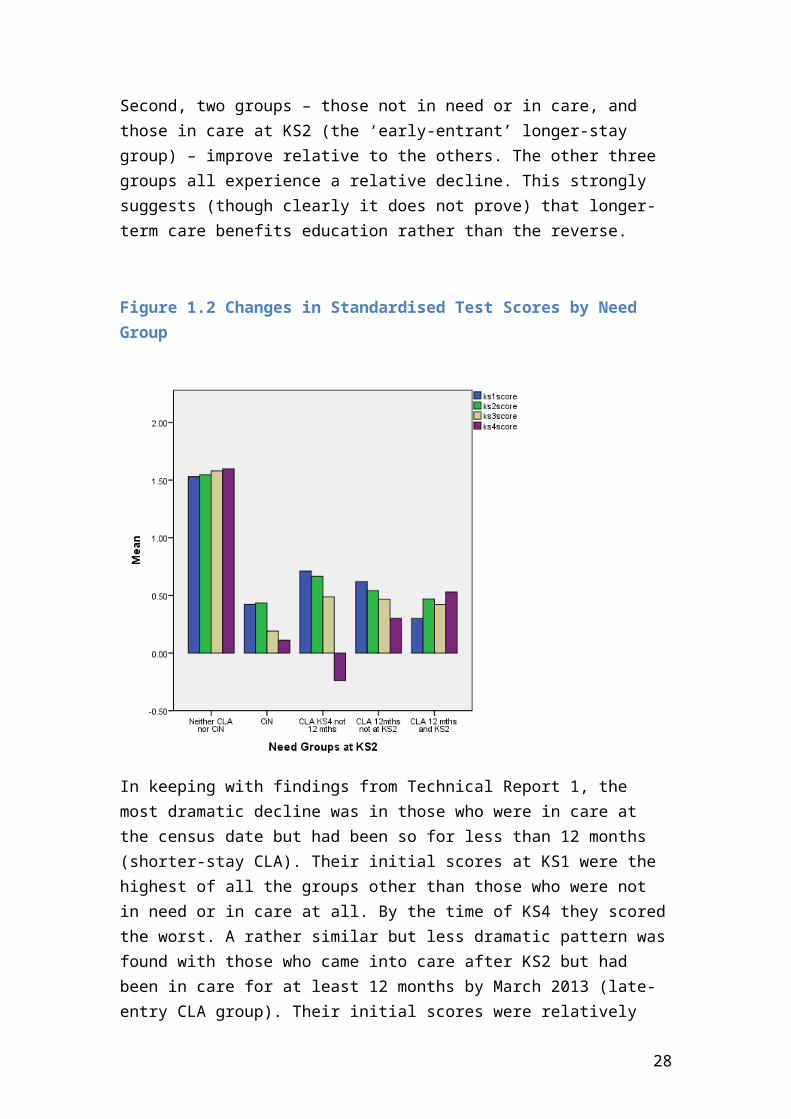
Does the Gap between Children in Care and Others increase over time?...............................17Figure 1.2 Changes in Standardised Test Scores by Need Group................................................18Schools.................................................................................................................................................................. 19
Table 1.10 Pupils Per School in Longer-Stay CLA Group...........................................................20Table 1.11 Need Groups at KS4 by whether in a Mainstream School..................................20Table 1.12 Average KS4 Points by Need Groups and whether in Mainstream Schools............................................................................................................................................................................. 21Table 1.13 Need Group, average KS4 Score and Type of Mainstream School..................22Table 1.14 Need Group, Type of Non-Mainstream School and Average KS4 Points.....22Figure 1.3 CVA Scores for Non-CIN and Non-CLA by Type of School...................................23
Part 1 Summary and Conclusion...............................................................................................................24
Part 2: Addressing the Research Questions in the Original bid...............................26Method.................................................................................................................................................................. 26Table notation....................................................................................................................................................26
Table 2.1: Regression model for mean KS4 points by individual characteristics...........27Conclusion on Research Question 1.........................................................................................................29
Table 2.2: Regression model for mean KS4 points by individual characteristics and care career types.........................................................................................................................................30
RESEARCH QUESTION 2: Is the finding suggesting the longer the duration of care the higher the attainment robust or is this explained by the reasons for entry into care or age of admission - those entering the care system later bringing with them a different set of behavioural and related issues (DfE 2011)?...................................................................................32
Figure 2.1: Mean KS4 points by total time in care, controlling for KS2 results...............32
1
Figure 2.2: Mean KS4 points by total time in care and reason for first entry, controlling for KS2 results......................................................................................................................33Figure 2.3: Mean KS4 points by total time in care and reason for first entry, not controlling for KS2 results......................................................................................................................34Table 2.3: Estimated marginal means (and standard errors) for KS4 points by career type....................................................................................................................................................................34Figure 2.4: Mean KS4 points by total time in care and career type, controlling for KS2 results...............................................................................................................................................................35Table 2.4: Correlations between length of time in care and KS4 points by career type............................................................................................................................................................................. 36Table 2.5: Correlations between length of time in care and KS4 points by career type, for short- and medium-term children only.....................................................................................36
Conclusion on Research Question 2.........................................................................................................37Table 2.6: Regression model for mean KS4 points by individual characteristics and time in care....................................................................................................................................................39
RESEARCH QUESTION 3: Are placement stability and school stability equally associated with higher attainment (Conger and Rebeck 2001)?.......................................................................41
Table 2.7: Correlations between school changes and KS4 points..........................................41Table 2.8: Correlations between school changes and KS4 points..........................................41Table 2.9: Correlations between school changes and placement changes........................42Table 2.10 KS4 Points (and SD) by Post-KS2 Placement Changes and Year 10 or 11 School Change (Mainstream Schools)................................................................................................43Table 2.11 KS4 Points (and SD) by Post-KS2 Placement Changes and Year 10 or 11 School Change (Non-mainstream Schools)......................................................................................43Table 2.12 Distribution of Post-KS2 Placement Changes Across Five Placement Types at KS4................................................................................................................................................................44Table 2.13 KS4 Points (and SD) by Post-KS2 Placement Changes and KS4 Placement Type...................................................................................................................................................................45
Conclusion on Research Question 3.........................................................................................................45Table 2.14: Regression model for mean KS4 points by individual characteristics, time in care and instability................................................................................................................................46
RESEARCH QUESTION 4: What factors contribute to any association between placement stability and higher attainment (Conger and Rebeck 2001)?.......................................................48Block 1................................................................................................................................................................... 48Block 2................................................................................................................................................................... 48Block 3................................................................................................................................................................... 48
Table 2.15: Mean standardised SDQ scores by BESD status (statemented or School Action Plus)....................................................................................................................................................49
Block 4................................................................................................................................................................... 49Interpreting the regression models.........................................................................................................51Conclusion on Research Question 4.........................................................................................................52
Table 2.16a: Regression model for mean KS4 points: Block 1 only......................................53Table 2.16b: Regression model for mean KS4 points: Blocks 1-2.........................................54Table 2.16c: Regression model for mean KS4 points: Blocks 1-3..........................................56Table 2.16d: Regression model for mean KS4 points: Blocks 1-4.........................................58
Part 2 Summary and Conclusion...............................................................................................................60
Part 3: Path analysis of data for CLA cohort...........................................................61Method.................................................................................................................................................................. 61
Table 3.1 KS4 Points (and SD) by Levels of Difficulty in School and in Care....................63Results...................................................................................................................................................................64
Figure 3.1: Path model for looked after children’s KS4 results..............................................65Part 3 Summary and Conclusion...............................................................................................................66
2
Part 4: Modelling School and Local Authority Variables........................................67Method.................................................................................................................................................................. 68Findings................................................................................................................................................................ 71
Table 4.1: Association of CVA scores with outcome after allowing for relevant predictors in mainstream schools.......................................................................................................71Table 4.2: Correlations between School Level Measures in Mainstream Schools.........72Table 4.3: Association of CVA for CLA, School FSM and School mean KS2 points with outcome after allowing for relevant predictors, when all three are entered together 73Table 4.4: Correlations among selected local authority Variables........................................73Table 4.5: Associations of School and local authority variables with in outcome in mainstream schools and after allowing for predictor variables............................................74Table 4.6: Associations of School and local authority variables with outcome in non-mainstream schools and after allowing for predictor variables............................................75
Full Model............................................................................................................................................................76Table 4.7: School level coefficients in different combinations after allowing for predictor variables: model applies to all schools..........................................................................77Table 4.8: Mean KS4 pints (and SD) by Schools grouped according to average KS2 points and proportions of children who have had free school meals in past 6 years...79Table 4.9: Final multi-level models showing coefficients (and SE) for mainstream, non-mainstream, and all schools.........................................................................................................80
Part 4 Summary and Conclusion...............................................................................................................81
Overall Conclusion................................................................................................83Summary of Parts 1-4.....................................................................................................................................83Key messages.....................................................................................................................................................86
References............................................................................................................89
Appendix A: Note on variables used in Part 2 of this report..................................90Free School Meals.............................................................................................................................................90School and placement instability...............................................................................................................91
Appendix B: Supplementary analyses on kinship vs. foster care at KS4.................92Table B1: Means (and SD) for KS4 points by placement type and FSM status at KS4. .92Table B2a: Regression model for mean KS4 points (foster/kinship subsample only): Block 1 only................................................................................................................................................... 93Table B2b: Regression model for mean KS4 points (foster/kinship subsample only): Blocks 1-2.......................................................................................................................................................95Table B2c: Regression model for mean KS4 points (foster/kinship subsample only): Blocks 1-3.......................................................................................................................................................97Table B2d: Regression model for mean KS4 points (foster/kinship subsample only): Blocks 1-4.......................................................................................................................................................99
Appendix C: Supplementary analyses on looked after children in mainstream vs. non-mainstream schools at KS4..........................................................................101
Table C1a: Regression model for mean KS4 points (mainstream vs. non-mainstream at KS4): Block 1 only...............................................................................................................................103Table C1b: Regression model for mean KS4 points (mainstream vs. non-mainstream at KS4): Blocks 1-2...................................................................................................................................105Table C1c: Regression model for mean KS4 points (mainstream vs. non-mainstream at KS4): Blocks 1-3........................................................................................................................................107Table C1d: Regression model for mean KS4 points (mainstream vs. non-mainstream at KS4): Blocks 1-4...................................................................................................................................109
Appendix D: Comparison of significant predictors across three analyses.............111
3
Table D1: Significant predictors (and direction of relationship) of KS4 points, controlling for KS2 scores, comparing the main sample of interest, the subsample of young people in foster or kinship care at KS4, and those in mainstream and non-mainstream schools at KS4..................................................................................................................111
Appendix E: Output for Part 4 (multi-level models).............................................113Figure E1: Final Model for Mainstream Schools.........................................................................113Figure E2: Final Model for Non-mainstream schools...............................................................114Figure E3: Final Model for All Schools............................................................................................115
Aim and Objectives
The policy aim underlying this research was to improve the relatively poor educational outcomes of looked-after children. The research exploited the linking of national data about the educational achievement of all children from the National Pupil Database (NPD) with local authority data on Children Looked After (CLA) and their experiences of care, from the annual returns from local authorities (SSDA903). This linkage provided a unique opportunity to inform future policy and practice by identifying factors that might account for the relatively poor GCSE attainments of CLA and factors associated with substantive variations in those outcomes.
Technical Report 1 analyses the data on a sample from the NPD. The current report focuses on the results of merging these data with the further data which are routinely collected on children looked after and which were made available to us in an anonymised form by the Department for Education (DfE). This quantitative analysis, relating to GCSE attainment and progress during the secondary phase of education, provides a profile of the cohort of CLA, and examines how their individual characteristics and their experiences in care and education relate to their educational attainment and progress.
The paper has four parts, each characterised by the use of the different statistical techniques required by the questions in our original proposal. The four parts will:
1. Describe the sample of interest of CLA with particular reference to those characteristics that might explain the gap between their educational outcomes and those of other children in the general population.
2. Use regression modelling to predict educational outcomes among the CLA.3. Use path modelling to examine the inter-relationships between variables and
suggest plausible causes for different outcomes.4. Use multi-level modelling to examine the way in which schools and local
authorities may affect these outcomes.
This paper summarises the main findings from these analyses, looking successively at the ‘educational gap’ (the difference in GCSE points between CLA and other
4
children), the reasons for differing outcomes, and the role of schools and local authorities. Any implications for policy and future research will be discussed in the overall summary.
The Data
The study used data from the English National Pupil Database (NPD) and Children Looked After Dataset (CLAD). The sample drawn from the NPD comprised the full cohort of around 640,000 English schoolchildren who were aged 15 on 1 September, 2012. The sample drawn from the 2012-13 CLAD comprised 7,852 children, of whom 6,236 were still in care on 31 March 2013, but the main focus of the statistical analysis was the smaller subset (4,849) who were looked after continuously for 12 months from 1 April 2012 to 31 March 2013 (which we abbreviate to CLA-LT). Data on both databases are linked to individual pupils using a unique pupil number (UPN), which enables the linking of personal characteristics collected in English schools censuses, examination results collected from awarding bodies, and episodes of care collected from local authorities on the SSDA903 return. It is worth noting that the group studied was older children in long-term care. Children who were only in care when they were younger, or who were in care for shorter periods, may have had different experiences of, and outcomes from, education.
The NPD provides data on attainment at National Curriculum Key Stages, attendance at school and exclusions from school. The SSDA903 return provides data on episodes of care and placements, such as dates, legal basis, locations, and providers involved in the children’s different placements, categories of placement (e.g. whether fostered with unrelated carers or with family or friends) and their destination on leaving the system (e.g. whether they were adopted or returned to their birth family). Both sources provide basic demographic data. To simplify the analysis, pupil-level data on absences and exclusions from school were aggregated into the five school years of the secondary phase of education; data on episodes of care were aggregated to the child level. (The availability of dates for care placements, absences and exclusions from school, and attainment tests would make it feasible to undertake a more time-oriented analysis but that was beyond the remit of this project).
5
Part 1: Descriptive analysis
The sample of interest comprises children who had been continuously in care for at least 12 months at 31 March 2013; it is hereafter referred to as the ‘longer-stay group’. This is a category used by the DfE in its statistical releases.
Part 1 of this report deals with variables that can be used to compare this group with the other comparison groups already identified in the NPD analysis. It thus focusses on:
1. Children in the general population who were not in need or in care at 31 March 2013
2. Children who were ‘In Need’ (CIN) at 31 March 20133. Shorter-stay CLA: children in care at 31 March 2013, but for less than 12
months continuously4. Longer-stay CLA: children in care at 31 March 2013 for 12 months
continuously (our sample of interest)
At the end of Part 1 we focus on the possible effects of length of stay and further sub-divide the longer-stay group into:
a. Early-entry CLA: children in care at 31 March 2013 for 12 months continuously, and whose entry to care predates end of KS2
b. Late-entry CLA: children in care at 31 March 2013 for 12 months continuously, but whose entry to care was after KS2
As in Technical Report 1, the measure of outcome is the number of GCSE points a child achieves in their 8 best subjects, with an improvement of one grade (e.g. from C to B) adding 6 points to the score.
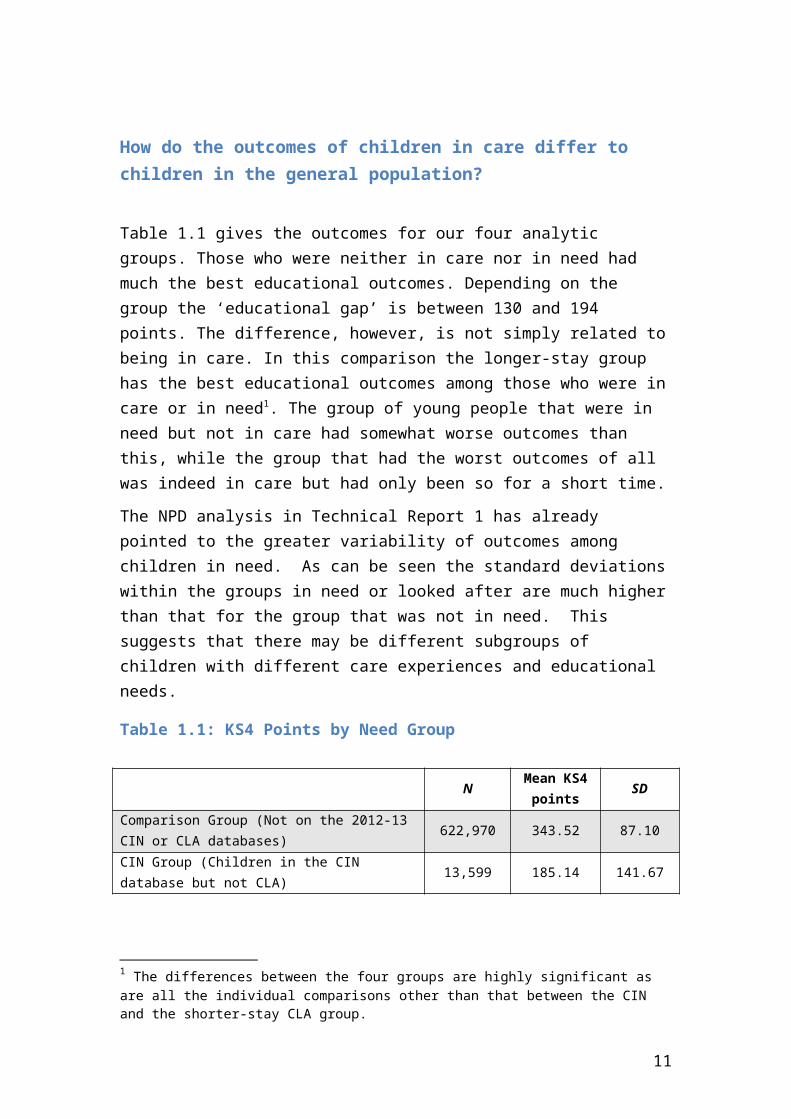
How do the outcomes of children in care differ to children in the general population?
Table 1.1 gives the outcomes for our four analytic groups. Those who were neither in care nor in need had much the best educational outcomes. Depending on the group the ‘educational gap’ is between 130 and 194 points. The difference, however, is not simply related to being in care. In this comparison the longer-stay group has the best educational outcomes among those who were in care or in need1. The group of
1 The differences between the four groups are highly significant as are all the individual comparisons other than that between the CIN and the shorter-stay CLA group.
6

young people that were in need but not in care had somewhat worse outcomes than this, while the group that had the worst outcomes of all was indeed in care but had only been so for a short time.
The NPD analysis in Technical Report 1 has already pointed to the greater variability of outcomes among children in need. As can be seen the standard deviations within the groups in need or looked after are much higher than that for the group that was not in need. This suggests that there may be different subgroups of children with different care experiences and educational needs.
Table 1.1: KS4 Points by Need Group
NMean KS4
pointsSD
Comparison Group (Not on the 2012-13 CIN or CLA databases)
622,970 343.52 87.10
CIN Group (Children in the CIN database but not CLA) 13,599 185.14 141.67Shorter-stay CLA (Looked after at 31 March 2013 but not 12 months continuously)
1,387 149.52 128.01
Longer-stay CLA (Looked after at 31 March 2013 and for 12 months or more continuously)
4849 202.41 130.39
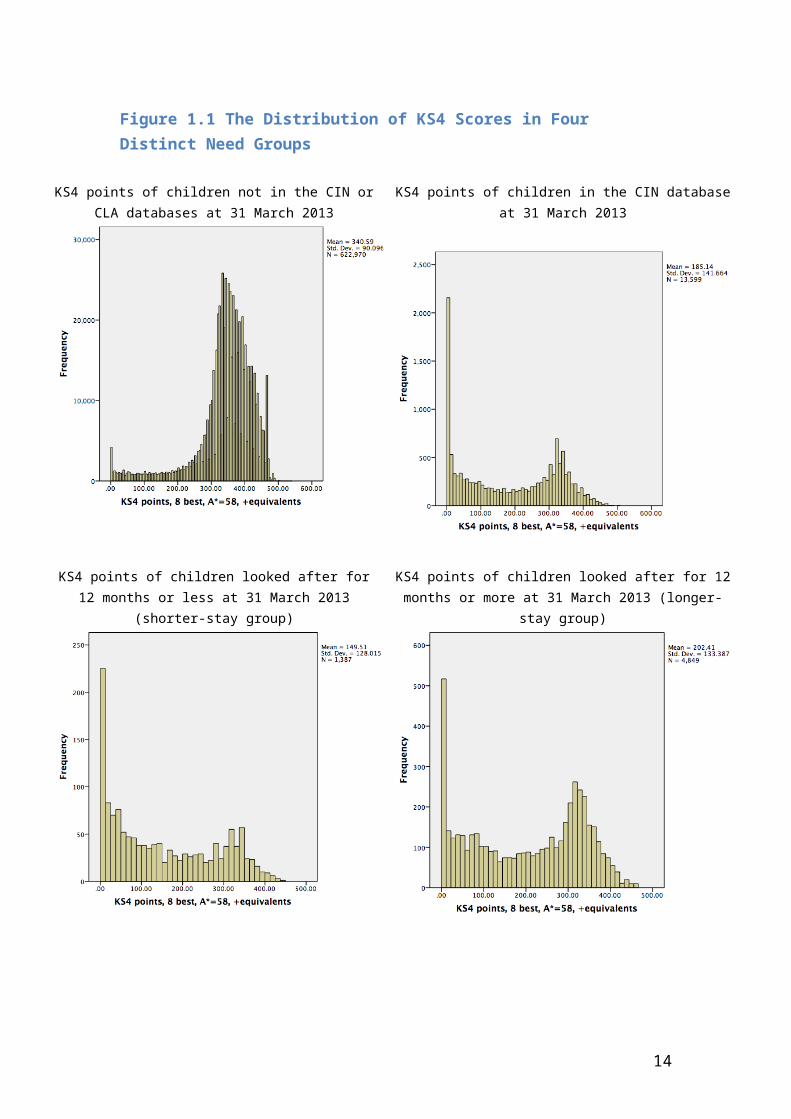
Figure 1.1 illustrates the distribution of scores in the four groups with the longer-stay group. The right hand side of the histogram for the longer-stay group suggests a ‘bell-shaped’ curve which is centered around a mean of around 320. The left hand side of the histogram gives a very different picture with a large spike at zero, and decreasing numbers as the scores increase2. The other two groups (CIN and shorter-stay CLA group) are broadly similar to this picture. The histogram for those who are not in need or in care is very different. There is a small spike at zero but this is less than the spike on the right hand side of the diagram, which probably represents a group who get nothing, but A-star (A*) results. This picture is dominated by a broadly normal curve which has a mean around 350.
The hypothesis that arises from these data is therefore that the longer-stay care group does contain at least two rather distinct populations. One of these does have an average GCSE score which is lower than that found for the group that is not in need or in care but not dramatically so. The other has very low scores and commonly no KS4 points at all. As will be shown in the section on special educational needs (SEN), young people with more pronounced difficulties make up a substantial proportion of this lower-scoring group, which also makes up a substantial proportion of those CLA pupils who are not in mainstream schools.
2 The size of the sample means that statistically this lack of normality should not usually trouble us. We checked a number of calculations using an appropriate transformation for the KS4 score and found that it made no meaningful difference to the results.
7
8
Figure 1.1 The Distribution of KS4 Scores in Four Distinct Need Groups
KS4 points of children not in the CIN or CLA databases at 31 March 2013
KS4 points of children in the CIN database at 31 March 2013
KS4 points of children looked after for 12 months or less at 31 March 2013 (shorter-stay group)
KS4 points of children looked after for 12 months or more at 31 March 2013 (longer-stay group)
9
Age and Gender
The mean age of the sample of interest was 16 years and one month (SD = 3.78). Given the lack of variation, it was not surprising that age did not have substantive relationships with outcome and we do not consider it further.
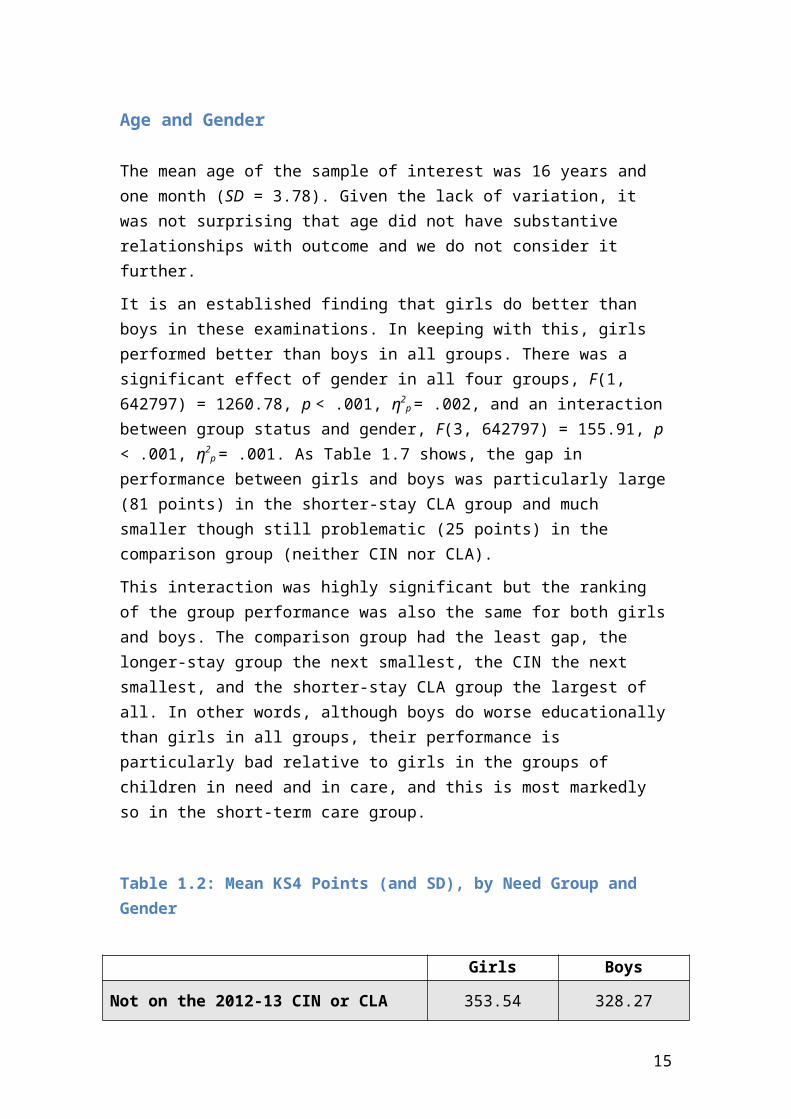
It is an established finding that girls do better than boys in these examinations. In keeping with this, girls performed better than boys in all groups. There was a significant effect of gender in all four groups, F(1, 642797) = 1260.78, p < .001, η2
p
= .002, and an interaction between group status and gender, F(3, 642797) = 155.91, p < .001, η2
p = .001. As Table 1.7 shows, the gap in performance between girls and boys was particularly large (81 points) in the shorter-stay CLA group and much smaller though still problematic (25 points) in the comparison group (neither CIN nor CLA).
This interaction was highly significant but the ranking of the group performance was also the same for both girls and boys. The comparison group had the least gap, the longer-stay group the next smallest, the CIN the next smallest, and the shorter-stay CLA group the largest of all. In other words, although boys do worse educationally than girls in all groups, their performance is particularly bad relative to girls in the groups of children in need and in care, and this is most markedly so in the short-term care group.
Table 1.2: Mean KS4 Points (and SD), by Need Group and Gender
Girls Boys
Not on the 2012-13 CIN or CLA databases353.54 (84.35)
N = 303,869328.27 (93.60)
N = 319,101
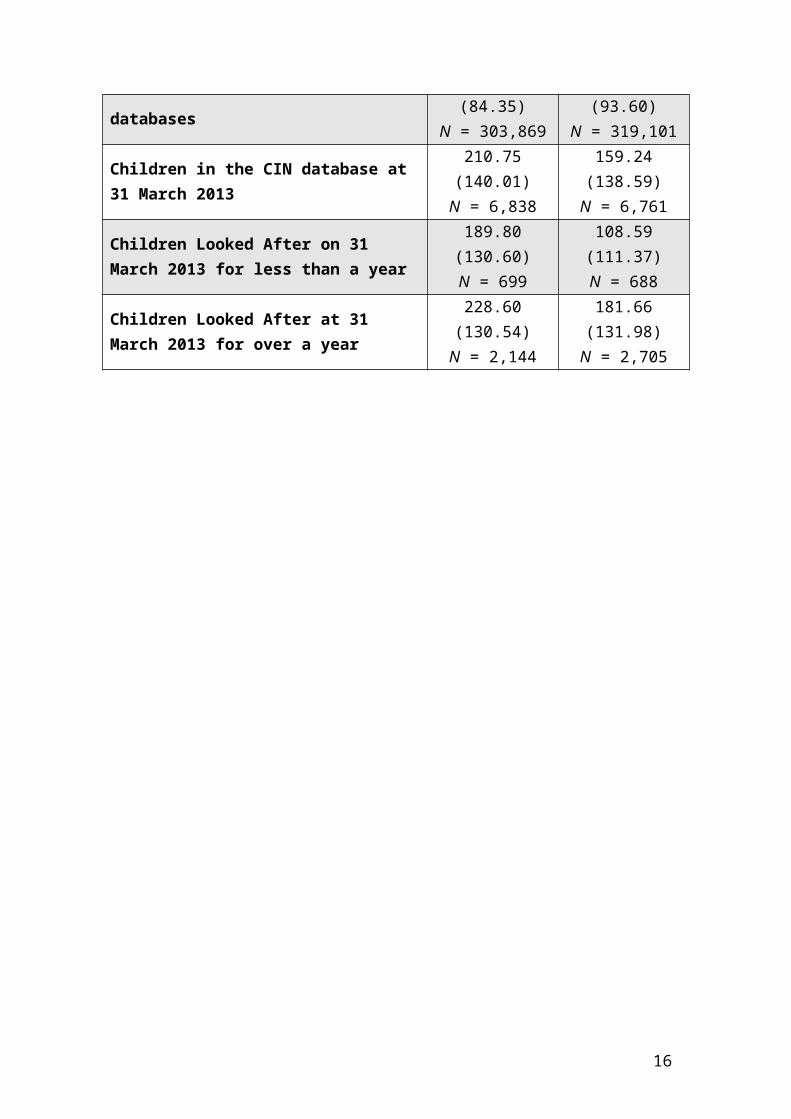
Children in the CIN database at 31 March 2013210.75 (140.01)
N = 6,838159.24 (138.59)
N = 6,761Children Looked After on 31 March 2013 for less than a year
189.80 (130.60)N = 699
108.59 (111.37)N = 688
Children Looked After at 31 March 2013 for over a year
228.60 (130.54)N = 2,144
181.66 (131.98)N = 2,705
10
Ethnicity
There is considerable interest in the outcomes of different ethnic groups, with Steve Strand3 suggesting that White working class boys fare particularly poorly academically. It is also known that children from Traveller communities are the lowest-performing group in KS4 exams. We therefore compared the effect of ethnicity on KS4 results across the four groups. For reasons of parsimony, we grouped ethnicity into seven categories (including ‘not known’). We were guided in this grouping by the coefficients in CVA models produced by the DfE and by differing propensities in the model we fitted to being looked after. We neither attach special significance to the classification we arrived at nor attempt to interpret any of the coefficients causally.
There was a significant effect of ethnicity in all four groups with children from Traveller backgrounds consistently having the worst KS4 scores (as expected) and Asian/Black African children the best, F(6, 642777) = 64.208, p < .001, η2
p = .001. There was also an interaction between group status and ethnicity, F(18, 642777) = 37.10, p < .001, η2
p = .001.
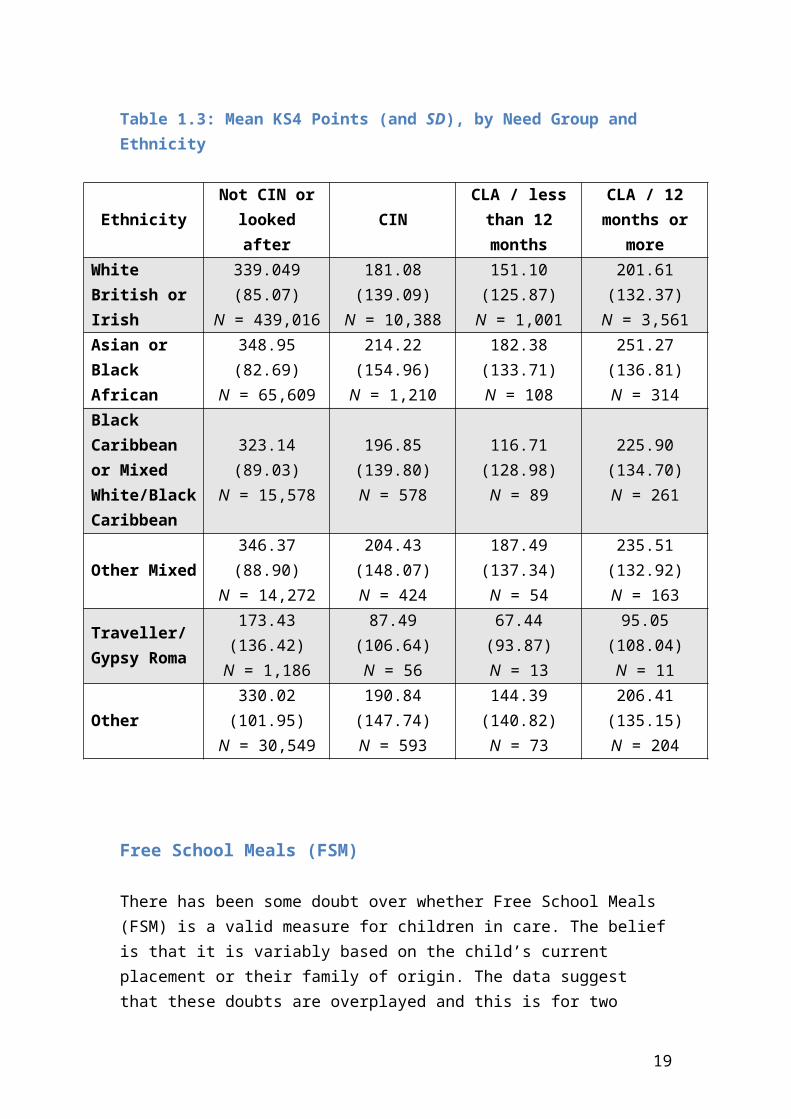
As Table 1.3 shows, all ethnic groups had worse scores in the in need and CLA categories than in the larger cohort. In particular, young people from Traveller backgrounds and White British children in care had the poorest performance relative to their non-care peers. Black Caribbean and Mixed White / Black Caribbean children in the CLA less than 12 months group appeared to perform relatively worse than children of the same ethnicity in other groups.
3 Strand, S. (2014) Ethnicity, gender, social class and achievement gaps at age 16: Intersectionality and
‘Getting it’ for the white working class Research Papers In Education 29(2):131-171
11
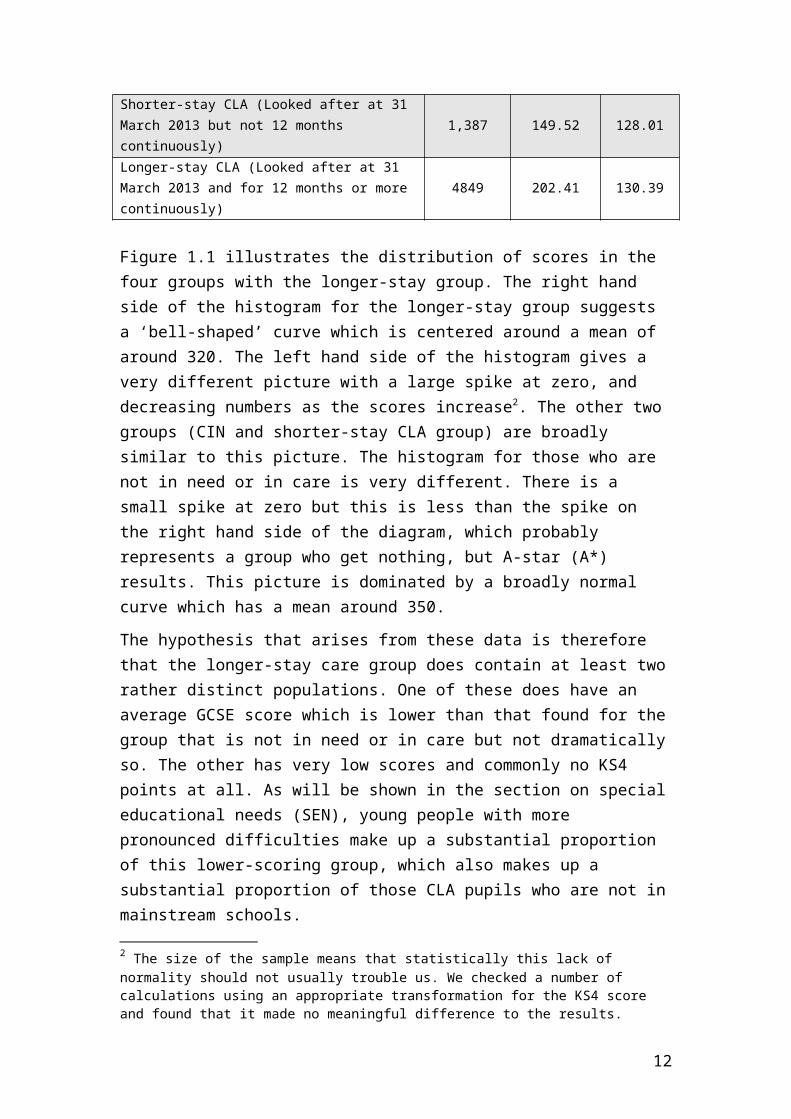
Table 1.3: Mean KS4 Points (and SD), by Need Group and Ethnicity
EthnicityNot CIN or
looked afterCIN
CLA / less than 12 months
CLA / 12 months or more
White British or Irish
339.049 (85.07)N = 439,016
181.08 (139.09)N = 10,388
151.10 (125.87)N = 1,001
201.61 (132.37)N = 3,561
Asian or Black African
348.95 (82.69)N = 65,609
214.22 (154.96)N = 1,210
182.38 (133.71)N = 108
251.27 (136.81)N = 314
Black Caribbean or Mixed White/Black Caribbean
323.14 (89.03)N = 15,578
196.85 (139.80)N = 578
116.71 (128.98)N = 89
225.90 (134.70)N = 261
Other Mixed346.37 (88.90)
N = 14,272204.43 (148.07)
N = 424187.49 (137.34)
N = 54235.51 (132.92)
N = 163Traveller/Gypsy Roma
173.43 (136.42)N = 1,186
87.49 (106.64)N = 56
67.44 (93.87)N = 13
95.05 (108.04)N = 11
Other330.02 (101.95)
N = 30,549190.84 (147.74)
N = 593144.39 (140.82)
N = 73206.41 (135.15)
N = 204
Free School Meals (FSM)
There has been some doubt over whether Free School Meals (FSM) is a valid measure for children in care. The belief is that it is variably based on the child’s current placement or their family of origin. The data suggest that these doubts are overplayed and this is for two reasons. As described later, this is partly because children who are being looked after are very much less likely to be FSM eligible. It is also because, as seen below and later, it is significantly related to outcome in ways that would be unlikely if it was simply ‘noise’.
We looked at FSM status at both KS1 and KS4. In our sample of interest two thirds of those who were not yet looked after were eligible for FSM in 2004, a figure that compares with 16 per cent for the whole cohort. In 2013 when all the sample of interest were officially looked after only 9 per cent were eligible for free school meals and some of these were living with their parents on a care order. By contrast 13 per cent of the full sample were eligible for FSM.
There was a significant effect of FSM eligibility at KS4 across all four groups F(1, 574737) = 307.06 p < .001, η2
p = .001, and an interaction between this variable and
12

group status, F(3, 574737) = 387.89, p < .001, η2p = .002. Free School Meals Status at
KS4 made little difference to the KS4 score for children in need, whereas for the other 3 groups, children and young people eligible for Free School Meals did worse.
Table 1.4: Mean KS4 points (and SD), by Need Group and FSM Eligibility at KS4
Not CIN or looked after
CINCLA / less than
12 monthsCLA / 12 months
or more
FSM300.70 (100.32)
N = 81,340195.01 (137.04)
N = 5,801168.71 (129.82)
N = 469206.62 (133.78)
N = 483
Not FSM352.18 (72.07)
N = 476,538197.18 (146.30)
N = 6,384191.64 (130.29)
N = 539243.90 (123.15)
N = 3,191
There was also a significant effect of FSM eligibility at KS1, F(1, 565143) = 172.42.26 p < .001, η2
p < .001, and an interaction between this variable and group status, F(3, 565143) = 429.67, p < .001, η2
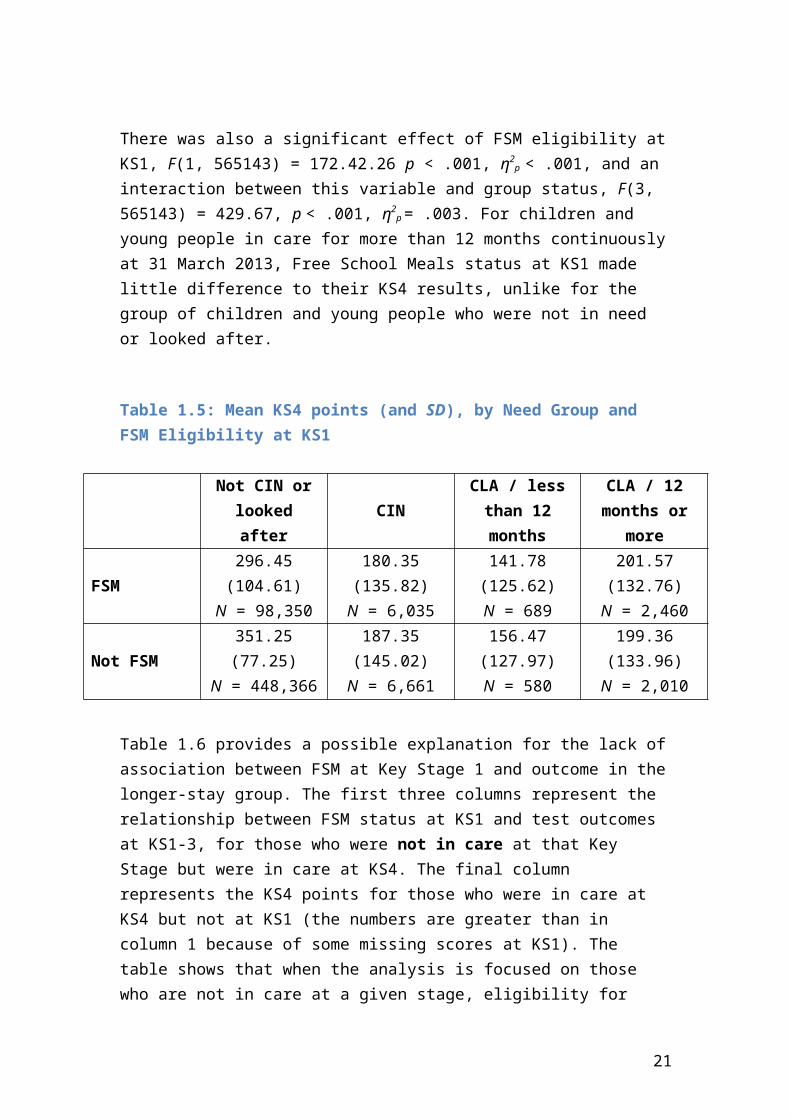
p = .003. For children and young people in care for more than 12 months continuously at 31 March 2013, Free School Meals status at KS1 made little difference to their KS4 results, unlike for the group of children and young people who were not in need or looked after.
Table 1.5: Mean KS4 points (and SD), by Need Group and FSM Eligibility at KS1
Not CIN or looked after
CINCLA / less than
12 monthsCLA / 12 months
or more
FSM296.45 (104.61)
N = 98,350180.35 (135.82)
N = 6,035141.78 (125.62)
N = 689201.57 (132.76)
N = 2,460
Not FSM351.25 (77.25)
N = 448,366187.35 (145.02)
N = 6,661156.47 (127.97)
N = 580199.36 (133.96)
N = 2,010
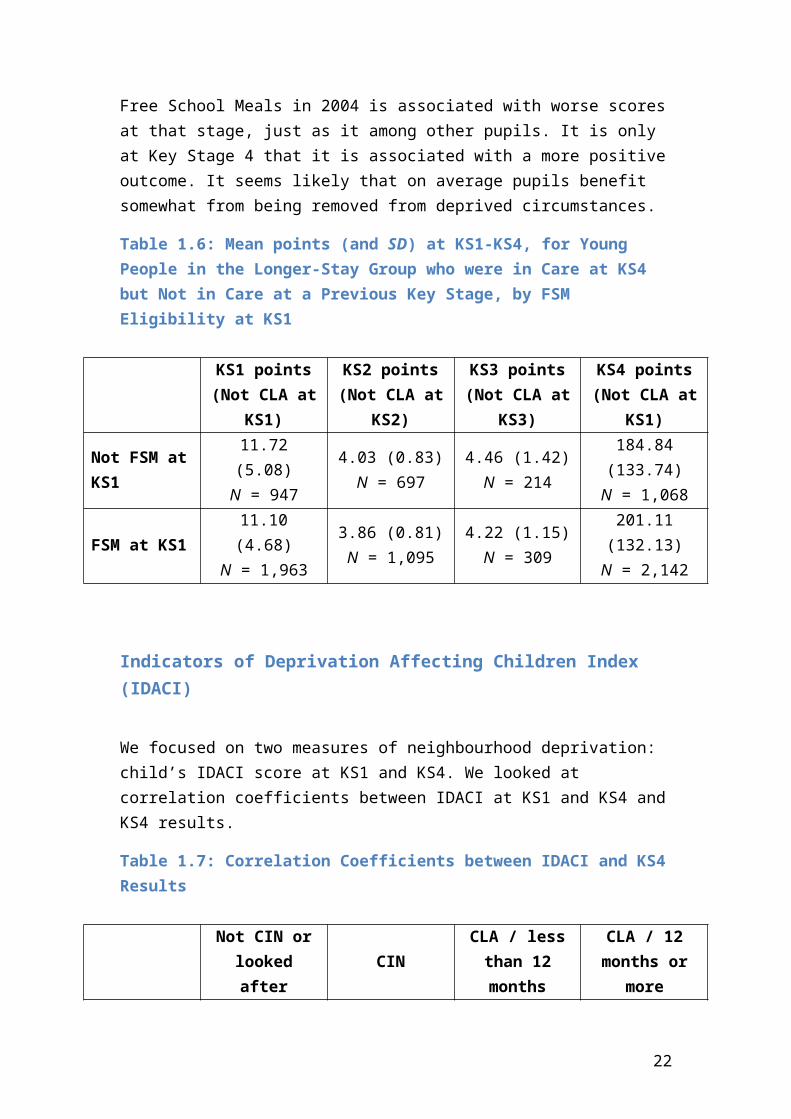
Table 1.6 provides a possible explanation for the lack of association between FSM at Key Stage 1 and outcome in the longer-stay group. The first three columns represent the relationship between FSM status at KS1 and test outcomes at KS1-3, for those who were not in care at that Key Stage but were in care at KS4. The final column represents the KS4 points for those who were in care at KS4 but not at KS1 (the numbers are greater than in column 1 because of some missing scores at KS1). The table shows that when the analysis is focused on those who are not in care at a given stage, eligibility for Free School Meals in 2004 is associated with worse scores at that stage, just as it among other pupils. It is only at Key Stage 4 that it is associated with
13
a more positive outcome. It seems likely that on average pupils benefit somewhat from being removed from deprived circumstances.
Table 1.6: Mean points (and SD) at KS1-KS4, for Young People in the Longer-Stay Group who were in Care at KS4 but Not in Care at a Previous Key Stage, by FSM Eligibility at KS1
KS1 points(Not CLA at KS1)
KS2 points(Not CLA at KS2)
KS3 points(Not CLA at KS3)
KS4 points(Not CLA at KS1)
Not FSM at KS111.72 (5.08)
N = 9474.03 (0.83)
N = 6974.46 (1.42)
N = 214184.84 (133.74)
N = 1,068
FSM at KS111.10 (4.68)
N = 1,9633.86 (0.81)N = 1,095
4.22 (1.15)N = 309
201.11 (132.13)N = 2,142
Indicators of Deprivation Affecting Children Index (IDACI)
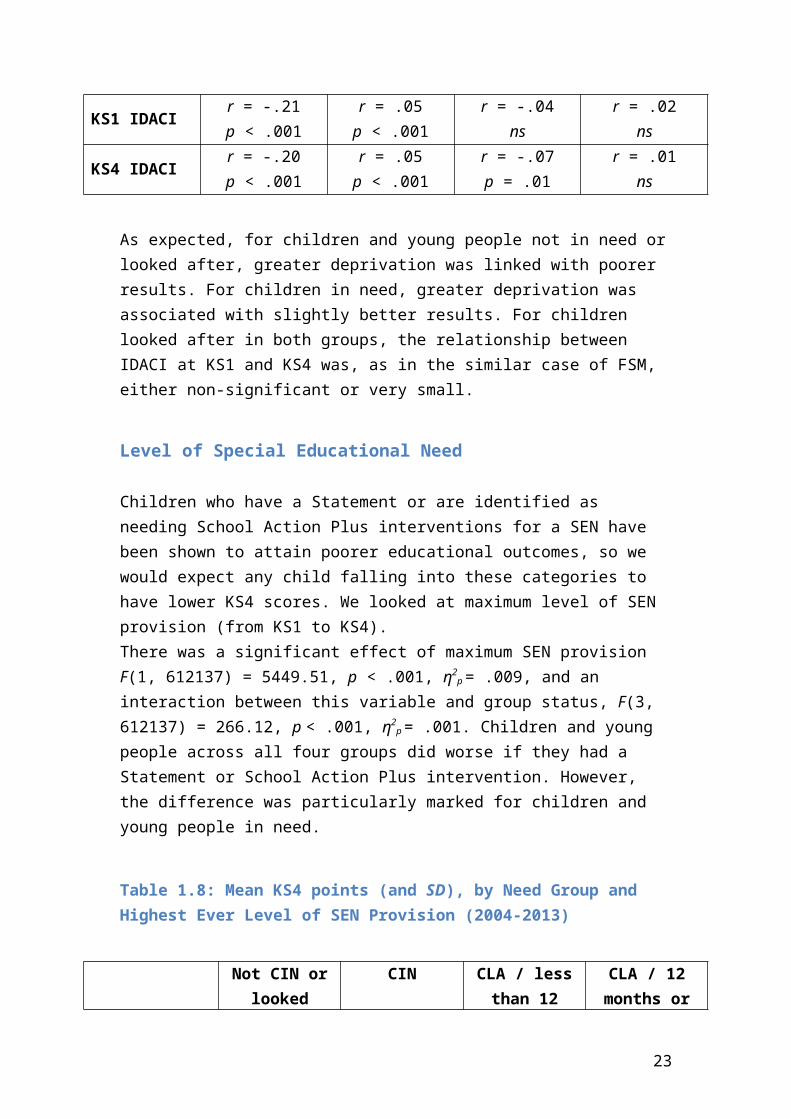
We focused on two measures of neighbourhood deprivation: child’s IDACI score at KS1 and KS4. We looked at correlation coefficients between IDACI at KS1 and KS4 and KS4 results.
Table 1.7: Correlation Coefficients between IDACI and KS4 Results
Not CIN or looked after
CINCLA / less than
12 monthsCLA / 12 months
or more
KS1 IDACIr = -.21p < .001
r = .05p < .001
r = -.04ns
r = .02ns
KS4 IDACIr = -.20p < .001
r = .05p < .001
r = -.07p = .01
r = .01ns
As expected, for children and young people not in need or looked after, greater deprivation was linked with poorer results. For children in need, greater deprivation was associated with slightly better results. For children looked after in both groups, the relationship between IDACI at KS1 and KS4 was, as in the similar case of FSM, either non-significant or very small.
Level of Special Educational Need
14
Children who have a Statement or are identified as needing School Action Plus interventions for a SEN have been shown to attain poorer educational outcomes, so we would expect any child falling into these categories to have lower KS4 scores. We looked at maximum level of SEN provision (from KS1 to KS4). There was a significant effect of maximum SEN provision F(1, 612137) = 5449.51, p < .001, η2
p = .009, and an interaction between this variable and group status, F(3, 612137) = 266.12, p < .001, η2
p = .001. Children and young people across all four groups did worse if they had a Statement or School Action Plus intervention. However, the difference was particularly marked for children and young people in need.
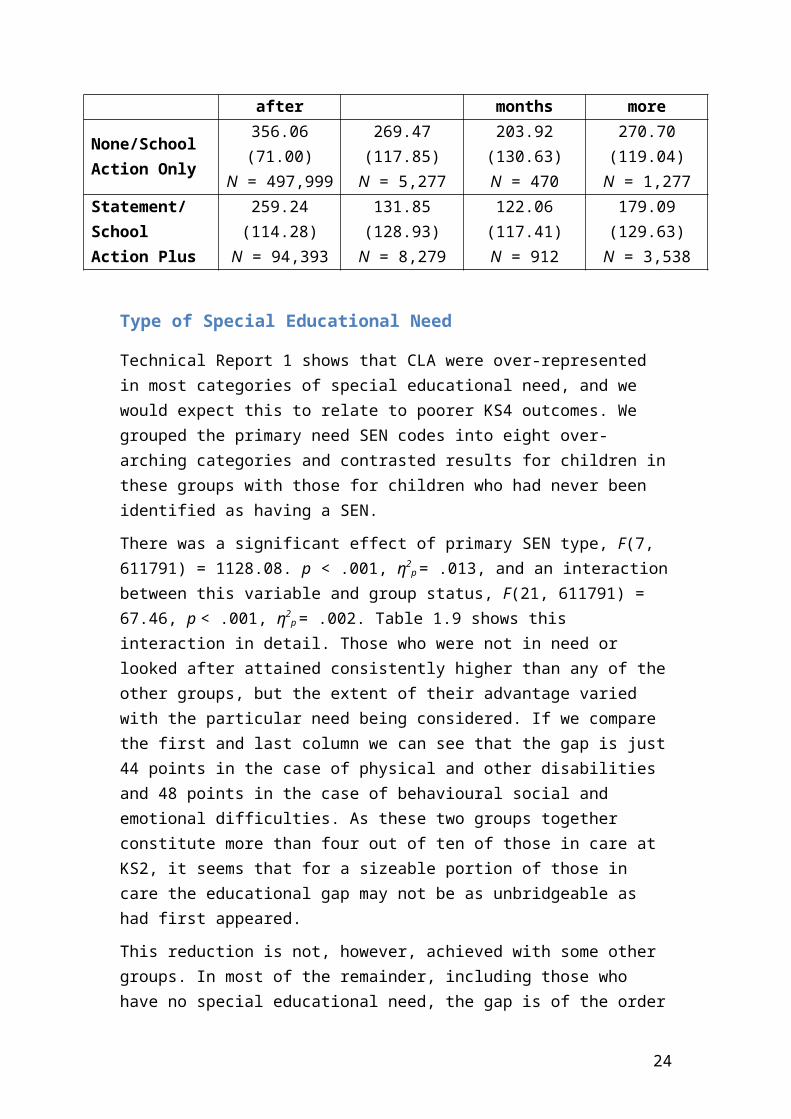
Table 1.8: Mean KS4 points (and SD), by Need Group and Highest Ever Level of SEN Provision (2004-2013)
Not CIN or looked after
CINCLA / less than
12 monthsCLA / 12
months or moreNone/School Action Only
356.06 (71.00)N = 497,999
269.47 (117.85)N = 5,277
203.92 (130.63)N = 470
270.70 (119.04)N = 1,277
Statement/School Action Plus
259.24 (114.28)N = 94,393
131.85 (128.93)N = 8,279
122.06 (117.41)N = 912
179.09 (129.63)N = 3,538
Type of Special Educational Need
Technical Report 1 shows that CLA were over-represented in most categories of special educational need, and we would expect this to relate to poorer KS4 outcomes. We grouped the primary need SEN codes into eight over-arching categories and contrasted results for children in these groups with those for children who had never been identified as having a SEN.
There was a significant effect of primary SEN type, F(7, 611791) = 1128.08. p < .001, η2
p = .013, and an interaction between this variable and group status, F(21, 611791) = 67.46, p < .001, η2
p = .002. Table 1.9 shows this interaction in detail. Those who were not in need or looked after attained consistently higher than any of the other groups, but the extent of their advantage varied with the particular need being considered. If we compare the first and last column we can see that the gap is just 44 points in the case of physical and other disabilities and 48 points in the case of behavioural social and emotional difficulties. As these two groups together constitute more than four out of ten of those in care at KS2, it seems that for a sizeable portion of those in care the educational gap may not be as unbridgeable as had first appeared.
15
This reduction is not, however, achieved with some other groups. In most of the remainder, including those who have no special educational need, the gap is of the order of 60 to 80 points, considerably less than the original 140 points but sizeable nonetheless.
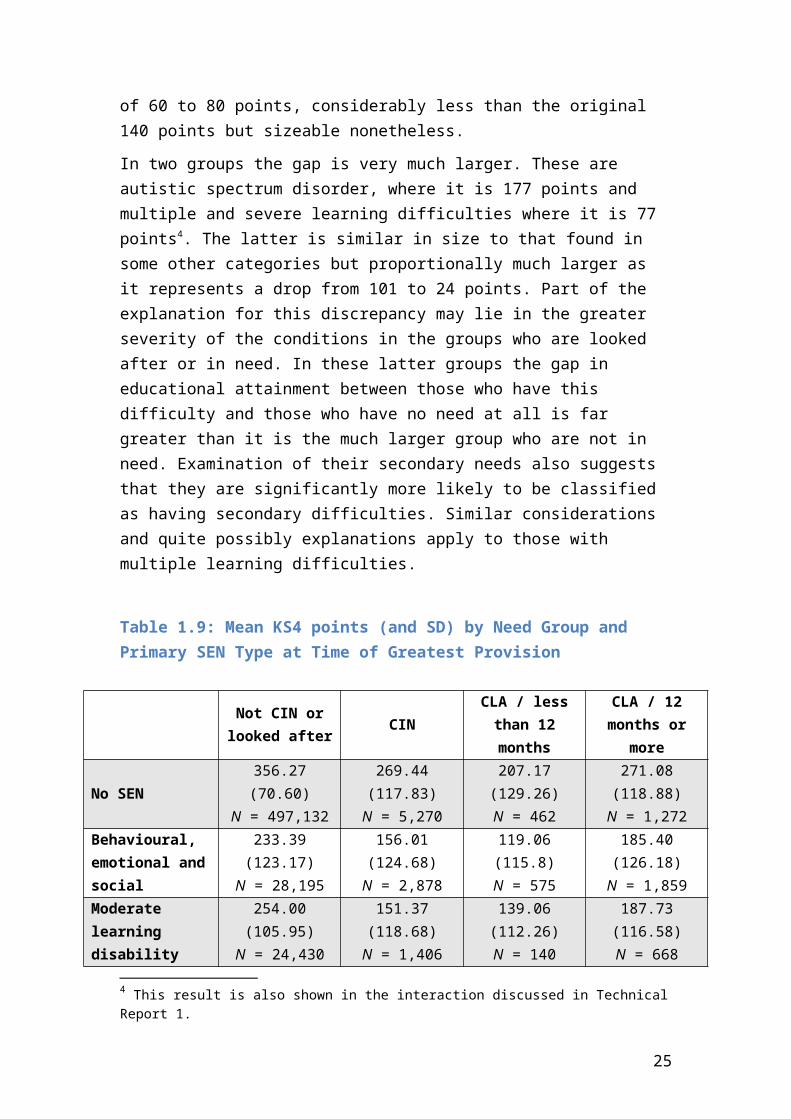
In two groups the gap is very much larger. These are autistic spectrum disorder, where it is 177 points and multiple and severe learning difficulties where it is 77 points4. The latter is similar in size to that found in some other categories but proportionally much larger as it represents a drop from 101 to 24 points. Part of the explanation for this discrepancy may lie in the greater severity of the conditions in the groups who are looked after or in need. In these latter groups the gap in educational attainment between those who have this difficulty and those who have no need at all is far greater than it is the much larger group who are not in need. Examination of their secondary needs also suggests that they are significantly more likely to be classified as having secondary difficulties. Similar considerations and quite possibly explanations apply to those with multiple learning difficulties.
Table 1.9: Mean KS4 points (and SD) by Need Group and Primary SEN Type at Time of Greatest Provision
Not CIN or looked after
CINCLA / less than 12
monthsCLA / 12 months
or more
No SEN356.27 (70.60)
N = 497,132269.44 (117.83)
N = 5,270207.17 (129.26)
N = 462271.08 (118.88)
N = 1,272Behavioural, emotional and social
233.39 (123.17)N = 28,195
156.01 (124.68)N = 2,878
119.06 (115.8)N = 575
185.40 (126.18)N = 1,859
Moderate learning disability
254.00 (105.95)N = 24,430
151.37 (118.68)N = 1,406
139.06 (112.26)N = 140
187.73 (116.58)N = 668
Specific learning disability
290.49 (88.45)N = 14,676
202.92 (120.78)N = 452
153.55 (108.93)N = 35
228.97 (114.79)N = 176
Speech, language and communication
289.72 (97.51)N = 9,243
172.68 (125.56)N = 310
154.85 (136.33)N = 18
204.87 (118.10)N = 128
Autistic spectrum disorder
260.71 (125.20)N = 6,195
98.79 (122.04)N = 992
80.92 (114.39)N =45
82.90 (112.07)N = 186
Severe or multiple learning difficulties
101.74 (124.60)N = 1,698
13.12 (38.76)N = 1,336
20.59 (39.03)N = 40
24.71 (58.27)N = 224
Physical, sensory and other disabilities
298.54 (102.41)N = 10,510
187.68 (138.21)N = 911
182.37 (127.40)N = 59
254.83 (119.02)N = 302
4 This result is also shown in the interaction discussed in Technical Report 1.
16
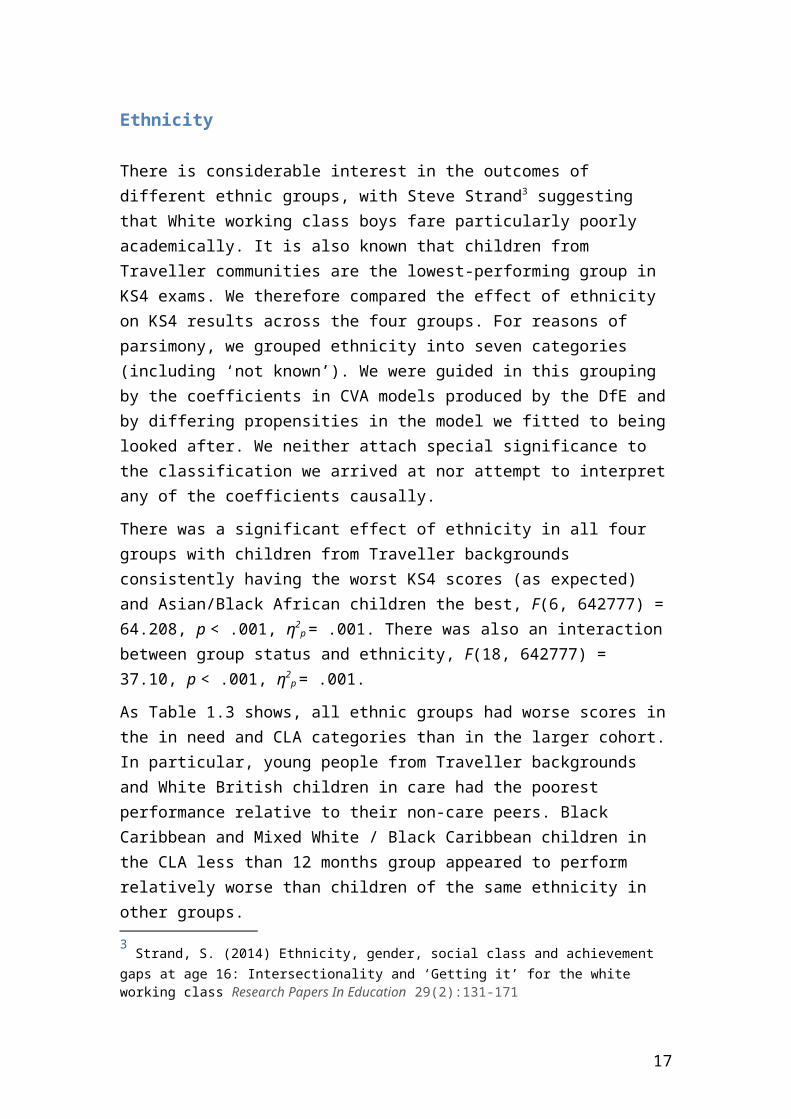
Table 1.9 has a number of other interesting features. First, those who are looked after for a brief time do worse in every category than those who are looked after for longer. Second, with the exception of children with ASD, those who are looked after longer term do consistently better than those who are in need but never looked after at all.
Does the Gap between Children in Care and Others increase over time?
It is widely believed that the educational gap between looked after children and others increases over time with the position of children in care worsening relative to that of the others. The NPD analysis has cast doubt on this belief in two ways. First, it suggests that when like is compared with like, children who are in need fare worse educationally than children who have spent a year or more in the care system. Second, it shows that children who are in need begin at Key Stage 1 by scoring slightly worse than the ‘longer-stay care group’, perform much the same at Key Stage 2, and noticeably worse by Key Stage 4.
Figure 1.2 essentially repeats this NPD analysis but with two differences. First we compare five groups rather than the four. This allows us to compare a longer-staying group who entered before KS2 with a group of later entrants who had still been looked after for a continuous 12 months at KS4 but were nevertheless not in care at KS2. Second, we made it easier to compare pupils’ relative positions at different stages by using standardised scores5.
At KS2 stage just over half (53%) of the longer-stay group were already looked after (Early-entry CLA group). The outcomes of the longer-stay group as a whole will reflect changes in the performance of this early entrant group and also the arrival of later entrants whose performance may be less affected by the care system. Distinguishing between these groups helps to disentangle these issues6.
Two main points stand out from Figure 1.2. First, the educational gap starts young. All four groups in need or in care were already doing far worse educationally at KS1 than those pupils who were not in need or in care. In the great majority of cases this gap existed long before the pupils ever entered care if indeed they did so. This matters since later success seems to build on a platform of earlier success7.
5Each score has a grand mean of 0 and a standard deviation of one, to which we added 1.5 in order to allow for easier comparisons. This addition does not affect the trends but does ensure that they do not have to be examined both above and below the x-axis.6 Changes that result from some young people leaving the care system after Key Stage 2 cannot be assessed with our data, as we cannot identify this group.7 In the sample of interest the correlations between successive scores are .79 (KS1 with KS2), 81 (KS2 with KS3) and .65 (KS3 with KS4)
17

Second, two groups – those not in need or in care, and those in care at KS2 (the ‘early-entrant’ longer-stay group) – improve relative to the others. The other three groups all experience a relative decline. This strongly suggests (though clearly it does not prove) that longer-term care benefits education rather than the reverse.
Figure 1.2 Changes in Standardised Test Scores by Need Group
In keeping with findings from Technical Report 1, the most dramatic decline was in those who were in care at the census date but had been so for less than 12 months (shorter-stay CLA). Their initial scores at KS1 were the highest of all the groups other than those who were not in need or in care at all. By the time of KS4 they scored the worst. A rather similar but less dramatic pattern was found with those who came into care after KS2 but had been in care for at least 12 months by March 2013 (late-entry CLA group). Their initial scores were relatively high but their position steadily declined over time. Arguably both groups were experiencing a worsening situation at home, which in the end led to some of them entering the care system. This does not, of course, mean that improvement may not be possible after their arrival in the care system. As we will see, it is likely that this does indeed occur. In many cases, however, the major educational damage may have already been done and there was probably too little time to do much by way of repair.
In some ways the most interesting comparison was between the children in need who were never in care (CIN group) and the children who were already looked after
18
at Key Stage 2 and were then in care for at least 12 months by March 2013 (early-entry CLA group). The relative educational performance of the CIN who remained in the community (rather than being in care) declined steadily over time. At Key Stage 1 they were slightly better positioned than the early-entry CLA group, at Key Stage 2 they performed less well than the early-entry CLA group, and their relative position worsened over Key Stages 3 and 4. By contrast and apart from a slight blip at Key Stage 38 those who were already in care at Key Stage 2 steadily improved their relative position9.
As a final check on this analysis we looked at the performance of those in care at a particular stage relative to those who were not but were in one of the other need groups. We did this for Key Stages 2, 3 and 4, and allowed for the score of the preceding stage. We found that at every stage those who were in care at that stage did significantly better than those who were yet to enter care or who were part of our final CIN group.10
Schools
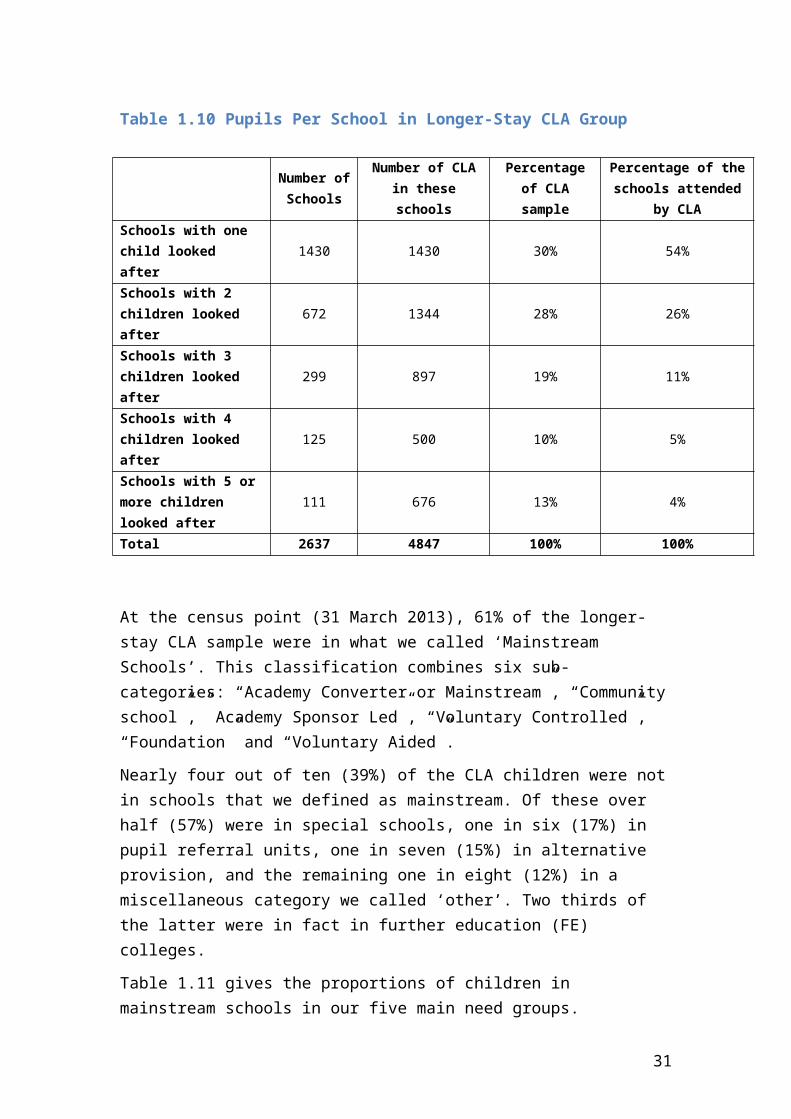
The analysis in Technical Report 1 included data from 5722 schools. Just over half (53%) of these had no longer-stay CLA pupils in Year 11. Table 1.10 gives the distribution of the remainder. Even in this group more than half (58%) have no more than two such pupils.
8 See the NPD analysis for an explanation of the difficulties of comparing Key Stages 2 and 3.9 We checked this conclusion using a regression analysis in which we entered ‘in care at Key Stage 2’ as a dummy variable and included Key Stage 2 scores as independent predictors. The Key Stage 2 score contains a high number of missing values and as explained in the NPD analysis it had an artificial floor of 2.5. For this reason we created a categorical variable which had missing and 2.5 as separate categories and then a further nine roughly equal groups in ascending order of Key Stage 2 scores. We entered this categorical variable into the regression using ‘missing’ as the reference group. This analysis supported the conclusion that being in care long-term was protective. In a further test we re-ran the tables on which Figure 1 is based omitting those who were classified as having Autistic Spectrum Disorder or Multiple or Severe Learning Disabilities. The NPD analysis had shown that these two groups were more common among the CIN than those in care and we wished to check that this difference had not affected the result. Removal of these young people from the analysis had little effect on the results apart from smoothing the relative improvement among the longer-stay group, so that their scores at Key Stage 3 were better than at Key Stage 2.10 This analysis cannot be done for KS1 as there is no KS0 score.
19
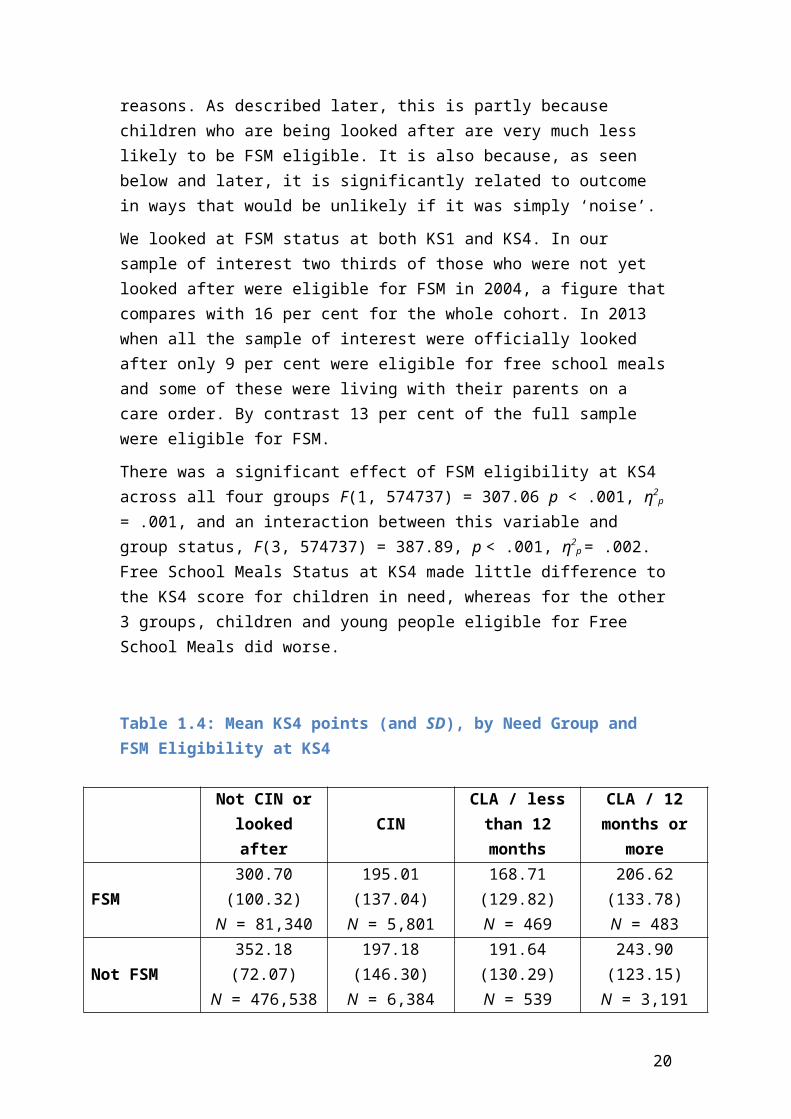
Table 1.10 Pupils Per School in Longer-Stay CLA Group
Number of Schools
Number of CLA in these schools
Percentage of CLA sample
Percentage of the schools attended by CLA
Schools with one child looked after
1430 1430 30% 54%
Schools with 2 children looked after
672 1344 28% 26%
Schools with 3 children looked after
299 897 19% 11%
Schools with 4 children looked after
125 500 10% 5%
Schools with 5 or more children looked after
111 676 13% 4%
Total 2637 4847 100% 100%
At the census point (31 March 2013), 61% of the longer-stay CLA sample were in what we called ‘Mainstream Schools’. This classification combines six sub-categories: “Academy Converter or Mainstream”, “Community school”,” Academy Sponsor Led”, “Voluntary Controlled”, “Foundation” and “Voluntary Aided”.
Nearly four out of ten (39%) of the CLA children were not in schools that we defined as mainstream. Of these over half (57%) were in special schools, one in six (17%) in pupil referral units, one in seven (15%) in alternative provision, and the remaining one in eight (12%) in a miscellaneous category we called ‘other’. Two thirds of the latter were in fact in further education (FE) colleges.
Table 1.11 gives the proportions of children in mainstream schools in our five main need groups.
Table 1.11 Need Groups at KS4 by whether in a Mainstream School
In Mainstream SchoolNo Yes
Neither CLA nor CIN 11% 89%CIN 35% 66%
Shorter-stay CLA 41% 59%Longer-stay Late-entry CLA 41% 59%Longer-stay Early-entry CLA 36% 64%
Total 12% 88%
20
Two thirds of the 11% who are not in need or looked after, and not in mainstream schools, as we defined them, were in independent schools. If children in independent schools are omitted, 96% of those who are not in need or looked after were in mainstream schools and 4% were in other types of schools. Omitting the independent schools hardly changes the other proportions in Table 1.11. Thus, the proportions of children in need or looked after who were not in mainstream school is far higher (by a factor of 8 to 10) than other children.
The gap between the results of those in mainstream and non-mainstream schools was much greater than that between those who were and were not looked after. Table 1.12 sets out the results by our main need groups.
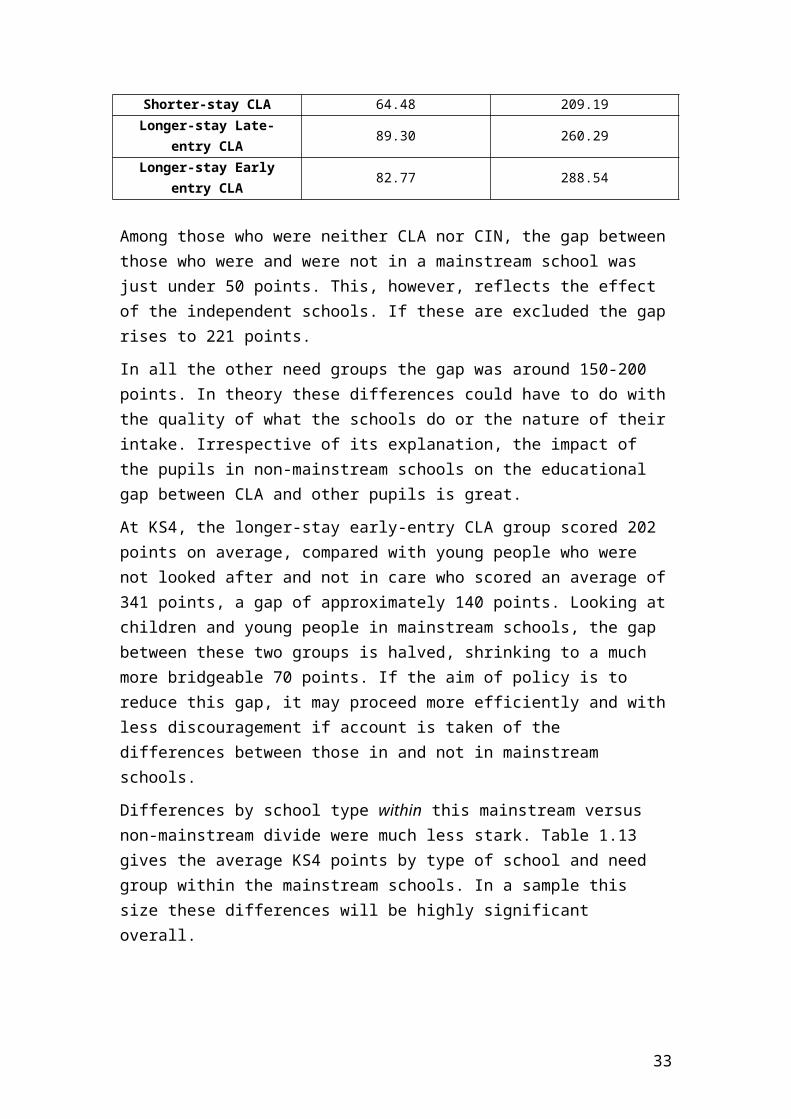
Table 1.12 Average KS4 Points by Need Groups and Whether in Mainstream Schools
Mainstream schoolNo Yes
Neither CLA nor CIN 297.32 346.06CIN 57.35 252.50
Shorter-stay CLA 64.48 209.19Longer-stay Late-entry CLA 89.30 260.29Longer-stay Early entry CLA 82.77 288.54
Among those who were neither CLA nor CIN, the gap between those who were and were not in a mainstream school was just under 50 points. This, however, reflects the effect of the independent schools. If these are excluded the gap rises to 221 points.
In all the other need groups the gap was around 150-200 points. In theory these differences could have to do with the quality of what the schools do or the nature of their intake. Irrespective of its explanation, the impact of the pupils in non-mainstream schools on the educational gap between CLA and other pupils is great.
At KS4, the longer-stay early-entry CLA group scored 202 points on average, compared with young people who were not looked after and not in care who scored an average of 341 points, a gap of approximately 140 points. Looking at children and young people in mainstream schools, the gap between these two groups is halved, shrinking to a much more bridgeable 70 points. If the aim of policy is to reduce this gap, it may proceed more efficiently and with less discouragement if account is taken of the differences between those in and not in mainstream schools.
Differences by school type within this mainstream versus non-mainstream divide were much less stark. Table 1.13 gives the average KS4 points by type of school and
21
need group within the mainstream schools. In a sample this size these differences will be highly significant overall.
Table 1.13 Need Group, average KS4 Score and Type of Mainstream School
School type at KS4Neither CLA
nor CINCIN
Shorter-stay CLA
Longer-stay Late-entry CLA
Longer-stay Early-entry CLA
Academy-Converter Mainstream
357.28 261.97 217.00 263.23 292.83
Voluntary Aided School
351.58 268.38 234.01 266.22 293.29
Voluntary Controlled School
343.85 258.08 208.80 222.30 262.93
Community School 339.02 247.34 199.85 251.77 281.88Foundation School 334.83 243.22 197.15 254.32 276.70Academy-Sponsor Led
334.38 244.91 213.86 279.11 301.83
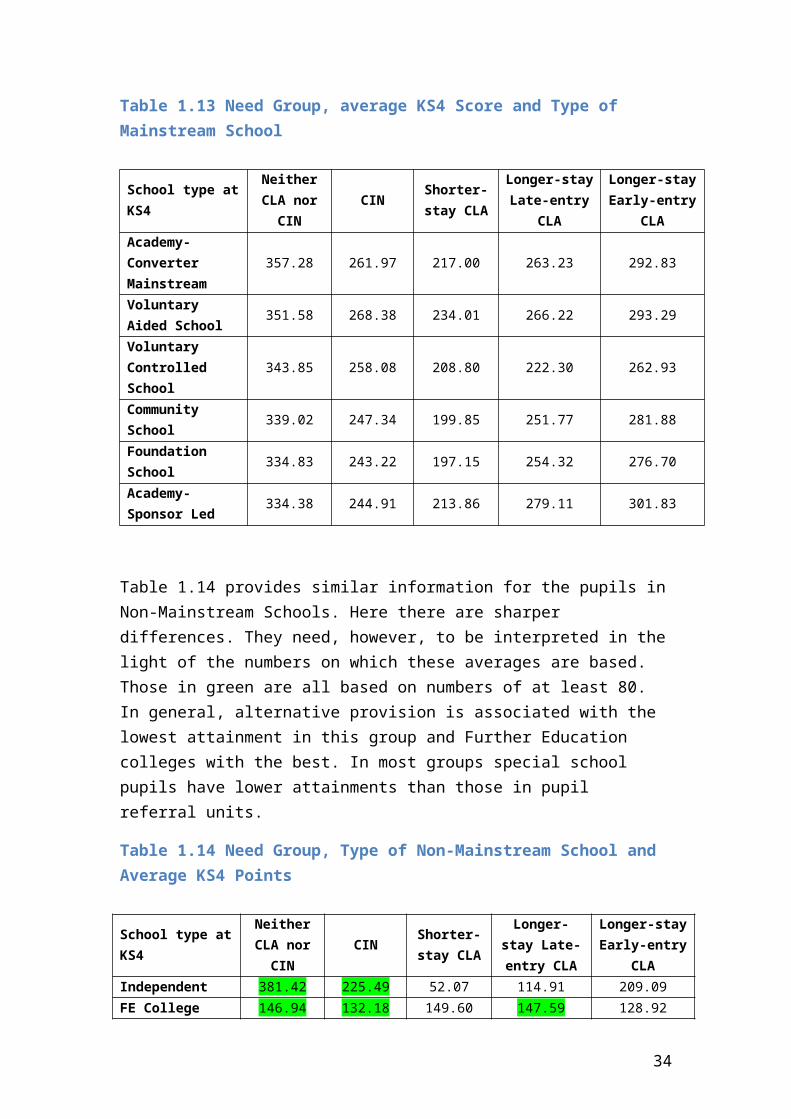
Table 1.14 provides similar information for the pupils in Non-Mainstream Schools. Here there are sharper differences. They need, however, to be interpreted in the light of the numbers on which these averages are based. Those in green are all based on numbers of at least 80. In general, alternative provision is associated with the lowest attainment in this group and Further Education colleges with the best. In most groups special school pupils have lower attainments than those in pupil referral units.
Table 1.14 Need Group, Type of Non-Mainstream School and Average KS4 Points
School type at KS4Neither CLA
nor CINCIN
Shorter-stay CLA
Longer-stay Late-entry CLA
Longer-stay Early-entry CLA
Independent 381.42 225.49 52.07 114.91 209.09FE College 146.94 132.18 149.60 147.59 128.92Pupil Referral Unit 104.72 82.02 73.20 94.69 63.07Special School 99.01 43.01 57.48 90.31 88.40Secure Unit 84.85 108.36 70.37 71.89 66.79Alternative Provision
78.59 35.75 35.98 37.87 22.71
The clear outlier is the average of 381 points based on over 47 000 pupils in the Independent sector. As explained earlier, these pupils account for the relatively good performance of non-CIN children in non-mainstream schools. However, our definition of schools as ‘mainstream or other’ has the effect of putting together Public (Independent) Schools with Pupil Referral Units.
22
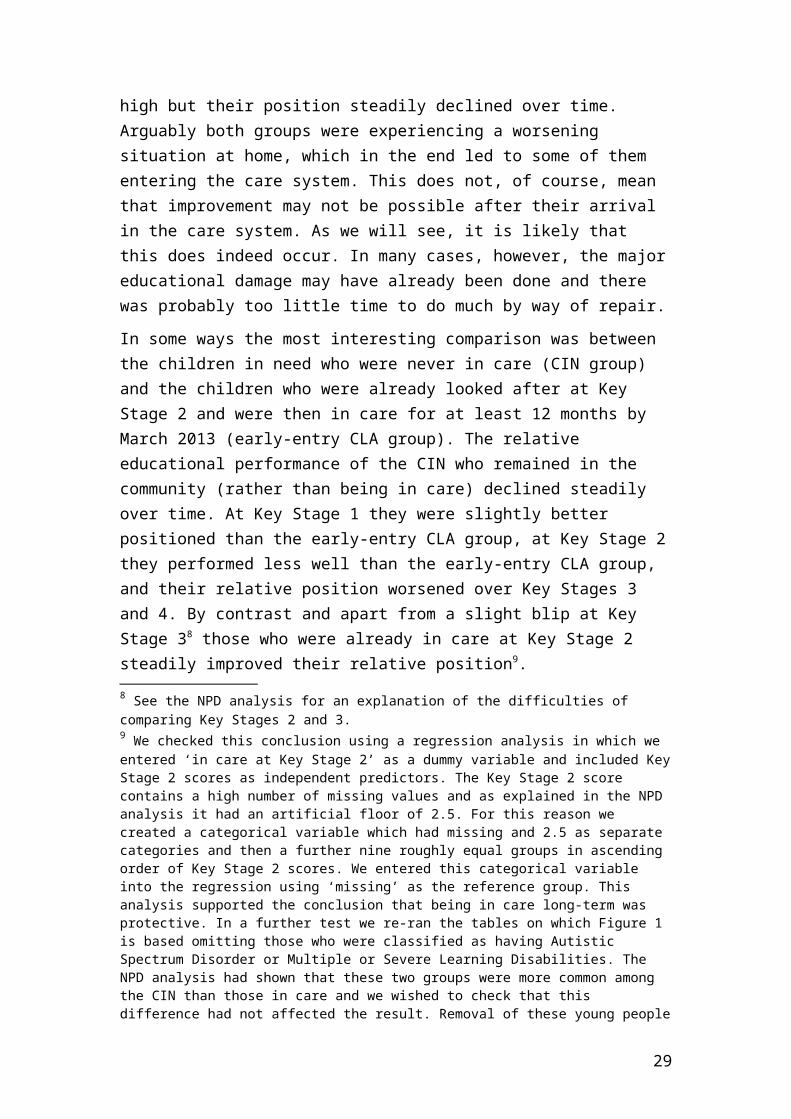
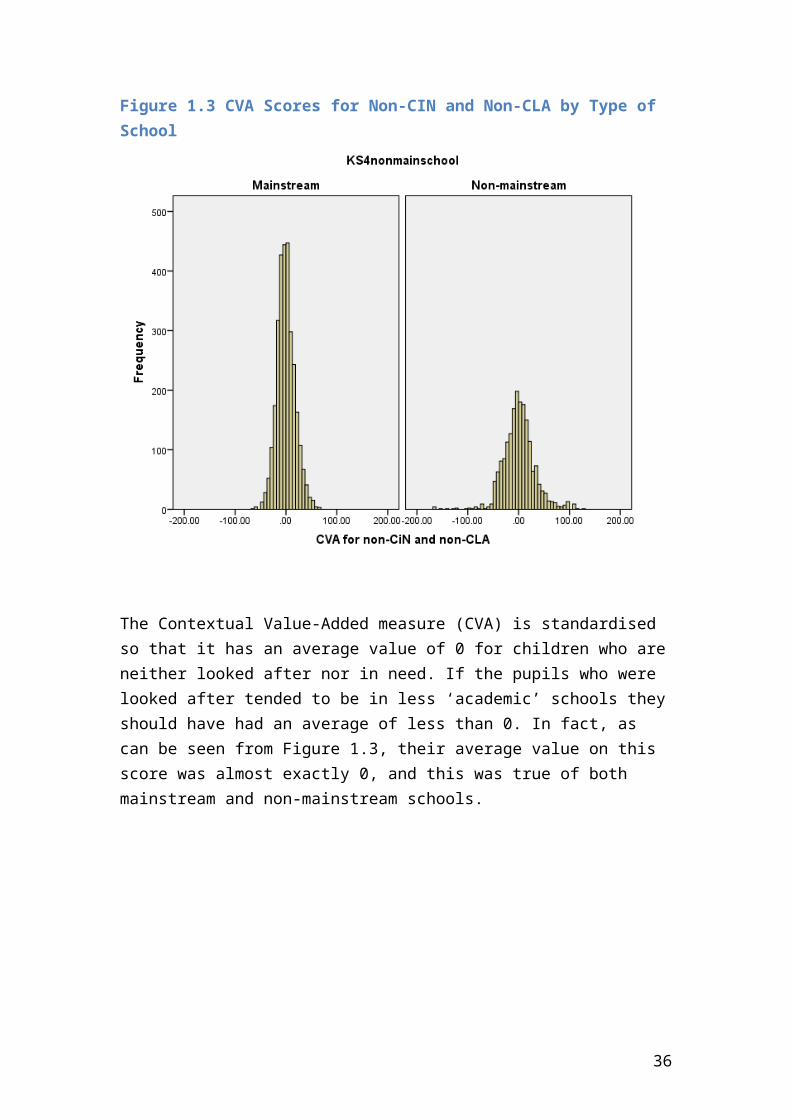
Our final question in this section concerns the issue of whether children looked after in our sample of interest went to schools which were, as far as other pupils were concerned, more or less likely to result in higher than expected attainment at KS4. The NPD multi-level analysis in Technical Report 1 gave us estimates of value added for all the schools attended by our sample of interest. One of these measures was simply an estimate of the amount that pupils in a given school who were not in need might be expected to do better or worse than similar pupils in other schools. We used this measure as an indicator of more or less ‘academic’ schools, and as will be seen it held up well in our later analysis. Figure 1.3 gives the distribution of this school measure among the pupils in our sample of interest (the longer-stay CLA group).
Figure 1.3 CVA Scores for Non-CIN and Non-CLA by Type of School
The Contextual Value-Added measure (CVA) is standardised so that it has an average value of 0 for children who are neither looked after nor in need. If the pupils who were looked after tended to be in less ‘academic’ schools they should have had an average of less than 0. In fact, as can be seen from Figure 1.3, their average value on this score was almost exactly 0, and this was true of both mainstream and non-mainstream schools.
23
24
Part 1 Summary and Conclusion
Taken together these findings show:
There is a range of outcomes among children in need and children in care. Whereas there is evidence that many looked after children perform with the normal range, albeit with a somewhat depressed mean KS4 score, the overall average is made much lower by a sizeable minority of children who have very low scores or no score at all.
In keeping with this, almost four out of ten of the looked after children go to non-mainstream schools and their educational attainments are far lower than those of the six in ten who go to mainstream ones.
Despite the evidence that looked after children are less likely to go to mainstream schools the evidence does not suggest that within school types they go to schools that are associated with poorer educational outcomes for children who are not in need.
Similar contrasts are found with special educational needs which are far more common among children who are looked after and associated with large differences in outcome. The ‘gap’ in attainment between those in need or looked after and others is considerably reduced if allowance is made for special educational need.
Other variables that are strongly associated with outcome in these analyses are gender, ethnicity, and receipt of free school meals.
Irrespective of the variable being considered, the relative educational performance of the different analytic groups tends to be constant. The comparison group (neither in care nor CIN) performs best, the longer-stay CLA group comes next and is followed by Children in Need, and then the shorter-stay CLA group.
The average performance of the longer-stay CLA group masks differences according to when young people first entered the care system. Those who had been in care at KS2 and were also in care at KS4 (the early-entry longer-stay group) had better outcomes than those who had been in care for at least 12 months at KS4 but who had not been in care at KS2 (the late-entry longer-stay group).
Similar contrasts are observed in changes in educational performance over time. The comparison group improves their position relative to others; so too does the early-entry longer-stay CLA group. The educational performance of the late-entry longer-stay CLA group worsens relative to that of these others
25
but slightly less so than the CIN, and noticeably less so than the shorter-stay CLA group.
All this suggests that care may be protective, with early admission to care being associated with consistently better outcomes than found with other need groups in the same categories. It may benefit later admissions but it does not fully reverse the damage that may have been done.
These considerations only partly explain the gap between the performance of children in care and those who are not in need. By taking account of sub-groups it is much reduced but remains nevertheless. This makes it highly likely that much of this gap is related to experiences which are common in this group, uncommon in the general population and not measured in the NPD. The next section focusses on these variables, available through the SSDA903 CLA dataset.
26
Part 2: Addressing the Questions in the Original bid
Part 2 of this report focuses on the specific questions listed in the original bid, using regression analysis to examine the relative contribution of the complex differences in young people’s characteristics and experiences. The questions provide an explanatory framework for looked after children’s KS4 results. This begins with factors associated with the individual and their early environment (starting with those that are routinely recorded for all children and on which the full-cohort analyses were based) and moves on to add in the child’s experiences of (in)stability and features of their later environment.
In seeking to answer these questions we did not rely exclusively on regression analysis but used other techniques when these seemed appropriate. Almost invariably, however, we have used regression as a final step. Our overall analyses looked at the variables in blocks, taking into account individual, environmental and care variables in predicting KS4 results.
We subsequently used a path analysis model to identify the potential pathways through which these factors are linked to KS4 outcomes; this is presented in Part 3 of this report.
Method
As a reminder, our main sample of interest (N = 4847) consists of all those children at KS4 in 2013 who: had been in care for 12 months or more had not been exclusively in short-term respite placements
These criteria are in line with those used by the DfE for their CLA statistical releases.
Table notation
The following notation is followed throughout:
n = sample size with available data* significant at p < .05** significant at p < .01*** significant at p < .001
Green shading indicates that a predictor in the regression has a significant positive relationship with KS4 results (i.e. a higher value is related to higher KS4 scores).
27
Orange shading indicates that a predictor in the regression has a significant negative relationship with KS4 results (i.e. a higher value is related to lower KS4 scores).
28
RESEARCH QUESTION 1: What are the associations between individual characteristics such as gender, ethnicity, SEN, socio-economic status and educational outcomes for children in care (Flynn et al. 2013)?
We examined the characteristics of the individual and their early environment that either cannot be or are less likely to be influenced by experiences in care (see Appendix A for information about the decision not to analyse the FSM6_KS4 variable in the CLA sample). Table 2.1 summarises the results of the resulting multiple regression both before and after controlling for KS2 scores (using the mean across three tests).
Table 2.1: Regression model for mean KS4 points by individual characteristics
Not Controlling for KS2 (R2 = .230) After Controlling for KS2 (R2 = .322)
B SE B B SE B
Constant 297.836 14.322 46.535 17.742
KS2 3-Test Average 57.899 2.486 0.371***
Gender (1 = Female, 2 = Male) -22.225 3.666 -0.083*** -17.561 3.611 -0.065***
Ethnicity (reference group: White)
Asian or Black African 26.185 10.813 0.048* 36.968 10.644 0.068**
Black Caribbean or Mixed White/Black Caribbean 22.420 7.927 0.038** 9.367 7.816 0.016
Other Mixed 28.161 10.066 0.038** 22.147 9.903 0.030*
Traveller -97.684 37.063 -0.035** -67.059 36.475 -0.024
Other -9.262 9.213 -0.014 -1.923 9.067 -0.003
Ethnicity Unknown -75.939 7.074 -0.144*** -66.203 6.970 -0.126***
Primary Special Educational Need (reference group: none)
Autistic Spectrum Disorder -174.284 9.845 -0.251*** -99.661 10.199 -0.144***
Behavioural, Emotional and Social -74.309 4.551 -0.271*** -48.197 4.614 -0.176***
Moderate Learning Disability -73.994 5.906 -0.191*** -11.988 6.389 -0.031
Physical, Sensory and Other Disabilities -13.855 7.847 -0.025 6.290 7.766 0.011
Severe or Multiple Learning Difficulties -237.716 8.973 -0.374*** -130.229 9.959 -0.205***
Specific Learning Disability -32.781 9.908 -0.046** 10.864 9.923 0.015
Speech, Language and Communication -58.770 11.400 -0.071*** 0.445 11.496 0.001
29
Eligible for FSM at 2004 census (KS1) -5.004 3.823 -0.019 -1.481 3.763 -0.006
Local deprivation index 2004 (KS1 IDACI) -1.630 9.695 -0.002 2.469 9.536 0.004
Home language other than English at 2004 census (KS1) 4.280 12.612 0.007 -10.376 12.420 -0.016
Adding the KS2 score to the model increased the variance explained from 23 to 32 per cent. This is a small increase in comparison with similar analyses for ‘ordinary children’ – see Technical Report 1, pp.11-12 on ‘Progressive Attainment’ for an explanation of this.
Some of the variables – notably gender, Asian/Black African ethnicity, severe or multiple learning difficulties, autistic spectrum disorders and BESD – were related to both progress and outcome in a similar or more extreme way to that found among other children.
The relationship between other SEN variables (e.g. specific learning disability) and outcome changed after we allowed for KS2 scores and did not have a negative relationship with progress. Arguably this was because their contribution was now discounted. Similarly, children from Traveller families were at no greater disadvantage once KS2 results had been taken into account.
By contrast, variables denoting early social disadvantage (e.g. FSM at Key Stage 1) were not related to outcome in the CLA sample as they may be among the larger cohort. We have already discussed some reasons why this may be so.
Being socially disadvantaged almost certainly increases the risk of entering the care system. Among those who do this, however, progress is more closely related to gender and more particularly the presence or otherwise of other particular individual needs.
We left these individual variables in the model, as they would normally form part of a contextual value added (CVA) model for the general population. In trying to answer the questions in the bid, our analyses retain these variables.
In crude terms Table 2.1 answers the research question about the role of gender, ethnicity, SEN, socio-economic status and educational outcomes.
Our next step was to add in ‘career type’, which seeks to capture the age at which children first enter care and the reason for which they do so. The majority of our sample of interest (77.4%) had only had one period in care (i.e. had entered care and remained), so for most of them their age at their first entry to care (on which career type is based) was the same as their age at latest entry to care. Both of these variables had a range from 0-16 years, a median entry age of 10 years and a modal
30
entry age of 14 years. The means of these variables were also very close, with the mean for age at first entry being 9.10 years and that at latest entry 9.68 years.
Career type is also something which the Care System has to take as a given of a child’s situation. Its association with outcome is given in Table 2.2.
The reference group in this analysis is the children who entered before Key Stage 2. As can be seen, all the other groups do worse than this group of early entrants (with the exception of unaccompanied asylum seeking children, once KS2 results are taken into account). One likely reason for the ‘widening gap’ between CLA and others after KS2 is probably the entry to care after this stage of children who are disaffected and do particularly badly both in absolute terms and (with the exception of those seeking asylum) in terms of progress.
Variables that were significant predictors of KS4 results in Table 2.1 remained significant once career type was added in Table 2.2.
Conclusion on Research Question 1
In general the data suggest that addressing the research question, gender and some forms of SEN (ASD, BESD, severe/multiple learning difficulties) are associated with poor KS4 scores among looked after children. Social disadvantage at Key Stage 1 is associated with being looked after, but among this sample of looked after children it is not associated with educational outcome. With the exception of unaccompanied asylum seeking children (once KS2 results are taken into account), early entrants into care (aged under 10) do better than all other groups (older entrants and those with disabilities).
31
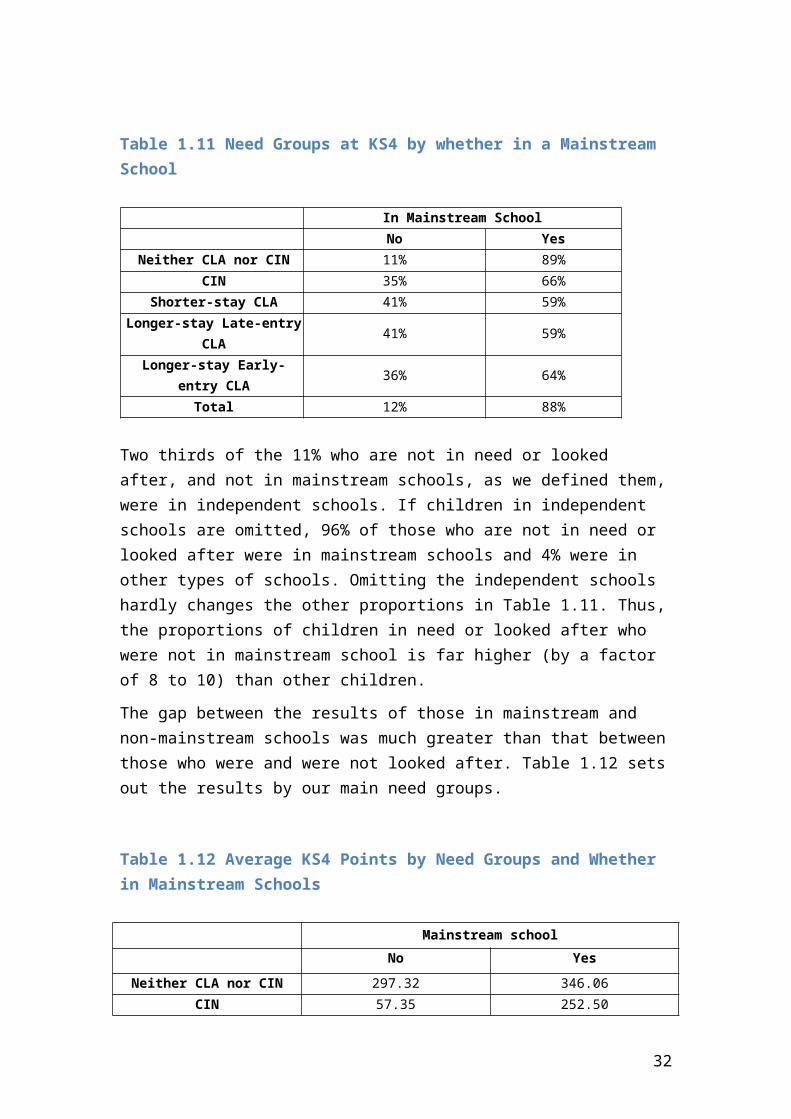
Table 2.2: Regression model for mean KS4 points by individual characteristics and care career types
Not Controlling for KS2 (R2 = .260) After Controlling for KS2 (R2 = .343)
B SE B B SE B
Constant 324.066 15.084 69.669 18.680
KS2 3-Test Average 56.053 2.485 0.359***
Gender (1 = Female, 2 = Male) -22.350 3.646 -0.083*** -19.457 3.601 -0.072***
Ethnicity (reference group: White)
Asian or Black African 37.709 12.268 0.069** 33.909 12.112 0.062**
Black Caribbean or Mixed White/Black Caribbean 17.389 7.794 0.029* 4.452 7.716 0.008
Other Mixed 28.433 9.944 0.038** 20.800 9.822 0.028*
Traveller -96.623 36.372 -0.034** -69.842 35.925 -0.025
Other 1.146 10.288 0.002 -3.561 10.158 -0.005
Ethnicity Unknown -71.922 6.973 -0.137*** -64.584 6.891 -0.123***
Primary Special Educational Need (reference group: none)
Autistic Spectrum Disorder -141.574 10.452 -0.204*** -79.087 10.683 -0.114***
Behavioural, Emotional and Social -75.453 4.524 -0.275*** -48.293 4.625 -0.176***
Moderate Learning Disability -77.539 5.840 -0.200*** -16.001 6.378 -0.041*
Physical, Sensory and Other Disabilities -15.039 7.731 -0.027 4.447 7.680 0.008
Severe or Multiple Learning Difficulties -200.728 10.001 -0.316*** -108.298 10.690 -0.170***
Specific Learning Disability -36.211 9.740 -0.051*** 7.558 9.809 0.011
Speech, Language and Communication -57.882 11.194 -0.070*** -0.612 11.339 -0.001
Eligible for FSM at 2004 census (KS1) -1.978 3.795 -0.007 1.554 3.749 0.006
Local deprivation index 2004 (KS1 IDACI) -7.806 9.527 -0.012 -2.108 9.408 -0.003
Home language other than English at 2004 census (KS1) -2.580 13.407 -0.004 -5.713 13.236 -0.009
Care Career Type (reference groups: entry aged 0-4/5-9)
Adolescent Entrant (Abuse/Neglect) -20.672 4.463 -0.066*** -19.737 4.406 -0.063***
Adolescent Entrant (Other Reasons) -43.847 4.601 -0.135*** -43.697 4.542 -0.134***
Entered Care as UASC -41.072 12.246 -0.056** -9.794 12.168 -0.013
Entered Care due to Disability -92.079 8.832 -0.169*** -65.847 8.796 -0.121***
32
RESEARCH QUESTION 2: Is the finding suggesting the longer the duration of care the higher the attainment robust or is this explained by the reasons for entry into care or age of admission - those entering the care system later bringing with them a different set of behavioural and related issues (DfE 2011)?
First, we confirmed that length of time in care was indeed related to KS4 results. We divided length of time in care into thirds for ease of illustration, but all correlations reported here use the continuous variable of time in care (excluding respite). Roughly speaking, the three groups represent means of 2 years (743.82 days) in care, 5 years (1933.05 days) in care and 11 years (3954.76 days) in care.
There was a correlation between length of time in care (excluding respite) and KS4 points, r(4847) = .109, p < .001. So although significant, the relationship was not substantial. Splitting the continuous variable into thirds showed that there was no difference in KS4 scores for those who had been in care in the medium- and long-term, but that both did better than those in care only in the short-term, even after controlling for KS2 results:
Figure 2.1: Mean KS4 points by total time in care, controlling for KS2 results
33
We wondered whether the weak relationship between time in care and KS4 points was due to differences between children first entering care owing to abuse compared to those entering for other reasons, or to differences across the six career types.
Figure 2.2: Mean KS4 points by total time in care and reason for first entry, controlling for KS2 results
First, abuse vs. other: Figure 2.2 shows that although children who come in for reasons other than abuse (e.g. behaviour, family stress or disability) did worse overall, the gap was smaller for those who had been in care longer. At first sight it looks as though spending a long time in care has more benefit for those who are in for reasons other than abuse/neglect. The pattern, however, is difficult to interpret. The abused children who spent a very long time in care will have entered when they were under 5, an age group for which the main reason for entry to care is abuse or neglect. The majority of those who enter under this age go home, become adopted or leave the system in other ways such as special guardianship. It cannot therefore be assumed that those who remain in care till they reach Key Stage 4 are typical and they may well be a group ‘selected’ because they exhibit difficult behaviour or other problems.
We looked to see whether the ‘kink’ in this graph was due to the fact that the effect of being in care had been taken out by taking account of KS2 scores – Figure 2.3 shows the pattern without KS2 scores. As can be seen the pattern is even more pronounced.
34
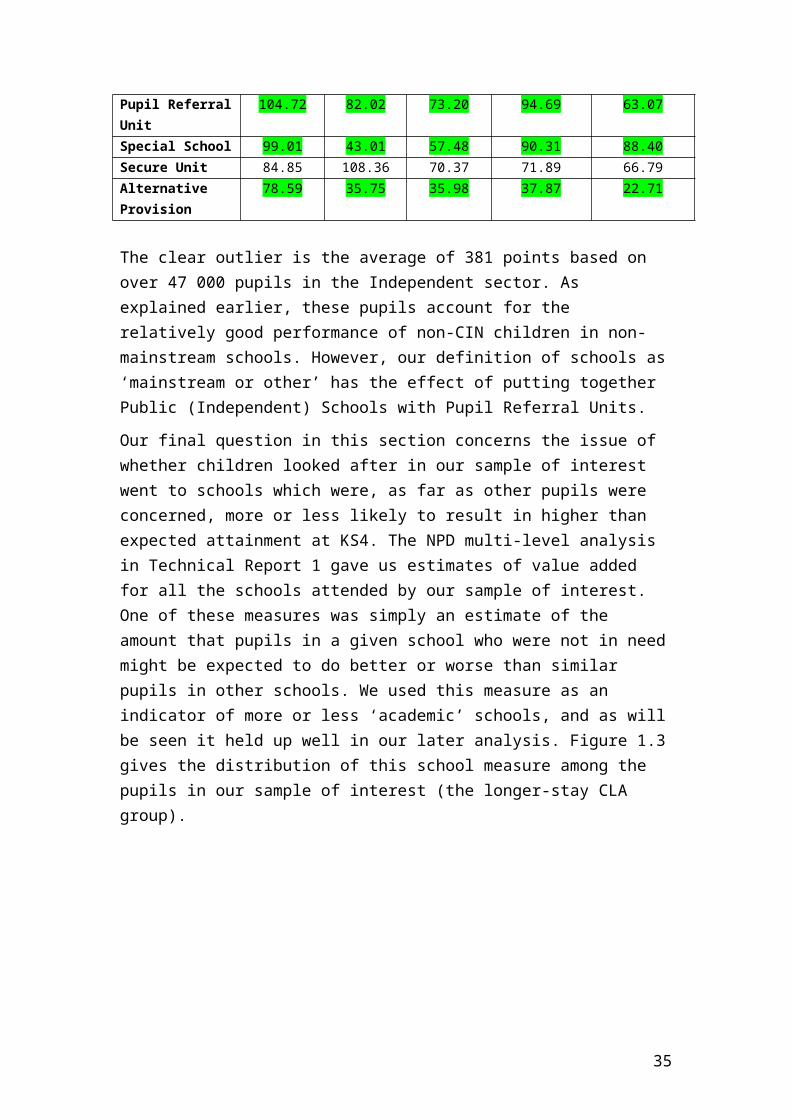
Figure 2.3: Mean KS4 points by total time in care and reason for first entry, not controlling for KS2 results
Second, the career types analysis. Table 2.3 shows the adjusted mean KS4 points, first taking into account only KS2 average as a covariate, then with both KS2 points and length of time in care as covariates.
Table 2.3: Estimated marginal means (and standard errors) for KS4 points by career type
Controlling for KS2Controlling for KS2 and
Time in Care
Mean KS4 Points Mean KS4 Points
1. Entry Aged 0-4 225.452 (4.414) 202.920 (6.922)
2. Entry Aged 5-9 230.604 (3.044) 223.662 (3.455)
3. Adolescent Entrant (Abuse/Neglect) 213.961 (3.500) 224.983 (4.362)
4. Adolescent Entrant (Other Reasons) 181.725 (3.754) 194.365 (4.797)
5. Entered Care as UASC 338.418 (24.581) 337.306 (24.534)
6. Entered Care due to Disability 128.565 (7.593) 134.16 (7.693)
35
The first set of results (controlling only for KS2 scores) suggest that children who have predominantly entered care from abusive environments (categories 1,2 and 3) tend to do better than others such as Adolescent entrants (category 4) who may have been selected because they were proving difficult to manage in the community, or the small group who entered for reasons of disability (category 6).
The second set of results show an effect of time in addition to that of career type. Effect sizes showed that career type (η2
p = .042) had greater explanatory power than time in care (η2
p = .004), but both were significant. Taking KS2 scores into account, individual characteristics (behaviour, disability) can be risk factors for poorer KS4 results, but it also matters how long a child has been in care. The major reason why Adolescent entrants do badly seems to be to do with their personal characteristics. However, they might also have achieved better had they been in care for longer.
This can further be seen in the Figure 2.4, which uses the categorical variable for length of time in care to illustrate how this interacts with career type:
Figure 2.4: Mean KS4 points by total time in care and career type, controlling for KS2 results
Figure 2.4 shows the positive association with length of time in care for all groups, with the exception of the 0-4s (and the UASC – but there were such small numbers in
36
longest-stay third of UASC that this is unreliable). For disabled children, length of time in care was less important.
To further illustrate the importance of career type when considering the relationship between length of time in care and KS4 results, Table 2.4 shows that length of time in care only correlated with KS4 results for the two Adolescent groups and the UASC:
Table 2.4: Correlations between length of time in care and KS4 points by career type
n r
Entry Aged 0-4 715 -.037
Entry Aged 5-9 1464 .047
Adolescent Entrant (Abuse/Neglect) 1161 .098**
Adolescent Entrant (Other Reasons) 1031 .116***
Entered Care as UASC 167 .394***
Entered Care due to Disability 309 -.017
Overall 4847 .109***
Restricting the analysis to those who had been in care for just the short- or medium-term (approx. 5 years) showed a positive correlation for all groups except disabled children:
Table 2.5: Correlations between length of time in care and KS4 points by career type, for short- and medium-term children only
n r
Entry Aged 0-4 54 .371**
Entry Aged 5-9 577 .126**
Adolescent Entrant (Abuse/Neglect) 1161 .098**
Adolescent Entrant (Other Reasons) 1031 .116***
Entered Care as UASC 159 .381***
Entered Care due to Disability 251 .021
Overall 3233 .141***
37
These analyses show that there was a relationship between age at entry and KS4 results that might explain the small correlation between time in care and KS4 results. This is accounted for by those entering care over the age of 9. Those who came into care after age 9 did better the earlier they came in.
Those who entered under the age of 10 did worst if they first entered young, left care and then came back and had only around 2 years in care in total (more data would be needed to fully test this out), but better if they had been in care for the medium length of time (mean of 5 years).
The very long-stay group (mean of 11 years in total), however, did not fare well. It could be that children caught up to a certain extent over the first five years and then the effect dropped off. This explanation fits with the fact that among those who were in care for up to 5 years, the longer children had been in care the better for their KS4 results. Alternatively this apparent relationship with length of stay could be explained by differences between those who leave the system and those who stay. For example, we have already suggested that in the long-stay group the ‘easier’ group could have returned home or been adopted or placed under a special guardianship order.
Finally, we added length of time in care to the model outlined under Research Question 1, which explained less than 1% of additional variance in KS4 scores compared to when only career type was included (35% of the variance after controlling for KS2; see Table 2.6). The only changes in relationships between predictors and KS4 results were that: being from a Traveller family predicted poorer results; and after controlling for time in care, being an Adolescent entrant due to abuse or neglect was no longer a risk factor.
Conclusion on Research Question 2
The DfE’s national figures suggest that children in care do worse relative to their peers at Key Stage 4 as compared to Key Stage 2. See Technical Report 1 for details of the KS2 scoring system, which is one potential reason for this. Our analyses here also suggest that alternative reasons for this are that (a) adolescents first entering care can often come in for reasons other than abuse or neglect, and are less likely to do well educationally; (b) they have had less time for any benefits to take effect; and (c) some ‘better performing’ children who entered at a younger age may have left the system, for example making successful returns to birth families or being adopted.
Overall, the analyses suggest that most groups did better by being in care for longer. The apparent effect of length of time in care is probably real but the average effect is not large and may vary over time and between groups.
38

Table 2.6: Regression model for mean KS4 points by individual characteristics and time in care
Not Controlling for KS2 (R2 = .262) After Controlling for KS2 (R2 = .347)
B SE B B SE B
Constant 302.063 16.323 38.323 19.816
KS2 3-Test Average 56.609 2.482 0.362***
Gender (1 = Female, 2 = Male) -23.110 3.648 -0.086*** -20.423 3.598 -0.076***
Ethnicity (reference group: White)
Asian or Black African 40.506 12.279 0.075** 37.536 12.106 0.069**
Black Caribbean or Mixed White/Black Caribbean 16.962 7.785 0.029* 3.765 7.697 0.006
Other Mixed 28.644 9.932 0.039** 21.001 9.797 0.028*
Traveller -97.281 36.326 -0.035** -70.439 35.833 -0.025*
Other 2.269 10.280 0.003 -2.137 10.137 -0.003
Ethnicity Unknown -71.934 6.964 -0.137*** -64.526 6.874 -0.123***
Primary Special Educational Need (reference group: none)
Autistic Spectrum Disorder -140.965 10.440 -0.203*** -77.669 10.660 -0.112***
Behavioural, Emotional and Social -75.435 4.518 -0.275*** -48.000 4.614 -0.175***
Moderate Learning Disability -78.154 5.835 -0.202*** -16.196 6.362 -0.042*
Physical, Sensory and Other Disabilities -15.564 7.722 -0.028* 3.953 7.661 0.007
Severe or Multiple Learning Difficulties -202.637 10.003 -0.319*** -109.882 10.668 -0.173***
Specific Learning Disability -36.545 9.728 -0.051*** 7.555 9.784 0.011
Speech, Language and Communication -58.480 11.182 -0.070*** -0.828 11.310 -0.001
Eligible for FSM at 2004 census (KS1) 1.477 3.916 0.006 6.115 3.866 0.023
Local deprivation index 2004 (KS1 IDACI) -7.086 9.517 -0.010 -1.108 9.386 -0.002
Home language other than English at 2004 census (KS1) -5.889 13.424 -0.009 -10.079 13.235 -0.016
Care Career Type (reference groups: entry aged 0-4/5-9)
Adolescent Entrant (Abuse/Neglect) -5.169 6.283 -0.017 0.581 6.199 0.002
Adolescent Entrant (Other Reasons) -26.902 6.674 -0.083*** -21.497 6.584 -0.066**
Entered Care as UASC -26.135 12.954 -0.036* 10.083 12.869 0.014
39
Entered Care due to Disability -79.174 9.560 -0.145*** -48.681 9.520 -0.089***
Length of Time in Care (Excluding Respite) 0.007 0.002 0.078*** 0.009 0.002 0.102***
40
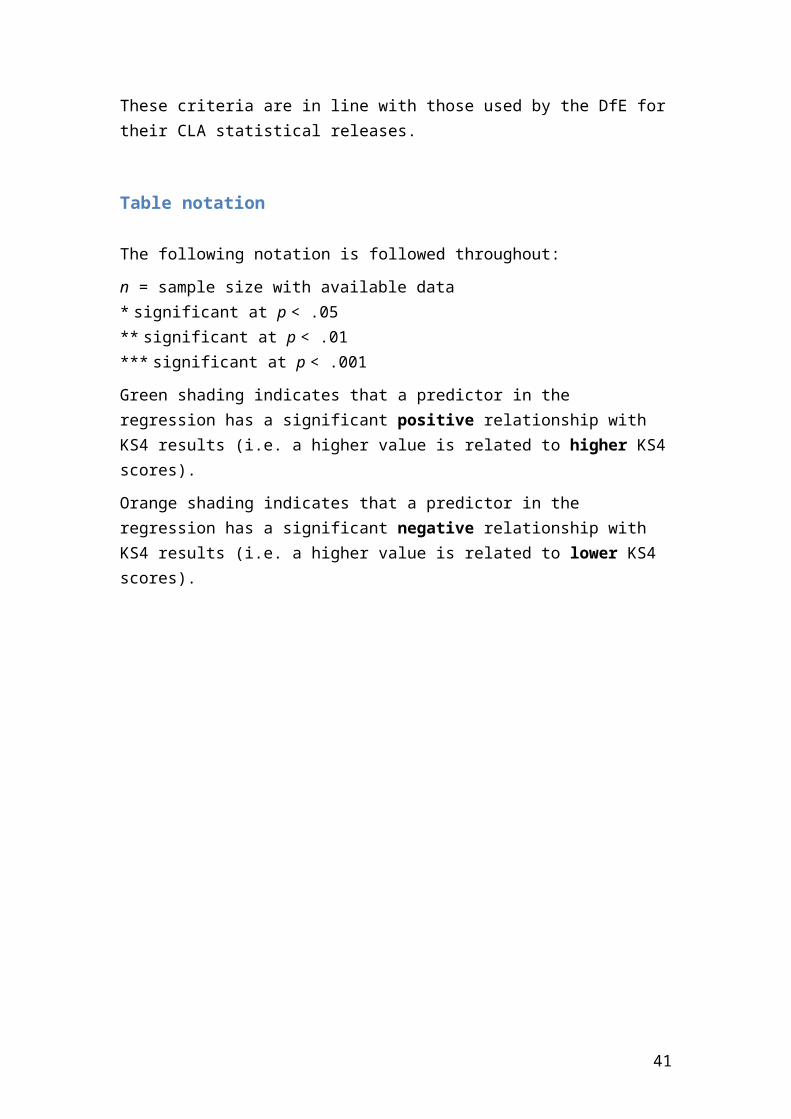
RESEARCH QUESTION 3: Are placement stability and school stability equally associated with higher attainment (Conger and Rebeck 2001)?
Correlation analyses showed that more proximal changes in the later years of schooling had a stronger relationship with KS4 results than changes in earlier years – these effects were strongest in Year 10 or 11 and then Year 9 (note that the Year 10/11 variable is the one for changes at any time during the GCSE years):
Table 2.7: Correlations between school changes and KS4 points
n r
Changed School Year 9 4371 -.102***
Changed School Year 10 or 11 4847 -.154***
A similar effect of chronicity was true for non-respite placement changes. Higher numbers of placement changes during a young person’s care career were linked to poorer results (first row of Table 2.8), and this relationship was stronger when focusing on changes made during secondary school years (row 2). Within this latter period, KS4 changes had the strongest correlation (row 4), followed by those that occurred between the end of KS2 and the start of KS4 (row 3):
Table 2.8: Correlations between school changes and KS4 points
n r
Overall Placement Changes 4847 -.239***
Placement Changes Since KS2 4847 -.273***
Placement Changes KS2-Start of KS4 4847 -.185***
Placement Changes During KS4 4847 -.237***
We also found that these measures of school and placement instability were correlated with each other:
41
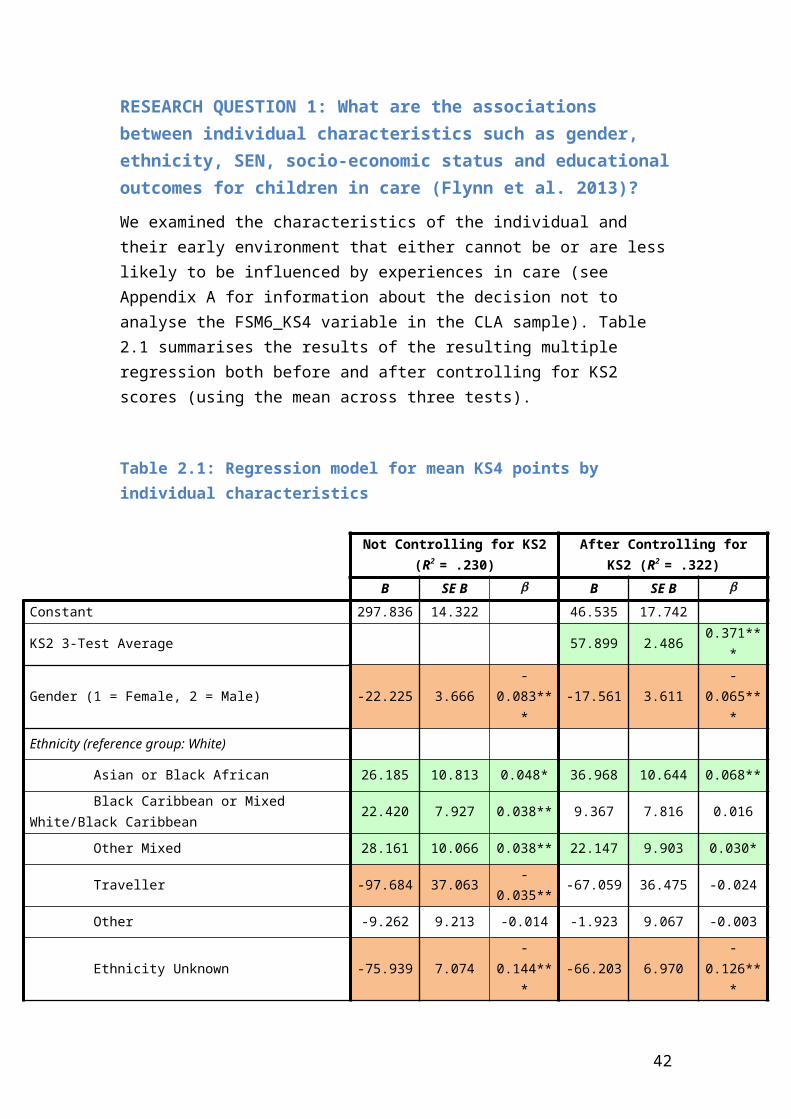
Table 2.9: Correlations between school changes and placement changes
Changed School Year 9
Changed School Year 10 or 11
Overall Placement Changes .104*** .133***
Placement Changes Since KS2 .136*** .173***
Placement Changes KS2-Start of KS4 .163*** .090***
Placement Changes During KS4 .073*** .168***
This raises the question of how far placement changes lead to school changes and thence to poorer outcomes. Adding our four placement stability variables to the regression model in a stepwise (exploratory) analysis showed that the only significant predictor was the number of non-respite changes in placement since date of KS2. The relationship between placement changes and KS4 points remained significant after accounting for school changes in Year 10 or 11, but a Sobel test showed that the reduction in the strength of this relationship was significant, t = -6.590, p < .001, i.e. that there was a significant partial mediation effect. Controlling for all the other variables in our model, this was still significant, t = -7.910, p < .001.
Given the sample size, the significance of these effects says rather little about their practical significance. In assessing this, it is worth noting that changes in Years 10 and 11 were not very frequent – only 11% of pupils experienced them – and were much less common than unstable placements. Thus, as our last analysis implied, they are very unlikely to provide a full explanation for the association between placement instability and outcome. In addition, school changes are less common in mainstream schools (9%) than others (15%), χ2(1) = 52.49, p < .001. Given the very poor outcomes in non-mainstream schools this association is likely to increase the apparent impact of changes on outcome.
Table 2.10 gives the association between placement difficulty, change of school and outcome in Mainstream schools while Table 11 does the same for Non-mainstream ones. We distinguish between these two groups partly because of the association noted above but also because the meaning of the changes may be different in the two cases. In mainstream schools a change may well be brought about by a change of placement. In non-mainstream ones it could reflect this, but it could also reflect changes prompted by a reassessment and a move, for example, to a pupil referral unit of a child who was already doing badly in terms of education.
42
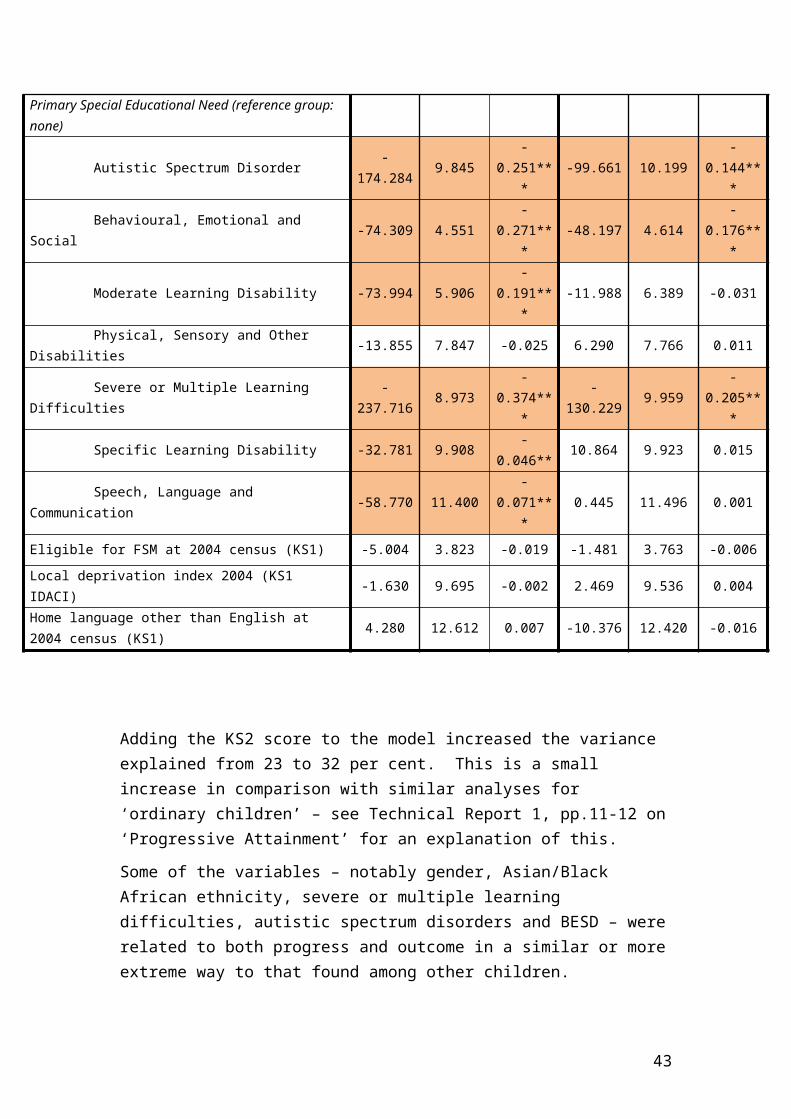
Table 2.10 KS4 Points (and SD) by Post-KS2 Placement Changes and Year 10 or 11 School Change (Mainstream Schools)
Level of placement change after KS2
Changed School in Year 10 or 11Low (< 3 changes)
Medium (3-4 changes)
High (5 or more changes)
Yes: changed school228.062
(114.354)246.373
(103.118)162.213
(112.980)
No: did not change school299.614(83.910)
258.648 (108.233)
207.162 (123.209)
Table 2.11 KS4 Points (and SD) by Post-KS2 Placement Changes and Year 10 or 11 School Change (Non-mainstream Schools)
Level of placement change after KS2
Changed School in Year 10 or 11Low (< 3 changes)
Medium (3-4 changes)
High (5 or more changes)
Yes: changed school90.528
(85.914)91.065
(86.035)74.407
(75.076)
No: did not change school83.743
(89.626)99.045
(86.709)84.592
(79.725)
Table 2.10 shows that the relationship between stability and better outcomes is apparent for young people who are in mainstream schools at the end of Key Stage 4. There was a clear decrease in KS4 points according to increasing numbers of post-KS2 placements for those who had not changed school during the GCSE years. For those who had changed school, fewer changes were also better in terms of GCSE results. The ‘kink’ for this group in terms of better achievement for those with 3-4 placement changes may be accounted for if those with the smallest number of placements were very recent entrants to the care system. The final regression model shown in Table 2.16d allows us to control for some of these complexities of experience.
As Table 2.11 shows, the relationship between placement change and GCSE results is less clear for those in non-mainstream schools at KS4. The relationship between outcome and changes of school is also not consistent. This may reflect the reasons for which changes take place in these different circumstances. It does not suggest that a change of school inevitably has a bad effect. For example, a child may change school because they are not doing well there, so that it is educational performance that brings about the change rather than vice-versa. In addition, both change of placement and poor educational performance are associated with other factors such as a high SDQ, which we will investigate in the path analysis model (see Part 3 of this
43
paper). For the moment, however, the precautionary principle would suggest that changes of school should be avoided unless there are good reasons for it, and particularly so when young people are in a stable placement.
A further feature of instability is that it is associated with the kinds of final placement in which the children find themselves. Table 2.12 deals with final placements (i.e. at KS4). As can be seen, foster care and in particular care by kin is associated with a low level of placement change. By contrast placement in any form of residential care is associated with much higher levels of placement change after KS2. This association is more likely to represent cause and effect. Very few of those who ended up in residential care had always been in it, and it is likely that their placements reflected the use of this highly expensive form of care as a response to failed fostering placements.
Table 2.12 Distribution of Post-KS2 Placement Changes Across Five Placement Types at KS4
Level of placement change after KS2
Placement Type at KS4Low (< 3 changes)
Medium (3-4 changes)
High (5 or more changes)
Kin 321 (81.3%) 49 (12.4%) 25 (6.3%)
Foster care 2095 (72.6%) 464 (16.1%) 327 (11.3%)
Residential (children’s home) 305 (33.9%) 228 (25.3%) 368 (40.8%)
Other residential 183 (46.0%) 69 (17.3%) 146 (36.7%)
Other placement 98 (36.7%) 69 (25.8%) 100 (37.5%)
Unsurprisingly, the combination of stability and placement type was strongly associated with outcome (see Table 2.13).
44
Table 2.13 KS4 Points (and SD) by Post-KS2 Placement Changes and KS4 Placement Type
Level of placement change after KS2
Placement Type at KS4Low (< 3 changes)
Medium (3-4 changes)
High (5 or more changes)
Kin 266.99 (116.27) 230.58 (124.15) 215.56 (107.59)
Foster care 257.46 (116.44) 242.42 (110.18) 185.90 (124.53)
Residential (children’s home) 94.48 (110.34) 131.55 (118.33) 100.46 (95.38)
Other residential 64.51 (93.75) 93.25 (89.97) 88.60 (82.04)
Other placement 213.32 (126.14) 132.82 (121.35) 90.63 (102.81)
As can be seen there is a largely consistent relationship within kinship and foster care between level of placement change and educational outcome. As might be expected, the lower the level of change the better the outcome seems to be. The pattern within residential and other residential placement types is far less clear. In general, the major contrasts in Table 2.13 are between the kinds of placements. This is once again a strong reminder of the heterogeneity with this sample, and of the need to distinguish within it. Young people in foster care are not doing as well as their peers who are not looked after. They are not, however, doing very badly. By contrast those in residential care are doing badly, and a number may well have dropped out of education. Both groups need educational help but the nature of their educational problems may not be the same.
Conclusion on Research Question 3
In terms of our question these results suggest that both school changes and placement changes are risk factors for looked after children’s educational outcomes; moreover, the length of the latest placement is also associated with educational outcomes. There is some evidence that placement changes may produce school changes and hence poor educational outcomes; however, the extent of this effect is relatively small. The main associations might occur because both kinds of change are markers of a child in difficulty; the inter-relationships between these variables are examined in our path analysis model (see Part 3).
45
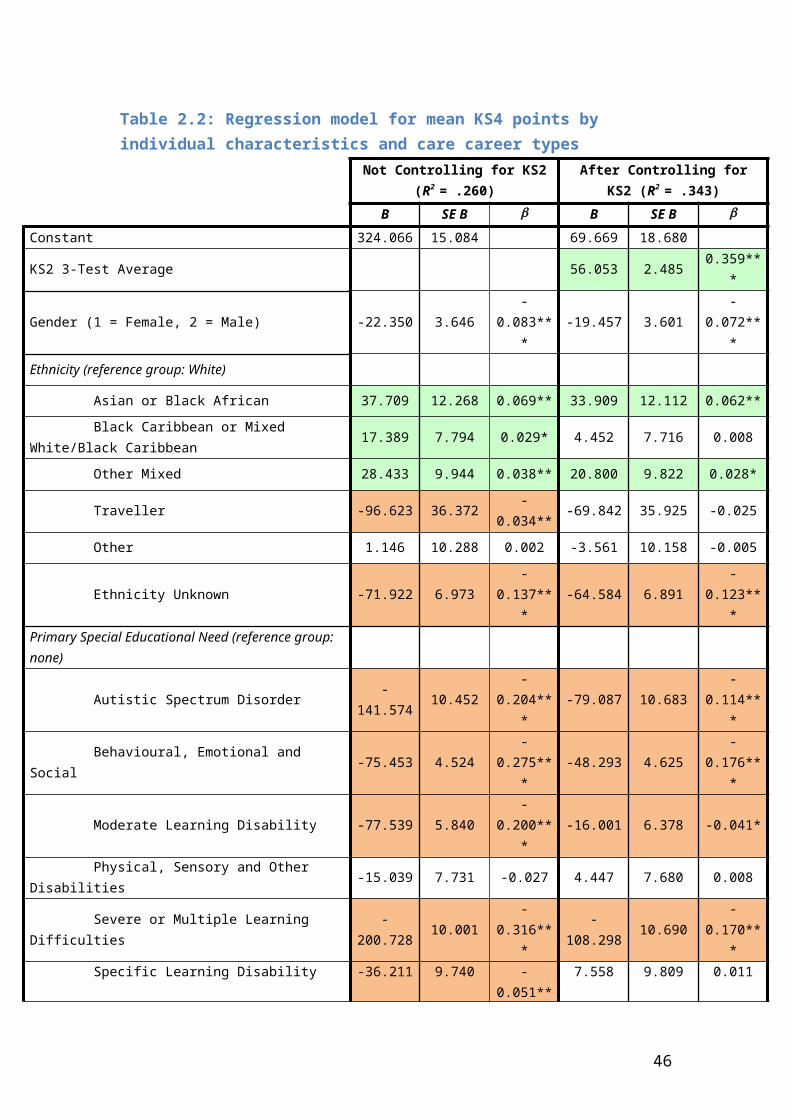
Table 2.14: Regression model for mean KS4 points by individual characteristics, time in care and instability
Not Controlling for KS2 (R2 = .363) After Controlling for KS2 (R2 = .453)
B SE B B SE B
Constant 339.484 15.322 68.051 18.210
KS2 3-Test Average 58.720 2.274 0.376***
Gender (1 = Female, 2 = Male) -29.878 3.402 -0.111*** -27.350 3.303 -0.102***
Ethnicity (reference group: White)
Asian or Black African 41.400 11.443 0.076*** 39.216 11.104 0.072***
Black Caribbean or Mixed White/Black Caribbean 23.855 7.244 0.040** 10.477 7.048 0.018
Other Mixed 25.035 9.235 0.034** 17.026 8.967 0.023
Traveller -91.626 33.788 -0.033** -62.843 32.806 -0.022
Other 8.433 9.568 0.013 4.473 9.286 0.007
Ethnicity Unknown -63.435 6.523 -0.121*** -56.272 6.335 -0.107***
Primary Special Educational Need (reference group: none)
Autistic Spectrum Disorder -145.603 9.711 -0.210*** -80.048 9.760 -0.115***
Behavioural, Emotional and Social -59.346 4.246 -0.216*** -30.292 4.271 -0.110***
Moderate Learning Disability -78.926 5.426 -0.204*** -14.717 5.823 -0.038*
Physical, Sensory and Other Disabilities -19.424 7.186 -0.035** 0.637 7.016 0.001
Severe or Multiple Learning Difficulties -209.474 9.307 -0.330*** -113.477 9.767 -0.179***
Specific Learning Disability -40.075 9.045 -0.056*** 5.519 8.953 0.008
Speech, Language and Communication -63.306 10.399 -0.076*** -3.458 10.354 -0.004
Eligible for FSM at 2004 census (KS1) 1.823 3.641 0.007 6.676 3.538 0.025
Local deprivation index 2004 (KS1 IDACI) -3.158 8.851 -0.005 3.117 8.592 0.005
Home language other than English at 2004 census (KS1) -10.173 12.504 -0.016 -15.497 12.135 -0.024
Care Career Type (reference groups: entry aged 0-4/5-9)
Adolescent Entrant (Abuse/Neglect) -3.509 5.845 -0.011 2.440 5.676 0.008
Adolescent Entrant (Other Reasons) -20.173 6.219 -0.062** -14.465 6.039 -0.044*
Entered Care as UASC -19.268 12.064 -0.026 19.152 11.801 0.026
46
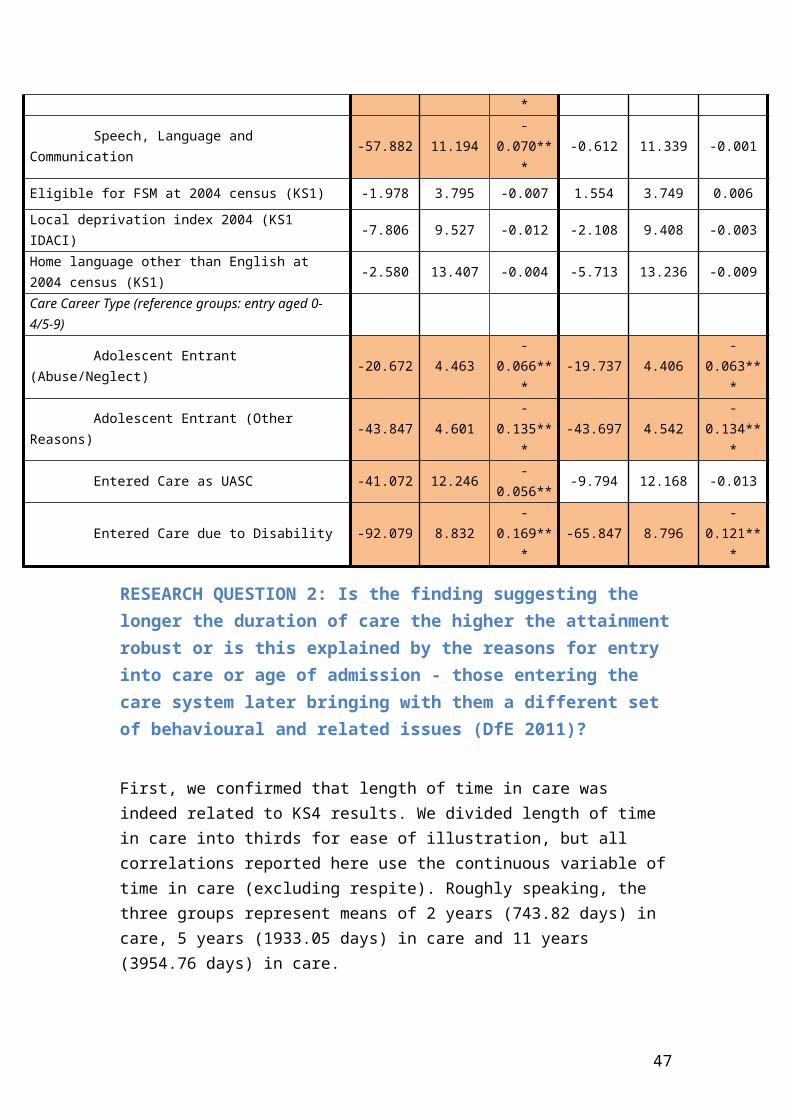
Entered Care due to Disability -88.180 8.896 -0.162*** -56.908 8.717 -0.104***
Length of Time in Care (Excluding Respite) -0.003 0.002 -0.027 -0.001 0.002 -0.006
Placement Changes Since KS2 -6.637 0.404 -0.220*** -6.604 0.392 -0.219***
School Changes in Year 10-11 -56.401 5.330 -0.134*** -63.449 5.180 -0.150***
Length of Latest Placement 0.015 0.002 0.127*** 0.015 0.002 0.130***
47
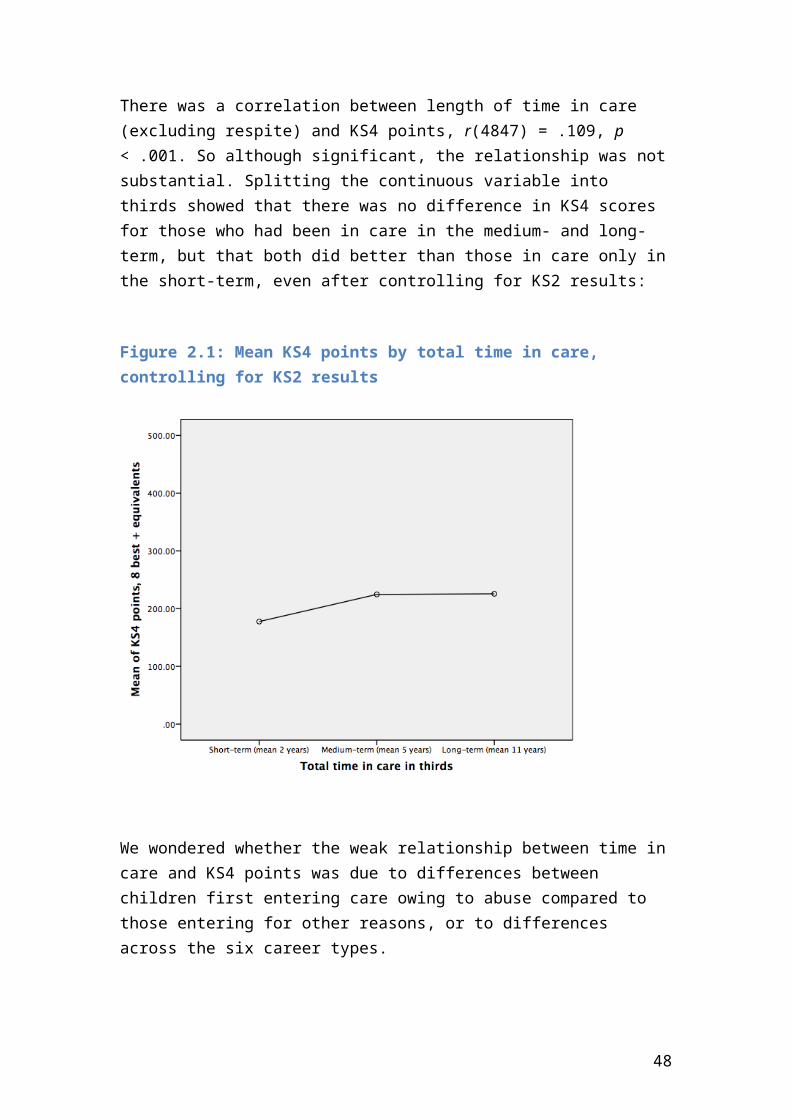
RESEARCH QUESTION 4: What factors contribute to any association between placement stability and higher attainment (Conger and Rebeck 2001)?
We explored this question by building on the regression model already created to answer Research Questions 1-3. Table 2.16 shows the effects of adding the variables from Research Questions 1-3 plus those identified below (see explanation of Blocks 1-4 below).
Block 1Table 2.16a shows the model using the first block of variables identified for Research Question 1. These are ‘difficult to change’ early factors (e.g. individual characteristics, early home environment).
Block 2Table 2.16b shows the model that includes all of the variables in Block 1, with the addition of KS2 test scores and total length of time in care. These variables were identified for Research Question 2 and represent other factors that are difficult for the care system to influence in adolescence.
Block 3Table 2.16c shows the model that includes all of the variables in Blocks 1 and 2, with the addition of factors that might be seen as a response to the care system. These include the measures of (in)stability identified for Research Question 3, along with four new variables as explained below.
First, we looked at whether looked after children’s behavioural difficulties could be represented solely by the SEN BESD variable, or whether their scores on the SDQ (mean across all available measurements) would add anything to the model. When we looked at the relationship between these two variables, we found a difference in SDQ scores dependent on whether the child had ever had an SEN statement/School Action Plus for BESD; however, the correlation between the two variables was low. This is because BESD is a yes/no variable and there is variance in SDQ scores at both levels.
48
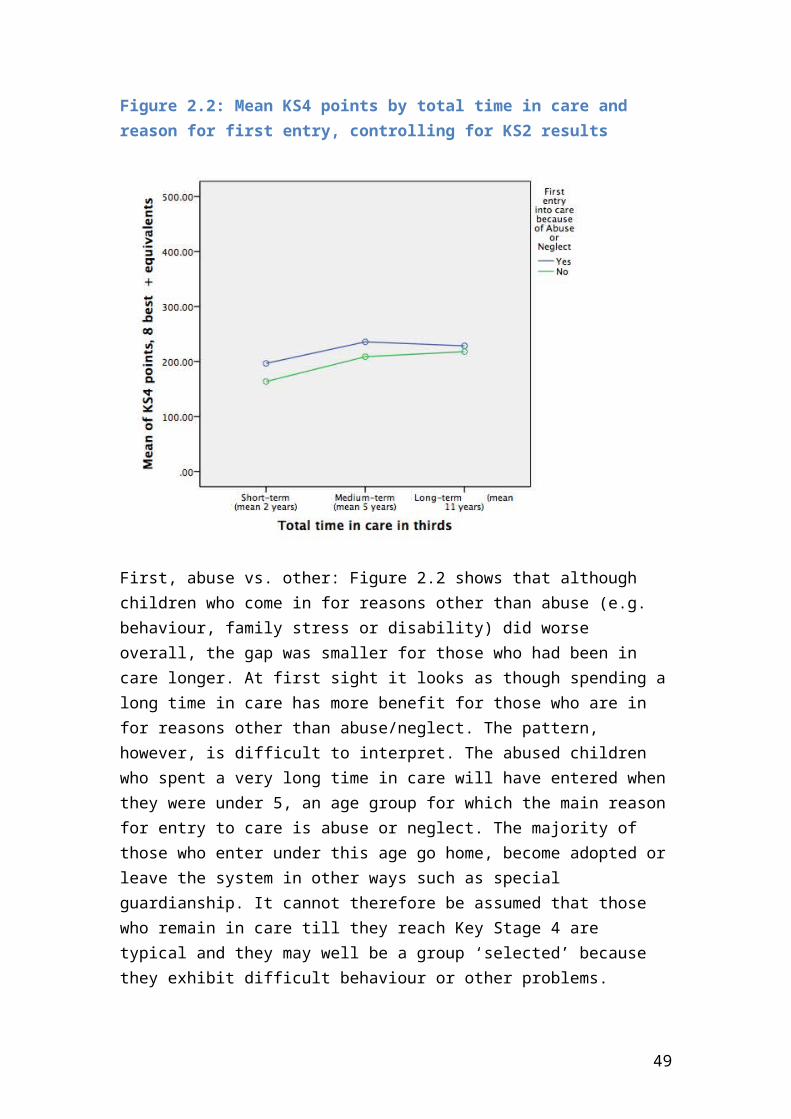
Table 2.15: Mean standardised SDQ scores by BESD status (statemented or School Action Plus)
n SDQ SDNever BESD 2616 -.897 6.674
BESD 1694 1.925 6.752
We believed that SDQ – which is measured by caregivers – represented at least in part a child’s response to the care system (rather than being purely a measure of temperament), and as such we decided to add mean standardised SDQ scores to the model in Block 3 (Table 2.16c). This variable was a significant negative predictor of KS4 results, over and above the influence of BESD status.
We also added in unauthorised absences (as a proportion of total possible sessions), number of sessions of fixed-term exclusions and whether ever permanently excluded, as part of Block 3 of the regression (as shown in Table 2.16c). As would be expected, each of these was a significant negative predictor of KS4 results.
Adding these absences and exclusions along with SDQ to the model did not affect the significant relationships that gender, Traveller or unknown ethnicity, ASD/BESD/SMLD, or entry due to disability, all had with KS4 results. However, it meant that being Asian or Black African or of other mixed ethnicity, having a moderate learning disability, being a Adolescent entrant to care for reasons other than abuse/neglect, and total length of time in care, were all no longer significant predictors of KS4 results.
Block 4Finally, Table 2.16d shows the model that includes all of the variables in Blocks 1 to 3, with the addition of factors relating to the young person’s concurrent environment.
First, we added variables relating to the placement the young person was in at the date of the 2013 census (end of KS4). We had to bear in mind that the KS4 placement length and type (final placement) are both situational variables but are also likely to be a characteristic of the individual (e.g. more ‘difficult’ young people are more likely to end up in short-term or residential care).
An ANCOVA of KS4 points by final placement type, controlling for our standard set of variables from the regression, showed a significant effect of final placement type, F(4, 3513) = 89.113, p < .001, η2
p = .025. Children who ended up in (a) kinship or foster care did better than those who ended in (b) residential/other-residential/other (categories within these two groups were the same as each other). We therefore recoded last placement type as kinship/foster
49
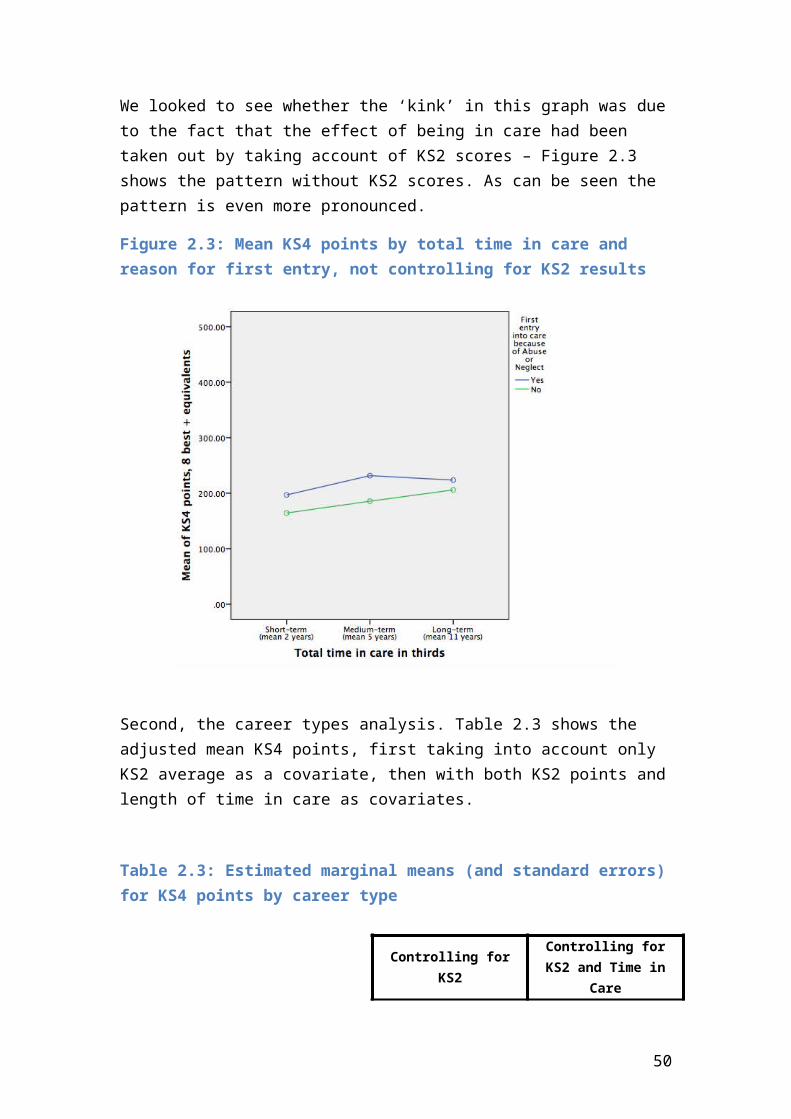
care vs. residential/other, and added this to the model (see Table 2.16d). See Appendix B for analyses on the subsample of children whose last placement was in either foster or kinship care (i.e. excluding those in residential or other care).
In addition to placement type at KS4, we also added to the model (shown in Table 2.16d) whether the child was placed in or out of their home local authority at that point, as well as 2012-2013 FSM eligibility (yes, no, or missing – to account for the 1174 missing data points on this variable11, as we had done for ethnicity) and IDACI as measures of concurrent deprivation, and language spoken at home at KS4.
Table 2.16d shows that of these variables, being in a residential/other placement (rather than kinship or foster care), having unknown FSM status at KS4 and speaking a language other than English at home at KS4 were all negative predictors of KS4 results. In contrast, having been in the final placement for longer (whatever the placement type) predicted better KS4 results.
Finally, in addition to these ‘home environment’ variables, we also added a measure of concurrent school environment, namely the type of school attended at KS4. The reference category as shown in Table 2.16d was attendance of any type of mainstream school (regardless of governing structure), and other school types were collapsed into special schools, pupil referral units, alternative provision, and ‘other’. We had initially conducted the analysis with ‘other’ broken down further, but the small numbers in secure units (25), independent schools (42) and other schools (10) in comparison to FE colleges (143) – and the fact that separating these types out confounded the role of KS4 FSM (because some school types had not recorded FSM eligibility) – led us to decide that combining these four categories into an overall ‘other’ would be most useful.
Although there had been a big change in home environment between KS1 to KS4 (on variables that would seem to matter, e.g. FSM, IDACI, home language), the only ‘home environment’ variables that related to KS4 results were unknown FSM status, concurrent home language, latest care placement type and final placement length. School environment was also important, as all non-mainstream school types predicted poorer KS4 scores in comparison to children in mainstream schools.
However, once the features of the home and school environment at KS4 were taken into account, being of Traveller or unknown ethnicity, having an identified BESD need, and having ever received a permanent school exclusion were no longer significant predictors of KS4 results. It is likely that this is due to shared variance between some of these predictors, owing to potential overlap in the characteristics of particular groups of children (e.g. young people end up in a pupil referral unit by receiving a permanent exclusion from a mainstream school). Having an identified
11 We received data for children on the mainstream school census, alternative provision and pupil referral units. Data are therefore missing for other reasons.
50
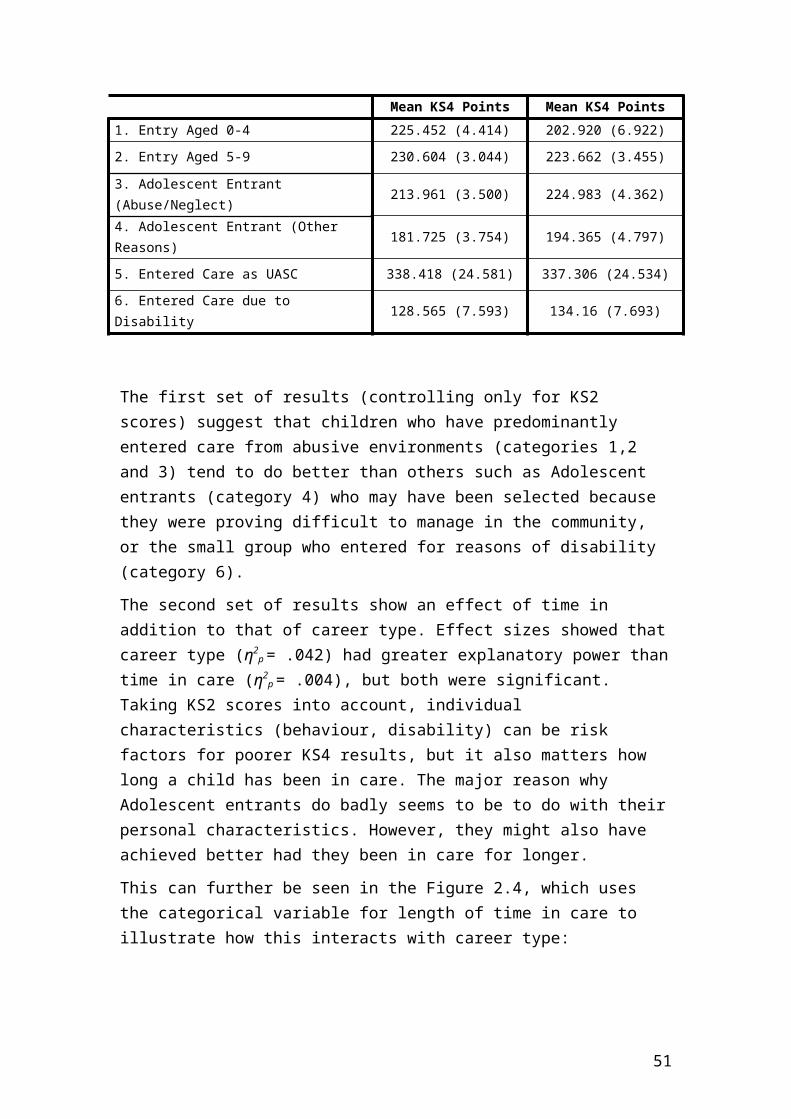
moderate learning disability, which was previously a non-significant predictor, now predicted poorer KS4 results once concurrent environment and school type were taken into account.
Interpreting the regression models
Table 2.16(a-d) shows how the relationships between predictor variables and KS4 results changed as we added more variables to the model. We added the variables to the regression model in four separate blocks which roughly speaking represent:
Block 1 – ‘difficult to change’ early factors (e.g. individual characteristics, early home environment)
Block 2 – other factors difficult for the care system to influence in adolescence (KS2 results and length of time in care)
Block 3 – factors that might be seen as a response to the care system (e.g. placement changes and school changes)
Block 4 – factors relating to concurrent environment (e.g. latest placement type and length)
Table 2.16a below therefore presents only those variables included in Block 1, Table 2.16b shows Blocks 1 and 2, Table 2.16c includes Blocks 1-3 and the final model with all four blocks appears in Table 2.16d. In interpreting the tables, it is important to bear in mind that the addition of variables to the model explains more of the variance in outcomes but due to correlations amongst predictors, additional variables can also mean that some predictors that are no longer significant when controlling for other variables are still important factors – it is just that their likelihood of coinciding with other factors means they do not have sufficiently unique explanatory power. It is therefore important to consider all of the information given across Tables 2.16a-2.16d.
51
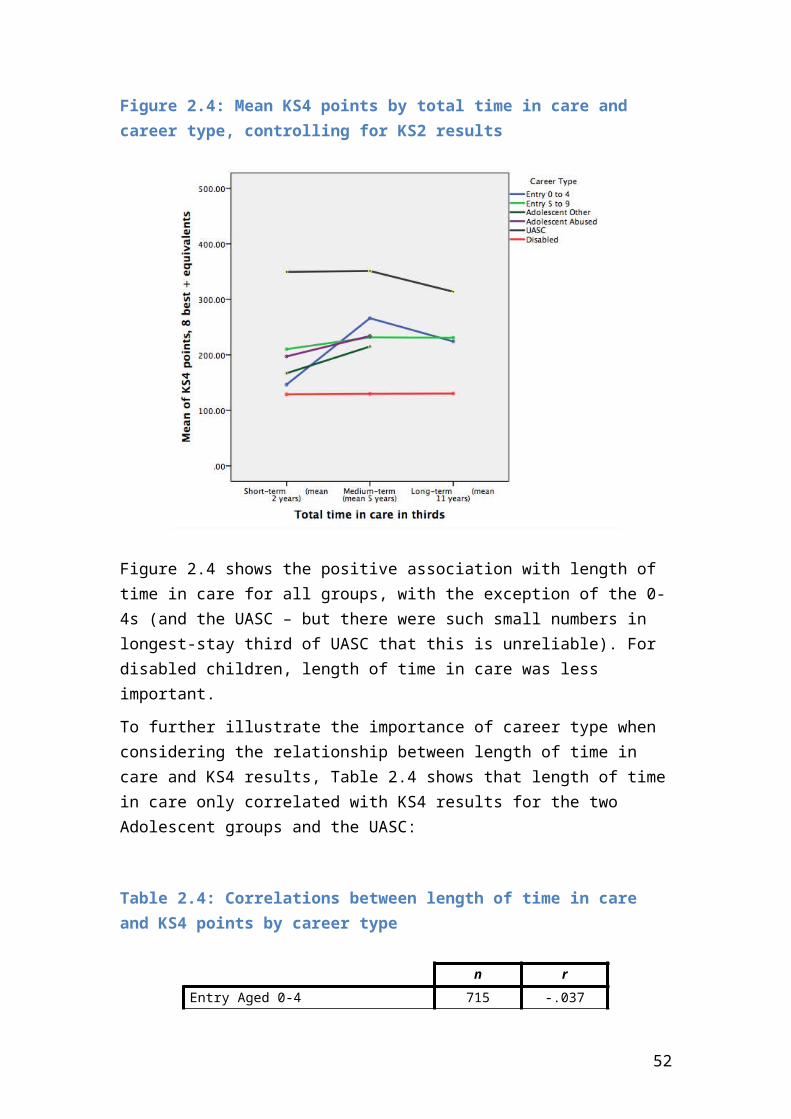
Conclusion on Research Question 4
In terms of our question these results suggest that in addition to the proposed relationship between changes of placement and school outlined above under Research Question 3, we can examine the role of instability while controlling for factors relating to the individual child and their early and concurrent environment. Taking a range of variables into account, we have shown that the following factors are significant predictors of poorer KS4 results after controlling for performance at KS2:
Individual characteristics Being male Having a recognised SEN of an Autism Spectrum Disorder Having a recognised SEN of a Moderate Learning Disability Having a recognised SEN of Severe or Multiple Learning Difficulties Entering care primarily due to a disability Having a high mean score on the SDQ
Instability Having more changes of placement (compared to other children) after KS2 Changing school in Year 10 or 11 Having more unauthorised school absences Having missed more school days (compared to other children) due to fixed-term
exclusions
Concurrent environment Having spent less time in the latest placement Living in residential or another form of care (compared to kinship or foster care)
at KS4 Having unknown FSM status at KS4 Having a home language other than English at KS4 Being in a non-mainstream school at KS4 (special schools, PRUs, Alternative
Provision, and other types of school all significant predictors of poorer results)
52
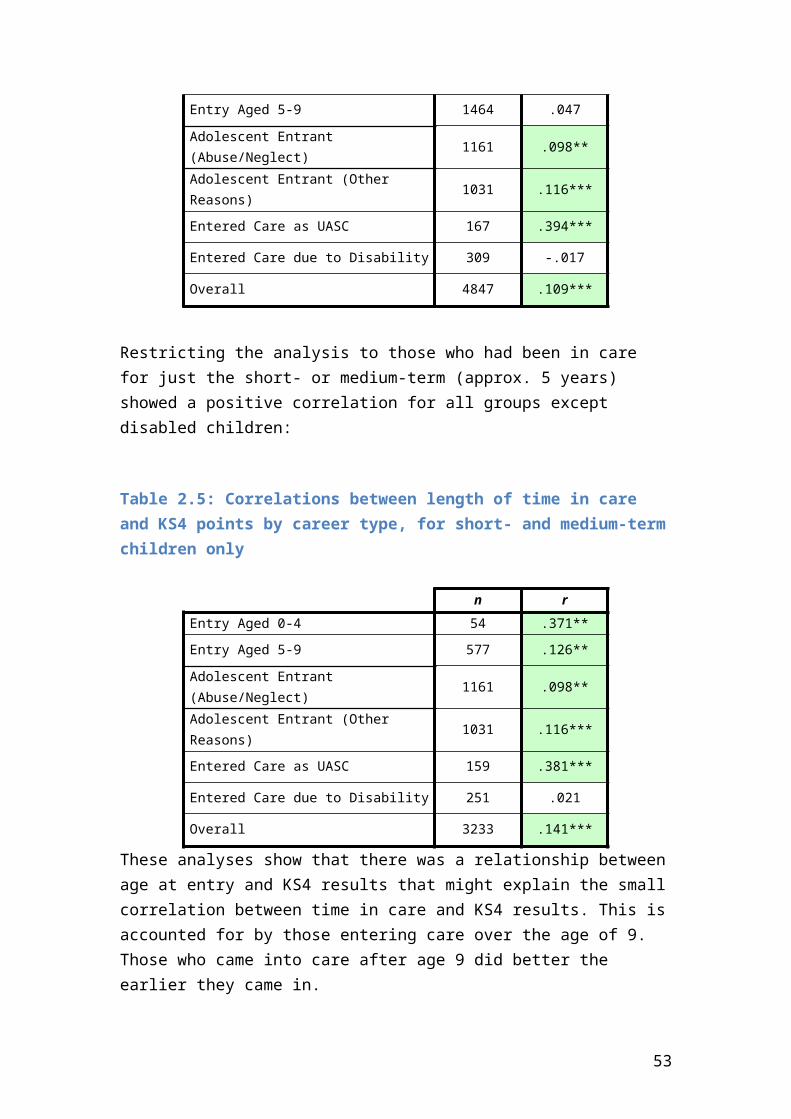
Table 2.16a: Regression model for mean KS4 points: Block 1 only
Not Controlling for KS2 (R2 = .260)
B SE B
Block 1
Constant 324.066 15.084
Gender (1 = Female, 2 = Male) -22.350 3.646 -0.083***
Ethnicity (reference group: White)
Asian or Black African 37.709 12.268 0.069**
Black Caribbean or Mixed White/Black Caribbean 17.389 7.794 0.029*
Other Mixed 28.433 9.944 0.038**
Traveller -96.623 36.372 -0.034**
Other 1.146 10.288 0.002
Ethnicity Unknown -71.922 6.973 -0.137***
Primary Special Educational Need (reference group: none)
Autistic Spectrum Disorder -141.574 10.452 -0.204***
Behavioural, Emotional and Social -75.453 4.524 -0.275***
Moderate Learning Disability -77.539 5.840 -0.200***
Physical, Sensory and Other Disabilities -15.039 7.731 -0.027
Severe or Multiple Learning Difficulties -200.728 10.001 -0.316***
Specific Learning Disability -36.211 9.740 -0.051***
Speech, Language and Communication -57.882 11.194 -0.070***
Eligible for FSM at 2004 census (KS1) -1.978 3.795 -0.007
Local deprivation index 2004 (KS1 IDACI) -7.806 9.527 -0.012
Home language other than English at 2004 census (KS1) -2.580 13.407 -0.004
Care Career Type (reference groups: entry aged 0-4/5-9)
Adolescent Entrant (Abuse/Neglect) -20.672 4.463 -0.066***
Adolescent Entrant (Other Reasons) -43.847 4.601 -0.135***
Entered Care as UASC -41.072 12.246 -0.056**
Entered Care due to Disability -92.079 8.832 -0.169***
53
Table 2.16b: Regression model for mean KS4 points: Blocks 1-2
Not Controlling for KS2 (R2 = .262) After Controlling for KS2 (R2 = .347)
B SE B B SE B
Block 1
Constant 308.338 19.544 44.032 22.709
Gender (1 = Female, 2 = Male) -23.110 3.648 -0.086*** -20.423 3.598 -0.076***
Ethnicity (reference group: White)
Asian or Black African 40.506 12.279 0.075** 37.536 12.106 0.069**
Black Caribbean or Mixed White/Black Caribbean 16.962 7.785 0.029* 3.765 7.697 0.006
Other Mixed 28.644 9.932 0.039** 21.001 9.797 0.028*
Traveller -97.281 36.326 -0.035** -70.439 35.833 -0.025*
Other 2.269 10.280 0.003 -2.137 10.137 -0.003
Ethnicity Unknown -71.934 6.964 -0.137*** -64.526 6.874 -0.123***
Primary Special Educational Need (reference group: none)
Autistic Spectrum Disorder -140.965 10.440 -0.203*** -77.669 10.660 -0.112***
Behavioural, Emotional and Social -75.435 4.518 -0.275*** -48.000 4.614 -0.175***
Moderate Learning Disability -78.154 5.835 -0.202*** -16.196 6.362 -0.042*
Physical, Sensory and Other Disabilities -15.564 7.722 -0.028* 3.953 7.661 0.007
Severe or Multiple Learning Difficulties -202.637 10.003 -0.319*** -109.882 10.668 -0.173***
Specific Learning Disability -36.545 9.728 -0.051*** 7.555 9.784 0.011
Speech, Language and Communication -58.480 11.182 -0.070*** -0.828 11.310 -0.001
Eligible for FSM at 2004 census (KS1) 1.477 3.916 0.006 6.115 3.866 0.023
Local deprivation index 2004 (KS1 IDACI) -7.086 9.517 -0.010 -1.108 9.386 -0.002
Home language other than English at 2004 census (KS1) -5.889 13.424 -0.009 -10.079 13.235 -0.016
Care Career Type (reference groups: entry aged 0-4/5-9)
Adolescent Entrant (Abuse/Neglect) -5.169 6.283 -0.017 0.581 6.199 0.002
Adolescent Entrant (Other Reasons) -26.902 6.674 -0.083*** -21.497 6.584 -0.066**
Entered Care as UASC -26.135 12.954 -0.036* 10.083 12.869 0.014
Entered Care due to Disability -79.174 9.560 -0.145*** -48.681 9.520 -0.089***
54
Block 2
KS2 3-test average 56.609 2.482 0.362***
Length of Time in Care (Excluding Respite) 0.007 0.002 0.078*** 0.009 0.002 0.102***
55
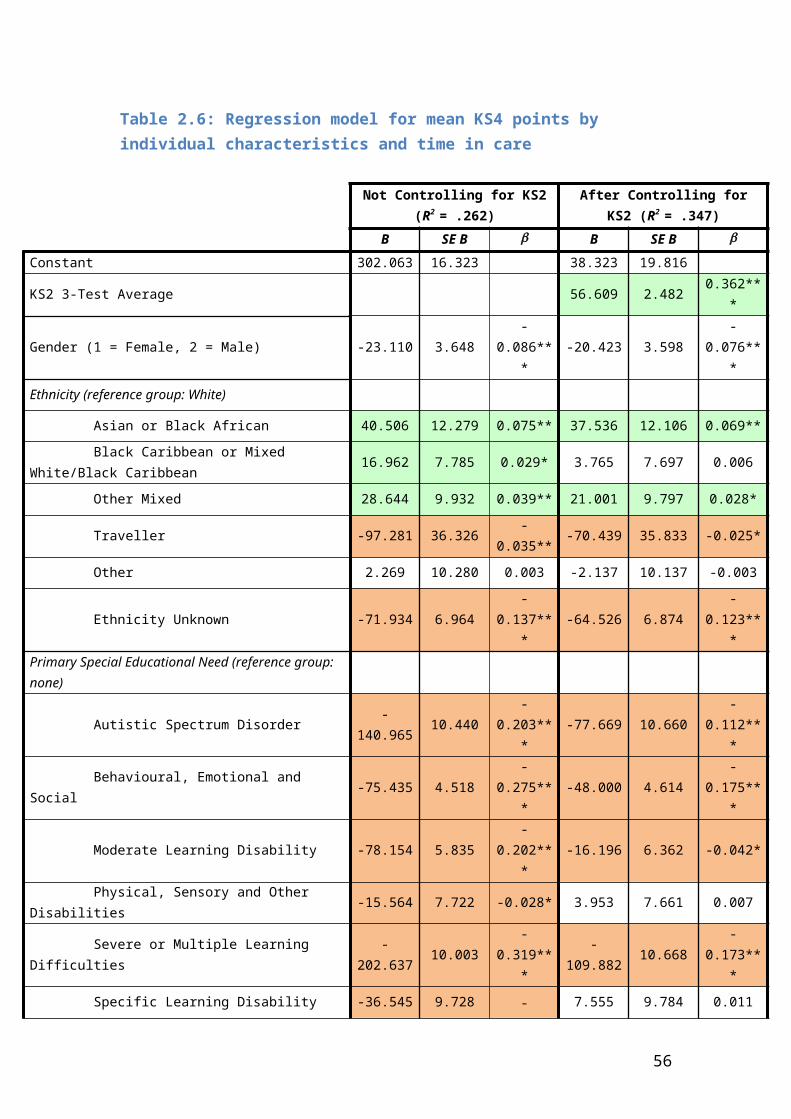
Table 2.16c: Regression model for mean KS4 points: Blocks 1-3
Not Controlling for KS2 (R2 = .453) After Controlling for KS2 (R2 = .527)
B SE B B SE B
Block 1
Constant 324.161 15.065 81.084 17.549
Gender (1 = Female, 2 = Male) -20.791 3.374 -0.077*** -19.217 3.217 -0.072***
Ethnicity (reference group: White)
Asian or Black African 15.402 11.283 0.028 17.496 10.754 0.032
Black Caribbean or Mixed White/Black Caribbean 17.929 7.130 0.030* 7.683 6.809 0.013
Other Mixed 19.262 9.065 0.026* 13.151 8.643 0.018
Traveller -88.977 33.151 -0.032** -64.394 31.611 -0.023*
Other 1.345 9.394 0.002 -0.937 8.953 -0.001
Ethnicity Unknown -55.130 6.423 -0.105*** -50.206 6.125 -0.095***
Primary Special Educational Need (reference group: none)
Autistic Spectrum Disorder -129.275 9.598 -0.186*** -74.282 9.428 -0.107***
Behavioural, Emotional and Social -32.450 4.339 -0.118*** -9.862 4.240 -0.036*
Moderate Learning Disability -65.973 5.379 -0.171*** -10.571 5.619 -0.027
Physical, Sensory and Other Disabilities -9.654 7.058 -0.017 6.805 6.761 0.012
Severe or Multiple Learning Difficulties -201.728 9.179 -0.318*** -117.759 9.417 -0.185***
Specific Learning Disability -31.304 8.885 -0.044*** 8.452 8.627 0.012
Speech, Language and Communication -51.389 10.251 -0.062*** -0.833 9.993 -0.001
Eligible for FSM at 2004 census (KS1) -0.061 3.573 0.000 4.788 3.411 0.018
Local deprivation index 2004 (KS1 IDACI) 2.973 8.712 0.004 10.137 8.308 0.015
Home language other than English at 2004 census (KS1) 7.840 12.290 0.012 0.789 11.717 0.001
Care Career Type (reference groups: entry aged 0-4/5-9)
Adolescent Entrant (Abuse/Neglect) -1.143 5.738 -0.004 5.075 5.474 0.016
Adolescent Entrant (Other Reasons) -11.175 6.107 -0.034 -5.796 5.825 -0.018
Entered Care as UASC -43.025 11.873 -0.059*** -4.890 11.426 -0.007
Entered Care due to Disability -87.655 8.730 -0.161*** -60.077 8.399 -0.110***
56
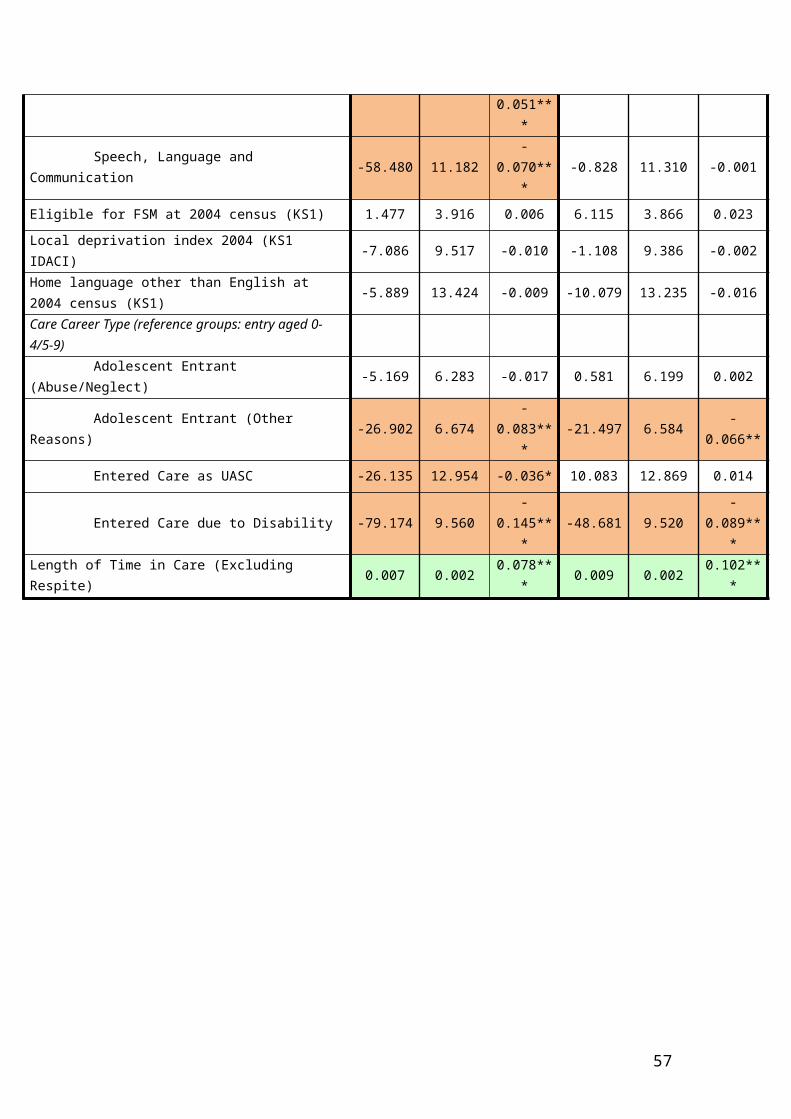
Block 2
KS2 3-test average 53.622 2.226 0.343***
Length of Time in Care (Excluding Respite) -0.001 0.002 -0.015 0.001 0.002 0.010
Block 3
Mean standardised SDQ scores -4.065 0.251 -0.209*** -3.030 0.243 -0.155***
Placement Changes Since KS2 -5.040 0.387 -0.167*** -5.216 0.369 -0.173***
School Changes in Year 10-11 -45.421 5.250 -0.108*** -52.462 5.012 -0.124***
Unauthorised absences (as a proportion of total possible sessions)
-355.783 25.820 -0.177*** -362.230 24.609 -0.180***
Number of sessions of fixed-term exclusions -0.905 0.079 -0.150*** -0.928 0.075 -0.154***
Child has ever been permanently excluded -52.697 9.112 -0.071*** -49.982 8.685 -0.067***
57
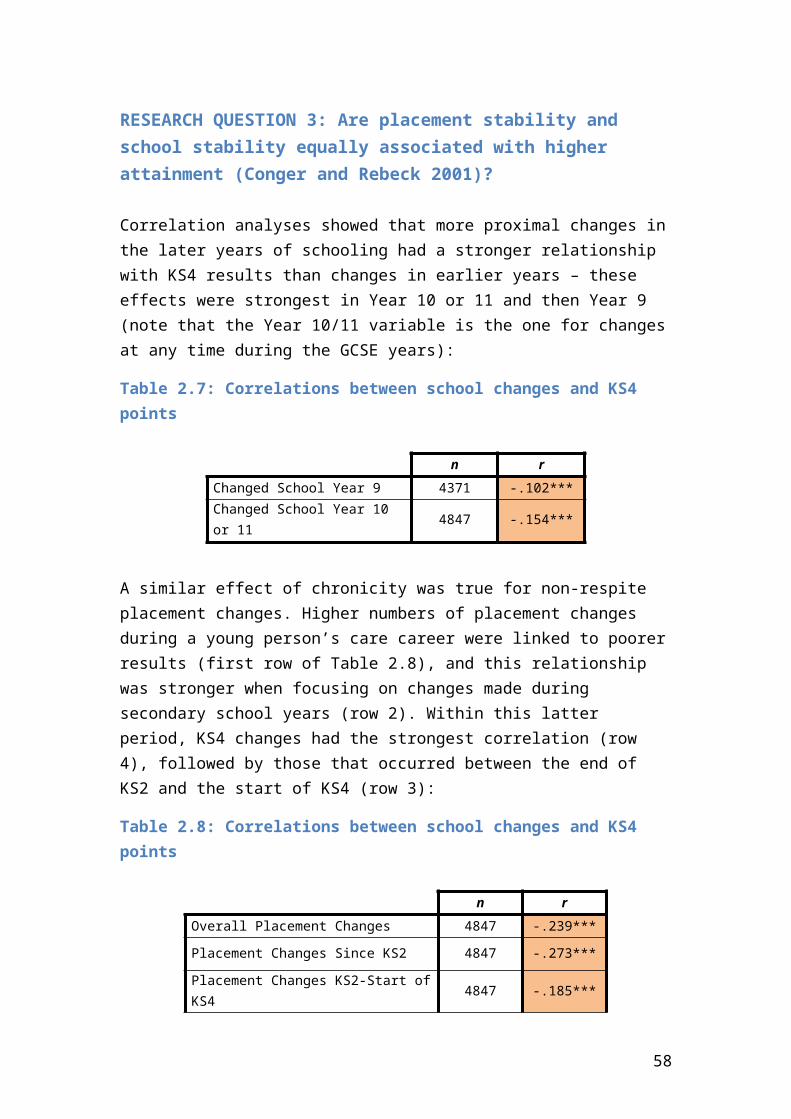
Table 2.16d: Regression model for mean KS4 points: Blocks 1-4
Not Controlling for KS2 (R2 = .627) After Controlling for KS2 (R2 = .662)
B SE B B SE B
Block 1
Constant 336.068 14.293 151.933 16.670
Gender (1 = Female, 2 = Male) -6.159 2.989 -0.023* -7.589 2.846 -0.028**
Ethnicity (reference group: White)
Asian or Black African 14.377 9.970 0.026 15.561 9.489 0.029
Black Caribbean or Mixed White/Black Caribbean 13.838 6.300 0.023* 7.524 6.006 0.013
Other Mixed 16.412 7.945 0.022* 12.884 7.564 0.017
Traveller -56.718 29.045 -0.020 -43.153 27.653 -0.015
Other 6.369 8.355 0.010 3.823 7.953 0.006
Ethnicity Unknown 12.169 6.474 0.023 10.548 6.163 0.020
Primary Special Educational Need (reference group: none)
Autistic Spectrum Disorder -67.539 8.645 -0.097*** -38.206 8.370 -0.055***
Behavioural, Emotional and Social -18.111 3.860 -0.066*** -3.566 3.752 -0.013
Moderate Learning Disability -46.269 4.783 -0.120*** -10.395 4.924 -0.027*
Physical, Sensory and Other Disabilities -16.983 6.198 -0.031** -5.476 5.930 -0.010
Severe or Multiple Learning Difficulties -132.500 8.496 -0.209*** -87.563 8.421 -0.138***
Specific Learning Disability -36.810 7.786 -0.052*** -6.722 7.576 -0.009
Speech, Language and Communication -39.644 9.000 -0.048*** -6.259 8.742 -0.008
Eligible for FSM at 2004 census (KS1) -0.081 3.135 0.000 3.673 2.991 0.014
Local deprivation index 2004 (KS1 IDACI) -1.952 7.835 -0.003 2.781 7.461 0.004
Home language other than English at 2004 census (KS1) 27.191 12.359 0.043* 14.945 11.780 0.024
Care Career Type (reference groups: entry aged 0-4/5-9)
Adolescent Entrant (Abuse/Neglect) -5.642 5.032 -0.018 -0.313 4.797 -0.001
Adolescent Entrant (Other Reasons) -9.992 5.355 -0.031 -5.861 5.101 -0.018
Entered Care as UASC -41.854 12.316 -0.057** -20.278 11.777 -0.028
Entered Care due to Disability -32.359 7.833 -0.059*** -18.194 7.492 -0.033*
58
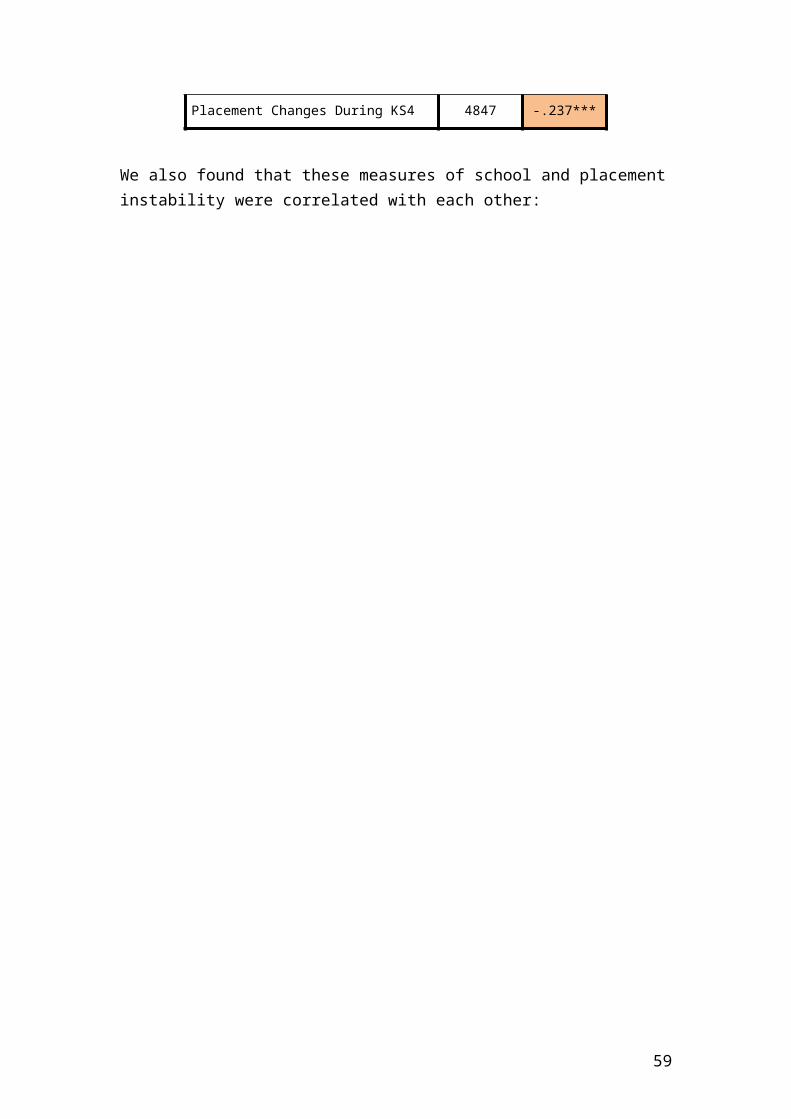
Block 2
KS2 3-test average 39.605 2.072 0.253***
Length of Time in Care (Excluding Respite) -0.005 0.002 -0.050** -0.003 0.002 -0.035
Block 3
Mean standardised SDQ scores -2.330 0.227 -0.120*** -1.743 0.218 -0.089***
Placement Changes Since KS2 -2.188 0.365 -0.073*** -2.305 0.347 -0.076***
School Changes in Year 10-11 -31.490 5.264 -0.075*** -33.926 5.012 -0.080***
Unauthorised absences (as a proportion of total possible sessions)
-246.978 22.952 -0.123*** -255.458 21.850 -0.127***
Number of sessions of fixed-term exclusions -0.496 0.070 -0.082*** -0.543 0.067 -0.090***
Child has ever been permanently excluded -10.762 8.126 -0.014 -9.947 7.734 -0.013
Block 4
Length of latest placement 0.003 0.002 0.024 0.003 0.002 0.030*
Residential/other non-foster placement at KS4 -34.972 3.780 -0.123*** -37.304 3.600 -0.131***
Placed out of authority at KS4 1.917 2.921 0.007 2.567 2.780 0.010
Eligible for FSM at KS4 (reference group: no)
Yes: eligible for FSM in 2013/2013 -1.624 4.945 -0.004 -0.435 4.707 -0.001
FSM eligibility not known -20.010 6.201 -0.064** -31.939 5.935 -0.103***
Local deprivation index 2013 (KS4 IDACI) 3.098 9.119 0.004 1.651 8.680 0.002
Home language other than English at 2013 census (KS4) -30.606 9.775 -0.061** -18.836 9.324 -0.038*
School type at KS4 (reference group: mainstream)
Special school -117.005 4.644 -0.363*** -87.622 4.680 -0.272***
Pupil Referral Unit -100.400 8.536 -0.188*** -88.234 8.149 -0.165***
Alternative Provision -150.153 8.552 -0.259*** -121.356 8.278 -0.209***
Other -83.700 8.470 -0.131*** -60.250 8.155 -0.094***
59
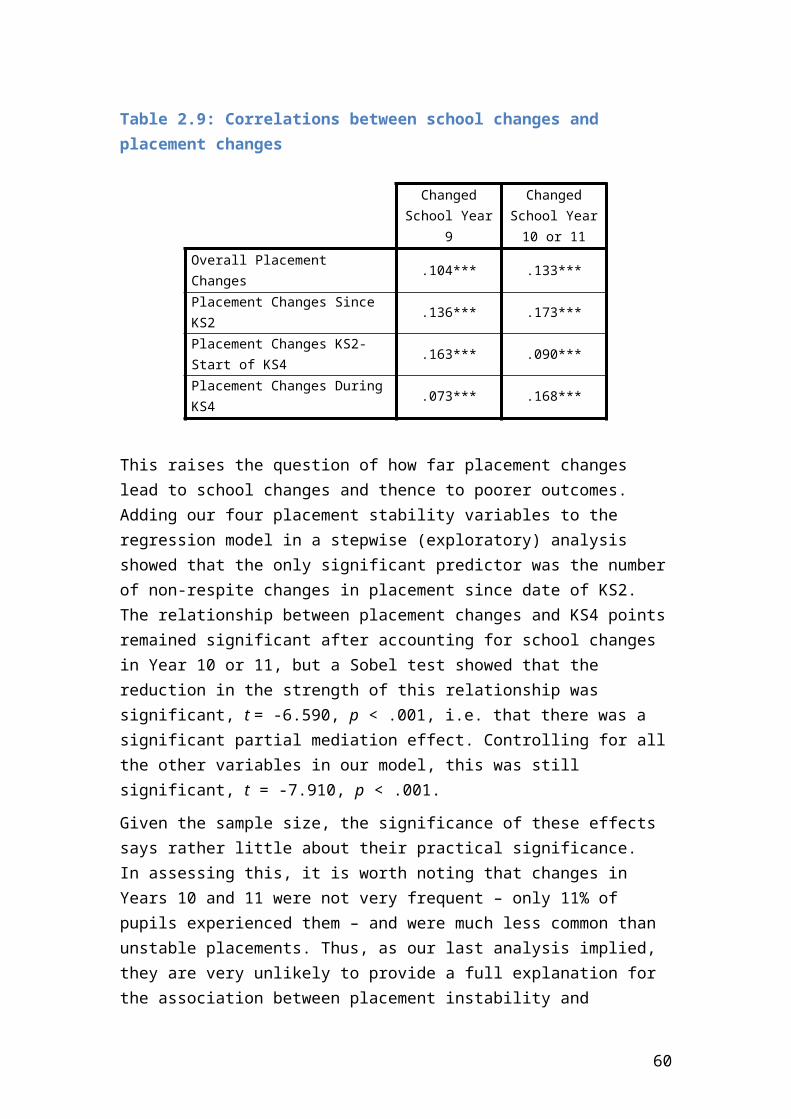
Part 2 Summary and Conclusion
We have used a range of statistical techniques to investigate the research questions in our original proposal. Combining an examination of first-order relationships between care and educational variables and KS4 outcomes, alongside building increasingly complex regression models, our analyses have shown how seemingly straightforward ‘risk factors’ might become more or less important once the complexity of looked after children’s experiences is taken into account.
In Part 3 of the report, path analysis modelling will allow us to explore the potential pathways through which the significant predictors identified in our regression model are linked to KS4 outcomes.
60
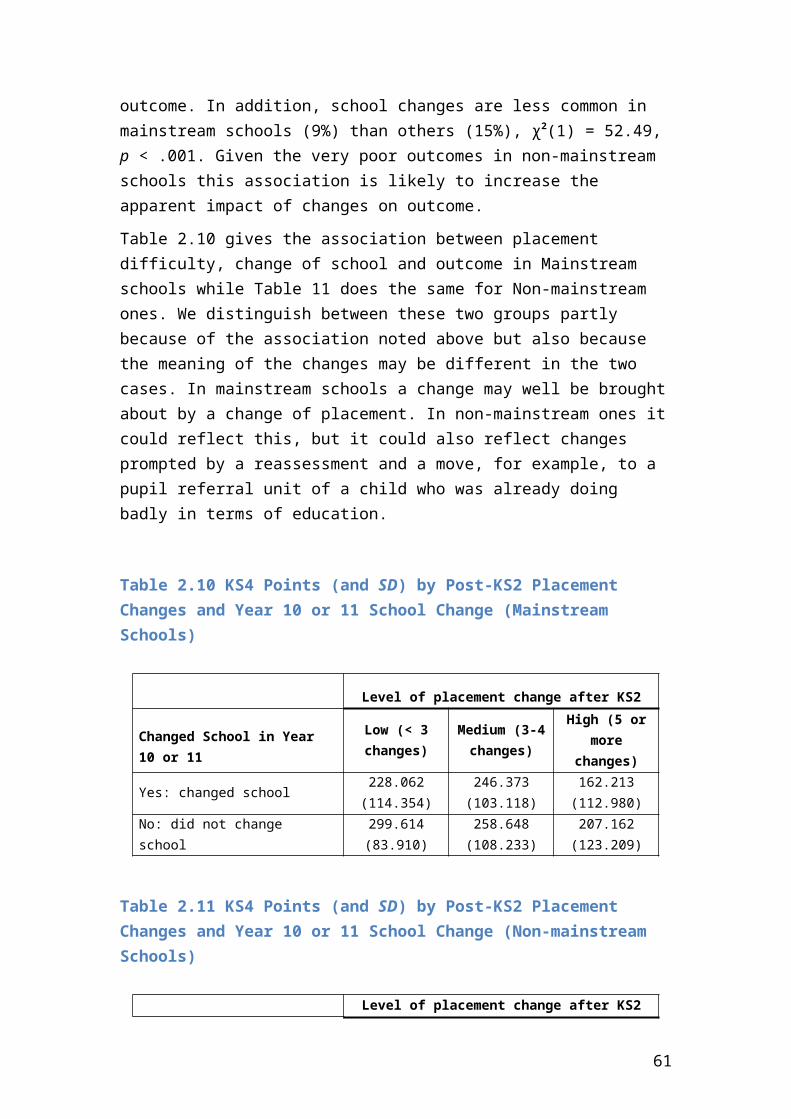
Part 3: Path analysis of data for CLA cohort
This part of the paper builds on the analyses of SSDA903 and NPD data presented thus far for the cohort of young people in care for 12 months or more at 31st March 2013. It focuses on examining the relationships between the variables identified in our regression model as predictors of looked after children’s KS4 outcomes; in addition, it enables the statistical examination of potential pathways through which any links to GSCE outcomes might be operating. Our model focuses on young people’s experiences of (in)stability and features of their later environment. Arguably, these are the factors that lie more within the control of local authorities (e.g. changes of school or placement) than prior experiences or characteristics (e.g. child maltreatment or disability).
Future work with the datasets could build on this to add further factors to this model; for example, a logical next step would be to identify the characteristics of the individual and their early environment that predict better or worse outcomes at KS2. This would enable us to build ‘backwards’ from the model presented here.
MethodAs a reminder, our main sample of interest (N = 4847) consists of all those children at KS4 in 2013 who:
had been in care for 12 months or more had not been exclusively in short-term respite placements
These criteria are in line with those used by the DfE for their CLA statistical releases.
Missing data
Missing data were handled by data regression imputation using maximum likelihood estimates. In this procedure, data from complete and partial cases of data are entered into a linear regression to predict the missing values for individual cases, using the information that is available for that case in the regression equation. Maximum likelihood estimates have been shown to be more efficient and less biased than alternative missing data methods such as listwise and pairwise deletion and similar response pattern imputation, where data are missing at random (Enders & Bandalos, 2001). Mean SDQ scores represented the largest amount of missing data in this sample, and so we determined which variables should be used to in the regression to predict these values. Having first tested which of the theoretically-related variables were also significant predictors of SDQ scores, we specified that
61
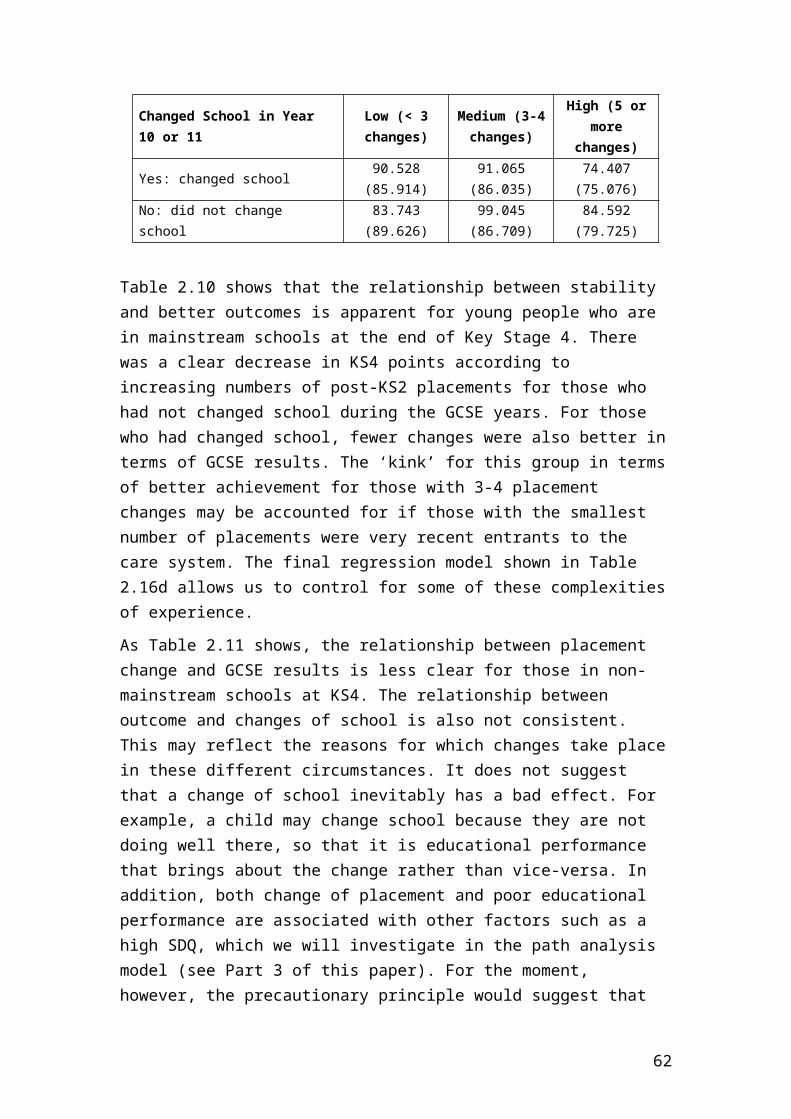
missing SDQ values should be predicted using the following: registered as having a special education need of ASD or BESD; ever convicted; ever substance abusing; and our four career types (adolescent abuse, adolescent other, UASC, disabled).
Variables in the model
The model moves on directly from the regression analysis presented in Table 2.16d. The outcome variable, as in previous analyses, is the young person’s KS4 points from their 8 best GCSEs or equivalents. Predictors are KS2 scores, mean score on the Strengths and Difficulties Questionnaire (SDQ), and two composite measures: school difficulty and care difficulty.
School difficulty was created using the data from four variables:
unauthorised absences as a proportion of total possible school sessions number of sessions missed due to fixed-term exclusions whether ever permanently excluded being in a non-mainstream school at the end of KS4
A principal components analysis of these four variables supported a one-factor solution, and a composite variable was produced.
Care difficulty was created using five variables:
placement changes after the end of KS2 mean placement length after the end of KS2 number of residential placements after the end of KS2 whether the final placement was in residential or other care (as opposed to
foster or kinship care) length of latest placement
A principal components analysis of these five variables supported a one-factor solution, and a composite variable was produced.
These principal components analyses indicate that a number of the variables included in the regression tables in Part 2 of this paper are inter-related, and can be understood to represent particular areas of difficulty for young people in their school and care experiences.
Prior to building the path model we examined the association between our measures of school difficulty, placement stability and KS4 outcome in an Analysis of Variance (ANOVA). The ANOVA showed a main effect of school difficulty level, F(2, 4838) = 721.60, p < .001, η2
p = .230, and a main effect of care difficulty level, F(2, 4838) = 71.29, p < .001, η2
p = .029. There was also an interaction between school and care difficulty levels, F(4, 4838) = 11.52, p < .001, η2
p = .009. As Table 3.1 shows, post-hoc tests indicated that lower levels of difficulty at school were consistently related
62
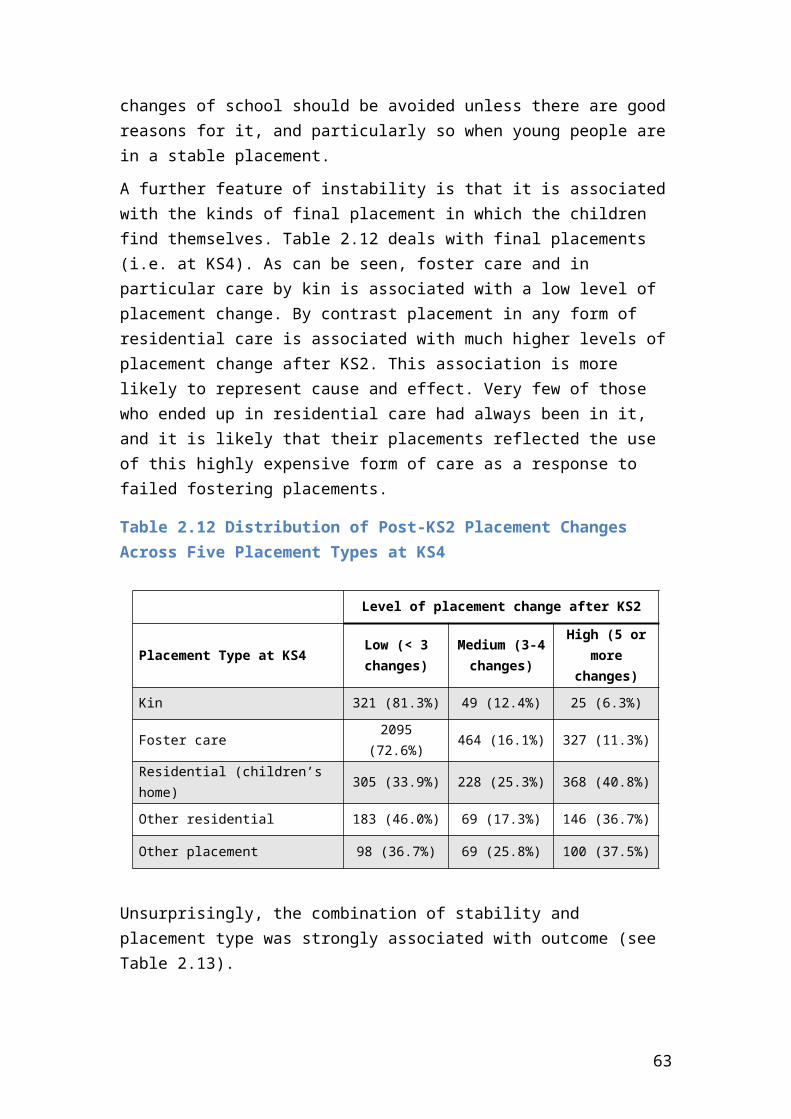
to better KS4 results, regardless of level of difficulty in care. Similarly, higher levels of school difficulty were consistently related to the poorest KS4 outcomes. The trend for care difficulties was less clear-cut. At low levels of school difficulty, there was a linear decline in KS4 results between low, medium, and high levels of care difficulty. At medium levels of school difficulty, there is a ‘kink’ in the results, with young people who also experienced medium levels of care difficulty having the best results. At high levels of school difficulty, there was no significant difference in the results of young people experiencing low or medium care difficulty, but both had higher KS4 scores than those who had high levels of care difficulty. Overall, the results suggest that young people with low levels of ‘difficulty’ (as conceptualized above) in school and in care achieve KS4 results comparable to those of their peers who are neither in care nor in need (see Part 1). Those experiencing high levels of difficulty in both settings, however, perform substantially worse (89 points at KS4 for those experiencing high levels of difficulty in both, as opposed to 323 points for those experiencing low levels of difficulty). In addition, it appears that difficulties in school may have a stronger relationship with KS4 outcomes than do difficulties in care. The path analysis model will allow us to examine this.
Table 3.1 KS4 Points (and SD) by Levels of Difficulty in School and in Care
Level of Care Difficulty
Level of School Difficulty Low Medium High
Low 323.02 (63.24) 305.63 (77.75) 266.65 (109.30)
Medium 182.87 (130.69) 219.58 (124.77) 153.36 (125.58)
High 127.30 (103.87) 140.31 (108.01) 89.26 (86.99)
It is also worth noting that the table as we have presented it underplays the association between care and school difficulties, since the two are closely associated, r = .42, p < .001. We cannot assume cause and effect: for example, it could be that both are associated with an underlying variable such as ‘disturbance’ which produces both movement and difficulties at school. The use of mean SDQ scores in our path model will allow us to examine this possibility, at least in part. However, it is a reasonable hypothesis that interventions targeted at the causes of school difficulties or stability should improve outcomes and particularly so perhaps if they were combined.
63

Building a path analysis model
Mean SDQ and KS2 scores were conceptualised as measures of the individual and their prior academic attainment, and were allowed to predict KS4 scores directly. SDQ was also allowed to predict KS2 scores to control for any pre-KS4 influence of the individual’s behavioural characteristics. We hypothesised that although behavioural characteristics might be related to difficulties both in school and in care, prior academic attainment was less likely to be related to difficulties in care. We therefore added indirect paths from KS2 scores to KS4 scores via our school difficulty variable, and from mean SDQ to KS4 scores via both school difficulty and care difficulty.
We allowed the error terms for school difficulty and placement difficulty to covary. The error terms represent variance that is unexplained by the variables in the model. As well as providing a better model fit, this also made theoretical sense: covarying error terms indicate that unexplained variance may be due to a shared common factor, which in this case might represent the concept of ‘overall difficulty’ vs. ‘resilience’.
Results
The resulting model is shown in Figure 3.1. Model fit indices were good12 according to Kline (2005), χ2(1) = 17.026, p < .001, comparative fit index (CFI) = .997, root mean square error of approximation (RMSEA) = .058.
The model revealed the key paths along which children’s post-KS2 school and care experience was linked to their KS4 attainment. As previously shown in Part 2 of this paper, young people’s attainment at KS2 was a positive predictor of their KS4 results. The model also showed that higher SDQ scores predicted poorer KS4 scores. As predicted, higher SDQ scores were also linked to poorer grades at KS2.
Besides the direct paths from KS2 and SDQ scores to KS4 scores, there were also significant indirect pathways in the model. Higher scores at KS2 predicted fewer school difficulties, which in turn predicted higher KS4 scores. In contrast, higher scores on the SDQ predicted higher scores for both school and care difficulties, which in turn predicted lower KS4 scores. Although the pathway via care difficulty had a less powerful relationship with KS4 outcomes than that via school difficulty, it was still a substantial and significant predictor of results.
12 Although a non-significant chi-square test result generally indicates a better fit, large samples often produce a significant test statistic and so the CFI and RMSEA become more salient indicators of model fit.
64
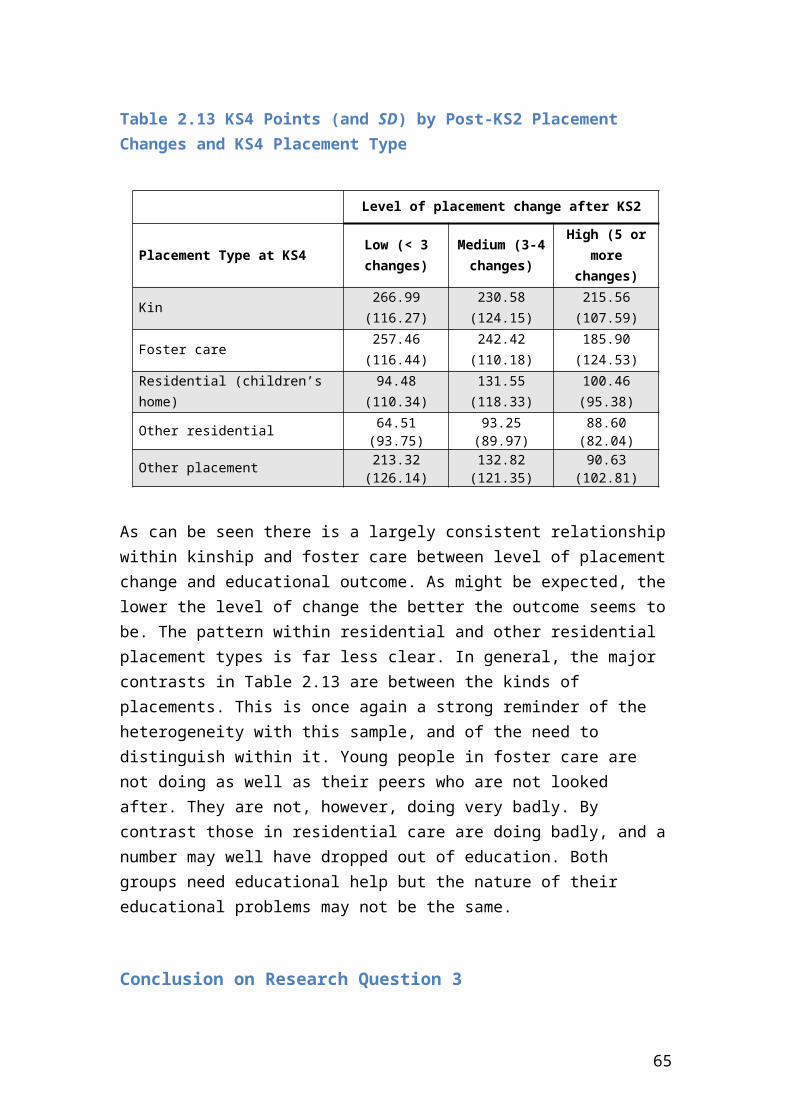
Figure 3.1: Path model for looked after children’s KS4 results χ2(1) = 17.026, p < .001, CFI = .997, RMSEA = .058. Figures given are standardised coefficients. All paths are significant at p < .001. Only the error terms for school and care difficulty are shown.
Mean SDQ
KS2 3-test average
.43
KS4 points, 8 best + equivalent
Care difficulty
School difficulty
-.24 .22
.25
-.09
-.39
-.11
-.20
error term
error term
.40
65
Part 3 Summary and Conclusion
The attainment of young people in care at KS4, after controlling for KS2 attainment, was related to difficulties in the young person, as well as difficulties in their experiences at school and in care. This part of the analysis has built on Parts 1 and 2 of the paper by showing the following:
Measures that represent unstable and ‘problematic’ experiences in care are statistically related with one another.
Measures representing difficulties in school can also be statistically grouped together.
Although related, school and care difficulties remain as distinct experiences and some young people can have difficulties in one but not the other.
The relationship between SDQ scores (sometimes seen as a measure of a ‘difficult child’) and KS4 scores shown in Part 2 of this paper was shown here to operate not just as a direct relationship; the relationship was also partially mediated by measures of difficulty in school and in care.
66
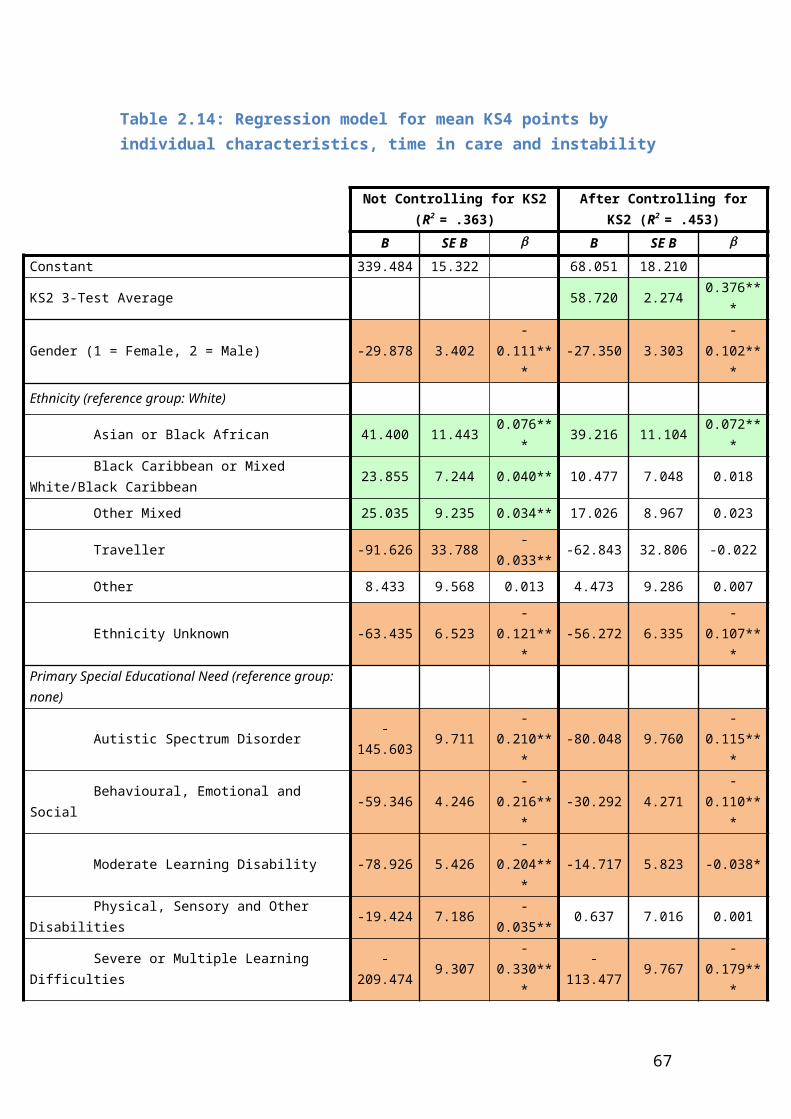
Part 4: Modelling School and Local Authority Variables
So far in this report on the CLA data we have considered the relationship between outcome and the characteristics of the individual children who are looked after. As envisaged in the proposal, we now extend this analysis to a multi-level model. Our analysis looks at the apparent impact of variables at the level of pupil, school and local authority (LA).
The proposal itself had promised a two-level model on the grounds that small numbers of children in each school would make it difficult to estimate school effects13. As we have seen, however, the NPD analysis in Technical Report 1 was able to provide estimates of school effects both for children who were not in need and for the CIN and CLA groups. We are now able to use these estimates with the CLA data set. We call them ‘CVA scores’ with ‘CVA’ standing for ‘Contextual Value Added’. Our key aim is to examine the association between these variables and educational outcome after allowing for important variables that are available in the CLA data set but not the NPD. In addition we will explore the associations between outcome and other aspects of the school and local authority context.
Our expectation was that the findings on the CVAs for pupils who were not in need or in care (Non-CIN CVA) would hold when tested with the new care variables. It would be surprising if a school that was good at teaching (say) geography to most children should be bad at doing so with those who were looked after. It was, however, perfectly possible that the new variables would explain some of the between-school variation in the performance of the young people who were looked after. For this reason, findings that were specific to the children looked after (CLA) or to the characteristics of schools in which they do well14 might well not hold when care-related variables were taken into account. We therefore tested the null hypotheses15 that:
13 The sample of looked-after children comprised 4847 pupils distributed among 2637 schools (somewhat fewer than half the schools in the full NPD sample). 64 per cent of the schools that were teaching CLA had only one child in our cohort of CLA. 14 The analysis in Technical Report 1 reported the effects of school level FSM and SEN along with average KS2 scores. These results were reported for all pupils and not for the specific impacts on those looked after. It was, however, possible that they would not hold for the looked after children when the care variables were included in the analysis.15 We call these ‘hypotheses’ because this is the conventional way to put it. A more accurate reflection would be that we had reason to think that the converse of these hypotheses might well be true but that our new data would attenuate the estimated relationships so that they were no longer significant.
67
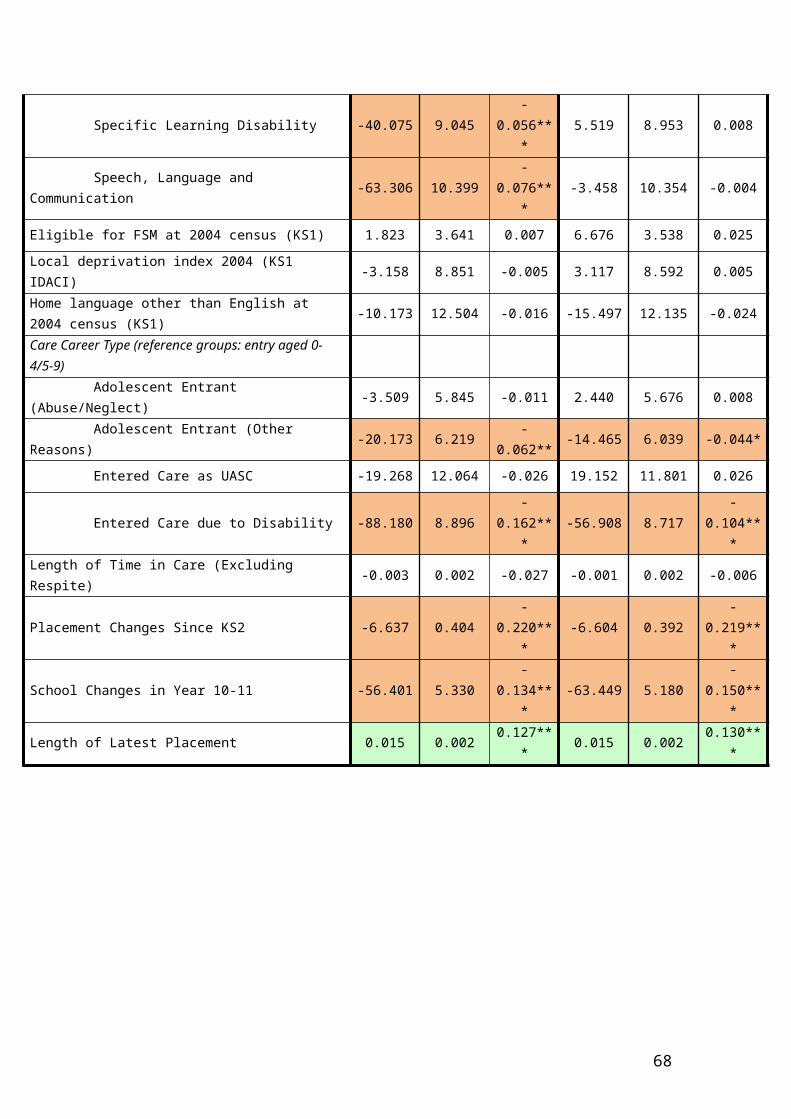
The measures of school effects found for the non-CIN children would not apply similarly to the CLA children so that CLA children would not tend to do better than expected in schools where other children did better than expected.
There would be no school effects for CLA beyond those for children who were not in need or looked-after.
After taking account of the CVA scores the school contextual variables which had significant relationships with outcome in the NPD sample (average KS2 points and proportion of children with FSM in past 6 years (FSM6)) would not do so in this sample.
Given the relatively small amount of variance explained at the local authority level, there would be no variables describing the local authority with a significant relationship with outcome.
Method
As we have seen Mainstream and Non-Mainstream schools differed in the educational results achieved and the variables that predicted them. Rather than accommodate this diversity within a single and inevitably complex model we decided to build two simpler models, one for mainstream and one for non-mainstream schools. We used the same set of variables to build each of these models. All of them predicted in either the mainstream or non-mainstream schools but we dropped any which were not predictive in a particular model. In the event the models differed less than we had expected and so our final model, like most of the work in this report, covered all schools.
Our level 1 (pupil level) variables built on the SEM model presented in Part 3, and included placement difficulty, school difficulty, Adjusted SDQ and KS2 score which we adapted for reasons given in the footnote16. To these we added ‘No special educational need’, ‘Autistic Spectrum Disorder’ and ‘Multiple or Severe Learning Disabilities’. Earlier analyses had suggested the latter would be particularly relevant to pupils in Non-Mainstream schools but we also retained them for the Mainstream analysis, thus allowing for easier comparison between the two models. The level 1 variables are essentially for actuarial purposes. We need them to take out variance and allow more precise estimates of the effects at levels 2 and 3 and not because we want to explain their associations with outcome.
Our level 2 (school level) variables were those which had either been used in the NPD analysis, or, in the case of the CVA scores, produced by it: 16 619 children do not have a KS2 score. In order to avoid dropping these children from the analysis we gave them an arbitrary score of 2.5 (the lowest mark possible) and allowed for the distortion this introduced by include ‘KS2 missing’ as a covariate.
68
School Type (the type of school recorded for the pupils). School % FSM - proportion receiving Free School meals at any time in previous 6
years School % SEN - proportion of pupils recorded as having a Special Educational
Need17 School Average KS2 Score CVA not CIN – the estimated average amount by which pupils who were not in
care or in need scored more or fewer KS4 points than expected from their known characteristics; that is, whether the general cohort of pupils in a school do better or worse than expected given the profile of the school and its pupils
CVA CIN - the estimated average amount by which pupils who were in need scored more or fewer KS4 points than expected from their known characteristics; in other words, whether pupils in a school who are classed as ‘in need’ but not in care do better or worse than expected given the profile of the school and its pupils
CVA CLA – the estimated average amount by which pupils who were looked after scored more or fewer KS4 points than expected from their known characteristics; that is, whether pupils in a school who are in care do better or worse than expected given the profile of the school and its pupils
All of these variables were measured as they applied at Key Stage 4 and using the full cohort of pupils rather than just those who were looked after longer-term.
The inclusion of CVA scores allow us to test our central hypotheses that a) CLA will do well in those schools where other children do better than expected but that b) schools will not additionally differ in the degree to which they do well with children in need or children who are looked after.
The inclusion of measures related to FSM, SEN and KS2 allow us to explore associations which were significant in some models in the NPD analysis presented in Technical Report 1 (see Table 20). These variables are inter-related and their effects on outcome could reflect the conflicting influence of deprivation and the resources it attracts18.
School type may influence outcomes but its effects, if any, are obscured by its influence on the kinds of children admitted. We include it in our model in order to allow for its influence rather than because we expect to explain its effects.
17 The proportions for FSM and SEN are likely to be significantly inaccurate for pupil referral units and alternative provision as they were calculated before some information on these units could be collected. A similar caveat applies to the variable ‘difficulties at school’ when this is used in the model for non-mainstream schools. 18 The effects of deprivation within the CLA sample may not necessarily be the same as in the general one. As shown in Technical Report 1, care reduces deprivation as measured by the FSM and IDACI scores, while relative risk changes with admission to the care system.
69
Our Level 3 (local authority) variables were:
LA Poor Families - Proportion of low income families in population LA IDACI – Mean IDACI score for children in full cohort CLA rate – rate of children looked after per 10,000 under 18 CIN rate – rate of children in need per 10,000 under 18 LA FSM6 – proportion of children in full cohort who had received free school
meals in past 6 years LA SEN – Proportion of children in full cohort who had a rating of special
educational need LA rating – OFSTED RATING for Children’s Care Services 2011 LA Care Cost – Average Cost per day of Care in Local Authority LA % Fostered – Proportion of children fostered in DFE Statistics LA % Residential - Proportion of children in residential care in DfE statistics
Those variables that were not calculated from the full cohort were taken from the DfE statistics and the Local Authority Interactive Tool (LAIT), for which we used the latest available year. Taken together they allow us to explore the possible effects of deprivation, the response to it (as in rates of children looked after or receiving free school meals) and the style and quality of provision (as in OFSTED Ratings and proportion fostered). Given the low amount of variance explained by local authority in Technical Report 1, we did not expect any of these variables to be strongly related to outcome or have strong expectations about the direction of any association we might find. As discussed later a number of them are very highly correlated with each other (r = .85 or above) and we needed to take this into account.
Findings
We built our models ‘from the ground up’, beginning with the simplest ‘variance model’ and then progressively adding variables at level 1, level 2 and level 3. The output (presented in Appendix E) should not present difficulties to those familiar with multiple regression, but requires an understanding of which variables are being used and what the notation means. The coefficient tables below therefore ‘translate’ the output
The tables which follow have all taken account of our set of predictor variables. Output tables for the three final models (mainstream, non-mainstream, and all schools) are included in Appendix E and cover: the predictor variables for each model along with their relationships with outcome, and the final models.
The ‘fixed’ part each model presents an estimate of the KS4 score provided by a constant, to which is added successive quantities calculated by multiplying the coefficients and the relevant variable (e.g. if a pupil has a score of 1 on a variable and
70
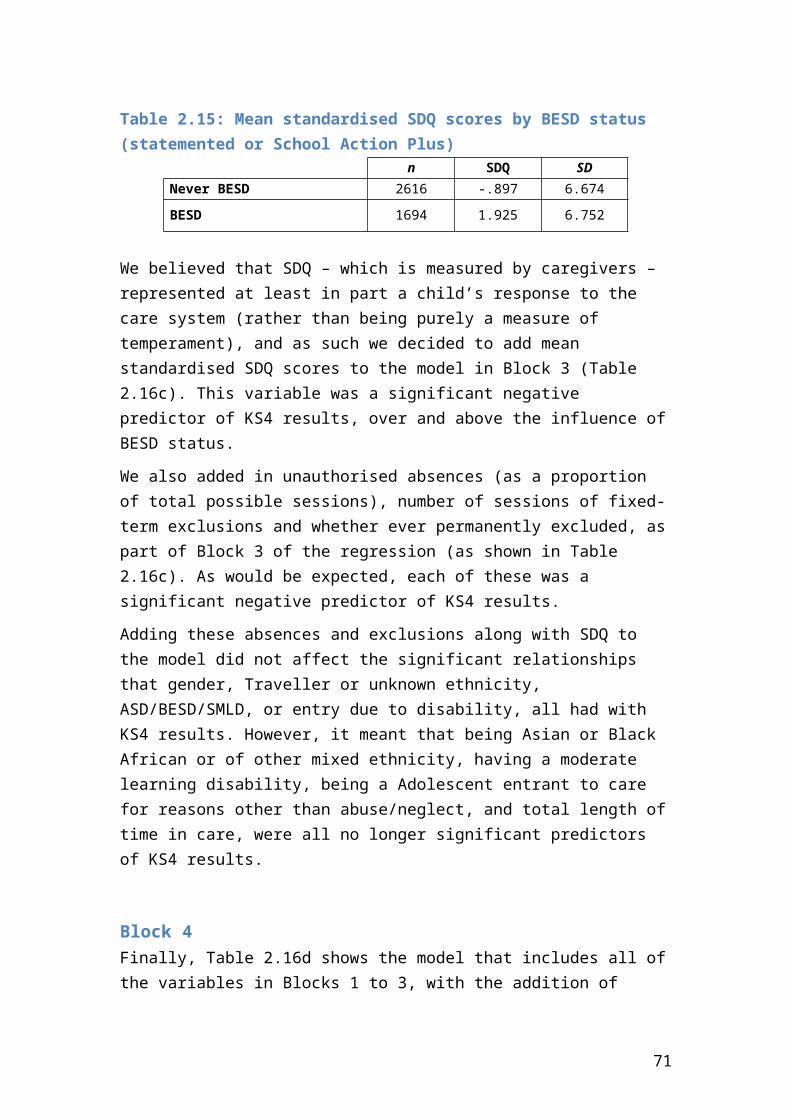
the coefficient is 25 this adds 25 to the estimate). The coefficients are given under the heading ‘estimate’ and the figures in brackets are their standard errors. If a coefficient gives a number of at least 2 when divided by its standard error it is usually considered statistically significant.
The figures in the ‘random’ part of the model relate to the variance which is unexplained by the fixed part of the model. MlWin allocates an estimated variance to the different levels of the model (i.e. there is a certain amount of variance in KS4 results to be explained by differences between individuals, a certain amount by differences between schools, and so on). The last figure measures the difference between the model and what is observed in the data; a smaller number means a better fit.
The tables that follow concentrate on the variables, that apply to the schools (level 2) and local authorities (level 3). Table 4.1 presents analyses for the mainstream, non-mainstream and full models without the level 2 and level 3 variables. As can be seen in Appendix E, the coefficients for the level 1 variables change slightly when we added in the higher-level variables but the changes were almost always very small.
71
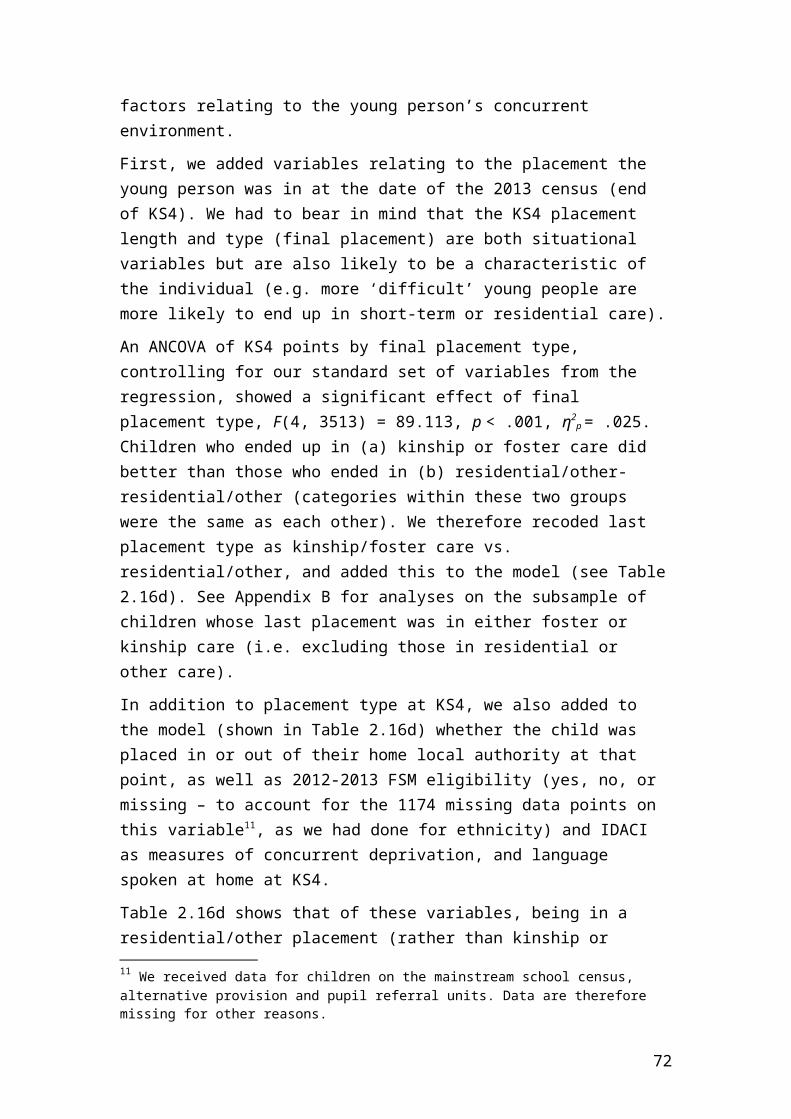
Table 4.1: Final multi-level models showing coefficients (and SE) for mainstream, non-mainstream, and all schools
Mainstream Non-mainstream All schools
Parameter
Fixed
Constant -562.01 (106.48) -120.67 (13.18) -103.29 (17.65)
KS2 Points (missing recoded as 2.5) 33.84 (2.27) 29.32 (2.33) 33.06 (1.68)
KS2 Points Missing (1 = yes, 0 = no) 20.49 (6.24) 15.59 (4.32) 17.25 (4.00)
Gender (1 = female, 2 = male) n/a n/a -6.90 (2.25)
Adjusted SDQ -11.91 (1.64) -6.74 (1.63) -11.49 (1.22)
FSM in Last 6 Years n/a 4.14 (4.24) 7.51 (2.48)
School Difficulty -35.22 (3.06) n/a -12.03 (1.54)
Care Difficulty -31.47 (1.70) -12.68 (1.50) -25.05 (1.22)
No Statement of SEN 18.14 (3.27) n/a 17.41 (2.70)
Autistic Spectrum Disorder n/a -22.126 (5.27) -19.06 (5.87)
Severe or Multiple Learning Difficulties -78.57 (19.33) -34.55 (5.17) -40.84 (5.89)
Ethnicity (White) n/a n/a -6.16 (2.75)
Ethnicity (Asian or Black African) n/a n/a 12.50 (4.97)
Academy (Converter or Mainstream) 15.96 (4.32) n/a n/a
Academy (Sponsor Led) n/a n/a 15.64 (4.42)
Community School n/a n/a -6.14 (3.62)
Foundation School n/a n/a -6.32 (4.24)
Voluntary Aided School n/a n/a -0.03 (5.10)
Voluntary Controlled School n/a n/a -19.02 (9.98)
Alternative Provision n/a -91.57 (5.75) -120.07 (7.01)
Further Education Sector College n/a n/a -43.63 (7.99)
Independent School n/a n/a 14.52 (12.39)
Pupil Referral Unit n/a -76.18 (5.74) -104.74 (6.26)
72
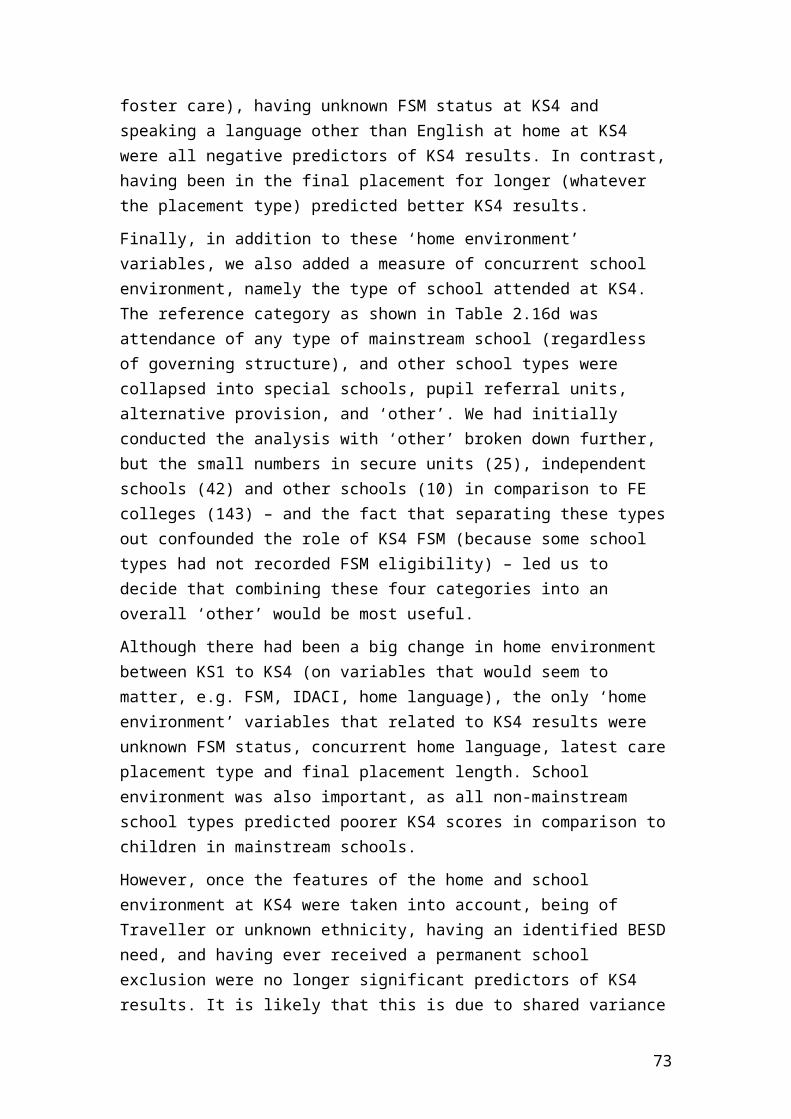
Secure Unit n/a n/a -62.93 (15.62)
Special School n/a -21.21 (5.06) -56.32 (6.34)
Other Non-mainstream School n/a 0.00 (0.00) -92.32 (23.68)
CVA for CLA 1.50 (0.07) 1.11 (0.04) 1.29 (0.04)
School Average KS2 Points 63.41 (10.91) 42.08 (3.56) 48.45 (3.70)
School Proportion FSM in Last 6 Years 87.19 (13.60) 23.19 (6.66) 33.84 (6.19)
Local Authority Proportion of CLA in Foster Care 37.72 (13.66) n/a n/a
Local Authority Percentage Low Income Families 71.11 (20.42) n/a n/a
Random
Variance (Between Authorities) 248.89 (186.58) 100.65 (186.02) 209.24 (111.48)
Variance (Between Schools) 323.17 (819.36) 1293.05 (430.11) 342.04 (505.31)
Variance (Between Individuals) 5594.39 (811.70)
2187.09 (383.65)
4843.10 (502.67)
Statistics
Cases in use 2971 1859 4830
IGLS Deviance (Chi square) 34356.38 20478.77 55206.28
Findings: Mainstream Schools
Do the CLA pupils do better educationally in those schools where the NPD analysis shows that other children did better? If so, are their results even better in those schools where the NPD analysis suggests that the schools do particularly well for the CLA (i.e. these schools have high CVA CLA scores)?
Table 4.2 gives the coefficients for the CVA scores along with an estimate of the effect of an improvement of one standard deviation in the relevant score on a pupil’s performance after allowing for the predictor variables..
Table 4.1: Association of CVA scores with outcome after allowing for relevant predictors in mainstream schools
73
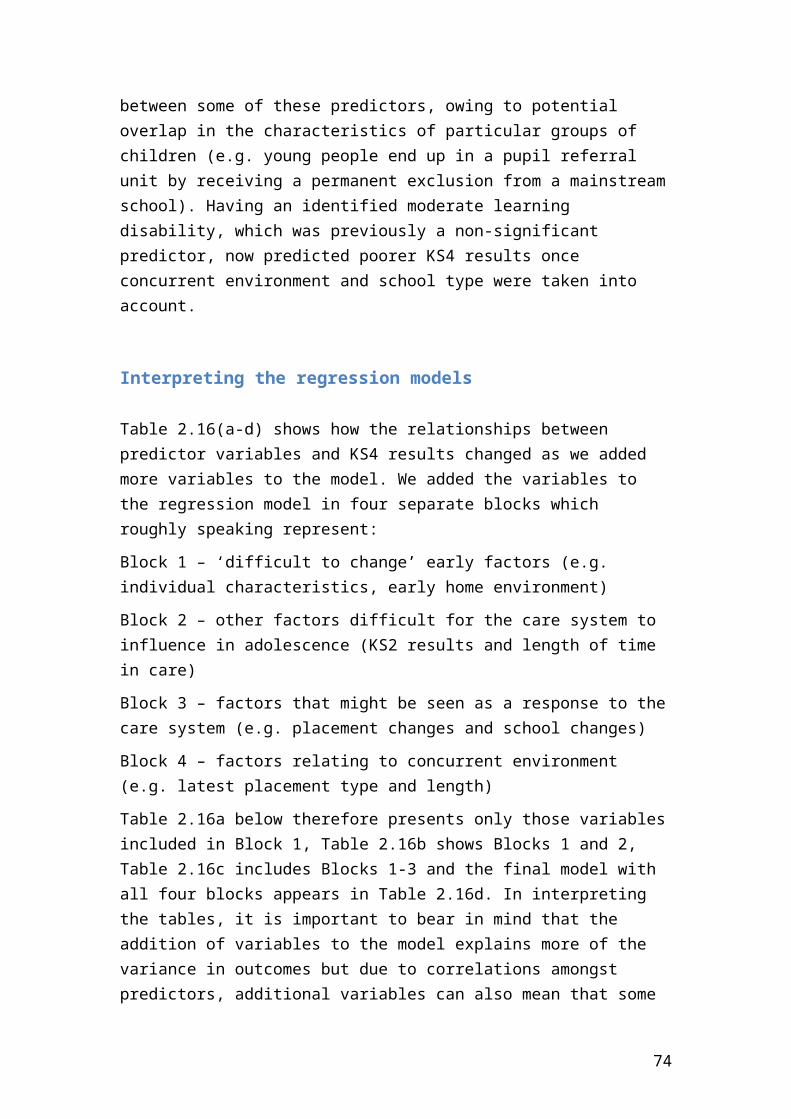
CVA Scores Coefficient SE of Coefficient
SD of CVA score
Effect Size (SD*coefficient)
Not in Need 1.107 .087 17.84 19.74In Need not CLA
1.223 .062 24.14 29.53
CLA 1.443 .065 22.74 32.81
As can be seen the hypothesis that CLA would do better educationally in schools where other children do better was very strongly supported. They also did particularly well in schools where the NPD analysis in Technical Report 1 suggested that they should (i.e. in schools with high CVA-CLA scores).
In terms of practical effect, an increase of one standard deviation in the CVA score for children who are not in need or in care would lead to an improvement of roughly three grades in the scores of children who are looked after (shown in the final column of Table 4.1, because one GCSE grade = 6 points). An increase of a standard deviation in the CVA scores for the CIN would result in an improvement of roughly five grades (e.g. five grades in one subject or one grade in five subjects). An increase of one standard deviation in the CVA score for the CLA would bring an improvement of roughly five and half grades. All these differences in the outcomes achieved are statistically significant but the main practical difference relates to the difference between the CIN and Non-CIN scores. Looked after children are likely to do well in those schools where all children do well academically. They are particularly likely to do well in those schools where NPD analysis found that the CIN do well.
Are the School Context variables included in the NPD models associated with outcome when account is taken of the CLA variables?
Our next models are concerned with three school context variables: proportions of SEN pupils in school, proportions of pupils with FSM in the school and mean KS2 scores for the school, after allowing for predictor variables and the CVA score for the CLA. These models are influenced by the relationship these variables have with each other in mainstream schools. Table 4.3 sets out this relationship in terms of the school level correlations.
Table 4.3: Correlations between School Level Measures in Mainstream Schools
School FSM School SEN School KS2pts Value Added CLA
74
School FSM 1 .471** -.680** .058*
School SEN .471** 1 -.561** .139**
School KS2pts -.680** -.561** 1 -.136**
Value added CLA .058* .139** -.136** 1
As can be seen, School FSM and School SEN are positively associated with each other and both have strong negative correlations with school KS2 points.. The effect of these relationships can be seen in our models. After taking account of the predictor variables and value added CLA, both school FSM and school KS2 points are significantly and positively associated with outcome. School SEN had a similar association to that found for FSM but was not significant and dropped from further analysis.
Table 4.4 gives the associations after allowing for the predictor variables when school FSM and School KS2 points are entered together with the value added score for the CLA.
Table 4.4: Association of CVA for CLA, School FSM and School mean KS2 points with outcome after allowing for relevant predictors and when all three are entered together
CVA Scores Coefficient SE of Coefficient
SD of Measure Effect Size (SD*coefficient)
School FSM 64.09 12.63 .16 10.25School KS2 pts
58.64 10.62 .73 42.81
CVA for CLA 1.5 .07 22.74 34.11
As can be seen, all three measures are highly significant and their combined overall impact could be considerable. The interpretation of these figures is left till later in this discussion.
Is there evidence from this study on the nature of any local authority level variables that may influence the outcome?
We next explored the possible relationship between the local authority level variables we included and outcome. As before, we need to understand the associations between these variables in assessing the results. Table 4.5 gives the authority level associations between those measures which most obviously reflected deprivation or the response to it.
75
Table 4.5: Correlations among selected Local Authority Variables
FSM 6 KS2 pts Rate CIN Rate CLA Av. IDACI % low inc.FSM6 1 -.656** .591** .519** .958** .926**
KS2 pts -.656** 1 -.402** -.419** -.621** -.663**
Rate CIN .591** -.402** 1 .668** .514** .642**
Rate CLA .519** -.419** .668** 1 .414** .651**
Av. IDACI .958** -.621** .514** .414** 1 .895**
% low Inc .926** -.663** .642** .651** .895** 1
The correlations in this table are high and represent the fact that authorities where there are many low income families, also tend to have high rates of free school meals, more children in need or looked after, high measures of area deprivation, and relatively poor educational attainment at primary school. The correlations between three variables (those relating Average IDACI, FSM6 and low income families) are so high that it would be misleading to enter them into our models together. We therefore first tested the effects of entering these variables on their own into the model containing the school level variables discussed earlier.
At this level the three variables most strongly correlated in Table 4.4 (those related to FSM6, IDACI and low income families) were all associated with poor outcomes in our mainstream model. The rates for CIN and CLA were not significantly associated with good or poor outcomes. ‘Average KS2 points’ was associated with good outcomes.
None of these associations changed the relationships at level 2 in any material way. We therefore have an ‘inconsistent’ pattern of results for FSM6 in the sense that high FSM6 is associated with good outcomes at level 2 but the opposite at level 3. By contrast the pattern for KS2 points is that high FSM is linked to better KS4 results at all levels.
We had other measures: the Ofsted rating of the authority’s care services, the proportions of looked after children fostered and the proportions in residential care, and the unit cost of a day of care. The proportions fostered and in residential care were so strongly negatively correlated that they could be seen as mirror images of the same thing. We therefore tested the other variables and proportions factored into the level 2 model. Only the proportions fostered proved to be significant.
Our final ‘best’ model for mainstream schools contained variables at all three levels. In creating this model the school level variables remain those we have discussed. Those at the local authority level which survived being entered with others were proportions fostered and average KS2 points for the authority. Table 4.6 sets out these associations after allowing for the predictor variables. Inclusion of the variable FSM6 at the individual level did not change the results.)
76
Table 4.6: Associations of School and local authority variables with in outcome in mainstream schools and after allowing for predictor variables
CVA Scores Coefficient SE of Coefficient
SD of Measure Effect Size (SD*coefficient)
School FSM 87.19 13.6 .16 10.25School KS2 pts
63.41 10.91 .73 42.81
CVA for CLA 1.50 .07 22.74 34.11LA Foster % 37.72 13.66 .11 4.09LA KS2 points Av
71.11 20.42 .08 5.69
These level three effects are small, less than one grade in one subject per child (as shown in the final column). Perhaps it is more important that they do not affect the associations already uncovered at school level. Taken together a change in all these measures of one standard deviation would lead to an improvement for each child of just under 100 points and this would be a policy goal worth seeking to achieve.
How far does the same model apply to Non-Mainstream schools?
We followed the same process in Non-mainstream schools and tested the same variables that had appeared in the final model for our mainstream one.
Table 4.7: Associations of School and local authority variables with outcome in non-mainstream schools and after allowing for predictor variables
CVA Scores Coefficient SE of Coefficient
SD of Measure Effect Size (SD*coefficient)
School FSM 27.94 5.75 .28 7.83School KS2 pts
41.93 3.96 .88 36.90
CVA for CLA 1.1 .04 34.66 38.16LA Foster % 2.03 11.82 .12 .24LA KS2 points 33.19 18.47 .08 2.65
77
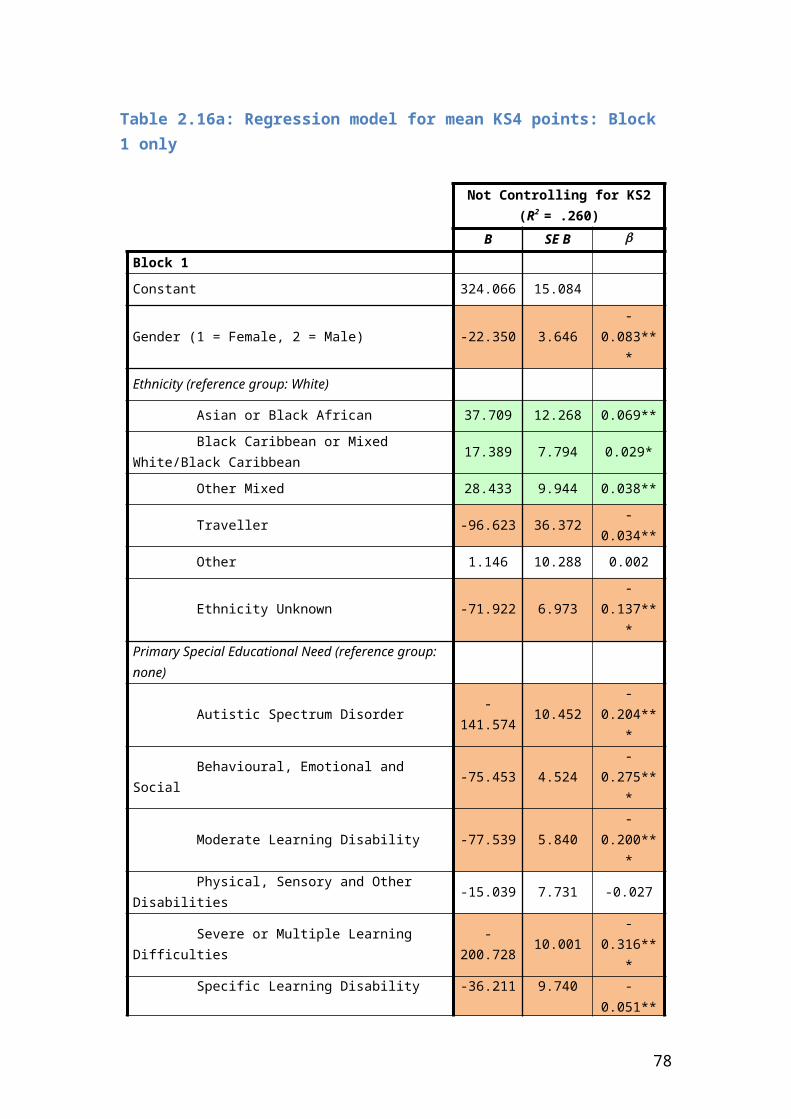
Av
The school level variables found to be significant in the mainstream schools are again significant in the non-mainstream ones. This increases the probability that these findings are statistically robust without doing much to clarify what it is that explains them. The effects of the last two (level 3) variables are tiny and not significant.
One variable was significant at the local authority level when it had not been so in the mainstream schools. If the OFSTED rating of care services is entered instead of the two local authority variables given in Table 4.7, it has a positive and significant association with outcome (coefficient = 4.56, SE = 1.53). The effect size is small with a shift of one rating point amount to an increase of less than one grade per pupil. So although much attention in practice and policy is concentrated on the local authority level as a lever for change, the analysis suggests that effects at this level are weak.
Given the very skewed distribution of educational outcomes in the Non-Mainstream schools we tested these results using the transformation described in the footnote. Those that we have quoted as significant also hold when this transformation is made19. Inclusion of the variable FSM6 at the individual level similarly did not change the results, although this time the variable’s positive association with outcome was not significant.
Full Model
The differences between the mainstream and non-mainstream schools seemed sufficiently small for us to create a final model for all the schools put together, and thus achieving greater consistency with the previous analysis that had gone forward on this basis. Table 4.8 gives the school level coefficients for the variables we have been considering after allowing for the predictor variables.20.
19 Just under a fifth (19%) of pupils in these schools scored 0 (presumably they did not take GCSEs). The scores of the others were very heavily skewed with the proportions reducing rapidly as scores increased. There was also a marked floor effect with young people unable to score less than 0 and a sharp downward sloping line from 0 in the scatter plot relating residuals to predicted values. Despite the large numbers these are potential problems wand we tested the final model by transforming the scores using the transformation Score’= ln(p/(1-p)) where p=(KS4pts+1)/480. This transformation normalized the distribution for those pupils who did not score 0. We ran the model using this outcome and both keeping and omitting those who scored ‘0’. The model remained substantially the same and we saw no need to change it. We ran the same tests with the same outcome for the final mainstream model.20 The level 1 predictors taken into account in the table are our earlier set of SDQ, school difficulty, placement difficulty, KS2 score with missing adjustment, whether a statement of special educational need, whether a statement of Autistic Spectrum disorder, whether a statement of severe or multiple learning difficulties and type of school attended. To this we added whether in receipt of Free school meals in the last 6 years at level 1 so that this variable, like KS2 points, was taken into account at this level as well as at level 2. Finally we added for the purposes of checking, gender, whether white, and whether Asian or Black African. The removal of these latter additional variables makes only a marginal
78
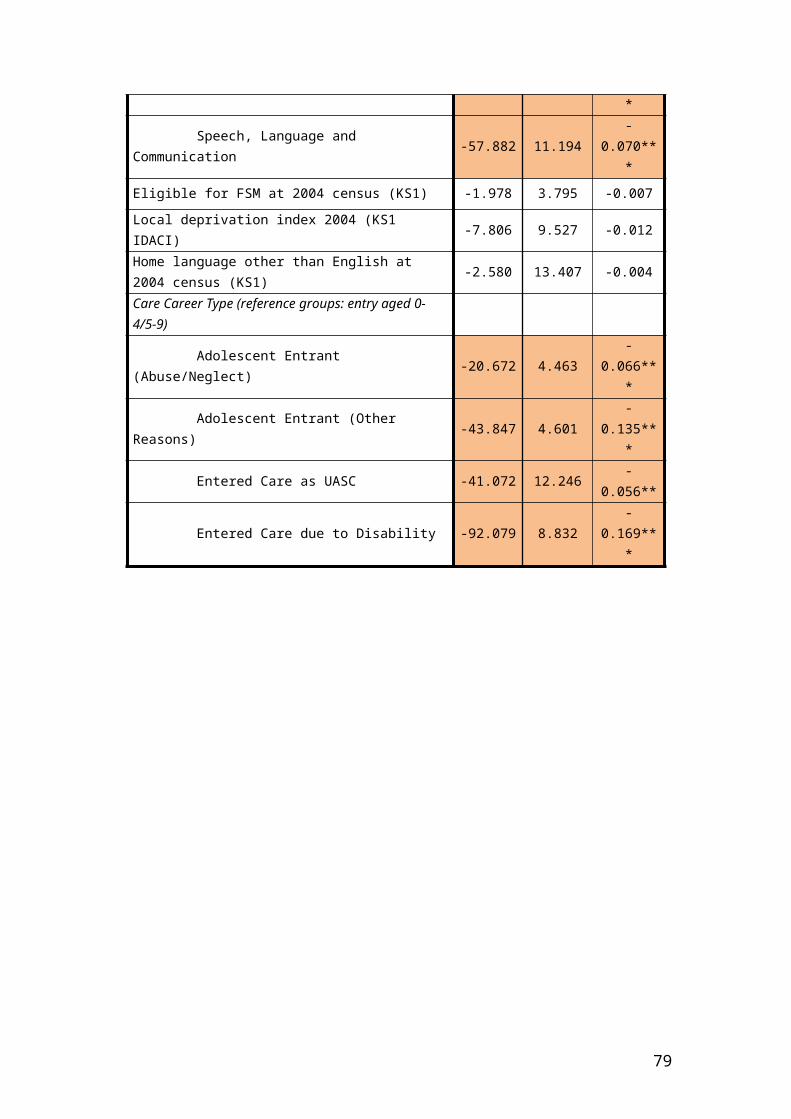
Table 4.8: School Level coefficients in different combinations after allowing for predictor variables: model applies to all schools
Variable Coefficient with level 1 predictors only
Coefficient with school FSM6 per cent
Coefficient with school KS2 points
Coefficient with school CVA-CLA
Coefficient with school KS2, FSM6, CVA-CLA
School FSM6
13.38 (6.55) - 26.12 (6.81) 10.08 (6.05) 33.84 (6.19)
School KS2 pts
24.80 (3.86) 29.20 (4.01) - 42.75 (3.56) 48.45 (3.69)
CVA-CLA 1.21 (.04) 1.21 (.04) 1.29 (.04) - 1.29 (.04)CVA- CIN 1.11 (.04) 1.11 (.04) 1.19 (.04) - -CVA-Neither
1.00 (.05) 1.00 (.05) 1.07 (.05) - -
The table shows the effects of adding the school level variables in different combinations. All are significant when added on their own. Schools that have many children who have had free school meals at some time over the past six years also tend to have intakes with below average KS2 scores. As both the relevant aggregates (School FSM6 and School KS2 points) are associated with good educational outcomes, the coefficients of each increase when they are considered together.
In this sample, however, the CVA scores have slight negative correlations with school KS2 points and even smaller positive ones21 with school level FSM6 aggregate. These correlations have a surprisingly large impact on the coefficients of the other two aggregates whose magnitude is greater when CVA scores are included in the model. When all three school level scores are added in together all three are very highly significant.
The coefficients for the various CVA scores are highly significant and largely unaffected by the addition of other school level variables. Their order of magnitude is as found earlier with the mainstream and non-mainstream models and although the differences between the coefficients look small they have a highly significant
difference to the coefficients given above. We also checked this equation using the logit type transformation and found that it still held.21 For the KS2 points these are -.1 (CVA-neither), -.17 (CVA-CIN) and -.16 (CVA-CLA) and for the FSM6 aggregate .074, .07 and .088. Given the large numbers of schools these are very highly significant but they are of course tiny nevertheless. School level FSM6 falls just below significance when considered on its own with one of the CVA scores. However, it is significant on its own and when entered with KS2 points. This justifies its inclusion in the final model where it is again very highly significant.
79
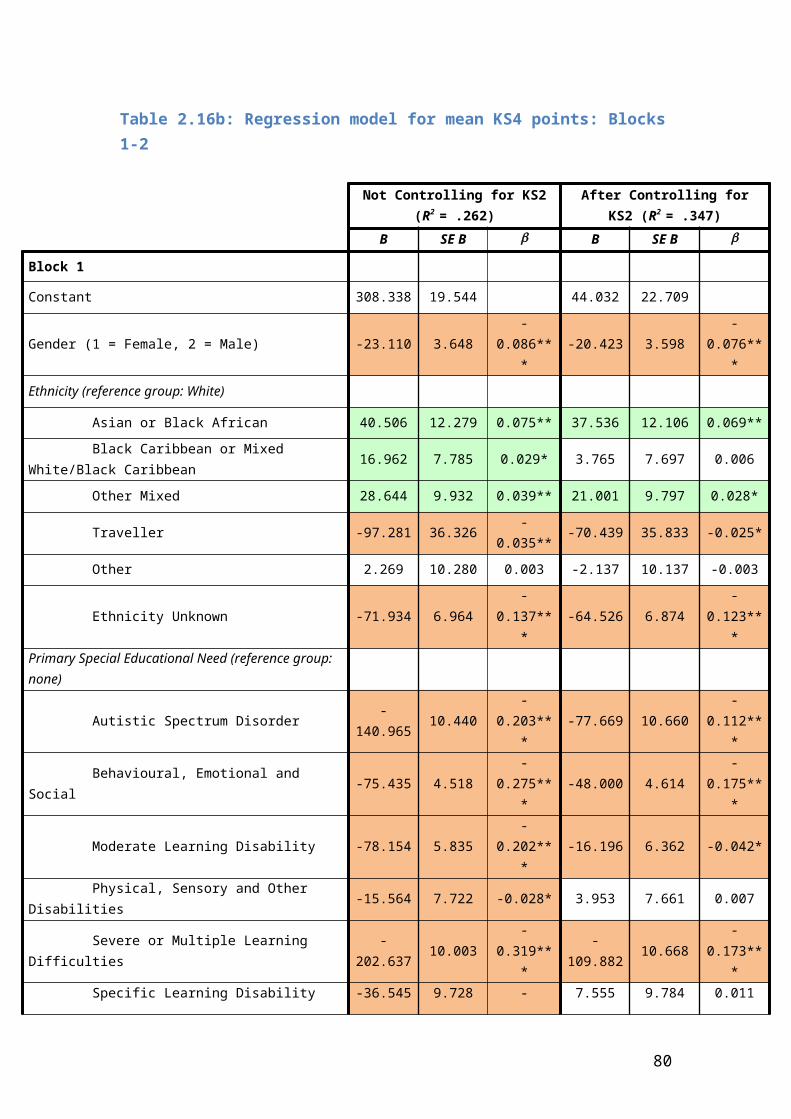
impact on the significance of the various models. Thus it remains true that schools which seem to benefit ‘Non-CIN’ children educationally also seem to benefit the CLA. In addition some schools seem to be particularly good with the CLA.
Table 4.9 illustrates what the findings on FSM6 and KS2 may mean in practice. The schools have been divided into 9 groups depending on whether they are in the top, medium or lowest scoring group for the KS2 point average, and again similarly for the proportions who had received free school meals in the past 6 years.
Looking within the schools that have low KS2 points, it can be seen that there is a consistent trend. Children who go to these schools do worst if they go to schools with few FSM pupils, better on average if they go to schools with a medium number of these pupils and best of all if they go to schools with a high number of these pupils.
This trend is repeated within the medium and high average KS2 point schools. In each of these a higher level of pupils with FSM6 goes with better results. In the sample as whole, however, schools with medium levels of FSM6 overall tend to do better than schools with high FSM. The reason for this can be seen in the numbers and reflects the fact that schools with a high average score for KS2 points tend to have few looked after children who have had free school meals and vice versa22.
Table 4.9: Mean KS4 pints (and SD) by Schools grouped according to average KS2 points and proportions of children who have had free school meals in past 6 years
Percentile Group of School FSM
Percentile Group of School KS2 Points Low Medium High
Low99.40 (94.40)
N = 735276.62 (148.90)
N = 182347.54 (162.25)
N = 346
Medium217.88 (198.94)
N = 548348.81 (162.60)
N = 563363.59 (159.95)
N = 249
High231.55 (197.90)
N = 1836365.60 (155.52)
N = 345395.70 (183.53)
N = 30
Finally we looked at the effect of adding our level 3 variables to this equation. None of them was significantly associated with outcome.
22 There are, for example only 30 children in the schools which have high KS2 points scores who are also in schools with a high number of FSM pupils. This compares with 1836 pupils who are in schools which have a high number of pupils who have received FSM and are in schools with a low average numbers of KS2 points. Thus although the 30 pupils in the first group have the highest average KS4 score of all (395 as against 231 for the second group), their effect on the overall average for looked after children or indeed for those looked after children in high scoring schools is minimal.
80
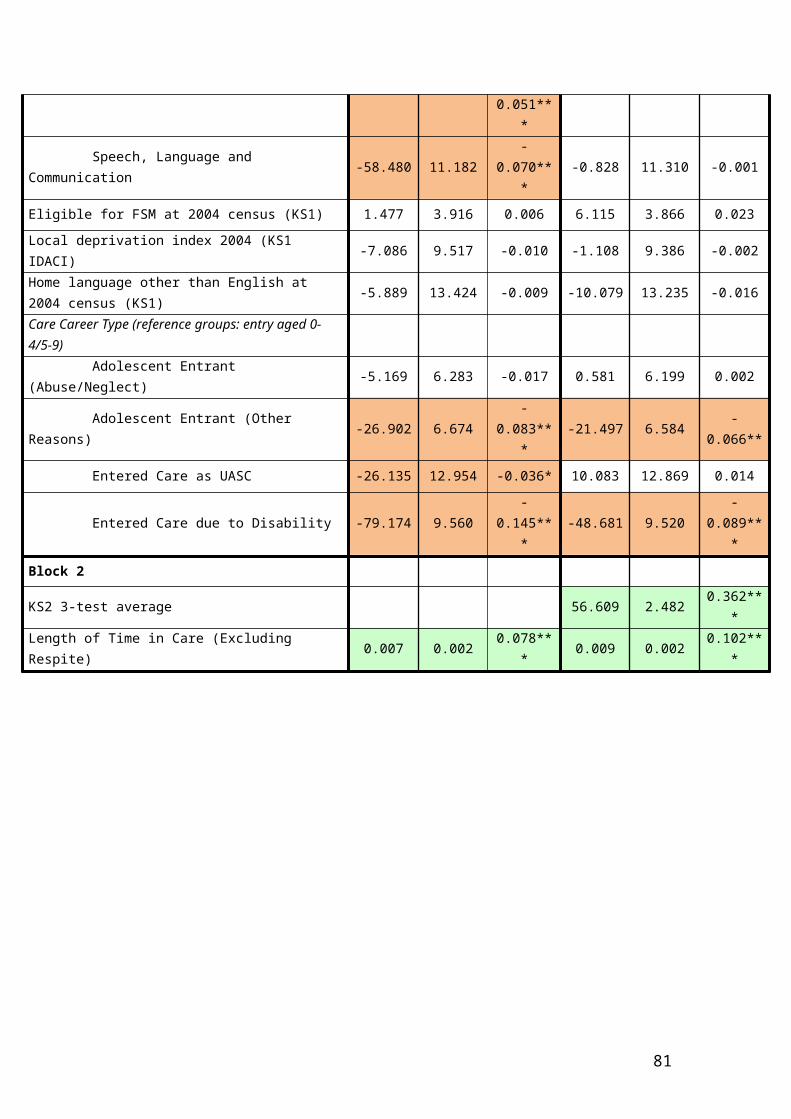
Part 4 Summary and Conclusion
Our models for mainstream, non-mainstream and all schools suggested that almost all of the school level variation was statistically ‘explained’ by three variables, each of with had a positive association with KS4 results:
The proportion of children in receipt of free school meals in a school
A measure of the average KS2 scores of a school’s intake
The CVA scores calculated in Technical Report 1
There were three CVA scores and they were all strongly associated with outcome and with each other. As a result we only entered one at a time into our models. As might be expected the strongest association was with CLA -CVA which was the measure derived from the NPD analysis of the degree to which the CLA did better or worse than expected in a particular school. The measure of how far non-CIN children were doing better or worse in a particular school had the weakest relationship of the three with outcome but it was still true that CLA children did better than expected in schools where children who were not in need were also doing better than expected.
Variables at the local authority level seemed to have little impact. Children in local authorities which had a high level of deprivation (as measured by the proportion of low income families) tended to have worse outcomes in mainstream schools. However, these were also the authorities that had relatively low proportions of their looked after children in foster care and low average KS2 points across the authority. These two variables were better predictors of outcome when entered together, although their impact at the level of the individual looked after child was small. These results were, however, restricted to mainstream schools. In non-mainstream schools only the Ofsted rating of the quality of children’s care services predicted outcome. In the model covering all schools none of our local authority level variables predicted outcome at all.
81
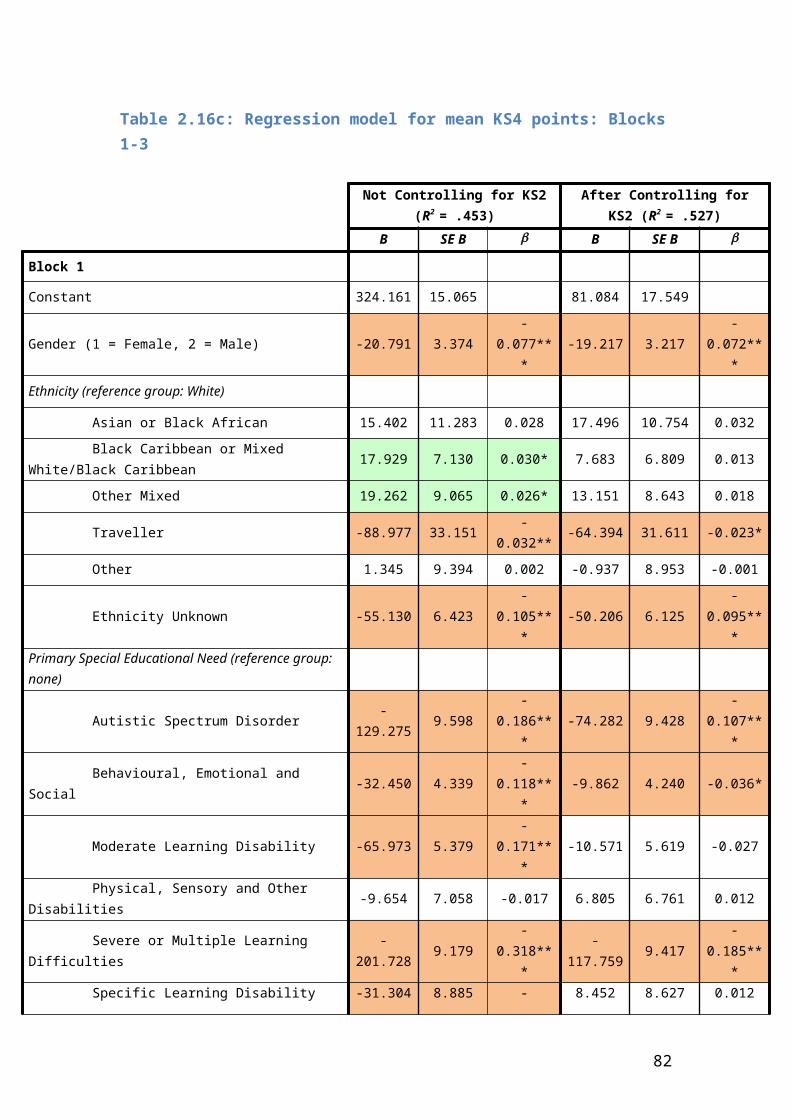
Overall Conclusion
In this final part of the report, we consider what the analyses conducted in Parts 1-4 tell us about the educational attainment and progress of children in care. We do this firstly by presenting a reflection on the findings from the four parts, and subsequently by drawing out the key messages that have arisen throughout the analyses.
Summary of Parts 1-4
The analysis in Part 1 showed a difference of just under 140 GCSE points between the longer-staying group and those children who were not in any kind of need. This gap probably does not have a simple unified explanation. It starts young and before most of the former group had entered the care system. These children come from deprived groups as measured by their likelihood of receiving FSM while in the community. This probably depressed their performance and may have had a particular impact on white working class boys.
Poverty, however, as measured by receipt of free school meals did not of itself account for the gap. More relevantly , the sample of interest (CLA-LT) had very high proportions of children who had statements of special educational need or who were in non-mainstream schools. The outcomes for these children were dramatically worse than those of others and their presence in the sample of interest helps to explain the gap while reinforcing the impression of a large difference between those CLA who do very much worse than the general run of pupils and those whose performance is only moderately depressed.
Educational outcomes among the CLA remained worse even after taking account of statements of educational need and type of school attended. They were not, however, worse than those of the children in need who were not looked after. The most likely explanation for the depressed performance of these groups is that both experience distress which is not measured in the NPD.
In keeping with this, the evidence from Part 1 does not support the view that care is of itself bad for the education of those who receive it.. As already mentioned the problems start before the children enter care. The explanation for the educational problems of CIN and those in short-term care must be sought outside the care system.
82
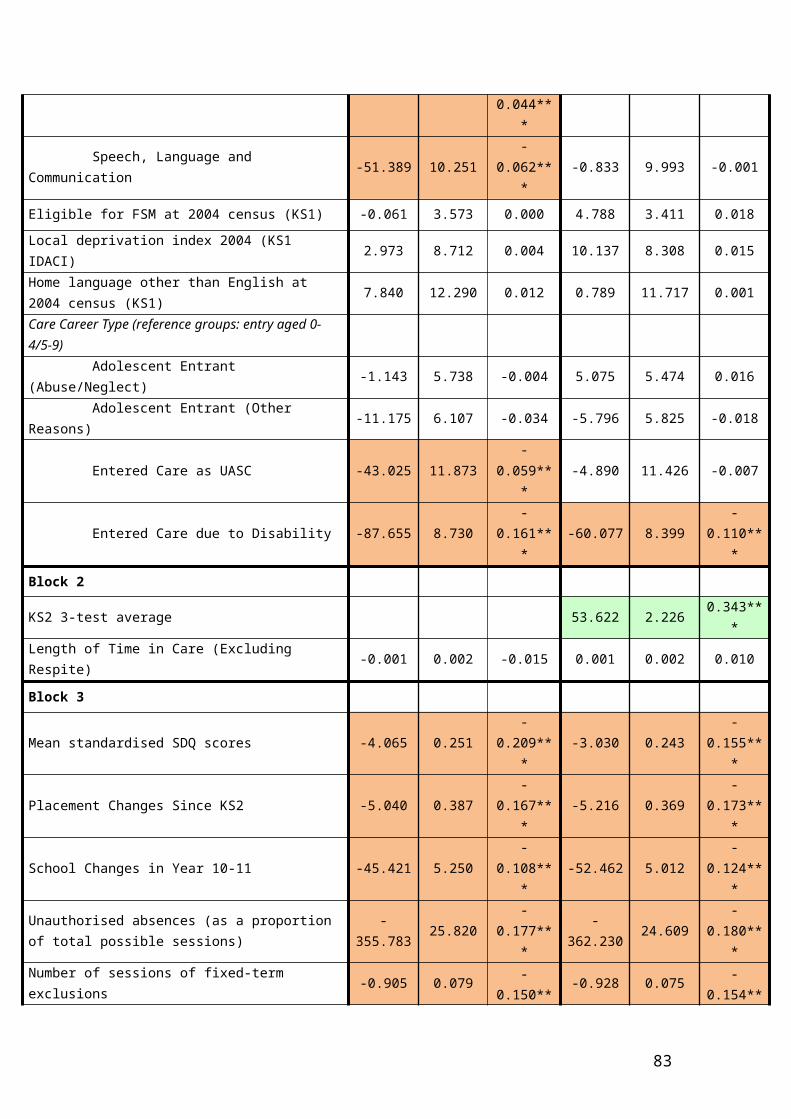
In addition, as Technical Report 1 also showed, CLA-LT did better than children in need. In the case of the early-entry CLA-LT group the rate of relative decline seems to be halted and even reversed. Late-entry CLA-LT fare less well but their decline in their teenage years is less than that of those who enter care really late or indeed that of the CIN group who never enter at all. Care may benefit later admissions but it does not fully reverse the damage that may have been done. There is also some evidence that the negative effects of deprivation apply in the longer-stay group while they are at home but may be reversed on entry to care.
In Part 2 we examined a number of specific research questions around the relationships between the characteristics and experiences of the CLA-LT group and their KS4 results, as well as building an increasingly complex regression model to investigate the relative contribution of properties of the individual, their early and concurrent environment, and experiences at school and in care.
We found that some of the factors that predict poorer progress from KS2-KS4 in the general population also hold for children in care (gender, some special educational needs, and school factors including moves during the GCSE years, unauthorised absences and fixed-term exclusions, and non-mainstream schooling). Other factors that were important predictors in the larger cohort – such as early deprivation – were not linked to educational progress for this group, arguably because the material circumstances of the CLA are better after they enter care than they were before.
The linking of data from the NPD and CLAD allowed us to explore the additional role of experiences in care, and revealed that instability of placements and being in particular placement types at the end of KS4 (specifically, residential and other non-foster placements) were linked to poorer GCSE results. Instability both in school and in care had its strongest relationship with KS4 results when it occurred during the GCSE years, and changes in the two contexts were related to each other.
Our analyses in Part 2 also examined the potential reasons for the ‘widening gap’ between CLA and their peers from KS2 to KS4, and suggested that: (a) adolescents first entering care can often come in for reasons other than abuse or neglect, and are less likely to do well educationally; (b) they have had less time for any benefits to take effect; and (c) some ‘better performing’ children who entered at a younger age may have left the system, for example making successful returns to birth families or being adopted.
Building the regression model in stages in Part 2 allowed us to show how the addition of further factors in the model could change the relationships between the predictors and the outcome. These changes highlight the importance of considering the complexity of the contexts, characteristics and experiences of young people in care when attempting to answer questions about risk factors for their educational
83
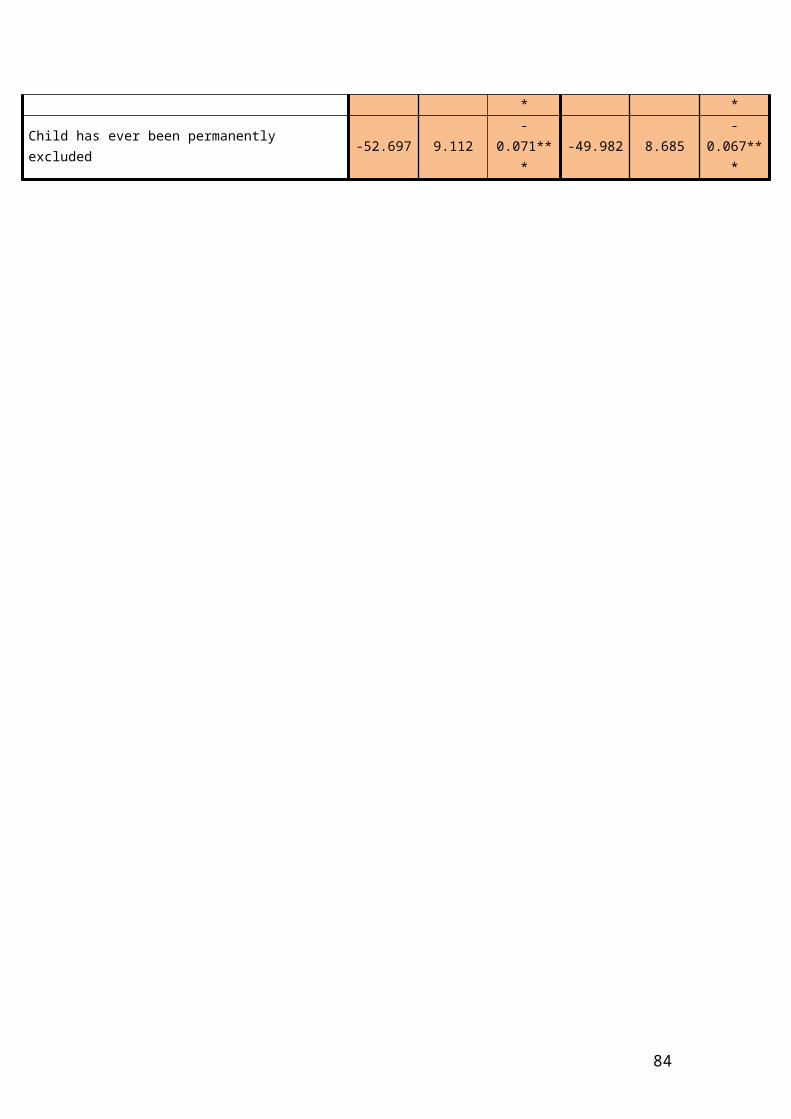
attainment. Acknowledging that some risk factors might cluster together to form particular ‘risky profiles’ can help us to move beyond the view that any one factor is in and of itself a ‘bad thing’. Taking account of all these complex factors enabled us to build a model that statistically accounted for approximately two-thirds of the variation in educational outcomes.
This idea of ‘profiles’ was further examined in Part 3. We reasoned that we could create profiles that reflected difficult experiences in both school and care, using variables available in the NPD and CLAD. The inter-relationships between these measures of experience, a measure of young people’s ‘difficulty’ (mean SDQ scores), and their educational attainment were examined in a path model. The analysis showed that school and care difficulties were related but distinct experiences.
Part 3 also created a tentative causal model to explain the educational outcomes achieved. This begins with two main factors which we regard as set by KS2 – educational attainment at KS2 itself and a measure of difficulties in the young person (SDQ). The effect of these initial variables on outcomes is partly direct but also mediated by the young person’s reaction to school and care as measured by placement instability and school instability. Children who have unstable care careers are more likely to have unstable school careers but have worse educational outcomes even when their school careers are stable, Similarly children with unstable school careers tend to have unstable career in care but to have worse educational outcomes even when in stable placements.
Our model suggests that early interventions which improved attainment at KS2 or which reduced distress and difficulties at this point would have a strong effect on outcomes at KS4.. It also suggests that a key consideration in improving the educational attainment of ‘difficult’ young people lies in addressing not just their own behavioural difficulties, but also the way that educational and care systems respond to those difficulties, for example with school exclusions and placement changes. According to our model, Interventions which increased stability by effectively tackling the reasons for instability at school or in care would also have a strong effect on the educational outcomes for this group.
In Part 4 we conducted a multi-level analysis on the CLA-LT group, using the data from the combined NPD and CLAD. The majority of variance in KS4 results was explained by variables at the individual pupil level. There was some explanation of variance at the school (in terms of the school’s free school meals population, their intake’s average KS2 score, and their CVA score), but variables at the local authority level seemed to have little additional impact.
These findings are relevant to placement decisions and to policy. Those placing looked after children should consider schools which seem to achieve better than expected results with other children, which have reasonably high attaining intakes,
84
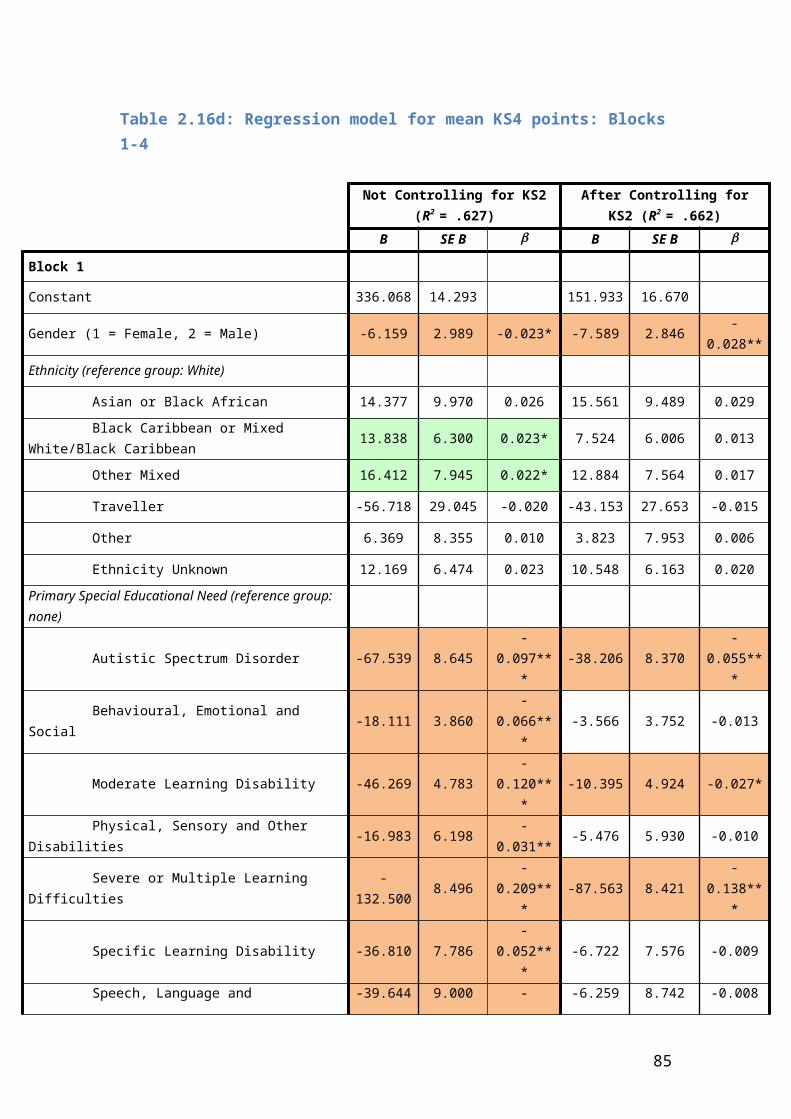
and which include a relatively high proportion of ‘deprived children’ as measured by the proportions who have been given Free School meals in the past six years. It is unlikely that these are the only considerations and they may not be overwhelming ones; nevertheless, they should be borne in mind.
The positive association between outcomes and school average KS2 points repeats a result from Technical Report 1. The model suggests that it should have a ‘contextual’ explanation and this may well be correct. However, it could also reflect characteristics of the pupils that it has not been possible to take into account. Either way it reinforces the evidence on the initial KS2 score. We saw in our descriptive analyses that around half the children were not in the care system when they were assessed at KS2 and that their educational outcomes would probably have been better if they had been looked after earlier. It seems that they may face additional barriers in being much more likely to go to schools where other children have not attained high levels at KS2 and that their results may well be worse in part for that reason.
In practice, a policy of putting young people in care earlier would be dubiously legal and in any case highly expensive. This is not only because of the direct costs of care, but because it would almost certainly result in many other children becoming looked after who would otherwise not have done so. In addition, such a policy would have little impact on the wider population whose progress may be hampered by entering schools where the initial level of attainment is low. The findings do, however, point to the difficulty of tackling the problem of low educational achievement in care in isolation from the problems of children in need and to the probable importance of tackling these problems early.
The finding on the apparently positive effect of FSM is interesting. It also repeats a result from Technical Report 1 and shows that it applies, if anything, more strongly to the CLA than it does to the population of children in general. Given the usual use of this variable as a proxy for poverty, it is not what would naturally be expected and it accounts for a very low proportion of the variance. However, there is a lot of variance to be explained and its practical effect is not negligible. A possible explanation is that it is a proxy for experience with deprived children and for the resources they attract. There is a lively literature on the use of the extra resources that have been provided for deprived children. These figures in no way determine what is good practice in this area but they do suggest that some practice may be good. The problem is therefore to identify what this practice is.23 One of the
23 Suppose, for example, that the effective ingredient was ‘extra school resources’. For these to impact on an individual pupil, there would need to be measures on which these could be spent which were effective, they would need to be available to the school and relevant to her or him, and he or she would need to assessed for them and get them, and they would have to be well delivered. The probability of all these conditions being fulfilled may well be quite low and hence the low amount of variance explained.
85
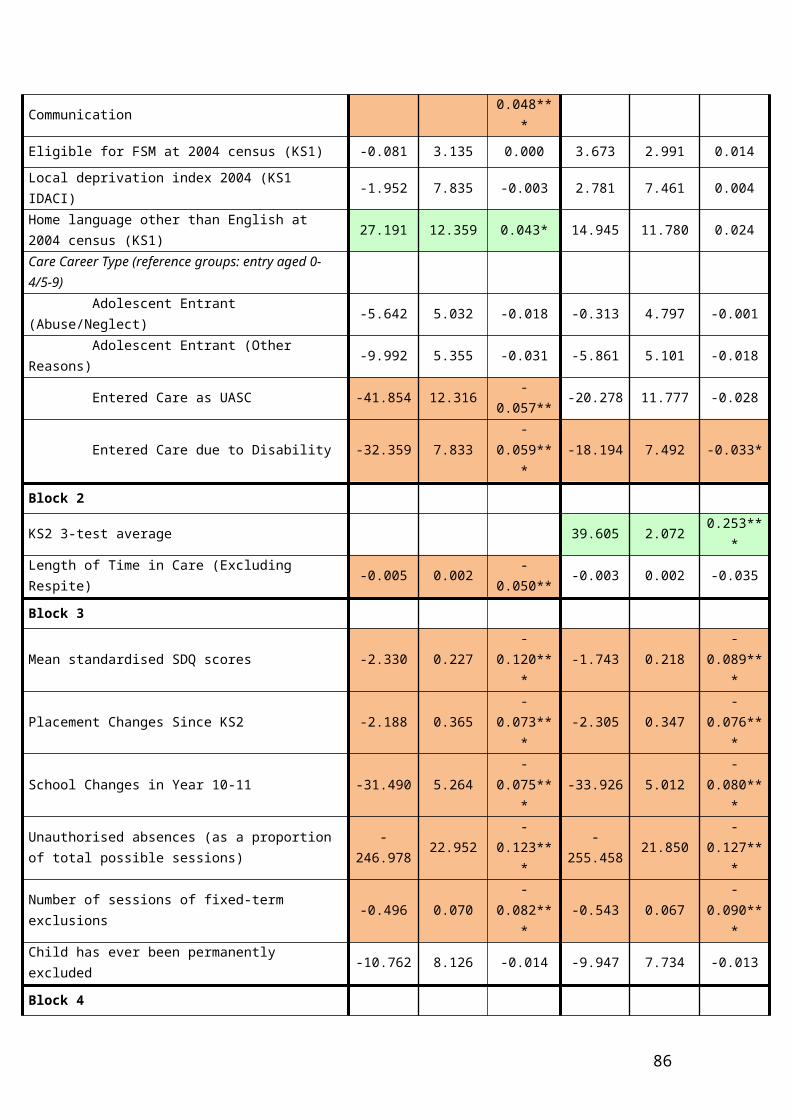
strengths of the qualitative study presented in Technical Report 3 is that it may help towards doing this.
The most robust findings relate to the CVA scores which held for all three of our final models in Part 4. They were tested using a different set of covariates to that used to create them (and in the case of the scores for the Non-CIN on an effectively different sample). Nevertheless they added at least as much value (and in the case of the CVA for the CLA in mainstream schools nearly 50% more) as they had done in the analysis of the whole cohort presented in Technical Report 1.24 The implications may well be the same as those for the less robust findings on FSM and KS2 points. It seems likely that some schools are using good practice. It is likely that this practice is not simply relevant to the CLA. The task is to identify this practice and ensure that it is applied to the wider groups from whom the CLA are drawn.
Key messages
First, the CLA are not a homogenous group. The distribution of outcomes suggests at least two very different populations and this is in keeping with the differences in scores between those in mainstream and other schools, and those with different categories of SEN. These differences clearly exist among other children but to nothing like the same extent. Thus the proportion of children in non-mainstream schools is roughly ten times as great (after excluding independent schools) and the proportion with special educational needs is four and a half times as great. The implications of these findings are:
The gap is not nearly as formidable if different groups are taken into account – for example, the gap between CLA-LT and those who were neither in care nor in need is less than 40 points amongst those who have BESD.
Different measures are likely to be needed to close the gap for different sub-groups. For example, the approach needed for CLA with severe and multiple learning disabilities in special schools is unlikely to be the same as that needed for children with statement of educational need in mainstream schools.
Targeted research strategies may also be needed. For example, an understanding of why some children essentially fail to get any GCSES may involve different processes to an understanding of why children in care who do take GCSEs routinely do somewhat worse than their peers.
Second, the gap in performance starts early, before most children are in care. Care does not cause it and in most cases probably reduces it or prevents from widening
24 These findings may have relevance to the interpretation of Non-CIN CVA scores. It is tempting to see CVA as reflecting individual variables which predict outcomes but are not measured in the NPD (for example, the willingness of schools to exclude pupils or the effects of ‘keen’ parents attracted by a school’s reputation). Such mechanisms are less likely to apply to children in care. The fact that CVA scores for Non-CIN seem to affect them in much the same way is therefore encouraging.
86
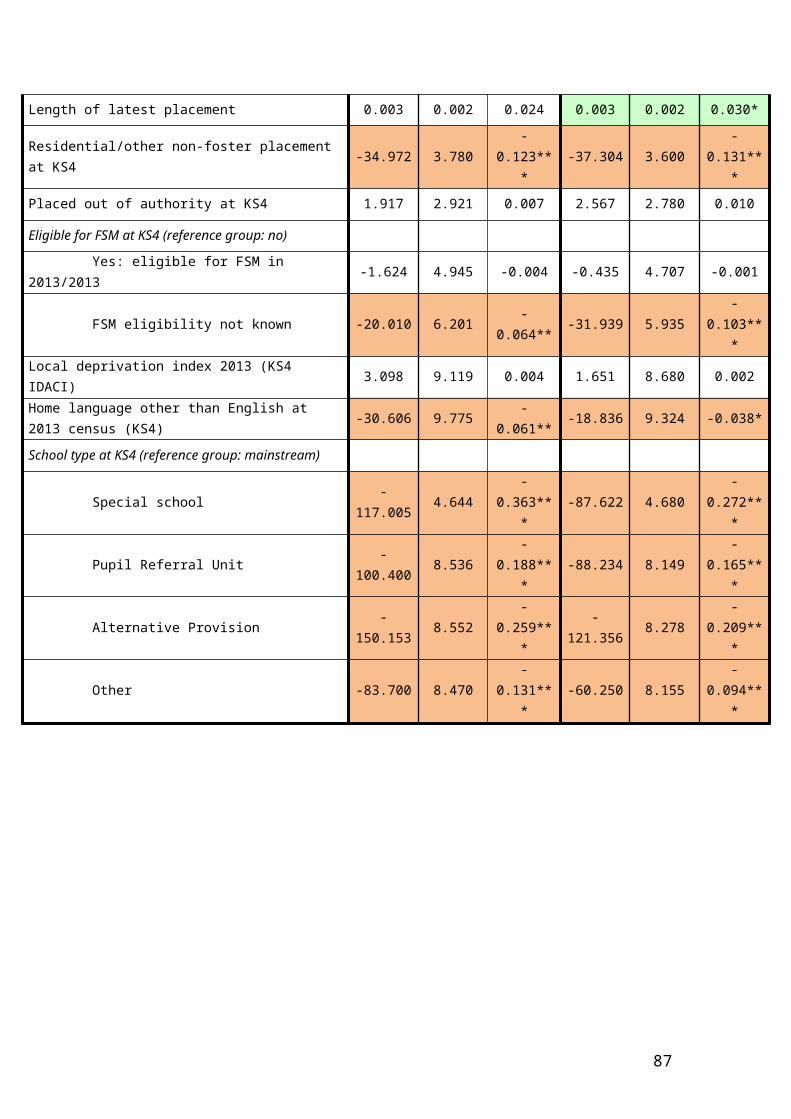
yet further. Thus early admission to care appears to reduce a steady trend towards worsening results found among children in need. Late admission appears less effective in this respect but still seems to alter the pace of decline. In keeping with this it seems that for lengths of stay of up to 5 years in care, the longer a child spends in the care system the better they do. Similarly the comparative analysis in Part 1 shows that looked after children as a group tend to do better than children in need. The implications of this would seem to be:
It is difficult to do something about the educational problems of children in care without also tackling those of children in need. The latter are much more numerous, seem to have even worse results and are the group from whom children in care are mainly drawn and among whom their educational destiny may be in some cases decided.
The fact that care may in some ways be doing a good job is in keeping with other evidence from the child-care field. It does not mean that it could not be doing a better one.
Third, if care is to be doing a better job, this has to be based on an understanding of what it is that is holding the children back. It is highly unlikely that this can be understood solely in terms of the variables that are found in the NPD. The regression equations and the path analysis do indeed suggest that it has to do with early educational attainment, and the response to secondary school. These however are strongly associated with factors to do with care, the child’s ‘disturbance’ (for which SDQ scores serve as a proxy), and the child’s response to it, and these are linked to both school response and final outcome. A rational strategy for tackling the problems would therefore include educational measures (e.g. reading tuition) but also efforts to reduce the stress on children or provide them with ways of tackling it. Insofar as it involves educational approaches it should probably include efforts at early intervention since some of the final outcome seems to be affected by KS2.
Fourth, schools are probably part of the solution to the problems. CLA do well in those schools where other children do well but there also seems to be some factor which means that some schools are particularly good with them. In addition there is some evidence that a combination of an ‘academic’ intake (in terms of average KS2 score) and a habit of taking a high proportion of children with FSM is associated with better than average success. The implications of this seem to be:
It is rational for those continuing to place CLA in better performing schools. It is rational to suppose that some of the resources being devoted to the FSM are
being put to good use. We need a determined effort to identify and describe potentially promising
approaches and then put them to the test.
87
References
Enders, C. K., & Bandalos, D. L. (2001). The relative performance of full information maximum likelihood estimation for missing data in structural equation models. Structural Equation Modeling, 8, 430-457.
Kline, R. B. (2005). Principles and practice of structural equation modelling (2nd ed.). New York: Guilford.
88
Appendix A: Note on variables used in Part 2 of this report
Free School Meals
We were interested in discovering (a) whether FSM at KS1 could provide a reliable indicator of early disadvantage for CLA or whether a separate variable would need to be created, and (b) whether the variable used in our previous analyses (FSM6_KS4 – i.e. eligible for FSM in any of the 6 years preceding KS4 exams) was a reliable one for our cohort.
We first created a variable PrecareFSM, which showed FSM status at the latest Key Stage before the child entered care – this was not perfect but would include most children.
We ran ANOVAs for KS4 results using this variable, which showed:
PreCareFSM predicted better KS4 results, even after controlling for KS2 results. This main effect was no longer significant once we included Career Type.
We re-ran the analysis only on the two Adolescent entrant categories, because these groups more commonly had FSM before they came into care. Controlling for KS2 results showed:
Adolescent entrants who were eligible for FSM before entering care did better at KS4 than those who were not, though the difference was not large (around 7 points).
Further tests with these two Adolescent groups showed that KS4 (i.e. concurrent) FSM status was not related to KS4 results after controlling for KS2 results. Having both Pre-care and KS4 FSM status in the ANOVA, only Pre-care was a significant predictor, with those who were FSM Pre-care doing better.
We originally thought it might be that removal from poverty into care is better for the young person, however if this was the case then any effect was small. Change of FSM eligibility status after entering care produced little difference in KS4 results.
We also thought it might be a selection effect, i.e. that FSM-eligible young people are more ‘difficult’ children. However, neither Pre-care FSM nor KS4 FSM was related to mean SDQ score, ever having had abnormal SDQ status, or ever having had BESD as an SEN, in the two Adolescent groups. But when we looked at all career types, we found that the children who entered care due to disability had higher (i.e. ‘worse’) mean SDQ scores if they had not been eligible for FSM pre-care than if they had been; this suggests a selection effect, because disabled children from poorer families might be removed at a lower threshold of behaviour/it’s harder for poorer families
89
to cope/behavioural issues need to more challenging when the financial situation is not so bad.
Our analyses suggest that:
A separate PrecareFSM variable is not needed, because the relationship between this and KS4 results was no stronger than that between KS1FSM and KS4 results; moreover, most of our sample (74%) were not in care at KS1.
The FSM6_KS4 variable is unreliable, because in our analyses it showed a relationship with KS4 results only in the two Adolescent categories. This is almost certainly an artifact and suggests that this is probably not the right variable to use in the MLM for this sample. This is supported by the fact that FSM6_KS4 is 0 for all children in secure units, FE colleges, independent schools and most of those in PRUs.
School and placement instability
As well as the measures listed under Research Question 3, we also created a school instability variable, which added up the yes/no for school change in Y9 and the yes/no in Years 10-11 to create school changes in Y9-11 (0 = neither, 1 = either, 2 = both). This variable was not as strong a predictor of KS4 results as Year 10/11 changes alone, but was still a significant partial mediator of placement changes since KS2 on KS4 results, t = -7.461, p < .001. We decided to use school changes in Year 10-11 as the key school instability variable in our model.
To examine whether our proposed direction of effect was the most plausible, we checked whether there was a mediation effect in the opposite direction: i.e. whether the relationship between school changes and KS4 results could be partly explained by subsequent changes in placement. To make a clearer temporal argument than would be possible if both school and placement change variables covered the period of KS4 (in which case we would be unable to determine which had come first), we tested whether (a) School changes in Year 9 predicted KS4 results, after controlling for our standard set of variables; (b) School changes in Year 9 predicted Placement changes during KS4; and (c) Placement changes during KS4 mediated the relationship between School changes in Year 9 and KS4 results. We found that Y9 school changes did indeed predict KS4 results, as well as predicting KS4 placement changes, and that there was a significant (albeit partial) mediation by placement changes during KS4, t = -2.027, p = .043. These additional measures have not been included in the regression model, given the small associations and potential for shared variance. So placement changes since KS2 and school changes in Year 10-11 are retained as the proxies for instability.
90
Appendix B: Supplementary analyses on kinship vs. foster care at KS4
An ANCOVA of KS4 points by last placement type for the subsample of children whose last placement was in either foster or kinship care (excluding those in residential or other care) showed no significant difference between the two placement types in KS4 results once the standard set of variables had been taken into account, F(1, 2284) = 0.736, p = .391, η2
p < .001.
There was a significant difference in the IDACI measure of local deprivation at KS4 when comparing those in kinship and stranger foster care at KS4, t(429) = 8.251, p < .001. Young people whose final placement was in kinship care were more likely to live in a more deprived neighbourhood. Those in kinship care were also more likely to be eligible for FSM at KS4, t(415) = 2.822, p = .005.
Very few children were FSM eligible at KS4, and eligibility was more likely when children had been placed with parents (see Table B1).
Table B1: Means (and SD) for KS4 points by placement type and FSM status at KS4
FSM Eligible Not Eligible
n Mean KS4 Points n Mean KS4 Points
Kinship Care at KS4 51 268.858 (113.061) 300 274.250 (108.326)
Foster Care at KS4 217 256.102 (111.647) 2341 263.825 (110.962)
Placed with Parents at KS4 71 211.060 (125.496) 60 220.217 (132.759)
Table B2 repeats the regression analyses presented in Table 2.16, but only for the subsample of children who last placement was in either foster or kinship care. The variable ‘Residential/other non-foster placement at KS4’ has been replaced by ‘Kinship placement at KS4’, making foster care the reference category for comparison.
Focusing on B2d (the final model including all variables of interest), we can note a number of differences in the results for this subsample (n = 3281) as compared to the main sample of interest (n = 4847) – see also Table D1 in Appendix D:
Block 1
Having a recorded SEN of ASD was not related to KS4 results in this subsample
91
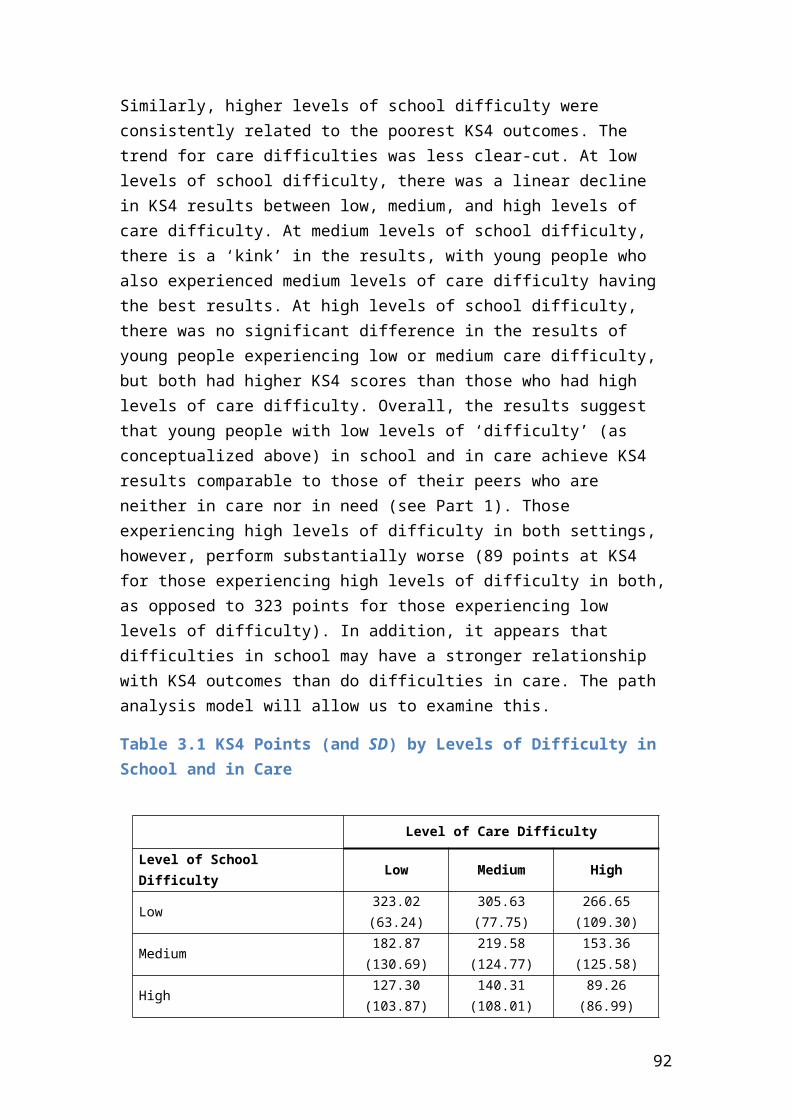
Having a recorded SEN of a Moderate Learning Disability was not related to KS4 results in this sample
Entering care due to disability was not related to KS4 results in this subsample
Block 2
No differences
Block 3
No differences
Block 4
Length of latest placement was not related to KS4 results in this subsample Kinship care (as opposed to foster care) predicted poorer KS4 results in this
subsample, once the other variables in the model were accounted for Having a home language other than English at KS4 was not related to KS4 results
in this subsample
Table B2a: Regression model for mean KS4 points (foster/kinship subsample only): Block 1 only
Not Controlling for KS2 (R2 = .232)
B SE B
Block 1
Constant 339.994 18.478
Gender (1 = Female, 2 = Male) -23.631 4.260 -0.100***
Ethnicity (reference group: White)
Asian or Black African 23.064 14.587 0.052
Black Caribbean or Mixed White/Black Caribbean 14.589 8.868 0.029
Other Mixed 27.810 11.483 0.043*
Traveller -112.999 47.721 -0.041*
Other 6.179 12.026 0.011
Ethnicity Unknown -56.846 11.150 -0.090***
Primary Special Educational Need (reference group: none)
Autistic Spectrum Disorder -121.791 15.487 -0.140***
Behavioural, Emotional and Social -63.004 5.245 -0.252***
Moderate Learning Disability -85.845 6.536 -0.259***
92
Physical, Sensory and Other Disabilities -23.072 8.326 -0.051**
Severe or Multiple Learning Difficulties -244.210 13.074 -0.361***
Specific Learning Disability -45.443 10.547 -0.078***
Speech, Language and Communication -71.503 12.359 -0.103***
Eligible for FSM at 2004 census (KS1) 3.768 4.414 0.016
Local deprivation index 2004 (KS1 IDACI) -17.127 11.087 -0.028
Home language other than English at 2004 census (KS1) 9.525 16.549 0.017
Care Career Type (reference groups: entry aged 0-4/5-9)
Adolescent Entrant (Abuse/Neglect) -15.145 5.144 -0.055**
Adolescent Entrant (Other Reasons) -29.351 5.643 -0.096***
Entered Care as UASC -51.048 13.275 -0.090***
Entered Care due to Disability -61.961 13.859 -0.084***
93
Table B2b: Regression model for mean KS4 points (foster/kinship subsample only): Blocks 1-2
Not Controlling for KS2 (R2 = .232) After Controlling for KS2 (R2 = .347)
B SE B B SE B
Block 1
Constant 336.658 19.808 38.323 21.966
Gender (1 = Female, 2 = Male) -23.804 4.277 -0.100*** -20.423 3.988 -0.076***
Ethnicity (reference group: White)
Asian or Black African 23.637 14.640 0.053 37.536 13.420 0.069**
Black Caribbean or Mixed White/Black Caribbean 14.498 8.871 0.029 3.765 8.533 0.006
Other Mixed 27.950 11.488 0.043* 21.001 10.860 0.028
Traveller -113.045 47.729 -0.041* -70.439 39.721 -0.025
Other 6.372 12.035 0.011 -2.137 11.237 -0.003
Ethnicity Unknown -56.704 11.155 -0.090*** -64.526 7.620 -0.123***
Primary Special Educational Need (reference group: none)
Autistic Spectrum Disorder -121.877 15.490 -0.140*** -77.669 11.817 -0.112***
Behavioural, Emotional and Social -62.986 5.246 -0.252*** -48.000 5.114 -0.175***
Moderate Learning Disability -85.987 6.544 -0.260*** -16.196 7.052 -0.042*
Physical, Sensory and Other Disabilities -23.152 8.329 -0.052** 3.953 8.493 0.007
Severe or Multiple Learning Difficulties -244.610 13.104 -0.362*** -109.882 11.825 -0.173***
Specific Learning Disability -45.461 10.549 -0.078*** 7.555 10.845 0.011
Speech, Language and Communication -71.617 12.363 -0.103*** -0.828 12.537 -0.001
Eligible for FSM at 2004 census (KS1) 4.385 4.607 0.018 6.115 4.286 0.023
Local deprivation index 2004 (KS1 IDACI) -16.857 11.104 -0.028 -1.108 10.405 -0.002
Home language other than English at 2004 census (KS1) 8.753 16.634 0.016 -10.079 14.672 -0.016
Care Career Type (reference groups: entry aged 0-4/5-9)
Adolescent Entrant (Abuse/Neglect) -12.667 7.385 -0.046 0.581 6.872 0.002
Adolescent Entrant (Other Reasons) -26.700 7.997 -0.087** -21.497 7.298 -0.066**
Entered Care as UASC -48.667 14.219 -0.086** 10.083 14.265 0.014
94
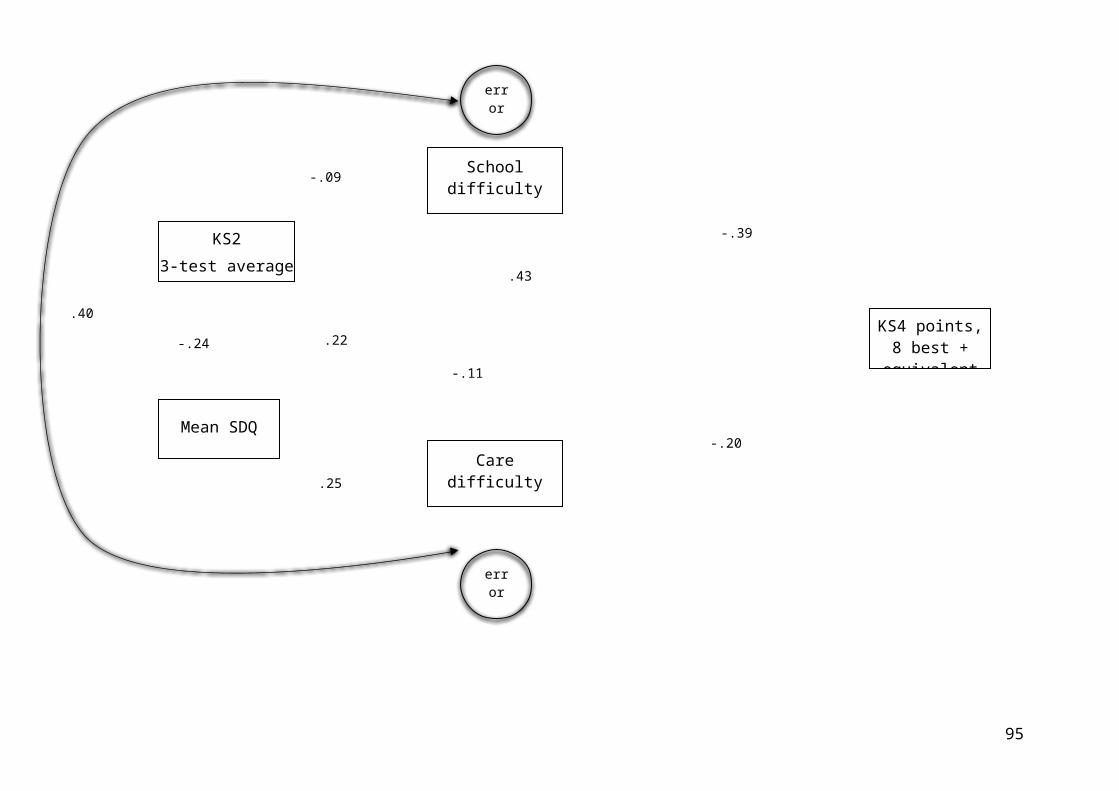
Entered Care due to Disability -60.530 14.195 -0.082*** -48.681 10.552 -0.089***
Block 2
KS2 3-test average 56.609 2.751 0.362***
Length of Time in Care (Excluding Respite) 0.001 0.002 0.014 0.009 0.002 0.102***
95
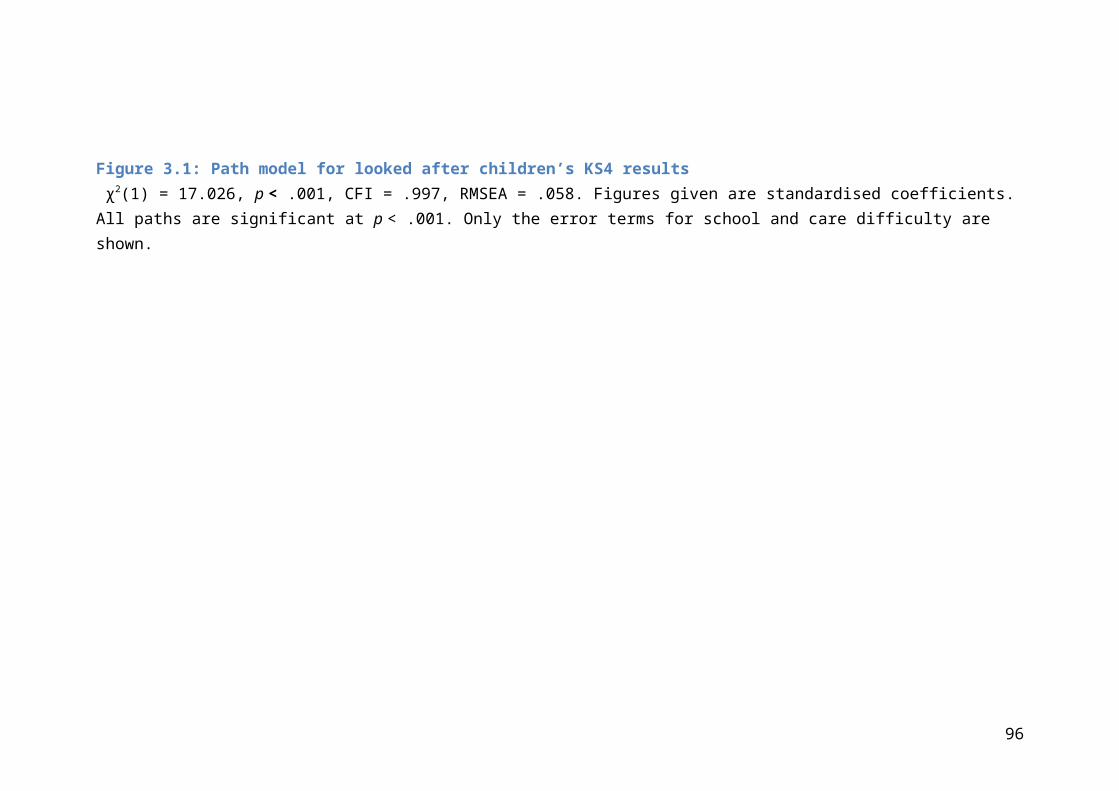
Table B2c: Regression model for mean KS4 points (foster/kinship subsample only): Blocks 1-3
Not Controlling for KS2 (R2 = .388) After Controlling for KS2 (R2 = .527)
B SE B B SE B
Block 1
Constant 346.911 17.925 81.084 18.804
Gender (1 = Female, 2 = Male) -20.011 3.874 -0.084*** -19.217 3.447 -0.072***
Ethnicity (reference group: White)
Asian or Black African 4.651 13.206 0.010 17.496 11.523 0.032
Black Caribbean or Mixed White/Black Caribbean 19.552 7.965 0.039* 7.683 7.296 0.013
Other Mixed 21.386 10.291 0.033* 13.151 9.261 0.018
Traveller -95.227 42.711 -0.034* -64.394 33.871 -0.023
Other 0.238 10.794 0.000 -0.937 9.593 -0.001
Ethnicity Unknown -48.805 10.013 -0.077*** -50.206 6.563 -0.095***
Primary Special Educational Need (reference group: none)
Autistic Spectrum Disorder -109.592 13.917 -0.126*** -74.282 10.102 -0.107***
Behavioural, Emotional and Social -27.978 4.936 -0.112*** -9.862 4.544 -0.036*
Moderate Learning Disability -75.107 5.940 -0.227*** -10.571 6.021 -0.027
Physical, Sensory and Other Disabilities -16.869 7.469 -0.038* 6.805 7.245 0.012
Severe or Multiple Learning Difficulties -238.751 11.784 -0.353*** -117.759 10.090 -0.185***
Specific Learning Disability -36.714 9.450 -0.063*** 8.452 9.244 0.012
Speech, Language and Communication -64.219 11.134 -0.092*** -0.833 10.707 -0.001
Eligible for FSM at 2004 census (KS1) -1.174 4.127 -0.005 4.788 3.655 0.018
Local deprivation index 2004 (KS1 IDACI) -5.748 9.959 -0.010 10.137 8.902 0.015
Home language other than English at 2004 census (KS1) 19.595 14.945 0.036 0.789 12.554 0.001
Care Career Type (reference groups: entry aged 0-4/5-9)
Adolescent Entrant (Abuse/Neglect) -8.194 6.619 -0.030 5.075 5.866 0.016
Adolescent Entrant (Other Reasons) -12.032 7.187 -0.039 -5.796 6.241 -0.018
Entered Care as UASC -52.125 12.776 -0.092*** -4.890 12.243 -0.007
96
Entered Care due to Disability -67.012 12.691 -0.091*** -60.077 8.999 -0.110***
Block 2
KS2 3-test average 53.622 2.385 0.343***
Length of Time in Care (Excluding Respite) -0.006 0.002 -0.078** 0.001 0.002 0.010
Block 3
Mean standardised SDQ scores -3.334 0.288 -0.191*** -3.030 0.260 -0.155***
Placement Changes Since KS2 -3.503 0.575 -0.099*** -5.216 0.395 -0.173***
School Changes in Year 10-11 -52.167 6.659 -0.128*** -52.462 5.370 -0.124***
Unauthorised absences (as a proportion of total possible sessions)
-371.948 37.868 -0.164*** -362.230 26.368 -0.180***
Number of sessions of fixed-term exclusions -1.083 0.110 -0.168*** -0.928 0.081 -0.154***
Child has ever been permanently excluded -54.935 14.075 -0.062*** -49.982 9.306 -0.067***
97
Table B2d: Regression model for mean KS4 points (foster/kinship subsample only): Blocks 1-4
Not Controlling for KS2 (R2 = .567) After Controlling for KS2 (R2 = .616)
B SE B B SE B
Block 1
Constant 346.968 15.992 154.049 18.438
Gender (1 = Female, 2 = Male) -9.124 3.261 -0.038** -11.954 3.092 -0.050***
Ethnicity (reference group: White)
Asian or Black African 4.369 11.115 0.010 7.588 10.529 0.017
Black Caribbean or Mixed White/Black Caribbean 12.610 6.725 0.025 5.194 6.382 0.010
Other Mixed 16.579 8.613 0.026 13.142 8.160 0.020
Traveller -78.185 35.713 -0.028* -62.697 33.836 -0.023
Other 2.797 9.155 0.005 4.820 8.672 0.009
Ethnicity Unknown 19.036 9.326 0.030* 9.924 8.847 0.016
Primary Special Educational Need (reference group: none)
Autistic Spectrum Disorder -47.391 11.922 -0.054*** -18.290 11.402 -0.021
Behavioural, Emotional and Social -16.931 4.181 -0.068*** -3.218 4.030 -0.013
Moderate Learning Disability -46.849 5.085 -0.142*** -9.758 5.223 -0.029
Physical, Sensory and Other Disabilities -16.355 6.260 -0.036** -4.454 5.965 -0.010
Severe or Multiple Learning Difficulties -150.263 10.403 -0.222*** -99.319 10.237 -0.147***
Specific Learning Disability -40.487 7.901 -0.070*** -7.318 7.698 -0.013
Speech, Language and Communication -43.303 9.342 -0.062*** -10.046 9.032 -0.014
Eligible for FSM at 2004 census (KS1) -0.571 3.459 -0.002 2.711 3.281 0.011
Local deprivation index 2004 (KS1 IDACI) -7.488 8.535 -0.012 -3.590 8.087 -0.006
Home language other than English at 2004 census (KS1) 30.928 14.343 0.056* 18.216 13.603 0.033
Care Career Type (reference groups: entry aged 0-4/5-9)
Adolescent Entrant (Abuse/Neglect) -7.746 5.539 -0.028 0.159 5.264 0.001
Adolescent Entrant (Other Reasons) -12.447 6.012 -0.041* -5.916 5.706 -0.019
Entered Care as UASC -44.296 12.707 -0.078*** -21.000 12.102 -0.037
98
Entered Care due to Disability -24.567 10.744 -0.033* -17.203 10.184 -0.023
Block 2
KS2 3-test average 42.408 2.311 0.298***
Length of Time in Care (Excluding Respite) -0.004 0.002 -0.055* -0.003 0.002 -0.032
Block 3
Mean standardised SDQ scores -2.255 0.248 -0.129*** -1.478 0.238 -0.085***
Placement Changes Since KS2 -2.605 0.511 -0.074*** -2.805 0.484 -0.079***
School Changes in Year 10-11 -36.612 6.080 -0.089*** -38.895 5.760 -0.095***
Unauthorised absences (as a proportion of total possible sessions)
-285.814 32.128 -0.126*** -291.215 30.431 -0.129***
Number of sessions of fixed-term exclusions -0.740 0.093 -0.115*** -0.745 0.088 -0.116***
Child has ever been permanently excluded -7.346 12.013 -0.008 -9.409 11.378 -0.011
Block 4
Length of latest placement 0.000 0.002 0.002 0.001 0.002 0.013
Kinship placement at KS4 -5.474 4.896 -0.015 -9.336 4.642 -0.026*
Placed out of authority at KS4 -1.493 3.204 -0.006 -0.392 3.036 -0.002
Eligible for FSM at KS4 (reference group: no)
Yes: eligible for FSM in 2013/2013 -2.063 5.655 -0.005 1.509 5.359 0.004
FSM eligibility not known -40.003 9.480 -0.105*** -43.262 8.980 -0.114***
Local deprivation index 2013 (KS4 IDACI) 11.654 10.314 0.016 14.514 9.770 0.019
Home language other than English at 2013 census (KS4) -22.431 10.277 -0.054* -14.024 9.744 -0.034
School type at KS4 (reference group: mainstream)
Special school -137.910 5.388 -0.407*** -105.345 5.403 -0.311***
Pupil Referral Unit -86.002 12.027 -0.143*** -84.847 11.392 -0.141***
Alternative Provision -147.181 15.291 -0.155*** -138.351 14.491 -0.146***
Other -72.789 11.657 -0.111*** -55.466 11.081 -0.085***
99
Appendix C: Supplementary analyses on looked after children in mainstream vs. non-mainstream schools at KS4
An ANCOVA of KS4 points by school type at KS4 results, controlling for results at KS2, showed that looked after children in non-mainstream schools did worse than those in mainstream schools, F(1, 4225) = 2742.243, p < .001, η2
p = .394. We therefore looked at whether the model outlined in Table 2.16d was a useful model for children in both types of educational setting.
Table C1 repeats the regression analyses presented in Table 2.16, but separates out the models for children in mainstream and non-mainstream schools. Please note that due to insufficient numbers, young people with FSM ‘unknown’ at KS4 are not included in the mainstream model, and UASC are not included in the non-mainstream model.
Focusing on Table C1d (the final model including all variables of interest), we can note a number of differences between those in mainstream schools at KS4 (n = 2971) as compared to those in non-mainstream schools (n = 1876) – see also Table D1 in Appendix D:
Block 1
Being male was a negative predictor of KS4 results for those in mainstream schools, but not for those in non-mainstream schools
Being of ‘other mixed’ ethnicity was a positive predictor of KS4 results for those in mainstream schools, but not for those in non-mainstream schools
Having a recorded Traveller ethnicity was a negative predictor of KS4 results for those in mainstream schools, but not for those in non-mainstream schools
Having unknown ethnicity was a negative predictor of KS4 results for those in mainstream schools, but it was a positive predictor for those in non-mainstream schools
Having a home language other than English at KS1 was a positive predictor of KS4 results for those in mainstream schools, but not for those in non-mainstream schools
Block 2
No differences
Block 3
Having missed more sessions of schooling due to fixed-term exclusions was a negative predictor of KS4 results for those in mainstream schools, but not for those in non-mainstream schools
100

Block 4
Having unknown FSM eligibility at KS4 was not in the model for those in mainstream schools due to low numbers, but it was a negative predictor of KS4 results for those in non-mainstream schools
Having a home language other than English at KS4 was a negative predictor of KS4 results for those in mainstream schools, but not for those in non-mainstream schools
101
Table C1a: Regression model for mean KS4 points (mainstream vs. non-mainstream at KS4): Block 1 only
Mainstream at KS4 (R2 = .089) Non-mainstream at KS4 (R2 = .149)
B SE B B SE B
Block 1
Constant 336.170 18.343 102.590 27.081
Gender (1 = Female, 2 = Male) -5.142 4.146 -0.025 -5.616 6.918 -0.031
Ethnicity (reference group: White)
Asian or Black African 47.000 14.724 0.128** -32.033 23.124 -0.067
Black Caribbean or Mixed White/Black Caribbean 22.606 8.681 0.052** 3.268 15.077 0.008
Other Mixed 40.586 10.974 0.076*** -14.479 19.835 -0.027
Traveller -93.825 54.500 -0.034 -36.274 51.632 -0.026
Other 16.281 12.362 0.034 -13.686 18.324 -0.028
Ethnicity Unknown -32.118 16.271 -0.039* 18.948 9.209 0.080*
Primary Special Educational Need (reference group: none)
Autistic Spectrum Disorder -44.604 4.945 -0.206*** -11.890 10.107 -0.069
Behavioural, Emotional and Social -49.870 6.515 -0.165*** -18.348 12.269 -0.076
Moderate Learning Disability -37.207 9.909 -0.077*** -23.689 23.887 -0.039
Physical, Sensory and Other Disabilities -37.561 12.285 -0.061** -25.764 22.680 -0.045
Severe or Multiple Learning Difficulties -41.255 20.338 -0.040* -42.317 15.499 -0.136**
Specific Learning Disability -147.232 26.593 -0.109*** -74.600 14.651 -0.273***
Speech, Language and Communication -22.172 7.602 -0.061** -3.716 22.002 -0.007
Eligible for FSM at 2004 census (KS1) 3.068 4.326 0.015 -5.531 7.050 -0.032
Local deprivation index 2004 (KS1 IDACI) -9.390 10.764 -0.018 3.160 17.948 0.007
Home language other than English at 2004 census (KS1) -14.943 16.476 -0.033 21.782 23.134 0.046
Care Career Type (reference groups: entry aged 0-4/5-9)
Adolescent Entrant (Abuse/Neglect) -16.677 4.988 -0.071** -2.608 8.576 -0.013
Adolescent Entrant (Other Reasons) -36.302 5.404 -0.141*** -4.850 8.380 -0.024
Entered Care as UASC -74.135 13.412 -0.157*** n/a n/a n/a
102
Entered Care due to Disability 13.827 22.482 0.012** -38.874 11.404 -0.163**
103
Table C1b: Regression model for mean KS4 points (mainstream vs. non-mainstream at KS4): Blocks 1-2
Mainstream at KS4 (R2 = .145) Non-mainstream at KS4 (R2 = .206)
B SE B B SE B
Block 1
Constant 149.032 23.639 -22.363 33.277
Gender (1 = Female, 2 = Male) -7.757 4.035 -0.038 -1.452 6.726 -0.008
Ethnicity (reference group: White)
Asian or Black African 48.670 14.331 0.133** -29.330 22.507 -0.061
Black Caribbean or Mixed White/Black Caribbean 14.578 8.439 0.033 -3.965 14.634 -0.010
Other Mixed 36.367 10.646 0.068** -17.063 19.201 -0.032
Traveller -78.798 52.841 -0.028 -22.299 50.016 -0.016
Other 13.902 12.002 0.029 -13.890 17.778 -0.029
Ethnicity Unknown -35.773 15.792 -0.044* 18.234 8.920 0.077*
Primary Special Educational Need (reference group: none)
Autistic Spectrum Disorder -30.721 4.922 -0.142*** -1.318 9.950 -0.008
Behavioural, Emotional and Social -16.603 6.882 -0.055* 13.548 12.862 0.056
Moderate Learning Disability -8.283 9.894 -0.017 -5.960 23.282 -0.010
Physical, Sensory and Other Disabilities -4.701 12.211 -0.008 4.282 22.435 0.007
Severe or Multiple Learning Difficulties -11.251 19.866 -0.011 -16.695 15.502 -0.054
Specific Learning Disability -83.614 26.397 -0.062** -36.562 15.404 -0.134*
Speech, Language and Communication -11.203 7.423 -0.031 10.520 21.460 0.019
Eligible for FSM at 2004 census (KS1) 8.025 4.385 0.039 -1.543 6.992 -0.009
Local deprivation index 2004 (KS1 IDACI) -4.751 10.444 -0.009 4.870 17.374 0.011
Home language other than English at 2004 census (KS1) -20.076 16.053 -0.045 15.644 22.455 0.033
Care Career Type (reference groups: entry aged 0-4/5-9)
Adolescent Entrant (Abuse/Neglect) 2.215 7.129 0.009 -5.366 10.760 -0.026
Adolescent Entrant (Other Reasons) -17.469 7.742 -0.068* -8.506 11.029 -0.042
Entered Care as UASC -40.462 13.987 -0.086** n/a n/a n/a
104
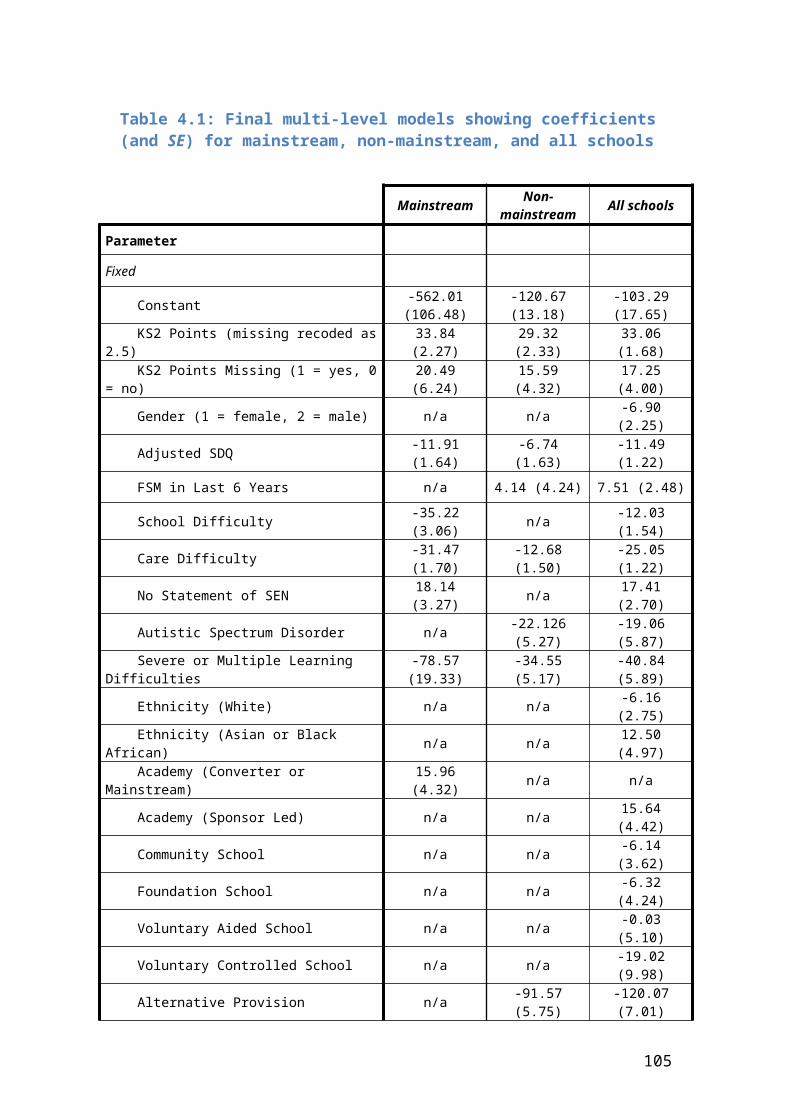
Entered Care due to Disability 33.363 22.040 0.029 -26.891 12.543 -0.113*
Block 2
KS2 3-test average 37.099 3.011 0.265*** 29.204 4.354 0.301***
Length of Time in Care (Excluding Respite) 0.007 0.002 0.102** 0.002 0.003 0.029
105
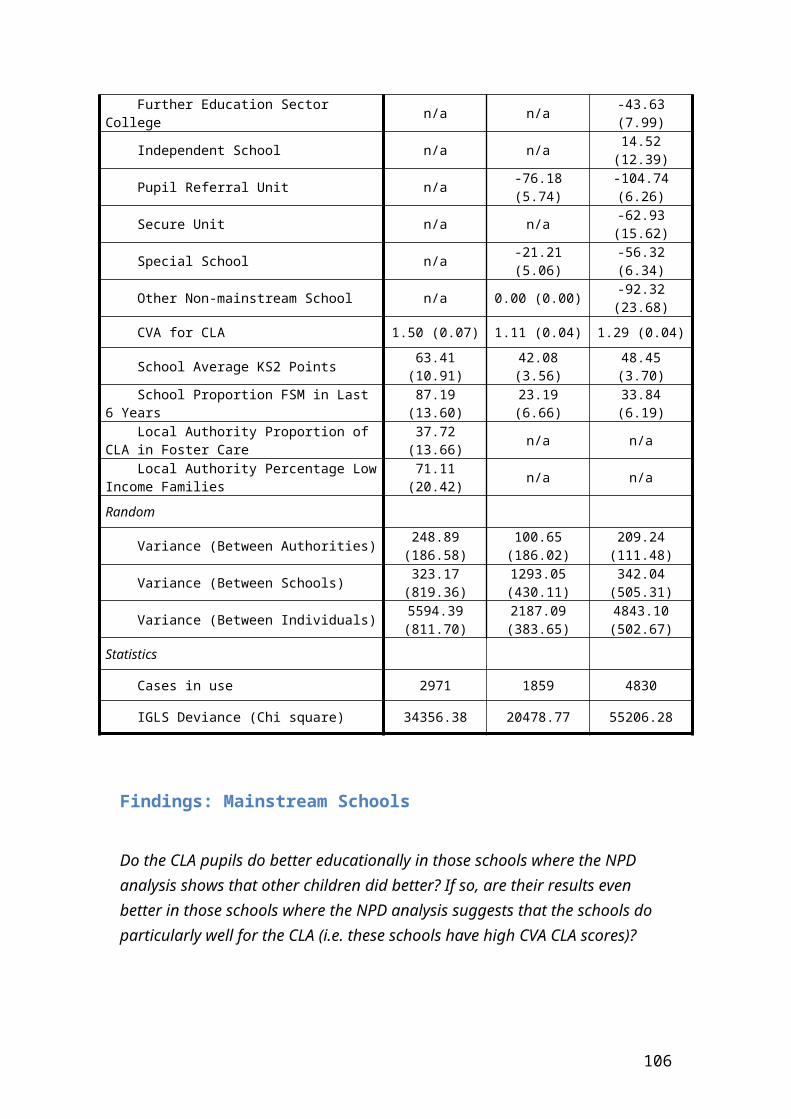
Table C1c: Regression model for mean KS4 points (mainstream vs. non-mainstream at KS4): Blocks 1-3
Mainstream at KS4 (R2 = .378) Non-mainstream at KS4 (R2 = .277)
B SE B B SE B
Block 1
Constant 176.889 20.301 -9.380 32.060
Gender (1 = Female, 2 = Male) -11.143 3.514 -0.055** -3.970 6.508 -0.022
Ethnicity (reference group: White)
Asian or Black African 14.282 12.432 0.039 -26.861 21.709 -0.056
Black Caribbean or Mixed White/Black Caribbean 16.651 7.231 0.038* -0.962 14.154 -0.002
Other Mixed 20.408 9.116 0.038* -15.949 18.419 -0.030
Traveller -99.420 45.147 -0.036* -15.484 48.029 -0.011
Other -0.202 10.313 0.000 -10.292 17.080 -0.021
Ethnicity Unknown -31.154 13.502 -0.038* 14.141 8.708 0.059
Primary Special Educational Need (reference group: none)
Autistic Spectrum Disorder -6.099 4.350 -0.028 11.485 9.867 0.067
Behavioural, Emotional and Social -11.333 5.886 -0.038 14.051 12.400 0.058
Moderate Learning Disability -11.011 8.460 -0.023 -0.100 22.351 0.000
Physical, Sensory and Other Disabilities -6.808 10.454 -0.011 3.344 21.576 0.006
Severe or Multiple Learning Difficulties -9.500 16.997 -0.009 -20.465 14.958 -0.066
Specific Learning Disability -84.746 22.557 -0.063*** -43.624 14.865 -0.159**
Speech, Language and Communication -3.849 6.360 -0.011 6.276 20.613 0.011
Eligible for FSM at 2004 census (KS1) 2.917 3.753 0.014 0.983 6.720 0.006
Local deprivation index 2004 (KS1 IDACI) 6.353 8.954 0.012 7.563 16.734 0.017
Home language other than English at 2004 census (KS1) 7.089 13.835 0.016 11.601 21.614 0.025
Care Career Type (reference groups: entry aged 0-4/5-9)
Adolescent Entrant (Abuse/Neglect) 7.470 6.107 0.032 -4.098 10.340 -0.020
Adolescent Entrant (Other Reasons) -3.492 6.641 -0.014 -5.054 10.603 -0.025
Entered Care as UASC -33.719 12.009 -0.071** n/a n/a n/a
106
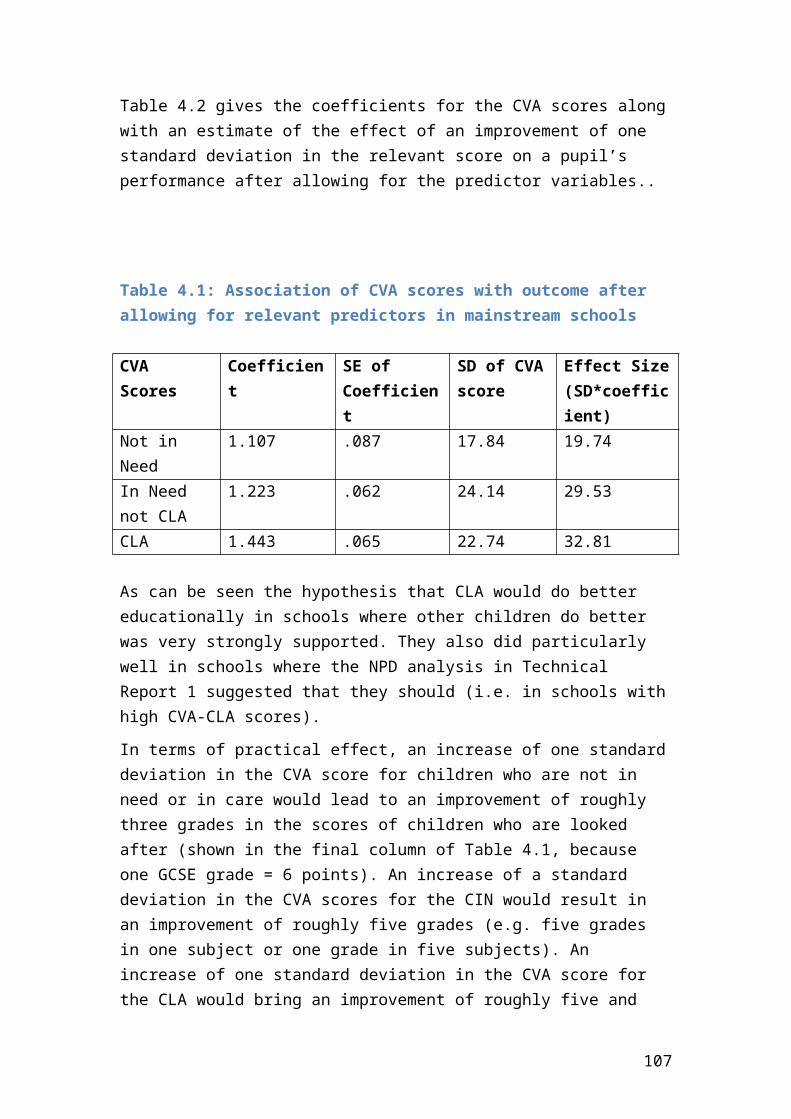
Entered Care due to Disability 22.514 18.842 0.020 -30.295 12.035 -0.127*
Block 2
KS2 3-test average 34.564 2.619 0.247*** 35.437 4.326 0.365***
Length of Time in Care (Excluding Respite) 0.000 0.002 -0.003 -0.001 0.003 -0.009
Block 3
Mean standardised SDQ scores -2.004 0.269 -0.132*** -1.601 0.488 -0.115**
Placement Changes Since KS2 -4.689 0.476 -0.170*** -2.755 0.614 -0.166***
School Changes in Year 10-11 -41.864 6.138 -0.115*** -24.011 8.862 -0.101**
Unauthorised absences (as a proportion of total possible sessions)
-501.263 33.325 -0.268*** -110.452 38.488 -0.105**
Number of sessions of fixed-term exclusions -1.137 0.101 -0.197*** -0.174 0.122 -0.054
Child has ever been permanently excluded -25.992 18.628 -0.023*** -15.846 11.760 -0.048
107
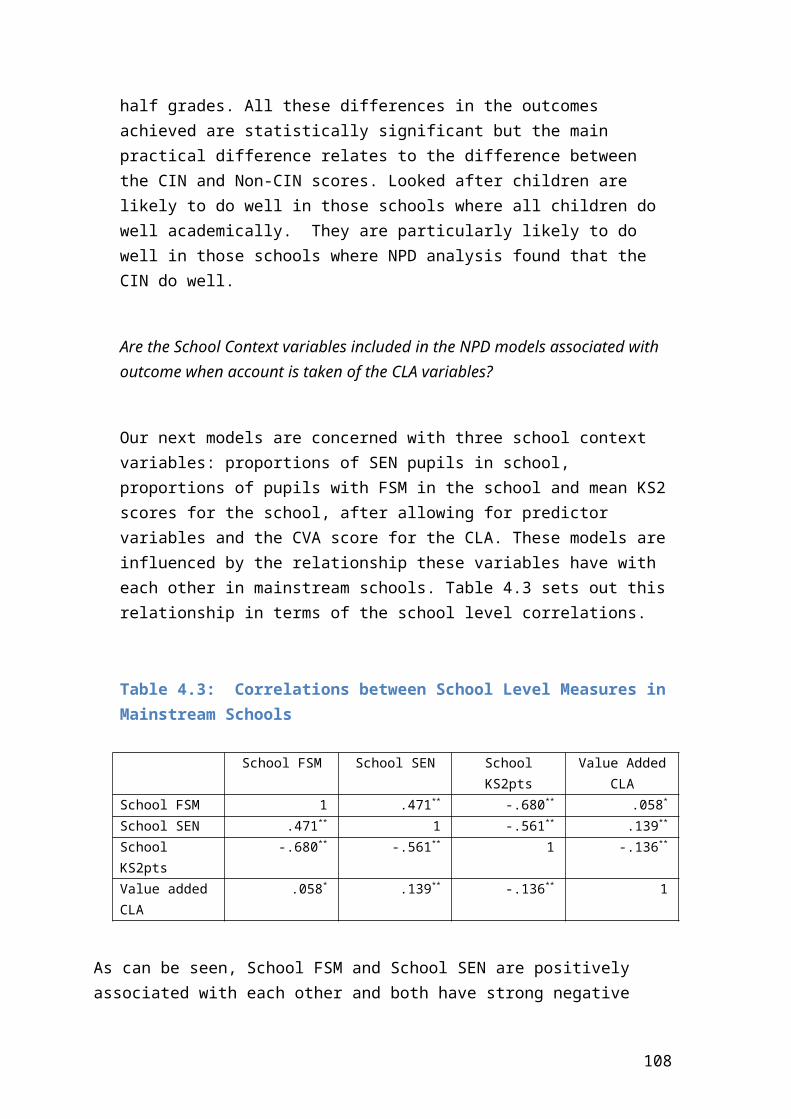
Table C1d: Regression model for mean KS4 points (mainstream vs. non-mainstream at KS4): Blocks 1-4
Mainstream at KS4 (R2 = .413) Non-mainstream at KS4 (R2 = .329)
B SE B B SE B
Block 1
Constant 170.317 20.558 3.346 32.634
Gender (1 = Female, 2 = Male) -10.053 3.430 -0.049** -4.564 5.335 -0.025
Ethnicity (reference group: White)
Asian or Black African 6.514 12.221 0.018 -27.212 20.696 -0.057
Black Caribbean or Mixed White/Black Caribbean 12.423 7.116 0.028 3.325 11.688 0.008
Other Mixed 18.338 8.917 0.034* -16.379 15.092 -0.031
Traveller -105.447 43.919 -0.038* -8.606 39.347 -0.006
Other -2.263 10.061 -0.005 -6.305 14.405 -0.013
Ethnicity Unknown -35.752 13.209 -0.044** 29.420 7.448 0.124***
Primary Special Educational Need (reference group: none)
Autistic Spectrum Disorder -6.314 16.576 -0.006 -23.509 12.384 -0.076
Behavioural, Emotional and Social -5.223 4.232 -0.024 9.913 8.102 0.058
Moderate Learning Disability -8.799 5.734 -0.029 6.887 10.199 0.028
Physical, Sensory and Other Disabilities -3.761 6.207 -0.010 -3.085 16.895 -0.006
Severe or Multiple Learning Difficulties -82.858 21.954 -0.061*** -52.925 12.331 -0.193***
Specific Learning Disability -11.919 8.243 -0.025 3.308 18.273 0.005
Speech, Language and Communication -3.584 10.174 -0.006 -5.895 17.665 -0.010
Eligible for FSM at 2004 census (KS1) 2.670 3.667 0.013 2.214 5.504 0.013
Local deprivation index 2004 (KS1 IDACI) 0.872 8.950 0.002 8.259 14.020 0.019
Home language other than English at 2004 census (KS1) 37.848 16.868 0.084* 13.396 17.742 0.028
Care Career Type (reference groups: entry aged 0-4/5-9)
Adolescent Entrant (Abuse/Neglect) 6.337 5.946 0.027 -4.636 8.474 -0.022
Adolescent Entrant (Other Reasons) -4.019 6.465 -0.016 -2.042 8.715 -0.010
Entered Care as UASC -9.717 14.577 -0.021 n/a n/a n/a
108
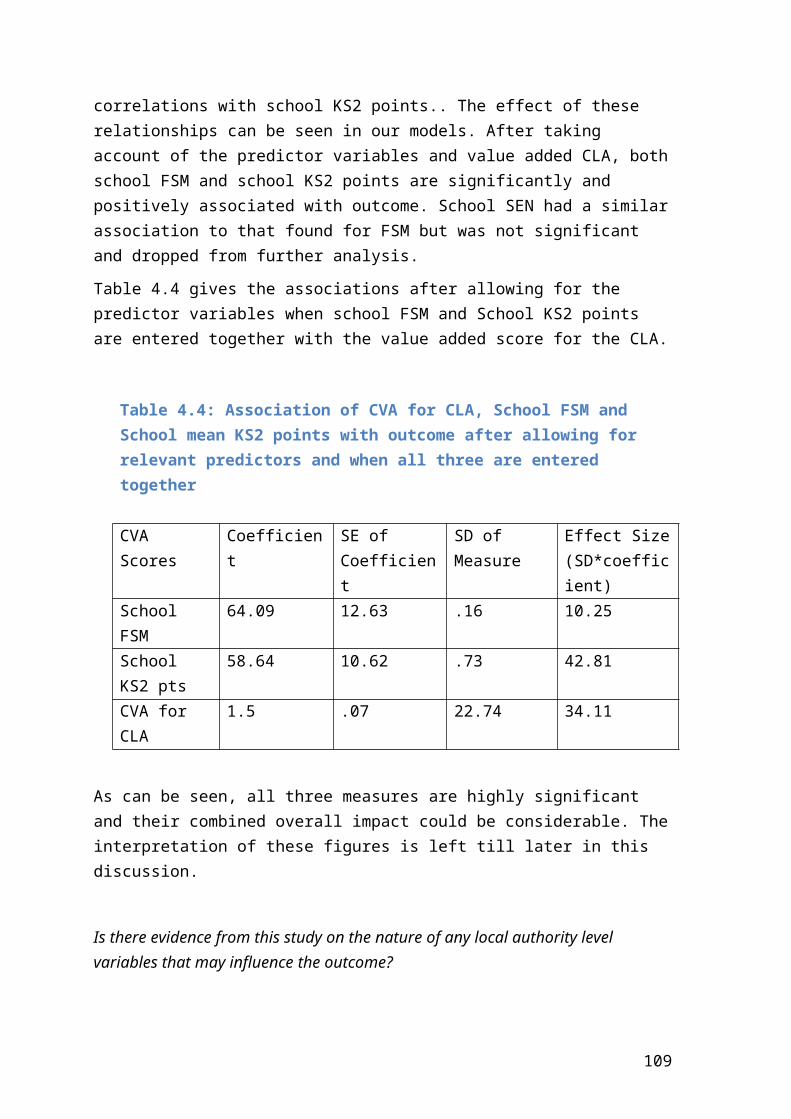
Entered Care due to Disability 21.236 18.336 0.019 -20.568 9.984 -0.086*
Block 2
KS2 3-test average 35.845 2.555 0.256*** 41.629 3.690 0.429***
Length of Time in Care (Excluding Respite) -0.002 0.002 -0.033 -0.003 0.003 -0.049
Block 3
Mean standardised SDQ scores -1.800 0.267 -0.119*** -1.326 0.404 -0.095**
Placement Changes Since KS2 -3.295 0.496 -0.120*** -1.904 0.532 -0.115***
School Changes in Year 10-11 -37.920 6.013 -0.104*** -25.768 7.303 -0.108***
Unauthorised absences (as a proportion of total possible sessions)
-440.180 33.022 -0.235*** -84.183 31.614 -0.080**
Number of sessions of fixed-term exclusions -1.036 0.099 -0.179*** -0.147 0.101 -0.046
Child has ever been permanently excluded -23.960 18.168 -0.021 -11.589 9.626 -0.035
Block 4
Length of latest placement 0.003 0.002 0.037 0.001 0.003 0.008
Residential/other non-foster placement at KS4 -55.294 4.935 -0.195*** -26.425 5.762 -0.151***
Placed out of authority at KS4 2.350 3.436 0.011 -4.702 4.984 -0.027
Eligible for FSM at KS4 (reference group: no)
Yes: eligible for FSM in 2013/2013 7.220 5.317 0.022 -9.405 9.821 -0.030
FSM eligibility not known n/a n/a n/a -31.964 6.848 -0.183***
Local deprivation index 2013 (KS4 IDACI) 12.147 10.484 0.020 -27.400 16.486 -0.050
Home language other than English at 2013 census (KS4) -31.555 11.592 -0.090** 9.600 17.419 0.021
109
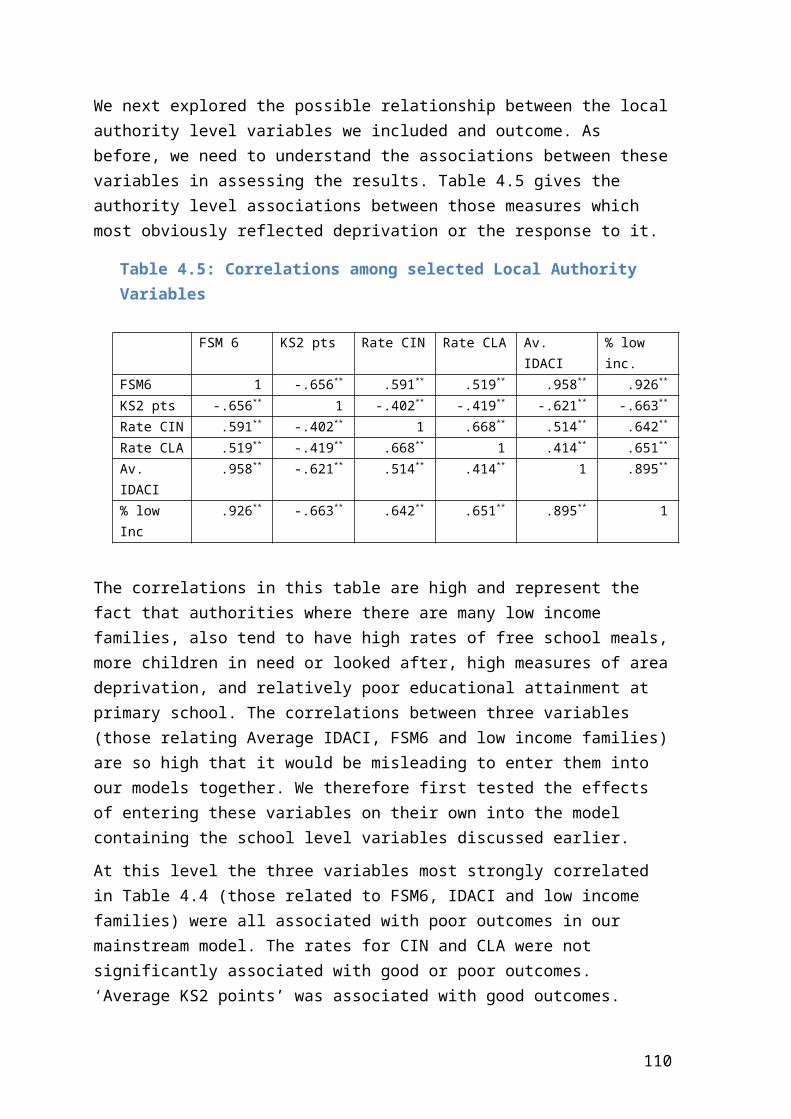
Appendix D: Comparison of significant predictors across three analyses
Table D1 summarises the significant predictors of poorer KS4 results, comparing the main sample of interest (as reported under Research Question 4, Table 2.16d) with the subsample in foster or kinship care (Appendix B, Table B2d) and the separate regressions conducted for those in mainstream and non-mainstream schools at KS4 (Appendix C, Table C1d).
Table D1: Significant predictors (and direction of relationship) of KS4 points, controlling for KS2 scores, comparing the main sample of interest, the subsample of young people in foster or kinship care at KS4, and those in mainstream and non-mainstream schools at KS4
Main sample(n = 4847)
Foster/kin(n = 3281)
Mainstream (n = 2971)
Non-main (n = 1876)
Individual characteristics
Gender (1 = Female, 2 = Male) - - -Being from an ‘other mixed’ ethnic background +Being from a Traveller family -Being of unknown ethnicity - +Having a recognised SEN of an Autism Spectrum Disorder -Having a recognised SEN of a Moderate Learning Disability -Having a recognised SEN of Severe or Multiple Learning Difficulties - - - -Having a home language other than English at KS1 +Entering care primarily due to a disability -Having a high mean score on the SDQ - - - -
Instability
Placement changes since KS2 - - - -Changing school in Year 10 or 11 - - - -
110
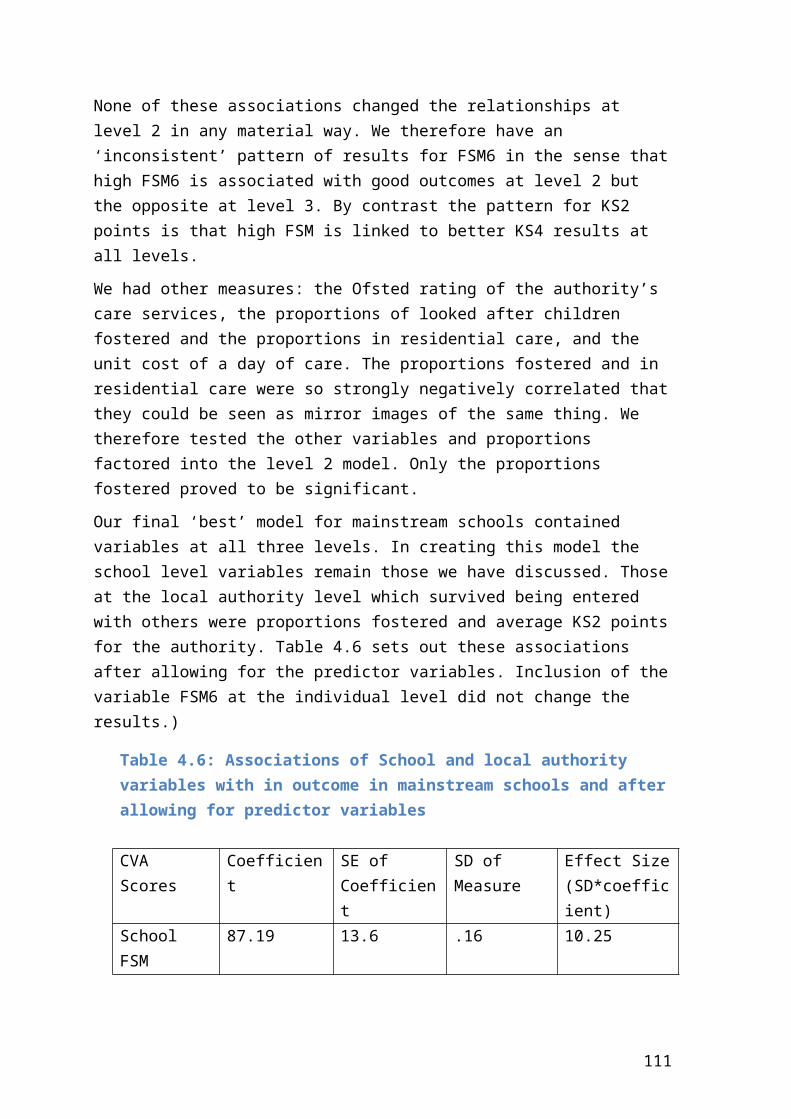
Unauthorised absences (as a proportion of total possible sessions) - - - -Number of sessions of fixed-term exclusions - - -
Concurrent environment
Length of latest placement +Living in residential or another form of care (compared to kinship or foster care) at KS4 - n/a - -Living in kinship care (compared to foster care) at KS4 n/a - n/a n/a
Having unknown FSM status at KS4 - - n/a -Having a home language other than English at KS4 - -Being in a non-mainstream school at KS4 - - n/a n/a
111
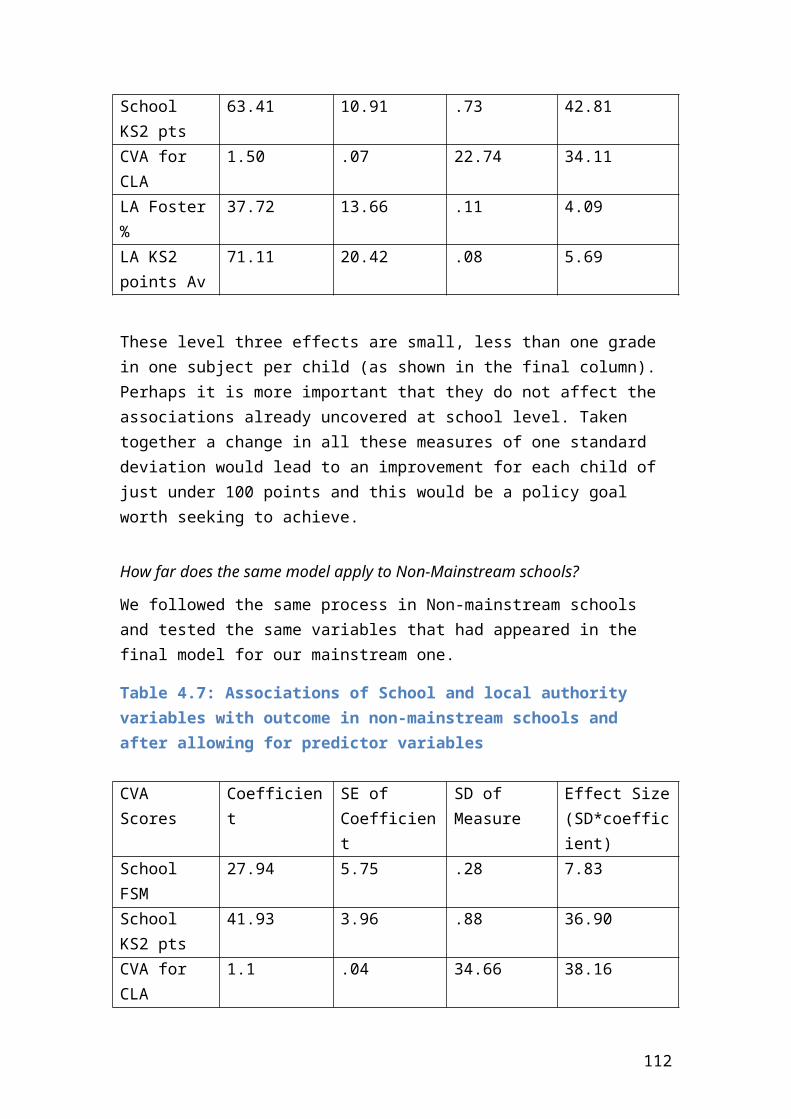
Appendix E: Output for Part 4 (multi-level models)
The MLWin tables appear complex and may be hard to read for those who are not used to them. The output should not present difficulties to those familiar with multiple regression. They do, however, need to be able to understand which variables are being used and what the notation means. For this reason we have converted the output below into a table in Part 4 (Table 4.1), which is hopefully easier to understand.
Figures E1-E3 give the MlWin output for the final mainstream, non-mainstream and all school models. There is a glossary after each table explaining the variable names.
Figure E1: Final Model for Mainstream Schools
The variable names in this model are: KS4pts_cnewe = KS4 points; Cons = Constant; Mainstream which acts as a filter being 1 when the pupil is in a mainstream school and otherwise missing; Adjustedsdq_imputed= The adjusted SDQ score with some imputed values; SchooldifficultyexclAbs= Measure of difficulties at school which does not include absences; Placementdifficulty= Measure of placement Difficulties; Sennone=No special educational need; Sensmld= Special Educational Need of severe or multiple learning difficulties; Academy=Pupil is in an academy school; KS2new= A new measure of KS2 points in which missing values are given a value of 2.5; Yes = A dummy variable which is 1 when KS2 is missing and otherwise 0; CVA_CLA= Measure of value school was estimated to add in the NPD analysis to the scores of CLA; School_FSM6=Proportion of pupils in the school ever receiving FSM in previous 6
112
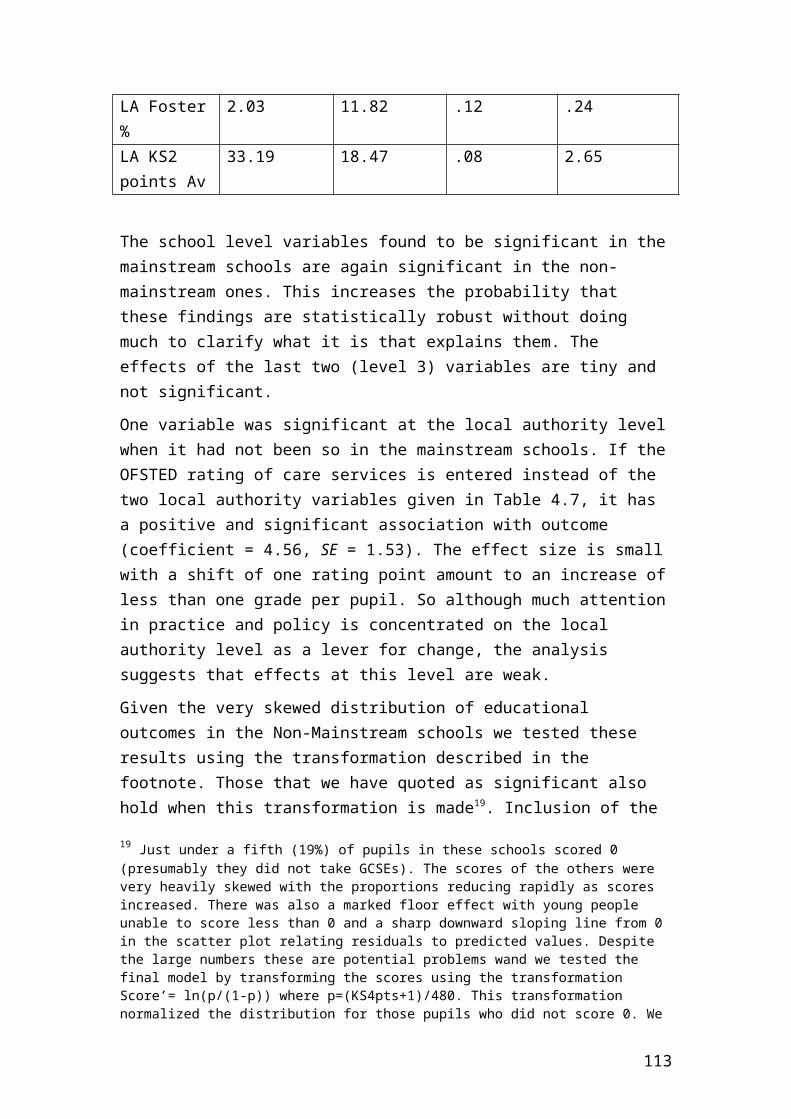
years (from NPD); School_KS2pts=mean KS2 score for the school (from NPD); LA_Foster=proportion of children in care in the authority who are fostered; Percentlowincfam2012= percent of families in LA with children under 18 on low incomes (2012); NewFSM6= Whether pupil has ever had FSM in past 6 years
The three lines of the model above the IGLS deviance give estimates of the unaccounted variance at the local authority, school and individual level, with the local authority being at the top and the individual at the bottom
Figure E2: Final Model for Non-mainstream schools
The variables have the same meaning as in the previous table. There are five additional variables SENASD (whether pupil has a special educational need of Autistic Spectrum Disorder), Special schools, alternative provision and other which are as the names imply. SENASD was not significantly associated with outcome in the mainstream schools, while the other schools are not mainstream. Nonmainstream is a filter which selects pupils in non-mainstream schools and otherwise plays no role in the equation
Figure E3: Final Model for All Schools
113
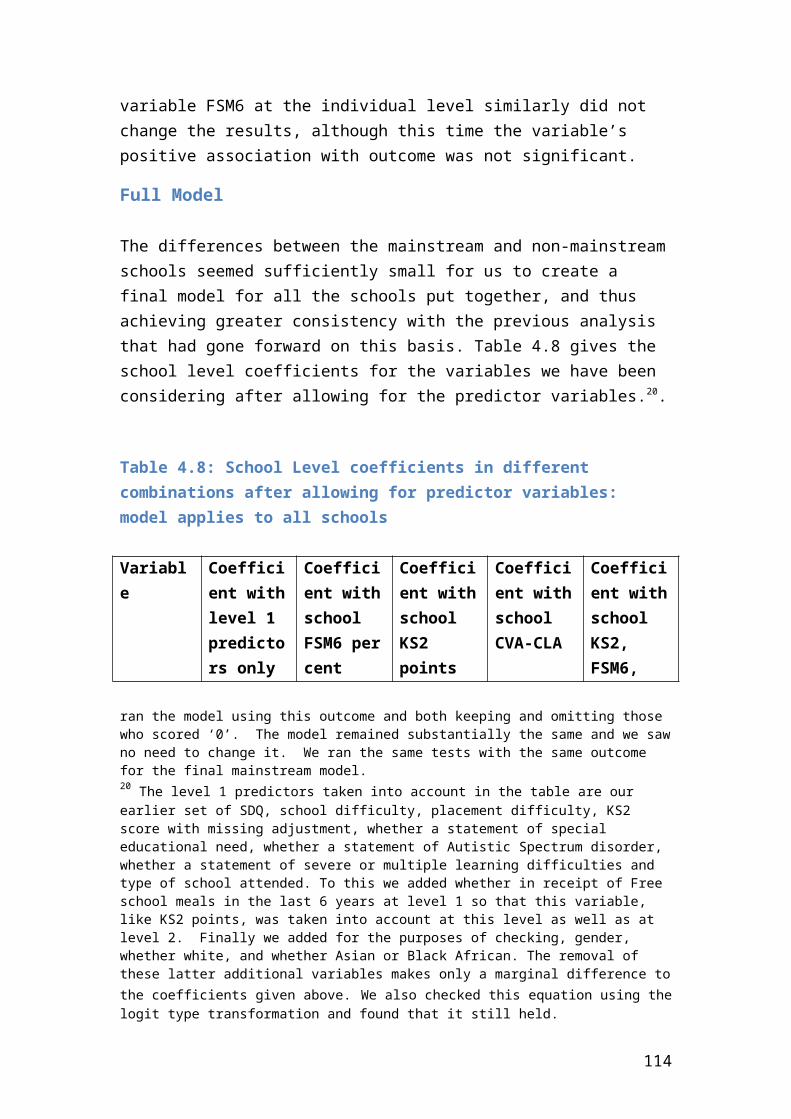
The final model contains all the different types of school and three additional variables which were important in the modelling before the SEM and included to check whether they made a material difference to the level 2 or 3 associations (they did not), These latter variables were male (whether female or male), ethwhite (whether white) and ethaba (whether Asian or Black African)
114