Embed Size (px)
Citation preview
ASEAN Integration Monitoring Report
A Joint Report by the ASEAN Secretariat and the World Bank
“One Vision, One Identity, One Community”
“Working for a World Free of Poverty”
ASEAN ASEAN Integration Monitoring Office
World Bank
East Asia and Pacific Region
ASEA
N Integration M
onitoring Report ‐ A Joint Report by the A
SEAN Secretariat and the W
orld Bank
Supported by the Australian Government through the ASEAN-Australia Development Cooperation Program Phase II
Pub
lic D
iscl
osur
e A
utho
rized
Pub
lic D
iscl
osur
e A
utho
rized
Pub
lic D
iscl
osur
e A
utho
rized
Pub
lic D
iscl
osur
e A
utho
rized
Pub
lic D
iscl
osur
e A
utho
rized
Pub
lic D
iscl
osur
e A
utho
rized
Pub
lic D
iscl
osur
e A
utho
rized
Pub
lic D
iscl
osur
e A
utho
rized
ASEAN Integration Monitoring Report
A Joint Report by the ASEAN Secretariat and the World Bank
ASEAN Integration Monitoring Office, ASEAN Office of the Chief Economist, East Asia and Pacific Region, The World Bank
The Association of Southeast Asian Nations (ASEAN) was established on August 8, 1967. The Member States of the Association are Brunei Darussalam, Cambodia, Indonesia, Lao PDR, Malaysia, Myanmar, Philippines, Singapore, Thailand and Vietnam. The ASEAN Secretariat is based in Jakarta, Indonesia
©ASEAN 2013 The ASEAN Secretariat 70 A Jalan Sisingamangaraja Jakarta 12110 Indonesia Telephone: 62-21-724-3372 Internet: www.asean.org © 2013 International Bank for Reconstruction and Development / International Development Association or The World Bank 1818 H Street NW Washington DC 20433 USA Telephone: 1-202-473-1000 Internet: www.worldbank.org
This report was printed by The World Bank Printing & Multimedia Department using only FSC certified paper and environmentally sustainable water based inks.
This work is a product of the staff of The ASEAN Secretariat and The World Bank with external contributions. The findings, interpretations, and conclusions expressed in this work do not necessarily reflect the views of ASEAN or its Member States, The World Bank, its Board of Executive Directors, or the governments they represent.
ASEAN or the World Bank does not guarantee the accuracy of the data included in this work. The boundaries, colors, denominations, and other information shown on any map in this work do not imply any judgment on the part of ASEAN or The World Bank concerning the legal status of any territory or the endorsement or acceptance of such boundaries.
Rights and Permissions
The material in this work is subject to copyright. Because ASEAN and The World Bank encourage dissemination of its knowledge, this work may be freely quoted or reprinted, in whole or in part, for noncommercial purposes as long as full attribution to this work is given.
Any queries on rights and licenses, including subsidiary rights, should be addressed to the Office of the Publisher, The World Bank, 1818 H Street NW, Washington, DC 20433, USA; fax: 202-522-2422; e-mail: [email protected].
Foreword
Since the adoption of the ASEAN Economic Community (AEC) Blueprint in 2007, ASEAN has undertaken various efforts to monitor its implementation. Building upon the AEC Scorecard, this inaugural ASEAN Integration Monitoring Report (AIMR) assesses the progress in four AEC-related dimensions: merchandise trade, trade facilitation, services trade and investment. It focuses on policy and market integration outcomes achieved in ASEAN Member States (AMS), as part of the first pillar of the AEC formation process. Released by the ASEAN Integration Monitoring Office (AIMO) of the ASEAN Secretariat, together with the World Bank - East Asia Pacific Region, the Report is the first component of the ASEAN Community Monitoring and Evaluation Program (AECMEP). It is expected to be released annually to provide a regular update on the state of integration in ASEAN. In this regard, we would like to extend our appreciation to the World Bank for assisting in strengthening ASEAN’s monitoring and analytical capacities as well as the ASEAN-Australia Development Cooperation Program (AADCP) II for its support in implementing the AECMEP. The AIMR shows that ASEAN’s broader economic agenda has brought significant gains to AMS. As a trade-creating block, together with the improvement of trade facilitation, ASEAN integration has led to an increase in intra-ASEAN trade, parallel with an increase in ASEAN’s trade with the rest of the world. ASEAN also had modest contributions to the development of the services sector and the enhancement of foreign direct investment (FDI), both for extra- and intra- regional inflows. Finally, AEC efforts also help in narrowing the development gap and accelerating development in CLMV countries, whose share of GDP in ASEAN grew from 3.5% in 1990 to nearly 10% in 2011. This is further reflected in the implementation rate of 79.7 % of the AEC Scorecard as of August 2013. Despite these achievements, there remain several areas where implementation has been limited. Although ASEAN’s gains came from enhancing trade facilitation, services and investments, efforts are still needed in these critical areas as well as in the transport sector. Domestic regulatory reforms, enhanced capacities, strong internal coordination and sufficient budgets are imperatives in order to address the implementation challenges. The AIMR further suggests priorities for future actions for the effective implementation of the AEC 2015 goals. To complement the AIMR and further enhance ASEAN’s monitoring capabilities, the AECMEP will also develop the components of integration of trade in services: the ASEAN database of trade in services and the ASEAN-World Bank Services Regional Integration Report. We hope that this Report will be a useful document for ASEAN officials and policy-makers, serving as the key monitoring report used to track AEC’s progress, at both regional and national levels, to ensure its timely realization by 2015.
Le Luong Minh Secretary General Association of South East Asian Nations
Foreword
The Association of Southeast Asian Nations (ASEAN) is a community of more than 600 million people living in ten countries in one of the most dynamic regions of the world. Consistent with this, ASEAN’s share of world GDP and world trade has sharply increased over the past decades. In 2003, ASEAN’s regional integration agenda was significantly deepened when ASEAN Member States adopted the ambitious goal of forming an ASEAN Economic Community (AEC) by 2015. These goals were crystallized in the highly specific targets set for creating a “single market and production base” in the ASEAN Economic Community Blueprint of 2007, signed by the Heads of the Governments of the ASEAN countries. As the global economy is still recovering from the deep financial and economic crisis of 2008 ASEAN’s regional integration agenda has become even more important. It is clear that as the world economy recovers, the high income economies of North America and Western Europe will need to undergo significant fiscal and structural changes, including lowering consumption and import growth. As a result they will not be the same robust destination markets for manufacturing exports as they were in the past. Emerging and developing economies will have to rely more on South-South and regional trade. Beyond the need to sustain trade in goods, it is also clear that the high and middle economies of ASEAN and in other parts of the developing world will now need to focus more on boosting their productivity through diversifying into high end manufacturing and services. The ASEAN Economic Community’s bold vision of achieving the free flow of goods, services, investment, and skilled labor in the region is precisely what is needed to achieve higher productivity growth and economic diversification. It is in this context that I am delighted with the collaboration of the ASEAN Integration Monitoring Office of the ASEAN Secretariat and the World Bank’s staff from the East Asia and Pacific region and the Trade and the Research departments on this ASEAN Integration Monitoring Report. The report has also benefited from several rounds of presentations, consultations and reviews involving the officials of the ASEAN Member States. The report provides some important findings and guidance on going forward. The report finds that the ASEAN economic integration agenda has already provided important benefits to the Member States by boosting regional trade flows without adversely affecting the global integration agenda. Integration efforts have also helped to improve trade logistics, lower aggregate trade costs and significantly increase regional investment flows. Progress in services integration, however, has been modest. It is also clear that the potential gains from further integration in all these spheres remain large. The report highlights important pending challenges to achieving the AEC 2015 goals that lie in implementing the services integration agenda as well as the dangers posed by the use of non-tariff measures. It identifies a number of policy and institutional measures that ASEAN can take to address these issues.
Lastly, let me note that this report is the first of a series of outputs under the ASEAN Economic Community Monitoring and Evaluation program that is being carried out jointly by ASEAN Secretariat and World Bank staff. We thank the government of Australia for funding most of this work through their technical assistance program for ASEAN. We are hopeful that this program will only be the first of many such collaborative programs in the future.
Regional Vice President East Asia and Pacific Region The World Bank
ACRONYMS AND ABBREVIATIONS AADCP II ASEAN-Australia Development Cooperation
Program IGA ASEAN Agreement for Promotion and Protection of
Investment ACD ASEAN Cosmetic Directive IL Tariff-Reduction – Inclusion List ACI Air Connectivity Index ILP Import Licensing Procedures ACIA ASEAN Comprehensive Investment
Agreement ISO International Organization for Standardization
AEC ASEAN Economic Community LSCI Linear Shipping Connectivity Index AECMEP ASEAN Economic Community and Monitoring
and Evaluation Program SL Tariff-Reduction – Sensitive List
AEM ASEAN Economic Ministers HSL Tariff-Reduction – Highly Sensitive List AFAS ASEAN Framework Agreement on Services LPI Logistics Performance Index AFTA ASEAN Free Trade Area MOF Minister of Finance AHEEERR ASEAN Harmonized Electrical And Electronic
Equipment Regulatory Regime MOT Minister of Trade
AHTN ASEAN Harmonized Tariff Nomenclature MTO Merchandise Trade Openness AIA ASEAN Investment Agreement MTII Merchandise Trade Intensity Index AIMO ASEAN Integration Monitoring Office MFNs Most Favored Nations AIMR ASEAN Integration Monitoring Report MRAs Multinational Regional Agreements AMS ASEAN Member States MTR Mid-Term Review APEC Asia-Pacific Economic Cooperation ASEAN Association of Southeast Asian Nations NAFTA North American Free Trade Organization ASEAN+3 Three of Ten ASEAN Economies NTBs Non-Tariff Barriers ASEAN+6 Six of Ten ASEAN Economies NTMs Non-Tariff Measures ASEC ASEAN Secretariat
OECD Organization for Economic Cooperation and
Development ASW ASEAN Single Window PIS Policy Integration Sectors ATIGA ASEAN Trade in Goods Agreement PREM Poverty Reduction and Economic Management ATF ASEAN Trade Facilitation RIA Regulatory Impact Assessment ATWG Air Transport Working Group ROO Rules of Origin BPO Business Processing Outsourcing RTA Regional Trade Agreement CARICOM Caribbean Common Market SEOM Senior Economic Officials’ Meetings CBM Central Bank of Myanmar SPCD Strategic Program of Customs Development CCS Coordinating Community on Services SPS Sanitary or Phytosanitary Measures CEPT Common Effective Preferential Tariff Scheme STRI Services Trade Restrictiveness Index CLMV Cambodia, Laos, Myanmar, and Viet Nam TPR Trade Policy Review DTIS Diagnostic Trade Integration Study TRQ Tariff-Rate Quotas EAP East Asia and Pacific EAPCE East Asia and Pacific Chief Economist’s Office UNCTAD United Nations Conference on Trade and
Development EASPW East Asia PREM Sector UNECE United Nations Economic Commission of EuropeEE Electrical and Electronic Equipment USITC United States International Trade Commission ERIA Economic Research Institute for ASEAN WB World Bank FEP Foreign Equity Participation WCFSL Working Committee on Financial Services
Liberalization FDI Foreign Direct Investment WCO World Customs Organization GMP Good Manufacturing Practice WEF World Economic Forum GTA Global Trade Alert WDI World Development Indicators JPA Junior Professional Associate WDR World Development Report JCC Joint Consultative Committee WTI World Trade Indicators ICT Information and Communications Technology WTO World Trade Organization
Preface
This report has been jointly produced by the Association of Southeast Asian Nations— ASEAN Secretariat (ASEAN Integration Monitoring Office) and the World Bank (Office of the Chief Economist, East Asia and Pacific Region) as part of the Advisory Services program of the World Bank for ASEAN. These advisory services are being provided under the ASEAN Economic Community Monitoring and Evaluation Program (AECMEP) financed by the ASEAN-Australia Development Cooperation Program, Phase II (AADCP II) and World Bank non-lending technical assistance. The World Bank also gratefully acknowledges support from the Government of Korea that funded part of the work for this report. The focus of the report is on policy and market integration outcomes achieved in ASEAN Member States (AMS) as part of the Pillar One of the ASEAN Economic Community (AEC) formation process. The aim is to assess progress drawing on evidence from a large range of indicators on policies and outcomes. The report then suggests priorities for future actions for implementing the AEC 2015 goals. This report is based on the Inception Report presented to and endorsed by the Senior Economic Officials’ Meetings of the ASEAN last year and on the presentation on early findings also to the SEOM. The earlier version of this report was also presented to the 45th ASEAN Economic Ministers’ Meetings in Bandar Seri Begawan, Brunei Darussalam in August 2013. This report is intended to complement the recent Mid-Term Review Report by the Economic Research Institute for ASEAN and East Asia (ERIA, 2012), which has focused more on progress with agreements and commitments for achieving AEC 2015 goals.
This report was written by a team of ASEAN Secretariat and World Bank (WB) staff, consultants led by Aladdin Rillo and Pitchaya Sirivunnabood from ASEAN Secretariat, and by Ahmad Ahsan and Jean-Christophe Maur from the World Bank. Other team members were Khin Maung Nyunt (AADCP II), Mikiko Imai Ollison (Doing Business Team, WB), Gianni Zanini, Peter Walkenhorst, Ben Shepherd, Lili Yang Yi, Simon Evenett and Erna Munawadi (Consultants, WB). Rohan Singh (JPA, EAPCE) provided invaluable research and overall assistance throughout the preparation of this report. Mildred Gonzalvez (EASPW) processed the report and Nishi Widge edited it. The report benefited from extensive comments provided by ASEAN Secretariat officials in the Trade and Facilitation Division, Services and Investment Division, and Infrastructure Division, and comments were received from ASEAN Member States’ officials in their review of the report in May 2013. The team thanks Dr. Lim Hong Hin, Deputy Secretary General of ASEAN for ASEAN Economic Community and Bert Hofman, Regional Chief Economist, East Asia and Pacific region, the World Bank for helpful comments and guidance.
ASEAN Integration Monitoring Report Table of Contents
Overview .................................................................................................................................................. i
A. A Region at the Forefront of Global Integration and Poverty Reduction ..................................... i B. Objectives of the ASEAN Integration Monitoring Report (AIMR) ............................................ ii C. Broad Findings from the Report ................................................................................................. vi D. Progress and Challenges in Trade in Goods ............................................................................... ix E. Trade Facilitation ........................................................................................................................ xi F. Services ..................................................................................................................................... xiii G. Foreign Direct Investment ......................................................................................................... xv
Chapter 1: Trends and Patterns of Merchandise Trade .................................................................... 1
Key Findings ................................................................................................................................ 1 A. AEC Blueprint Goals for Free Flow of Goods (Tariffs and Non-Tariff Measures) ..................... 2 B. The ASEAN Approach for Eliminating NTBs ............................................................................ 8 C. Recent Trade Measures Affecting ASEAN Countries ............................................................... 16 D. Merchandise Trade Integration Outcomes ................................................................................. 30 E. Conclusion and Policy Implications .......................................................................................... 41 F.
Chapter 2: Trade Facilitation and Logistics ...................................................................................... 44
A. Key Findings .............................................................................................................................. 44 A. Introduction: ASEAN Priorities in Trade Facilitation ............................................................... 45 B. Progress in Achieving AEC Goals ............................................................................................. 47 C. Trade Costs in ASEAN .............................................................................................................. 52 D. Measuring ASEAN’s Trade Facilitation Performance .............................................................. 59 E. Conclusion and Policy Implications .......................................................................................... 78
Technical Annex to Chapter 2 .................................................................................................... 81 Chapter 3: Trends and Patterns in Services Trade and Policies ..................................................... 92
A. Introduction and Key Findings .................................................................................................. 92 B. Progress in Achieving AEC Goals for Free Trade in Services .................................................. 95 C. International and Intra-Regional Comparison of Services Trade Policies ............................... 101 D. Developments in Services Trade .............................................................................................. 106 E. Skilled Labor Mobility ............................................................................................................. 112 F. Implementing the Services Integration Agenda: Domestic Regulatory Reform ..................... 114 G. Conclusion and Policy Implications ........................................................................................ 118
Chapter 4: Investments and the ASEAN Region ............................................................................ 121
A. Key Findings ............................................................................................................................ 121 B. ASEAN Investment Integration: An Assessment .................................................................... 122 C. AEC’s Role in Promoting and Liberalizing Investment Flows................................................ 142 D. Policies towards FDI: Market Access and Equal Treatment of Foreign Investment ............... 145 E. ASEAN Integration Impacts on FDI ........................................................................................ 152 F. Conclusion and Policy Recommendations ............................................................................... 155
References ........................................................................................................................................... 157
List of Tables
Table 1. 1: Share of Tariff Lines at 0% Preferential Duty ....................................................................... 5 Table 1. 2: ATIGA Preference Utilization in 2005-10 ............................................................................ 6 Table 1. 3: ASEAN International Peaks in MFN Tariffs ......................................................................... 7 Table 1. 4: Measures Affecting ASEAN Countries Since First G20 ..................................................... 19 Table 1. 5: Which Trading Partners Have Hit ASEAN Economies....................................................... 21 Table 1. 6: Policy Responses to Rice Price Increases during the Global Food Crisis ........................... 24 Table 1. 7: Trade Measures Adopted by ASEAN Countries, October 2011-May 2012 ........................ 26 Table 1. 8: Export Restrictions Indicators in ASEAN ........................................................................... 30 Table 2. 1 : Bilateral Trade Costs in Manufacturing .............................................................................. 57 Table 2. 2: Bilateral Trade Costs in Agriculture Among ASEAN ......................................................... 58 Table 2. 3: Data and Sources ................................................................................................................. 84 Table 2. 4: Regression Results Using Log of Trade Costs as the Dependent Variable ......................... 86 Table 2. 5: Simulated Reductions in Trade Costs from Meeting 2015 Reform Targets ........................ 88 Table 4. 1: Intra ASEAN FDI 2011 ..................................................................................................... 126 Table 4. 2: Transnational Corporations’ Top Prospective Host Economies for 2012-2014 ................ 130 Table 4. 3: Enterprise Surveys: Top 10 Constraints to Doing Business .............................................. 133 Table 4. 4: Ease of Doing Business in ASEAN .................................................................................. 139 Table 4. 5: Foreign Equity Caps by Sector, 2010 ................................................................................ 146 Table 4.6: Investment Liberalization Rates in ASEAN ....................................................................... 148
List of Figures
Figure 1. 1: Intra-ASEAN Preferential Tariffs, 1993-2012 .................................................................... 4 Figure 1. 2: Low Preferential Margins Largely Explain Low Preference Utilization ............................. 8 Figure 1. 3: NTMs in ASEAN by Type—Officially Notified .............................................................. 14 Figure 1. 4: NTMs in ASEAN by Industry—Officially Notified ......................................................... 14 Figure 1. 5: ASEAN Economies with Strong Export Performance ...................................................... 17 Figure 1. 6: Tariffs, Non-Tariff Measures (NTMs), ............................................................................. 20 Figure 1. 7: Tariffs and Non-Tariff Measures (NTMs) ......................................................................... 23 Figure 1. 8: Comparison of Export Restriction Indicators .................................................................... 28 Figure 1. 9: Intra-ASEAN Trade Openness has Increased ................................................................... 33 Figure 1. 10: Intra-ASEAN Trade Intensity has been Declining Modestly, ......................................... 33 Figure 1. 11: Global Openness has Increased ....................................................................................... 34 Figure 1. 12: Intra-ASEAN Trade by Major Components .................................................................... 36 Figure 1. 13: Intra-Industry Trade Rose Strongly Through 2000 ......................................................... 36 Figure 1. 14: ASEAN Trade Complementary Indices, 2006-2010 ....................................................... 38 Figure 1. 15: ASEAN and Comparators Number of Exports and Concentration Index ....................... 40 Figure 1. 16: ASEAN and Comparators’ Shares of Five Top Export Products .................................... 41 Figure 2. 1: Trade Costs of Manufactured Goods ................................................................................. 54 Figure 2. 2: Trade Costs of Agricultural Products ................................................................................ 55 Figure 2. 3: Intra-and Extra-Regional Trade Costs of Manufactured Good ......................................... 56 Figure 2. 4: Intra- and Extra-Regional Trade Costs .............................................................................. 57 Figure 2. 5: Internal LPI Scores, Averaged by World Bank ................................................................. 60 Figure 2. 6: International LPI Scores .................................................................................................... 62 Figure 2. 7: Performance on Individual International LPI components, ............................................... 63
Figure 2. 8: Performance on Individual International LPI Components, ASEAN ............................... 64 Figure 2. 9: Major Delays from Stated Sources .................................................................................... 65 Figure 2. 10: Major Delays from Stated Sources, Percentage of Respondents, ASEAN ..................... 66 Figure 2. 11: Improvements in the Logistics Environment, .................................................................. 67 Figure 2. 12: Logistics Restrictiveness Index for Foreign Services Providers, ASEAN+6 .................. 69 Figure 2. 13: Documents Required to Import in ASEAN Member Countries, 2006-2011 ................... 70 Figure 2. 14: Days to Import in ASEAN Member Countries, 2006-2011 ............................................ 71 Figure 2. 15: Document preparation time for import (days), ASEAN+6 ............................................. 71 Figure 2. 16: Cost to Import (USD) in ASEAN Member Countries, 2006-2011 ................................. 72 Figure 2. 17: Total Freight Costs from ASEAN Member ..................................................................... 73 Figure 2. 18: Liner Shipping Connectivity Index Scores ...................................................................... 74 Figure 2. 19: World Bank Air Connectivity Index, ASEAN+6 ............................................................ 75 Figure 2. 20: The Growth of Airline Companies in ASEAN, 1998-2010 ............................................ 78 Figure 3.1: Comparison of Services Trade Commitments and Policies…………………………….…98 Figure 3.2: Overall Services Trade Restrictiveness Index .................................................................. 101 Figure 3. 3: Services Trade Restrictiveness Index for Financial......................................................... 102 Figure 3. 4: Services Trade Restrictiveness Index for Telecommunications ...................................... 102 Figure 3. 5: Services Trade Restrictiveness Index for Retailing ......................................................... 103 Figure 3. 6: Services Trade Restrictiveness Index for Transport ........................................................ 104 Figure 3. 7: Services Trade Restrictiveness Index for Professional .................................................... 104 Figure 3. 8: Services Trade Restrictiveness Index .............................................................................. 105 Figure 3. 9: Changes in Services Trade Restrictiveness ..................................................................... 106 Figure 3. 10: Share of Services Sector in GDP, 2011* (in Percent) ................................................... 107 Figure 3. 11: Growth in Service Trade ............................................................................................... 107 Figure 3. 12: Openness Towards Services Trade (Ratio of Exports plus Imports to GDP) ................ 107 Figure 3. 13: Services Trade in Relation to GDP, 2010 (Percent) ...................................................... 108 Figure 3. 14: Share in ASEAN Services Export, 2010 (Percent) ........................................................ 108 Figure 3. 15: Share in ASEAN Services Imports, 2012 (Percent) ...................................................... 108 Figure 3. 16: Net-Exports of Services, 2010 (Billion US Dollars) ..................................................... 109 Figure 3. 17: Aggregate Net-Exports of Services in ASEAN (Percent of GDP) ................................ 109 Figure 3. 18: Exports of Services in ASEAN by Sector (Percent of Billion US Dollars) .................. 110 Figure 3. 19: Intra-ASEAN Services Imports ..................................................................................... 111 Figure 3. 20: Singapore’s Regional Services Exports, 2009 (Percent) ............................................... 112 Figure 3. 21: Singapore’s Regional Services Imports, 2009 (Percent) ............................................... 112 Figure 3. 22: Singapore’s Intra-Regional Services Trade, .................................................................. 112 Figure 4. 1: Ratio of Total Investment to GDP (percent) -- Increasing Trend Countries ................... 124 Figure 4. 2: Ratio of Total Investment to GDP (percent) – Decreasing or Stagnant Trend ................ 124 Figure 4. 3: Ratio of Total FDI to GDP (Index, 2000=100) – Increasing Trend ................................ 124 Figure 4. 4: Ratio of Total FDI to GDP (Index 2000=100) – Decreasing Trend ................................ 124 Figure 4. 5: Intra- and Extra-ASEAN FDI .......................................................................................... 125 Figure 4. 6: FDI Inflows to ASEAN by Host Countries ..................................................................... 127 Figure 4. 7: FDI Flows into ASEAN by Sector .................................................................................. 128 Figure 4. 8: Total FDI Inflows to ASEAN by Country Source 2000-2011 ........................................ 128 Figure 4. 9: Governance Indicators in ASEAN Countries (Percentile Rankings) .............................. 134 Figure 4. 10: Starting a New Business in ASEAN ............................................................................. 135 Figure 4. 11: Starting a Foreign Business in ASEAN ......................................................................... 137
Figure 4. 12: Evolution of Real Wages of Employees (in Current US Dollars) ................................. 141 Figure 4. 13: Labor Productivity 2002-2010 (2005=100) ................................................................... 141 Figure 4. 14: From IGA to ACIA ....................................................................................................... 144 Figure 4. 15: Arbitrating Commercial Disputes .................................................................................. 150 Figure 4. 16: Global Investment Promotion Benchmarking ............................................................... 151
List of Boxes
Box 1. 1: Streamlining Non-Tariff Measures: A Toolkit for Policy Makers ......................................... 12 Box 1. 2: NTM Patterns by ASEAN Member States—Officially Notified ........................................... 15 Box 1. 3: Thailand’s Import NTM Regime ............................................................................................ 16 Box 1. 4: Recent Merchandise Trade Measures by ASEAN—Summary by Instrument ....................... 22 Box 1. 5: Myanmar NTMs from Discretionary to Automatic Licensing ............................................... 23 Box 1. 6: Indonesia’s Restrictions on Nickel and Coal Exports ............................................................ 29 Box 1. 7: Thailand’s Export Restrictions ............................................................................................... 30 Box 2. 1: The ASEAN Framework for Trade Facilitation ..................................................................... 47 Box 2. 2: Progress Towards National and ASEAN Single Window ..................................................... 50 Box 2. 3: Measuring Trade Costs: Some Methodological Points .......................................................... 53 Box 2. 4: The World Bank’s Logistics Performance Index (LPI) ......................................................... 61 Box 2. 5: Logistics Services in the ASEAN Economic Community (AEC) .......................................... 68 Box 2. 6: Air Transport Liberalization: From Open Skies to the ASEAN Single Aviation Market ...... 76 Box 3. 1: The Shift to Services and Services Trade and its Contribution to Productivity ..................... 93 Box 3. 2: Services Trade Policy and Development in Singapore ........................................................ 116 Box 4. 1: Singapore: The Investment Hub of ASEAN ........................................................................ 129 Box 4. 2: Business Licensing Reforms in Singapore and Malaysia..................................................... 136 Box 4.3: Handling Investment Inquiries in ASEAN………..…………………………………….….150 Box 4. 4: The Central Role of Investment in the Rise of the ASEAN Automotive Sector….……….154
i
Overview
A. A Region at the Forefront of Global Integration and Poverty Reduction
1. The regional economic integration agenda became a priority for the Association of Southeast Asian Nations (ASEAN) from the early 1990s as the political and security concerns of the Cold War diminished and the Association turned its focus towards economic goals.1 A series of treaties and agreements put regional integration at the center of the economic agenda. These agreements included the ASEAN Free Trade Area (AFTA), the ASEAN Framework Agreement on Services (AFAS), the ASEAN Agreement for Promotion and Protection of Investment (IGA), and the Framework Agreement on the ASEAN Investment Agreement (AIA), all signed in the 1990s.
2. The 1997 East Asian Crisis, which adversely hit the East Asian economies and particularly the ASEAN economies of Thailand, Malaysia, Indonesia, and the Philippines, provided further impetus to the regional integration agenda. Creating a larger regional market was seen to be important for attracting investors who had become cautious, and for building more resilience to macro-financial stability. The integration agenda was significantly deepened through the 2003 declaration for achieving the ASEAN Economic Community (AEC) in 2015 by setting up a ‘single market and production base’ for the 10 countries in the Association of 600 million people whose aggregate nominal GDP is currently USD 2.1 trillion (PPPD 3.3 trillion). More recently, new trade and investment treaties such as the ASEAN Trade in Good Agreement (ATIGA) and the ASEAN Comprehensive Investment Agreement (ACIA) have further deepened integration goals to accelerate progress towards the AEC goals. 3. ASEAN’s goal for integration goes beyond trade to include efforts to deepen intra-regional socio-economic ties. In December 1997, the Association adopted a vision for 2020, emphasizing the objective of “…transforming ASEAN into a stable, prosperous, and highly competitive region with equitable economic development, and reduced poverty and socio-economic disparities.” To achieve this, ASEAN members agreed to an ASEAN Economic Community (AEC) Blueprint, with the aim of achieving a single market and production base by 2015. The goals of this regional integration agreement have been to drive deep economic integration, accelerate growth and boost development. In doing this, the AEC also seeks to bridge the development divide amongst ASEAN countries.
4. ASEAN’s efforts to deepen integration have renewed importance as the global economy enters a new phase. As members of the most dynamic and enduring regional organization in the developing world, ASEAN countries have grown rapidly over the past three decades—at twice the rate of the world economic growth—and as a result their share in global GDP has doubled. The lower income ASEAN countries—Cambodia, Laos and Viet Nam—have enjoyed even faster growth, as their share of world GDP has tripled. Poverty reduction was also significant across all ASEAN countries over this period, declining by nearly half in some ASEAN countries. This rapid growth and poverty reduction was based on sound macroeconomic management, high rates of investment, especially in human development and infrastructure, and the rapid growth of exports mainly to the advanced economies in North America and Europe.
1 ASEAN was formed in 1967. The members of ASEAN are Brunei, Cambodia, Indonesia, Laos, Malaysia, Myanmar, Philippines, Singapore, Thailand, and Viet Nam. They are referred to as ASEAN Member States (AMS) and member states in this report.
ii
5. As the world economy struggles to come out of a crisis, ASEAN economies will have to search for new sources of growth in regional markets. The traditional export markets of G7 countries will be dampened, as those economies will grow slowly in the medium term under the burden of large debts and deficits. As a result, 2012 marked a watershed when the external trade did not contribute to the growth of the East Asian economies. In this context, stimulating domestic demand based on a rapidly rising middle class and regional demand through creating a large integrated ASEAN market of USD 2 trillion will provide new sources of growth on the demand side, especially in services. On the supply side, the freer flow of investment, technology and services across the region under AEC will boost productivity and supply. Last, but not least, the deep integration of AEC will provide a strong platform for the larger economic integration being discussed under the ASEAN + 3 and ASEAN + 6 umbrellas.
B. Objectives of the ASEAN Integration Monitoring Report (AIMR): Taking Stock of ASEAN’s Contribution to Trade Integration
6. This report, jointly produced by the ASEAN Secretariat and the World Bank, focuses on policy and market integration outcomes achieved in ASEAN Member States (AMS) as part of the ASEAN Economic Community (AEC) formation process under Pillar One.2 Under this pillar, ASEAN will form a single market and production base with free flow of goods, services, investment, skilled labor, and a ‘freer flow’ of capital.3 The aim is to assess progress of AMS regional and global trade integration, drawing on evidence from a large range of indicators on policies and outcomes. The focus of this report is to assess whether ASEAN policies are associated with measurable progress in participation in international and regional trade in goods, services and investment, through increased and more diversified trade flows. The report also attempts to highlight sectors where ASEAN and its Member States have been more successful, and conversely, sectors where progress is still needed. 7. In so doing, the AIMR strives towards using recent international data and indicators where available. Indicators such as the Logistics Performance Index or the Services Trade Restrictiveness Index help shed additional light on fundamental elements of international trade. They also provide more comprehensive and robust measures of reform and their impact. The focus on this new breed of indicators is also a first attempt to address the need for better information about complex regulatory dimensions of trade integration, which are an integral part of the ASEAN agenda but are not yet very well analyzed. This point is elaborated in the policy recommendations below.
8. This AIMR is also expected to be the first of an annual report series providing a regular update on the state of trade integration in the ASEAN region. This is part of an effort to assess the
2 This report has been jointly produced by the Association of South-East Asian Nations—ASEAN (ASEAN Integration Monitoring Office) and the World Bank (Office of the Chief Economist, East Asia and Pacific Region) as part of the Advisory Services program of the World Bank for ASEAN. Staff of both organizations contributed to drafting the report and reviewing it based on comments received from ASEC, AMS and WB officials.
3 “An ASEAN single market and production base shall comprise five core elements: “(i) free flow of goods; (ii) free flow of services; (iii) free flow of investment; (iv) freer flow of capital; and (v) free flow of skilled labor.” ASEAN Economic Community Blueprint, para 9, ASEAN, 2009.
iii
relevance and importance of the ASEAN process and reflect on it, while providing a new venue for dialogue among AMS and their constituents. 9. The focus of the AIMR is on policy outcomes of ASEAN integration. By design the report details ASEAN policy commitments, but does not provide a comprehensive assessment of progress towards meeting these commitments. This work was undertaken in a comprehensive manner in the ASEAN Economic Community Blueprint Mid-Term Review: Integrative Report and the companion country reports detailing the state of implementation in each ASEAN Member (ERIA, 2012). The report refers to this body of work and should be read as complementing ERIA studies’ findings. 10. A key finding of the AIMR is that ASEAN and the AEC agendas have already brought important gains to the AMS. This finding is consistent with a range of empirical research, mostly using computable general equilibrium ex ante simulations on the potential impact of ASEAN on GDP growth. These studies consistently show a positive potential impact from ASEAN integration. According to one of the earlier studies (Plummer and Yue’s, 2009), the deep integration measures envisaged under the ASEAN Economic Community would lead to an increase in welfare of about 5.3 percent or about USD 69 billion in 2009 incomes. This is more than six times larger than the effect estimated for simply having free trade under AFTA. Other important results on the impact of the formation of AEC in 2015 include:
- Increase in per-capita incomes by 26 percent to 38 percent in the resource-rich original group of ASEAN countries compared to the baseline, including the effects of higher FDI;
- Greater inflow of FDI with an increase in FDI stocks by 28 to 63 percent; - Increase in growth rates by 0.5 percent to 1.0 percent points; - Expanded trade in goods; - More competitive consumer markets leading to a cheaper and wider range of goods and
services; - Lower cost of capital; - Reduced skill shortages due to flexible labor markets; and - Narrower development gaps as the less developed CLMV (Cambodia, Laos, Myanmar and
Viet Nam) group gains most in productivity from regional integration.
11. More recent studies also find significant gains from deeper integration measures under AEC. The most recent research, conducted as part of the AEC Mid-Term Review (AEC-MTR) by ERIA (2012) for eight ASEAN countries (excluding Brunei and Myanmar due to data availability), finds the most significant gains arising from service liberalization, which leads to a higher growth rate for Indonesia, Malaysia, the Philippines, Singapore, Thailand, and Viet Nam. A positive effect of trade facilitation, infrastructure and logistics on trade cost is also expected for many of these countries. 12. This report finds that gains from integration to ASEAN have come from five directions. First, ASEAN economic integration has been trade-creating (increased trade with ‘lower cost’ partners and welfare) and not trade-diverting (reduced trade with lower-cost partners and welfare). As a result, ASEAN integration has not taken place at the expense of global integration, but has in fact been a ‘building block’ for world trade rather than a ‘stumbling-block.’ Two pieces of evidence suggest this. As noted in Chapter 1, AMS have made significant progress in almost eliminating ASEAN tariffs on regional trade (to less than one percent on average), while also
iv
reducing tariffs on trade with other countries. Further, evidence suggests that regional tariff liberalizations actually induce a faster decline in external tariffs than would otherwise occur. For instance, if imports of a product faced a 10 percent MFN tariff but 0 tariffs if sourced from other ASEAN members, then the ASEAN importing country would subsequently tend to reduce its MFN tariff on that product by between 2 ½ and 4 ½ percentage points (Calvo-Pardo et al, 2009). Corroborating research found that products receiving preferential treatment in Indonesia, the Philippines, and Thailand under the ASEAN Free Trade Agreement underwent greater reduction in MFN tariffs than non-preferential products by between one and five percentage points. As a result, the margin of preferences—and the incentives to trade—for intra-ASEAN trade remained small and did not divert trade away from non-ASEAN partners.
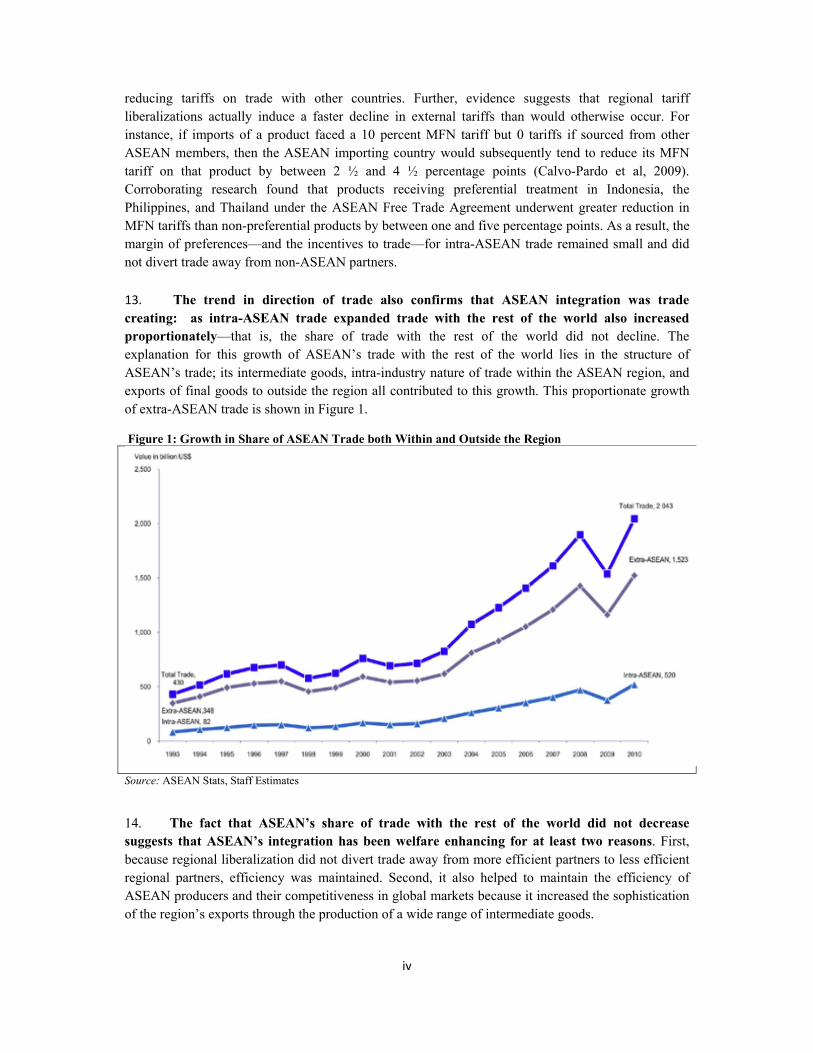
13. The trend in direction of trade also confirms that ASEAN integration was trade creating: as intra-ASEAN trade expanded trade with the rest of the world also increased proportionately—that is, the share of trade with the rest of the world did not decline. The explanation for this growth of ASEAN’s trade with the rest of the world lies in the structure of ASEAN’s trade; its intermediate goods, intra-industry nature of trade within the ASEAN region, and exports of final goods to outside the region all contributed to this growth. This proportionate growth of extra-ASEAN trade is shown in Figure 1.
Figure 1: Growth in Share of ASEAN Trade both Within and Outside the Region
Source: ASEAN Stats, Staff Estimates
14. The fact that ASEAN’s share of trade with the rest of the world did not decrease suggests that ASEAN’s integration has been welfare enhancing for at least two reasons. First, because regional liberalization did not divert trade away from more efficient partners to less efficient regional partners, efficiency was maintained. Second, it also helped to maintain the efficiency of ASEAN producers and their competitiveness in global markets because it increased the sophistication of the region’s exports through the production of a wide range of intermediate goods.
v
15. While the share of intra ASEAN trade has stayed at a stable and seemingly small share of 25 percent of total ASEAN trade, in reality it represents a high degree of integration. Measured by the trade intensity indicator, which compares regional trade to global trade with the region, ASEAN is highly integrated compared to other regional organizations such as the European Union or the North American Free Trade Organization (NAFTA). 16. Second, improvements in trade facilitation through ASEAN integration have helped, leading to greater trade and efficiency gains. Overall, trade costs in ASEAN are generally lower than elsewhere, both in intra- and extra-regional trade. Indeed, intra-regional trade costs in ASEAN are comparable to those in NAFTA, which is indicative of a high level of economic integration. Further, ASEAN substantially reduced its level of trade costs between 1996 and 2001, although improvements appear to have slowed afterward. These improvements over the past decade have significantly lowered trade costs by more than 15 percent on average within ASEAN and by about eight percent with the rest of the world. Trade costs for the ASEAN-5 countries have substantially fallen over recent years, by as much as 50 percent between 1990 and 2007. This, in turn, has led to an increase in trade flows. Other research, using a broader measure of trade costs than international transport costs, shows that trade costs have fallen substantially over recent years, by between five and ten percent from 2001 to 2007. However, performance differs substantially across countries. For example, while Viet Nam stands out as having experienced major trade cost reductions, performance improvements have been more moderate in other ASEAN countries.
17. Third, the AEC agenda has contributed modestly to services sector development and trade by providing a push for services trade liberalization commitments that go beyond similar efforts in the World Trade Organization (WTO). A comparison of AFAS commitments with similar reforms has been made with commitments under the General Agreement on Trade in Services (GATS) in six countries for which detailed survey-based policy data is available. Except for Viet Nam, AFAS commitments call for a more liberal policy in the retailing and transportation sectors than in WTO Doha Rounds.4 Moreover, in some sectors and countries, AFAS commitments imply a more open services trade regime than the policies that were implemented in 2007/08. Overall, there also seems to have been some progress in implementation in areas such as air and road transport, and movement of professionals in the areas of engineering and architecture. 18. Fourth, ASEAN integration has helped to attract FDI, both from outside and particularly from inside the region. A key goal in forming AEC was to raise investment and particularly FDI in the ASEAN region. As investors became shy in the wake of the ASEAN financial crisis of 1997, the larger market size created by the ASEAN Economic Community was expected to attract investment. As Chapter 4 on FDI makes clear, ASEAN integration has been significant in attracting FDI to ASEAN countries, although the destinations remain highly concentrated. FDI to ASEAN countries increased from USD 20 billion in 2001 to USD 94 billion in 2010. Within the ASEAN region, FDI flows have also increased markedly from an average of USD 5 billion in the 1990s to USD 13 billion in the last three years. Attractive factor prices and good connectivity in the region have no doubt played a key role in drawing FDI to the region.
4 For the methodology of the services data collection see paper, “Guide to the Services Trade Restrictions Database” (Borchert, Gootiiz and Mattoo, 2012b) and in supplementary material available at http://iresearch.worldbank.org/servicetrade. Details on the comparison with GATS are provided in Chapter 3.

vi
19. However, there is also good evidence that ASEAN integration efforts had a direct impact on increasing foreign investment with important beneficial impact. Regional integration has been found to increase the attractiveness of the region to foreign investors, and ASEAN in no exception. There is also a suggestion that FDI not only supplies ASEAN countries with necessary funds, but also helps in exporting outside the region. This has positive dynamic implications for ASEAN countries in that these investments are not tariff-jumping FDI but efficient FDI; they are highly productive and well paying, are conduits of technology, and create positive spillovers for other firms. 20. Finally, the AEC has also helped to stimulate the development of lower income CLMV countries and bridge the development divide (although the divide still remains vast). As a result, the share of GDP of CLMV countries in ASEAN has increased from around 3.5 percent in 1990 to nearly 10 percent in 2011. As noted earlier, the share of GDP of these countries in the global economy has also increased markedly.
21. There are, however, several areas where actual progress in implementation in integration has been limited. Chief among these are AEC’s goals to remove non-tariff barriers to trade, achieve integration of services especially through liberalizing foreign investment thresholds in services, and improve some areas of trade facilitation. These are discussed below.
C. Broad Findings from the Report
22. ASEAN integration has progressed in parallel with global integration. Global and regional trade flows in ASEAN have been closely intertwined with goods, services and investments. For instance, non-ASEAN investors also generate intra-ASEAN investments, and an important portion of intra-regional trade in goods takes place in the context of global supply chains. Similarly, for investments, the ratio of intra-ASEAN FDI to total FDI in ASEAN increased from eight percent in 2000 to 20 percent in 2011, and continues to rise. Baldwin (2012) shows that intra-industry trade in ASEAN—an indicator of “supply-chain trade”—is high in absolute levels for intra-ASEAN. However, there are also suggestions that more can be achieved as this level is not yet as high as it is for trade among developed countries (EU regional trade or trade between the EU and the US). 23. Broadly defined, the ASEAN agenda of regional integration has been implemented concurrently with the opening of market access to non-ASEAN traders. The AEC Blueprint envisages a region fully integrated into the global economy, indicating the open nature of the ASEAN regional integration model (Soesastro, 2008; ERIA, 2012). It was discussed earlier how preferential tariff liberalization in ASEAN proceeded alongside MFN liberalization. The same is true for investment policies: access of FDI to markets and, conversely, restrictions to market access have been applied largely on a non-preferential basis. The emphasis on trade facilitation naturally supports ASEAN’s open regionalism objective as reductions in trade transaction policy costs tend to benefit all traders indiscriminately.
24. Looking forward, ASEAN should continue as a facilitator of better integration of its members’ economies into the global trading system and pursue an open regionalism agenda. This agenda can build on three features: ASM complementarities, deep integration, and implementation.

vii
25. The high trade complementarity of some ASEAN countries to the region—indicating that exports of those ASEAN member countries are in high demand in other countries of the region—points to significant gains from further trade within ASEAN. Important differences in economic structures among ASEAN members point out differences and complementarities in comparative advantage. Recent research in other countries suggests that integration of the services sectors can also stimulate productivity growth in manufacturing and other sectors in ASEAN countries and bring significant gains. Overall, the research suggests that creating the AEC could increase annual income growth (conservatively) on the order of 0.5-1 percent of GDP and increase FDI stocks by 28 percent to 63 percent (or USD117-USD264 billion relative to 2006 inward FDI stocks)1 through greater regional trade in both goods and services.
26. Supply chains are only as strong as their weakest links: complementarities among member countries should be developed through the help of the ASEAN integration agenda. Two instances illustrate this potential: i) there are numerous areas of trade integration that must be tackled at the regional or sub-regional level, such as mutual recognition of rules and procedures, suggesting that ASEAN members should seek mutually beneficial solutions; and ii) ASEAN members can draw on best practices and knowledge from within the region to improve their overall trading environment. As pointed out by Soesastro (2008), successful production fragmentation in the region rests on the possibility to shift part of the production base to less developed economies, where costs are cheaper, provided that the cost of connecting to the supply chain (transport and logistics, and input services) is also lowered. In turn, participation in global supply chains is a source of growth and economic diversification for less developed countries. 27. A key finding of this report is the areas of commonality that arise in the four trade integration pillars examined: goods, services, trade facilitation, and investment. This reflects that ASEAN members have achieved significant liberalization with respect to market access in several of these areas. Trade rules whose sole purpose is to explicitly discriminate against foreign suppliers, such as tariffs, prohibitions and limitations aimed at foreign economic agents (ASEAN and non-ASEAN), have come down.
28. As this report also shows, while there remain several areas (non-tariff measures, services, investment) where progress must still be achieved to meet and expand existing liberalization commitments, the overall integration agenda should also now include regulatory measures that remain largely unaddressed. Non-tariff measures and barriers (goods), red tape and transaction costs (trade facilitation), entry or operational restrictions affecting foreign service providers (including transport, third-party logistics, distribution that helps determine trade facilitation outcomes), and FDI policies, all have a common important regulatory agenda that affects international trade and needs to be addressed.
29. Regulatory barriers impeding trade are different from traditional trade barriers such as tariffs and are potentially numerous and pervasive. Regulations are core to international trade, and as such are already recognized in the AEC agenda, be it standards to ensure the safe movement of goods, regulations to guarantee efficient and competitive markets in services and investment, or procedures that dictate how borders are managed. Facilitating trade implies reducing or eliminating altogether the discriminatory incidence of these regulations and diminishing compliance costs while meeting the regulatory objectives. However, tackling such issues requires more than just commitments to the elimination of flagrantly discriminatory barriers.
viii
30. The across-the-board regulatory challenge has implications in terms of how to move forward in pursuing the ASEAN integration objective. Going forward, there needs to be more emphasis on putting in place and strengthening mechanisms that enable better collective management of these regulations. In practice, this entails improving information and transparency on measures that are often complex and opaque: creating focal points, agreeing on specific performance indicators, etc. Some of these reporting efforts are recognized in the AEC Blueprint but have not always been met by member states (such as the Trade Facilitation Assessment Framework and Indicators), or they offer an incomplete picture of the reality of barriers to trade (for instance the notification mechanism of non-tariff barriers). Another important and complementary element addresses accountability—via establishing baselines, measurement, and transparency to allow stakeholders to monitor progress and outcomes. The ASEAN Scorecard is a right move in this direction.
31. A second dimension of the regulatory agenda is setting up processes that help address the unnecessary costs that regulatory barriers may create. This requires the involvement of regulatory experts and stakeholders who are directly involved with these regulations. It also includes incorporating the private sector, which can provide views about lowering costs while guaranteeing compliance. There are often several government ministries and agencies concerned with a given regulation (such as establishment of a foreign firm) or trade process (such as border crossing), and involvement of them all facilitates coordination of their actions and mutually agreeable solutions. One key aspect of addressing regulatory barriers is that the integration process should be operational in purpose—it should try to facilitate the circulation of information through better understanding of how regulations work (for instance, by conducting regulatory audits), and look out for solutions to regulatory problems (through exchanges around best practices).
32. Given that regulatory issues pervade goods, services and investment integration policies, and affect regional supply chains in more than one way, it would be advisable for the ASEAN membership to also think holistically in terms of supply-chain policy strategies. This recommendation echoes the conclusion of a recent report (WEF, 2013). It also reflects on initiatives by the ASEAN membership to draw more inclusive visions such as in the Master Plan on ASEAN Connectivity (2010). This would involve looking for indicators of performance that capture the entirety of the supply chain and not just some of its discrete components, and setting up coordinating mechanisms that enable linkages to be created between areas that are traditionally negotiated and managed separately (for instance, linking trade facilitation efforts with liberalization of logistics and transport services).
33. Going beyond commitments, the ASEAN membership must now focus on implementation and the institutions supporting it. Arguably, implementation should be a chief concern for any international agreement, but insisting on implementation carries a deeper meaning when considering non-tariff barriers, transaction costs or operational restrictions. The reason is that it is likely impossible to come up with a complete catalog of possible measures impeding trade, and even less likely to come up with simple and harmonized solutions to reduce these barriers. Merely calling for the elimination of non-tariff barriers is not enough. Looking at implementation through the establishment of mechanisms of monitoring, consultation and exchange of best practice described above has some implications in the context of the role of ASEAN and its institutions, including increasing the focus on monitoring, bringing on board technical expertise, devising arrangements that

ix
enable satisfactory redress (both informal and formal), and increasing resources devoted to this overall effort.
34. It is now widely agreed that a key task for ASEAN will be to prioritize the actions and targets set out in the highly comprehensive AEC Blueprint. The discussion on the different areas of Pillar 1 in the rest of this Overview identifies the priorities set by the AIMR. These priorities are based on two general principles. First, policy measures that remove clear impediments to regional trade in goods and services and investment flows need to be prioritized over actions that are country specific. Second, the priority should now be to go beyond ensuring compliance with market access commitments to implementation. Under this scenario there needs to be greater efforts to benchmark the current status of policies and regulations and monitor changes therein in support of regional integration, especially in the case of non-tariff trade barriers and services trade. These points are elaborated below.
D. Progress and Challenges in Trade in Goods
35. Among AEC goals, ASEAN has made substantial progress in integrating goods markets and opening up trade in goods. Intra-ASEAN elimination of tariff protection has been achieved completely for Singapore and Brunei. Indonesia, Malaysia, Philippines, and Thailand have also eliminated tariffs on almost all imports from other member states since 2010, except on agriculture sensitive goods and a few other goods not subject to liberalization under ATIGA. CLMV countries have also made rapid progress, but Cambodia needs to accelerate its tariff reduction schedule to meet the subgroup-specific AEC target by 2015.5 At present, while ASEAN is highly integrated, the potential for higher gains from trade is very much possible given the complementarity of trade patterns of some ASEAN countries with others, that is, several ASEAN countries export goods that are imported by other countries. 36. Low and declining MFN tariffs by ASEAN countries have contributed to low intra-ASEAN preference margins, which in turn help explain the low utilization rates of ATIGA preferences, especially in some member states. With already liberal and recently simplified rules of origin for intra-ASEAN trade, the only avenue for ASEAN to boost preference utilization rates might be a targeted technical assistance and information campaign to reach traders of those goods with still sizeable preference margins and in those countries with utilization rates around or below 20 percent. However, with further preference erosion to be expected as ASEAN Member States will likely move further on MFN tariff and peak reduction, boosting the utilization rates of such shrinking preferences should not be a priority concern for ASEAN.
37. In contrast to tariff reform, there has been little progress by ASEAN Member States in identifying and eliminating their ‘trade-barrier’ elements in their non-tariff measures (virtually all implemented on an MFN basis), despite it being an explicit AEC Blueprint goal. However, their wholesale elimination is not a realistic medium-term goal even if limited to ‘core’ trade-restrictive measures; even these might have been adopted to meet legitimate objectives such as public
5 For CMLV countries, tariffs on all goods should be eliminated by 2015, except for the seven percent flexibility products for which the deadline is 2018. Other exceptions to tariff elimination for all ASEAN members are contained in schedules D (sensitive goods whose tariffs can be maintained at 0-5 percent) and H (goods not subject to liberalization). CLMV benefit from a longer time period to implement the liberalization of schedule D: 2013 for Viet Nam, 2015 for Lao PDR and Myanmar, and 2017 for Cambodia.
x
health or consumer protection, and thus require revision but not elimination. ASEAN needs to instead recognize the complexity and diversity of non-tariff measures (NTMs) and adopt a goal of streamlining rather than eliminating them. This entails reviewing cumbersome domestic regulations with a supply-chain approach and in consultation with private sector associations (of producers, downstream users, and final consumers) to make them more targeted, simple, and effective, while minimizing any trade-restricting impact.
38. Most of the ASEAN economies impose not only non-tariff barriers (NTBs) on imports, but also maintain high export restrictions, both in absolute terms and in comparison to other relevant regional groupings. Most member states require export licensing (except for the Philippines) or impose export taxes (except Brunei, the Philippines, and Singapore) for at least some products, including on intra-ASEAN trade. ASEAN needs to pursue a program of drastic reduction of export restrictions, especially on intra-ASEAN trade. 39. In the short term, this report recommends that ASEAN persuade both its members and its trading partners to roll back all new trade-restrictive measures introduced since the start of the global financial crisis. It also recommends that ASEAN avoid restricting commerce via introducing new or stricter NTMs, by its members and also by its trading partners. Furthermore, in developing a new, fresh medium-term agenda for regulatory (including NTM) reform, ASEAN should adopt a coherent approach across countries and ministries and consider vesting more authority in the Secretariat (accompanied by adequate financial resources) to review national regulations, expand region-wide consultations with industry and assess member compliance with any future regionally-agreed guidelines or directives. In addition, this report recommends a promising medium-term action agenda, drawing on proposals by ASEAN’s 2012 Chair, Cambodia, to start streamlining NTMs by:
(i) improving the classification of NTMs according to the UNCTAD guidelines adopted in February 2012; (ii) updating and verifying country lists in an open process driven by the ASEAN Secretariat rather than on a voluntary basis by individual member states; (iii) eliminating, with only few exceptions, all quantity control measures comprising non-automatic licensing, import and export quotas and prohibitions, and all foreign exchange at least for intra-ASEAN trade though it may not be possible or practical to police such limitations;6 (iv) identifying the other most egregious trade-restrictive measures, with help not only from the private sector (as foreseen in article 42 of ATIGA) but also with sectoral regulatory impact assessments to be launched urgently; (v) deciding in ASEAN bodies on national level regulatory modifications as well as regional harmonization actions necessary to eliminate or minimize the trade-restrictive impact of the NTM measures identified; and
6 Myanmar, the only ASEAN Member State with foreign exchange controls, should also eliminate such restrictions. It is indeed expected to do so in the very near future, as foreign trade and financial sanctions are being lifted. The Central Bank of Myanmar (CBM) introduced an exchange rate system in the form of the official peg with a managed float unifying the exchange rates with assistance from the International Monetary Fund. Accordingly, CBM began a managed float system on April 1, 2012, dismantling the existing multiple exchange rate system. A new currency regime was commenced on April 2, 2012 by setting a daily reference exchange rate of Myanmar Kyat to the dollar by the CBM in line with its value on the market rate as announced at www.cbm.gob.mm.
xi
(vi) planning an in-depth regional study of NTMs, possibly under Phase II of the AEC Monitoring and Evaluation Capacity Building Program (AECMEP) collaborative project between the ASEAN Secretariat and the World Bank.
40. Overall, the trends over the last seven years for various indicators point to a high degree of intra-regional merchandise trade integration within ASEAN, which is increasing at a faster pace than its GDP, though not faster than its trade with the rest of the world. Measured in terms of indicators such as regional trade intensity, merchandise trade in ASEAN is more integrated than other regional groups such as EU or MERCOSUR in Latin America. They also paint a picture of a recent resumption of the historical expansion of ASEAN trade with the rest of the world. This picture is consistent with the hypothesis of ASEAN being a force for trade creation rather than trade diversion. Not only has trade increased, there has also been an increase in the diversification and sophistication of exports in most ASEAN countries. Although still behind, ASEAN 6 high and middle income countries compare well by the number of goods exported with that of the EU 27 countries. However, Brunei, Cambodia, Lao PDR, and Myanmar all suffer from a relatively low export diversification. Only Indonesia, with its predominance of natural resources, and possibly Cambodia, are moving in the wrong direction toward more export concentration. They should consider policies to reverse this trend.
E. Trade Facilitation
41. The AEC Blueprint has rightly identified trade facilitation as an essential piece of international trade integration. Customs reform through simplification, harmonization and modernization of procedures is the centerpiece of these efforts. The ASEAN agenda is ambitious, with the objective of strong integration of national customs systems through the ASEAN single window and ASEAN e-customs. The adoption of some high-level international standards, such as preconized by the Revised Kyoto Convention, is also on the agenda, although not all modern customs management elements are present. 42. The ASEAN trade facilitation agenda is not only about customs reform; it needs to be broadened to include other essential elements. Facilitation is also about ensuring that implementation of product standards and phytosanitary measures and the provisions of transport and logistics services do not unduly impede trade. The streamlining of standards is an area that, while clearly identified as a priority by both ASEAN governments and the private sector, has recorded modest and limited progress. It should become a focus of future work with emphasis on sectoral approach and results, starting with transparency.
43. In its identification of logistics services as a key component of integration, ASEAN is a pioneer. This overall progress in facilitating trade is reflected in key international indicators. Both Doing Business (DB) and Logistics Performance Index (LPI) indicators show that the region is a strong performer compared to other regions of the world and that it has demonstrated measurable progress over the past five years. As noted, this performance has been reflected in the significant decline in trade costs both within ASEAN and outside ASEAN trade. ASEAN as a group can also benefit from the experience of Singapore, the leading world performer. However the DB and LPI indicators also show areas in need of improvement: ASEAN does not perform as well as ASEAN+6 countries; there is a wide disparity of performance within ASEAN with three of the CLMV countries lagging.
xii
44. Further, progress has been uneven in the critical area of transport. In the air transport sector there has been both progress and growth, but the slow implementation of the multilateral agreements by some AMS have impeded the full realization of the ASEAN open sky regime so far. On the other hand, little has been achieved in the maritime sector (this is not a priority sector) and this translates into poor connectivity and inadequate progress in trade facilitation for several ASEAN members.
45. This report proposes the following priorities for advancing the AEC’s trade facilitation agenda: (i) Reform of customs is a vast and challenging agenda that includes advanced techniques that may not be reachable to all ASEAN partners, especially those with capacity needs. Given this, it might be perhaps desirable to consider establishing some order of priorities rather than expanding the agenda at all costs. For instance, facilitation measures that absolutely require regional or cross-country coordination, such as transit and the harmonization agenda, could be prioritized over those that can be carried out by AMS individually. Another criterion to follow might be to focus on simplification and streamlining first, before moving on to the more challenging modernization features of this agenda. Last but not least, not all reforms have the same value: it would be useful to put first the reforms that provide the most immediate gains. (ii) A comprehensive look at all elements of the trade supply chain is needed for successful integration into regional and global value chains. Partial reform only achieves modest gains and only countries that have undertaken a global approach to facilitate trade have made significant headway. The various elements of the AEC framework dealing with transport and logistics, and services and customs seem to be pursued independently; this probably limits opportunity for reforms (for instance different AMS line ministries may be involved in each initiative) and likely prevents useful linkages from being made. (iii) The streamlining of institutional responsibilities and improvements in inter-agency coordination is another priority. For instance, the Philippines has numerous agencies involved in trade facilitation. In Cambodia, the involvement of two customs entities, customs and CamControl, delays customs processing. In Viet Nam there is poor coordination among the various trade facilitation measures that are undertaken. The program of National Single Windows should go some way towards addressing some of these issues, but ASEAN cooperation could also help by looking at the role of agencies other than customs, at the border. (iv) Governance of trade procedures, including informal payments and the additional burden of pre-shipment inspections, remains a concern in several countries in the region. Therefore, a priority is clearly to improve human capital and institutional strengthening. In this context, transparency and monitoring have an important role to play in providing incentives for reform and good governance. An important pending task is the carrying out of trade facilitation assessment on a biennial basis by individual AMS. Such assessments will measure performance and help lay out more detailed roadmaps for improving trade facilitation. The effective use of notification and creation of a repository of regulation are two other important agendas that ASEAN should meet. (v) Focusing on capacity building initiatives, such as those already identified in the AEC Blueprint, will be critical and can benefit from the experience and expertise of the most advanced
xiii
members of the region. Thus, using ASEAN to develop tools of cooperation between member states would help address some of these issues. These tools could include: expert sectoral committees, programs of secondary support among countries, and the reinforcement of the ASEAN Secretariat’s own expertise and participation in international standard setting bodies. (vi) While there has been significant progress in National Single Window in countries such as Indonesia, Philippines and Singapore, there has been less progress in other countries. In the run-up to the AEC 2015 targets perhaps a focus on implementing the National Single Window agenda in AMS has become important.
F. Services
46. The services sector integration goals of the AEC present the biggest challenge and also the biggest opportunities for the region. Services, already an important source of both output and employment in ASEAN economies, will be increasingly critical in the future. On average, the sector contributed more than 40 percent of total value-added and more than 50 percent of total employment in 2010. Some ASEAN countries, particularly Singapore, Malaysia and the Philippines, have already become significant exporters of modern services in sectors such as professional and information services, transport and communication technology, business processing outsourcing (BPO), higher education, and health tourism. On the demand side, as per capita income rises further, the demand for services will grow rapidly. On the supply side, finance, communications, information technology, higher education and transport will provide inputs for high end manufacturing sectors and sophisticated service sectors. Thus, a more competitive services sector will lead to a more competitive manufacturing sector, an increase in overall productivity and export opportunities for the services sector. 47. While growth in services has been encouraging in recent years, the services sector in ASEAN economies still remains relatively underdeveloped. In particular, the relative importance of services in GDP and trade is less than what would be expected given the levels of income and development in the AMS. Moreover, regulations affecting services in ASEAN countries are relatively more restrictive compared to other regions and across different modes of services provision, and particularly for professional and transport services. 48. In this context, while the AEC goals for ASEAN provide useful and detailed targets for the integration of services in the ASEAN region, progress has been mixed and modest. Overall, there has been progress in meeting sectoral commitment targets until the 8th Package of AFAS. However, while in terms of commitments AFAS often goes beyond GATS commitments or Doha Round offers, this rarely leads to changes in the regulations that are applied in AMS. Hence, the impact on trade and competitiveness of ASEAN economies is limited to the potential effect on investment from strengthened assurances against a policy rollback. According to the analysis of services trade data, this effect has not been sufficiently strong to trigger a large expansion of intra-ASEAN services trade.
49. In fact, for most countries and sectors the commitments to liberalize services contained in AFAS fall short of the policies that were implemented in 2007/08 already. In other words, countries are ahead of AFAS and the main impact from implementation of the AFAS commitments will be to provide assurance to regional investors that any potential reversals in the trend towards greater services trade integration will be more limited than under the WTO provisions. One result of
xiv
this is that the growth of services trade has outpaced goods trade globally and in AMS. ASEAN countries such as Singapore, the Philippines and Malaysia have already become significant exporters of modern services in sectors such as professional services and information and communication technology, BPO, higher education and health tourism. Despite these improvements, the services sector in ASEAN economies is still relatively underdeveloped. While the contribution of services growth has picked up in the last decade, the share of services in GDP remains relatively low for ASEAN economies compared to countries in other regions.
50. Another example of mixed progress comes from one of the integration efforts concerning the eight mutual recognition arrangements (MRA) for professional services that have been concluded among AMS. Indeed, international experience suggests that the most pronounced benefits from regional integration in services come from the harmonization of the regulatory environment and the convergence of policy regimes through the creation of common standards and institutions. Yet, the conclusion of MRAs can only generate the hoped-for benefits in terms of market integration if the arrangements are properly implemented and not compromised by national regulations. Recently, however, ASEAN has taken a new approach to this issue through the signing of an Agreement on the Movement of Natural Persons in late 2012. This agreement is a step in the right direction, as it has introduced enough flexibility to help facilitate faster implementation in the movement of skilled workers; however it is too early to evaluate its effectiveness. 51. Three priorities emerge in the task of implementing AEC Blueprint goals. (i) The past focus of reform discussions in the Coordinating Committee on Services (CCS) on improving market access now needs to be supplemented by renewed focus on the implementation of regulatory reforms. Doing so will help to move more quickly towards the objective of the AEC Blueprint of creating a unified services market in ASEAN. The domestic regulatory reform agenda, which helps to implement commitments and ensure that external liberalization takes place after adequate prudential and pro-competitive and institutional measures are in place, has now become a priority. Here, shifting the attention of regulators and policy makers towards creating this agenda and then towards a unified services market with common rules and procedures is often a more promising avenue to foster regional integration. (ii) Upgrading technical capacity on sectoral involvement in services trade negotiations and reforms has become urgent. Steps in this direction could range from the occasional organization of information exchanges among sectoral regulators to the delegation of negotiating authority from the CCS to new sectoral working groups. This would help the role of the CSS to evolve towards ensuring overall coherence and broad-based progress on services integration. Also, a systemic work program to implement domestic regulatory reforms might facilitate the implementation of services commitments. (iii) Bridging the existing divide in regulatory capacity among AMS. As the data analysis has demonstrated, there is considerable diversity within ASEAN with some strong services exporters, such as Singapore or the Philippines, and several less well-positioned countries that are just starting to integrate their services sectors into international markets. Moreover, in the STRI-analysis, the CLMV appear as being relatively open to services trade. Yet, these AMS are still in the process of codifying their existing regulations, and creating transparent and consistent policy regimes in the different services sub-sectors is an important step in the development process. On the other hand, many of the more advanced AMS have mature services sectors and well-established prudential and consumer
xv
protection measures in place and would benefit from a regulatory easing and its pro-competitive impacts. These diverging situations and needs might best be appreciated and dealt with in discussions of sectoral experts rather than trade policy generalists. Also, the regular meetings of sectoral officials from AMS might help to spread information on best practices and useful approaches to regulatory challenges in the individual sub-sectors.
G. Foreign Direct Investment
52. The role of foreign investments in ASEAN global integration has grown noticeably over the past decade, even taking into account the financial crisis of 2008. The perception of ASEAN countries as destinations for foreign investments is very positive with several ASEAN members among the top world destinations, so this favorable trend can be expected to continue in the international environment. Remarkably, intra-regional investments have taken a central role in this context. The share of intra-regional FDI is rising, a result of the confidence in future opportunities in the region and the relative stability offered by the region in contrast to the rest of the world. 53. The distribution of foreign investments in the region is, however, very uneven: three fourths of investments are concentrated in five countries, and half in one country (Singapore). While this reflects the economic size and development disparities in the region, it also follows the level of regional and global integration of the various economies in the region. Therefore, if ASEAN is to keep attracting productive foreign investments, it must keep pushing not only investment reforms but also other trade and business environment reforms that are part of the blueprint package and beyond. Indeed, reduction of barriers to trade and facilitation of trade flows offer guarantees to investors of returns on their productive investments.
54. The characteristics of foreign investment in ASEAN, mainly directed towards global and regional supply chain manufacturing, suggest that there are still important barriers to integration. If these were removed it would make the region even more attractive to foreign investors. Arguably, this applies even more to the CLM (Cambodia, Lao PDR, and Myanmar) group, which is in need of substantial reform progress and increase in FDIs.
55. In terms of investment policies, progress is needed in several directions. The most visible aspect of it is restrictions to levels of foreign equity cap. Good reforms have been made, but the region overall is still lagging behind East Asian and OECD countries as measured by investment restrictiveness data. ACIA does not cover all sectors, in particular services. Significant restrictions in telecoms, electricity and banking—all of which are important inputs into economic activities—are prevalent in a majority of AMS and still far from the 2015 objective of free and open investment. Overall progress in services areas is needed now that there is movement towards opening in manufacturing and agriculture.
56. The institutional approach of the ACIA towards liberalization of investment would also benefit from improvements. As it stands, there is considerable leeway for creating reservations to liberalization and the use of negative lists is not very transparent. Less visible, but also important, are regulations such as performance requirements, restrictions on capital movements, and constraints on movement of labor that can also restrict investments. Such conditions are still relatively frequent in the ASEAN countries and are contradictory to the principle of equal treatment of foreign and national investors affirmed in the ATIGA. Implementation or facilitation of investment is also very important. Regulations that are not directly related to investment, such as land access (which is part of the
xvi
reservations to liberalization), visa policies, and screening policies for regulatory purposes and tax exemptions may further limit foreign presence. A survey of businesses conducted by ERIA (Economic Research Institute for ASEAN and East Asia) indicates that great importance is attached to such measures by foreign investors, which suggests that further joint efforts to streamline these policies will be welcome.
57. The facilitation of the investment agenda is closely related to the need to improve monitoring and transparency of policies. The Coordinating Committee on Investment provides a forum to exchange information, and the decision to create a peer review mechanism will provide a monitoring of the implementation of the ACIA. ASEAN countries have started implementing the peer review mechanism since 2012.
1
Chapter 1: Trends and Patterns of Merchandise Trade
Key Findings A.
1. Intra-ASEAN elimination of tariff protection has been achieved completely for Singapore and Brunei. Indonesia, Malaysia, and to a lesser extent, the Philippines and Thailand have also eliminated tariffs since 2010 on almost all imports from other member states, except on agriculture sensitive goods and a few others not subject to liberalization under the ASEAN Trade in Goods Agreement (ATIGA). CLMV (Cambodia, Laos, Myanmar, and Viet Nam) countries have also made large and rapid progress, but Cambodia needs to accelerate its tariff reduction schedule of 93 percent of tariff lines with zero duty to meet the subgroup-specific ASEAN Economic Community (AEC) target by 2015. 2. Low and declining most favored nation (MFN) tariffs by ASEAN countries have contributed to low intra-ASEAN preference margins, which in turn help explain the low utilization rates of ATIGA preferences, especially in some member states. With already liberal and recently simplified rules of origin for intra-ASEAN trade, the only avenue for ASEAN to boost preference utilization rates might be targeted technical assistance and information campaigns to reach traders of those goods with still sizeable preference margins and in those countries with utilization rates around or below 20 percent. However, with further preference erosion to be expected as ASEAN Member States likely move further on MFN tariff and peak reduction, boosting the utilization rates of such shrinking preferences should not be a priority for ASEAN.
3. In contrast to tariff reform, there has been little progress by ASEAN Member States in the elimination of their non-tariff barriers (NTBs), despite it being an explicit AEC Blueprint goal. However, their wholesale elimination is not a realistic medium-term goal, even if limited to ‘core’ trade-restrictive measures, as even these might have been adopted to meet legitimate objectives such as public health or consumer protection. ASEAN needs instead to recognize the complexity and diversity of non-tariff measures (NTMs) and adopt a goal of streamlining rather than eliminating them. This entails reviewing cumbersome domestic regulations with a supply-chain approach and in consultation with private sector associations (of producers, downstream users, and final consumers) making them more targeted, simple, and effective, while minimizing any trade-restricting impact. At the same time, ASEAN should pressure both its members and its trading partners to roll back all new trade-restrictive measures introduced since the start of the global financial crisis and avoid introducing new or stricter NTMs, especially those affecting regional partners. Furthermore, in developing a new, fresh agenda for regulatory (including NTM) reform, ASEAN Member States should consider vesting more authority in the Secretariat—accompanied by adequate financial resources—to review national regulations, expand region-wide consultations with industry, and assess member compliance with any future regionally-agreed guidelines or directives.
4. Most of the ASEAN economies impose not only NTBs on imports, but also maintain high export restrictions, both in absolute terms and in comparison to other relevant regional groupings. Most member states require export licensing (except for the Philippines) or impose export taxes (except for Brunei, the Philippines, and Singapore) at least for some products, including on intra-ASEAN trade. ASEAN needs to pursue a program of drastic reduction of export restrictions, especially on intra-ASEAN trade, as part of its accelerated move towards regional economic integration under AEC.
2
5. Taken together, the trends over the last seven years for various indicators point to a high degree of intra-regional merchandise trade integration within ASEAN, which is increasing at a faster pace than its GDP, though not faster than its trade with the rest of the world. They also paint a picture of a recent resumption of the historical expansion of ASEAN trade with the rest of the world. This picture is consistent with the hypothesis of ASEAN being a force for trade creation rather than trade diversion.
6. In terms of export performance, Brunei, Cambodia, Lao PDR, and Myanmar all suffer from relatively low export diversification. However, Indonesia, and possibly Cambodia, are moving in the wrong direction toward more export concentration and should consider policies to reverse this trend.
AEC Blueprint Goals for Free Flow of Goods (Tariffs and Non-Tariff Measures) B.
7. In the AEC Blueprint, the ultimate goal for its first pillar is to transform ASEAN “into a single market and production base” through free movement of goods (covered in this and the next chapters), of services and investment (covered in Chapters 3 and 4), of skilled labor (to be covered in the forthcoming regional services trade study), and freer flow of capital. The rationale for removing all man-made barriers to flows of produced and tradable goods and services, including resources, is to achieve better economic allocation. 8. The goal of completely removing intra-regional tariffs is a worthy and straightforward endeavor that all free-trade areas and customs or economic unions have tackled or need to tackle. In fact, tariff removal is both a first and necessary step towards regional economic integration. The ASEAN Free Trade Area (AFTA) was established in 1992 with the signing of the Agreement on the Common Effective Preferential Tariff Scheme (CEPT), under which ASEAN Member States (AMS) began in1993 successive rounds of intra-ASEAN tariff reductions. The approach has consisted of an accelerated elimination of tariffs for products in the Inclusion List (IL), progressive shifting of products from the Sensitive List (SL) into the IL, and reduction of tariffs to a 0-5 percent range for products in the SL and in the Highly Sensitive List (HSL).
9. In 2003, a Protocol for the Elimination of Import Duties was adopted to push integration forward. Since then, most applied intra-ASEAN tariffs (excluding products in SL and HSL) were reduced to zero by 2010 for the older members (the ASEAN-6 group of Brunei, Indonesia, Malaysia, Philippines, Singapore, and Thailand). The new members (the CLMV group: Cambodia, Lao PDR, Myanmar, and Viet Nam) were offered flexibility on seven percent of their tariff lines and thus are expected to reach only by 2018 the same zero target as the older members.
10. At the 14th ASEAN Summit in February 2009, ASEAN leaders signed a new ATIGA. The aim was to integrate all existing ASEAN initiatives related to trade in goods into a comprehensive framework, by consolidating and streamlining all the provisions in CEPT-AFTA and relevant economic cooperation agreements. The agreement contains a number of key features to improve AFTA’s rules-based system and also to enhance transparency, certainty, and predictability within the broader ASEAN legal framework.
11. Besides subsuming and accelerating the previous tariff elimination commitments, ATIGA as well as the AEC Blueprint cover three other key sets of policy actions that are critical for promoting the free flow of goods and the broadening and deepening of regional economic
3
integration. These are: (i) the removal of non-tariff barriers (NTBs) and minimization of the trade-restricting effects of other non-tariff measures (NTMs), (ii) the strengthening of trade facilitation, and (iii) the harmonization of standards, conformity laws and technical regulations. They also address trade remedy measures and rules of origin.
12. This chapter focuses only on merchandise trade policy (in tariffs and non-tariff measures) and on ASEAN regional and global merchandise trade integration and performance, while the next chapter will address progress and challenges in trade facilitation.
Progress in Eliminating Intra-ASEAN Tariffs
13. ATIGA entered into force on May 17, 2010, marking a milestone in ASEAN merchandise trade liberalization and facilitation agendas through 2015 and beyond. As of June 2012, all AMS have issued the necessary legal enactment at the national level to implement commitments taken on the reduction or elimination of intra-ASEAN import duties under Article 19 of ATIGA as well as previous commitments under the CEPT scheme. 14. Tariffs for the ASEAN-6 countries have been eliminated since 2010 as scheduled under ATIGA. Tariffs that are not subject to be eliminated under ATIGA are those on few products contained in schedule D (agriculture sensitive goods whose tariffs can be maintained at 0-5 percent) and schedule H (goods not subject to liberalization in terms of tariffs and non-tariffs). With Singapore’s preferential tariff on all products already at zero percent since 1997, and Brunei Darussalam recently reducing them also to zero, the ASEAN-6 simple cross-country average CEPT tariff is about 0.05 percent, which compares well with other customs unions and free-trade areas like North American Free Trade Organization (NAFTA) (the latter at 0.03 percent). Even excluding Singapore, the average intra-ASEAN preferential tariff for ASEAN-5 (Brunei Darussalam, Indonesia, Malaysia, the Philippines, and Thailand) under the CEPT scheme has been gradually reduced from 4.1 in 2000 to almost zero (0.06) percent by 2012, as shown in Figure 1.1.
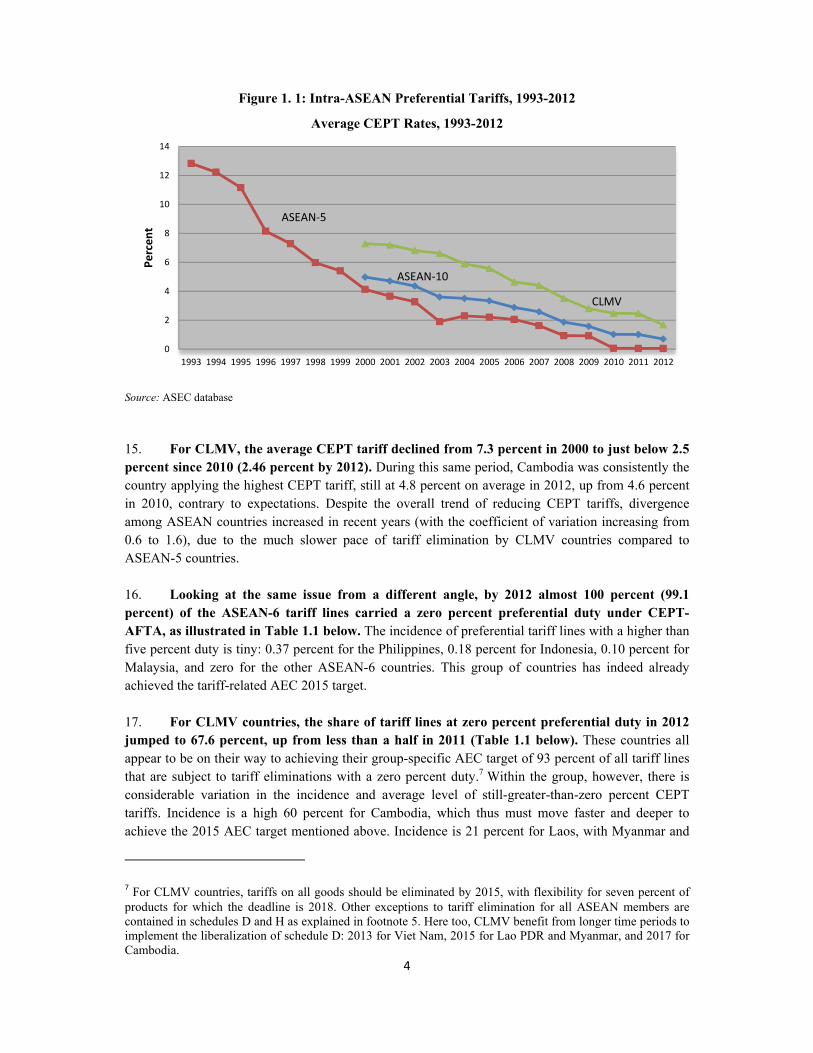
4
Figure 1. 1: Intra-ASEAN Preferential Tariffs, 1993-2012
Source: ASEC database
15. For CLMV, the average CEPT tariff declined from 7.3 percent in 2000 to just below 2.5 percent since 2010 (2.46 percent by 2012). During this same period, Cambodia was consistently the country applying the highest CEPT tariff, still at 4.8 percent on average in 2012, up from 4.6 percent in 2010, contrary to expectations. Despite the overall trend of reducing CEPT tariffs, divergence among ASEAN countries increased in recent years (with the coefficient of variation increasing from 0.6 to 1.6), due to the much slower pace of tariff elimination by CLMV countries compared to ASEAN-5 countries.
16. Looking at the same issue from a different angle, by 2012 almost 100 percent (99.1 percent) of the ASEAN-6 tariff lines carried a zero percent preferential duty under CEPT-AFTA, as illustrated in Table 1.1 below. The incidence of preferential tariff lines with a higher than five percent duty is tiny: 0.37 percent for the Philippines, 0.18 percent for Indonesia, 0.10 percent for Malaysia, and zero for the other ASEAN-6 countries. This group of countries has indeed already achieved the tariff-related AEC 2015 target.
17. For CLMV countries, the share of tariff lines at zero percent preferential duty in 2012 jumped to 67.6 percent, up from less than a half in 2011 (Table 1.1 below). These countries all appear to be on their way to achieving their group-specific AEC target of 93 percent of all tariff lines that are subject to tariff eliminations with a zero percent duty.7 Within the group, however, there is considerable variation in the incidence and average level of still-greater-than-zero percent CEPT tariffs. Incidence is a high 60 percent for Cambodia, which thus must move faster and deeper to achieve the 2015 AEC target mentioned above. Incidence is 21 percent for Laos, with Myanmar and
7 For CLMV countries, tariffs on all goods should be eliminated by 2015, with flexibility for seven percent of products for which the deadline is 2018. Other exceptions to tariff elimination for all ASEAN members are contained in schedules D and H as explained in footnote 5. Here too, CLMV benefit from longer time periods to implement the liberalization of schedule D: 2013 for Viet Nam, 2015 for Lao PDR and Myanmar, and 2017 for Cambodia.
ASEAN-10
ASEAN-5
CLMV
0
2
4
6
8
10
12
14
1993 1994 1995 1996 1997 1998 1999 2000 2001 2002 2003 2004 2005 2006 2007 2008 2009 2010 2011 2012
Perc
ent
Average CEPT Rates, 1993-2012
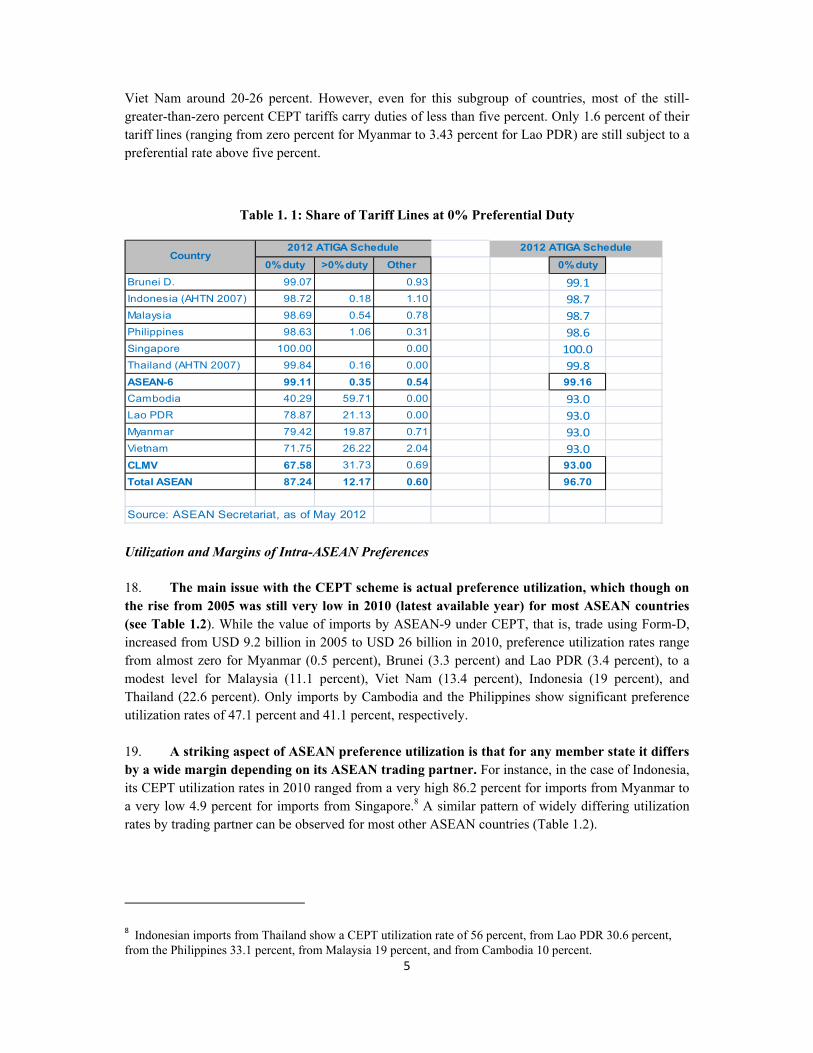
5
Viet Nam around 20-26 percent. However, even for this subgroup of countries, most of the still-greater-than-zero percent CEPT tariffs carry duties of less than five percent. Only 1.6 percent of their tariff lines (ranging from zero percent for Myanmar to 3.43 percent for Lao PDR) are still subject to a preferential rate above five percent.
Table 1. 1: Share of Tariff Lines at 0% Preferential Duty
Utilization and Margins of Intra-ASEAN Preferences
18. The main issue with the CEPT scheme is actual preference utilization, which though on the rise from 2005 was still very low in 2010 (latest available year) for most ASEAN countries (see Table 1.2). While the value of imports by ASEAN-9 under CEPT, that is, trade using Form-D, increased from USD 9.2 billion in 2005 to USD 26 billion in 2010, preference utilization rates range from almost zero for Myanmar (0.5 percent), Brunei (3.3 percent) and Lao PDR (3.4 percent), to a modest level for Malaysia (11.1 percent), Viet Nam (13.4 percent), Indonesia (19 percent), and Thailand (22.6 percent). Only imports by Cambodia and the Philippines show significant preference utilization rates of 47.1 percent and 41.1 percent, respectively. 19. A striking aspect of ASEAN preference utilization is that for any member state it differs by a wide margin depending on its ASEAN trading partner. For instance, in the case of Indonesia, its CEPT utilization rates in 2010 ranged from a very high 86.2 percent for imports from Myanmar to a very low 4.9 percent for imports from Singapore.8 A similar pattern of widely differing utilization rates by trading partner can be observed for most other ASEAN countries (Table 1.2).
8 Indonesian imports from Thailand show a CEPT utilization rate of 56 percent, from Lao PDR 30.6 percent, from the Philippines 33.1 percent, from Malaysia 19 percent, and from Cambodia 10 percent.
0% duty >0% duty Other 0% duty
Brunei D. 99.07 0.93 99.1Indonesia (AHTN 2007) 98.72 0.18 1.10 98.7Malaysia 98.69 0.54 0.78 98.7Philippines 98.63 1.06 0.31 98.6Singapore 100.00 0.00 100.0Thailand (AHTN 2007) 99.84 0.16 0.00 99.8ASEAN-6 99.11 0.35 0.54 99.16
Cambodia 40.29 59.71 0.00 93.0Lao PDR 78.87 21.13 0.00 93.0Myanmar 79.42 19.87 0.71 93.0Vietnam 71.75 26.22 2.04 93.0CLMV 67.58 31.73 0.69 93.00
Total ASEAN 87.24 12.17 0.60 96.70
Source: ASEAN Secretariat, as of May 2012
2012 ATIGA Schedule2012 ATIGA ScheduleCountry
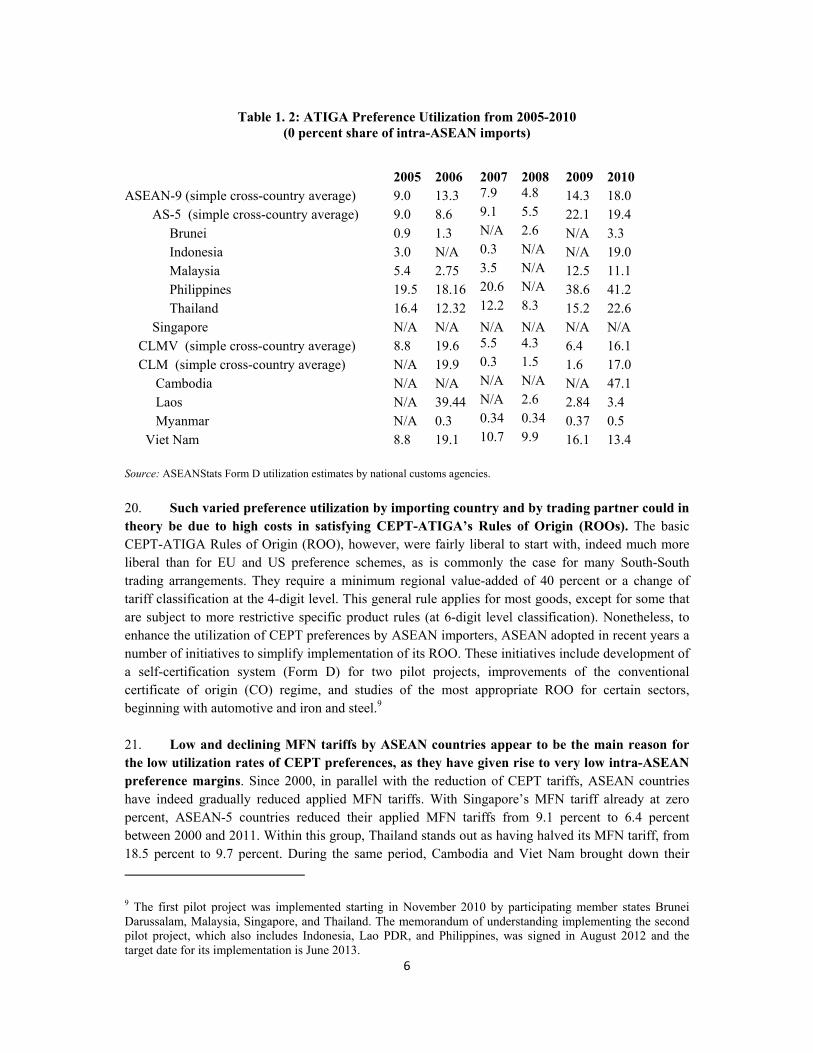
6
Table 1. 2: ATIGA Preference Utilization from 2005-2010
(0 percent share of intra-ASEAN imports)
2005 2006
2007
2008 2009 2010
ASEAN-9 (simple cross-country average) 9.0 13.3 7.9 4.8 14.3 18.0 AS-5 (simple cross-country average) 9.0 8.6 9.1 5.5 22.1 19.4 Brunei 0.9 1.3 N/A 2.6 N/A 3.3 Indonesia 3.0 N/A 0.3 N/A N/A 19.0 Malaysia 5.4 2.75 3.5 N/A 12.5 11.1 Philippines 19.5 18.16 20.6 N/A 38.6 41.2 Thailand 16.4 12.32 12.2 8.3 15.2 22.6 Singapore N/A N/A N/A N/A N/A N/A CLMV (simple cross-country average) 8.8 19.6 5.5 4.3 6.4 16.1 CLM (simple cross-country average) N/A 19.9 0.3 1.5 1.6 17.0 Cambodia N/A N/A N/A N/A N/A 47.1 Laos N/A 39.44 N/A 2.6 2.84 3.4 Myanmar N/A 0.3 0.34 0.34 0.37 0.5 Viet Nam 8.8 19.1 10.7 9.9 16.1 13.4 Source: ASEANStats Form D utilization estimates by national customs agencies.
20. Such varied preference utilization by importing country and by trading partner could in theory be due to high costs in satisfying CEPT-ATIGA’s Rules of Origin (ROOs). The basic CEPT-ATIGA Rules of Origin (ROO), however, were fairly liberal to start with, indeed much more liberal than for EU and US preference schemes, as is commonly the case for many South-South trading arrangements. They require a minimum regional value-added of 40 percent or a change of tariff classification at the 4-digit level. This general rule applies for most goods, except for some that are subject to more restrictive specific product rules (at 6-digit level classification). Nonetheless, to enhance the utilization of CEPT preferences by ASEAN importers, ASEAN adopted in recent years a number of initiatives to simplify implementation of its ROO. These initiatives include development of a self-certification system (Form D) for two pilot projects, improvements of the conventional certificate of origin (CO) regime, and studies of the most appropriate ROO for certain sectors, beginning with automotive and iron and steel.9 21. Low and declining MFN tariffs by ASEAN countries appear to be the main reason for the low utilization rates of CEPT preferences, as they have given rise to very low intra-ASEAN preference margins. Since 2000, in parallel with the reduction of CEPT tariffs, ASEAN countries have indeed gradually reduced applied MFN tariffs. With Singapore’s MFN tariff already at zero percent, ASEAN-5 countries reduced their applied MFN tariffs from 9.1 percent to 6.4 percent between 2000 and 2011. Within this group, Thailand stands out as having halved its MFN tariff, from 18.5 percent to 9.7 percent. During the same period, Cambodia and Viet Nam brought down their
9 The first pilot project was implemented starting in November 2010 by participating member states Brunei Darussalam, Malaysia, Singapore, and Thailand. The memorandum of understanding implementing the second pilot project, which also includes Indonesia, Lao PDR, and Philippines, was signed in August 2012 and the target date for its implementation is June 2013.
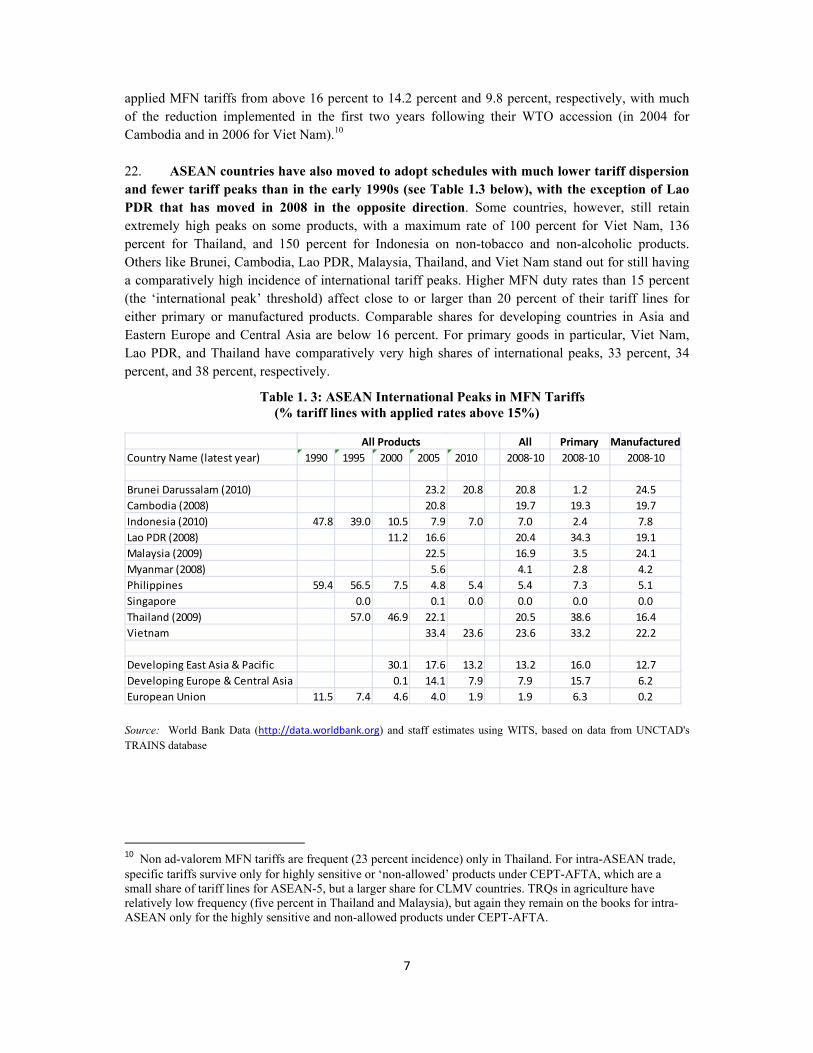
7
applied MFN tariffs from above 16 percent to 14.2 percent and 9.8 percent, respectively, with much of the reduction implemented in the first two years following their WTO accession (in 2004 for Cambodia and in 2006 for Viet Nam).10 22. ASEAN countries have also moved to adopt schedules with much lower tariff dispersion and fewer tariff peaks than in the early 1990s (see Table 1.3 below), with the exception of Lao PDR that has moved in 2008 in the opposite direction. Some countries, however, still retain extremely high peaks on some products, with a maximum rate of 100 percent for Viet Nam, 136 percent for Thailand, and 150 percent for Indonesia on non-tobacco and non-alcoholic products. Others like Brunei, Cambodia, Lao PDR, Malaysia, Thailand, and Viet Nam stand out for still having a comparatively high incidence of international tariff peaks. Higher MFN duty rates than 15 percent (the ‘international peak’ threshold) affect close to or larger than 20 percent of their tariff lines for either primary or manufactured products. Comparable shares for developing countries in Asia and Eastern Europe and Central Asia are below 16 percent. For primary goods in particular, Viet Nam, Lao PDR, and Thailand have comparatively very high shares of international peaks, 33 percent, 34 percent, and 38 percent, respectively.
Table 1. 3: ASEAN International Peaks in MFN Tariffs (% tariff lines with applied rates above 15%)
Source: World Bank Data (http://data.worldbank.org) and staff estimates using WITS, based on data from UNCTAD's TRAINS database
10 Non ad-valorem MFN tariffs are frequent (23 percent incidence) only in Thailand. For intra-ASEAN trade, specific tariffs survive only for highly sensitive or ‘non-allowed’ products under CEPT-AFTA, which are a small share of tariff lines for ASEAN-5, but a larger share for CLMV countries. TRQs in agriculture have relatively low frequency (five percent in Thailand and Malaysia), but again they remain on the books for intra-ASEAN only for the highly sensitive and non-allowed products under CEPT-AFTA.
All Primary ManufacturedCountry Name (latest year) 1990 1995 2000 2005 2010 2008-10 2008-10 2008-10
Brunei Darussalam (2010) 23.2 20.8 20.8 1.2 24.5Cambodia (2008) 20.8 19.7 19.3 19.7Indonesia (2010) 47.8 39.0 10.5 7.9 7.0 7.0 2.4 7.8Lao PDR (2008) 11.2 16.6 20.4 34.3 19.1Malaysia (2009) 22.5 16.9 3.5 24.1Myanmar (2008) 5.6 4.1 2.8 4.2Philippines 59.4 56.5 7.5 4.8 5.4 5.4 7.3 5.1Singapore 0.0 0.1 0.0 0.0 0.0 0.0Thailand (2009) 57.0 46.9 22.1 20.5 38.6 16.4Vietnam 33.4 23.6 23.6 33.2 22.2
Developing East Asia & Pacific 30.1 17.6 13.2 13.2 16.0 12.7Developing Europe & Central Asia 0.1 14.1 7.9 7.9 15.7 6.2European Union 11.5 7.4 4.6 4.0 1.9 1.9 6.3 0.2
All Products
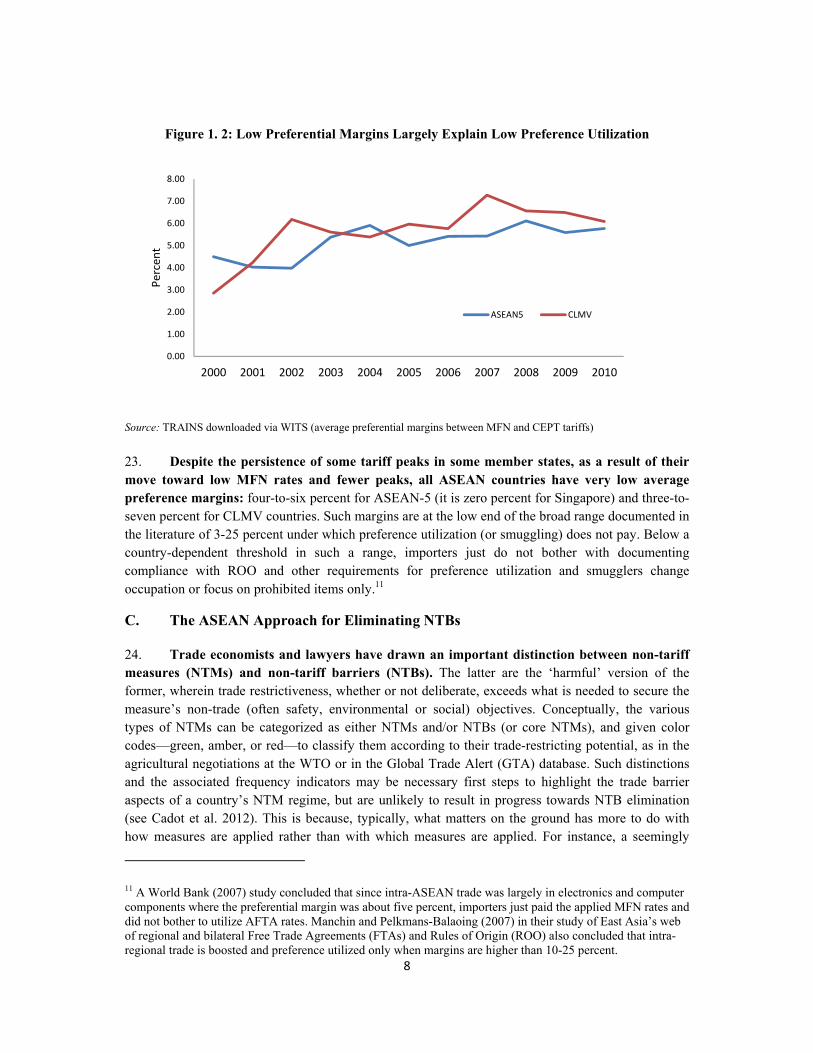
8
Figure 1. 2: Low Preferential Margins Largely Explain Low Preference Utilization
Source: TRAINS downloaded via WITS (average preferential margins between MFN and CEPT tariffs)
23. Despite the persistence of some tariff peaks in some member states, as a result of their move toward low MFN rates and fewer peaks, all ASEAN countries have very low average preference margins: four-to-six percent for ASEAN-5 (it is zero percent for Singapore) and three-to-seven percent for CLMV countries. Such margins are at the low end of the broad range documented in the literature of 3-25 percent under which preference utilization (or smuggling) does not pay. Below a country-dependent threshold in such a range, importers just do not bother with documenting compliance with ROO and other requirements for preference utilization and smugglers change occupation or focus on prohibited items only.11
The ASEAN Approach for Eliminating NTBs C.
24. Trade economists and lawyers have drawn an important distinction between non-tariff measures (NTMs) and non-tariff barriers (NTBs). The latter are the ‘harmful’ version of the former, wherein trade restrictiveness, whether or not deliberate, exceeds what is needed to secure the measure’s non-trade (often safety, environmental or social) objectives. Conceptually, the various types of NTMs can be categorized as either NTMs and/or NTBs (or core NTMs), and given color codes—green, amber, or red—to classify them according to their trade-restricting potential, as in the agricultural negotiations at the WTO or in the Global Trade Alert (GTA) database. Such distinctions and the associated frequency indicators may be necessary first steps to highlight the trade barrier aspects of a country’s NTM regime, but are unlikely to result in progress towards NTB elimination (see Cadot et al. 2012). This is because, typically, what matters on the ground has more to do with how measures are applied rather than with which measures are applied. For instance, a seemingly
11 A World Bank (2007) study concluded that since intra-ASEAN trade was largely in electronics and computer components where the preferential margin was about five percent, importers just paid the applied MFN rates and did not bother to utilize AFTA rates. Manchin and Pelkmans-Balaoing (2007) in their study of East Asia’s web of regional and bilateral Free Trade Agreements (FTAs) and Rules of Origin (ROO) also concluded that intra-regional trade is boosted and preference utilized only when margins are higher than 10-25 percent.
0.00
1.00
2.00
3.00
4.00
5.00
6.00
7.00
8.00
2000 2001 2002 2003 2004 2005 2006 2007 2008 2009 2010
Perc
ent
ASEAN5 CLMV
9
innocuous technical standard may create unnecessary trade-restricting problems if it implemented by certifying foreign production facilities. Also, a mild sanitary or phytosanitary (SPS) measure may be highly trade-inhibiting if it requires every shipment to be inspected rather than using risk profiling, thus minimizing the number of physical inspections. In other words, the devil is in the details. 25. Nonetheless, the AEC Blueprint identified NTBs as the main protection instrument currently used by many ASEAN Member States against imports from the rest of ASEAN to “impede the free flow of goods in the region,” and mandated their full elimination. ASEAN was expected to take the following priority actions to achieve the above stated goal:
i. Enhance transparency by abiding to the Protocol on Notification Procedure and set up an effective Surveillance Mechanism.
ii. Abide by the commitment of a standstill and roll-back on NTBs.
iii. Remove all NTBs by 2010 for ASEAN-5, by 2012 for the Philippines, and by 2015 with
flexibilities to 2018 for CLMV, in accordance with the agreed Work Program on NTB elimination.
iv. Enhance transparency of NTMs.
v. Where possible, work towards having regional rules and regulations consistent with
international best practices.
26. In the mid-1990s, ASEAN included in its list of NTBs, customs surcharges, technical measures, product characteristic requirements, and monopolistic measures. Following the UNCTAD classification of that period, it eventually also added quantitative controls to its list.12 ASEAN’s NTBs reform modalities included eliminating import surcharges, mutually recognizing or harmonizing product standards, adopting pro-competition and market access measures to address monopolistic behavior, and more recently (under the AEC Blueprint) also the elimination of quantitative restrictions. The largely ineffective implementation approach throughout the 2000s was through voluntary offers by member states. 27. The current implementation approach appears to be more of the same. It relies on a list of NTMs (inclusive of NTBs, its trade-restricting subset) submitted by each country, but not to be verified or challenged by any other member country or by the ASEAN Secretariat staff.13 Each member state is expected to prioritize and develop a work program to eliminate its NTBs. The only new and promising elements are that ASEAN has also initiated consultations with industry associations, starting in three priority sectors, that is, automotive, electronics and textiles, to determine which NTMs significantly affect the cost of doing business and of trading regionally and to explore
12 Different organizations and researchers have slightly different concepts of what to include among core NTBs, since many measures have also legitimate social goals and may not have been adopted primarily in order to restrict trade. Kee, Nicita and Olarreaga (2008, 2009), for instance, treat as core NTBs only the following categories: price control measures (TRAINS codes 6100, 6200 and 6300), which are not captured in the ASEC database; quantity restrictions (TRAINS codes 3100, 3200 and 3300); monopolistic measures (TRAINS code 7000); and technical regulations (TRAINS code 8100). See http://www.worldbank.org/trade/otri . 13 ASEAN Non-Tariff Measure Database, available at http://www.aseansec.org/16355.htm, with 2009-2011 country submissions (Lao PDR was the last country completing its submission in 2011).

10
feasible ways to reduce their trade-restricting effect. Additionally, ASEAN has agreed to develop a set of guidelines for import licensing procedures (ILP), prohibitions, and quantitative restriction with a view to eliminating the NTB components of these measures. 28. So far, however, there has been little real progress in the elimination by ASEAN Member States of their NTBs, in contrast to the tariff reform agenda. Only Malaysia and Thailand have offered a few NTBs for elimination and ASEAN has succeeded only in adopting a mutual recognition agreement (MRA) on cosmetics, largely resulting from a strong push by industry leaders. Moreover, as illustrated in the next three sections of this chapter, ASEAN has neither been able to stem the tide of foreign trade partners, nor has it been able to prevent some ASEAN governments from imposing harmful trade measures affecting ASEAN Member States (as well as the rest of the world). Unless ASEAN Member States stick to the current and still largely voluntary approach to NTM reform at the national level, it is difficult to be optimistic about progress in this area.
29. In reviewing the challenges and proposing a reform agenda of NTMs worldwide, it will be important to avoid using an inappropriate, overly broad definition of NTMs. It is now clear that by focusing solely or principally on the trade-restricting impact of NTMs, and not recognizing their other, often legitimate, policy objectives, has contributed to slow progress in policy dialog and negotiations at both multilateral and regional levels (Cadot, et. al 2012). Such disappointing results are particularly striking at the regional level, where NTM elimination and harmonization have been high on the agenda of regional secretariats for years but haven’t seen much action on the ground. Escaping from the current impasse requires recognizing the complexity and diversity of NTMs and adopting a goal of streamlining rather than eliminating them. Their proposed toolkit for doing so is described in Box 1.1.
30. A complementary approach recently proposed in a flagship World Economic Forum (WEF) report prepared in collaboration with Bain & Company and the World Bank stresses reviewing all NTBs, trade facilitation, services, and investment regulations from a supply-chain perspective. This approach envisages close consultations with industry associations to include producers and downstream users (WEF 2013).14 Furthermore, in developing a new, fresh agenda for regulatory (and NTM) reform, ASEAN should adopt a coherent approach across member states and across ministries. It should also consider vesting a greater role for the Secretariat—accompanied by adequate financial resources—for reviewing national regulations, expanding region-wide consultations with industry, and assessing member compliance with any future regionally-agreed guidelines or directives. This report also endorses the following concrete proposals by Cambodia, ASEAN’s 2012 Chair, for a new NTM reform agenda:
14 One of the key recommendations proposed in the report is to “create a focal point within government with a mandate to coordinate and oversee all regulation that directly affects supply chain efficiency. Given the importance of tipping points, governments need to design policy with an economy-wide vision and the recognition that different clusters of policies affect industry-specific supply chains. Improving supply chain performance requires coherence and coordination across many government agencies and collaboration with industry. Governments should create a high-level body to oversee all regulation directly affecting the supply chain.” World Economic Forum (2013), Enabling Trade: Valuing Growth Opportunities, Geneva, available at http://www3.weforum.org/docs/WEF_SCT_EnablingTrade_Report_2013.pdf
11
i. Improve the classification of NTMs according to the UNCTAD guidelines adopted in
February 2012.
ii. Update and verify country lists in an open process driven by the ASEAN Secretariat, rather than on a voluntary basis by individual member states.
iii. Eliminate, with only few exceptions, all quantity control measures comprising non-automatic
licensing, import and export quotas and prohibitions, and all foreign exchange at least for intra-ASEAN trade (though it may not be possible or practical to police such limitations).15
iv. Identify the other most egregious trade-restrictive measures with help not only from the
private sector (as foreseen in article 42 of ATIGA), but also with sectoral, supply-chain-based regulatory impact assessments to be launched urgently.
v. Decide in ASEAN bodies on the regulatory modifications at the national level, as well as
regional harmonization actions necessary to eliminate or minimize the trade-restrictive impact of the measures identified as per point.
vi. Plan an in-depth regional study of NTMs, possibly under Phase II of the AEC Monitoring and
Evaluation Capacity Building Program (AECMEP) collaborative project between the ASEAN Secretariat and the World Bank.
15 Myanmar, the only ASEAN Member State with foreign exchange controls, should also eliminate such restrictions. It is indeed expected to do so in the very near future, as foreign trade and financial sanctions are being lifted. The Central Bank of Myanmar (CBM) introduced an exchange rate system in the form of the official peg with a managed float unifying the exchange rates with assistance from the International Monetary Fund. Accordingly, the CBM began a managed float system on April 1, 2012, dismantling the existing multiple exchange rate system. A new currency regime was commenced on April 2, 2012, by setting a daily reference exchange rate of Myanmar Kyat to the dollar by the CBM in line with its value on the market rate as announced at www.cbm.gov.mn
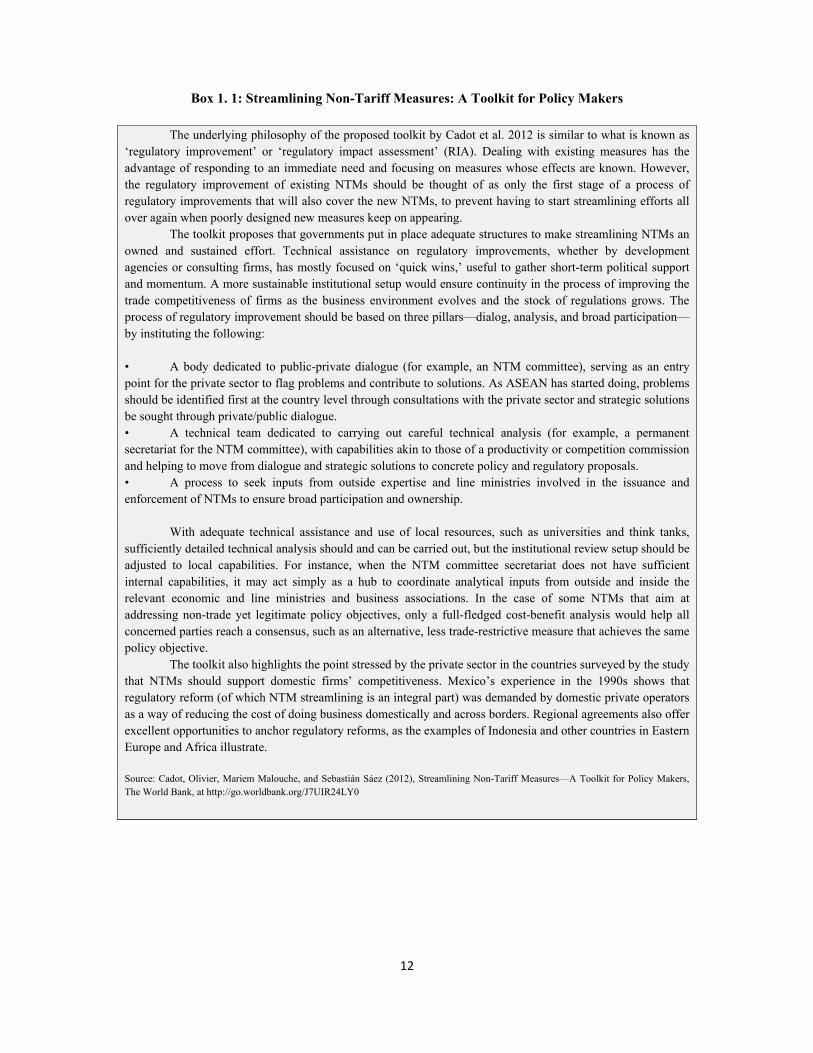
12
Box 1. 1: Streamlining Non-Tariff Measures: A Toolkit for Policy Makers
The underlying philosophy of the proposed toolkit by Cadot et al. 2012 is similar to what is known as ‘regulatory improvement’ or ‘regulatory impact assessment’ (RIA). Dealing with existing measures has the advantage of responding to an immediate need and focusing on measures whose effects are known. However, the regulatory improvement of existing NTMs should be thought of as only the first stage of a process of regulatory improvements that will also cover the new NTMs, to prevent having to start streamlining efforts all over again when poorly designed new measures keep on appearing.
The toolkit proposes that governments put in place adequate structures to make streamlining NTMs an owned and sustained effort. Technical assistance on regulatory improvements, whether by development agencies or consulting firms, has mostly focused on ‘quick wins,’ useful to gather short-term political support and momentum. A more sustainable institutional setup would ensure continuity in the process of improving the trade competitiveness of firms as the business environment evolves and the stock of regulations grows. The process of regulatory improvement should be based on three pillars—dialog, analysis, and broad participation—by instituting the following:
• A body dedicated to public-private dialogue (for example, an NTM committee), serving as an entry point for the private sector to flag problems and contribute to solutions. As ASEAN has started doing, problems should be identified first at the country level through consultations with the private sector and strategic solutions be sought through private/public dialogue. • A technical team dedicated to carrying out careful technical analysis (for example, a permanent secretariat for the NTM committee), with capabilities akin to those of a productivity or competition commission and helping to move from dialogue and strategic solutions to concrete policy and regulatory proposals. • A process to seek inputs from outside expertise and line ministries involved in the issuance and enforcement of NTMs to ensure broad participation and ownership.
With adequate technical assistance and use of local resources, such as universities and think tanks,
sufficiently detailed technical analysis should and can be carried out, but the institutional review setup should be adjusted to local capabilities. For instance, when the NTM committee secretariat does not have sufficient internal capabilities, it may act simply as a hub to coordinate analytical inputs from outside and inside the relevant economic and line ministries and business associations. In the case of some NTMs that aim at addressing non-trade yet legitimate policy objectives, only a full-fledged cost-benefit analysis would help all concerned parties reach a consensus, such as an alternative, less trade-restrictive measure that achieves the same policy objective.
The toolkit also highlights the point stressed by the private sector in the countries surveyed by the study that NTMs should support domestic firms’ competitiveness. Mexico’s experience in the 1990s shows that regulatory reform (of which NTM streamlining is an integral part) was demanded by domestic private operators as a way of reducing the cost of doing business domestically and across borders. Regional agreements also offer excellent opportunities to anchor regulatory reforms, as the examples of Indonesia and other countries in Eastern Europe and Africa illustrate.
Source: Cadot, Olivier, Mariem Malouche, and Sebastián Sáez (2012), Streamlining Non-Tariff Measures—A Toolkit for Policy Makers, The World Bank, at http://go.worldbank.org/J7UIR24LY0
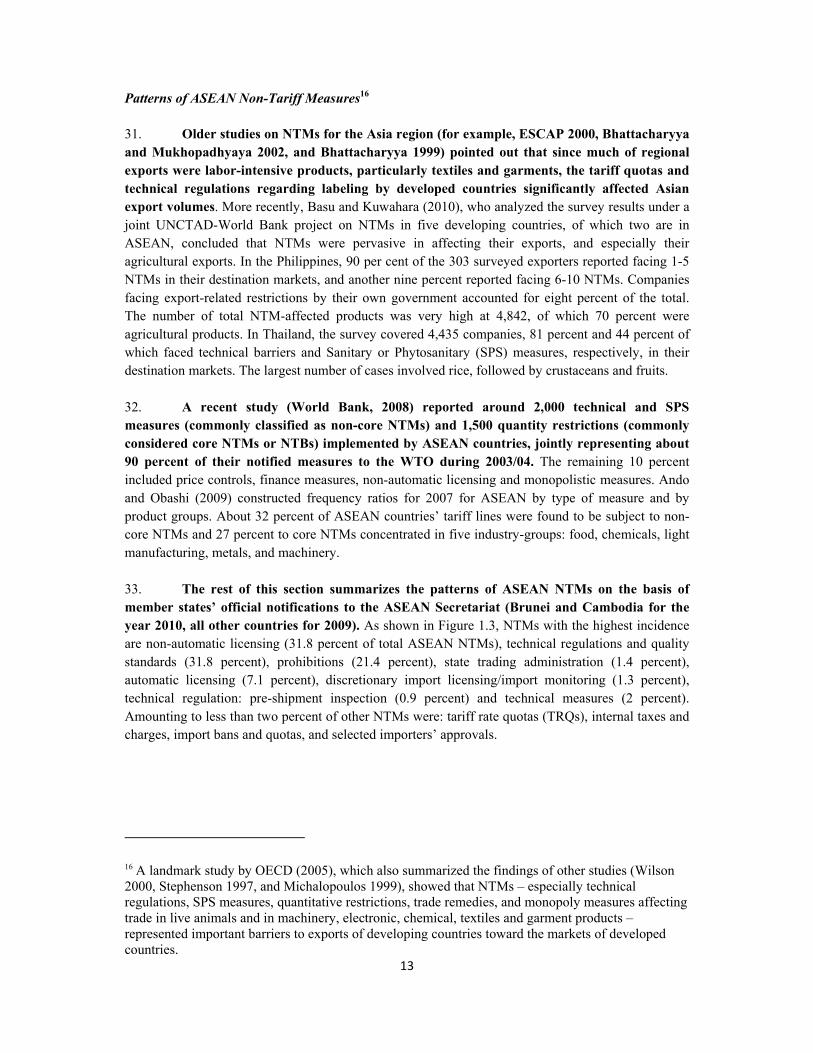
13
Patterns of ASEAN Non-Tariff Measures16
31. Older studies on NTMs for the Asia region (for example, ESCAP 2000, Bhattacharyya and Mukhopadhyaya 2002, and Bhattacharyya 1999) pointed out that since much of regional exports were labor-intensive products, particularly textiles and garments, the tariff quotas and technical regulations regarding labeling by developed countries significantly affected Asian export volumes. More recently, Basu and Kuwahara (2010), who analyzed the survey results under a joint UNCTAD-World Bank project on NTMs in five developing countries, of which two are in ASEAN, concluded that NTMs were pervasive in affecting their exports, and especially their agricultural exports. In the Philippines, 90 per cent of the 303 surveyed exporters reported facing 1-5 NTMs in their destination markets, and another nine percent reported facing 6-10 NTMs. Companies facing export-related restrictions by their own government accounted for eight percent of the total. The number of total NTM-affected products was very high at 4,842, of which 70 percent were agricultural products. In Thailand, the survey covered 4,435 companies, 81 percent and 44 percent of which faced technical barriers and Sanitary or Phytosanitary (SPS) measures, respectively, in their destination markets. The largest number of cases involved rice, followed by crustaceans and fruits. 32. A recent study (World Bank, 2008) reported around 2,000 technical and SPS measures (commonly classified as non-core NTMs) and 1,500 quantity restrictions (commonly considered core NTMs or NTBs) implemented by ASEAN countries, jointly representing about 90 percent of their notified measures to the WTO during 2003/04. The remaining 10 percent included price controls, finance measures, non-automatic licensing and monopolistic measures. Ando and Obashi (2009) constructed frequency ratios for 2007 for ASEAN by type of measure and by product groups. About 32 percent of ASEAN countries’ tariff lines were found to be subject to non-core NTMs and 27 percent to core NTMs concentrated in five industry-groups: food, chemicals, light manufacturing, metals, and machinery.
33. The rest of this section summarizes the patterns of ASEAN NTMs on the basis of member states’ official notifications to the ASEAN Secretariat (Brunei and Cambodia for the year 2010, all other countries for 2009). As shown in Figure 1.3, NTMs with the highest incidence are non-automatic licensing (31.8 percent of total ASEAN NTMs), technical regulations and quality standards (31.8 percent), prohibitions (21.4 percent), state trading administration (1.4 percent), automatic licensing (7.1 percent), discretionary import licensing/import monitoring (1.3 percent), technical regulation: pre-shipment inspection (0.9 percent) and technical measures (2 percent). Amounting to less than two percent of other NTMs were: tariff rate quotas (TRQs), internal taxes and charges, import bans and quotas, and selected importers’ approvals.
16 A landmark study by OECD (2005), which also summarized the findings of other studies (Wilson 2000, Stephenson 1997, and Michalopoulos 1999), showed that NTMs – especially technical regulations, SPS measures, quantitative restrictions, trade remedies, and monopoly measures affecting trade in live animals and in machinery, electronic, chemical, textiles and garment products – represented important barriers to exports of developing countries toward the markets of developed countries.
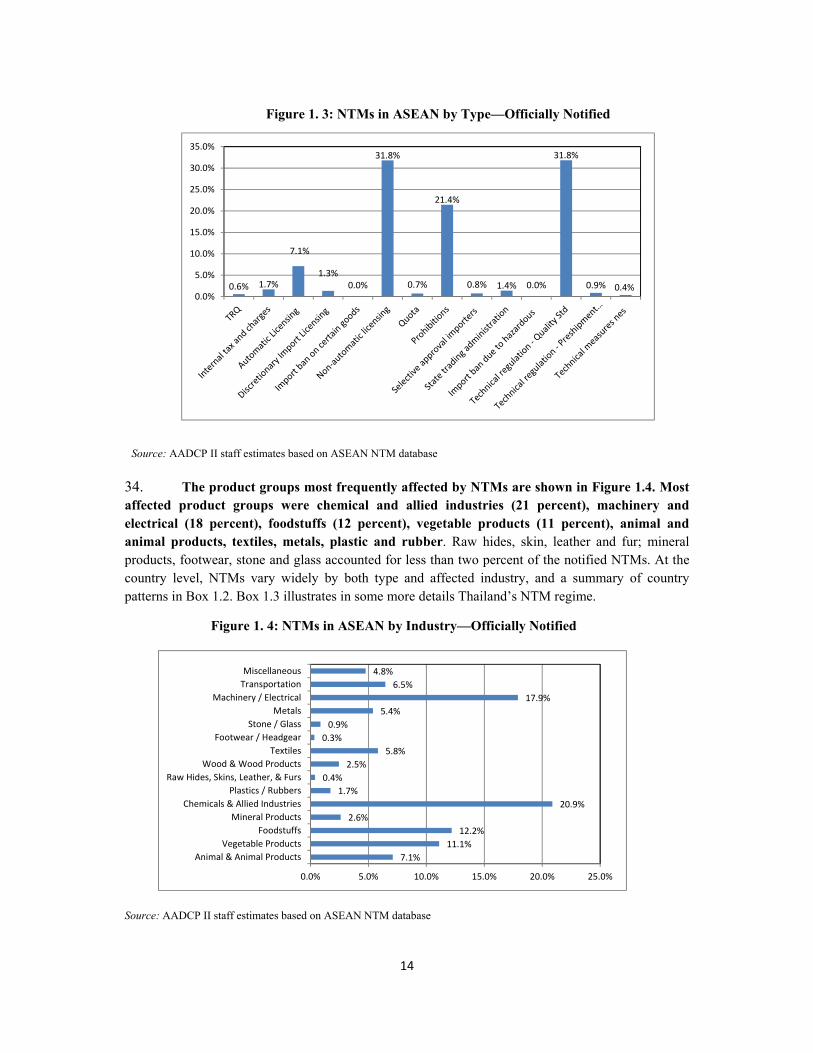
14
Figure 1. 3: NTMs in ASEAN by Type—Officially Notified
Source: AADCP II staff estimates based on ASEAN NTM database
34. The product groups most frequently affected by NTMs are shown in Figure 1.4. Most affected product groups were chemical and allied industries (21 percent), machinery and electrical (18 percent), foodstuffs (12 percent), vegetable products (11 percent), animal and animal products, textiles, metals, plastic and rubber. Raw hides, skin, leather and fur; mineral products, footwear, stone and glass accounted for less than two percent of the notified NTMs. At the country level, NTMs vary widely by both type and affected industry, and a summary of country patterns in Box 1.2. Box 1.3 illustrates in some more details Thailand’s NTM regime.
Figure 1. 4: NTMs in ASEAN by Industry—Officially Notified
Source: AADCP II staff estimates based on ASEAN NTM database
7.1%11.1%
12.2%2.6%
20.9%1.7%
0.4%2.5%
5.8%0.3%
0.9%5.4%
17.9%6.5%
4.8%
0.0% 5.0% 10.0% 15.0% 20.0% 25.0%
Animal & Animal ProductsVegetable Products
FoodstuffsMineral Products
Chemicals & Allied IndustriesPlastics / Rubbers
Raw Hides, Skins, Leather, & FursWood & Wood Products
TextilesFootwear / Headgear
Stone / GlassMetals
Machinery / ElectricalTransportationMiscellaneous
0.6% 1.7%
7.1%
1.3%0.0%
31.8%
0.7%
21.4%
0.8% 1.4% 0.0%
31.8%
0.9% 0.4%0.0%
5.0%
10.0%
15.0%
20.0%
25.0%
30.0%
35.0%
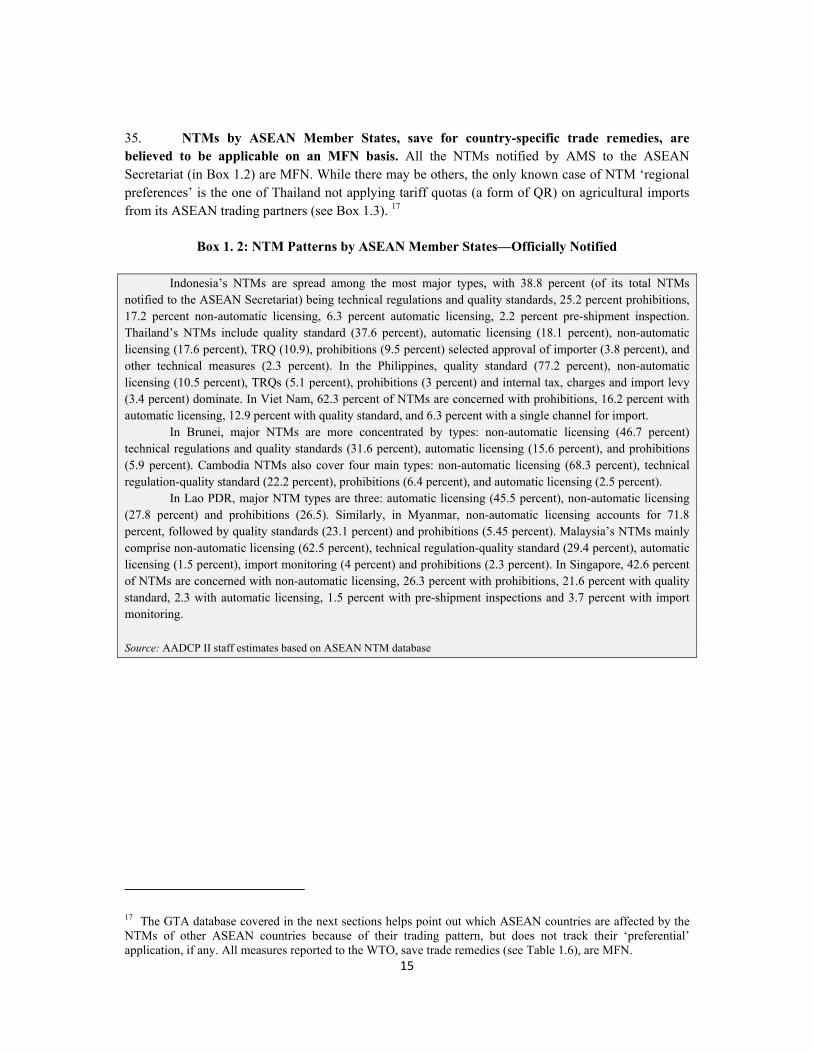
15
35. NTMs by ASEAN Member States, save for country-specific trade remedies, are believed to be applicable on an MFN basis. All the NTMs notified by AMS to the ASEAN Secretariat (in Box 1.2) are MFN. While there may be others, the only known case of NTM ‘regional preferences’ is the one of Thailand not applying tariff quotas (a form of QR) on agricultural imports from its ASEAN trading partners (see Box 1.3). 17
Box 1. 2: NTM Patterns by ASEAN Member States—Officially Notified
Indonesia’s NTMs are spread among the most major types, with 38.8 percent (of its total NTMs notified to the ASEAN Secretariat) being technical regulations and quality standards, 25.2 percent prohibitions, 17.2 percent non-automatic licensing, 6.3 percent automatic licensing, 2.2 percent pre-shipment inspection. Thailand’s NTMs include quality standard (37.6 percent), automatic licensing (18.1 percent), non-automatic licensing (17.6 percent), TRQ (10.9), prohibitions (9.5 percent) selected approval of importer (3.8 percent), and other technical measures (2.3 percent). In the Philippines, quality standard (77.2 percent), non-automatic licensing (10.5 percent), TRQs (5.1 percent), prohibitions (3 percent) and internal tax, charges and import levy (3.4 percent) dominate. In Viet Nam, 62.3 percent of NTMs are concerned with prohibitions, 16.2 percent with automatic licensing, 12.9 percent with quality standard, and 6.3 percent with a single channel for import.
In Brunei, major NTMs are more concentrated by types: non-automatic licensing (46.7 percent) technical regulations and quality standards (31.6 percent), automatic licensing (15.6 percent), and prohibitions (5.9 percent). Cambodia NTMs also cover four main types: non-automatic licensing (68.3 percent), technical regulation-quality standard (22.2 percent), prohibitions (6.4 percent), and automatic licensing (2.5 percent).
In Lao PDR, major NTM types are three: automatic licensing (45.5 percent), non-automatic licensing (27.8 percent) and prohibitions (26.5). Similarly, in Myanmar, non-automatic licensing accounts for 71.8 percent, followed by quality standards (23.1 percent) and prohibitions (5.45 percent). Malaysia’s NTMs mainly comprise non-automatic licensing (62.5 percent), technical regulation-quality standard (29.4 percent), automatic licensing (1.5 percent), import monitoring (4 percent) and prohibitions (2.3 percent). In Singapore, 42.6 percent of NTMs are concerned with non-automatic licensing, 26.3 percent with prohibitions, 21.6 percent with quality standard, 2.3 with automatic licensing, 1.5 percent with pre-shipment inspections and 3.7 percent with import monitoring.
Source: AADCP II staff estimates based on ASEAN NTM database
17 The GTA database covered in the next sections helps point out which ASEAN countries are affected by the NTMs of other ASEAN countries because of their trading pattern, but does not track their ‘preferential’ application, if any. All measures reported to the WTO, save trade remedies (see Table 1.6), are MFN.
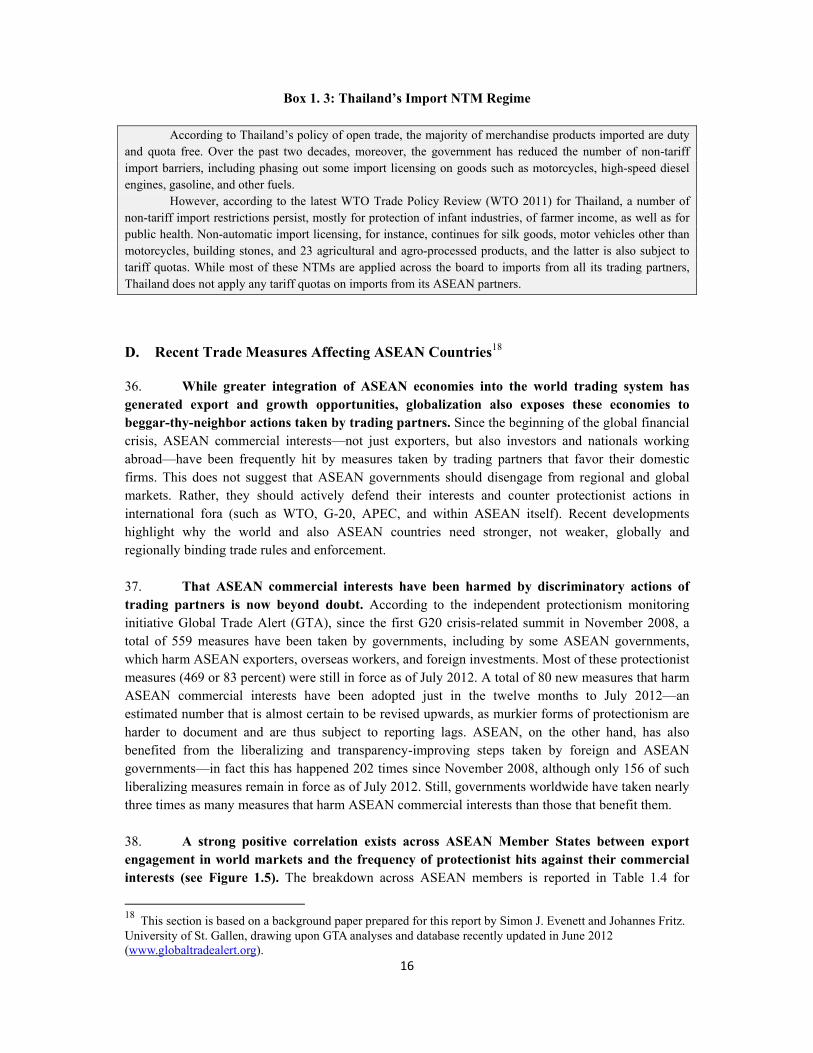
16
Box 1. 3: Thailand’s Import NTM Regime
According to Thailand’s policy of open trade, the majority of merchandise products imported are duty and quota free. Over the past two decades, moreover, the government has reduced the number of non-tariff import barriers, including phasing out some import licensing on goods such as motorcycles, high-speed diesel engines, gasoline, and other fuels.
However, according to the latest WTO Trade Policy Review (WTO 2011) for Thailand, a number of non-tariff import restrictions persist, mostly for protection of infant industries, of farmer income, as well as for public health. Non-automatic import licensing, for instance, continues for silk goods, motor vehicles other than motorcycles, building stones, and 23 agricultural and agro-processed products, and the latter is also subject to tariff quotas. While most of these NTMs are applied across the board to imports from all its trading partners, Thailand does not apply any tariff quotas on imports from its ASEAN partners.
Recent Trade Measures Affecting ASEAN Countries18 D.
36. While greater integration of ASEAN economies into the world trading system has generated export and growth opportunities, globalization also exposes these economies to beggar-thy-neighbor actions taken by trading partners. Since the beginning of the global financial crisis, ASEAN commercial interests—not just exporters, but also investors and nationals working abroad—have been frequently hit by measures taken by trading partners that favor their domestic firms. This does not suggest that ASEAN governments should disengage from regional and global markets. Rather, they should actively defend their interests and counter protectionist actions in international fora (such as WTO, G-20, APEC, and within ASEAN itself). Recent developments highlight why the world and also ASEAN countries need stronger, not weaker, globally and regionally binding trade rules and enforcement. 37. That ASEAN commercial interests have been harmed by discriminatory actions of trading partners is now beyond doubt. According to the independent protectionism monitoring initiative Global Trade Alert (GTA), since the first G20 crisis-related summit in November 2008, a total of 559 measures have been taken by governments, including by some ASEAN governments, which harm ASEAN exporters, overseas workers, and foreign investments. Most of these protectionist measures (469 or 83 percent) were still in force as of July 2012. A total of 80 new measures that harm ASEAN commercial interests have been adopted just in the twelve months to July 2012—an estimated number that is almost certain to be revised upwards, as murkier forms of protectionism are harder to document and are thus subject to reporting lags. ASEAN, on the other hand, has also benefited from the liberalizing and transparency-improving steps taken by foreign and ASEAN governments—in fact this has happened 202 times since November 2008, although only 156 of such liberalizing measures remain in force as of July 2012. Still, governments worldwide have taken nearly three times as many measures that harm ASEAN commercial interests than those that benefit them. 38. A strong positive correlation exists across ASEAN Member States between export engagement in world markets and the frequency of protectionist hits against their commercial interests (see Figure 1.5). The breakdown across ASEAN members is reported in Table 1.4 for
18 This section is based on a background paper prepared for this report by Simon J. Evenett and Johannes Fritz. University of St. Gallen, drawing upon GTA analyses and database recently updated in June 2012 (www.globaltradealert.org).
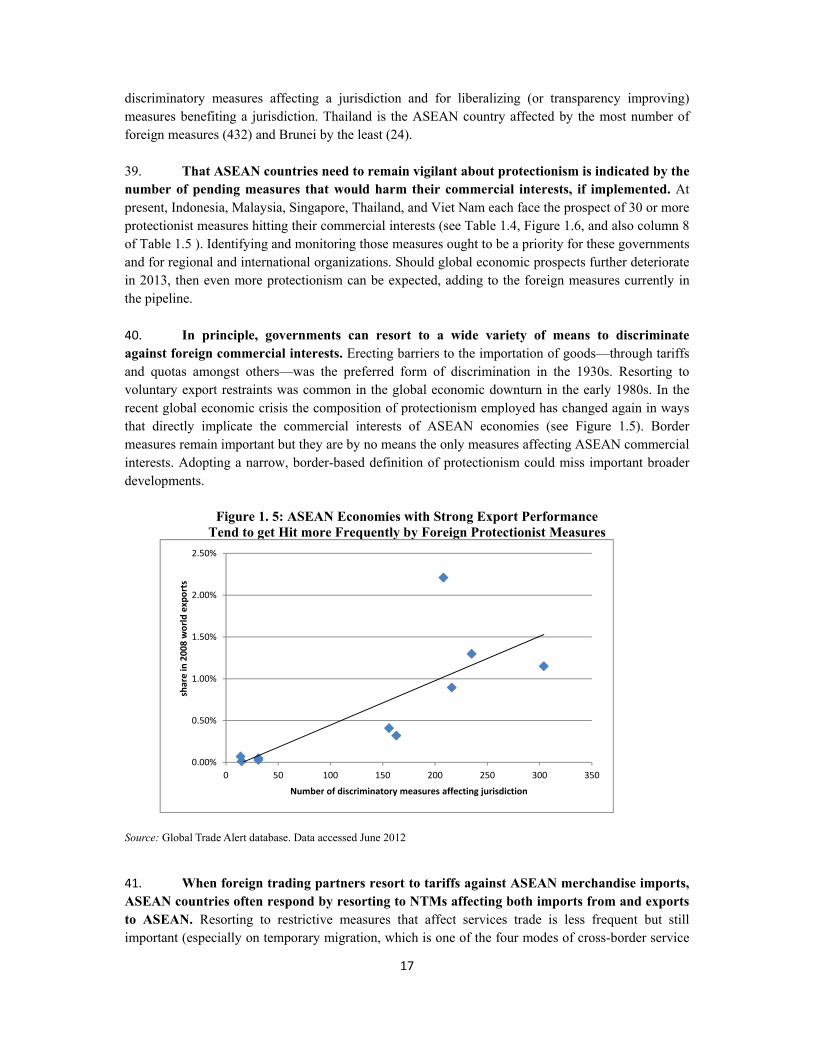
17
discriminatory measures affecting a jurisdiction and for liberalizing (or transparency improving) measures benefiting a jurisdiction. Thailand is the ASEAN country affected by the most number of foreign measures (432) and Brunei by the least (24).
39. That ASEAN countries need to remain vigilant about protectionism is indicated by the number of pending measures that would harm their commercial interests, if implemented. At present, Indonesia, Malaysia, Singapore, Thailand, and Viet Nam each face the prospect of 30 or more protectionist measures hitting their commercial interests (see Table 1.4, Figure 1.6, and also column 8 of Table 1.5 ). Identifying and monitoring those measures ought to be a priority for these governments and for regional and international organizations. Should global economic prospects further deteriorate in 2013, then even more protectionism can be expected, adding to the foreign measures currently in the pipeline. 40. In principle, governments can resort to a wide variety of means to discriminate against foreign commercial interests. Erecting barriers to the importation of goods—through tariffs and quotas amongst others—was the preferred form of discrimination in the 1930s. Resorting to voluntary export restraints was common in the global economic downturn in the early 1980s. In the recent global economic crisis the composition of protectionism employed has changed again in ways that directly implicate the commercial interests of ASEAN economies (see Figure 1.5). Border measures remain important but they are by no means the only measures affecting ASEAN commercial interests. Adopting a narrow, border-based definition of protectionism could miss important broader developments.
Figure 1. 5: ASEAN Economies with Strong Export Performance Tend to get Hit more Frequently by Foreign Protectionist Measures
Source: Global Trade Alert database. Data accessed June 2012
41. When foreign trading partners resort to tariffs against ASEAN merchandise imports, ASEAN countries often respond by resorting to NTMs affecting both imports from and exports to ASEAN. Resorting to restrictive measures that affect services trade is less frequent but still important (especially on temporary migration, which is one of the four modes of cross-border service
0 50 100 150 200 250 300 3500.00%
0.50%
1.00%
1.50%
2.00%
2.50%
Number of discriminatory measures affecting jurisdiction
shar
e in
200
8 w
orld
exp
orts

18
provision). In addition to the measures mentioned above (and illustrated in Figure 1.6), foreign subsidies can also do harm to ASEAN exports. Since November 2008, a total of 69 subsidies have been implemented worldwide that harm ASEAN commercial interests, 53 of which are still in effect. As shown in Table 1.5, the trading partners that appear in the top 10 list ranked by frequency of harmful measures implemented and affecting ASEAN economies are Argentina, China, India, and the Russian Federation. Some ASEAN countries, and especially Indonesia, have also taken various measures that harm other ASEAN economies (others are Malaysia and Viet Nam; see next section and also Table 1.6).

19
T
able
1. 4
: M
easu
res
Aff
ecti
ng
AS
EA
N C
oun
trie
s S
ince
Fir
st G
20
Cri
sis-
Rel
ated
Su
mm
it in
Nov
emb
er 2
008
Coun
try
Tota
l no.
of
mea
sure
s affe
ctin
g
juris
dict
ion
that
are
…
Tota
l no.
of
disc
rimin
ator
y m
easu
res
affe
ctin
g ju
risdi
ctio
n th
at a
re …
Tota
l num
ber o
f lik
ely
disc
rimin
ator
y m
easu
res
affe
ctin
g ju
risdi
ctio
n th
at a
re …
Tota
l num
ber o
f
liber
alizi
ng
mea
sure
saf
fect
ing
juris
dict
ion
that
are
…
curr
ently
in
forc
e no
lo
nger
in
forc
e pe
ndin
g cu
rren
tly
in fo
rce
no
long
er
in fo
rce
curr
ently
in
forc
e no
lo
nger
in
forc
e pe
ndin
gcu
rren
tly
in fo
rce
no
long
er
in fo
rce
pend
ing
Brun
ei
24
2 9
14
07
18
31
1
Cam
bodi
a 47
9
14
26
512
213
92
1
Indo
nesia
31
6 81
50
17
2 44
5512
32
8925
18
Lao
PDR
25
4 8
13
26
28
60
0
Mal
aysia
34
8 78
49
19
6 39
5512
31
9727
18
Mya
nmar
56
7
2 27
4
152
2 14
10
Phili
ppin
es 2
45
62
34
134
2943
925
6824
9
Sing
apor
e 31
5 76
43
16
6 42
568
3193
2612
Thai
land
43
2 99
68
25
4 50
6414
48
114
3520
Viet
Nam
23
4 65
39
12
2 34
489
3264
227
Sour
ce:
Glo
bal T
rade
Ale
rt d
atab
ase.
Dat
a ac
cess
ed J
une
2012
. The
mea
sure
s re
ferr
ed t
o as
dis
crim
inat
ory
and
likel
y di
scri
min
ator
y in
thi
s ta
ble
are
cate
gori
zed
red
and
ambe
r, re
spec
tivel
y, i
n th
e G
TA d
atab
ase.
In
mos
t ca
ses
the
diff
eren
ce b
etw
een
the
latte
r an
d th
e fo
rmer
is
the
degr
ee o
f ce
rtai
nty
that
the
GTA
tea
m h
as t
hat
the
mea
sure
dis
crim
inat
es a
gain
st f
orei
gn c
omm
erci
al
inte
rest
s.
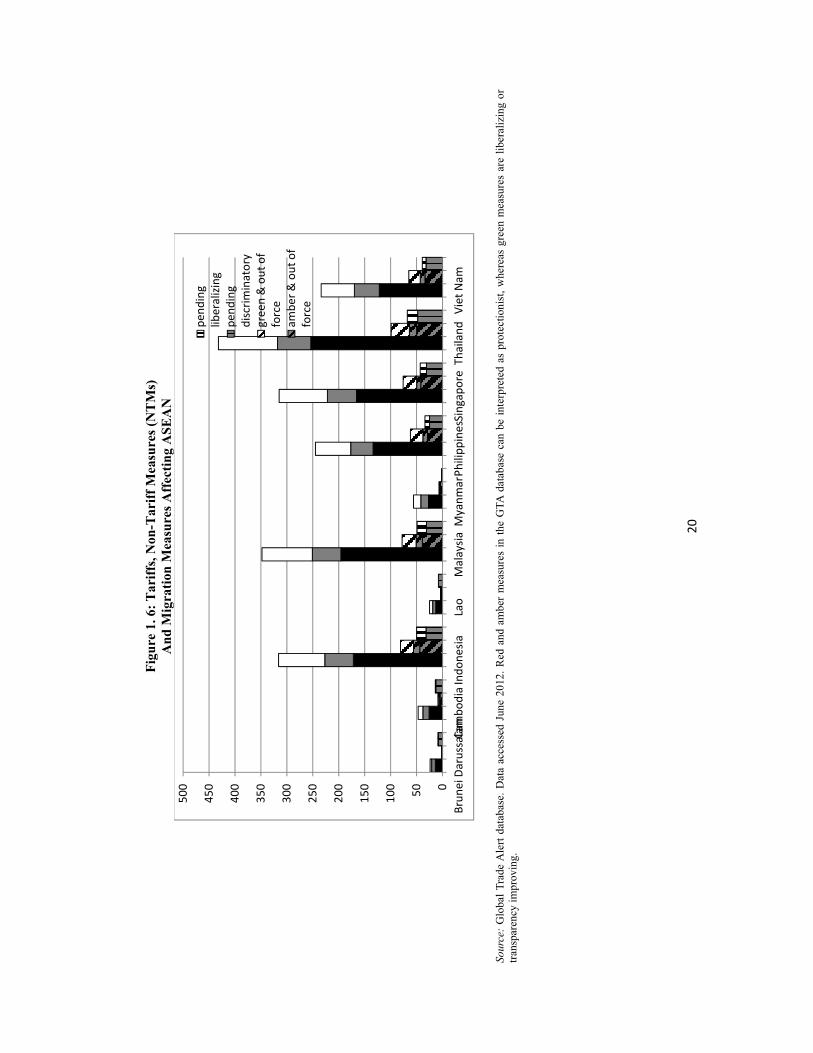
20
Fig
ure
1. 6
: T
arif
fs, N
on-T
arif
f M
easu
res
(NT
Ms)
A
nd
Mig
rati
on M
easu
res
Aff
ecti
ng
AS
EA
N
Sour
ce:
Glo
bal
Tra
de A
lert
dat
abas
e. D
ata
acce
ssed
Jun
e 20
12.
Red
and
am
ber
mea
sure
s in
the
GTA
dat
abas
e ca
n be
int
erpr
eted
as
prot
ectio
nist
, w
here
as g
reen
mea
sure
s ar
e lib
eral
izin
g or
tr
ansp
aren
cy im
prov
ing.
Brun
ei D
arus
sala
mCa
mbo
dia
Indo
nesia
Lao
Mal
aysia
Mya
nmar
Phili
ppin
esSi
ngap
ore
Thai
land
Viet
Nam
050100
150
200
250
300
350
400
450
500
pend
ing
liber
alizi
ngpe
ndin
g di
scrim
inat
ory
gree
n &
out
of
forc
eam
ber &
out
of
forc
e
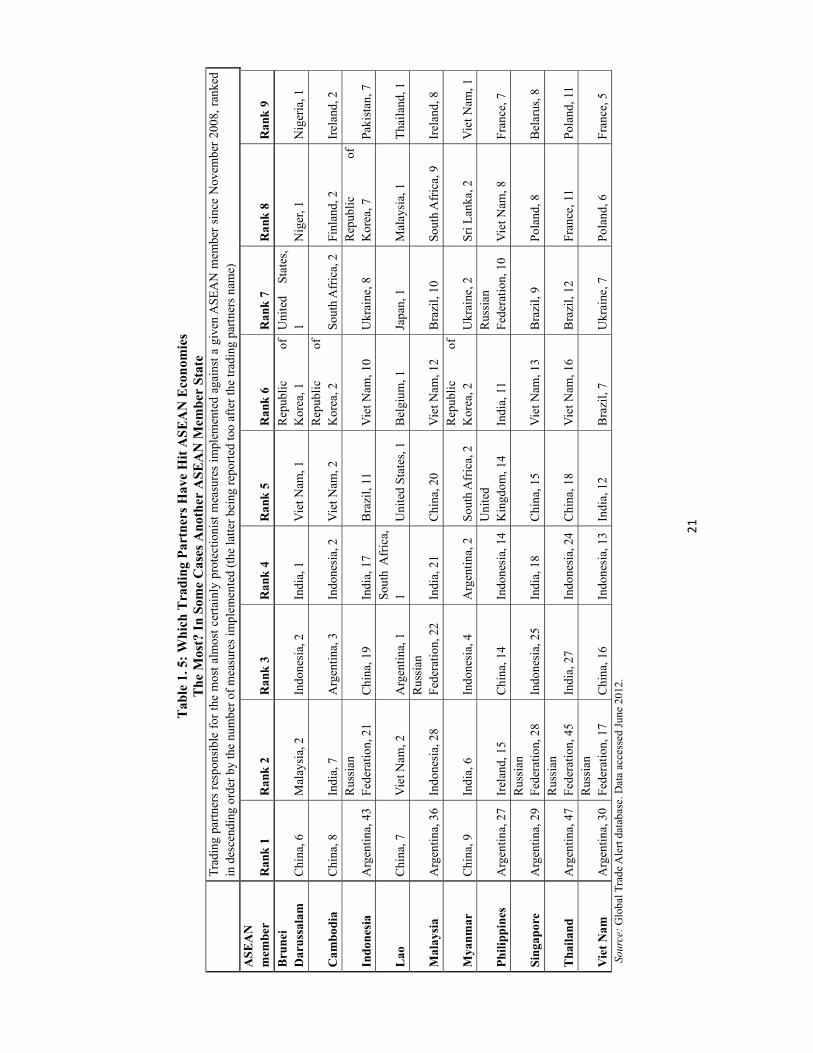
21
T
able
1. 5
: W
hic
h T
rad
ing
Par
tner
s H
ave
Hit
AS
EA
N E
con
omie
s T
he
Mos
t? I
n S
ome
Cas
es A
not
her
AS
EA
N M
emb
er S
tate
T
radi
ng p
artn
ers
resp
onsi
ble
for
the
mos
t al
mos
t ce
rtai
nly
prot
ectio
nist
mea
sure
s im
plem
ente
d ag
ains
t a
give
n A
SEA
N m
embe
r si
nce
Nov
embe
r 20
08, r
anke
d in
des
cend
ing
orde
r by
the
num
ber
of m
easu
res
impl
emen
ted
(the
latt
er b
eing
rep
orte
d to
o af
ter
the
trad
ing
part
ners
nam
e)
AS
EA
N
mem
ber
Ran
k 1
R
ank
2
Ran
k 3
R
ank
4
Ran
k 5
R
ank
6
Ran
k 7
R
ank
8
Ran
k 9
Bru
nei
D
aru
ssal
am
Chi
na, 6
M
alay
sia,
2
Indo
nesi
a, 2
In
dia,
1
Vie
t Nam
, 1
Rep
ubli
c of
K
orea
, 1
Uni
ted
Stat
es,
1 N
iger
, 1
Nig
eria
, 1
Cam
bod
ia
Chi
na, 8
In
dia,
7
Arg
enti
na, 3
In
done
sia,
2
Vie
t Nam
, 2
Rep
ubli
c of
K
orea
, 2
Sou
th A
fric
a, 2
Finl
and,
2
Irel
and,
2
Indo
nesi
a A
rgen
tina
, 43
Rus
sian
F
eder
atio
n, 2
1 C
hina
, 19
Indi
a, 1
7 B
razi
l, 11
V
iet N
am, 1
0 U
krai
ne, 8
R
epub
lic
of
Kor
ea, 7
P
akis
tan,
7
Lao
C
hina
, 7
Vie
t Nam
, 2
Arg
enti
na, 1
S
outh
Afr
ica,
1
Uni
ted
Stat
es, 1
B
elgi
um, 1
Ja
pan,
1
Mal
aysi
a, 1
T
hail
and,
1
Mal
aysi
a A
rgen
tina
, 36
Indo
nesi
a, 2
8 R
ussi
an
Fed
erat
ion,
22
Indi
a, 2
1 C
hina
, 20
Vie
t Nam
, 12
Bra
zil,
10
Sout
h A
fric
a, 9
Ir
elan
d, 8
Mya
nm
ar
Chi
na, 9
In
dia,
6
Indo
nesi
a, 4
A
rgen
tina
, 2
Sou
th A
fric
a, 2
R
epub
lic
of
Kor
ea, 2
U
krai
ne, 2
Sr
i Lan
ka, 2
V
iet N
am, 1
Ph
ilipp
ines
A
rgen
tina
, 27
Irel
and,
15
Chi
na, 1
4 In
done
sia,
14
Uni
ted
Kin
gdom
, 14
Indi
a, 1
1 R
ussi
an
Fed
erat
ion,
10
Vie
t Nam
, 8
Fra
nce,
7
Sin
gapo
re
Arg
enti
na, 2
9 R
ussi
an
Fed
erat
ion,
28
Indo
nesi
a, 2
5 In
dia,
18
Chi
na, 1
5 V
iet N
am, 1
3 B
razi
l, 9
Pola
nd, 8
B
elar
us, 8
Tha
ilan
d A
rgen
tina
, 47
Rus
sian
F
eder
atio
n, 4
5 In
dia,
27
Indo
nesi
a, 2
4C
hina
, 18
Vie
t Nam
, 16
Bra
zil,
12
Fran
ce, 1
1 P
olan
d, 1
1
Vie
t N
am
Arg
enti
na, 3
0 R
ussi
an
Fed
erat
ion,
17
Chi
na, 1
6 In
done
sia,
13
Indi
a, 1
2 B
razi
l, 7
Ukr
aine
, 7
Pola
nd, 6
F
ranc
e, 5
Sour
ce:
Glo
bal T
rade
Ale
rt d
atab
ase.
Dat
a ac
cess
ed J
une
2012
.
22
Recent Trade Measures Adopted by ASEAN Member States19
42. ASEAN economies, especially Indonesia and to a lesser extent Viet Nam, Malaysia, and Thailand have also resorted to using protectionist measures during the global economic crisis, as summarized in Box 1.4 and illustrated in Figure 1.7.20 According to the GTA database, since the first G20 crisis-related summit in November 2008, and through June 2012, ASEAN governments have implemented 102 measures that harm foreign commercial interests, including other ASEAN Member States, over 90 per cent of which remain in force (93). During the same period, these governments introduced 29 measures that liberalize commerce or improve the transparency of their national trade regimes. This tendency to discriminate more than liberalize is, as noted earlier, a worldwide tendency. Still, these findings raise questions about the extent to which ASEAN governments, and especially Indonesia, have been able to hold the line against protectionist pressures at home.
Box 1. 4: Recent Merchandise Trade Measures by ASEAN—Summary by Instrument
Import tariffs represent by far the most frequent harmful measure to ASEAN commercial interests as well as the instrument ASEAN governments have resorted to most frequently when tilting the playing field in favor of domestic firms. Their total number far exceeds the number of liberalizing tariff measures. A third of tariff increases implemented since November 2008 are no longer in force. However. Indonesia and Viet Nam have imposed the most tariff measures among the ASEAN nations.
Import-related NTMs are the second most frequently used measure to harm the commercial interests of ASEAN members and the second most class of policies resorted to by ASEAN governments to limit trade. Thailand has been harmed by 126 foreign import NTMs, far more than any other ASEAN member. Meanwhile, Indonesia has implemented 16 such NTMs.
Export taxes (tariffs) by ASEAN countries are relatively rare. Also, foreign governments have only infrequently resorted to export tariffs that harm ASEAN commercial interests. Still, Indonesia, Malaysia, Singapore, and Thailand have seen their commercial interests harmed by eight or more export tariff increases since November 2008.
Export NTMs are resorted to by ASEAN and non-ASEAN governments more often than export tariffs. Most export NTMs disadvantage foreign commercial interests and few if any are trade promoting. Those export NTMs harming ASEAN commercial interests affect middle-income economies more often than lower-income ASEAN nations, probably reflecting the larger manufacturing sectors in the former.
Source: Simon J. Evenett and Johannes Fritz. University of St. Gallen, drawing upon the Global Trade Alert analyses and database recently updated in June 2012 (www.globaltradealert.org)
19 The first part of this section is based on a background paper prepared for this report by Simon J. Evenett and Johannes Fritz. University of St. Gallen, drawing upon the GTA database recently updated in June 2012 (www.globaltradealert.org). The second part draws on a recent WTO report on trade policy developments and includes mention of specific concerns by ASEAN trading partners, trade remedies initiated and other trade measures taken by ASEAN countries during the period October 2011-April 2012. See the “Report to the Trade Policy Review Body (TPRB) from the Director-General on Trade-Related Developments”, WTO, WT/TPR/OV/W/6, 28 June 2012, available at: http://www.wto.org/english/news_e/news12_e/devel_29jun12_e.htm 20 As part of its AEC Scorecard Phase 2 project, the Economic Research Institute for ASEAN and East Asia (ERIA) singled out three most problematic NTMs—quantity control, monopolistic and finance measures—and developed what it calls a Core NTM Restrictiveness Index based on frequency indicators. Indonesia does stand out with a particularly high index value, followed by Viet Nam, although with a far lower score than Indonesia.
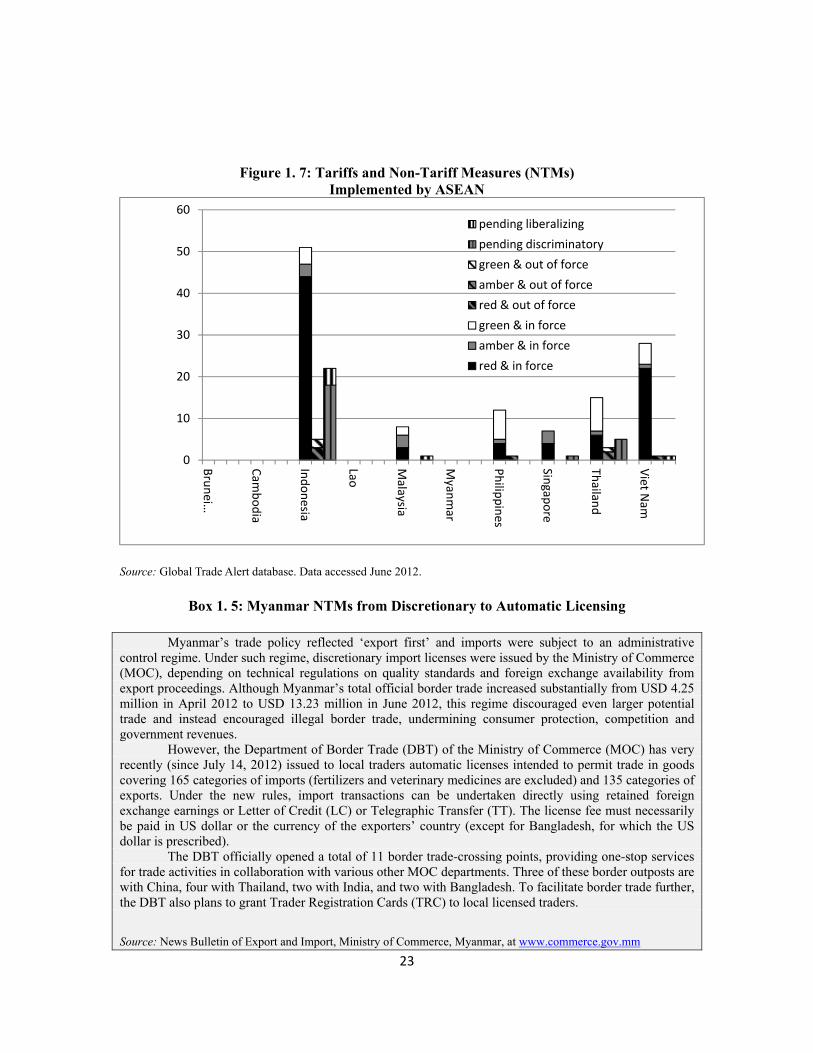
23
Figure 1. 7: Tariffs and Non-Tariff Measures (NTMs)
Implemented by ASEAN
Source: Global Trade Alert database. Data accessed June 2012.
Box 1. 5: Myanmar NTMs from Discretionary to Automatic Licensing
Myanmar’s trade policy reflected ‘export first’ and imports were subject to an administrative control regime. Under such regime, discretionary import licenses were issued by the Ministry of Commerce (MOC), depending on technical regulations on quality standards and foreign exchange availability from export proceedings. Although Myanmar’s total official border trade increased substantially from USD 4.25 million in April 2012 to USD 13.23 million in June 2012, this regime discouraged even larger potential trade and instead encouraged illegal border trade, undermining consumer protection, competition and government revenues.
However, the Department of Border Trade (DBT) of the Ministry of Commerce (MOC) has very recently (since July 14, 2012) issued to local traders automatic licenses intended to permit trade in goods covering 165 categories of imports (fertilizers and veterinary medicines are excluded) and 135 categories of exports. Under the new rules, import transactions can be undertaken directly using retained foreign exchange earnings or Letter of Credit (LC) or Telegraphic Transfer (TT). The license fee must necessarily be paid in US dollar or the currency of the exporters’ country (except for Bangladesh, for which the US dollar is prescribed).
The DBT officially opened a total of 11 border trade-crossing points, providing one-stop services for trade activities in collaboration with various other MOC departments. Three of these border outposts are with China, four with Thailand, two with India, and two with Bangladesh. To facilitate border trade further, the DBT also plans to grant Trader Registration Cards (TRC) to local licensed traders.
Source: News Bulletin of Export and Import, Ministry of Commerce, Myanmar, at www.commerce.gov.mm
Brunei …
Cambodia
Indonesia
Lao
Malaysia
Myanm
ar
Philippines
Singapore
Thailand
Viet Nam
0
10
20
30
40
50
60pending liberalizingpending discriminatorygreen & out of forceamber & out of forcered & out of forcegreen & in forceamber & in forcered & in force
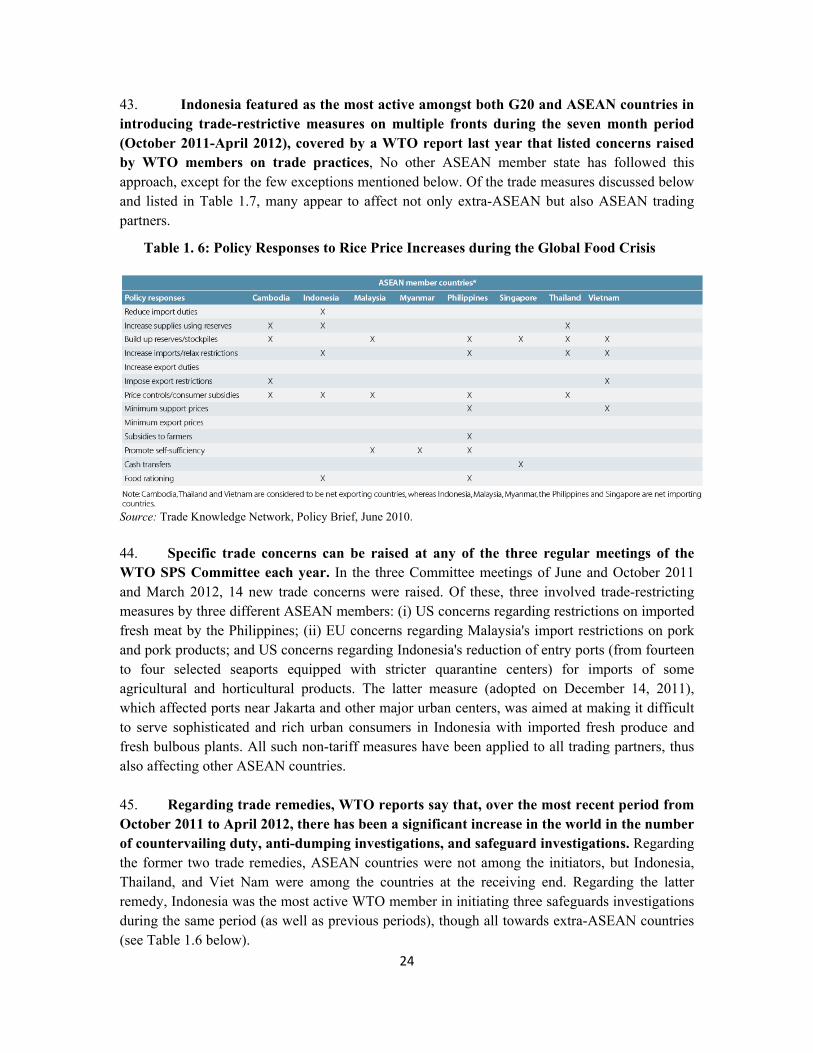
24
43. Indonesia featured as the most active amongst both G20 and ASEAN countries in introducing trade-restrictive measures on multiple fronts during the seven month period (October 2011-April 2012), covered by a WTO report last year that listed concerns raised by WTO members on trade practices, No other ASEAN member state has followed this approach, except for the few exceptions mentioned below. Of the trade measures discussed below and listed in Table 1.7, many appear to affect not only extra-ASEAN but also ASEAN trading partners.
Table 1. 6: Policy Responses to Rice Price Increases during the Global Food Crisis
Source: Trade Knowledge Network, Policy Brief, June 2010.
44. Specific trade concerns can be raised at any of the three regular meetings of the WTO SPS Committee each year. In the three Committee meetings of June and October 2011 and March 2012, 14 new trade concerns were raised. Of these, three involved trade-restricting measures by three different ASEAN members: (i) US concerns regarding restrictions on imported fresh meat by the Philippines; (ii) EU concerns regarding Malaysia's import restrictions on pork and pork products; and US concerns regarding Indonesia's reduction of entry ports (from fourteen to four selected seaports equipped with stricter quarantine centers) for imports of some agricultural and horticultural products. The latter measure (adopted on December 14, 2011), which affected ports near Jakarta and other major urban centers, was aimed at making it difficult to serve sophisticated and rich urban consumers in Indonesia with imported fresh produce and fresh bulbous plants. All such non-tariff measures have been applied to all trading partners, thus also affecting other ASEAN countries.
45. Regarding trade remedies, WTO reports say that, over the most recent period from October 2011 to April 2012, there has been a significant increase in the world in the number of countervailing duty, anti-dumping investigations, and safeguard investigations. Regarding the former two trade remedies, ASEAN countries were not among the initiators, but Indonesia, Thailand, and Viet Nam were among the countries at the receiving end. Regarding the latter remedy, Indonesia was the most active WTO member in initiating three safeguards investigations during the same period (as well as previous periods), though all towards extra-ASEAN countries (see Table 1.6 below).
25
46. However, most trade-related measures taken recently by other ASEAN countries either ended or reduced their trade-restricting effects. In December 2011, the Philippines actually terminated anti-dumping duties on imports of clear float glass from Indonesia (imposed several years earlier). Myanmar and Thailand adjusted some of their licensing and tariff quota regulations (respectively), but towards a more flexible, liberal direction (see Box 1.5). According to press reports cited in WTO 2012, while Viet Nam did impose a trade restrictive measure in the form of an import quota on salt (fixed at 102,000 tons) for the year 2012, it also reduced import tariffs on 1,000 items, that is, meat and meat by-products, and export tariffs (from 17 percent to 14 percent) on certain products, that is, coal, processed limestone.
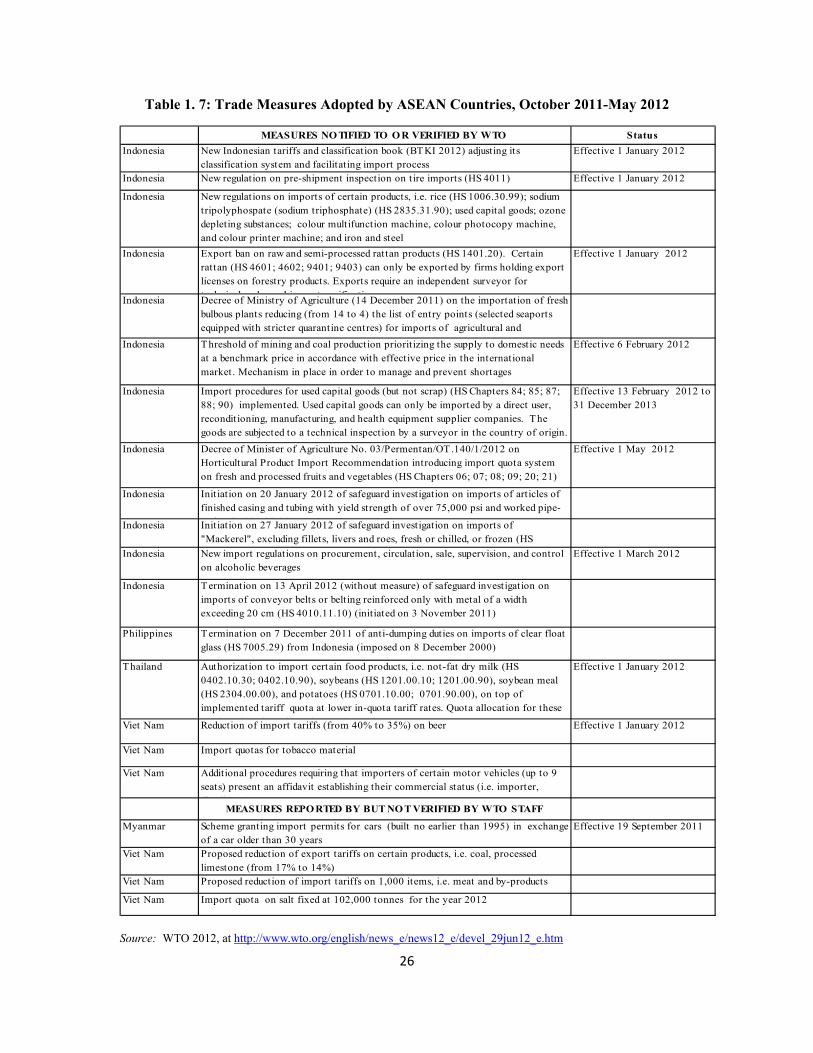
26
Table 1. 7: Trade Measures Adopted by ASEAN Countries, October 2011-May 2012
Source: WTO 2012, at http://www.wto.org/english/news_e/news12_e/devel_29jun12_e.htm
MEASURES NO TIFIED TO O R VERIFIED BY WTO Status
Indonesia New Indonesian tariffs and classification book (BTKI 2012) adjusting its classification system and facilitating import process
Effective 1 January 2012
Indonesia New regulation on pre-shipment inspection on tire imports (HS 4011) Effective 1 January 2012
Indonesia New regulations on imports of certain products, i.e. rice (HS 1006.30.99); sodium tripolyphospate (sodium triphosphate) (HS 2835.31.90); used capital goods; ozone depleting substances; colour multifunction machine, colour photocopy machine, and colour printer machine; and iron and steel
Indonesia Export ban on raw and semi-processed rattan products (HS 1401.20). Certain rattan (HS 4601; 4602; 9401; 9403) can only be exported by firms holding export licenses on forestry products. Exports require an independent surveyor for technical and pre shipment verification
Effective 1 January 2012
Indonesia Decree of Ministry of Agriculture (14 December 2011) on the importation of fresh bulbous plants reducing (from 14 to 4) the list of entry points (selected seaports equipped with stricter quarantine centres) for imports of agricultural and
Indonesia Threshold of mining and coal production priorit izing the supply to domestic needs at a benchmark price in accordance with effective price in the international market. Mechanism in place in order to manage and prevent shortages
Effective 6 February 2012
Indonesia Import procedures for used capital goods (but not scrap) (HS Chapters 84; 85; 87; 88; 90) implemented. Used capital goods can only be imported by a direct user, reconditioning, manufacturing, and health equipment supplier companies. The goods are subjected to a technical inspection by a surveyor in the country of origin.
Effective 13 February 2012 to 31 December 2013
Indonesia Decree of Minister of Agriculture No. 03/Permentan/OT.140/1/2012 on Horticultural Product Import Recommendation introducing import quota system on fresh and processed fruits and vegetables (HS Chapters 06; 07; 08; 09; 20; 21)
Effective 1 May 2012
Indonesia Initiation on 20 January 2012 of safeguard investigation on imports of articles of finished casing and tubing with yield strength of over 75,000 psi and worked pipe-
d (HS 7304 29 00)Indonesia Initiation on 27 January 2012 of safeguard investigation on imports of "Mackerel", excluding fillets, livers and roes, fresh or chilled, or frozen (HS
Indonesia New import regulations on procurement, circulation, sale, supervision, and control on alcoholic beverages
Effective 1 March 2012
Indonesia Termination on 13 April 2012 (without measure) of safeguard investigation on imports of conveyor belts or belting reinforced only with metal of a width exceeding 20 cm (HS 4010.11.10) (initiated on 3 November 2011)
Philippines Termination on 7 December 2011 of anti-dumping duties on imports of clear float glass (HS 7005.29) from Indonesia (imposed on 8 December 2000)
Thailand Authorization to import certain food products, i.e. not-fat dry milk (HS 0402.10.30; 0402.10.90), soybeans (HS 1201.00.10; 1201.00.90), soybean meal (HS 2304.00.00), and potatoes (HS 0701.10.00; 0701.90.00), on top of implemented tariff quota at lower in-quota tariff rates. Quota allocation for these
d b d "li i d d"
Effective 1 January 2012
Viet Nam Reduction of import tariffs (from 40% to 35%) on beer Effective 1 January 2012
Viet Nam Import quotas for tobacco material
Viet Nam Additional procedures requiring that importers of certain motor vehicles (up to 9 seats) present an affidavit establishing their commercial status (i.e. importer, di ib )
MEASURES REPO RTED BY BUT NO T VERIFIED BY WTO STAFF
Myanmar Scheme granting import permits for cars (built no earlier than 1995) in exchangeof a car older than 30 years
Effective 19 September 2011
Viet Nam Proposed reduction of export tariffs on certain products, i.e. coal, processed limestone (from 17% to 14%)
Viet Nam Proposed reduction of import tariffs on 1,000 items, i.e. meat and by-products
Viet Nam Import quota on salt fixed at 102,000 tonnes for the year 2012
27
ASEAN Export Restrictions
47. Export controls are normally of two types—export taxes and quantitative restrictions. They are mostly imposed by low-income and lower-middle economies on agricultural products and raw materials, for the common purpose of generating government revenues and/or protecting domestic consumers and infant industries using such goods. Although quantitative limitations are generally prohibited under the WTO, Article XI of the GATT allows export taxes, as they are considered the least damaging export control measure. However, in some regional trade agreements, that is, the European Union (EU), North American Free Trade Agreement (NAFTA), and the Caribbean Common Market (CARICOM), export duties on intra-regional trade are prohibited. 48. Taking advantage of a lack of ASEAN-wide discipline on export restrictions, many ASEAN Member States instead impose various export measures. They particularly did so to ensure adequate domestic supplies of essential agricultural products in the wake of the global food crisis during 2007/08, when the international market prices of many staples rose dramatically, triggering riots among urban consumers and jeopardizing food security in many countries. Governments in the region that experienced a surge in the exports of such commodities reacted by imposing export controls and building up domestic reserves or stockpiles. Table 1.8 shows the variety of policy responses of selected ASEAN Member States to the sharp global price increases of rice.
49. ATIGA Article 44 states that each member state shall notify the other member states of any existing import licensing procedures, including any new licensing procedure and any modification. However, no such official information is available to the ASEAN Secretariat. The available unofficial information shows that most of the ASEAN governments impose export licensing, except for the Philippines, while many others impose export taxes, except for Brunei, Philippines, and Singapore. The cases of Thailand and Indonesia are illustrated in Boxes 1.6 and 1.7. 50. Figure 1.8 compares selected indicators of export restrictions in 2009 (or latest available year) among various country groupings—ASEAN, MERCOSUR, EU-27, and the entire WTO membership. The European Union had the lowest usage of export restrictions, while ASEAN appears to have deployed such instruments as much or more than the other comparators. Box 1.6 illustrates the specific case of export restrictions on nickel and coal by Indonesia, and Box 1.7 summarizes the export restrictions regime for Thailand.
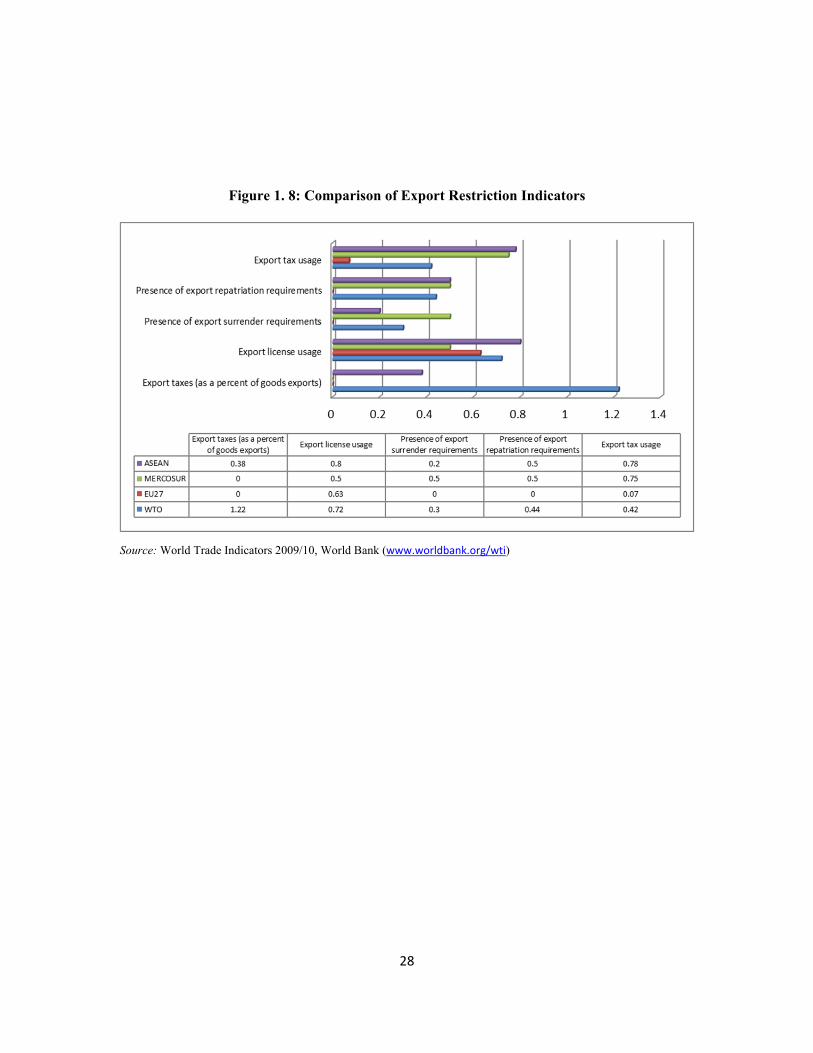
28
Figure 1. 8: Comparison of Export Restriction Indicators
Source: World Trade Indicators 2009/10, World Bank (www.worldbank.org/wti)
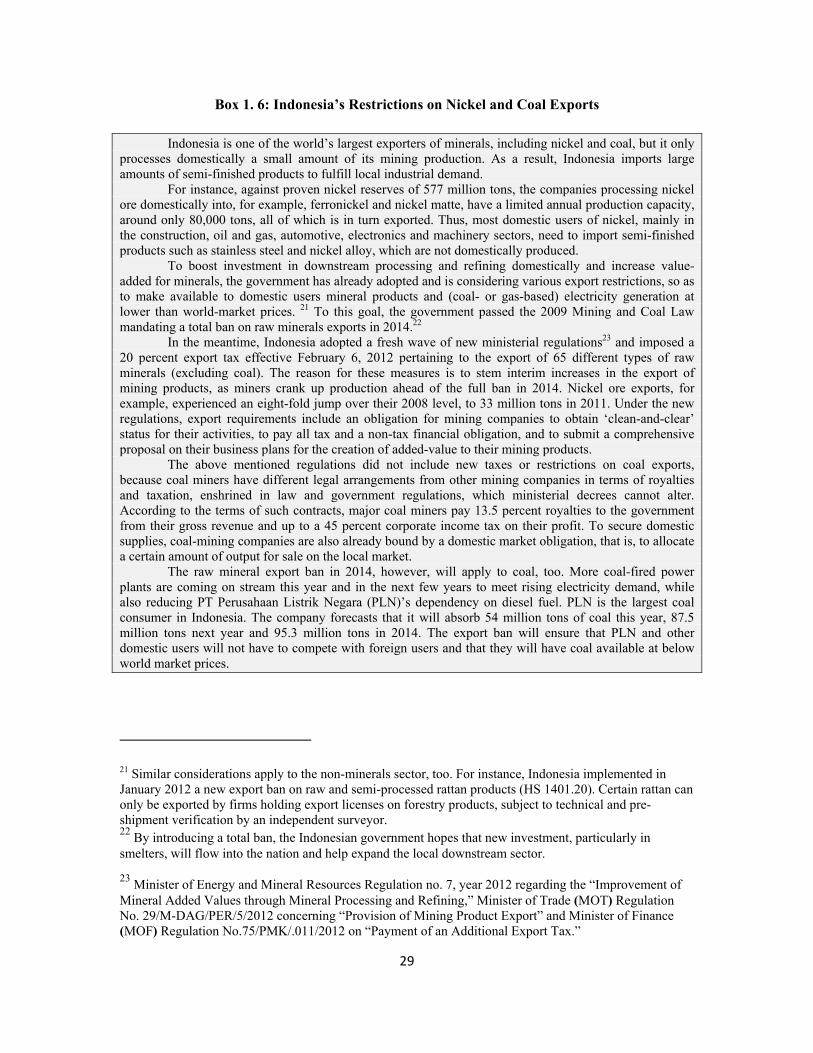
29
Box 1. 6: Indonesia’s Restrictions on Nickel and Coal Exports
Indonesia is one of the world’s largest exporters of minerals, including nickel and coal, but it only processes domestically a small amount of its mining production. As a result, Indonesia imports large amounts of semi-finished products to fulfill local industrial demand.
For instance, against proven nickel reserves of 577 million tons, the companies processing nickel ore domestically into, for example, ferronickel and nickel matte, have a limited annual production capacity, around only 80,000 tons, all of which is in turn exported. Thus, most domestic users of nickel, mainly in the construction, oil and gas, automotive, electronics and machinery sectors, need to import semi-finished products such as stainless steel and nickel alloy, which are not domestically produced.
To boost investment in downstream processing and refining domestically and increase value-added for minerals, the government has already adopted and is considering various export restrictions, so as to make available to domestic users mineral products and (coal- or gas-based) electricity generation at lower than world-market prices. 21 To this goal, the government passed the 2009 Mining and Coal Law mandating a total ban on raw minerals exports in 2014.22
In the meantime, Indonesia adopted a fresh wave of new ministerial regulations23 and imposed a 20 percent export tax effective February 6, 2012 pertaining to the export of 65 different types of raw minerals (excluding coal). The reason for these measures is to stem interim increases in the export of mining products, as miners crank up production ahead of the full ban in 2014. Nickel ore exports, for example, experienced an eight-fold jump over their 2008 level, to 33 million tons in 2011. Under the new regulations, export requirements include an obligation for mining companies to obtain ‘clean-and-clear’ status for their activities, to pay all tax and a non-tax financial obligation, and to submit a comprehensive proposal on their business plans for the creation of added-value to their mining products.
The above mentioned regulations did not include new taxes or restrictions on coal exports, because coal miners have different legal arrangements from other mining companies in terms of royalties and taxation, enshrined in law and government regulations, which ministerial decrees cannot alter. According to the terms of such contracts, major coal miners pay 13.5 percent royalties to the government from their gross revenue and up to a 45 percent corporate income tax on their profit. To secure domestic supplies, coal-mining companies are also already bound by a domestic market obligation, that is, to allocate a certain amount of output for sale on the local market.
The raw mineral export ban in 2014, however, will apply to coal, too. More coal-fired power plants are coming on stream this year and in the next few years to meet rising electricity demand, while also reducing PT Perusahaan Listrik Negara (PLN)’s dependency on diesel fuel. PLN is the largest coal consumer in Indonesia. The company forecasts that it will absorb 54 million tons of coal this year, 87.5 million tons next year and 95.3 million tons in 2014. The export ban will ensure that PLN and other domestic users will not have to compete with foreign users and that they will have coal available at below world market prices.
21 Similar considerations apply to the non-minerals sector, too. For instance, Indonesia implemented in January 2012 a new export ban on raw and semi-processed rattan products (HS 1401.20). Certain rattan can only be exported by firms holding export licenses on forestry products, subject to technical and pre-shipment verification by an independent surveyor. 22 By introducing a total ban, the Indonesian government hopes that new investment, particularly in smelters, will flow into the nation and help expand the local downstream sector.
23 Minister of Energy and Mineral Resources Regulation no. 7, year 2012 regarding the “Improvement of Mineral Added Values through Mineral Processing and Refining,” Minister of Trade (MOT) Regulation No. 29/M-DAG/PER/5/2012 concerning “Provision of Mining Product Export” and Minister of Finance (MOF) Regulation No.75/PMK/.011/2012 on “Payment of an Additional Export Tax.”
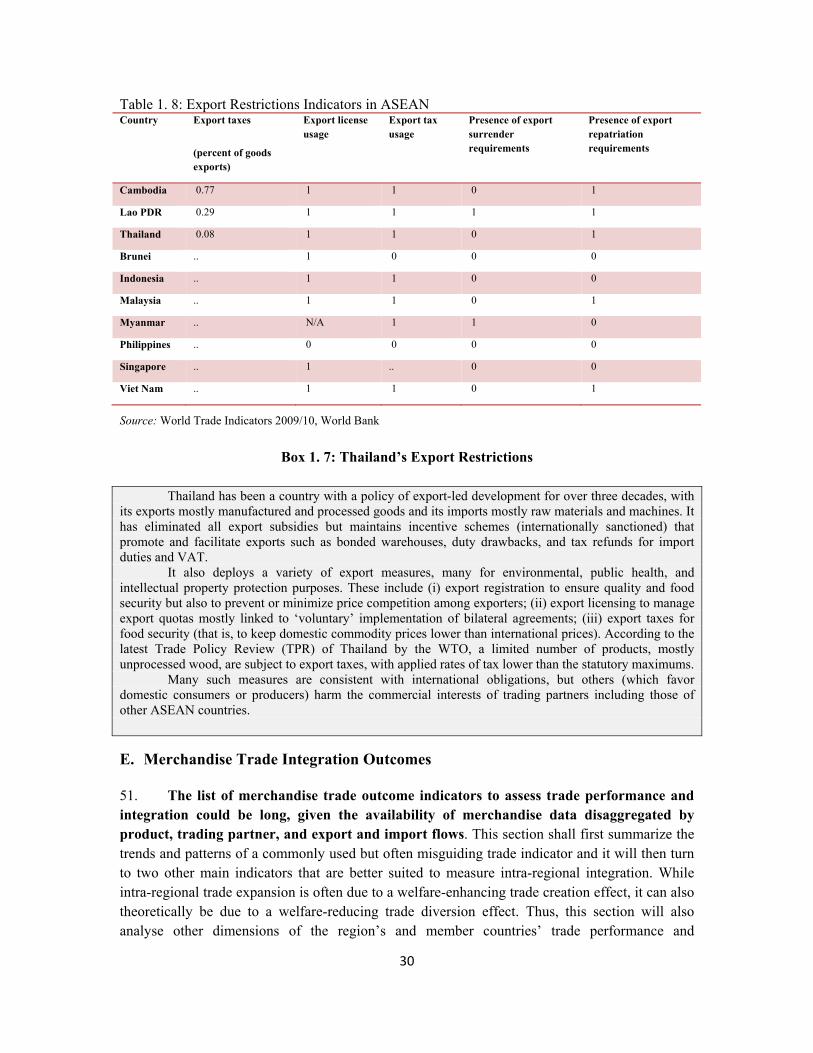
30
Table 1. 8: Export Restrictions Indicators in ASEAN Country Export taxes
(percent of goods exports)
Export license usage
Export tax usage
Presence of export surrender requirements
Presence of export repatriation requirements
Cambodia 0.77 1 1 0 1
Lao PDR 0.29 1 1 1 1
Thailand 0.08 1 1 0 1
Brunei .. 1 0 0 0
Indonesia .. 1 1 0 0
Malaysia .. 1 1 0 1
Myanmar .. N/A 1 1 0
Philippines .. 0 0 0 0
Singapore .. 1 .. 0 0
Viet Nam .. 1 1 0 1
Source: World Trade Indicators 2009/10, World Bank
Box 1. 7: Thailand’s Export Restrictions
Thailand has been a country with a policy of export-led development for over three decades, with its exports mostly manufactured and processed goods and its imports mostly raw materials and machines. It has eliminated all export subsidies but maintains incentive schemes (internationally sanctioned) that promote and facilitate exports such as bonded warehouses, duty drawbacks, and tax refunds for import duties and VAT.
It also deploys a variety of export measures, many for environmental, public health, and intellectual property protection purposes. These include (i) export registration to ensure quality and food security but also to prevent or minimize price competition among exporters; (ii) export licensing to manage export quotas mostly linked to ‘voluntary’ implementation of bilateral agreements; (iii) export taxes for food security (that is, to keep domestic commodity prices lower than international prices). According to the latest Trade Policy Review (TPR) of Thailand by the WTO, a limited number of products, mostly unprocessed wood, are subject to export taxes, with applied rates of tax lower than the statutory maximums.
Many such measures are consistent with international obligations, but others (which favor domestic consumers or producers) harm the commercial interests of trading partners including those of other ASEAN countries.
Merchandise Trade Integration Outcomes E.
51. The list of merchandise trade outcome indicators to assess trade performance and integration could be long, given the availability of merchandise data disaggregated by product, trading partner, and export and import flows. This section shall first summarize the trends and patterns of a commonly used but often misguiding trade indicator and it will then turn to two other main indicators that are better suited to measure intra-regional integration. While intra-regional trade expansion is often due to a welfare-enhancing trade creation effect, it can also theoretically be due to a welfare-reducing trade diversion effect. Thus, this section will also analyse other dimensions of the region’s and member countries’ trade performance and
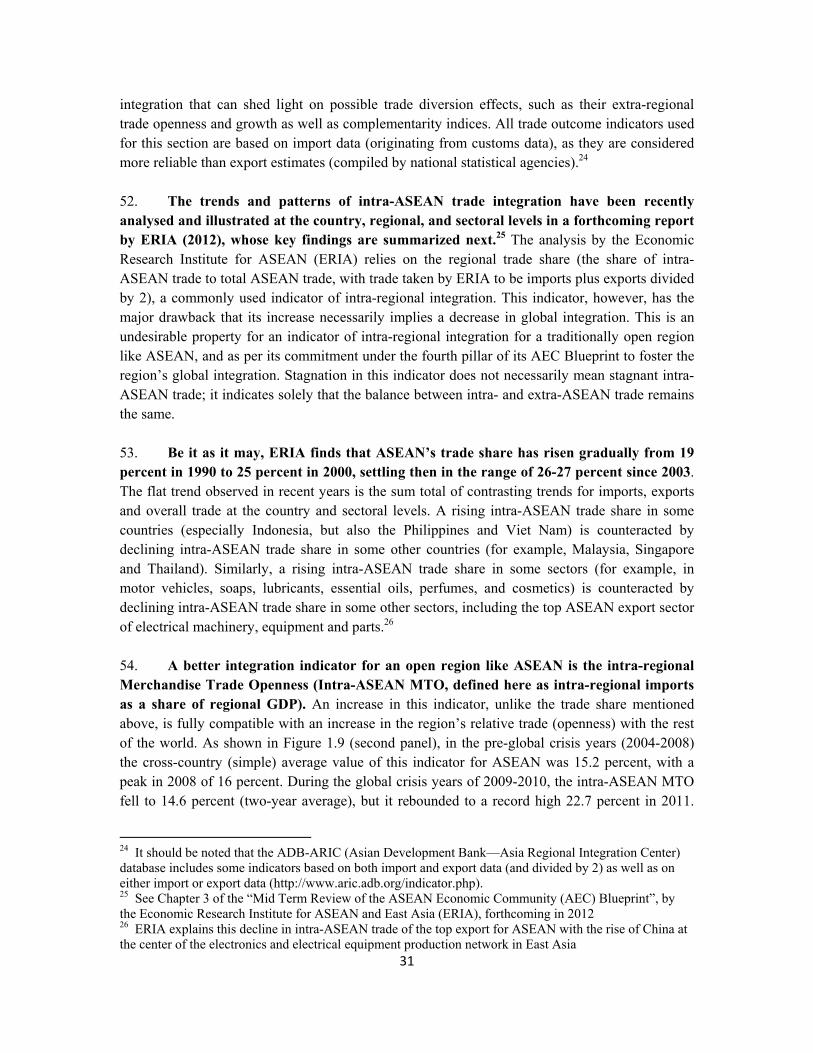
31
integration that can shed light on possible trade diversion effects, such as their extra-regional trade openness and growth as well as complementarity indices. All trade outcome indicators used for this section are based on import data (originating from customs data), as they are considered more reliable than export estimates (compiled by national statistical agencies).24 52. The trends and patterns of intra-ASEAN trade integration have been recently analysed and illustrated at the country, regional, and sectoral levels in a forthcoming report by ERIA (2012), whose key findings are summarized next.25 The analysis by the Economic Research Institute for ASEAN (ERIA) relies on the regional trade share (the share of intra-ASEAN trade to total ASEAN trade, with trade taken by ERIA to be imports plus exports divided by 2), a commonly used indicator of intra-regional integration. This indicator, however, has the major drawback that its increase necessarily implies a decrease in global integration. This is an undesirable property for an indicator of intra-regional integration for a traditionally open region like ASEAN, and as per its commitment under the fourth pillar of its AEC Blueprint to foster the region’s global integration. Stagnation in this indicator does not necessarily mean stagnant intra-ASEAN trade; it indicates solely that the balance between intra- and extra-ASEAN trade remains the same.
53. Be it as it may, ERIA finds that ASEAN’s trade share has risen gradually from 19 percent in 1990 to 25 percent in 2000, settling then in the range of 26-27 percent since 2003. The flat trend observed in recent years is the sum total of contrasting trends for imports, exports and overall trade at the country and sectoral levels. A rising intra-ASEAN trade share in some countries (especially Indonesia, but also the Philippines and Viet Nam) is counteracted by declining intra-ASEAN trade share in some other countries (for example, Malaysia, Singapore and Thailand). Similarly, a rising intra-ASEAN trade share in some sectors (for example, in motor vehicles, soaps, lubricants, essential oils, perfumes, and cosmetics) is counteracted by declining intra-ASEAN trade share in some other sectors, including the top ASEAN export sector of electrical machinery, equipment and parts.26
54. A better integration indicator for an open region like ASEAN is the intra-regional Merchandise Trade Openness (Intra-ASEAN MTO, defined here as intra-regional imports as a share of regional GDP). An increase in this indicator, unlike the trade share mentioned above, is fully compatible with an increase in the region’s relative trade (openness) with the rest of the world. As shown in Figure 1.9 (second panel), in the pre-global crisis years (2004-2008) the cross-country (simple) average value of this indicator for ASEAN was 15.2 percent, with a peak in 2008 of 16 percent. During the global crisis years of 2009-2010, the intra-ASEAN MTO fell to 14.6 percent (two-year average), but it rebounded to a record high 22.7 percent in 2011.
24 It should be noted that the ADB-ARIC (Asian Development Bank—Asia Regional Integration Center) database includes some indicators based on both import and export data (and divided by 2) as well as on either import or export data (http://www.aric.adb.org/indicator.php). 25 See Chapter 3 of the “Mid Term Review of the ASEAN Economic Community (AEC) Blueprint”, by the Economic Research Institute for ASEAN and East Asia (ERIA), forthcoming in 2012 26 ERIA explains this decline in intra-ASEAN trade of the top export for ASEAN with the rise of China at the center of the electronics and electrical equipment production network in East Asia
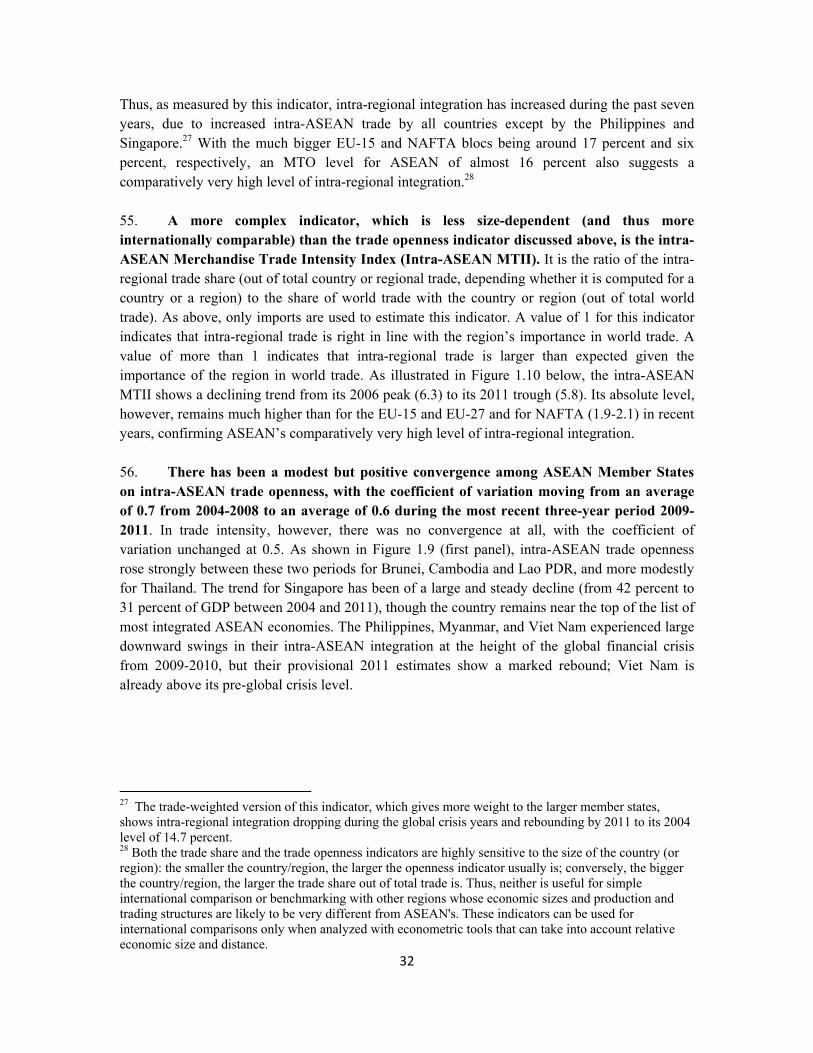
32
Thus, as measured by this indicator, intra-regional integration has increased during the past seven years, due to increased intra-ASEAN trade by all countries except by the Philippines and Singapore.27 With the much bigger EU-15 and NAFTA blocs being around 17 percent and six percent, respectively, an MTO level for ASEAN of almost 16 percent also suggests a comparatively very high level of intra-regional integration.28 55. A more complex indicator, which is less size-dependent (and thus more internationally comparable) than the trade openness indicator discussed above, is the intra-ASEAN Merchandise Trade Intensity Index (Intra-ASEAN MTII). It is the ratio of the intra-regional trade share (out of total country or regional trade, depending whether it is computed for a country or a region) to the share of world trade with the country or region (out of total world trade). As above, only imports are used to estimate this indicator. A value of 1 for this indicator indicates that intra-regional trade is right in line with the region’s importance in world trade. A value of more than 1 indicates that intra-regional trade is larger than expected given the importance of the region in world trade. As illustrated in Figure 1.10 below, the intra-ASEAN MTII shows a declining trend from its 2006 peak (6.3) to its 2011 trough (5.8). Its absolute level, however, remains much higher than for the EU-15 and EU-27 and for NAFTA (1.9-2.1) in recent years, confirming ASEAN’s comparatively very high level of intra-regional integration. 56. There has been a modest but positive convergence among ASEAN Member States on intra-ASEAN trade openness, with the coefficient of variation moving from an average of 0.7 from 2004-2008 to an average of 0.6 during the most recent three-year period 2009-2011. In trade intensity, however, there was no convergence at all, with the coefficient of variation unchanged at 0.5. As shown in Figure 1.9 (first panel), intra-ASEAN trade openness rose strongly between these two periods for Brunei, Cambodia and Lao PDR, and more modestly for Thailand. The trend for Singapore has been of a large and steady decline (from 42 percent to 31 percent of GDP between 2004 and 2011), though the country remains near the top of the list of most integrated ASEAN economies. The Philippines, Myanmar, and Viet Nam experienced large downward swings in their intra-ASEAN integration at the height of the global financial crisis from 2009-2010, but their provisional 2011 estimates show a marked rebound; Viet Nam is already above its pre-global crisis level.
27 The trade-weighted version of this indicator, which gives more weight to the larger member states, shows intra-regional integration dropping during the global crisis years and rebounding by 2011 to its 2004 level of 14.7 percent. 28 Both the trade share and the trade openness indicators are highly sensitive to the size of the country (or region): the smaller the country/region, the larger the openness indicator usually is; conversely, the bigger the country/region, the larger the trade share out of total trade is. Thus, neither is useful for simple international comparison or benchmarking with other regions whose economic sizes and production and trading structures are likely to be very different from ASEAN's. These indicators can be used for international comparisons only when analyzed with econometric tools that can take into account relative economic size and distance.
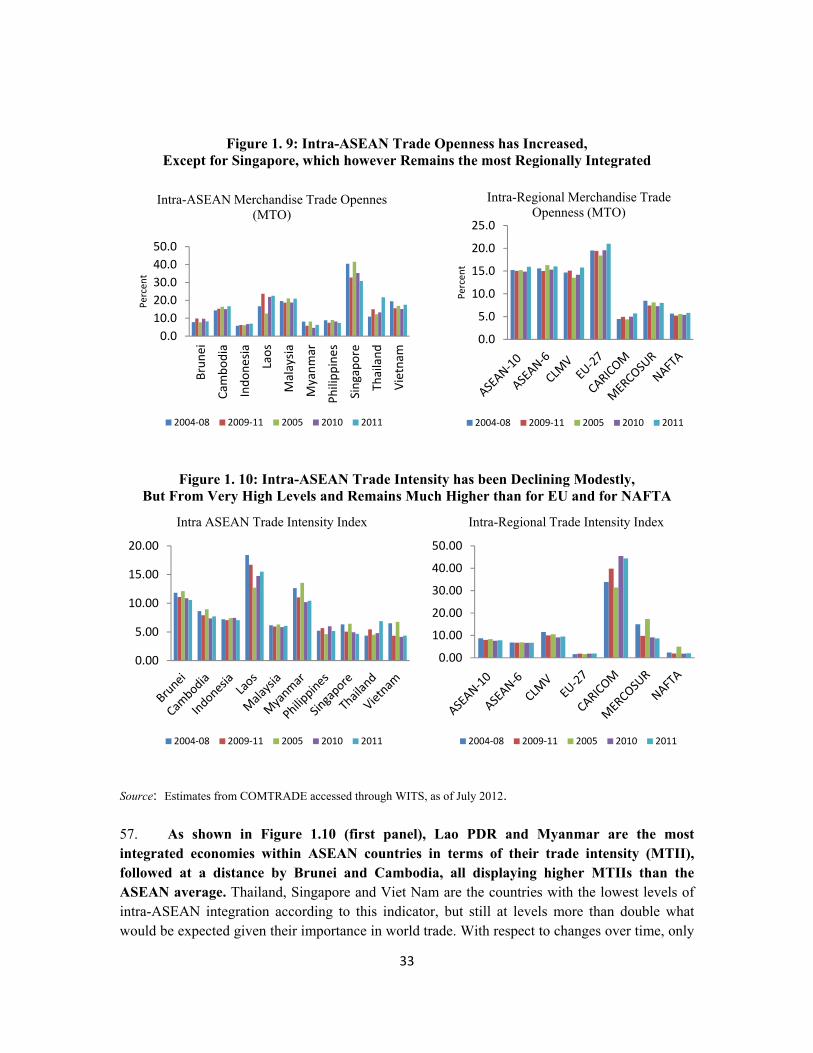
33
Figure 1. 9: Intra-ASEAN Trade Openness has Increased, Except for Singapore, which however Remains the most Regionally Integrated
Figure 1. 10: Intra-ASEAN Trade Intensity has been Declining Modestly, But From Very High Levels and Remains Much Higher than for EU and for NAFTA
Source: Estimates from COMTRADE accessed through WITS, as of July 2012. 57. As shown in Figure 1.10 (first panel), Lao PDR and Myanmar are the most integrated economies within ASEAN countries in terms of their trade intensity (MTII), followed at a distance by Brunei and Cambodia, all displaying higher MTIIs than the ASEAN average. Thailand, Singapore and Viet Nam are the countries with the lowest levels of intra-ASEAN integration according to this indicator, but still at levels more than double what would be expected given their importance in world trade. With respect to changes over time, only
0.010.020.030.040.050.0
Brun
ei
Cam
bodi
a
Indo
nesia
Laos
Mal
aysia
Mya
nmar
Phili
ppin
es
Sing
apor
e
Thai
land
Viet
nam
Perc
ent
Intra-ASEAN Merchandise Trade Opennes (MTO)
2004-08 2009-11 2005 2010 2011
0.0
5.0
10.0
15.0
20.0
25.0
Perc
ent
Intra-Regional Merchandise Trade Openness (MTO)
2004-08 2009-11 2005 2010 2011
0.00
5.00
10.00
15.00
20.00
Intra ASEAN Trade Intensity Index
2004-08 2009-11 2005 2010 2011
0.00
10.00
20.00
30.00
40.00
50.00
Intra-Regional Trade Intensity Index
2004-08 2009-11 2005 2010 2011
34
the Philippines and Thailand experienced rising intra-regional trade intensity, as all other countries showed varying degrees of decline between 2004 and 2011. 58. Figure 1.11 shows the evolution of ASEAN’s global (extra-ASEAN) merchandise trade since the mid-2000s. Overall, ASEAN’s extra-regional imports in 2009 contracted by more than 22 percent from their 2008 level, while ASEAN’s intra-regional total imports still managed to increase, though only by a modest four percent. The Philippines, Indonesia, Malaysia, and to a much lesser degree Singapore and Thailand, show absolute declines in 2009 in their imports from the rest of the world. The turnaround, however, has been quick and strong. Total trade by ASEAN between 2009 and 2011 has expanded by 56 percent, almost equally well balanced between exports and imports and between intra- and extra-ASEAN. The weakest total trade rebound at 33 percent was registered by Lao PDR (due to an actual drop in its intra-ASEAN exports and only a sluggish increase in imports from the rest of the region), and the strongest by Indonesia and Viet Nam with 79 percent and 62 percent, respectively.
Figure 1. 11: Global Openness has Increased for Some, Decreased for Other ASEAN Countries
Source: ASEAN stats, based on recorded imports by member states.
59. Taken together, the trends over the last seven years for intra-ASEAN trade share, trade openness indicators and trade growth rates, all point to a high degree of intra-regional merchandise trade integration within ASEAN, which is increasing at a faster pace than its GDP, though not faster than its trade with the rest of the world. They also paint a picture of a recent resumption of the historical expansion of ASEAN trade with the rest of the world.
0.00
20.00
40.00
60.00
80.00
100.00
120.00
140.00
Brunei Cambodia Indonesia Laos Malaysia Myanmar Philippines Singapore Thailand Vietnam
Perc
ent
Extra-ASEAN Merchandise Trade Openness (MTO)
2004-08 2009-11 2000 2005 2010 2011
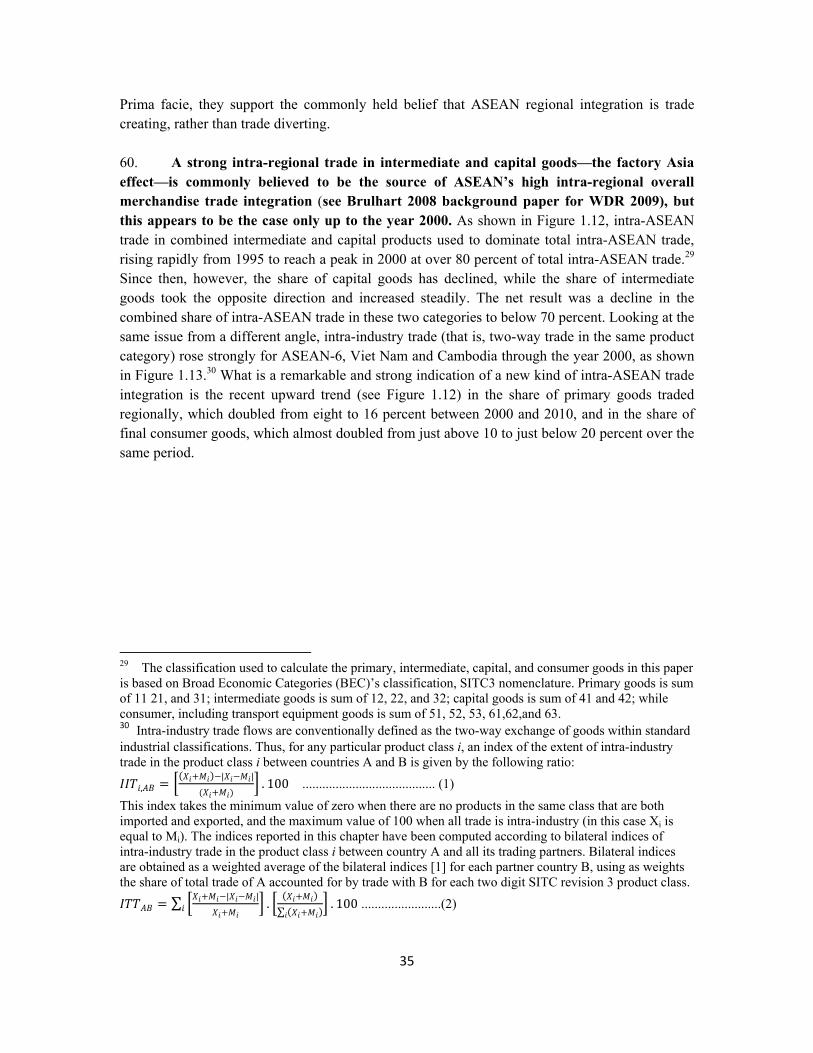
35
Prima facie, they support the commonly held belief that ASEAN regional integration is trade creating, rather than trade diverting. 60. A strong intra-regional trade in intermediate and capital goods—the factory Asia effect—is commonly believed to be the source of ASEAN’s high intra-regional overall merchandise trade integration (see Brulhart 2008 background paper for WDR 2009), but this appears to be the case only up to the year 2000. As shown in Figure 1.12, intra-ASEAN trade in combined intermediate and capital products used to dominate total intra-ASEAN trade, rising rapidly from 1995 to reach a peak in 2000 at over 80 percent of total intra-ASEAN trade.29 Since then, however, the share of capital goods has declined, while the share of intermediate goods took the opposite direction and increased steadily. The net result was a decline in the combined share of intra-ASEAN trade in these two categories to below 70 percent. Looking at the same issue from a different angle, intra-industry trade (that is, two-way trade in the same product category) rose strongly for ASEAN-6, Viet Nam and Cambodia through the year 2000, as shown in Figure 1.13.30 What is a remarkable and strong indication of a new kind of intra-ASEAN trade integration is the recent upward trend (see Figure 1.12) in the share of primary goods traded regionally, which doubled from eight to 16 percent between 2000 and 2010, and in the share of final consumer goods, which almost doubled from just above 10 to just below 20 percent over the same period.
29 The classification used to calculate the primary, intermediate, capital, and consumer goods in this paper is based on Broad Economic Categories (BEC)’s classification, SITC3 nomenclature. Primary goods is sum of 11 21, and 31; intermediate goods is sum of 12, 22, and 32; capital goods is sum of 41 and 42; while consumer, including transport equipment goods is sum of 51, 52, 53, 61,62,and 63. 30 Intra-industry trade flows are conventionally defined as the two-way exchange of goods within standard industrial classifications. Thus, for any particular product class i, an index of the extent of intra-industry trade in the product class i between countries A and B is given by the following ratio: , = ( + )−| − |( + ) . 100 ........................................ (1)
This index takes the minimum value of zero when there are no products in the same class that are both imported and exported, and the maximum value of 100 when all trade is intra-industry (in this case Xi is equal to Mi). The indices reported in this chapter have been computed according to bilateral indices of intra-industry trade in the product class i between country A and all its trading partners. Bilateral indices are obtained as a weighted average of the bilateral indices [1] for each partner country B, using as weights the share of total trade of A accounted for by trade with B for each two digit SITC revision 3 product class. = ∑ + −| − |+ . ( + )∑ ( + ) . 100 ........................(2)
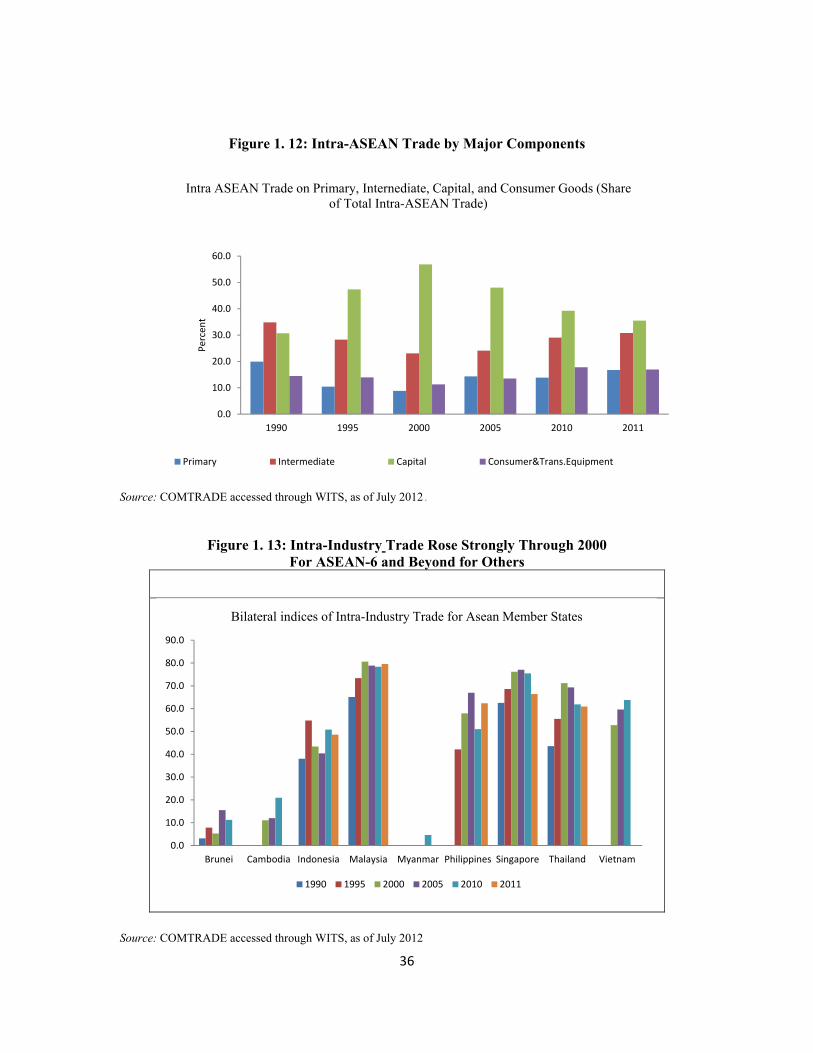
36
Figure 1. 12: Intra-ASEAN Trade by Major Components
Source: COMTRADE accessed through WITS, as of July 2012 .
Figure 1. 13: Intra-Industry Trade Rose Strongly Through 2000 For ASEAN-6 and Beyond for Others
Source: COMTRADE accessed through WITS, as of July 2012
0.0
10.0
20.0
30.0
40.0
50.0
60.0
1990 1995 2000 2005 2010 2011
Perc
ent
Intra ASEAN Trade on Primary, Internediate, Capital, and Consumer Goods (Share of Total Intra-ASEAN Trade)
Primary Intermediate Capital Consumer&Trans.Equipment
0.0
10.0
20.0
30.0
40.0
50.0
60.0
70.0
80.0
90.0
Brunei Cambodia Indonesia Malaysia Myanmar Philippines Singapore Thailand Vietnam
Bilateral indices of Intra-Industry Trade for Asean Member States
1990 1995 2000 2005 2010 2011
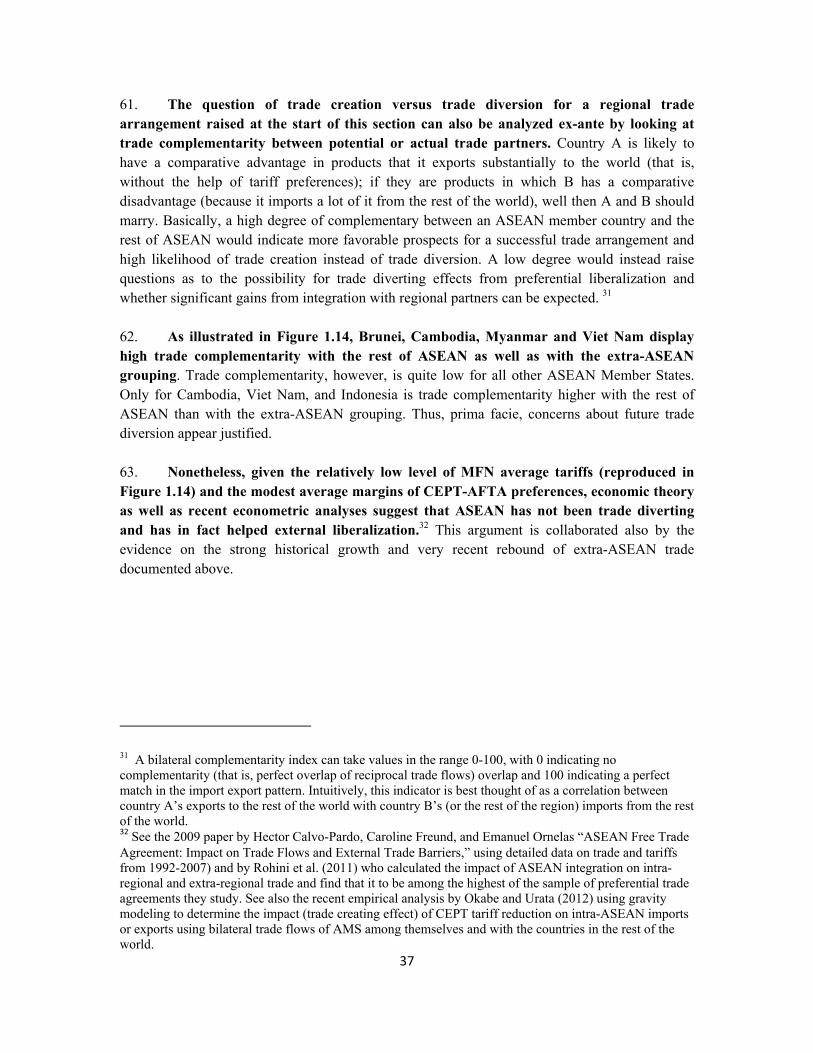
37
61. The question of trade creation versus trade diversion for a regional trade arrangement raised at the start of this section can also be analyzed ex-ante by looking at trade complementarity between potential or actual trade partners. Country A is likely to have a comparative advantage in products that it exports substantially to the world (that is, without the help of tariff preferences); if they are products in which B has a comparative disadvantage (because it imports a lot of it from the rest of the world), well then A and B should marry. Basically, a high degree of complementary between an ASEAN member country and the rest of ASEAN would indicate more favorable prospects for a successful trade arrangement and high likelihood of trade creation instead of trade diversion. A low degree would instead raise questions as to the possibility for trade diverting effects from preferential liberalization and whether significant gains from integration with regional partners can be expected. 31 62. As illustrated in Figure 1.14, Brunei, Cambodia, Myanmar and Viet Nam display high trade complementarity with the rest of ASEAN as well as with the extra-ASEAN grouping. Trade complementarity, however, is quite low for all other ASEAN Member States. Only for Cambodia, Viet Nam, and Indonesia is trade complementarity higher with the rest of ASEAN than with the extra-ASEAN grouping. Thus, prima facie, concerns about future trade diversion appear justified.
63. Nonetheless, given the relatively low level of MFN average tariffs (reproduced in Figure 1.14) and the modest average margins of CEPT-AFTA preferences, economic theory as well as recent econometric analyses suggest that ASEAN has not been trade diverting and has in fact helped external liberalization.32 This argument is collaborated also by the evidence on the strong historical growth and very recent rebound of extra-ASEAN trade documented above.
31 A bilateral complementarity index can take values in the range 0-100, with 0 indicating no complementarity (that is, perfect overlap of reciprocal trade flows) overlap and 100 indicating a perfect match in the import export pattern. Intuitively, this indicator is best thought of as a correlation between country A’s exports to the rest of the world with country B’s (or the rest of the region) imports from the rest of the world. 32 See the 2009 paper by Hector Calvo-Pardo, Caroline Freund, and Emanuel Ornelas “ASEAN Free Trade Agreement: Impact on Trade Flows and External Trade Barriers,” using detailed data on trade and tariffs from 1992-2007) and by Rohini et al. (2011) who calculated the impact of ASEAN integration on intra-regional and extra-regional trade and find that it to be among the highest of the sample of preferential trade agreements they study. See also the recent empirical analysis by Okabe and Urata (2012) using gravity modeling to determine the impact (trade creating effect) of CEPT tariff reduction on intra-ASEAN imports or exports using bilateral trade flows of AMS among themselves and with the countries in the rest of the world.
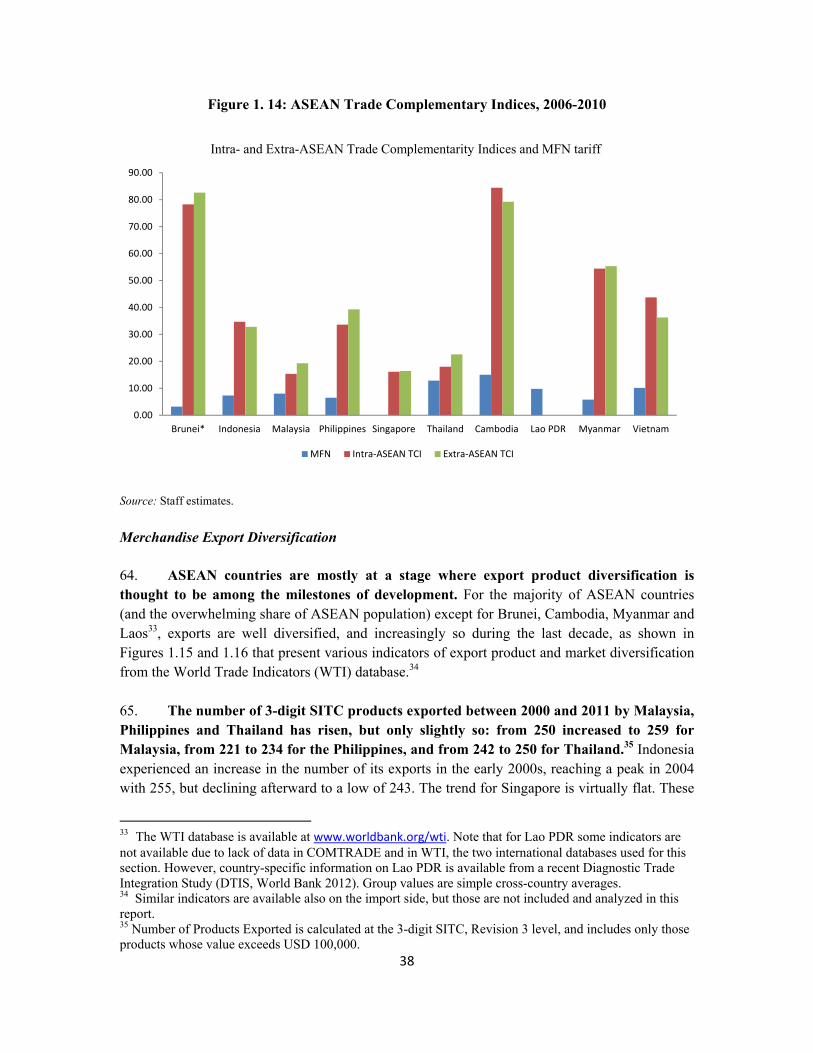
38
Figure 1. 14: ASEAN Trade Complementary Indices, 2006-2010
Source: Staff estimates.
Merchandise Export Diversification
64. ASEAN countries are mostly at a stage where export product diversification is thought to be among the milestones of development. For the majority of ASEAN countries (and the overwhelming share of ASEAN population) except for Brunei, Cambodia, Myanmar and Laos33, exports are well diversified, and increasingly so during the last decade, as shown in Figures 1.15 and 1.16 that present various indicators of export product and market diversification from the World Trade Indicators (WTI) database.34 65. The number of 3-digit SITC products exported between 2000 and 2011 by Malaysia, Philippines and Thailand has risen, but only slightly so: from 250 increased to 259 for Malaysia, from 221 to 234 for the Philippines, and from 242 to 250 for Thailand.35 Indonesia experienced an increase in the number of its exports in the early 2000s, reaching a peak in 2004 with 255, but declining afterward to a low of 243. The trend for Singapore is virtually flat. These
33 The WTI database is available at www.worldbank.org/wti. Note that for Lao PDR some indicators are not available due to lack of data in COMTRADE and in WTI, the two international databases used for this section. However, country-specific information on Lao PDR is available from a recent Diagnostic Trade Integration Study (DTIS, World Bank 2012). Group values are simple cross-country averages. 34 Similar indicators are available also on the import side, but those are not included and analyzed in this report. 35 Number of Products Exported is calculated at the 3-digit SITC, Revision 3 level, and includes only those products whose value exceeds USD 100,000.
0.00
10.00
20.00
30.00
40.00
50.00
60.00
70.00
80.00
90.00
Brunei* Indonesia Malaysia Philippines Singapore Thailand Cambodia Lao PDR Myanmar Vietnam
Intra- and Extra-ASEAN Trade Complementarity Indices and MFN tariff
MFN Intra-ASEAN TCI Extra-ASEAN TCI
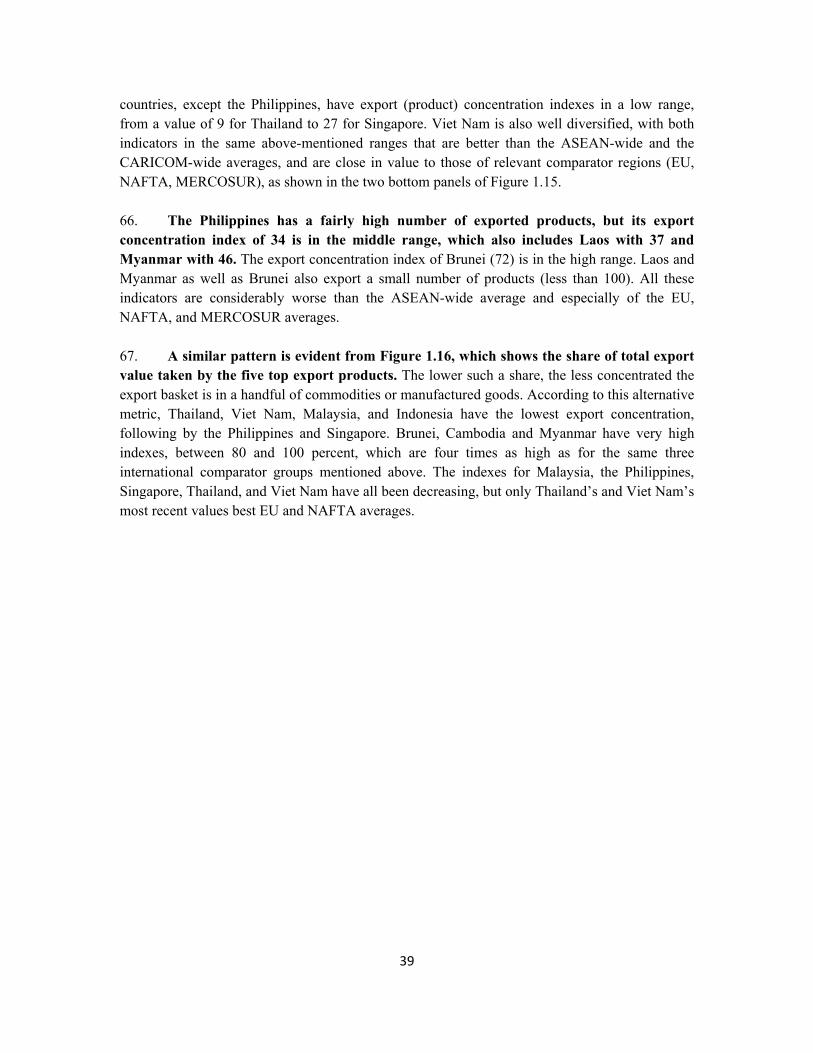
39
countries, except the Philippines, have export (product) concentration indexes in a low range, from a value of 9 for Thailand to 27 for Singapore. Viet Nam is also well diversified, with both indicators in the same above-mentioned ranges that are better than the ASEAN-wide and the CARICOM-wide averages, and are close in value to those of relevant comparator regions (EU, NAFTA, MERCOSUR), as shown in the two bottom panels of Figure 1.15.
66. The Philippines has a fairly high number of exported products, but its export concentration index of 34 is in the middle range, which also includes Laos with 37 and Myanmar with 46. The export concentration index of Brunei (72) is in the high range. Laos and Myanmar as well as Brunei also export a small number of products (less than 100). All these indicators are considerably worse than the ASEAN-wide average and especially of the EU, NAFTA, and MERCOSUR averages.
67. A similar pattern is evident from Figure 1.16, which shows the share of total export value taken by the five top export products. The lower such a share, the less concentrated the export basket is in a handful of commodities or manufactured goods. According to this alternative metric, Thailand, Viet Nam, Malaysia, and Indonesia have the lowest export concentration, following by the Philippines and Singapore. Brunei, Cambodia and Myanmar have very high indexes, between 80 and 100 percent, which are four times as high as for the same three international comparator groups mentioned above. The indexes for Malaysia, the Philippines, Singapore, Thailand, and Viet Nam have all been decreasing, but only Thailand’s and Viet Nam’s most recent values best EU and NAFTA averages.
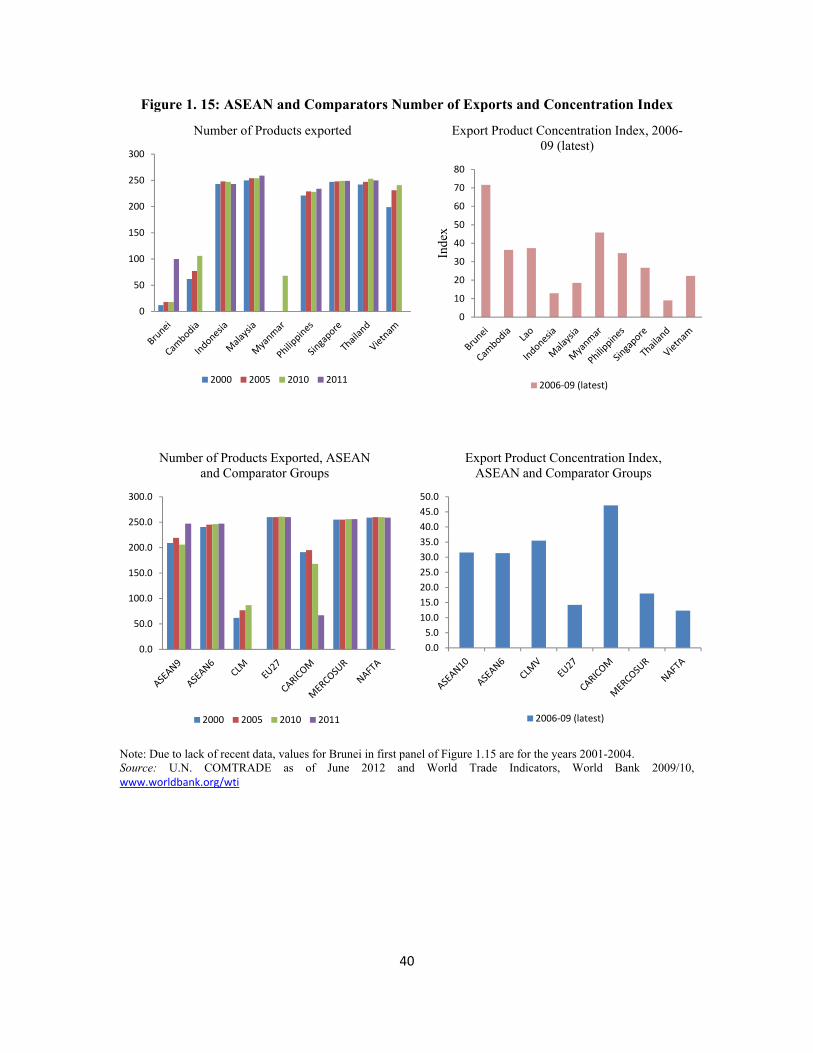
40
Figure 1. 15: ASEAN and Comparators Number of Exports and Concentration Index
Note: Due to lack of recent data, values for Brunei in first panel of Figure 1.15 are for the years 2001-2004. Source: U.N. COMTRADE as of June 2012 and World Trade Indicators, World Bank 2009/10, www.worldbank.org/wti
0
50
100
150
200
250
300
Number of Products exported
2000 2005 2010 2011
0
10
20
30
40
50
60
70
80
Inde
x
Export Product Concentration Index, 2006-09 (latest)
2006-09 (latest)
0.0
50.0
100.0
150.0
200.0
250.0
300.0
Number of Products Exported, ASEAN and Comparator Groups
2000 2005 2010 2011
0.05.0
10.015.020.025.030.035.040.045.050.0
Export Product Concentration Index, ASEAN and Comparator Groups
2006-09 (latest)
41
Figure 1. 16: ASEAN and Comparators’ Shares of Five Top Export Products
Source: U.N. Comtrade as of June 2012 and World Trade Indicators, World Bank 2009/10, www.worldbank.org/wti
68. In summary, only Indonesia is trending in the wrong direction according to two of the three product-related indicators discussed above, showing an increase in the value of this indicator (from 35 percent in 2000 to 46.2 percent in 2011) as well as a decrease in the number of exports (see above). Cambodia is also showing deterioration (increase) in the share of five top exports. Brunei, Cambodia, Lao PDR and Myanmar also suffer from a low relative export diversification.
Conclusion and Policy Implications F.
69. ASEAN has largely achieved its goal of eliminating tariffs on intra-ASEAN merchandise trade by 2010 for the ASEAN-6 countries, and remains on track for achieving by 2015 the goal for the CLMV countries (with flexibility until 2018). Nonetheless, in order to achieve full tariff elimination as per the agreed 2015 deadline for the ASEAN Economic Community, CLMV countries could consider accelerating the implementation of their intra-ASEAN preferential tariffs reduction commitments. This would help them attain the high share (above 99 percent) of tariff lines with a 0 percent duty on intra-ASEAN imports. 70. Import duties are an important source of tax revenue (excluding grants) in CLMV countries, representing 19.8, 10.3, and 24.2 percent in 2009 for Cambodia, Lao PDR, and Viet Nam, respectively. For Lao PDR, simulations of the impact of ASEAN Free Trade Area (AFTA) commitments in a recent Diagnostic Trade Integration Study (DTIS, World Bank 2012) point to a sharp drop in tariff revenue and tax revenue, 76.3 percent and 25.1 percent respectively despite an increase in imports by 2.4 percent. Large-scale elimination of tariffs by Lao PDR also vis-à-vis ASEAN+1 partners implies only slightly higher increases in imports, but larger decreases in tariff and tax revenues and significant trade diversion away from non-preferential trading partners. Whether CLMV countries accelerate their preferential tariffs elimination
0.00
20.00
40.00
60.00
80.00
100.00
120.00
Perc
ent
Top 5 Exports (value as share of total export)
2000 2005 2010 2011
0.00
10.00
20.00
30.00
40.00
50.00
60.00
70.00
80.00
Per
cen
t
Top 5 Exports (value as share of total export)
2000 2005 2010 2011
42
timetable, as recommended above, or stick to the agreed 2018 deadline, they will need to shift to other forms of indirect taxation to make up the inevitable tariff revenue loss.
71. Regarding the low intra-ASEAN preference utilization, especially for some countries, there may not be much mileage to be gained from addressing the already liberal ROO. Neither can many gains be expected from further simplification of documentary requirements and bureaucratic procedures at the border, which have already been scaled up from pilot projects in a few countries to all ASEAN Member States. With preference margins already at modest levels and further preference erosion to be expected, ASEAN Member States will likely move further on MFN tariff and peak reduction. A targeted technical assistance and information campaign to reach importers and exporters of those goods with still sizeable preference margins and in those countries with utilization rates around or below 20 percent might, however, help increase preference utilization, not only for ATIGA but also for other bilateral or unilateral preferential trade arrangements.
72. With regard to NTMs, ASEAN should recognize that some of its commercial interests have been caught up in the global protectionist impulse since the onset of the global economic crisis. Given that the region’s prosperity depends in large part on successfully selling abroad and that, with the growing prevalence of international supply chains, own protectionism frequently harms domestic export competitiveness, ASEAN governments should resist the pressure to restrict commerce abroad as well as at home. As a matter of priority, ad-hoc trade-restrictive measures introduced since the start of the financial crisis (2008), and especially those affecting other ASEAN countries, should be rolled back and no new ones introduced. 73. ASEAN should also recognize, in light of the discussion in Section C, that the wholesale elimination of all NTBs (those officially identified by each ASEAN country as well as the barrier elements of all other NTMs) is not a realistic medium-term goal, even if limited to ‘core’ trade restrictive measures. ASEAN needs instead to recognize explicitly the complexity and diversity of NTMs and adopt a goal of streamlining rather than eliminating them. Taking into account the implied recommendations contained in Box 1 and those already put forward by Cambodia, the current ASEAN Chair, a promising medium-term action agenda to start streamlining NTMs would include the following:
(i) Improve the classification of NTMs, according to the UNCTAD guidelines adopted in February 2012.
(ii) Update and verify country lists in an open process driven by the ASEAN Secretariat, rather than on a voluntary basis by individual member states.
(iii) Eliminate with only few exceptions all quantity control measures, comprising non-automatic licensing, import and export quotas and prohibitions, and all foreign
43
exchange at least for intra-ASEAN trade though it may not be possible or practical to police such limitation.36
(iv) Identify the other most egregious trade-restrictive measures, with help not only from the private sector, as foreseen in article 42 of ATIGA, but also with sectoral regulatory impact assessments to be launched urgently.
(v) Decide in ASEAN bodies on the regulatory modifications at the national level as well as regional harmonization actions necessary to eliminate or minimize the trade-restrictive impact of the measures identified as per point (iii) above.
(vi) Report publicly on the decisions taken and their justification. (vii) Plan an in-depth regional study of NTMs, possibly under Phase II of the AECMEP
collaborative project between the ASEAN Secretariat and the World Bank.
74. Taken together, the trends over the last seven years for intra-ASEAN trade share, the intra- and extra-ASEAN trade openness, nominal trade growth rates, and intra-ASEAN trade intensity all point to a high degree of intra-regional merchandise trade integration within ASEAN. This integration is increasing at a faster pace than the region’s GDP, though not faster than its trade with the rest of the world. They also paint a picture of a recent resumption of the historical expansion of ASEAN trade with the rest of the world. These developments suggest that ASEAN is a force for trade creation rather than trade diversion. To make further progress in ASEAN’s intra-regional and global integration and export diversification goals, ASEAN and their member states need to look at at-the-border and beyond-the-border reforms in trade facilitation, in services trade, and in foreign direct investment regulations and promotion. These key issues are discussed in the next chapters of the report.
36 Myanmar, the only ASEAN Member State with foreign exchange controls, should also eliminate such restrictions. It is indeed expected to do so in the very near future, as foreign trade and financial sanctions are being lifted. The Central Bank of Myanmar (CBM) introduced an exchange rate system in the form of the official peg with a managed float unifying the exchange rates with assistance from the International Monetary Fund. Accordingly, the CBM began a managed float system on April 1, 2012 dismantling the existing multiple exchange rate system. New currency regime was commenced on April 2, 2012 by setting a daily reference exchange rate of Myanmar Kyat to the dollar by the CBM in line with its value on the market rate as announced at www.cbm.gob.mm.

44
Chapter 2: Trade Facilitation and Logistics
A. Key Findings
1. A strong emphasis on the facilitation of trade flows. The AEC Blueprint has rightly identified trade facilitation as an essential piece of international trade integration. Customs reform through simplification, harmonization and modernization of procedures is the centerpiece of these efforts, but trade facilitation overlaps to a large extent with ASEAN’s agendas covering non-tariff measures and services. The ASEAN agenda is ambitious, with the objective of strong integration of national customs systems through the ASEAN single window and ASEAN e-customs. The adoption of some high-level international standards, such as preconized by the revised Kyoto Convention is also on the agenda, although not all modern customs management elements are present. This is in keeping with the gradual approach favored by ASEAN, but also recognizing that all ASEAN members are not on the same level of advancement. However, strong progress has been registered, with the CLMV adopting important harmonization and modernization steps. Importantly, many of the policy and administrative changes required to improve trade facilitation can be undertaken by individual AMS acting unilaterally, which means that there is real scope for countries to undertake reforms at different rates, starting from different baselines, and for catch up to occur over time.
2. The ASEAN trade facilitation agenda is not only about customs reform. Facilitation is also about ensuring that implementation of product standards and phytosanitary measures, and the provision of transport and logistics services do not unduly impede trade. The streamlining of standards is an area that while clearly identified has recorded modest and limited progress. It should become a focus of future work with emphasis on sectoral approach and results, starting with transparency. In its identification of logistics services as a key component, ASEAN is a precursor.
3. In the area of transport, progress has been uneven. In the air transport sector there has been very good progress and good growth of the air transport industry, but the slow implementation of the multilateral agreements by some AMS has impeded rapid progress towards the ASEAN open sky regime, which is scheduled to be achieved by 2015. Not very much has been achieved in the maritime sector on the other hand, and this translates to poor connectivity for several ASEAN members, and very likely a lack of trade facilitation.
4. This overall progress in facilitating trade is reflected in key international indicators. Both Doing Business and Logistics Performance Index indicators show that the region is a strong performer compared to other regions of the world and that it has demonstrated measurable progress over the past five years. ASEAN as a group can also benefit from the experience of Singapore, the leading world performer. However, the indicators also show areas in need of improvement: ASEAN does not perform as well as Australia, China, India, Japan, New Zealand, and South Korea on average (hereinafter ‘+6 countries’), and there is a wide disparity of performance within ASEAN with three of the CLMV countries lagging. Finally, performance on
45
customs and infrastructure is relatively weaker. This is well acknowledged by the AEC Blueprint where these two sectors are prioritized.
5. Trade costs have been falling, especially for intra-regional trade. A new and all-inclusive measure of trade costs shows that these costs have been falling among ASEAN members, more rapidly than with the rest of the world, a possible sign of the effect of ASEAN integration and of some measure of regional preferences at work beyond just tariffs. Trade costs with the rest of the world have fallen too, in particular for two of the CLMV countries, Cambodia and Viet Nam, for which a measure is available. While for other ASEAN members costs have remained relatively more stagnant in the last decade, they are fairly low by international standards. A source of concern for some AMS, however, is that the +6 countries are even more cost competitive, thus showing the need for further progress.
A. Introduction: ASEAN Priorities in Trade Facilitation
6. Trade facilitation is one of the key goals of the AEC Blueprint. The AEC work program on trade facilitation focuses on harmonizing, simplifying and modernizing trade and customs processes and customs integration, the development of the ASEAN single window, and on Standards and Conformance. The concept of trade facilitation is, however, used differently in different contexts. At the WTO, for example, it essentially refers to the simplification of customs and border procedures. For the Asia-Pacific Economic Cooperation (APEC) economies, by contrast, trade facilitation has come to mean any policy measure that reduces the transaction costs associated with international trade. The second meaning is much broader than the first one, and presents a number of advantages for assessing country performance. In addition, it highlights the connections between ASEAN’s core trade facilitation agenda and its activities in areas such as non-tariff measures and services. The Roadmap for the Integration of Logistics Services, for example, makes it clear that the work programs in these areas have many important synergies.
7. ASEAN’s emphasis in the trade facilitation section of the AEC Blueprint focuses largely on customs, border procedures and standards—and particularly the ASEAN Single Window. However, this chapter takes a broader approach that includes the full range of trade costs impacting exporters and importers, including in particular logistics performance and transport connectivity, all of which are also an important part of the AEC Blueprint.
8. One reason for doing so is that such an approach is consistent with the overall aim of this report to focus on actual trade integration outcomes and all policies to support those outcomes, instead of focusing on compliance with specific AEC Blueprint targets. Another reason for such an approach is that some of these areas are included in other important ASEAN initiatives: for instance logistics in the context of services liberalization and transport. This is particularly important given that more than half of intra-ASEAN trade is dominated by trade in parts and components and intermediate goods, which are particularly sensitive to logistics performance. A third reason is because the trade facilitation agenda as described in this chapter is linked to the broader ASEAN economic integration agenda, in which policies dealing with sectors such as logistics and transport are key components. Broad-sense trade facilitation, which can be
46
understood as the endeavor to reduce international trade transaction costs that are affected by government policies, is necessarily one of the central pillars of goods market integration in the region, and this chapter aims to assess progress both in terms of policy initiatives and impacts on the ground, as measured by internationally comparable data.
9. ASEAN countries have already achieved significant gains in trade facilitation and driving down trade costs as discussed later (see Annex to this chapter). While there have been improvements in all ASEAN countries, there are, however, very large differences in trade facilitation outcomes among the member states. Other studies on ASEAN (Shepherd and Wilson, 2009) also show that the region stands to make significant economic gains from trade facilitation and that these gains could even be considerably larger than those from comparable tariff reductions. Moreover, the gains from reform come largely from improvements at home—in many cases, they can be harvested unilaterally, without waiting for trading partners to reach exactly the same stage of preparation. In line with the broad definition of trade facilitation, a comprehensive reform program would need to cover areas as diverse as transport infrastructure, services sector regulation, and customs administration. Of these, trade flows in ASEAN are particularly sensitive to improvements in transport infrastructure and information and communications technology (ICT). The Annex to this chapter shows that trade costs in ASEAN—which are one driver of trade flows—are highly sensitive to air connectivity and logistics performance. This result lines up well with the research suggesting that trade facilitation has a larger impact on certain types of trade, such as parts and components that are used by transnational production networks (Saslavsky and Shepherd, 2012). This is because such networks are based on the idea of efficient cross-border sourcing of selected inputs, and this is an area where trade facilitation reforms can impact directly.
10. This chapter is organized in the following way: the next section, B, discusses progress in achieving AEC goals. Section C looks at one of the key outcomes of trade facilitation policies, trade costs in ASEAN countries. This discussion uses a new and comprehensive measure of aggregate trade costs. Section D continues the discussion on trade facilitation performance by looking at other important outcome indicators. Section F discusses policy issues and implications.
ASEAN Priorities in Trade Facilitation
11. To achieve an ASEAN single market and production base, as envisaged under the AEC Blueprint, five core elements are required. One is free flow of goods, which involves elimination of tariffs and non-tariff measures, as well as reforms in the areas of rules of origin, trade facilitation, and standards and conformance. The free flow of goods can be accelerated through effective trade facilitation in order to reduce trade transaction costs in ASEAN. This will enhance export competitiveness, and facilitate the integration of ASEAN into a single market for goods, services, and investments, including a single production base.
12. AMS have given a high priority to trade facilitation, as clearly emphasized in the AEC Blueprint. Several actions have been planned in order to reduce trade transaction
47
costs in ASEAN. These include assessing trade facilitation conditions in ASEAN before developing and implementing a comprehensive trade facilitation work program. The work program fundamentally aims at simplifying, harmonizing, and standardizing trade and customs processes, procedures, and related information flows. In addition, rationalization of non-tariff measures and liberalization of backbone services markets such as transport and logistics—both of which are dealt with separately in the AEC Blueprint—can also contribute to lowering trade costs. The trade facilitation section of the AEC Blueprint establishes mechanisms promoting the transparency and visibility of regulations affecting trade. A regional trade facilitation cooperation mechanism and an ASEAN Trade Repository (ATR) will be established (Box 2.1). Also, a comprehensive capacity building program to ensure smooth implementation of the work program will be developed. Finally, the AEC Blueprint aims to achieve customs integration within the region, together with further development of the ASEAN Single Window (ASW). Importantly, ASW requires the establishment of a National Single Window (NSW) in each AMS (Box 2.2).
Box 2. 1: The ASEAN Framework for Trade Facilitation
B. Progress in Achieving AEC Goals
Good but uneven progress in achieving most of the Trade Facilitation goals
13. At the 24th AFTA Council in 2010, the Comprehensive Trade Facilitation Work Program was endorsed with the purpose of simplifying, harmonizing, and standardizing trade and customs processes, procedures, and related information flows. Subsequently,
The priority action of the Trade Facilitation Work Program for 2008/09 of the Strategic Schedule for AEC is to establish a Regional Trade Facilitation mechanism and establish the ASEAN Trade Facilitation Repository.
The ASEAN Trade Facilitation Joint Consultative Committee (ATF-JCC) was established and the first meeting was convened from July 7-8, 2010 in Thailand. The ATF-JCC aims at strengthening cooperation to promote efficient trade among AMS through trade facilitation reforms and measures. The ATF-JCC serves as a focal point and forum and creates a dialog among national facilitation bodies at the regional level. This forum promotes coordinating and collaborating policies, recommendations, action plans, and the implementation of trade.
AMS have done an assessment of trade facilitation. However, there has been slow progress after the suspension of the ATF-JCC by Senior Economic Officials’ Meetings (SEOM) 3/42 in 2011.
Article 13 of the draft ATIGA stipulates that an ASEAN Trade Repository (ATR) shall be established and made accessible to the public through the internet. ATR shall contain trade related information such as: (i) tariff nomenclature; (ii) MFN tariffs, preferential tariffs offered under this Agreement and other Agreements of ASEAN with its Dialogue Partners; (iii) Rules of Origin; (iv) non-tariff measures; (v) national trade and customs laws and rules; (vi) procedures and documentary requirements; (vii) administrative rulings; (viii) best practices in trade facilitation applied by each member state; and (ix) list of authorized traders of member states.
Source: ASEC
48
ASEAN has developed a Work Program for the 2009-2015 period. ASEAN’s progress in core areas is reviewed below.
Governance of reforms, monitoring and transparency
14. Trade facilitation initiatives that have already been adopted include the establishment of national coordinating committees on trade facilitation and national focal points in each member state. For sanitary and phytosanitary measures (SPS), a coordinating group on SPS has been established in the framework of the AFTA Council. These two approaches to governance reflect the fact that some trade facilitation reforms, such as streamlining of border processes, can be implemented unilaterally, but others are properly the subject of regional cooperation and agreement, as is the case for harmonization of standards, including SPS measures.
15. In terms of improving the transparency of trade, ASEAN is working towards the establishment of ATR by 2015, in line with the timeline for realization of the AEC. The ATR will serve as a gateway for regulatory information at regional and national levels. It will carry information on tariff nomenclature, preferential tariffs offered under the ATIGA, rules of origin, non-tariff measures, national trade and customs laws and regulations, documentary requirements, best practices in trade facilitation, and lists of authorized traders of the AMS. The idea is to provide accessible information sources via the internet where countries and organizations can post trade documents and related guidelines for members of the public—exporters, importers, traders, and government agencies—to use as a source of regional trade-related information. Currently, ASEAN is developing the technical design and mechanism of the ATR. In doing so, stock-taking on information at national level needs to be done, because all ASEAN Customs agencies have their websites established, but with different contents, formats, timeliness of information, and accessibility. As this information regarding trade facilitation may already be included in NSWs (see paragraph 12 above and Box 2.2 below), a review may be needed.
16. Monitoring at country level was foreseen with the trade facilitation assessment of member states every two years. This has yet to be delivered as noted in the Scorecard report of July 2012. The ASEAN Trade Facilitation Assessment Framework and Indicators, developed and subsequently endorsed by the ASEAN Free Trade Area (AFTA) Council as guidelines for AMS to assess trade facilitation progress in the region every two years, have been suspended since 2011.
Customs Reforms
17. A chief focus of trade facilitation reform has been in the area of customs. Efforts are being directed at removing barriers to trade at customs points mainly through the simplification and harmonization of customs procedures and modernization. More specifically, AMS have undertaken the following measures:
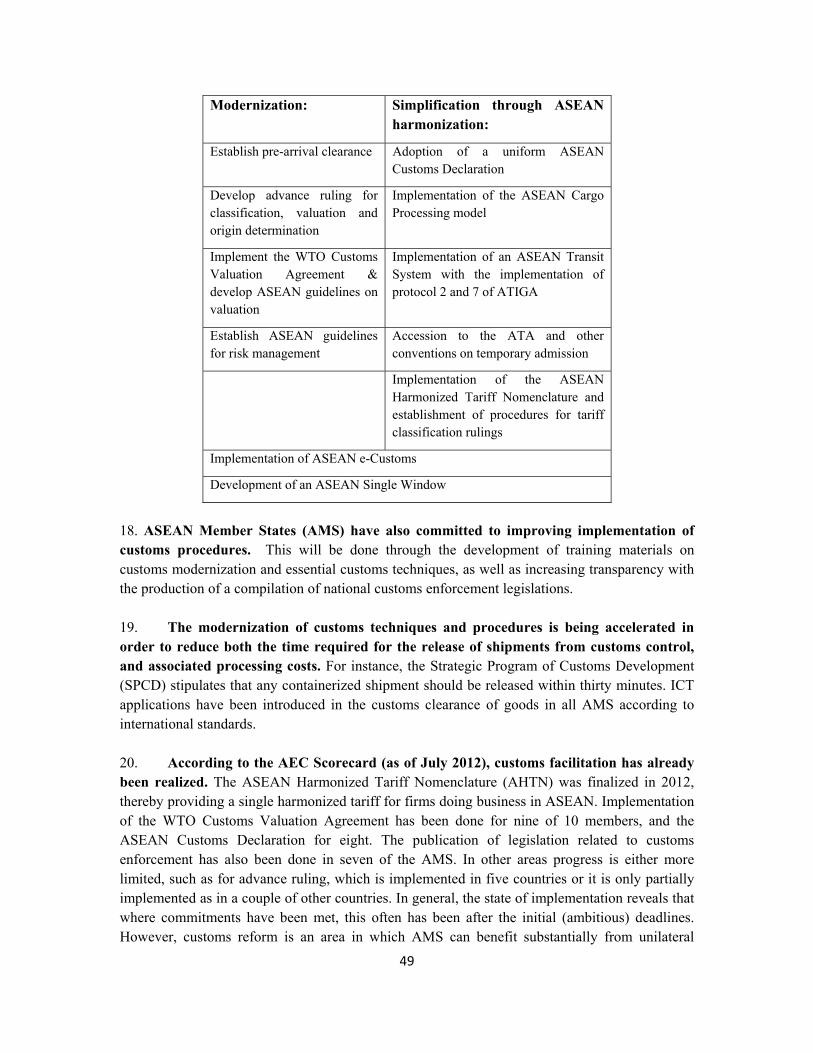
49
Modernization: Simplification through ASEAN harmonization:
Establish pre-arrival clearance Adoption of a uniform ASEAN Customs Declaration
Develop advance ruling for classification, valuation and origin determination
Implementation of the ASEAN Cargo Processing model
Implement the WTO Customs Valuation Agreement & develop ASEAN guidelines on valuation
Implementation of an ASEAN Transit System with the implementation of protocol 2 and 7 of ATIGA
Establish ASEAN guidelines for risk management
Accession to the ATA and other conventions on temporary admission
Implementation of the ASEAN Harmonized Tariff Nomenclature and establishment of procedures for tariff classification rulings
Implementation of ASEAN e-Customs
Development of an ASEAN Single Window
18. ASEAN Member States (AMS) have also committed to improving implementation of customs procedures. This will be done through the development of training materials on customs modernization and essential customs techniques, as well as increasing transparency with the production of a compilation of national customs enforcement legislations.
19. The modernization of customs techniques and procedures is being accelerated in order to reduce both the time required for the release of shipments from customs control, and associated processing costs. For instance, the Strategic Program of Customs Development (SPCD) stipulates that any containerized shipment should be released within thirty minutes. ICT applications have been introduced in the customs clearance of goods in all AMS according to international standards.
20. According to the AEC Scorecard (as of July 2012), customs facilitation has already been realized. The ASEAN Harmonized Tariff Nomenclature (AHTN) was finalized in 2012, thereby providing a single harmonized tariff for firms doing business in ASEAN. Implementation of the WTO Customs Valuation Agreement has been done for nine of 10 members, and the ASEAN Customs Declaration for eight. The publication of legislation related to customs enforcement has also been done in seven of the AMS. In other areas progress is either more limited, such as for advance ruling, which is implemented in five countries or it is only partially implemented as in a couple of other countries. In general, the state of implementation reveals that where commitments have been met, this often has been after the initial (ambitious) deadlines. However, customs reform is an area in which AMS can benefit substantially from unilateral
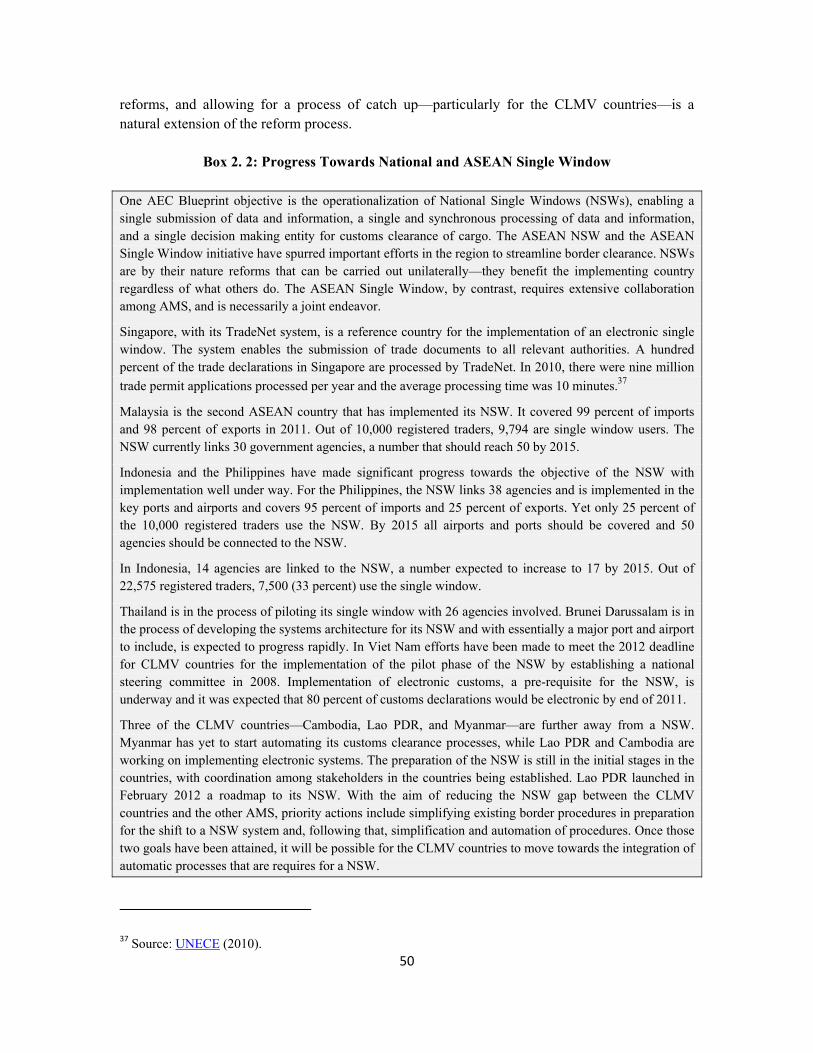
50
reforms, and allowing for a process of catch up—particularly for the CLMV countries—is a natural extension of the reform process.
Box 2. 2: Progress Towards National and ASEAN Single Window
One AEC Blueprint objective is the operationalization of National Single Windows (NSWs), enabling a single submission of data and information, a single and synchronous processing of data and information, and a single decision making entity for customs clearance of cargo. The ASEAN NSW and the ASEAN Single Window initiative have spurred important efforts in the region to streamline border clearance. NSWs are by their nature reforms that can be carried out unilaterally—they benefit the implementing country regardless of what others do. The ASEAN Single Window, by contrast, requires extensive collaboration among AMS, and is necessarily a joint endeavor.
Singapore, with its TradeNet system, is a reference country for the implementation of an electronic single window. The system enables the submission of trade documents to all relevant authorities. A hundred percent of the trade declarations in Singapore are processed by TradeNet. In 2010, there were nine million
trade permit applications processed per year and the average processing time was 10 minutes.37
Malaysia is the second ASEAN country that has implemented its NSW. It covered 99 percent of imports and 98 percent of exports in 2011. Out of 10,000 registered traders, 9,794 are single window users. The NSW currently links 30 government agencies, a number that should reach 50 by 2015.
Indonesia and the Philippines have made significant progress towards the objective of the NSW with implementation well under way. For the Philippines, the NSW links 38 agencies and is implemented in the key ports and airports and covers 95 percent of imports and 25 percent of exports. Yet only 25 percent of the 10,000 registered traders use the NSW. By 2015 all airports and ports should be covered and 50 agencies should be connected to the NSW.
In Indonesia, 14 agencies are linked to the NSW, a number expected to increase to 17 by 2015. Out of 22,575 registered traders, 7,500 (33 percent) use the single window.
Thailand is in the process of piloting its single window with 26 agencies involved. Brunei Darussalam is in the process of developing the systems architecture for its NSW and with essentially a major port and airport to include, is expected to progress rapidly. In Viet Nam efforts have been made to meet the 2012 deadline for CLMV countries for the implementation of the pilot phase of the NSW by establishing a national steering committee in 2008. Implementation of electronic customs, a pre-requisite for the NSW, is underway and it was expected that 80 percent of customs declarations would be electronic by end of 2011.
Three of the CLMV countries—Cambodia, Lao PDR, and Myanmar—are further away from a NSW. Myanmar has yet to start automating its customs clearance processes, while Lao PDR and Cambodia are working on implementing electronic systems. The preparation of the NSW is still in the initial stages in the countries, with coordination among stakeholders in the countries being established. Lao PDR launched in February 2012 a roadmap to its NSW. With the aim of reducing the NSW gap between the CLMV countries and the other AMS, priority actions include simplifying existing border procedures in preparation for the shift to a NSW system and, following that, simplification and automation of procedures. Once those two goals have been attained, it will be possible for the CLMV countries to move towards the integration of automatic processes that are requires for a NSW.
37 Source: UNECE (2010).
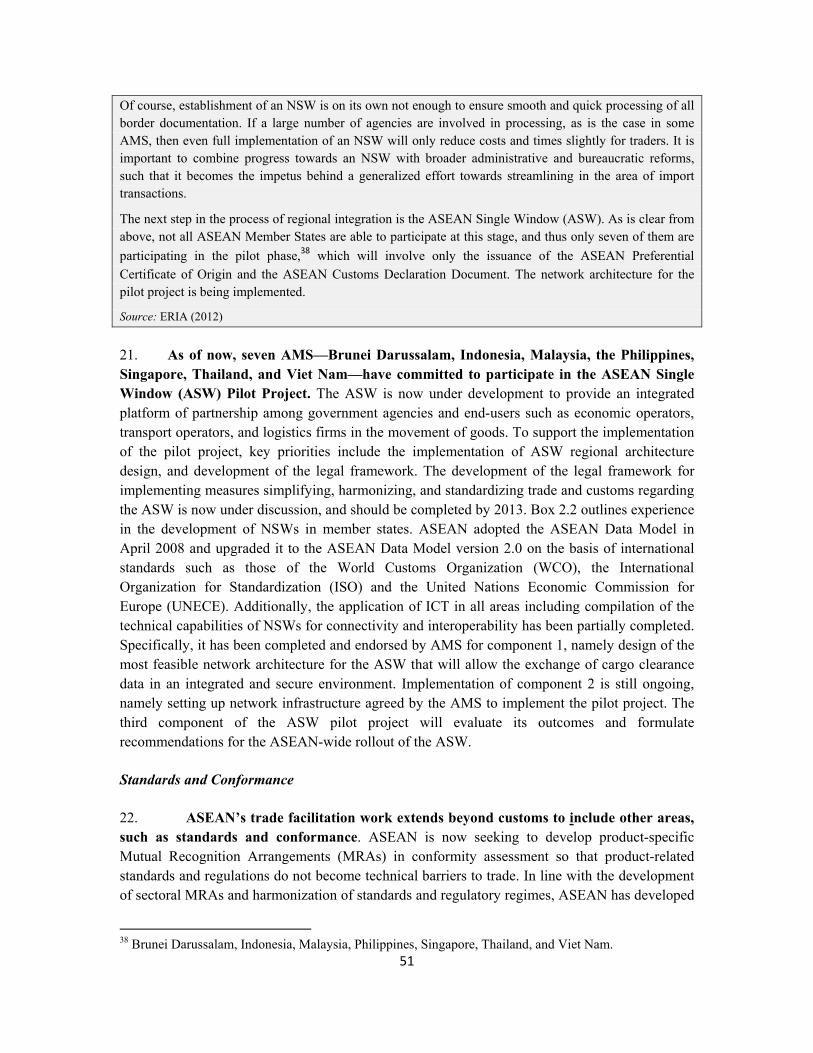
51
Of course, establishment of an NSW is on its own not enough to ensure smooth and quick processing of all border documentation. If a large number of agencies are involved in processing, as is the case in some AMS, then even full implementation of an NSW will only reduce costs and times slightly for traders. It is important to combine progress towards an NSW with broader administrative and bureaucratic reforms, such that it becomes the impetus behind a generalized effort towards streamlining in the area of import transactions.
The next step in the process of regional integration is the ASEAN Single Window (ASW). As is clear from above, not all ASEAN Member States are able to participate at this stage, and thus only seven of them are
participating in the pilot phase,38 which will involve only the issuance of the ASEAN Preferential
Certificate of Origin and the ASEAN Customs Declaration Document. The network architecture for the pilot project is being implemented.
Source: ERIA (2012)
21. As of now, seven AMS—Brunei Darussalam, Indonesia, Malaysia, the Philippines, Singapore, Thailand, and Viet Nam—have committed to participate in the ASEAN Single Window (ASW) Pilot Project. The ASW is now under development to provide an integrated platform of partnership among government agencies and end-users such as economic operators, transport operators, and logistics firms in the movement of goods. To support the implementation of the pilot project, key priorities include the implementation of ASW regional architecture design, and development of the legal framework. The development of the legal framework for implementing measures simplifying, harmonizing, and standardizing trade and customs regarding the ASW is now under discussion, and should be completed by 2013. Box 2.2 outlines experience in the development of NSWs in member states. ASEAN adopted the ASEAN Data Model in April 2008 and upgraded it to the ASEAN Data Model version 2.0 on the basis of international standards such as those of the World Customs Organization (WCO), the International Organization for Standardization (ISO) and the United Nations Economic Commission for Europe (UNECE). Additionally, the application of ICT in all areas including compilation of the technical capabilities of NSWs for connectivity and interoperability has been partially completed. Specifically, it has been completed and endorsed by AMS for component 1, namely design of the most feasible network architecture for the ASW that will allow the exchange of cargo clearance data in an integrated and secure environment. Implementation of component 2 is still ongoing, namely setting up network infrastructure agreed by the AMS to implement the pilot project. The third component of the ASW pilot project will evaluate its outcomes and formulate recommendations for the ASEAN-wide rollout of the ASW.
Standards and Conformance
22. ASEAN’s trade facilitation work extends beyond customs to include other areas, such as standards and conformance. ASEAN is now seeking to develop product-specific Mutual Recognition Arrangements (MRAs) in conformity assessment so that product-related standards and regulations do not become technical barriers to trade. In line with the development of sectoral MRAs and harmonization of standards and regulatory regimes, ASEAN has developed
38 Brunei Darussalam, Indonesia, Malaysia, Philippines, Singapore, Thailand, and Viet Nam.
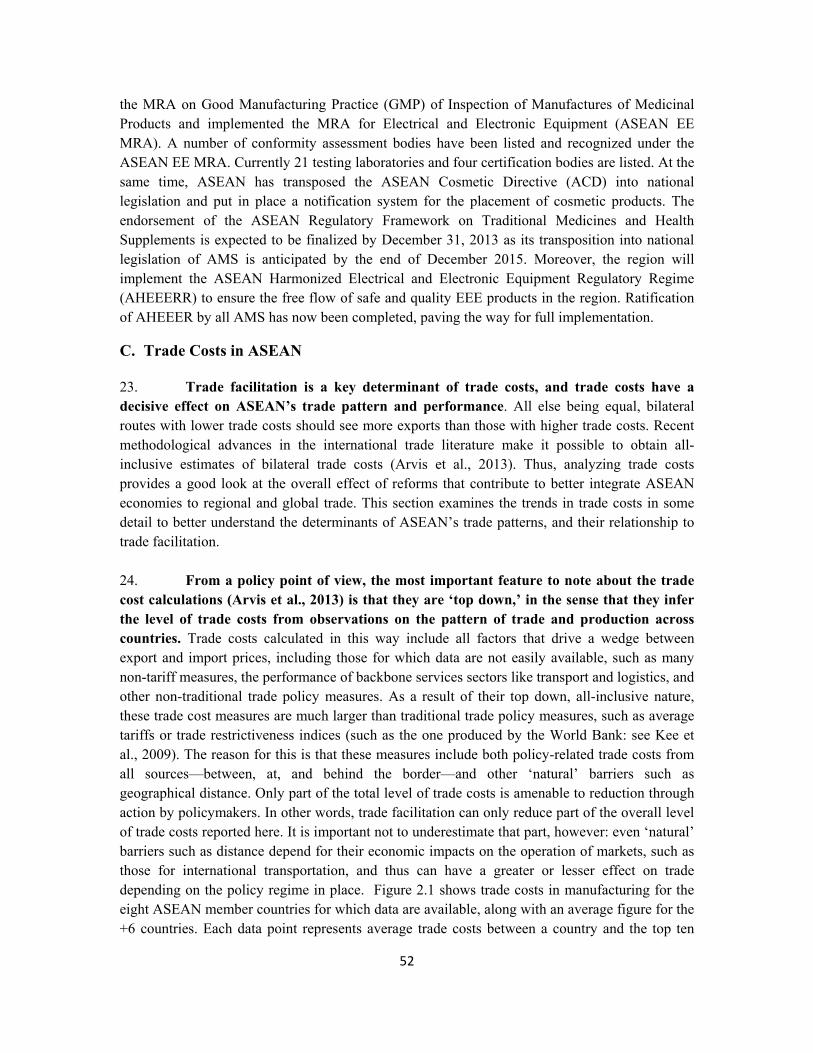
52
the MRA on Good Manufacturing Practice (GMP) of Inspection of Manufactures of Medicinal Products and implemented the MRA for Electrical and Electronic Equipment (ASEAN EE MRA). A number of conformity assessment bodies have been listed and recognized under the ASEAN EE MRA. Currently 21 testing laboratories and four certification bodies are listed. At the same time, ASEAN has transposed the ASEAN Cosmetic Directive (ACD) into national legislation and put in place a notification system for the placement of cosmetic products. The endorsement of the ASEAN Regulatory Framework on Traditional Medicines and Health Supplements is expected to be finalized by December 31, 2013 as its transposition into national legislation of AMS is anticipated by the end of December 2015. Moreover, the region will implement the ASEAN Harmonized Electrical and Electronic Equipment Regulatory Regime (AHEEERR) to ensure the free flow of safe and quality EEE products in the region. Ratification of AHEEER by all AMS has now been completed, paving the way for full implementation.
C. Trade Costs in ASEAN
23. Trade facilitation is a key determinant of trade costs, and trade costs have a decisive effect on ASEAN’s trade pattern and performance. All else being equal, bilateral routes with lower trade costs should see more exports than those with higher trade costs. Recent methodological advances in the international trade literature make it possible to obtain all-inclusive estimates of bilateral trade costs (Arvis et al., 2013). Thus, analyzing trade costs provides a good look at the overall effect of reforms that contribute to better integrate ASEAN economies to regional and global trade. This section examines the trends in trade costs in some detail to better understand the determinants of ASEAN’s trade patterns, and their relationship to trade facilitation. 24. From a policy point of view, the most important feature to note about the trade cost calculations (Arvis et al., 2013) is that they are ‘top down,’ in the sense that they infer the level of trade costs from observations on the pattern of trade and production across countries. Trade costs calculated in this way include all factors that drive a wedge between export and import prices, including those for which data are not easily available, such as many non-tariff measures, the performance of backbone services sectors like transport and logistics, and other non-traditional trade policy measures. As a result of their top down, all-inclusive nature, these trade cost measures are much larger than traditional trade policy measures, such as average tariffs or trade restrictiveness indices (such as the one produced by the World Bank: see Kee et al., 2009). The reason for this is that these measures include both policy-related trade costs from all sources—between, at, and behind the border—and other ‘natural’ barriers such as geographical distance. Only part of the total level of trade costs is amenable to reduction through action by policymakers. In other words, trade facilitation can only reduce part of the overall level of trade costs reported here. It is important not to underestimate that part, however: even ‘natural’ barriers such as distance depend for their economic impacts on the operation of markets, such as those for international transportation, and thus can have a greater or lesser effect on trade depending on the policy regime in place. Figure 2.1 shows trade costs in manufacturing for the eight ASEAN member countries for which data are available, along with an average figure for the +6 countries. Each data point represents average trade costs between a country and the top ten
53
global importers, and can thus be considered an indication of trade costs with respect to the rest of the world. The first feature to note is that, as discussed above, ad valorem equivalents are very high compared with the level of average tariffs: total trade costs of 100-150 percent are common in ASEAN, and lie between the high- and upper-middle-income group averages. Given the range of per capita incomes in ASEAN, performance is thus quite strong relative to other regions, although the numbers at first glance appear high. However, only Malaysia, Viet Nam, and Thailand have levels of trade costs in manufactured goods that are comparable to the +6 group average. To take extra-regional examples as points of comparison, the USA had trade costs of 69 percent in 2010, and Germany had 66 percent, both of which are considerably lower than the levels seen in most AMS.
Box 2. 3: Measuring Trade Costs: Some Methodological Points
Figure 1 shows trade costs in manufacturing as inferred by Arvis et al. (forthcoming) for the
A number of caveats need to be kept in mind in interpreting trade costs data of the type computed by Arvis et al. (2013). First, for each country pair the measure represents the geometric average of trade costs in each direction. It is not possible to obtain estimates for each direction separately, but only the two together. Imputing causal effect to policy actions taken by one or other trading partner is therefore difficult. Second, trade costs calculated in this way are the ratio of international to domestic trade costs. A change in the ratio can occur due to a change in international trade costs—the main object of interest here—or in domestic trade costs (distribution costs), or in both simultaneously. Again, this makes attributing causality difficult. Finally, calculating ad valorem equivalent trade costs relies on a number of technical assumptions to which the results are sensitive. Although the level of trade costs is therefore subject to discussion in particular cases, the pattern of change of trade costs over time and across countries is much less sensitive to parameter assumptions, and is in fact highly robust. Thus, the focus is on the pattern of changes in trade costs.
Source: Authors
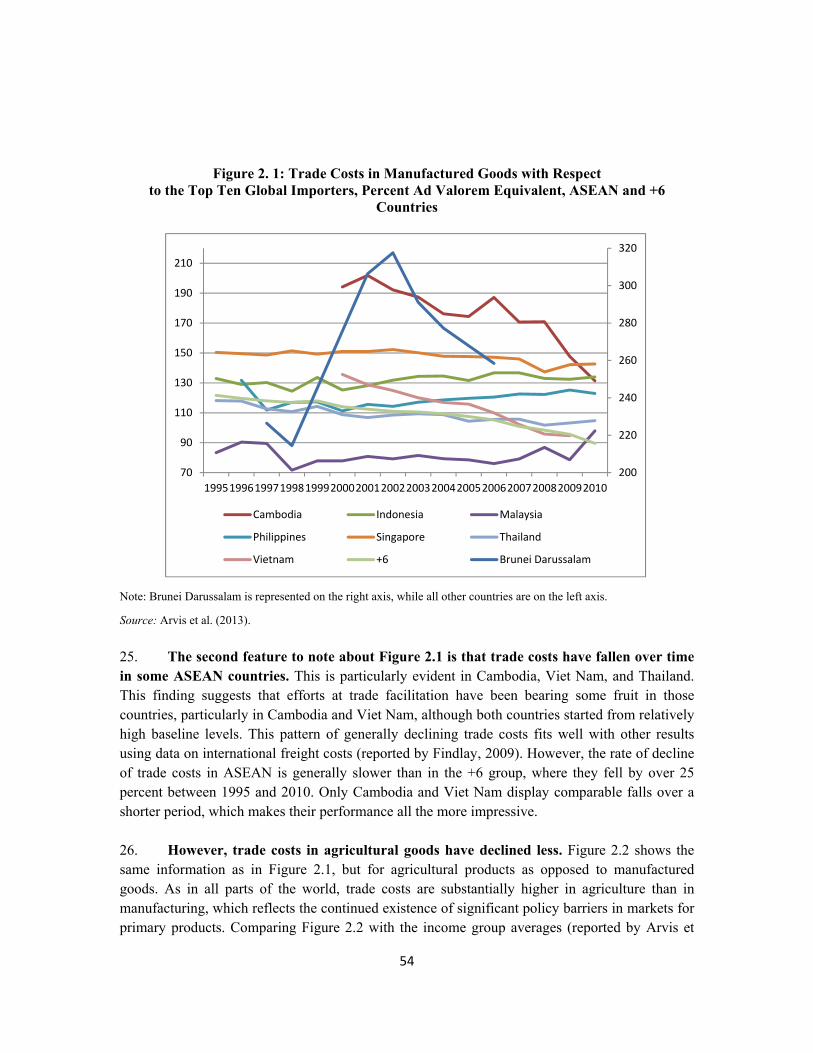
54
Figure 2. 1: Trade Costs in Manufactured Goods with Respect to the Top Ten Global Importers, Percent Ad Valorem Equivalent, ASEAN and +6
Countries
Note: Brunei Darussalam is represented on the right axis, while all other countries are on the left axis.
Source: Arvis et al. (2013).
25. The second feature to note about Figure 2.1 is that trade costs have fallen over time in some ASEAN countries. This is particularly evident in Cambodia, Viet Nam, and Thailand. This finding suggests that efforts at trade facilitation have been bearing some fruit in those countries, particularly in Cambodia and Viet Nam, although both countries started from relatively high baseline levels. This pattern of generally declining trade costs fits well with other results using data on international freight costs (reported by Findlay, 2009). However, the rate of decline of trade costs in ASEAN is generally slower than in the +6 group, where they fell by over 25 percent between 1995 and 2010. Only Cambodia and Viet Nam display comparable falls over a shorter period, which makes their performance all the more impressive.
26. However, trade costs in agricultural goods have declined less. Figure 2.2 shows the same information as in Figure 2.1, but for agricultural products as opposed to manufactured goods. As in all parts of the world, trade costs are substantially higher in agriculture than in manufacturing, which reflects the continued existence of significant policy barriers in markets for primary products. Comparing Figure 2.2 with the income group averages (reported by Arvis et
200
220
240
260
280
300
320
70
90
110
130
150
170
190
210
1995199619971998199920002001200220032004200520062007200820092010
Cambodia Indonesia Malaysia
Philippines Singapore Thailand
Vietnam +6 Brunei Darussalam
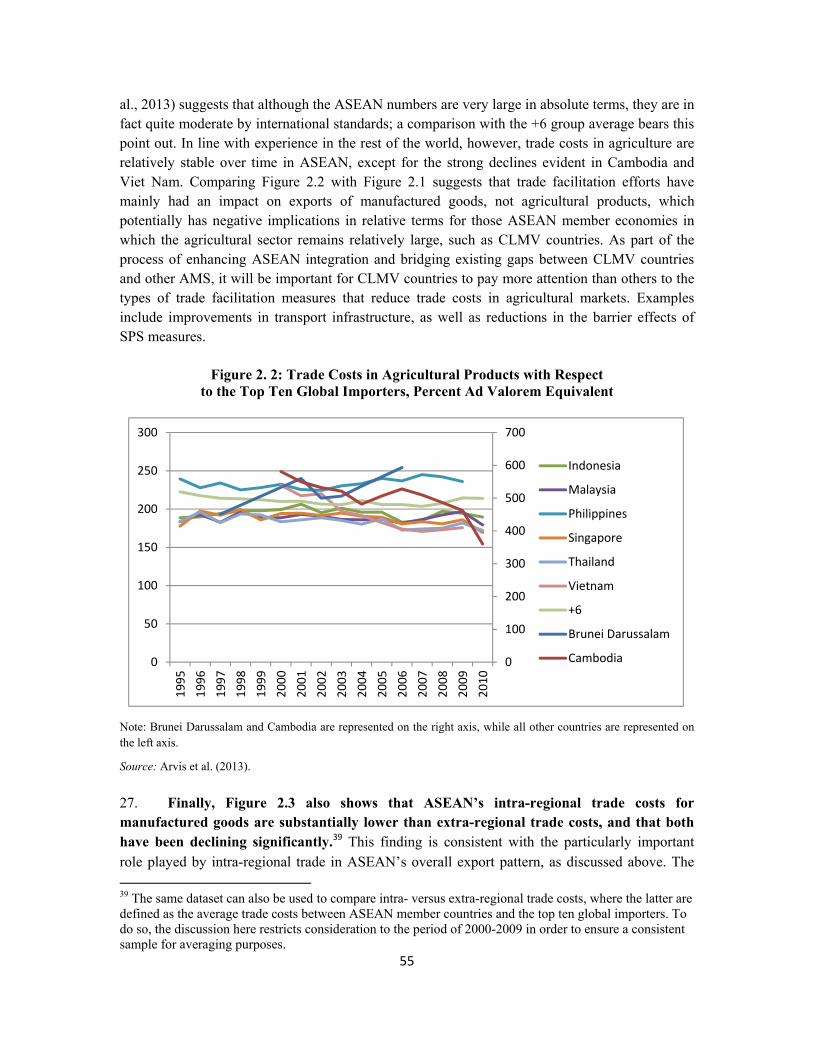
55
al., 2013) suggests that although the ASEAN numbers are very large in absolute terms, they are in fact quite moderate by international standards; a comparison with the +6 group average bears this point out. In line with experience in the rest of the world, however, trade costs in agriculture are relatively stable over time in ASEAN, except for the strong declines evident in Cambodia and Viet Nam. Comparing Figure 2.2 with Figure 2.1 suggests that trade facilitation efforts have mainly had an impact on exports of manufactured goods, not agricultural products, which potentially has negative implications in relative terms for those ASEAN member economies in which the agricultural sector remains relatively large, such as CLMV countries. As part of the process of enhancing ASEAN integration and bridging existing gaps between CLMV countries and other AMS, it will be important for CLMV countries to pay more attention than others to the types of trade facilitation measures that reduce trade costs in agricultural markets. Examples include improvements in transport infrastructure, as well as reductions in the barrier effects of SPS measures.
Figure 2. 2: Trade Costs in Agricultural Products with Respect to the Top Ten Global Importers, Percent Ad Valorem Equivalent
Note: Brunei Darussalam and Cambodia are represented on the right axis, while all other countries are represented on the left axis.
Source: Arvis et al. (2013).
27. Finally, Figure 2.3 also shows that ASEAN’s intra-regional trade costs for manufactured goods are substantially lower than extra-regional trade costs, and that both have been declining significantly.39 This finding is consistent with the particularly important role played by intra-regional trade in ASEAN’s overall export pattern, as discussed above. The 39 The same dataset can also be used to compare intra- versus extra-regional trade costs, where the latter are defined as the average trade costs between ASEAN member countries and the top ten global importers. To do so, the discussion here restricts consideration to the period of 2000-2009 in order to ensure a consistent sample for averaging purposes.
0
100
200
300
400
500
600
700
0
50
100
150
200
250
300
1995
1996
1997
1998
1999
2000
2001
2002
2003
2004
2005
2006
2007
2008
2009
2010
Indonesia
Malaysia
Philippines
Singapore
Thailand
Vietnam
+6
Brunei Darussalam
Cambodia
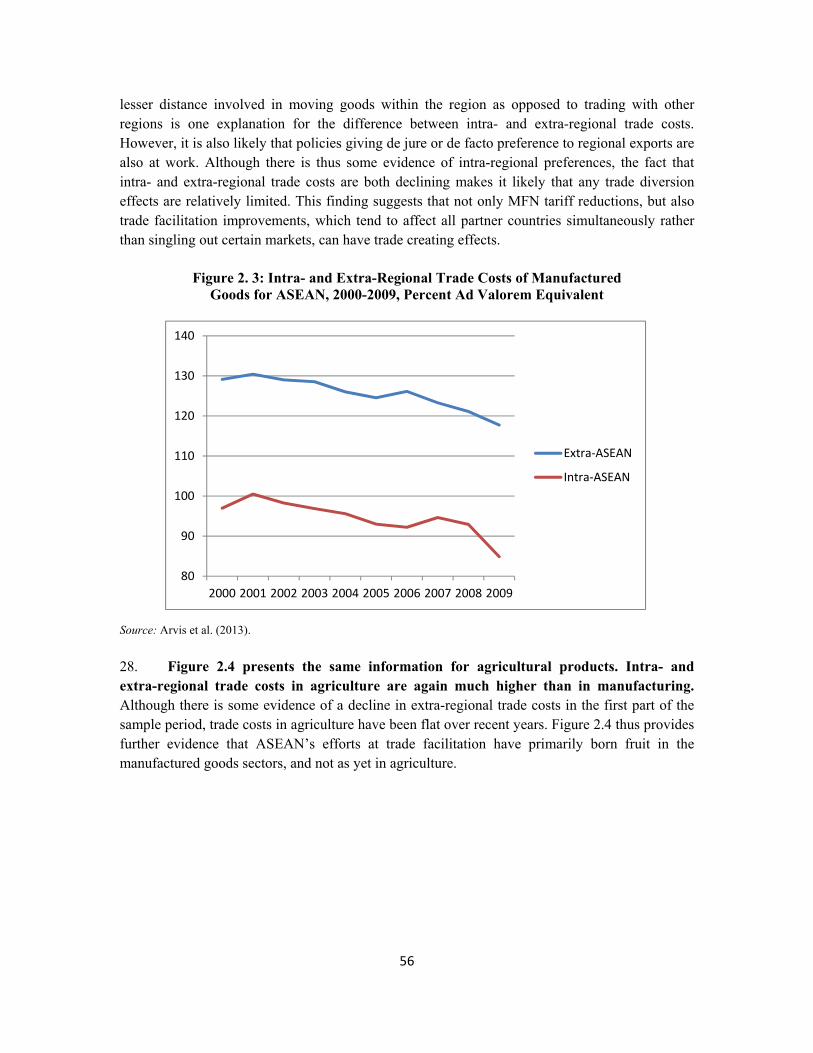
56
lesser distance involved in moving goods within the region as opposed to trading with other regions is one explanation for the difference between intra- and extra-regional trade costs. However, it is also likely that policies giving de jure or de facto preference to regional exports are also at work. Although there is thus some evidence of intra-regional preferences, the fact that intra- and extra-regional trade costs are both declining makes it likely that any trade diversion effects are relatively limited. This finding suggests that not only MFN tariff reductions, but also trade facilitation improvements, which tend to affect all partner countries simultaneously rather than singling out certain markets, can have trade creating effects.
Figure 2. 3: Intra- and Extra-Regional Trade Costs of Manufactured Goods for ASEAN, 2000-2009, Percent Ad Valorem Equivalent
Source: Arvis et al. (2013).
28. Figure 2.4 presents the same information for agricultural products. Intra- and extra-regional trade costs in agriculture are again much higher than in manufacturing. Although there is some evidence of a decline in extra-regional trade costs in the first part of the sample period, trade costs in agriculture have been flat over recent years. Figure 2.4 thus provides further evidence that ASEAN’s efforts at trade facilitation have primarily born fruit in the manufactured goods sectors, and not as yet in agriculture.
80
90
100
110
120
130
140
2000 2001 2002 2003 2004 2005 2006 2007 2008 2009
Extra-ASEAN
Intra-ASEAN
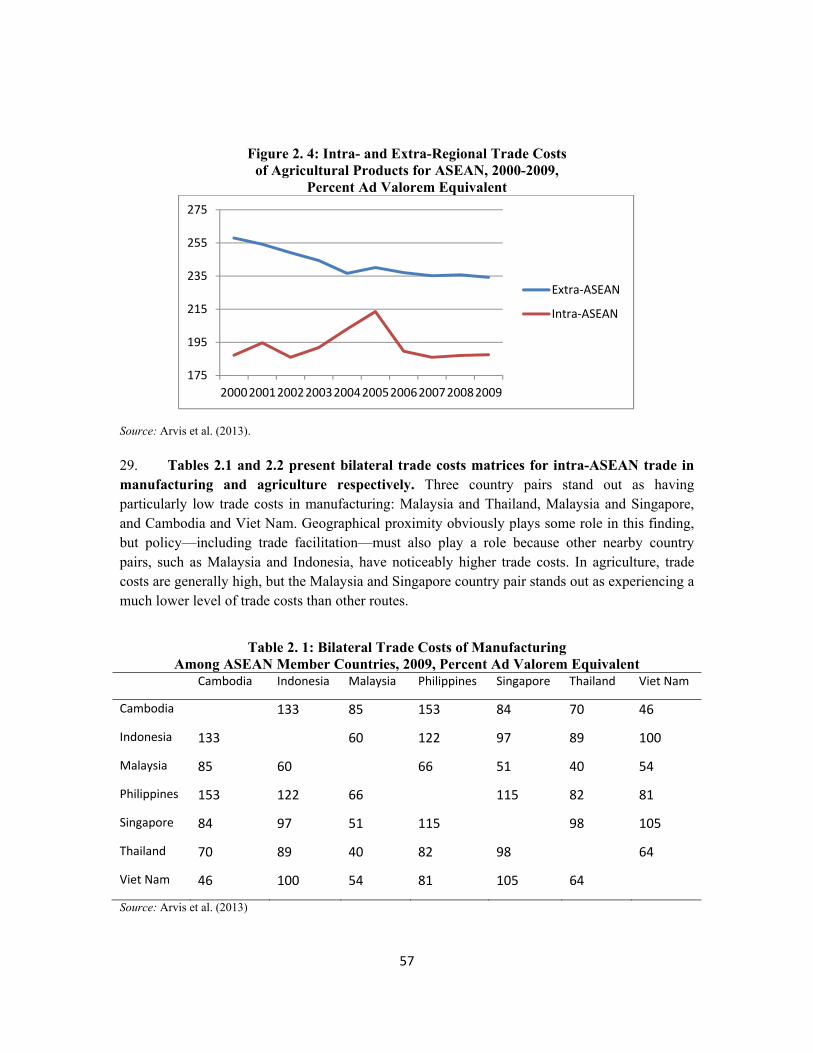
57
Figure 2. 4: Intra- and Extra-Regional Trade Costs of Agricultural Products for ASEAN, 2000-2009,
Percent Ad Valorem Equivalent
Source: Arvis et al. (2013).
29. Tables 2.1 and 2.2 present bilateral trade costs matrices for intra-ASEAN trade in manufacturing and agriculture respectively. Three country pairs stand out as having particularly low trade costs in manufacturing: Malaysia and Thailand, Malaysia and Singapore, and Cambodia and Viet Nam. Geographical proximity obviously plays some role in this finding, but policy—including trade facilitation—must also play a role because other nearby country pairs, such as Malaysia and Indonesia, have noticeably higher trade costs. In agriculture, trade costs are generally high, but the Malaysia and Singapore country pair stands out as experiencing a much lower level of trade costs than other routes.
Table 2. 1: Bilateral Trade Costs of Manufacturing Among ASEAN Member Countries, 2009, Percent Ad Valorem Equivalent
Cambodia Indonesia Malaysia Philippines Singapore Thailand Viet Nam
Cambodia 133 85 153 84 70 46
Indonesia 133 60 122 97 89 100
Malaysia 85 60 66 51 40 54
Philippines 153 122 66 115 82 81
Singapore 84 97 51 115 98 105
Thailand 70 89 40 82 98 64
Viet Nam 46 100 54 81 105 64
Source: Arvis et al. (2013)
175
195
215
235
255
275
2000200120022003200420052006200720082009
Extra-ASEAN
Intra-ASEAN
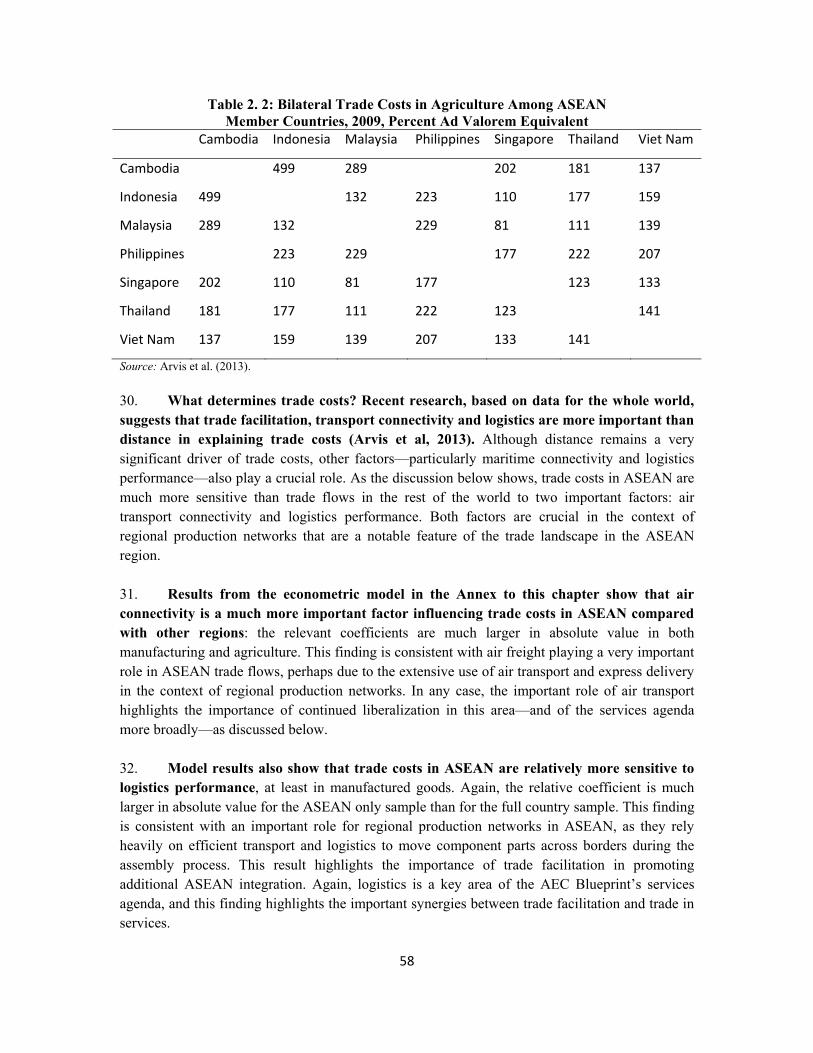
58
Table 2. 2: Bilateral Trade Costs in Agriculture Among ASEAN Member Countries, 2009, Percent Ad Valorem Equivalent
Cambodia Indonesia Malaysia Philippines Singapore Thailand Viet Nam
Cambodia 499 289 202 181 137
Indonesia 499 132 223 110 177 159
Malaysia 289 132 229 81 111 139
Philippines 223 229 177 222 207
Singapore 202 110 81 177 123 133
Thailand 181 177 111 222 123 141
Viet Nam 137 159 139 207 133 141
Source: Arvis et al. (2013).
30. What determines trade costs? Recent research, based on data for the whole world, suggests that trade facilitation, transport connectivity and logistics are more important than distance in explaining trade costs (Arvis et al, 2013). Although distance remains a very significant driver of trade costs, other factors—particularly maritime connectivity and logistics performance—also play a crucial role. As the discussion below shows, trade costs in ASEAN are much more sensitive than trade flows in the rest of the world to two important factors: air transport connectivity and logistics performance. Both factors are crucial in the context of regional production networks that are a notable feature of the trade landscape in the ASEAN region. 31. Results from the econometric model in the Annex to this chapter show that air connectivity is a much more important factor influencing trade costs in ASEAN compared with other regions: the relevant coefficients are much larger in absolute value in both manufacturing and agriculture. This finding is consistent with air freight playing a very important role in ASEAN trade flows, perhaps due to the extensive use of air transport and express delivery in the context of regional production networks. In any case, the important role of air transport highlights the importance of continued liberalization in this area—and of the services agenda more broadly—as discussed below. 32. Model results also show that trade costs in ASEAN are relatively more sensitive to logistics performance, at least in manufactured goods. Again, the relative coefficient is much larger in absolute value for the ASEAN only sample than for the full country sample. This finding is consistent with an important role for regional production networks in ASEAN, as they rely heavily on efficient transport and logistics to move component parts across borders during the assembly process. This result highlights the importance of trade facilitation in promoting additional ASEAN integration. Again, logistics is a key area of the AEC Blueprint’s services agenda, and this finding highlights the important synergies between trade facilitation and trade in services.
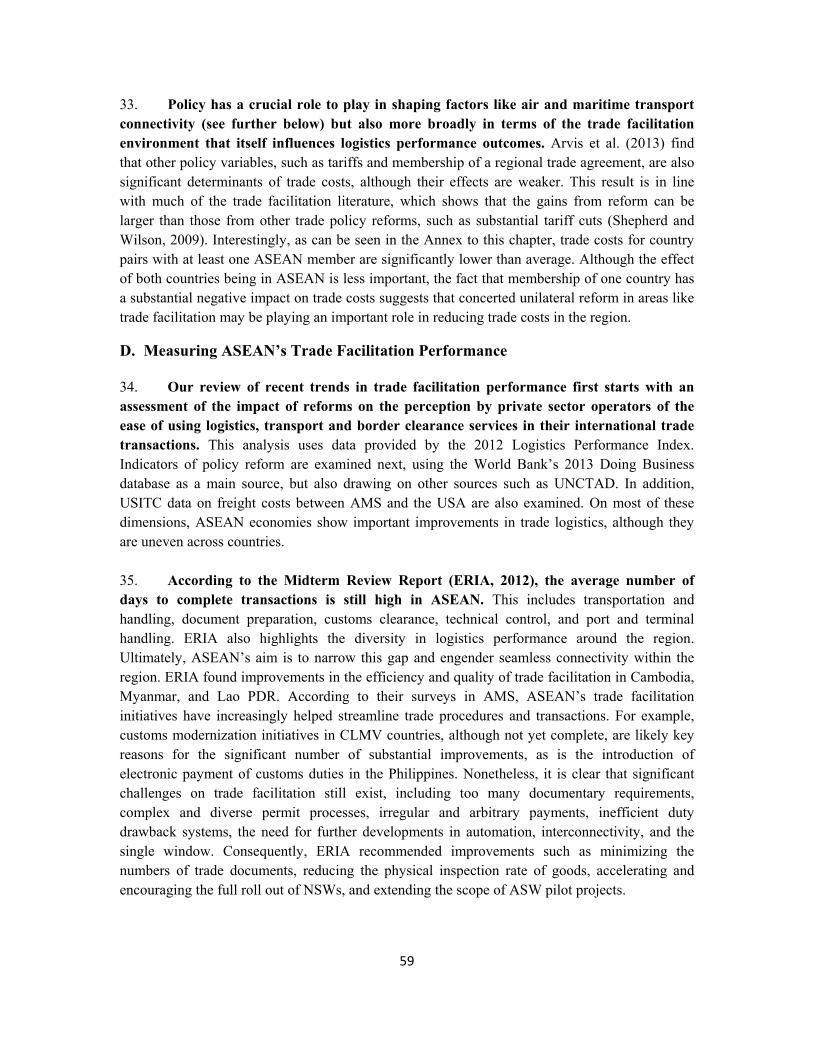
59
33. Policy has a crucial role to play in shaping factors like air and maritime transport connectivity (see further below) but also more broadly in terms of the trade facilitation environment that itself influences logistics performance outcomes. Arvis et al. (2013) find that other policy variables, such as tariffs and membership of a regional trade agreement, are also significant determinants of trade costs, although their effects are weaker. This result is in line with much of the trade facilitation literature, which shows that the gains from reform can be larger than those from other trade policy reforms, such as substantial tariff cuts (Shepherd and Wilson, 2009). Interestingly, as can be seen in the Annex to this chapter, trade costs for country pairs with at least one ASEAN member are significantly lower than average. Although the effect of both countries being in ASEAN is less important, the fact that membership of one country has a substantial negative impact on trade costs suggests that concerted unilateral reform in areas like trade facilitation may be playing an important role in reducing trade costs in the region.
D. Measuring ASEAN’s Trade Facilitation Performance
34. Our review of recent trends in trade facilitation performance first starts with an assessment of the impact of reforms on the perception by private sector operators of the ease of using logistics, transport and border clearance services in their international trade transactions. This analysis uses data provided by the 2012 Logistics Performance Index. Indicators of policy reform are examined next, using the World Bank’s 2013 Doing Business database as a main source, but also drawing on other sources such as UNCTAD. In addition, USITC data on freight costs between AMS and the USA are also examined. On most of these dimensions, ASEAN economies show important improvements in trade logistics, although they are uneven across countries. 35. According to the Midterm Review Report (ERIA, 2012), the average number of days to complete transactions is still high in ASEAN. This includes transportation and handling, document preparation, customs clearance, technical control, and port and terminal handling. ERIA also highlights the diversity in logistics performance around the region. Ultimately, ASEAN’s aim is to narrow this gap and engender seamless connectivity within the region. ERIA found improvements in the efficiency and quality of trade facilitation in Cambodia, Myanmar, and Lao PDR. According to their surveys in AMS, ASEAN’s trade facilitation initiatives have increasingly helped streamline trade procedures and transactions. For example, customs modernization initiatives in CLMV countries, although not yet complete, are likely key reasons for the significant number of substantial improvements, as is the introduction of electronic payment of customs duties in the Philippines. Nonetheless, it is clear that significant challenges on trade facilitation still exist, including too many documentary requirements, complex and diverse permit processes, irregular and arbitrary payments, inefficient duty drawback systems, the need for further developments in automation, interconnectivity, and the single window. Consequently, ERIA recommended improvements such as minimizing the numbers of trade documents, reducing the physical inspection rate of goods, accelerating and encouraging the full roll out of NSWs, and extending the scope of ASW pilot projects.
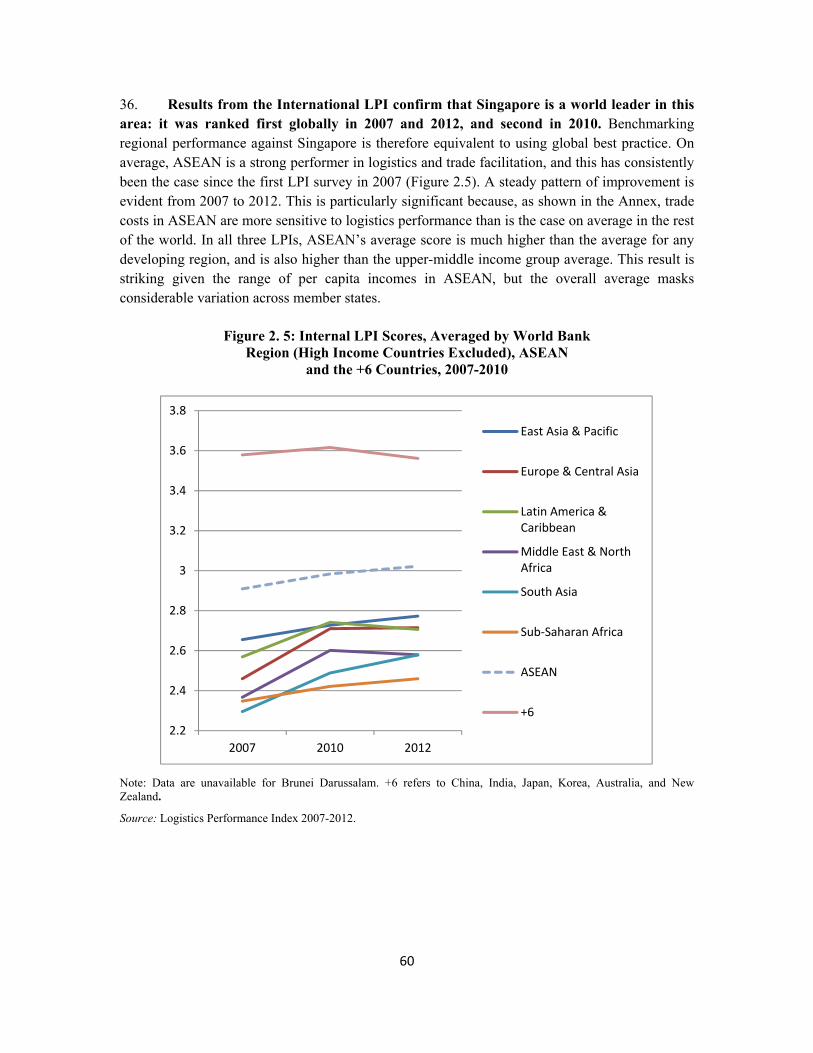
60
36. Results from the International LPI confirm that Singapore is a world leader in this area: it was ranked first globally in 2007 and 2012, and second in 2010. Benchmarking regional performance against Singapore is therefore equivalent to using global best practice. On average, ASEAN is a strong performer in logistics and trade facilitation, and this has consistently been the case since the first LPI survey in 2007 (Figure 2.5). A steady pattern of improvement is evident from 2007 to 2012. This is particularly significant because, as shown in the Annex, trade costs in ASEAN are more sensitive to logistics performance than is the case on average in the rest of the world. In all three LPIs, ASEAN’s average score is much higher than the average for any developing region, and is also higher than the upper-middle income group average. This result is striking given the range of per capita incomes in ASEAN, but the overall average masks considerable variation across member states.
Figure 2. 5: Internal LPI Scores, Averaged by World Bank Region (High Income Countries Excluded), ASEAN
and the +6 Countries, 2007-2010
Note: Data are unavailable for Brunei Darussalam. +6 refers to China, India, Japan, Korea, Australia, and New Zealand.
Source: Logistics Performance Index 2007-2012.
2.2
2.4
2.6
2.8
3
3.2
3.4
3.6
3.8
2007 2010 2012
East Asia & Pacific
Europe & Central Asia
Latin America &Caribbean
Middle East & NorthAfrica
South Asia
Sub-Saharan Africa
ASEAN
+6
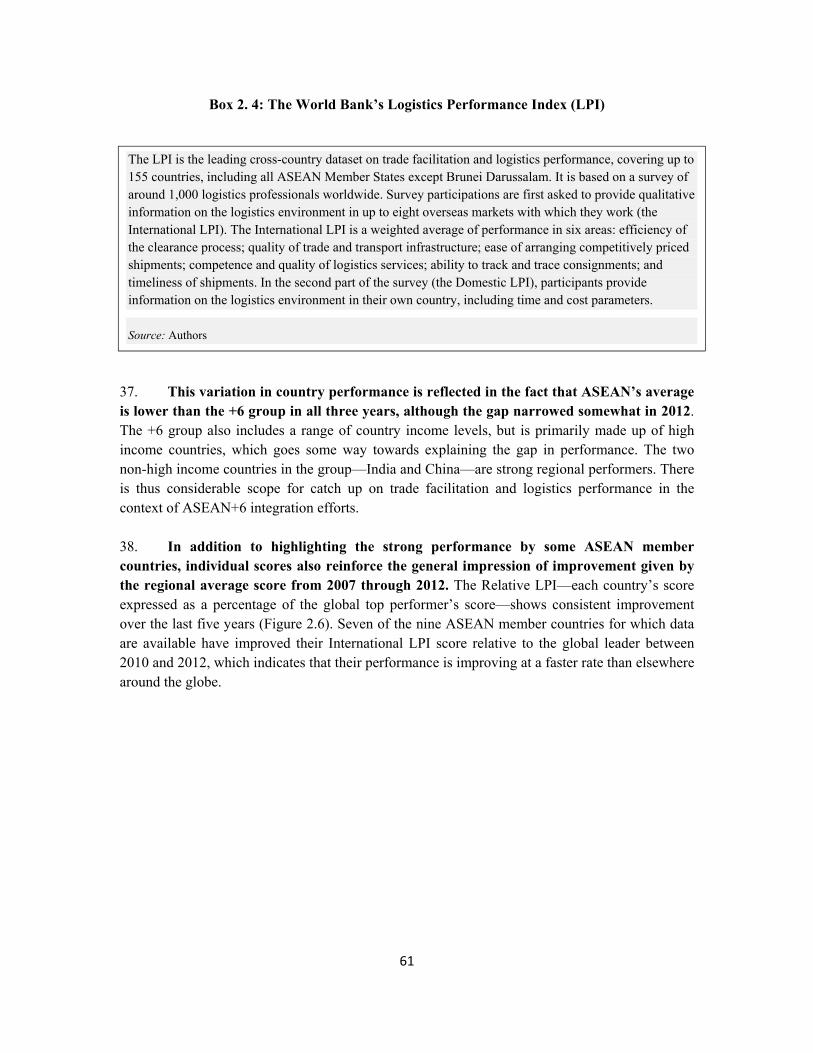
61
Box 2. 4: The World Bank’s Logistics Performance Index (LPI)
37. This variation in country performance is reflected in the fact that ASEAN’s average is lower than the +6 group in all three years, although the gap narrowed somewhat in 2012. The +6 group also includes a range of country income levels, but is primarily made up of high income countries, which goes some way towards explaining the gap in performance. The two non-high income countries in the group—India and China—are strong regional performers. There is thus considerable scope for catch up on trade facilitation and logistics performance in the context of ASEAN+6 integration efforts. 38. In addition to highlighting the strong performance by some ASEAN member countries, individual scores also reinforce the general impression of improvement given by the regional average score from 2007 through 2012. The Relative LPI—each country’s score expressed as a percentage of the global top performer’s score—shows consistent improvement over the last five years (Figure 2.6). Seven of the nine ASEAN member countries for which data are available have improved their International LPI score relative to the global leader between 2010 and 2012, which indicates that their performance is improving at a faster rate than elsewhere around the globe.
The LPI is the leading cross-country dataset on trade facilitation and logistics performance, covering up to 155 countries, including all ASEAN Member States except Brunei Darussalam. It is based on a survey of around 1,000 logistics professionals worldwide. Survey participations are first asked to provide qualitative information on the logistics environment in up to eight overseas markets with which they work (the International LPI). The International LPI is a weighted average of performance in six areas: efficiency of the clearance process; quality of trade and transport infrastructure; ease of arranging competitively priced shipments; competence and quality of logistics services; ability to track and trace consignments; and timeliness of shipments. In the second part of the survey (the Domestic LPI), participants provide information on the logistics environment in their own country, including time and cost parameters.
Source: Authors
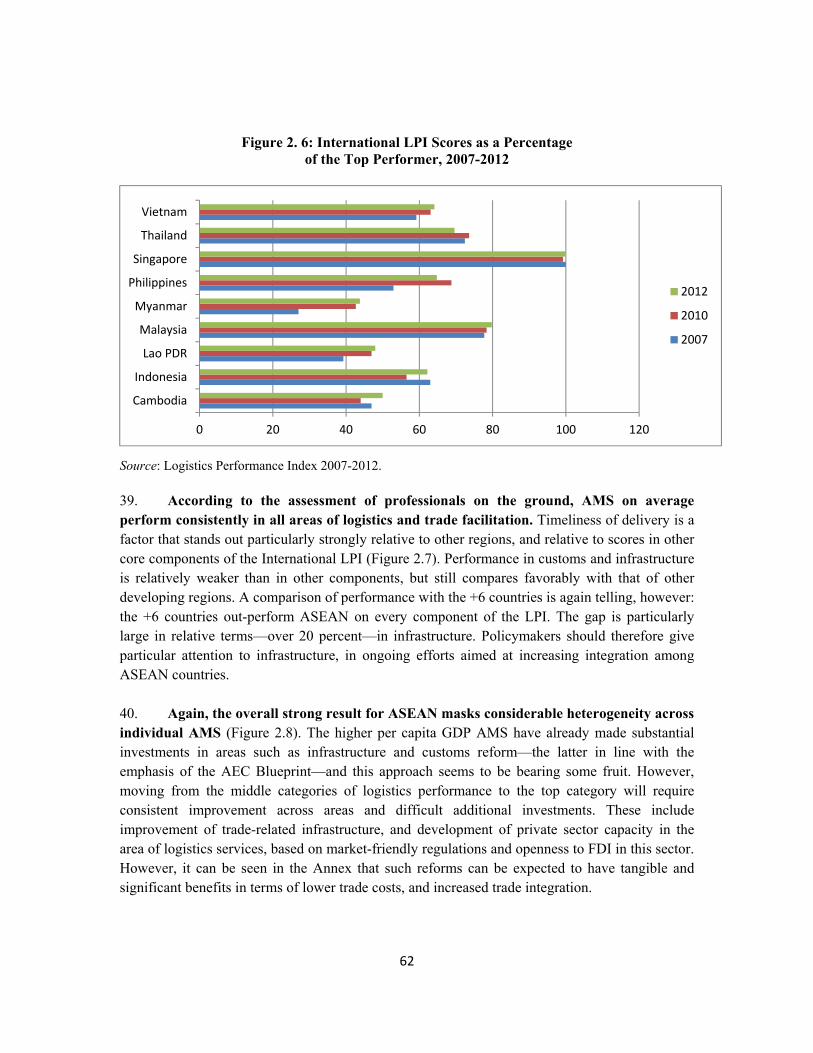
62
Figure 2. 6: International LPI Scores as a Percentage of the Top Performer, 2007-2012
Source: Logistics Performance Index 2007-2012.
39. According to the assessment of professionals on the ground, AMS on average perform consistently in all areas of logistics and trade facilitation. Timeliness of delivery is a factor that stands out particularly strongly relative to other regions, and relative to scores in other core components of the International LPI (Figure 2.7). Performance in customs and infrastructure is relatively weaker than in other components, but still compares favorably with that of other developing regions. A comparison of performance with the +6 countries is again telling, however: the +6 countries out-perform ASEAN on every component of the LPI. The gap is particularly large in relative terms—over 20 percent—in infrastructure. Policymakers should therefore give particular attention to infrastructure, in ongoing efforts aimed at increasing integration among ASEAN countries. 40. Again, the overall strong result for ASEAN masks considerable heterogeneity across individual AMS (Figure 2.8). The higher per capita GDP AMS have already made substantial investments in areas such as infrastructure and customs reform—the latter in line with the emphasis of the AEC Blueprint—and this approach seems to be bearing some fruit. However, moving from the middle categories of logistics performance to the top category will require consistent improvement across areas and difficult additional investments. These include improvement of trade-related infrastructure, and development of private sector capacity in the area of logistics services, based on market-friendly regulations and openness to FDI in this sector. However, it can be seen in the Annex that such reforms can be expected to have tangible and significant benefits in terms of lower trade costs, and increased trade integration.
0 20 40 60 80 100 120
Cambodia
Indonesia
Lao PDR
Malaysia
Myanmar
Philippines
Singapore
Thailand
Vietnam
2012
2010
2007
63
41. In the CLMV countries, on the other hand, infrastructure and customs continue to represent significant drags on overall performance. However, as discussed in further detail below, performance is not only a function of physical infrastructure, it also depends on efficient and effective regulation of transport and logistics services, an area in which continued efforts are required in many AMS. The objective of narrowing the gap between CLMV countries and the other AMS suggests that they should, with regional partners, give special attention to improving the quality and quantity of trade-related infrastructure, as well as the performance of customs and border agencies. The first aspect means not only paying attention to ports and airports, but also internal routes that are commercially important, such as key roads linking international gateways with production sites. In terms of customs and border procedures, the reforms required to move towards implementation of an NSW will do much to improve the trading environment, and should be a priority for CLMV countries.
Figure 2. 7: Performance on Individual International LPI components, Averaged by World Bank Region (High Income Countries Excluded),
ASEAN and the +6 Countries
Source: Logistics Performance Index 2012.
22.22.42.62.8
33.23.43.63.8
4
East Asia & Pacific
Europe & Central Asia
Latin America & Caribbean
Middle East & North Africa
South Asia
Sub-Saharan Africa
ASEAN
+6
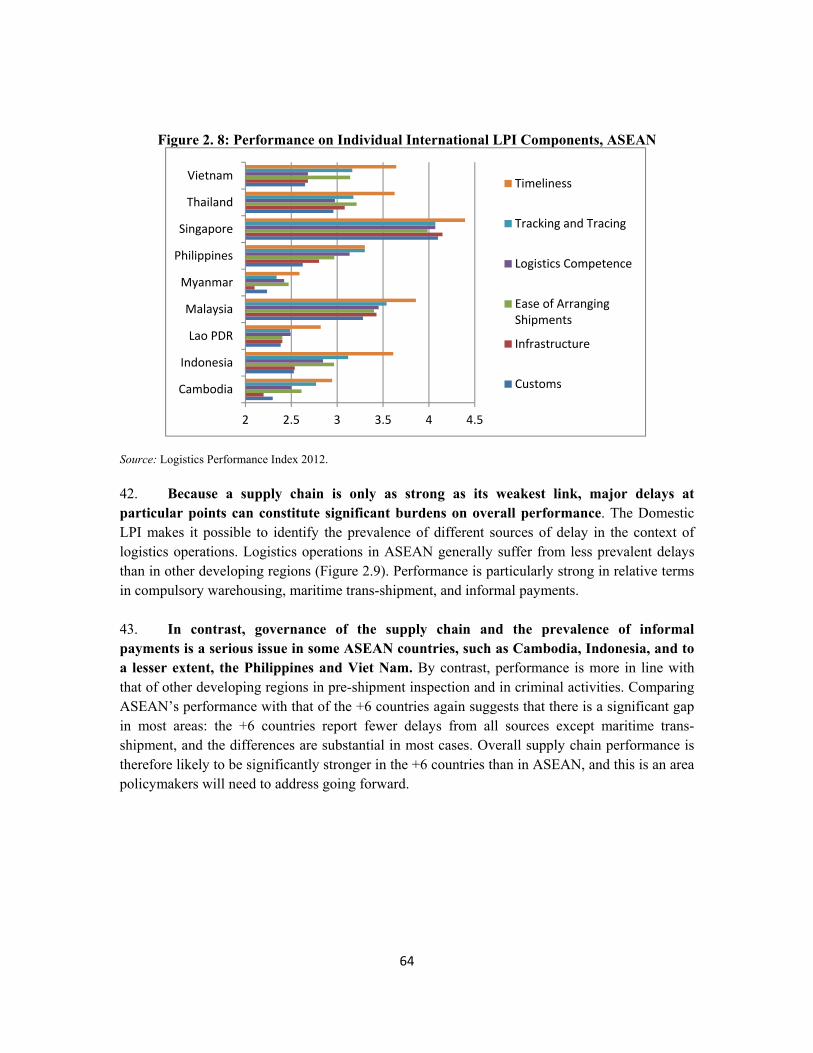
64
Figure 2. 8: Performance on Individual International LPI Components, ASEAN
Source: Logistics Performance Index 2012.
42. Because a supply chain is only as strong as its weakest link, major delays at particular points can constitute significant burdens on overall performance. The Domestic LPI makes it possible to identify the prevalence of different sources of delay in the context of logistics operations. Logistics operations in ASEAN generally suffer from less prevalent delays than in other developing regions (Figure 2.9). Performance is particularly strong in relative terms in compulsory warehousing, maritime trans-shipment, and informal payments.
43. In contrast, governance of the supply chain and the prevalence of informal payments is a serious issue in some ASEAN countries, such as Cambodia, Indonesia, and to a lesser extent, the Philippines and Viet Nam. By contrast, performance is more in line with that of other developing regions in pre-shipment inspection and in criminal activities. Comparing ASEAN’s performance with that of the +6 countries again suggests that there is a significant gap in most areas: the +6 countries report fewer delays from all sources except maritime trans-shipment, and the differences are substantial in most cases. Overall supply chain performance is therefore likely to be significantly stronger in the +6 countries than in ASEAN, and this is an area policymakers will need to address going forward.
2 2.5 3 3.5 4 4.5
Cambodia
Indonesia
Lao PDR
Malaysia
Myanmar
Philippines
Singapore
Thailand
Vietnam Timeliness
Tracking and Tracing
Logistics Competence
Ease of ArrangingShipments
Infrastructure
Customs
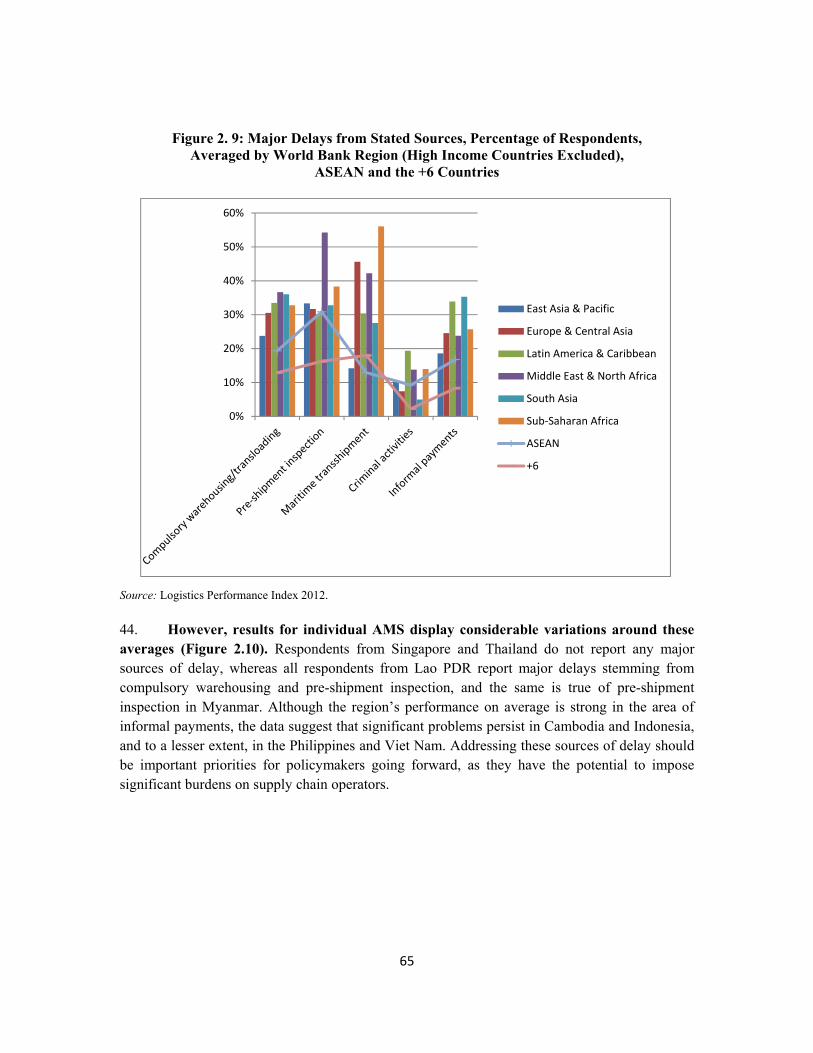
65
Figure 2. 9: Major Delays from Stated Sources, Percentage of Respondents, Averaged by World Bank Region (High Income Countries Excluded),
ASEAN and the +6 Countries
Source: Logistics Performance Index 2012.
44. However, results for individual AMS display considerable variations around these averages (Figure 2.10). Respondents from Singapore and Thailand do not report any major sources of delay, whereas all respondents from Lao PDR report major delays stemming from compulsory warehousing and pre-shipment inspection, and the same is true of pre-shipment inspection in Myanmar. Although the region’s performance on average is strong in the area of informal payments, the data suggest that significant problems persist in Cambodia and Indonesia, and to a lesser extent, in the Philippines and Viet Nam. Addressing these sources of delay should be important priorities for policymakers going forward, as they have the potential to impose significant burdens on supply chain operators.
0%
10%
20%
30%
40%
50%
60%
East Asia & Pacific
Europe & Central Asia
Latin America & Caribbean
Middle East & North Africa
South Asia
Sub-Saharan Africa
ASEAN
+6
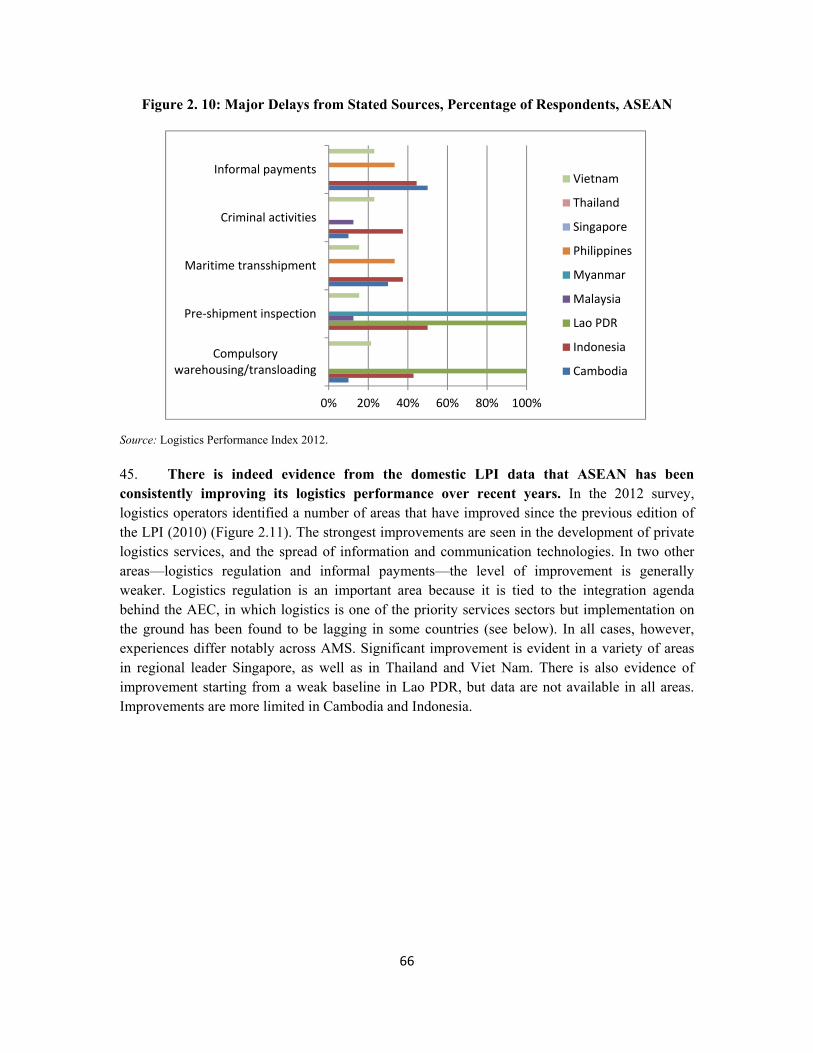
66
Figure 2. 10: Major Delays from Stated Sources, Percentage of Respondents, ASEAN
Source: Logistics Performance Index 2012.
45. There is indeed evidence from the domestic LPI data that ASEAN has been consistently improving its logistics performance over recent years. In the 2012 survey, logistics operators identified a number of areas that have improved since the previous edition of the LPI (2010) (Figure 2.11). The strongest improvements are seen in the development of private logistics services, and the spread of information and communication technologies. In two other areas—logistics regulation and informal payments—the level of improvement is generally weaker. Logistics regulation is an important area because it is tied to the integration agenda behind the AEC, in which logistics is one of the priority services sectors but implementation on the ground has been found to be lagging in some countries (see below). In all cases, however, experiences differ notably across AMS. Significant improvement is evident in a variety of areas in regional leader Singapore, as well as in Thailand and Viet Nam. There is also evidence of improvement starting from a weak baseline in Lao PDR, but data are not available in all areas. Improvements are more limited in Cambodia and Indonesia.
0% 20% 40% 60% 80% 100%
Compulsorywarehousing/transloading
Pre-shipment inspection
Maritime transshipment
Criminal activities
Informal paymentsVietnam
Thailand
Singapore
Philippines
Myanmar
Malaysia
Lao PDR
Indonesia
Cambodia
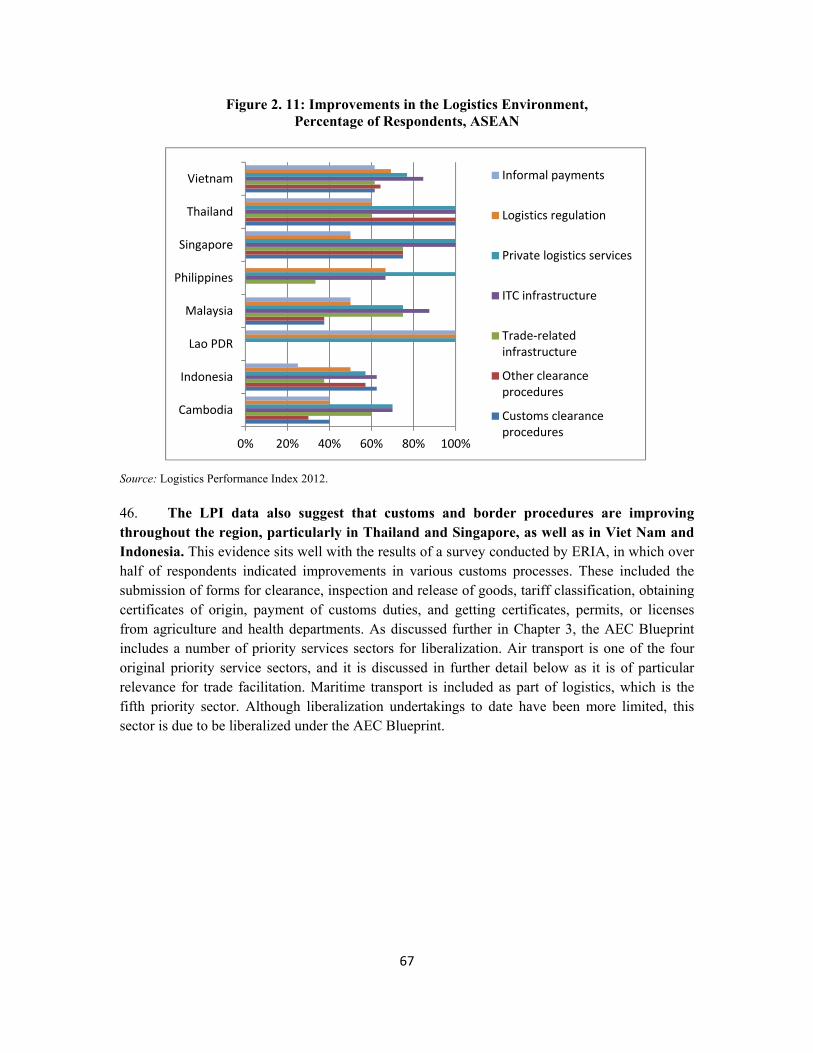
67
Figure 2. 11: Improvements in the Logistics Environment, Percentage of Respondents, ASEAN
Source: Logistics Performance Index 2012.
46. The LPI data also suggest that customs and border procedures are improving throughout the region, particularly in Thailand and Singapore, as well as in Viet Nam and Indonesia. This evidence sits well with the results of a survey conducted by ERIA, in which over half of respondents indicated improvements in various customs processes. These included the submission of forms for clearance, inspection and release of goods, tariff classification, obtaining certificates of origin, payment of customs duties, and getting certificates, permits, or licenses from agriculture and health departments. As discussed further in Chapter 3, the AEC Blueprint includes a number of priority services sectors for liberalization. Air transport is one of the four original priority service sectors, and it is discussed in further detail below as it is of particular relevance for trade facilitation. Maritime transport is included as part of logistics, which is the fifth priority sector. Although liberalization undertakings to date have been more limited, this sector is due to be liberalized under the AEC Blueprint.
0% 20% 40% 60% 80% 100%
Cambodia
Indonesia
Lao PDR
Malaysia
Philippines
Singapore
Thailand
Vietnam Informal payments
Logistics regulation
Private logistics services
ITC infrastructure
Trade-relatedinfrastructure
Other clearanceprocedures
Customs clearanceprocedures
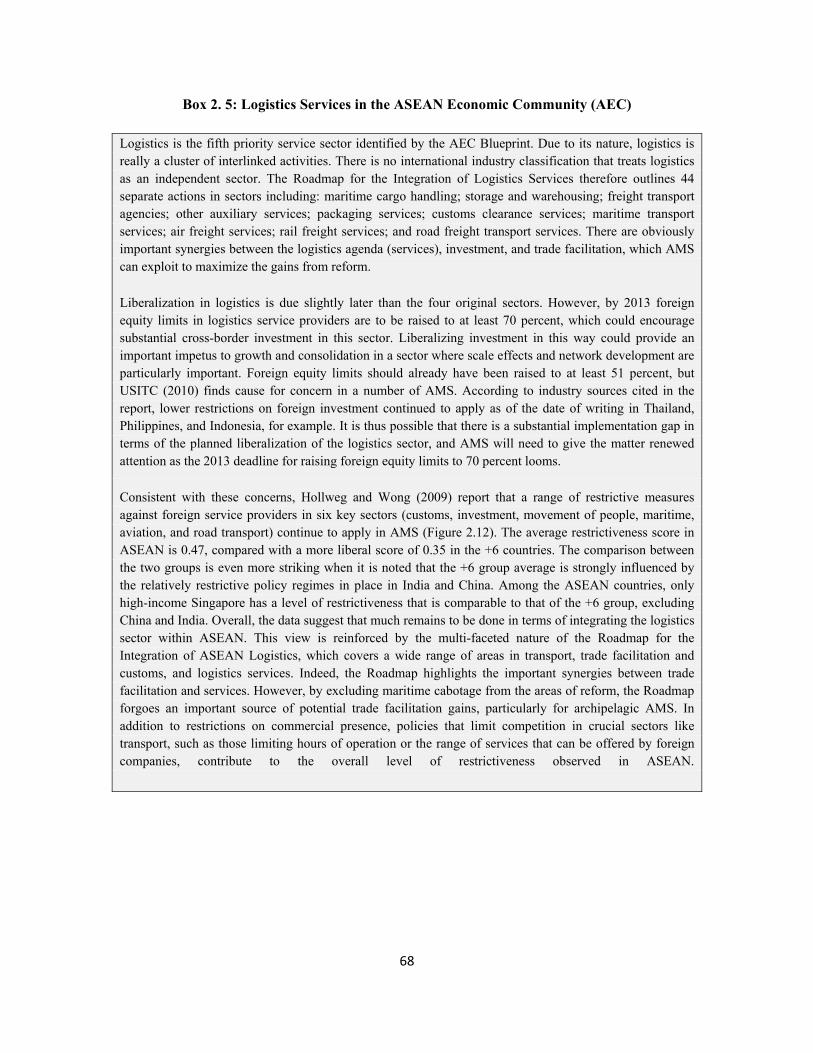
68
Box 2. 5: Logistics Services in the ASEAN Economic Community (AEC)
Logistics is the fifth priority service sector identified by the AEC Blueprint. Due to its nature, logistics is really a cluster of interlinked activities. There is no international industry classification that treats logistics as an independent sector. The Roadmap for the Integration of Logistics Services therefore outlines 44 separate actions in sectors including: maritime cargo handling; storage and warehousing; freight transport agencies; other auxiliary services; packaging services; customs clearance services; maritime transport services; air freight services; rail freight services; and road freight transport services. There are obviously important synergies between the logistics agenda (services), investment, and trade facilitation, which AMS can exploit to maximize the gains from reform.
Liberalization in logistics is due slightly later than the four original sectors. However, by 2013 foreign equity limits in logistics service providers are to be raised to at least 70 percent, which could encourage substantial cross-border investment in this sector. Liberalizing investment in this way could provide an important impetus to growth and consolidation in a sector where scale effects and network development are particularly important. Foreign equity limits should already have been raised to at least 51 percent, but USITC (2010) finds cause for concern in a number of AMS. According to industry sources cited in the report, lower restrictions on foreign investment continued to apply as of the date of writing in Thailand, Philippines, and Indonesia, for example. It is thus possible that there is a substantial implementation gap in terms of the planned liberalization of the logistics sector, and AMS will need to give the matter renewed attention as the 2013 deadline for raising foreign equity limits to 70 percent looms.
Consistent with these concerns, Hollweg and Wong (2009) report that a range of restrictive measures against foreign service providers in six key sectors (customs, investment, movement of people, maritime, aviation, and road transport) continue to apply in AMS (Figure 2.12). The average restrictiveness score in ASEAN is 0.47, compared with a more liberal score of 0.35 in the +6 countries. The comparison between the two groups is even more striking when it is noted that the +6 group average is strongly influenced by the relatively restrictive policy regimes in place in India and China. Among the ASEAN countries, only high-income Singapore has a level of restrictiveness that is comparable to that of the +6 group, excluding China and India. Overall, the data suggest that much remains to be done in terms of integrating the logistics sector within ASEAN. This view is reinforced by the multi-faceted nature of the Roadmap for the Integration of ASEAN Logistics, which covers a wide range of areas in transport, trade facilitation and customs, and logistics services. Indeed, the Roadmap highlights the important synergies between trade facilitation and services. However, by excluding maritime cabotage from the areas of reform, the Roadmap forgoes an important source of potential trade facilitation gains, particularly for archipelagic AMS. In addition to restrictions on commercial presence, policies that limit competition in crucial sectors like transport, such as those limiting hours of operation or the range of services that can be offered by foreign companies, contribute to the overall level of restrictiveness observed in ASEAN.
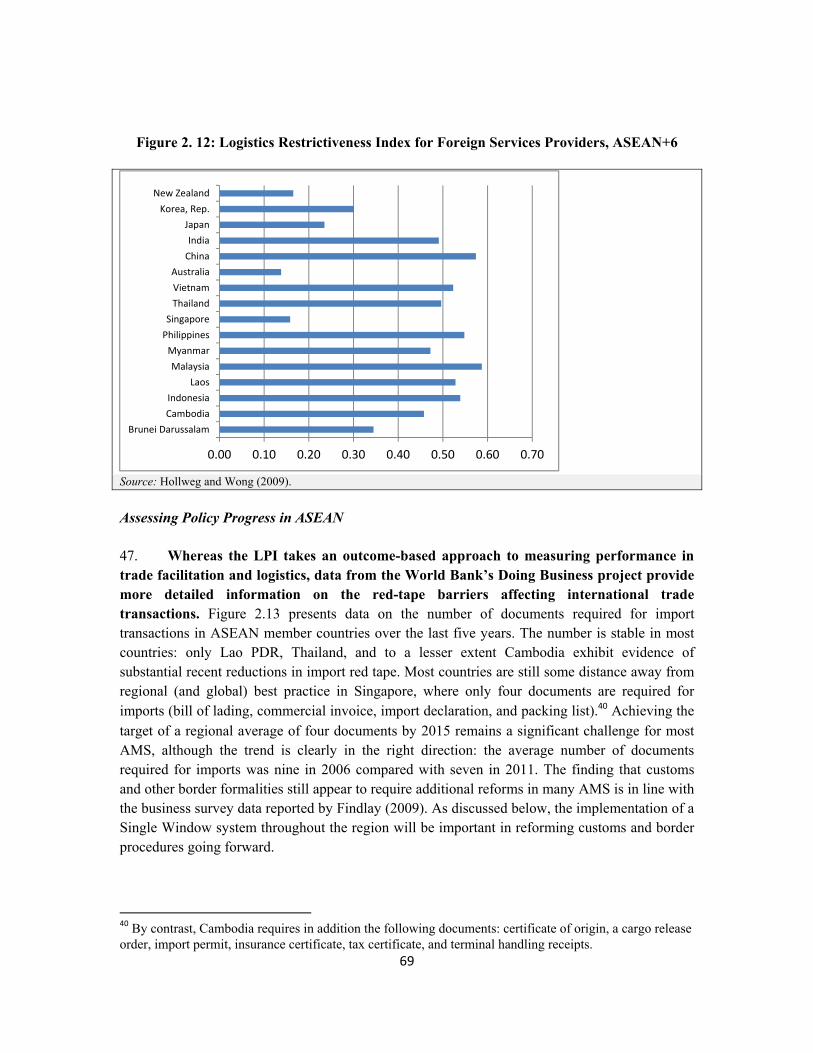
69
Figure 2. 12: Logistics Restrictiveness Index for Foreign Services Providers, ASEAN+6
Source: Hollweg and Wong (2009).
Assessing Policy Progress in ASEAN
47. Whereas the LPI takes an outcome-based approach to measuring performance in trade facilitation and logistics, data from the World Bank’s Doing Business project provide more detailed information on the red-tape barriers affecting international trade transactions. Figure 2.13 presents data on the number of documents required for import transactions in ASEAN member countries over the last five years. The number is stable in most countries: only Lao PDR, Thailand, and to a lesser extent Cambodia exhibit evidence of substantial recent reductions in import red tape. Most countries are still some distance away from regional (and global) best practice in Singapore, where only four documents are required for imports (bill of lading, commercial invoice, import declaration, and packing list).40 Achieving the target of a regional average of four documents by 2015 remains a significant challenge for most AMS, although the trend is clearly in the right direction: the average number of documents required for imports was nine in 2006 compared with seven in 2011. The finding that customs and other border formalities still appear to require additional reforms in many AMS is in line with the business survey data reported by Findlay (2009). As discussed below, the implementation of a Single Window system throughout the region will be important in reforming customs and border procedures going forward.
40 By contrast, Cambodia requires in addition the following documents: certificate of origin, a cargo release order, import permit, insurance certificate, tax certificate, and terminal handling receipts.
0.00 0.10 0.20 0.30 0.40 0.50 0.60 0.70
Brunei DarussalamCambodiaIndonesia
LaosMalaysia
MyanmarPhilippinesSingapore
ThailandVietnamAustralia
ChinaIndia
JapanKorea, Rep.
New Zealand
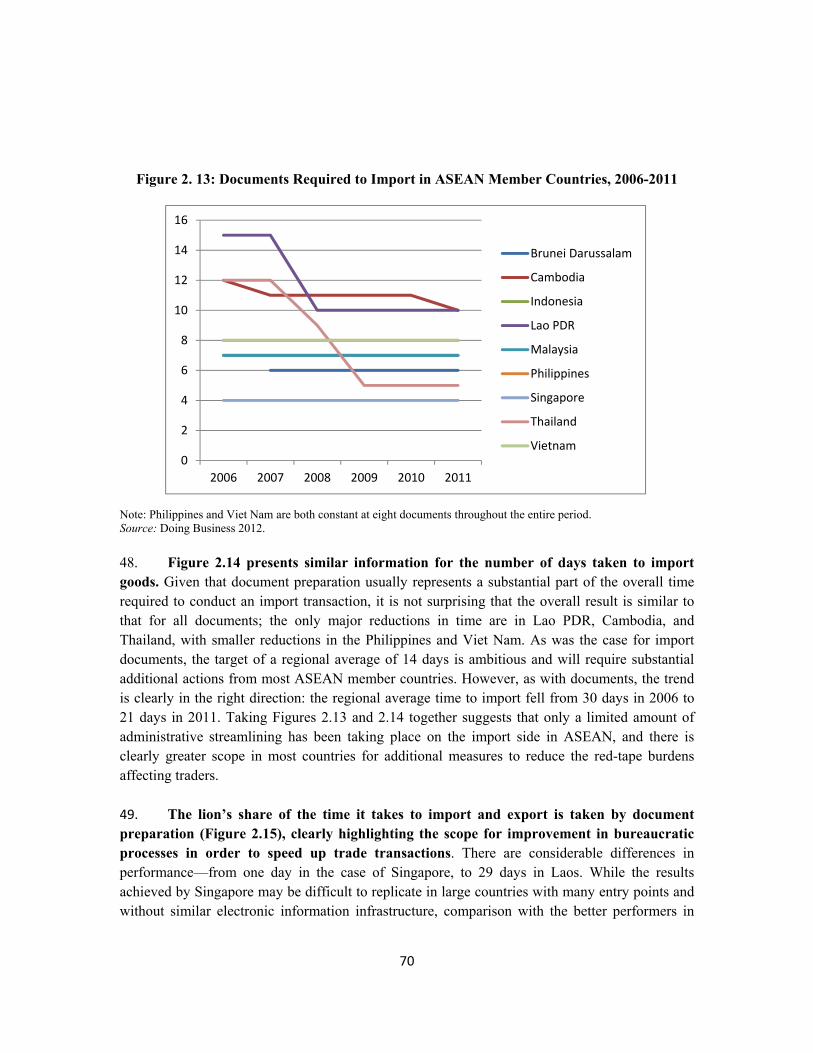
70
Figure 2. 13: Documents Required to Import in ASEAN Member Countries, 2006-2011
Note: Philippines and Viet Nam are both constant at eight documents throughout the entire period. Source: Doing Business 2012.
48. Figure 2.14 presents similar information for the number of days taken to import goods. Given that document preparation usually represents a substantial part of the overall time required to conduct an import transaction, it is not surprising that the overall result is similar to that for all documents; the only major reductions in time are in Lao PDR, Cambodia, and Thailand, with smaller reductions in the Philippines and Viet Nam. As was the case for import documents, the target of a regional average of 14 days is ambitious and will require substantial additional actions from most ASEAN member countries. However, as with documents, the trend is clearly in the right direction: the regional average time to import fell from 30 days in 2006 to 21 days in 2011. Taking Figures 2.13 and 2.14 together suggests that only a limited amount of administrative streamlining has been taking place on the import side in ASEAN, and there is clearly greater scope in most countries for additional measures to reduce the red-tape burdens affecting traders.
49. The lion’s share of the time it takes to import and export is taken by document preparation (Figure 2.15), clearly highlighting the scope for improvement in bureaucratic processes in order to speed up trade transactions. There are considerable differences in performance—from one day in the case of Singapore, to 29 days in Laos. While the results achieved by Singapore may be difficult to replicate in large countries with many entry points and without similar electronic information infrastructure, comparison with the better performers in
0
2
4
6
8
10
12
14
16
2006 2007 2008 2009 2010 2011
Brunei Darussalam
Cambodia
Indonesia
Lao PDR
Malaysia
Philippines
Singapore
Thailand
Vietnam
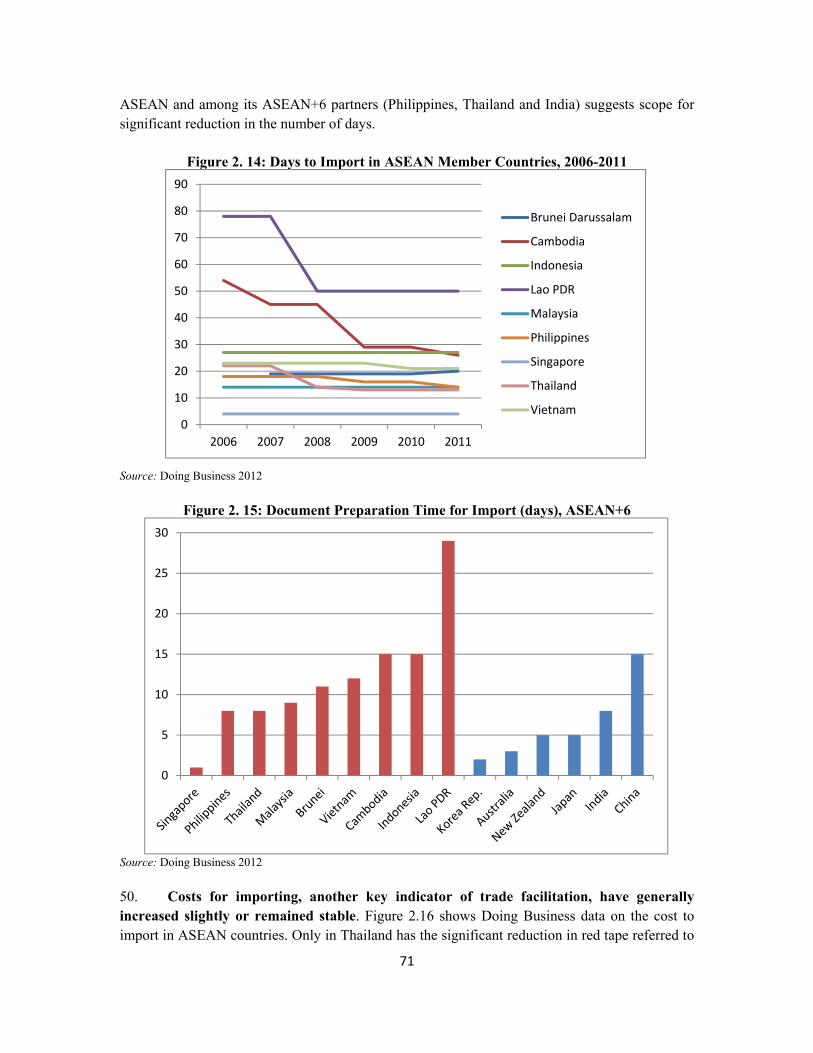
71
ASEAN and among its ASEAN+6 partners (Philippines, Thailand and India) suggests scope for significant reduction in the number of days.
Figure 2. 14: Days to Import in ASEAN Member Countries, 2006-2011
Source: Doing Business 2012
Figure 2. 15: Document Preparation Time for Import (days), ASEAN+6
Source: Doing Business 2012
50. Costs for importing, another key indicator of trade facilitation, have generally increased slightly or remained stable. Figure 2.16 shows Doing Business data on the cost to import in ASEAN countries. Only in Thailand has the significant reduction in red tape referred to
0
10
20
30
40
50
60
70
80
90
2006 2007 2008 2009 2010 2011
Brunei Darussalam
Cambodia
Indonesia
Lao PDR
Malaysia
Philippines
Singapore
Thailand
Vietnam
0
5
10
15
20
25
30
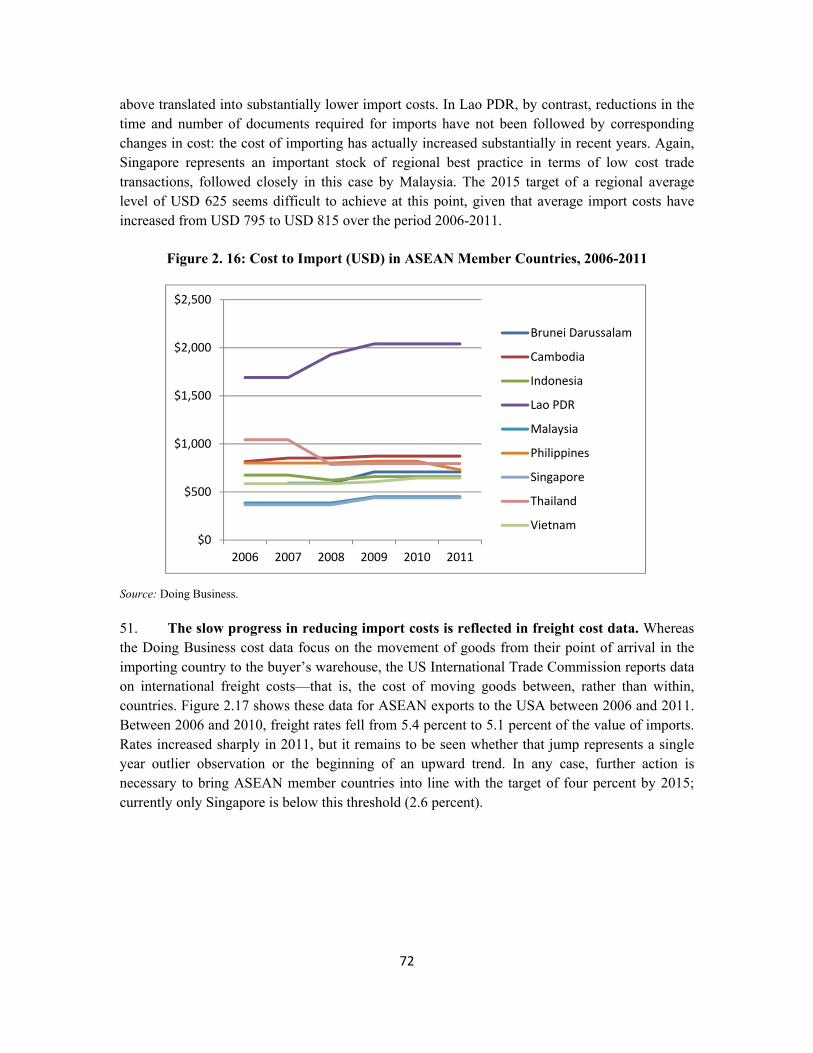
72
above translated into substantially lower import costs. In Lao PDR, by contrast, reductions in the time and number of documents required for imports have not been followed by corresponding changes in cost: the cost of importing has actually increased substantially in recent years. Again, Singapore represents an important stock of regional best practice in terms of low cost trade transactions, followed closely in this case by Malaysia. The 2015 target of a regional average level of USD 625 seems difficult to achieve at this point, given that average import costs have increased from USD 795 to USD 815 over the period 2006-2011.
Figure 2. 16: Cost to Import (USD) in ASEAN Member Countries, 2006-2011
Source: Doing Business.
51. The slow progress in reducing import costs is reflected in freight cost data. Whereas the Doing Business cost data focus on the movement of goods from their point of arrival in the importing country to the buyer’s warehouse, the US International Trade Commission reports data on international freight costs—that is, the cost of moving goods between, rather than within, countries. Figure 2.17 shows these data for ASEAN exports to the USA between 2006 and 2011. Between 2006 and 2010, freight rates fell from 5.4 percent to 5.1 percent of the value of imports. Rates increased sharply in 2011, but it remains to be seen whether that jump represents a single year outlier observation or the beginning of an upward trend. In any case, further action is necessary to bring ASEAN member countries into line with the target of four percent by 2015; currently only Singapore is below this threshold (2.6 percent).
$0
$500
$1,000
$1,500
$2,000
$2,500
2006 2007 2008 2009 2010 2011
Brunei Darussalam
Cambodia
Indonesia
Lao PDR
Malaysia
Philippines
Singapore
Thailand
Vietnam
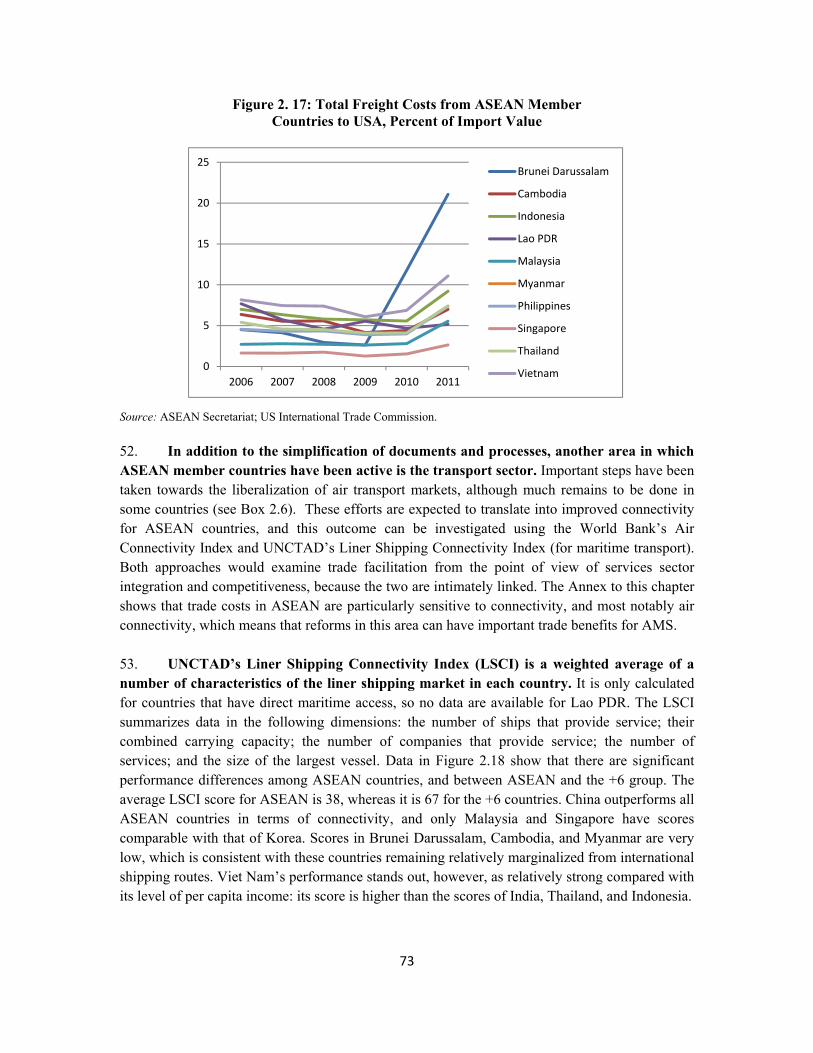
73
Figure 2. 17: Total Freight Costs from ASEAN Member Countries to USA, Percent of Import Value
Source: ASEAN Secretariat; US International Trade Commission.
52. In addition to the simplification of documents and processes, another area in which ASEAN member countries have been active is the transport sector. Important steps have been taken towards the liberalization of air transport markets, although much remains to be done in some countries (see Box 2.6). These efforts are expected to translate into improved connectivity for ASEAN countries, and this outcome can be investigated using the World Bank’s Air Connectivity Index and UNCTAD’s Liner Shipping Connectivity Index (for maritime transport). Both approaches would examine trade facilitation from the point of view of services sector integration and competitiveness, because the two are intimately linked. The Annex to this chapter shows that trade costs in ASEAN are particularly sensitive to connectivity, and most notably air connectivity, which means that reforms in this area can have important trade benefits for AMS.
53. UNCTAD’s Liner Shipping Connectivity Index (LSCI) is a weighted average of a number of characteristics of the liner shipping market in each country. It is only calculated for countries that have direct maritime access, so no data are available for Lao PDR. The LSCI summarizes data in the following dimensions: the number of ships that provide service; their combined carrying capacity; the number of companies that provide service; the number of services; and the size of the largest vessel. Data in Figure 2.18 show that there are significant performance differences among ASEAN countries, and between ASEAN and the +6 group. The average LSCI score for ASEAN is 38, whereas it is 67 for the +6 countries. China outperforms all ASEAN countries in terms of connectivity, and only Malaysia and Singapore have scores comparable with that of Korea. Scores in Brunei Darussalam, Cambodia, and Myanmar are very low, which is consistent with these countries remaining relatively marginalized from international shipping routes. Viet Nam’s performance stands out, however, as relatively strong compared with its level of per capita income: its score is higher than the scores of India, Thailand, and Indonesia.
0
5
10
15
20
25
2006 2007 2008 2009 2010 2011
Brunei Darussalam
Cambodia
Indonesia
Lao PDR
Malaysia
Myanmar
Philippines
Singapore
Thailand
Vietnam
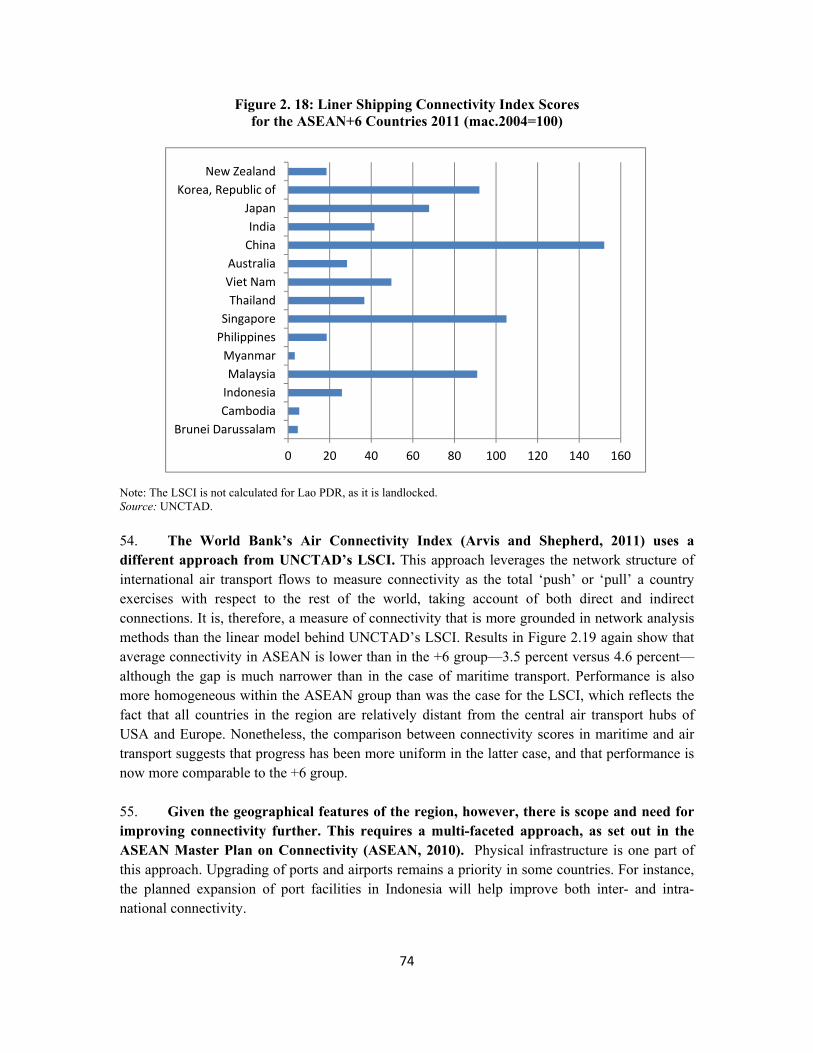
74
Figure 2. 18: Liner Shipping Connectivity Index Scores for the ASEAN+6 Countries 2011 (mac.2004=100)
Note: The LSCI is not calculated for Lao PDR, as it is landlocked. Source: UNCTAD.
54. The World Bank’s Air Connectivity Index (Arvis and Shepherd, 2011) uses a different approach from UNCTAD’s LSCI. This approach leverages the network structure of international air transport flows to measure connectivity as the total ‘push’ or ‘pull’ a country exercises with respect to the rest of the world, taking account of both direct and indirect connections. It is, therefore, a measure of connectivity that is more grounded in network analysis methods than the linear model behind UNCTAD’s LSCI. Results in Figure 2.19 again show that average connectivity in ASEAN is lower than in the +6 group—3.5 percent versus 4.6 percent—although the gap is much narrower than in the case of maritime transport. Performance is also more homogeneous within the ASEAN group than was the case for the LSCI, which reflects the fact that all countries in the region are relatively distant from the central air transport hubs of USA and Europe. Nonetheless, the comparison between connectivity scores in maritime and air transport suggests that progress has been more uniform in the latter case, and that performance is now more comparable to the +6 group. 55. Given the geographical features of the region, however, there is scope and need for improving connectivity further. This requires a multi-faceted approach, as set out in the ASEAN Master Plan on Connectivity (ASEAN, 2010). Physical infrastructure is one part of this approach. Upgrading of ports and airports remains a priority in some countries. For instance, the planned expansion of port facilities in Indonesia will help improve both inter- and intra-national connectivity.
0 20 40 60 80 100 120 140 160
Brunei DarussalamCambodiaIndonesiaMalaysia
MyanmarPhilippinesSingapore
ThailandViet NamAustralia
ChinaIndia
JapanKorea, Republic of
New Zealand
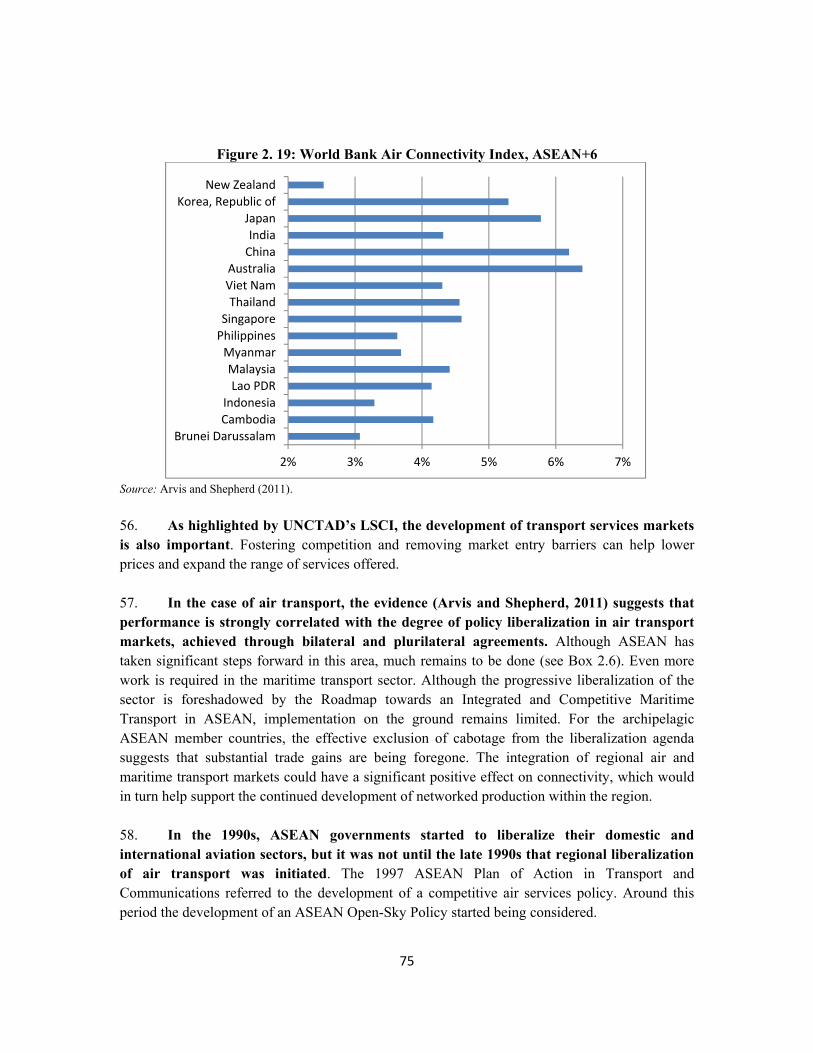
75
Figure 2. 19: World Bank Air Connectivity Index, ASEAN+6
Source: Arvis and Shepherd (2011).
56. As highlighted by UNCTAD’s LSCI, the development of transport services markets is also important. Fostering competition and removing market entry barriers can help lower prices and expand the range of services offered.
57. In the case of air transport, the evidence (Arvis and Shepherd, 2011) suggests that performance is strongly correlated with the degree of policy liberalization in air transport markets, achieved through bilateral and plurilateral agreements. Although ASEAN has taken significant steps forward in this area, much remains to be done (see Box 2.6). Even more work is required in the maritime transport sector. Although the progressive liberalization of the sector is foreshadowed by the Roadmap towards an Integrated and Competitive Maritime Transport in ASEAN, implementation on the ground remains limited. For the archipelagic ASEAN member countries, the effective exclusion of cabotage from the liberalization agenda suggests that substantial trade gains are being foregone. The integration of regional air and maritime transport markets could have a significant positive effect on connectivity, which would in turn help support the continued development of networked production within the region.
58. In the 1990s, ASEAN governments started to liberalize their domestic and international aviation sectors, but it was not until the late 1990s that regional liberalization of air transport was initiated. The 1997 ASEAN Plan of Action in Transport and Communications referred to the development of a competitive air services policy. Around this period the development of an ASEAN Open-Sky Policy started being considered.
2% 3% 4% 5% 6% 7%
Brunei DarussalamCambodiaIndonesia
Lao PDRMalaysia
MyanmarPhilippinesSingapore
ThailandViet NamAustralia
ChinaIndia
JapanKorea, Republic of
New Zealand
76
Box 2. 6: Air Transport Liberalization: From Open Skies to the ASEAN Single Aviation Market
In contrast with many other areas of trade facilitation, air services require joint action because they inherently involve at least two, and sometimes more, countries. At the 1995 fifth ASEAN summit in Bangkok, members included the development of an Open Sky Policy in the Plan of Action for Transport and Communications (1994-1996). At the same time, ASEAN members adopted a Framework Agreement on Services (AFAS) to liberalize services trade, including air transport.
In 2002, the ASEAN Memorandum of Understanding (MOU) on Air Freight Services was signed. This liberalization was limited only to all-cargo services up to 100 tons weekly based on a point-to-point route, with no limitations on frequency and aircraft type. The MOU provides for first, second, third, fourth, and fifth freedom rights within the region. In 2007, the agreement was amended to increase the authorized capacity to 250 tons weekly.
It was not until the Bali ASEAN leaders’ summit in October 2003 that liberalization in air transport was formally identified as one of 11 priority sectors. The Road Map for Integration of Air Travel Sector (RIATS) was subsequently adopted in November 2004, together with an Action Plan for ASEAN Air Transport Integration and Liberalization 2005-2010. Both instruments laid down a 2015 date for achieving what is effectively an open-skies regime for the entire ASEAN region. They also foresaw the full liberalization of air freight services by December 2008, and ASEAN-wide liberalization of scheduled passenger services, with no limitation in fifth freedom traffic rights for the capital cities of each member country by 2010.
Under the Road Map, the ASEAN “2+X” approach was adopted, according to which two or more ASEAN member countries could sign an agreement on a plurilateral, multilateral or sub-regional basis that other AMS could join when ready.
The Multilateral Agreement on Air Services (MAAS) and the Multilateral Agreement on the Full Liberalization of Passenger Air Services (MAFLPAS) were signed by all AMS in May 2009 and November 2010. Both agreements followed the agreement the Multilateral Agreement on the Full Liberalization of All Cargo Air Services (MAFLAFS) signed 10 months earlier. The MAAS provides for unlimited traffic rights between members, including fifth
freedom rights, more liberal provisions on tariffs, as well as no
limitations on route structures, frequency, capacity, and the number of designated airlines. MAFLPAS has similar provisions.
Under the Road Map, full liberalization of third and fourth freedom rights between ASEAN capital cities was to be achieved by 31 December 2008. This was to be followed by the full liberalization of fifth freedom traffic rights between ASEAN capital cities by December 31, 2010. However, this has not yet been achieved because so far three AMS (Cambodia, Indonesia and Lao PDR) have not ratified MAFLPAS, and
two AMS (Indonesia and the Philippines) have not ratified protocol 6 (on fifth freedom rights) of MAAS.41
41 As of July 27, 2012.
77
Box 2. 7: Air Transport Liberalization: From Open Skies to the ASEAN Single Aviation Market (continued)
There are several sub-regional agreements, such as, among CLMV, the Indonesia-Malaysia-Thailand Growth Triangle (IMT-GT), and Brunei, Indonesia, Malaysia and Philippines East ASEAN Growth Area (BIMPEAGA), which allow for up to fifth freedom rights and potentially more liberal measures.
With respect to bilateral liberalization agreements with third partners, ASEAN is now engaging as a regional grouping; ASEAN has already secured an agreement with China opening third and fourth freedom rights without limitations. Negotiations are now underway to deepen this agreement with the Republic of Korea and India.
Spurred by the liberalization of the ASEAN air market, the number of airlines in the region doubled between 1998 and 2010, notably with the entry of several low cost carriers. Airlines have established subsidiaries in ASEAN member countries, taking advantage of liberal rules for investment in order to expand their regional supply and in some instances circumvent the non-implementation of fifth freedom rights. Malaysia’s low cost carrier AirAsia engaged in joint ventures to form Thai AirAsia in Thailand,
Indonesia Air Asia, and Philippines Air Asia.42
The next step for ASEAN nations should be the development of the ASEAN Single Aviation Market (ASAM). ASAM aspires to consolidate the existing Open Skies agreements and to be broader in scope, covering all the elements of economic operation of airlines (market access, including 7th freedom rights, and the concept of ASEAN community carrier, tariffs, consumer protection, non-scheduled flights, airport rules, etc.) some of which are not covered yet but for which negotiations are ongoing. The ASAM is also considering extension to regulatory aspects of air safety and security and air traffic management, with the objective of an ASEAN-wide air traffic control system.
Source: Authors compilation
42 Tham (2008).
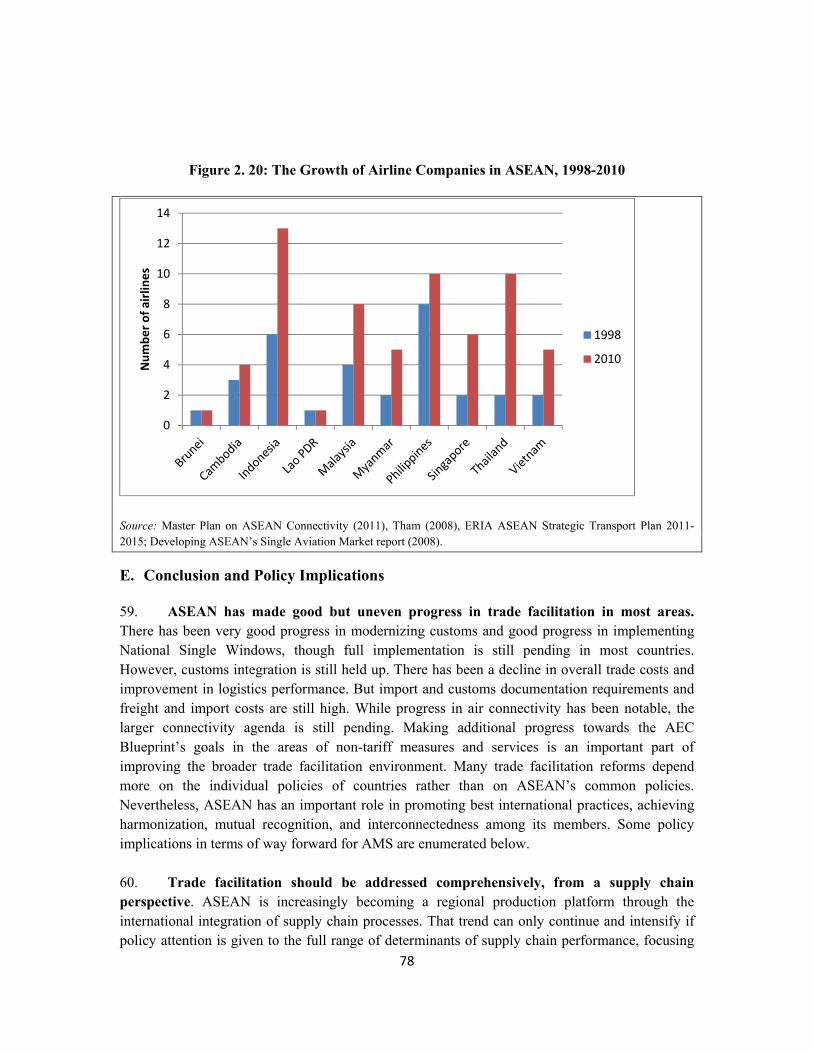
78
Figure 2. 20: The Growth of Airline Companies in ASEAN, 1998-2010
Source: Master Plan on ASEAN Connectivity (2011), Tham (2008), ERIA ASEAN Strategic Transport Plan 2011-2015; Developing ASEAN’s Single Aviation Market report (2008).
E. Conclusion and Policy Implications
59. ASEAN has made good but uneven progress in trade facilitation in most areas. There has been very good progress in modernizing customs and good progress in implementing National Single Windows, though full implementation is still pending in most countries. However, customs integration is still held up. There has been a decline in overall trade costs and improvement in logistics performance. But import and customs documentation requirements and freight and import costs are still high. While progress in air connectivity has been notable, the larger connectivity agenda is still pending. Making additional progress towards the AEC Blueprint’s goals in the areas of non-tariff measures and services is an important part of improving the broader trade facilitation environment. Many trade facilitation reforms depend more on the individual policies of countries rather than on ASEAN’s common policies. Nevertheless, ASEAN has an important role in promoting best international practices, achieving harmonization, mutual recognition, and interconnectedness among its members. Some policy implications in terms of way forward for AMS are enumerated below. 60. Trade facilitation should be addressed comprehensively, from a supply chain perspective. ASEAN is increasingly becoming a regional production platform through the international integration of supply chain processes. That trend can only continue and intensify if policy attention is given to the full range of determinants of supply chain performance, focusing
0
2
4
6
8
10
12
14
Num
ber o
f airl
ines
1998
2010
79
on time, cost, and, above all, uncertainty. Arvis et al. (2012) argue that those countries that are successful in improving supply chain performance tend to do so by moving forward on multiple fronts simultaneously, because a supply chain is only as strong as its weakest link. Addressing the root causes of delays and uncertainty—including logistics regulation, transport markets, infrastructure, and governance—will be important priorities for AMS moving forward. Again, it is important for AMS to exploit synergies between their work on trade facilitation and work in other areas—particularly non-tariff measures and services—to ensure maximum progress. 61. Administrative streamlining is one important way in which supply chain costs can be reduced, thereby facilitating trade. Recent data show that although there has been progress within ASEAN on reducing the number of administrative formalities involved in trade transactions, there is still much room for improvement in many countries. Indeed, the ambitious targets set by ASEAN will only be reached if efforts are redoubled in this area. One issue that deserves further attention in some countries is the number of agencies involved in trade. For instance, in Cambodia, the existence of two customs entities (customs itself and CamControl) delays customs processing. In Viet Nam, there is poor coordination among the various trade facilitation measures that are undertaken. To some extent, the program of National Single Windows should go some way towards addressing some of these issues, but it is not a solution on its own without additional administrative streamlining. In any case, only some AMS have made significant progress towards implementation of this program. In addition to facilitating information flows, it is also necessary to consolidate and rationalize administrative functions. Also, ASEAN-wide cooperation could help streamline the performance of agencies involved in the border clearance process, looking beyond customs to consider the full range of administrative agencies that deal with export and import transactions. 62. In tandem with administrative streamlining, it will be important to improve supply chain governance in some countries. Unofficial payments and other criminal activities are serious issues for trade facilitation performance in some AMS. Research shows that improving trade facilitation performance by reducing time and formalities is in fact one way of improving supply chain governance, because it decreases the incentive for traders to engage in informal activities (Shepherd, 2009). In addition to administrative streamlining, improvements in human capital and institutional strengthening are also important for better supply chain governance. Increasing transparency can also help, and the biennial Trade Facilitation Assessments by individual AMS can play an important role in this regard. The same is true of the planned ASEAN Trade Repository. 63. As part of a comprehensive approach, trade facilitation reforms should go beyond administrative streamlining to deal with the integration of key services markets across the region. Logistics and air transport services have already seen considerable progress being made within the region, but much remains to be done in terms of creating single regional markets for these services. The same point applies with greater force to maritime transport, and it is notable that maritime cabotage is currently not part of the ASEAN integration agenda—potentially foregoing significant welfare gains, particularly for archipelagic AMS. Integration of regional trade services markets could help reduce prices, expand the range of services available, and
80
improve efficiency. One part of a successful integration strategy will be openness to investment from outside the region in key areas of transport and logistics services. Japan, for example, is now investing heavily in core services markets in ASEAN with the aim of establishing regional hubs that can then supply services ASEAN-wide (see more in Chapter 3 of this report). The result of more integrated regional services markets would be an increase in regional goods trade, and particularly trade within production networks that rely on well-functioning services markets for their growth. Continued liberalization of key services markets is therefore an important aspect of trade facilitation, which overlaps with the services component of the AEC Blueprint. 64. Given the repository of global best practice within ASEAN, targeted capacity building can play an important role in improving trade facilitation performance. Although performance in many areas is quite heterogeneous across AMS, the presence of global supply chain leader Singapore is a valuable regional asset. The same is true of the increasingly close relationship with the +6 countries, many of which outperform ASEAN on average in several areas of trade facilitation. There is much that AMS can learn from regional experience; the development of targeted programs of capacity building in the areas identified above could help loosen existing constraints and improve trade facilitation performance across the region.
81
Technical Annex to Chapter 2: Impact of ASEAN Integration on Trade Costs and Logistics Indicators
1. This Annex examines the impact of ASEAN economic integration on intra- and extra-regional trade costs, and provides some indications as to the likely effects on trade flows. Particular attention is paid to identifying the sources of trade costs that are most important in the ASEAN context, and highlighting the different sensitivities of trade in manufactured goods and agricultural products to changes in trade costs. Whereas previous work on measuring the effects of ASEAN integration has used gravity modeling, this Annex uses a new approach that makes it possible to focus directly on the links between different policy variables and trade costs. Therefore, it provides important evidence on the mechanisms available to enhance market integration in the region.
Trade Impacts of ASEAN: A Review of the Evidence
2. A number of previous papers have attempted to quantify the impact of improving market integration in ASEAN. Two contributions focus on tariffs in particular. Manchin and Pelkmans-Balaoing (2008) use a gravity model to show that ASEAN Free Trade Area (AFTA) preferences have a positive and significant effect on intra-regional trade. They also find, however, that a threshold effect is in operation: very small preference margins do not have any significant impact on trade, whereas larger preferences do. 3. Calvo-Pardo et al. (2009) take a broader approach to tariffs by looking at both intra- and extra-regional trade. They do not use a gravity model approach, but instead use fixed effects to control for a wide range of unobserved influences on trade flows. In line with Manchin and Pelkmans-Balaoing (2008), they also find that AFTA preferences are associated with more intra-regional trade. In addition, however, their results also suggest that AFTA tends to promote trade with non-members too. They suggest that one reason for the complementarity between intra- and extra-regional trade is that trade flows within ASEAN consist of a relatively high proportion of intermediate goods. As a result, liberalization of intra-regional trade flows tends to lead to greater regional exports of final goods in addition to increased intra-regional trade in intermediates. 4. The authors also investigate the relationship between intra-regional trade liberalization in ASEAN and extra-regional liberalization in the form of reduced tariffs vis-à-vis the rest of the world. In line with their results for trade flows, they find that preferential liberalization tends to be associated with tariff reductions for other trading partners too. ASEAN therefore tends to act as a building block, rather than a stumbling block, in relation to multilateral liberalization. Taking these two sets of results together, the findings of Calvo-Pardo et al. (2009) tend to suggest on a policy level that ASEAN’s effects are primarily trade creating, and that any trade diversion is likely to be slight. 5. Tariffs, of course, are not the only item on the ASEAN economic integration agenda. Shepherd and Wilson (2009) take a broader approach, focusing on trade facilitation. They use a
82
gravity model to assess the sensitivity of intra-ASEAN trade flows to changes in the four main dimensions of trade facilitation defined as: efficiency of maritime ports; efficiency of airports; the extent of irregular payments in relation to import/export licenses; and the level of competition among internet service providers as a proxy for the regulation of backbone services sectors. They find that trade flows in Southeast Asia are particularly sensitive to the quality of air transport infrastructure, and the performance of backbone services sectors. Using the gravity model for counterfactual simulations suggests that improving trade facilitation performance in each country to the regional average could result in substantial trade gains, well in excess of those produced by comparable tariff reductions. Improving the quality of port facilities in this way could increase intraregional trade by 7.5 percent, or USD 22 billion. 6. A number of more recent contributions have used alternative methodological approaches to examine the landscape of trade costs in ASEAN, rather than just focusing on particular factors, such as tariffs or trade facilitation, and their links to trade flows. Sourdin and Pomfret (2009) use the gap between import (CIF) and export (FOB) prices reported by Australia to develop an index of trade costs for ASEAN countries. In line with the results reported in Chapter 2, they find that trade costs for the ASEAN-5 have fallen substantially over recent years, perhaps by as much as 50 percent between 1990 and 2007.43 7. Other measures of trade costs also confirm the decline of trade costs in some ASEAN countries. Shepherd (2010), for instance, uses a different measure of trade costs, calculated using a similar methodology to the one applied in Chapter 2 of this report. The study covers a broader range of factors than the data considered by Sourdin and Pomfret (2009), which essentially capture international transport costs. The author finds that even this broader measure of trade costs has fallen substantially over recent years, by between five and 10 percent between 2001 and 2007. Performance differs substantially across countries, however, with Viet Nam standing out as having experienced major trade cost reductions, whereas performance improvements are more moderate in other ASEAN countries. 8. In another study, Duval and Utoktham (2010) take a similar approach to calculating trade costs, and examine ASEAN in comparative perspective with other Asian sub-regions. They find that trade costs in ASEAN are generally lower than elsewhere, both in intra- and extra-regional dimensions. Intra-regional trade costs in ASEAN are indeed found to be comparable to those in NAFTA, which the authors conclude is indicative of a high level of economic integration. ASEAN substantially reduced its level of trade costs between 1996 and 2001, but improvements appear to have been much slower afterwards. 9. Although there is thus a growing body of work on trade costs in ASEAN, as well as the roles played by tariffs and trade facilitation in promoting trade, there is still much to be done in terms of understanding the determinants of trade costs in the region. Recent work has shown that trade costs have been reduced in recent years, but has not examined the policy
43 Indonesia, Malaysia, the Philippines, Singapore, and Thailand.
83
factors at work behind that outcome. The present chapter represents a contribution moving in that direction, as it breaks down the overall trade costs observed in ASEAN into components stemming from geographical and historical links, tariffs, transport and trade facilitation, logistics performance, and behind-the-border barriers.
Trade Costs Dataset and Model
10. Arvis et al. (2013) use newly collected data on trade and production in 178 countries to infer estimates of trade costs in agriculture and manufactured goods for the 1995-2010 period. Their approach is based on the inverse gravity methodology of Novy (2012). Whereas traditional gravity modeling provides estimates of the sensitivity of trade flows with respect to particular trade cost factors, inverse gravity modeling calculates trade costs based on the observed pattern of intra- and international trade across countries. It is then possible to use econometric methods to decompose trade costs into their component parts, using data on observable trade cost factors. This approach produces two sets of results. The first, discussed in Chapter 2, is a set of estimates of the level and rate of change of trade costs for particular countries and groups. The second set of results, the focus of the discussion here, estimates the extent to which different policy and non-policy factors affect trade costs. 11. As in Chapter 2, the trade costs estimates used in this part of the analysis include all factors that drive a wedge between export and import prices. Therefore, they take account of factors like geographical distance—which makes exporting and importing more costly—as well as traditional and non-traditional policy measures that affect the transaction costs associated with international trade. These measures of trade costs are thus all inclusive, in the sense that they cover both observable and unobservable factors. 12. The data used for the analysis are discussed in detail in Arvis et al. (2013). Variables, definitions, and sources are set out in Table 2.3. In broad terms, the data used to calculate trade costs come from the following sources: WITS-Comtrade for international trade data, adjusted in certain cases to account for re-exports; UN national accounts data and the World Development Indicators for domestic production data, estimated on the basis of value-added when data on a gross shipments basis are missing; and; an assumed elasticity of substitution among varieties within a sector equal to eight. The remaining variables used for the econometric model are standard indicators of trade costs from the gravity model literature, covering policy and non-policy factors.
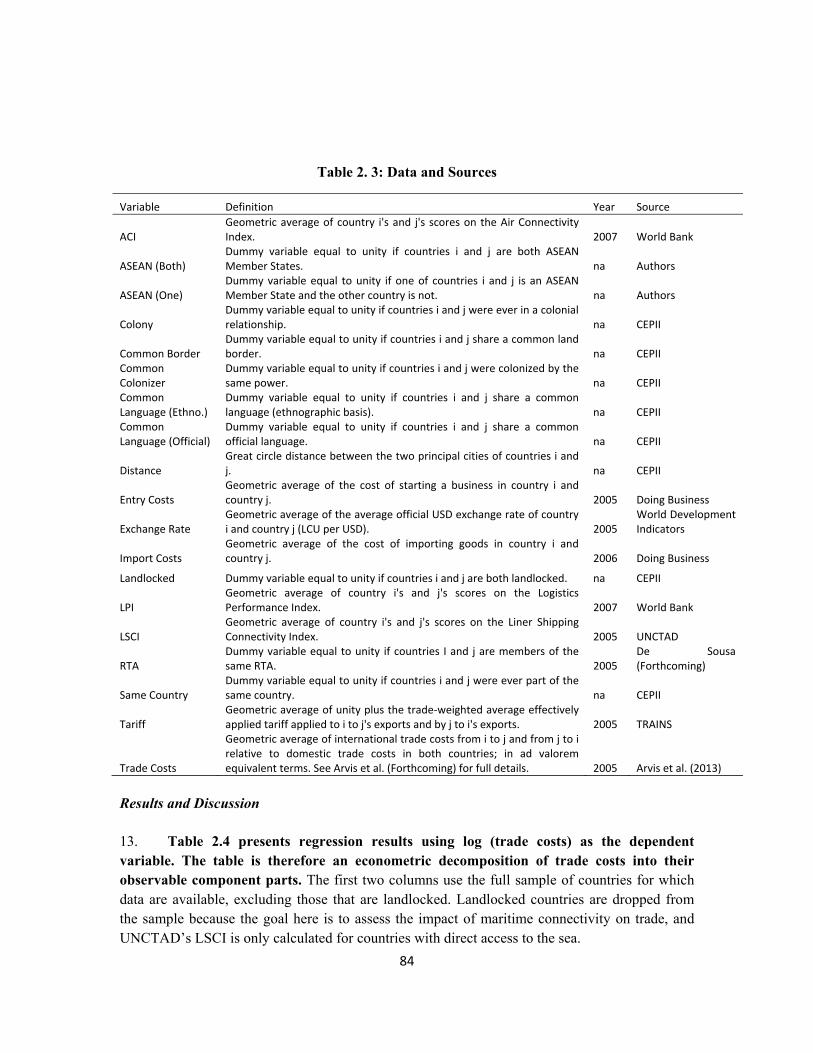
84
Table 2. 3: Data and Sources
Variable Definition Year Source
ACI Geometric average of country i's and j's scores on the Air Connectivity Index. 2007 World Bank
ASEAN (Both) Dummy variable equal to unity if countries i and j are both ASEAN Member States. na Authors
ASEAN (One) Dummy variable equal to unity if one of countries i and j is an ASEAN Member State and the other country is not. na Authors
Colony Dummy variable equal to unity if countries i and j were ever in a colonial relationship. na CEPII
Common Border Dummy variable equal to unity if countries i and j share a common land border. na CEPII
Common Colonizer
Dummy variable equal to unity if countries i and j were colonized by the same power. na CEPII
Common Language (Ethno.)
Dummy variable equal to unity if countries i and j share a common language (ethnographic basis). na CEPII
Common Language (Official)
Dummy variable equal to unity if countries i and j share a common official language. na CEPII
Distance Great circle distance between the two principal cities of countries i and j. na CEPII
Entry Costs Geometric average of the cost of starting a business in country i and country j. 2005 Doing Business
Exchange Rate Geometric average of the average official USD exchange rate of country i and country j (LCU per USD). 2005
World Development Indicators
Import Costs Geometric average of the cost of importing goods in country i and country j. 2006 Doing Business
Landlocked Dummy variable equal to unity if countries i and j are both landlocked. na CEPII
LPI Geometric average of country i's and j's scores on the Logistics Performance Index. 2007 World Bank
LSCI Geometric average of country i's and j's scores on the Liner Shipping Connectivity Index. 2005 UNCTAD
RTA Dummy variable equal to unity if countries I and j are members of the same RTA. 2005
De Sousa (Forthcoming)
Same Country Dummy variable equal to unity if countries i and j were ever part of the same country. na CEPII
Tariff Geometric average of unity plus the trade-weighted average effectively applied tariff applied to i to j's exports and by j to i's exports. 2005 TRAINS
Trade Costs
Geometric average of international trade costs from i to j and from j to i relative to domestic trade costs in both countries; in ad valorem equivalent terms. See Arvis et al. (Forthcoming) for full details. 2005 Arvis et al. (2013)
Results and Discussion
13. Table 2.4 presents regression results using log (trade costs) as the dependent variable. The table is therefore an econometric decomposition of trade costs into their observable component parts. The first two columns use the full sample of countries for which data are available, excluding those that are landlocked. Landlocked countries are dropped from the sample because the goal here is to assess the impact of maritime connectivity on trade, and UNCTAD’s LSCI is only calculated for countries with direct access to the sea.
85
14. Considering column 1 (manufacturing) first, the results show most of the variables in the model have statistically significant coefficients with the expected signs and sensible magnitudes. Distance, higher import costs, and higher market entry costs are both positively associated with trade costs, while geographical contiguity, a common language, a colonial link, membership of an RTA, a weaker exchange rate, better air and maritime connectivity, and stronger logistics performance are all negatively associated with trade costs. Interestingly, of the two ASEAN dummies, only ASEAN (one) has a statistically significant coefficient, although both dummies carry the expected negative sign. This result means that after controlling for other factors—including the average impact of RTA membership—trade costs within ASEAN are not substantially lower than for other country pairs, but trade costs for country pairs involving just one ASEAN member are significantly lower, by around six percent. This finding fits well with the results discussed above that tend to show that ASEAN produces minimal trade diversion. Indeed, our result is consistent with an important role for unilateral reform on a most favored nation (MFN) basis as part of the ASEAN liberalization process. In manufactured goods, there is little evidence that intra-regional preferences play a stronger role than would be expected based on the average relationship between trade costs and membership of a Regional Trade Agreement (RTA). 15. Column 2 presents results for agriculture, again using the full sample. Results are broadly similar to those for manufacturing, although Doing Business import costs have an unexpected negatively signed and statistically significant coefficient. There are also some important differences from a policy perspective. First, trade costs in agriculture are considerably less sensitive to transport connectivity than in manufacturing: the coefficient on maritime connectivity is smaller in absolute value, and the coefficient on air connectivity is no longer statistically significant. The same is true of logistics performance, which has a much smaller (in absolute value) coefficient in the agriculture regression. Improvements in these areas are thus of particular importance for exports of manufactured goods.
16. The second important point of difference between the agriculture and manufacturing regressions relates to the impact of ASEAN. In agriculture, both ASEAN dummies have negative coefficients that are statistically significant. The impact of both countries being ASEAN members is to reduce trade costs by around 20 percent compared with other country pairs. The impact of a single ASEAN member is to reduce trade costs by around 12 percent. Although there is evidence of significant intra-regional preferences in this case, the extent of trade diversion is still likely to be slight given that ASEAN membership reduces both intra- and extra-regional trade costs. This result contrasts with the raw data presented in Chapter 2, in which it is highlighted that trade costs in agriculture have been relatively flat in a dynamic sense over recent years. The regression results show that even though trade costs in agriculture are changing slowly, if at all, in ASEAN they still tend to be lower than comparable country pairs after controlling for other factors. Nonetheless, as highlighted in Chapter 2, trade costs in agriculture remain very high, and substantial additional work is required to reduce them.

86
Table 2. 4: Regression Results Using Log of Trade Costs as the Dependent Variable
(1) (2) (3) (4)
Manufacturing Agriculture Manufacturing Agriculture
ASEAN (Both) -0.082 -0.217** -0.004 -0.079
(0.390) (0.011) (0.984) (0.577)
ASEAN (One) -0.064*** -0.127***
(0.004) (0.000)
Log (Distance) 0.306*** 0.189*** 0.403*** 0.078**
(0.000) (0.000) (0.000) (0.019)
Common Border -0.315*** -0.228*** -0.147 -0.391***
(0.000) (0.000) (0.383) (0.000)
Common Language (Ethno.) 0.016 -0.047 0.225* 0.095
(0.610) (0.274) (0.059) (0.247)
Common Language (Official) -0.156*** -0.088* -0.201 -0.182*
(0.000) (0.052) (0.157) (0.052)
Colony -0.167*** -0.136*** -0.366 -0.010
(0.005) (0.002) (0.115) (0.949)
Common Colonizer -0.061* 0.006 0.089 0.029
(0.064) (0.863) (0.181) (0.615)
Same Country -0.147 -0.171** -0.001 -0.169
(0.157) (0.039) (0.998) (0.125)
Log(Tariff) 0.037 0.022 0.200 0.014
(0.562) (0.688) (0.268) (0.915)
RTA -0.126*** -0.052 0.009 -0.139
(0.000) (0.122) (0.954) (0.201)
Log(Exchange Rate) -0.010*** -0.003 -0.017*** -0.031***
(0.000) (0.401) (0.001) (0.000)
Log(LSCI) -0.189*** -0.114*** -0.175*** -0.198***
(0.000) (0.000) (0.000) (0.000)
Log(ACI) -0.035*** -0.011 -0.089** -0.090***
(0.002) (0.491) (0.020) (0.009)
Log(LPI) -0.418*** -0.126* -0.735*** -0.147
(0.000) (0.069) (0.000) (0.342)
Log(Import Costs) 0.026* -0.083*** -0.070* -0.056
(0.074) (0.000) (0.062) (0.180)
Log(Entry Costs) 0.021*** 0.031*** -0.039*** 0.028*
(0.000) (0.000) (0.003) (0.050)
Constant 4.066*** 5.953*** 4.983*** 6.747***
(0.000) (0.000) (0.000) (0.000)
Observations 2519 1552 474 345
R2 0.596 0.336 0.583 0.457
Note: Columns 1 and 2 include all countries for which data are available. Columns 3 and 4 only include country pairs with at least one ASEAN member country. P-values based on robust standard errors appear in parentheses below the parameter estimates. Statistical significance is indicated by * (10 percent), ** (5 percent), and *** (1 percent).
87
17. Whereas the first two columns of Table 2.4 present results using the full country sample from Arvis et al. (2013), columns 3 and 4 limit consideration to country pairs including at least one ASEAN member. The sample is therefore limited to intra- and extra-regional trade costs in ASEAN. It is important to be cautious in interpreting these results, as the sample size is much smaller than for columns 1 and 2. Nonetheless, some interesting results emerge. First, the level of the exchange rate matters much more for trade costs in ASEAN than it does elsewhere, both in manufacturing and agriculture. This finding is consistent with the export-led growth strategies followed by many AMS, in which a competitive exchange rate plays a key role. 18. Second, air connectivity is a much more important factor influencing trade costs in ASEAN compared with other regions: the relevant coefficients are much larger in absolute value in both manufacturing and agriculture. This finding is consistent with air freight playing a very important role in ASEAN trade flows, perhaps due to the extensive use of air transport and express delivery in the context of regional production networks. In any case, the important role of air transport highlights the importance of continued liberalization in this area, as discussed in Chapter 2.
19. Third, trade costs in ASEAN are relatively more sensitive to logistics performance, at least in manufactured goods. Again, the relative coefficient is much larger in absolute value for the ASEAN only sample than for the full country sample. This finding is consistent with an important role for regional production networks in ASEAN, as they rely heavily on efficient transport and logistics to move component parts across borders during the assembly process. Again, this result highlights the importance of trade facilitation in promoting additional ASEAN integration, as discussed in Chapter 2.
Simulation Results
20. The econometric decomposition of trade costs, discussed in the previous section, can be used to undertake some simulations of the impact of reform. ASEAN has set ambitious trade facilitation targets for 2015, as mentioned in Chapter 2. Progress towards those goals has been mixed, with some AMS recording strong performance to date and others continuing to lag well behind the announced goals. This section examines what the impact on trade costs would be if each AMS improved performance to the target level in three areas: logistics performance, Doing Business export costs, and Doing Business market entry costs. 21. To conduct the simulations, it is possible to simply use the estimated elasticities from Table 2.4 column 1. It is appropriate to use the full-sample regression rather than the sample limited to AMS only, as it provides more robust results due to increased size. Using the elasticities, it is a simple matter to calculate trade costs impacts. All that is necessary is to convert the difference between the baseline level and the target level into a percentage, and then use the elasticity to map that number to a percentage change in trade costs. In the case of Doing Business market entry restrictions, one can use the percentage changes in the number of days required for starting a business—which are the terms in which the ASEAN targets are couched—and apply
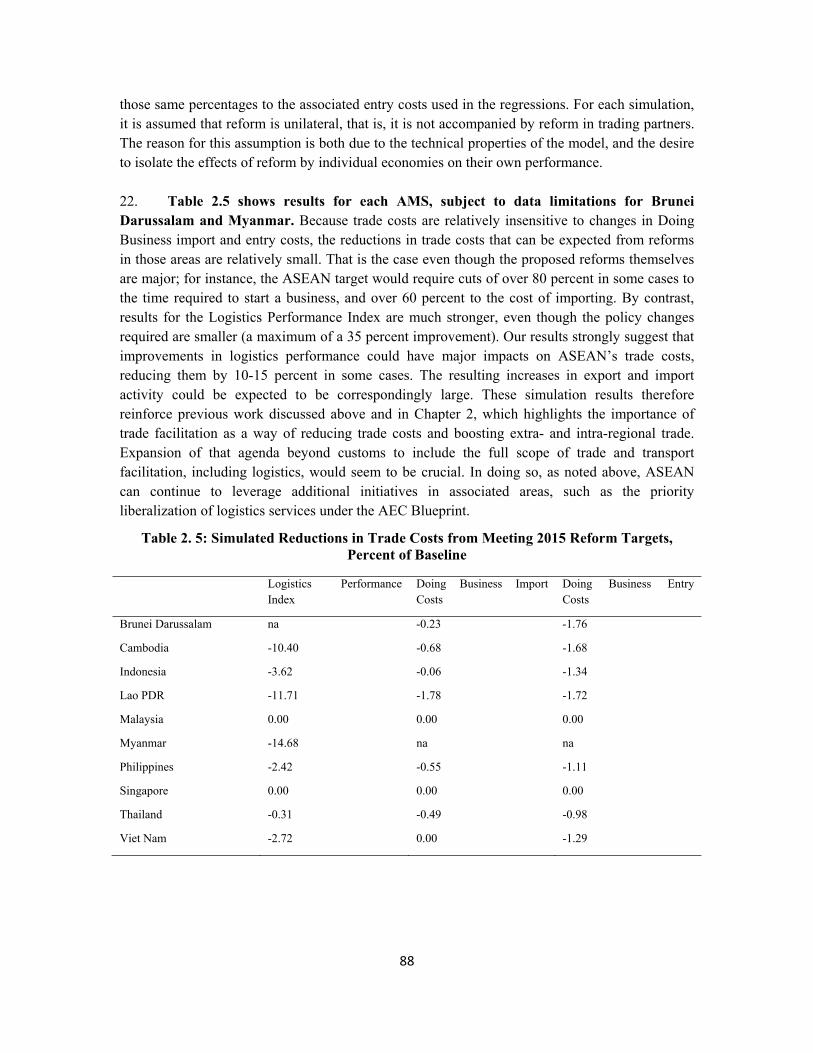
88
those same percentages to the associated entry costs used in the regressions. For each simulation, it is assumed that reform is unilateral, that is, it is not accompanied by reform in trading partners. The reason for this assumption is both due to the technical properties of the model, and the desire to isolate the effects of reform by individual economies on their own performance. 22. Table 2.5 shows results for each AMS, subject to data limitations for Brunei Darussalam and Myanmar. Because trade costs are relatively insensitive to changes in Doing Business import and entry costs, the reductions in trade costs that can be expected from reforms in those areas are relatively small. That is the case even though the proposed reforms themselves are major; for instance, the ASEAN target would require cuts of over 80 percent in some cases to the time required to start a business, and over 60 percent to the cost of importing. By contrast, results for the Logistics Performance Index are much stronger, even though the policy changes required are smaller (a maximum of a 35 percent improvement). Our results strongly suggest that improvements in logistics performance could have major impacts on ASEAN’s trade costs, reducing them by 10-15 percent in some cases. The resulting increases in export and import activity could be expected to be correspondingly large. These simulation results therefore reinforce previous work discussed above and in Chapter 2, which highlights the importance of trade facilitation as a way of reducing trade costs and boosting extra- and intra-regional trade. Expansion of that agenda beyond customs to include the full scope of trade and transport facilitation, including logistics, would seem to be crucial. In doing so, as noted above, ASEAN can continue to leverage additional initiatives in associated areas, such as the priority liberalization of logistics services under the AEC Blueprint.
Table 2. 5: Simulated Reductions in Trade Costs from Meeting 2015 Reform Targets, Percent of Baseline
Logistics Performance Index
Doing Business Import Costs
Doing Business Entry Costs
Brunei Darussalam na -0.23 -1.76
Cambodia -10.40 -0.68 -1.68
Indonesia -3.62 -0.06 -1.34
Lao PDR -11.71 -1.78 -1.72
Malaysia 0.00 0.00 0.00
Myanmar -14.68 na na
Philippines -2.42 -0.55 -1.11
Singapore 0.00 0.00 0.00
Thailand -0.31 -0.49 -0.98
Viet Nam -2.72 0.00 -1.29
89
Conclusion and Policy Implications
23. This Annex has linked the policy targets from ASEAN’s trade facilitation work with the key outcome indicator of extra- and intra-regional trade costs. It has shown that a number of the priority trade facilitation areas for ASEAN, such as logistics performance, import costs, and market entry costs, can have substantial impacts on trade costs. Simulation evidence suggests that the projected improvements in logistics performance are likely to bring the biggest benefits in terms of lower trade costs compared with the other policy areas, even though the policy changes tend to be larger in those other areas. The reason is that logistics performance is very closely linked to the overall level of trade costs. Moreover, the econometric evidence presented here suggests that trade costs in ASEAN are more sensitive to logistics performance than is the case elsewhere around the world, perhaps because of the prevalence of regional production networks that rely heavily on the ability to move goods—particularly parts and components—across borders quickly, reliably, and frequently. 24. In policy terms, these findings strengthen the case for giving renewed attention to trade facilitation in the context of ongoing efforts at regional integration under the AEC Blueprint. Moreover, as noted in Chapter 2, trade facilitation is closely linked to other regional initiatives in areas such as logistics services. Given the key importance of logistics performance as a driver of trade costs, it will be important for policymakers to focus on achieving the liberalization goals for that sector set out in the AEC Blueprint. Over time, they will also need to expand that agenda to focus more on the regulatory burdens affecting logistics operators in addition to the impacts of foreign equity limits and other ownership restrictions. The presence in the region of world leader Singapore will undoubtedly be a force for broad-based upgrading and continued liberalization of logistics services around the region, although some AMS—particularly the CLMV countries—still have a lot of work to do in this area. In terms of sequencing, and focusing in particular on the need to narrow the gap between CLMV countries and other AMS, the first priority should be introducing competition into transport and logistics markets, including road transport, by means such as liberalization of foreign investment restriction and relaxation of other barriers to entry. Once markets are reasonably competitive, countries—in particular CLMV countries—can turn to deal with measures that make it more costly for transport and logistics operators to do business. One example for road transport arises from a lack of harmonization of licensing requirements and load levels, which requires cargo transfers and changes of driver at each border crossing. Making efforts to harmonize such requirements on a regional or sub-regional level, including unilaterally, can make it possible for transport operators to do business more cost-effectively, thereby reducing the level of trade costs. 25. Beyond the specific targets set by ASEAN, the analyis presented here also suggests that well-functioning transport markets are particularly important to reducing trade costs around the region. This is true of both maritime and air transport, but the latter takes on particular significance as trade costs in ASEAN are much more sensitive to air transport connectivity than are trade costs in other parts of the world. Air transport should therefore
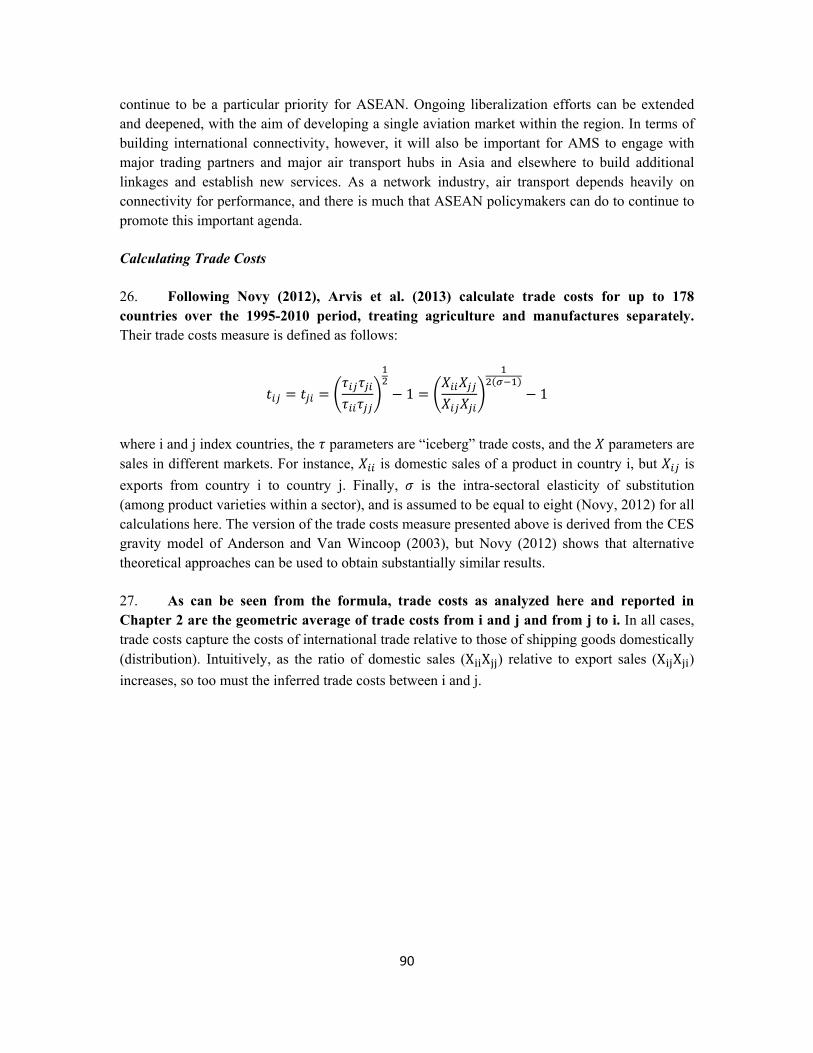
90
continue to be a particular priority for ASEAN. Ongoing liberalization efforts can be extended and deepened, with the aim of developing a single aviation market within the region. In terms of building international connectivity, however, it will also be important for AMS to engage with major trading partners and major air transport hubs in Asia and elsewhere to build additional linkages and establish new services. As a network industry, air transport depends heavily on connectivity for performance, and there is much that ASEAN policymakers can do to continue to promote this important agenda.
Calculating Trade Costs
26. Following Novy (2012), Arvis et al. (2013) calculate trade costs for up to 178 countries over the 1995-2010 period, treating agriculture and manufactures separately. Their trade costs measure is defined as follows:
= = − 1 = ( ) − 1
where i and j index countries, the parameters are “iceberg” trade costs, and the parameters are sales in different markets. For instance, is domestic sales of a product in country i, but is
exports from country i to country j. Finally, is the intra-sectoral elasticity of substitution (among product varieties within a sector), and is assumed to be equal to eight (Novy, 2012) for all calculations here. The version of the trade costs measure presented above is derived from the CES gravity model of Anderson and Van Wincoop (2003), but Novy (2012) shows that alternative theoretical approaches can be used to obtain substantially similar results.
27. As can be seen from the formula, trade costs as analyzed here and reported in Chapter 2 are the geometric average of trade costs from i and j and from j to i. In all cases, trade costs capture the costs of international trade relative to those of shipping goods domestically (distribution). Intuitively, as the ratio of domestic sales (X X ) relative to export sales (X X )
increases, so too must the inferred trade costs between i and j.
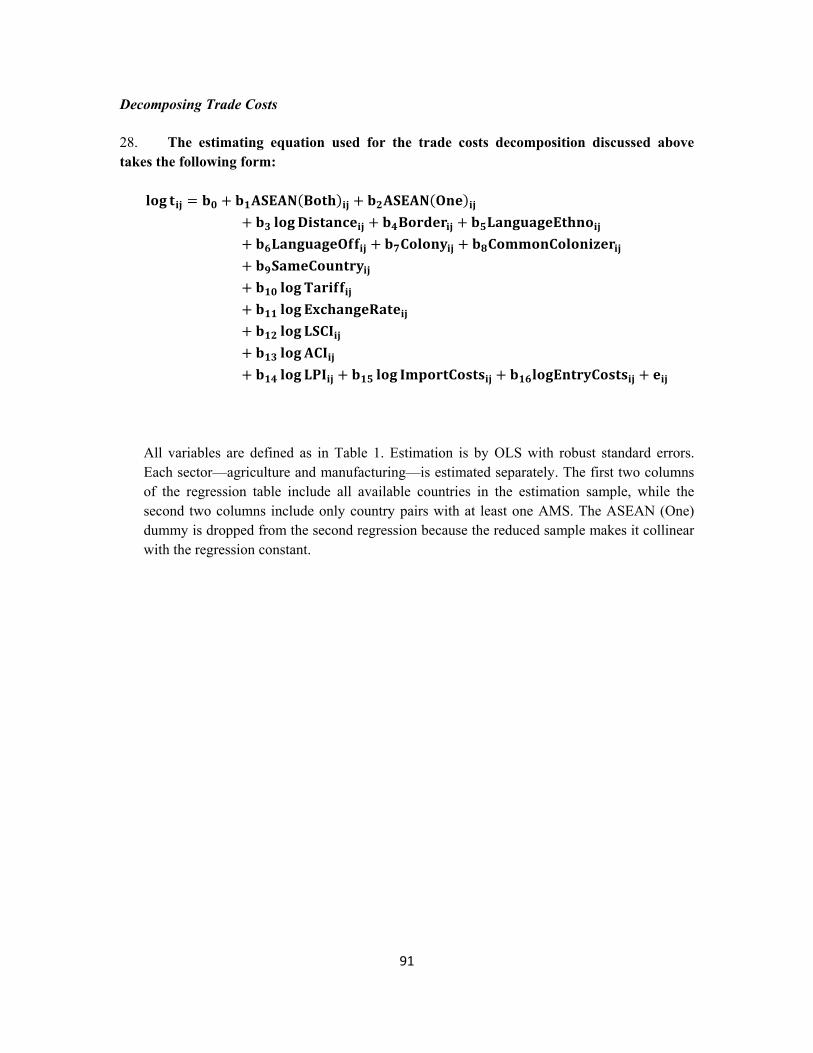
91
Decomposing Trade Costs
28. The estimating equation used for the trade costs decomposition discussed above takes the following form: = + ( ) + ( )+ + ++ + +++++++ + + +
All variables are defined as in Table 1. Estimation is by OLS with robust standard errors. Each sector—agriculture and manufacturing—is estimated separately. The first two columns of the regression table include all available countries in the estimation sample, while the second two columns include only country pairs with at least one AMS. The ASEAN (One) dummy is dropped from the second regression because the reduced sample makes it collinear with the regression constant.
92
Chapter 3: Trends and Patterns in Services Trade and Policies
A. Introduction and Key Findings
1. Services are an important and growing component of the global economy, and the growth of services trade has outpaced goods trade globally and in ASEAN Member States (AMS). On average, services contributed more than 40 percent of total value-added and more than 50 percent of total employment in 2010. However, ASEAN economies have developed equally fast growing manufacturing economies, while the services sectors in AMS have been relatively closed to international trade and investment. Despite this, the services sector has already become an important source of both output and employment in these economies. 2. Services will become increasingly critical in the future in ASEAN countries. As per capita income rises further, the demand for services will grow rapidly in ASEAN economies. On the supply side, services will become more important both through direct and indirect contribution to economic growth by improving efficiency in other sectors of the economy. Given that many service sectors, such as finance, communications and transport, provide inputs for the manufacturing sectors and other service sectors, a shift toward developing an efficient services sector could contribute to the development of a competitive manufacturing sector and thus lead to an increase in overall productivity (see Box 3.1). 3. Some ASEAN countries have already become significant exporters of modern services in sectors such as professional services and information and communication technology (ICT), including business processing outsourcing (BPO), higher education, and health tourism. Most prominent among these is Singapore, where services make up 60 percent of the economy and account for 21 percent of exports. In a few years the Philippines became the third largest player in the global BPO market, accounting for 15 percent of the market output, after India (37 percent) and Canada (27 percent). In the Philippines, services exports as a percent of total exports increased from nine percent in 1999 to 21 percent in 2009 (Yi, 2011). Although Malaysia has had relatively more moderate success as a services exporter when compared with the case of India or the Philippines, areas such as higher education, Islamic finance, and medical and airline services are contributing to export diversification.
4. The key finding of this chapter is that despite recent progress in services sector development, the services sector in ASEAN economies remains relatively underdeveloped and actual implementation in services integration has been limited. In particular, the relative importance of services in GDP and trade is less than what would be expected given the levels of income and development in AMS. Also, while the AEC goals for ASEAN provide useful and detailed targets for the integration of services in the ASEAN region, progress has been mixed and modest. Overall, there has been progress in meeting sectoral commitment targets until the 8th Package of AFAS. But while in terms of commitments AFAS often goes beyond GATS commitments or Doha Round offers, this rarely leads to changes in the regulations that are applied in AMS. Three priorities emerge: (i) the need to focus on the implementation of services reforms to actually implement the commitments being made under AFAS negotiations; (ii) upgrading technical capacity and sectoral involvement in services trade negotiations (reforms will be important for this); and (iii) bridging the existing divide in regulatory capacity among AMS.
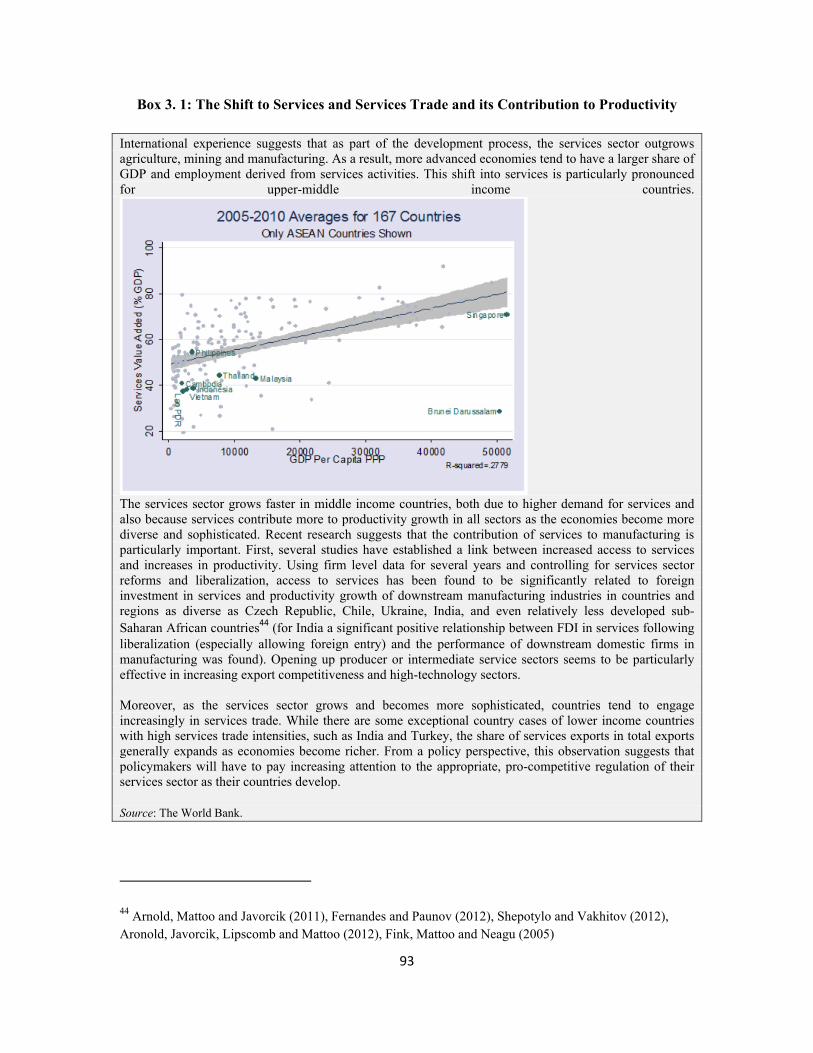
93
Box 3. 1: The Shift to Services and Services Trade and its Contribution to Productivity
International experience suggests that as part of the development process, the services sector outgrows agriculture, mining and manufacturing. As a result, more advanced economies tend to have a larger share of GDP and employment derived from services activities. This shift into services is particularly pronounced for upper-middle income countries.
The services sector grows faster in middle income countries, both due to higher demand for services and also because services contribute more to productivity growth in all sectors as the economies become more diverse and sophisticated. Recent research suggests that the contribution of services to manufacturing is particularly important. First, several studies have established a link between increased access to services and increases in productivity. Using firm level data for several years and controlling for services sector reforms and liberalization, access to services has been found to be significantly related to foreign investment in services and productivity growth of downstream manufacturing industries in countries and regions as diverse as Czech Republic, Chile, Ukraine, India, and even relatively less developed sub-Saharan African countries44 (for India a significant positive relationship between FDI in services following liberalization (especially allowing foreign entry) and the performance of downstream domestic firms in manufacturing was found). Opening up producer or intermediate service sectors seems to be particularly effective in increasing export competitiveness and high-technology sectors. Moreover, as the services sector grows and becomes more sophisticated, countries tend to engage increasingly in services trade. While there are some exceptional country cases of lower income countries with high services trade intensities, such as India and Turkey, the share of services exports in total exports generally expands as economies become richer. From a policy perspective, this observation suggests that policymakers will have to pay increasing attention to the appropriate, pro-competitive regulation of their services sector as their countries develop. Source: The World Bank.
44 Arnold, Mattoo and Javorcik (2011), Fernandes and Paunov (2012), Shepotylo and Vakhitov (2012), Aronold, Javorcik, Lipscomb and Mattoo (2012), Fink, Mattoo and Neagu (2005)

94
5. Despite these improvements, the services sector in ASEAN economies is still relatively underdeveloped. While the contribution of services growth has picked up in the past decade, the share of services in GDP remains relatively low for ASEAN economies compared to countries in other regions. Moreover, while most ASEAN countries are fairly open to goods trade, services trade openness lags behind. Regulations affecting services are relatively restrictive compared to service regimes in other regions, and vary widely from country to country and sector to sector. Also, restrictions remain high across modes of services provision and particularly for professional and transport services. Given the rapid pace of integration of ASEAN economies into the global trading system, and the intensifying pace of free trade agreement negotiations, it would be timely for their economic development to deepen and widen the integration and liberalization in services. Local services providers will be able to take advantage of new market openings and also benefit from new ideas and processes arising out of the opening up of the services sector. 6. The ASEAN countries have clearly recognized the important role that services will play in future growth and development. Thus, AEC’s 2015 goals and ASEAN Framework Agreement on Services call for commitments to progressively open services sectors to international trade to achieve regional integration in services. The ASEAN Heads of State have proclaimed “the free flow of services is one of the important elements in realizing the ASEAN Economic Community, such that by 2015 there will be substantially no restrictions to ASEAN services suppliers in providing services, and in establishing companies across national borders within the region, subject to domestic regulations.” (AEC Blueprint, pp. 10).
7. In this context, the analysis in this chapter aims to take stock of recent services sector developments. The chapter complements the ERIA Midterm Review report by focusing less on commitments made by AMS and the success in meeting jointly established commitment targets, and more on actual outcomes in services trade policies and in recent developments in services trade in the ASEAN region. Thus, the assessment investigates to what extent the commitments have triggered pro-trade reforms of regulatory regimes, and whether these, in turn, have fostered increased services trade. This attempt to measure progress on implementation and economic impacts is challenging due to deficiencies in the available information. However, a recently released database on services trade restrictions (Borchert, Gootiiz and Mattoo, 2012, World Bank Working Paper Series and http://iresearch.worldbank.org/servicestrade), as well as intra-regional trade data compiled by the ASEAN Secretariat, make it possible to shed some new light on the trends and patterns of services trade in the region. This review of services reforms is in preparation for an in-depth study of services integration that will be jointly carried out with the ASEAN Secretariat (ASEC) in 2013. 8. The rest of the chapter is organized as follows: Section B briefly discusses AEC’s goals for free trade in services and progress in meeting these goals. In addition to drawing on secondary literature, this section also shows how commitments under ASEAN compare with those made under GATS agreements. Section C uses World Bank data on six ASEAN countries to discuss actual progress on liberalizing the services trade. Section D discusses recent development in services trade in the ASEAN region. Section E investigates the status of labor mobility within ASEAN, and Section F presents some critical issues concerning domestic regulatory reforms without which the services integration agenda cannot be implemented. Section G concludes the chapter by discussing policy issues and implications.
95
B. Progress in Achieving AEC Goals for Free Trade in Services
9. In December 1995, ASEAN launched an ambitious services liberalization project called the ASEAN Framework Agreement on Services (AFAS). This agreement set a schedule of services commitments and planned eight rounds of commitments to liberalize, all negotiated under the Coordinating Committee on Services (CCS). In addition, the Working Committee on Financial Services Liberalization (WCFSL) is carrying out negotiations on financial services, and the Air Transport Working Group (ATWG) is carrying out negotiations on air transport services. WCFSL has completed five packages of commitments and ATWG has completed seven packages. 10. The main objectives of AFAS are to: (i) enhance cooperation in services amongst AMS in order to improve efficiency and competitiveness, diversify production capacity, and increase supply and distribution of service suppliers within and outside ASEAN; (ii) substantially eliminate restrictions to trade in services amongst member states; and (iii) liberalize trade in services by expanding the depth and scope of liberalization beyond those undertaken by member states under GATS, with the aim of realizing a free trade area in services.
11. The policy objectives of AFAS are to improve efficiency and competiveness, substantially eliminate trade restriction, and expand the scope and depth of AFAS beyond GATS. The modality of implementation of AFAS is primarily based on GATS. The liberalization commitments were also initially based on the ‘request and offer’ approach during the first round (1996-1998), and then gradually moved to using a more systematic approach. This approach also used specific quantitative targets, timeline and threshold parameters, as reflected under the AEC Blueprint adopted in 2007 and other parameters as set by the ASEAN Economic Ministers (AEM). Based on the scorecard assessment on AFAS, it is commonly recognized that liberalization has been mostly successful in terms of scheduling commitments made by AMS. Some degree of ‘flexibility’ in commitments to meet threshold targets has also enabled AMS to continue liberalizing their services sectors.
12. Clear liberalization targets have been laid out in the AEC Blueprint.
• ASEAN Member States will substantially remove all restrictions on trade in services for five priority integration sectors (PIS): air transport, e-ASEAN, healthcare, and tourism by 2010, and logistics services by 2013; restrictions on all other services sectors would be removed by 2015.
• There will be no restrictions on Modes 1 (cross border supply of services) and 2 (service consumption abroad), with exceptions only allowed for bona fide regulatory reasons.
• In Mode 3 (commercial presence or foreign investment), countries will work towards allowing 70 percent foreign equity participation (FEP) by 2015, as well as removing other Market Access and National Treatment restrictions.
• Concerning Mode 4, discussions have been undertaken to free the flow of skilled labor. These include conclusion and implementation of the ASEAN Agreement on Movement of Natural Persons and the mutual recognition of professional qualifications.
13. AMS made good progress in meeting sectoral commitment targets (under a liberal definition of commitments). The 7th and 8th package of commitments, however, faced delays due to a number of difficulties of AMS, including on allowing Mode 3 foreign investment that
96
exceeded 50 percent foreign ownership. Yet, as of the final quarter of 2012, all ASEAN countries have met the target for liberalization under the 8th Package of AFAS.
14. While there are issues in meeting both market access and national treatment commitments under Mode 3, the most significant difficulties have arisen on the issue of providing majority foreign equity ownership. Many ASEAN countries face significant challenge to meet the target of 51 percent of foreign equity participation. AMS have opted to use a 15 percent ‘flexibility’ option, including through committing other sectors instead of the priority (PIS) sub-sectors.
15. Three points are worth stressing here. First, the main obstacle seems to be in providing majority equity ownership. If one considers 49 percent ownership as the threshold, then AMS have done much better in committing to liberalization. If the Foreign Equity Participation (FEP) threshold continues to be a stumbling obstacle, as some AMS countries report, ASEAN may have to consider arrangements such as strategic and management control for foreign investors in firms as a way to make progress. How such arrangements could be implemented remains an issue for discussion.
16. Second, significantly, it seems that progress in liberalizing Mode 3 restrictions have been least in the case of some middle income countries. On the other hand, Cambodia, Myanmar, Viet Nam, and Indonesia have committed significantly more sub-sectors to Mode 3 liberalization thresholds. This raises important issues for domestic regulatory reforms and technicalities that are discussed in the final section.
17. Third, encouragingly, progress has been better in some key sectors. Overall, the recent ERIA study suggests that AMS such as Brunei, Cambodia, Indonesia, Laos, Malaysia, and Myanmar have done significantly better in committing to liberalize logistics sectors. Even Singapore, which has committed fewer subsectors, has made advanced commitments in telecommunications in both liberalization of overseas call market and allowing foreign ownership in local market. Malaysia and the Philippines opened up their local markets in 1995 and guaranteed market access in the international service sub-sector in 1998, despite no commitment in foreign control of telecom business.
18. The recent study on the ASEAN financial sector integration also suggests some progress in recent years on meeting financial sector integration targets set under the Roadmap for Monetary and Financial Integration. According to this study, ASEAN has completed most of the measures contributing to ASEAN financial integration in line with the AEC Blueprint targets, which follow a deferred timetable compared to other sectors. Financial sector integration is aimed to be achieved by 2020, five years after other sectors. However, the recent Joint Ministerial Statement (JMS) of the ASEAN Finance Ministers’ meeting in Brunei Darussalam in April 2013 did not mention the 2020 deadline concerning areas relating to the roadmap for ASEAN monetary and financial integration (RIA-Fin). In particular, the said JMS stated a 2015 AEC deadline under the section on financial services liberalization. In this context, ASEAN countries have particularly stepped up their commitments to open their financial services in insurance and banking services. Integration of capital markets has also intensified. Local currency bond markets are being developed, while in the equity markets regional efforts have been enhanced to broaden and deepen liquidity and market linkages. To support freer capital mobility, ASEAN has successfully completed the mutual assessment process of identifying rules to progressively liberalize current account transactions, direct and portfolio investments, and for other types of flows within the region, in accordance with the ASEAN Financial Integration

97
Framework (AFIF). According to the ASEAN Integration Monitoring Office (AIMO), which monitors and supports the progress toward an AEC in the finance area, ASEAN had achieved 88.9 percent of what it had committed to facilitate free flow of financial services and freer flow of capital by the end of July 2013. However, the challenge for ASEAN is to improve the quality of financial integration, thereby making financial markets more resilient, particularly in the current global context. The ASEAN Financial Integration Monitoring Report (AFIMR) highlighted that it is crucial to: (a) continue market-driven ASEAN financial integration initiatives; and (b) promote macroeconomic convergence and policy coordination. The AFIMR also recommends that policies should continue to remain supportive of regional initiatives, that is, developing harmonized standards and rules, improving the payment and settlement system, and harmonizing accounting standards and regulations.
19. Finally, in the area of skilled labor mobility in the ASEAN region, there has been some progress in recent years. AMS have signed eight Mutual Recognition Arrangements based on specific occupations covering engineering, architecture, accountancy, surveying, nursing, dental and medical practitioners, and tourism. Progress in implementing these has also varied across sectors with some sectors such as engineering and architectural services being well ahead of others. Moreover, in November 2012, the ASEAN Agreement on the Movement of Natural Persons was signed. This is expected to accelerate progress in facilitating the movement of skilled professionals across the region. 20. Although AMS are still behind schedule to meet the ambitious service sector integration targets, they have made significant commitments to liberalize regional trade in services. These commitments now exceed commitments and offers made under the GATS negotiations in Uruguay and Doha rounds.
21. A new database on services trade restrictions (http://iresearch.worldbank.org/servicestrade) released in June 2012 makes it possible to compare the situation and the state of reform implementation in 104 countries.45 The database focuses on policies that affect international trade in services, with the latter being defined as transactions that supply a service through cross-border delivery, through establishment of a commercial presence, or through the presence of a natural person (a real human being as a opposed to a legal entity). The information was obtained by scrutinizing publicly available sources and by administering a questionnaire.
22. Six ASEAN countries—namely Cambodia, Indonesia, Malaysia, the Philippines, Thailand, and Viet Nam—are covered in the database with the documented information referring to the situation of several major services sectors during the financial downturn in 2007/08. Policy instruments concerning all trading partners are collected and presented for five services sectors, which are financial services (banking and insurance), telecommunications, retail distribution, transportation, and professional services (accounting and legal). In addition to an inventory of measures, the database also contains quantitative estimates of the restrictiveness of each measure and mode of services supply that can be aggregated to the sectoral and country
45 See http://iresearch.worldbank.org/servicestrade.

98
level for analytical purposes.46 The resultant Services Trade Restrictiveness Index (STRI) takes values from zero for completely open trade and investment regimes to 100 for completely closed services sectors. This database is used for the subsequent analysis of liberalization commitments and the state of implementation.
23. A comparison of AFAS commitments with similar reform schedules established in the context of GATS, or under discussion in the ongoing Doha Round of WTO negotiations, can provide a starting point for analysis on the extent to which AFAS has contributed to services sector reform in ASEAN countries. Moreover, it is instructive to assess commitment levels of AFAS in relation to the status quo of in-country services sector regulation. As would be expected, the more recent Doha Round offers entail the same as or a higher degree of openness than the GATS-Uruguay commitments (Figure 3.1). In particular, further opening in telecommunications services has been offered by Indonesia, Malaysia, the Philippines, and Thailand to their WTO trading partners in the ongoing negotiations. For telecommunications, the AFAS commitments contain the same level of restrictiveness as the Doha offers, but in some other sectors they go beyond the state of discussion at the WTO level.
24. In five of the six countries covered, that is, except for Viet Nam, AFAS calls for a more liberal policy in the retailing and transportation sectors than Doha. Moreover, in some sectors and countries, AFAS commitments imply a more open services trade regime than the policies that were implemented in 2007/08. This is notably the case in transportation (except for Viet Nam) and for professional services in Cambodia, Malaysia, and Thailand. For most countries and sectors, however, the commitments contained in AFAS do imply a level of openness that actually falls short of the policies that were implemented in 2007/08 already. In other words, countries are ahead of AFAS and the main impact from implementation of the AFAS commitments will be to provide assurance to regional investors that any potential reversals in the trend towards greater services trade integration will be more limited than under the WTO provisions. Hence, the AFAS packages of liberalization commitments seem similar to the WTO’s tariff bindings that provide a safeguard against policy reversals rather than representing the actual state of reforms.
46 For further details on the database and its contents, please see Ingo Borchert, Batshur Gootiiz, and Aaditya Mattoo, 2012, “Guide to the Services Trade Restrictions Database,” Policy Research Working Paper 6108, The World Bank: Washington, DC.
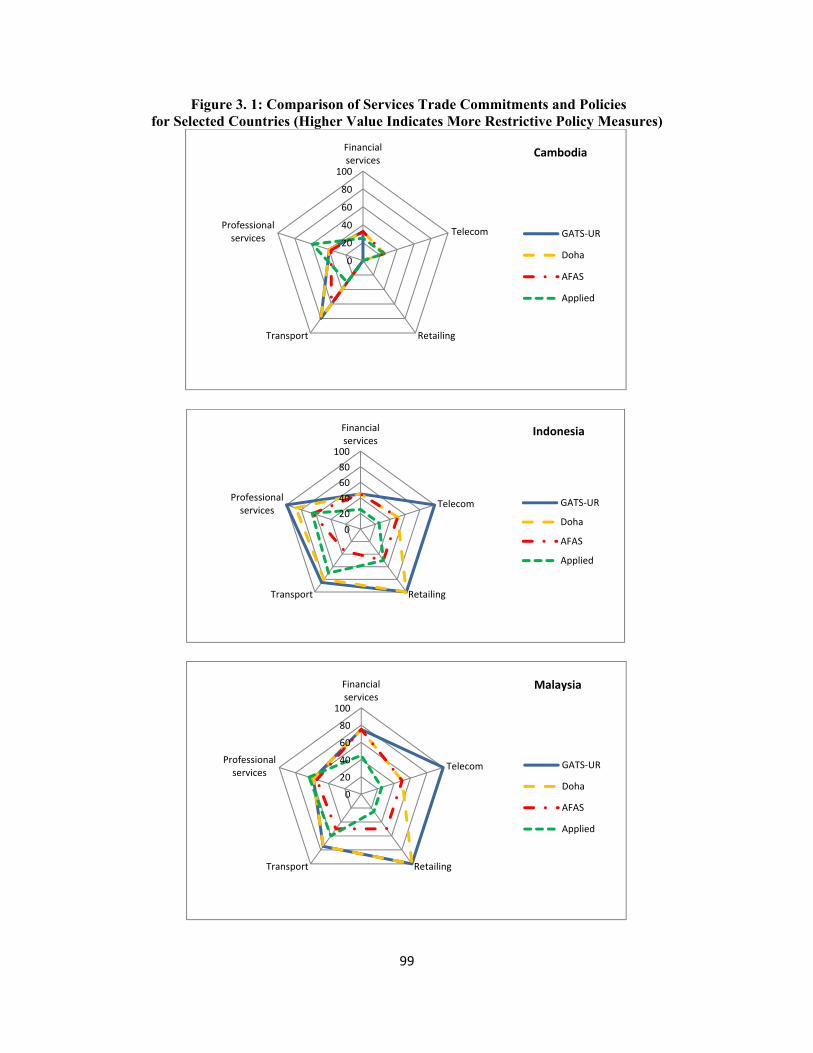
99
Figure 3. 1: Comparison of Services Trade Commitments and Policies for Selected Countries (Higher Value Indicates More Restrictive Policy Measures)
0
20
40
60
80
100
Financialservices
Telecom
RetailingTransport
Professionalservices
Cambodia
GATS-UR
Doha
AFAS
Applied
020406080
100
Financialservices
Telecom
RetailingTransport
Professionalservices
Indonesia
GATS-UR
Doha
AFAS
Applied
0
20
40
60
80
100
Financialservices
Telecom
RetailingTransport
Professionalservices
Malaysia
GATS-UR
Doha
AFAS
Applied
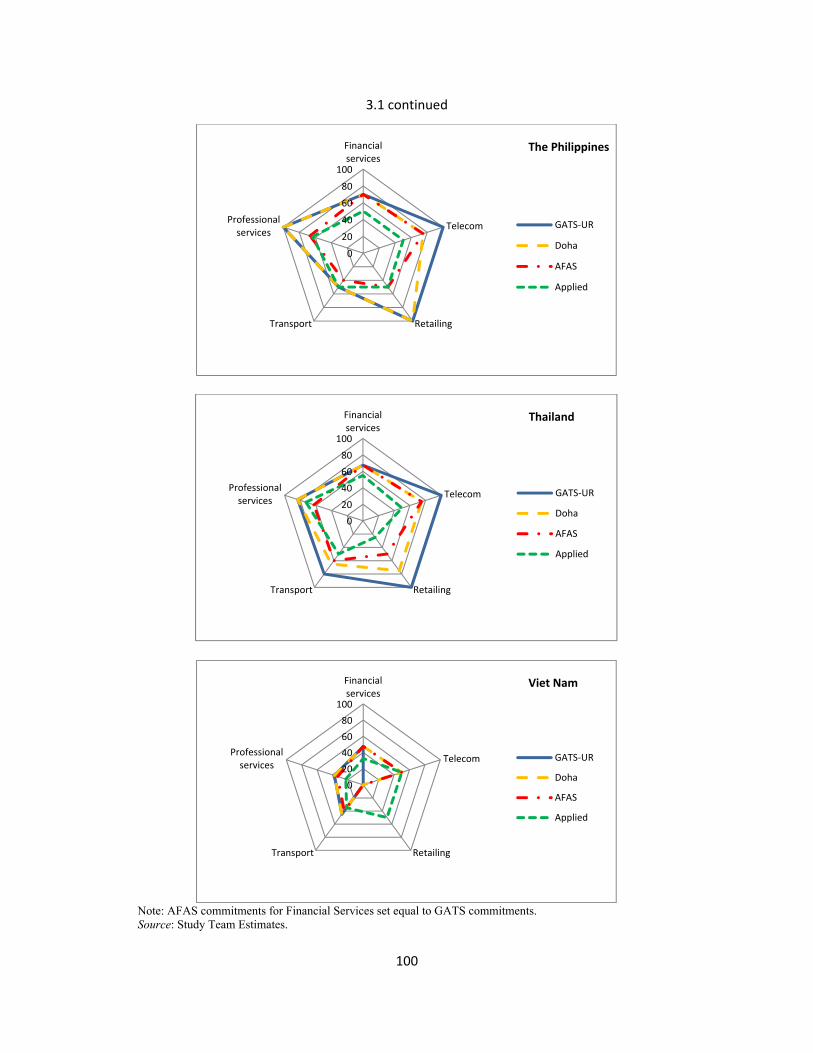
100
3.1 continued
Note: AFAS commitments for Financial Services set equal to GATS commitments. Source: Study Team Estimates.
020406080
100
Financialservices
Telecom
RetailingTransport
Professionalservices
The Philippines
GATS-UR
Doha
AFAS
Applied
020406080
100
Financialservices
Telecom
RetailingTransport
Professionalservices
Thailand
GATS-UR
Doha
AFAS
Applied
020406080
100
Financialservices
Telecom
RetailingTransport
Professionalservices
Viet Nam
GATS-UR
Doha
AFAS
Applied

101
C. International and Intra-Regional Comparison of Services Trade Policies
25. The investigation of the database content also reveals that services trade in ASEAN countries is more severely restricted than in the broader East Asia and Pacific region or the world overall (Figure 3.2). On average, the six ASEAN countries for which information is available have an STRI of 44, compared with an East Asia average of 41 and a global average of 29. The Philippines is showing the most restrictive policy regime with an STRI of 53, followed by Indonesia with an indicator value of 50. Hence, in general, the ASEAN region seems less advanced in the process of international integration of services than other regions. Moreover, it is worthwhile to note that the less developed countries, Cambodia and Viet Nam, feature the lowest STRI in the ASEAN group. This observation might reflect the nascent state of the countries’ regulatory regimes and the possibility that not all existing policy measures and practices might have been fully codified, rather than these governments’ proactive policies towards services trade.
Figure 3.2: Overall Services Trade Restrictiveness Index (Higher Value Indicates More Restrictive Policy Measures)
Source: “Policy Barriers to International Trade in Services: Evidence from a New Database,” Ingo Borchert, Batshur Gootiiz, and Aadtiya Mattoo, Working Paper Series, (http://iresearch.worldbank.org/servicestrade).
26. A closer look at the STRI information at the sectoral level reveals some additional insights. In financial services, for example, Indonesia has a relatively open policy regime (Figure 3.3), with an STRI for banking of 21 and one for insurance of 27. This relative openness is a reflection of the absence of restrictions on the legal form of entry and the possibility for foreign investors to acquire up to 99 percent of a bank or 80 percent of an insurance firm, as long as the company is run as a joint venture with local partners and does not have more than 11 branches. In contrast, the financial sectors in Thailand, Philippines and Malaysia appear not as welcoming to trade in services. However, the situation in Malaysia is particular: while the regulatory regime in general limits financial company ownership to 49 percent of firm capital, the country has provisions to allow existing majority-foreign banks to operate under a grandfathering provision. Another observation from the STRI data concerns differences of restrictiveness within the financial sector where it is noteworthy, for example, that foreign trade in banking services in Thailand and Viet Nam is much more tightly restricted than trade in insurance services
29
41
44
42
48
53
46
50
24
0 10 20 30 40 50 60
World Average
East Asia Average
ASEAN Average
Viet Nam
Thailand
The Philippines
Malaysia
Indonesia
Cambodia
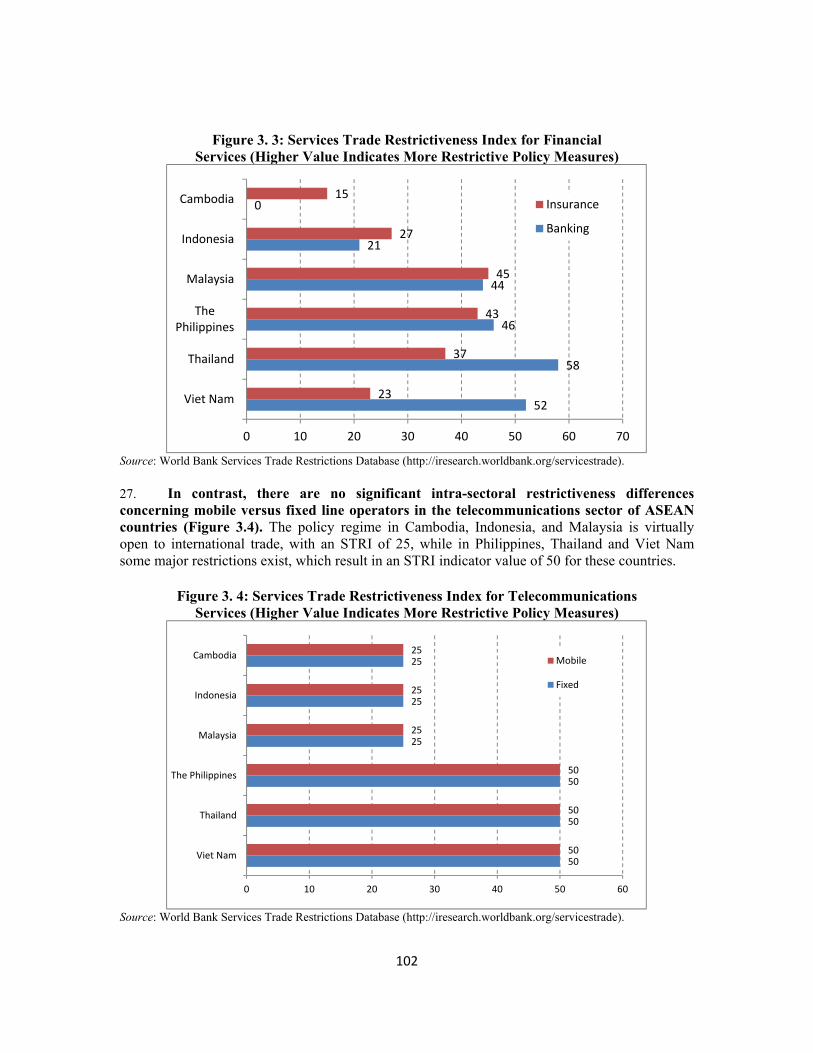
102
Figure 3. 3: Services Trade Restrictiveness Index for Financial Services (Higher Value Indicates More Restrictive Policy Measures)
Source: World Bank Services Trade Restrictions Database (http://iresearch.worldbank.org/servicestrade). 27. In contrast, there are no significant intra-sectoral restrictiveness differences concerning mobile versus fixed line operators in the telecommunications sector of ASEAN countries (Figure 3.4). The policy regime in Cambodia, Indonesia, and Malaysia is virtually open to international trade, with an STRI of 25, while in Philippines, Thailand and Viet Nam some major restrictions exist, which result in an STRI indicator value of 50 for these countries.
Figure 3. 4: Services Trade Restrictiveness Index for Telecommunications Services (Higher Value Indicates More Restrictive Policy Measures)
Source: World Bank Services Trade Restrictions Database (http://iresearch.worldbank.org/servicestrade).
52
58
46
44
21
0
23
37
43
45
27
15
0 10 20 30 40 50 60 70
Viet Nam
Thailand
ThePhilippines
Malaysia
Indonesia
Cambodia Insurance
Banking
50
50
50
25
25
25
50
50
50
25
25
25
0 10 20 30 40 50 60
Viet Nam
Thailand
The Philippines
Malaysia
Indonesia
Cambodia Mobile
Fixed
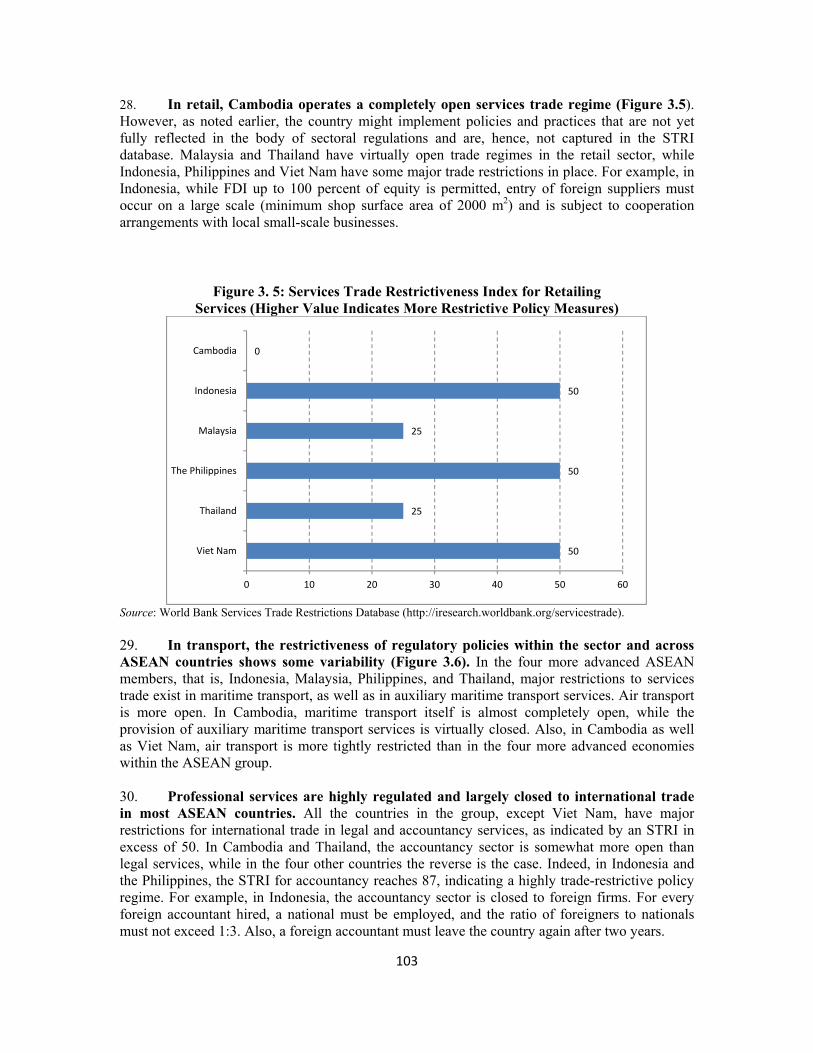
103
28. In retail, Cambodia operates a completely open services trade regime (Figure 3.5). However, as noted earlier, the country might implement policies and practices that are not yet fully reflected in the body of sectoral regulations and are, hence, not captured in the STRI database. Malaysia and Thailand have virtually open trade regimes in the retail sector, while Indonesia, Philippines and Viet Nam have some major trade restrictions in place. For example, in Indonesia, while FDI up to 100 percent of equity is permitted, entry of foreign suppliers must occur on a large scale (minimum shop surface area of 2000 m2) and is subject to cooperation arrangements with local small-scale businesses.
Figure 3. 5: Services Trade Restrictiveness Index for Retailing Services (Higher Value Indicates More Restrictive Policy Measures)
Source: World Bank Services Trade Restrictions Database (http://iresearch.worldbank.org/servicestrade). 29. In transport, the restrictiveness of regulatory policies within the sector and across ASEAN countries shows some variability (Figure 3.6). In the four more advanced ASEAN members, that is, Indonesia, Malaysia, Philippines, and Thailand, major restrictions to services trade exist in maritime transport, as well as in auxiliary maritime transport services. Air transport is more open. In Cambodia, maritime transport itself is almost completely open, while the provision of auxiliary maritime transport services is virtually closed. Also, in Cambodia as well as Viet Nam, air transport is more tightly restricted than in the four more advanced economies within the ASEAN group. 30. Professional services are highly regulated and largely closed to international trade in most ASEAN countries. All the countries in the group, except Viet Nam, have major restrictions for international trade in legal and accountancy services, as indicated by an STRI in excess of 50. In Cambodia and Thailand, the accountancy sector is somewhat more open than legal services, while in the four other countries the reverse is the case. Indeed, in Indonesia and the Philippines, the STRI for accountancy reaches 87, indicating a highly trade-restrictive policy regime. For example, in Indonesia, the accountancy sector is closed to foreign firms. For every foreign accountant hired, a national must be employed, and the ratio of foreigners to nationals must not exceed 1:3. Also, a foreign accountant must leave the country again after two years.
50
25
50
25
50
0
0 10 20 30 40 50 60
Viet Nam
Thailand
The Philippines
Malaysia
Indonesia
Cambodia
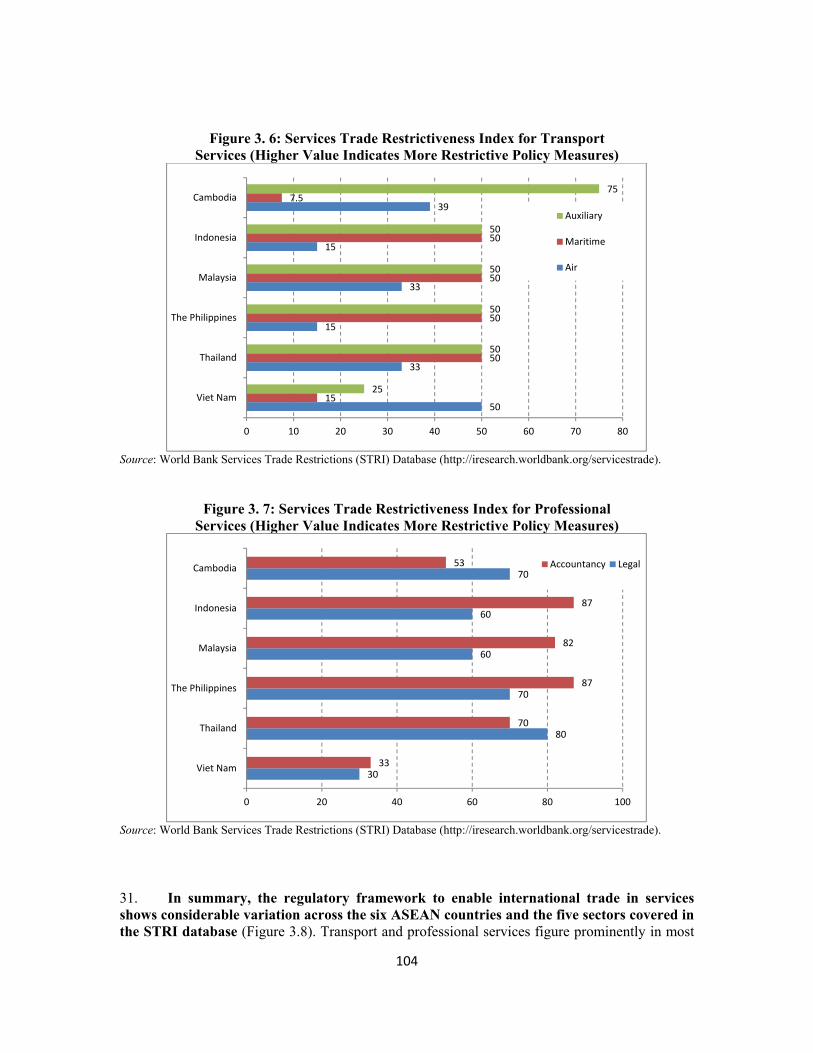
104
Figure 3. 6: Services Trade Restrictiveness Index for Transport Services (Higher Value Indicates More Restrictive Policy Measures)
Source: World Bank Services Trade Restrictions (STRI) Database (http://iresearch.worldbank.org/servicestrade).
Figure 3. 7: Services Trade Restrictiveness Index for Professional Services (Higher Value Indicates More Restrictive Policy Measures)
Source: World Bank Services Trade Restrictions (STRI) Database (http://iresearch.worldbank.org/servicestrade).
31. In summary, the regulatory framework to enable international trade in services shows considerable variation across the six ASEAN countries and the five sectors covered in the STRI database (Figure 3.8). Transport and professional services figure prominently in most
50
33
15
33
15
39
15
50
50
50
50
7.5
25
50
50
50
50
75
0 10 20 30 40 50 60 70 80
Viet Nam
Thailand
The Philippines
Malaysia
Indonesia
Cambodia
Auxiliary
Maritime
Air
30
80
70
60
60
70
33
70
87
82
87
53
0 20 40 60 80 100
Viet Nam
Thailand
The Philippines
Malaysia
Indonesia
Cambodia Accountancy Legal
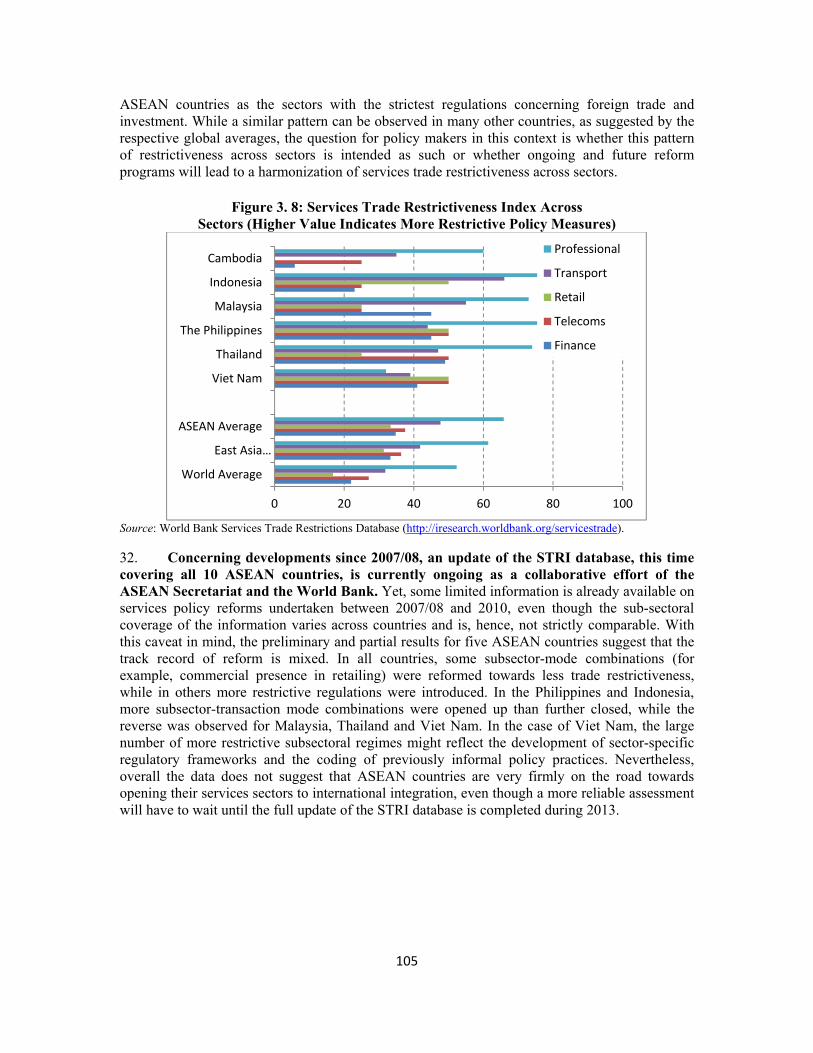
105
ASEAN countries as the sectors with the strictest regulations concerning foreign trade and investment. While a similar pattern can be observed in many other countries, as suggested by the respective global averages, the question for policy makers in this context is whether this pattern of restrictiveness across sectors is intended as such or whether ongoing and future reform programs will lead to a harmonization of services trade restrictiveness across sectors.
Figure 3. 8: Services Trade Restrictiveness Index Across Sectors (Higher Value Indicates More Restrictive Policy Measures)
Source: World Bank Services Trade Restrictions Database (http://iresearch.worldbank.org/servicestrade). 32. Concerning developments since 2007/08, an update of the STRI database, this time covering all 10 ASEAN countries, is currently ongoing as a collaborative effort of the ASEAN Secretariat and the World Bank. Yet, some limited information is already available on services policy reforms undertaken between 2007/08 and 2010, even though the sub-sectoral coverage of the information varies across countries and is, hence, not strictly comparable. With this caveat in mind, the preliminary and partial results for five ASEAN countries suggest that the track record of reform is mixed. In all countries, some subsector-mode combinations (for example, commercial presence in retailing) were reformed towards less trade restrictiveness, while in others more restrictive regulations were introduced. In the Philippines and Indonesia, more subsector-transaction mode combinations were opened up than further closed, while the reverse was observed for Malaysia, Thailand and Viet Nam. In the case of Viet Nam, the large number of more restrictive subsectoral regimes might reflect the development of sector-specific regulatory frameworks and the coding of previously informal policy practices. Nevertheless, overall the data does not suggest that ASEAN countries are very firmly on the road towards opening their services sectors to international integration, even though a more reliable assessment will have to wait until the full update of the STRI database is completed during 2013.
0 20 40 60 80 100
World Average
East Asia…
ASEAN Average
Viet Nam
Thailand
The Philippines
Malaysia
Indonesia
CambodiaProfessional
Transport
Retail
Telecoms
Finance
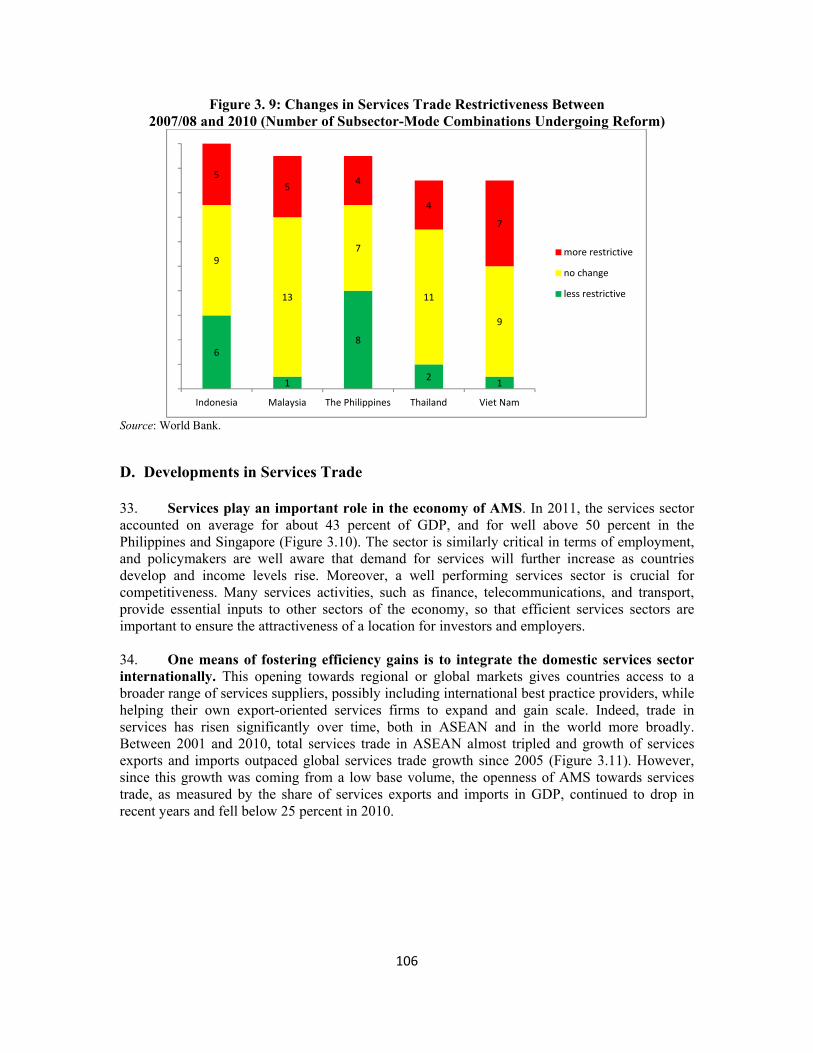
106
Figure 3. 9: Changes in Services Trade Restrictiveness Between 2007/08 and 2010 (Number of Subsector-Mode Combinations Undergoing Reform)
Source: World Bank.
D. Developments in Services Trade
33. Services play an important role in the economy of AMS. In 2011, the services sector accounted on average for about 43 percent of GDP, and for well above 50 percent in the Philippines and Singapore (Figure 3.10). The sector is similarly critical in terms of employment, and policymakers are well aware that demand for services will further increase as countries develop and income levels rise. Moreover, a well performing services sector is crucial for competitiveness. Many services activities, such as finance, telecommunications, and transport, provide essential inputs to other sectors of the economy, so that efficient services sectors are important to ensure the attractiveness of a location for investors and employers. 34. One means of fostering efficiency gains is to integrate the domestic services sector internationally. This opening towards regional or global markets gives countries access to a broader range of services suppliers, possibly including international best practice providers, while helping their own export-oriented services firms to expand and gain scale. Indeed, trade in services has risen significantly over time, both in ASEAN and in the world more broadly. Between 2001 and 2010, total services trade in ASEAN almost tripled and growth of services exports and imports outpaced global services trade growth since 2005 (Figure 3.11). However, since this growth was coming from a low base volume, the openness of AMS towards services trade, as measured by the share of services exports and imports in GDP, continued to drop in recent years and fell below 25 percent in 2010.
6
1
8
2 1
9
13
7
11
9
55 4
4
7
Indonesia Malaysia The Philippines Thailand Viet Nam
more restrictive
no change
less restrictive
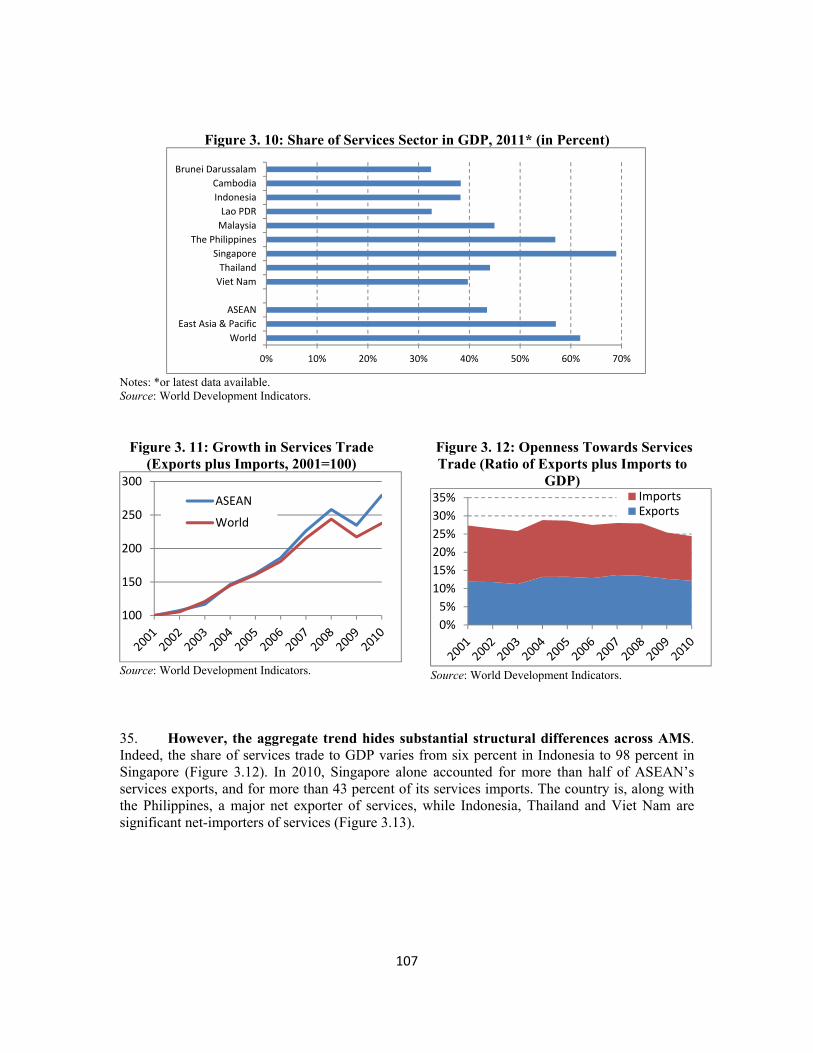
107
Figure 3. 10: Share of Services Sector in GDP, 2011* (in Percent)
Notes: *or latest data available. Source: World Development Indicators.
Figure 3. 11: Growth in Services Trade (Exports plus Imports, 2001=100)
Source: World Development Indicators.
Figure 3. 12: Openness Towards Services Trade (Ratio of Exports plus Imports to
GDP)
Source: World Development Indicators.
35. However, the aggregate trend hides substantial structural differences across AMS. Indeed, the share of services trade to GDP varies from six percent in Indonesia to 98 percent in Singapore (Figure 3.12). In 2010, Singapore alone accounted for more than half of ASEAN’s services exports, and for more than 43 percent of its services imports. The country is, along with the Philippines, a major net exporter of services, while Indonesia, Thailand and Viet Nam are significant net-importers of services (Figure 3.13).
0% 10% 20% 30% 40% 50% 60% 70%
WorldEast Asia & Pacific
ASEAN
Viet NamThailand
SingaporeThe Philippines
MalaysiaLao PDR
IndonesiaCambodia
Brunei Darussalam
100
150
200
250
300ASEAN
World
0%5%
10%15%20%25%30%35% Imports
Exports
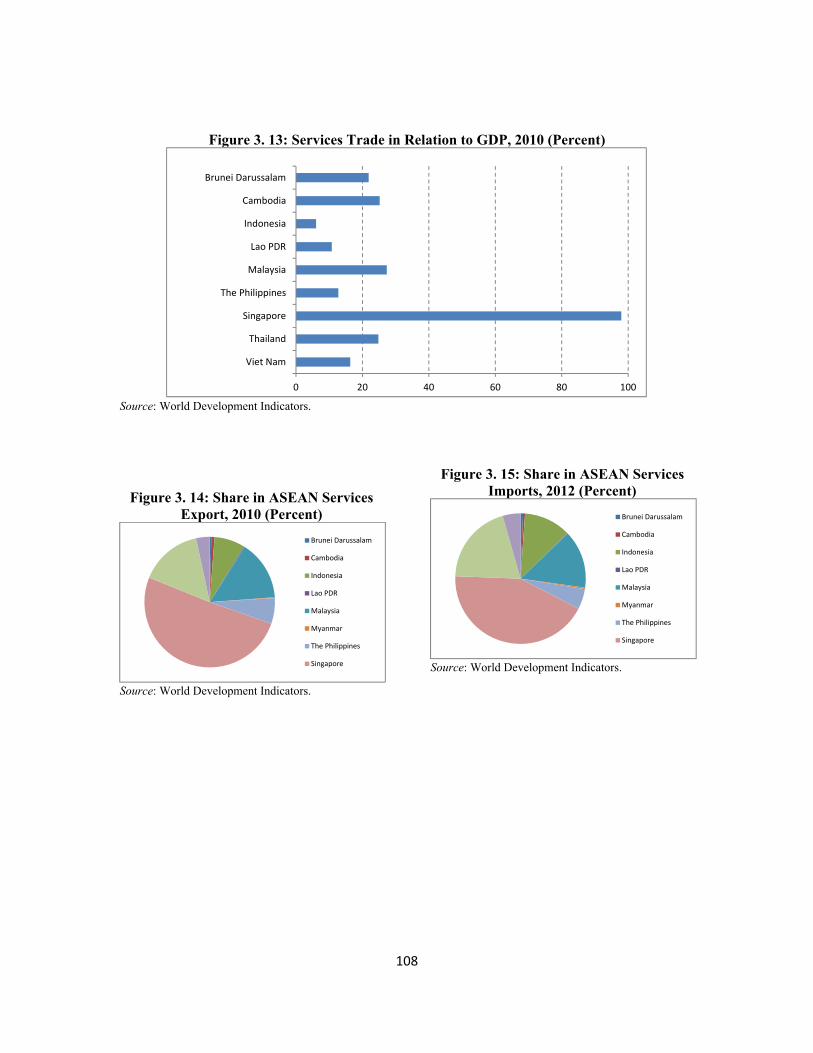
108
Figure 3. 13: Services Trade in Relation to GDP, 2010 (Percent)
Source: World Development Indicators.
Figure 3. 14: Share in ASEAN Services Export, 2010 (Percent)
Source: World Development Indicators.
Figure 3. 15: Share in ASEAN Services Imports, 2012 (Percent)
Source: World Development Indicators.
0 20 40 60 80 100
Viet Nam
Thailand
Singapore
The Philippines
Malaysia
Lao PDR
Indonesia
Cambodia
Brunei Darussalam
Brunei Darussalam
Cambodia
Indonesia
Lao PDR
Malaysia
Myanmar
The Philippines
Singapore
Brunei Darussalam
Cambodia
Indonesia
Lao PDR
Malaysia
Myanmar
The Philippines
Singapore
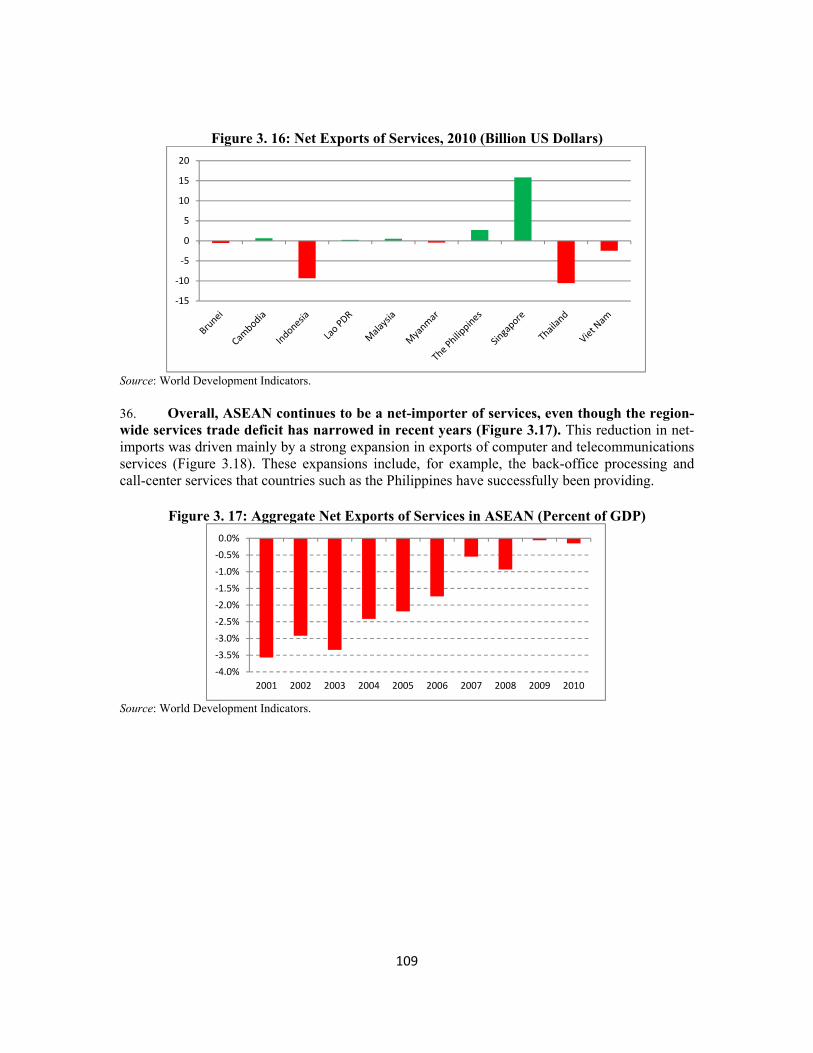
109
Figure 3. 16: Net Exports of Services, 2010 (Billion US Dollars)
Source: World Development Indicators. 36. Overall, ASEAN continues to be a net-importer of services, even though the region-wide services trade deficit has narrowed in recent years (Figure 3.17). This reduction in net-imports was driven mainly by a strong expansion in exports of computer and telecommunications services (Figure 3.18). These expansions include, for example, the back-office processing and call-center services that countries such as the Philippines have successfully been providing.
Figure 3. 17: Aggregate Net Exports of Services in ASEAN (Percent of GDP)
Source: World Development Indicators.
-15
-10
-5
0
5
10
15
20
-4.0%-3.5%-3.0%-2.5%-2.0%-1.5%-1.0%-0.5%0.0%
2001 2002 2003 2004 2005 2006 2007 2008 2009 2010
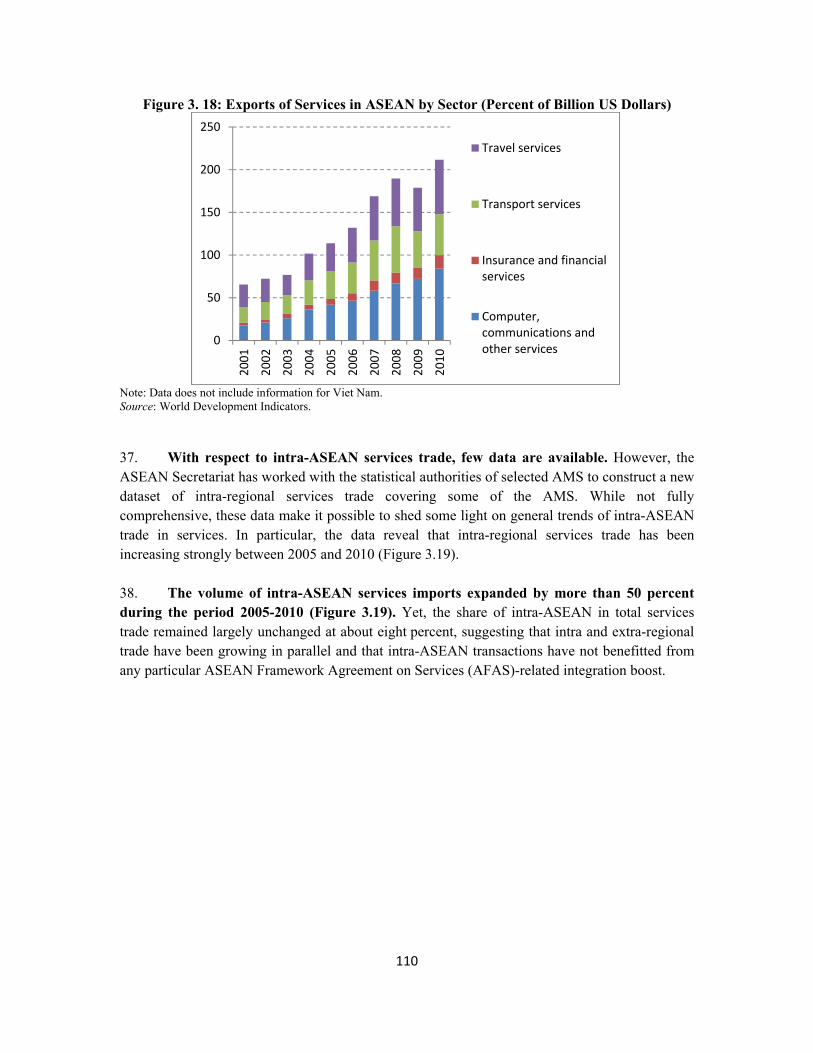
110
Figure 3. 18: Exports of Services in ASEAN by Sector (Percent of Billion US Dollars)
Note: Data does not include information for Viet Nam. Source: World Development Indicators.
37. With respect to intra-ASEAN services trade, few data are available. However, the ASEAN Secretariat has worked with the statistical authorities of selected AMS to construct a new dataset of intra-regional services trade covering some of the AMS. While not fully comprehensive, these data make it possible to shed some light on general trends of intra-ASEAN trade in services. In particular, the data reveal that intra-regional services trade has been increasing strongly between 2005 and 2010 (Figure 3.19). 38. The volume of intra-ASEAN services imports expanded by more than 50 percent during the period 2005-2010 (Figure 3.19). Yet, the share of intra-ASEAN in total services trade remained largely unchanged at about eight percent, suggesting that intra and extra-regional trade have been growing in parallel and that intra-ASEAN transactions have not benefitted from any particular ASEAN Framework Agreement on Services (AFAS)-related integration boost.
0
50
100
150
200
250
2001
2002
2003
2004
2005
2006
2007
2008
2009
2010
Travel services
Transport services
Insurance and financialservices
Computer,communications andother services
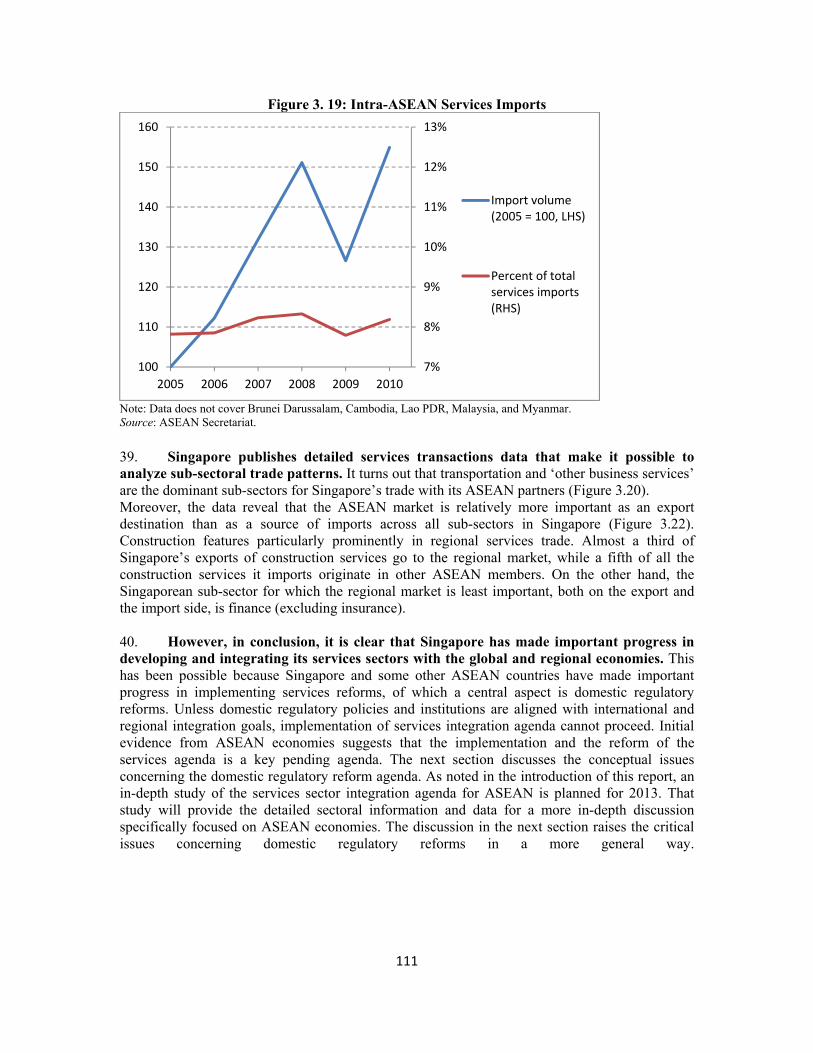
111
Figure 3. 19: Intra-ASEAN Services Imports
Note: Data does not cover Brunei Darussalam, Cambodia, Lao PDR, Malaysia, and Myanmar. Source: ASEAN Secretariat.
39. Singapore publishes detailed services transactions data that make it possible to analyze sub-sectoral trade patterns. It turns out that transportation and ‘other business services’ are the dominant sub-sectors for Singapore’s trade with its ASEAN partners (Figure 3.20). Moreover, the data reveal that the ASEAN market is relatively more important as an export destination than as a source of imports across all sub-sectors in Singapore (Figure 3.22). Construction features particularly prominently in regional services trade. Almost a third of Singapore’s exports of construction services go to the regional market, while a fifth of all the construction services it imports originate in other ASEAN members. On the other hand, the Singaporean sub-sector for which the regional market is least important, both on the export and the import side, is finance (excluding insurance). 40. However, in conclusion, it is clear that Singapore has made important progress in developing and integrating its services sectors with the global and regional economies. This has been possible because Singapore and some other ASEAN countries have made important progress in implementing services reforms, of which a central aspect is domestic regulatory reforms. Unless domestic regulatory policies and institutions are aligned with international and regional integration goals, implementation of services integration agenda cannot proceed. Initial evidence from ASEAN economies suggests that the implementation and the reform of the services agenda is a key pending agenda. The next section discusses the conceptual issues concerning the domestic regulatory reform agenda. As noted in the introduction of this report, an in-depth study of the services sector integration agenda for ASEAN is planned for 2013. That study will provide the detailed sectoral information and data for a more in-depth discussion specifically focused on ASEAN economies. The discussion in the next section raises the critical issues concerning domestic regulatory reforms in a more general way.
7%
8%
9%
10%
11%
12%
13%
100
110
120
130
140
150
160
2005 2006 2007 2008 2009 2010
Import volume(2005 = 100, LHS)
Percent of totalservices imports(RHS)
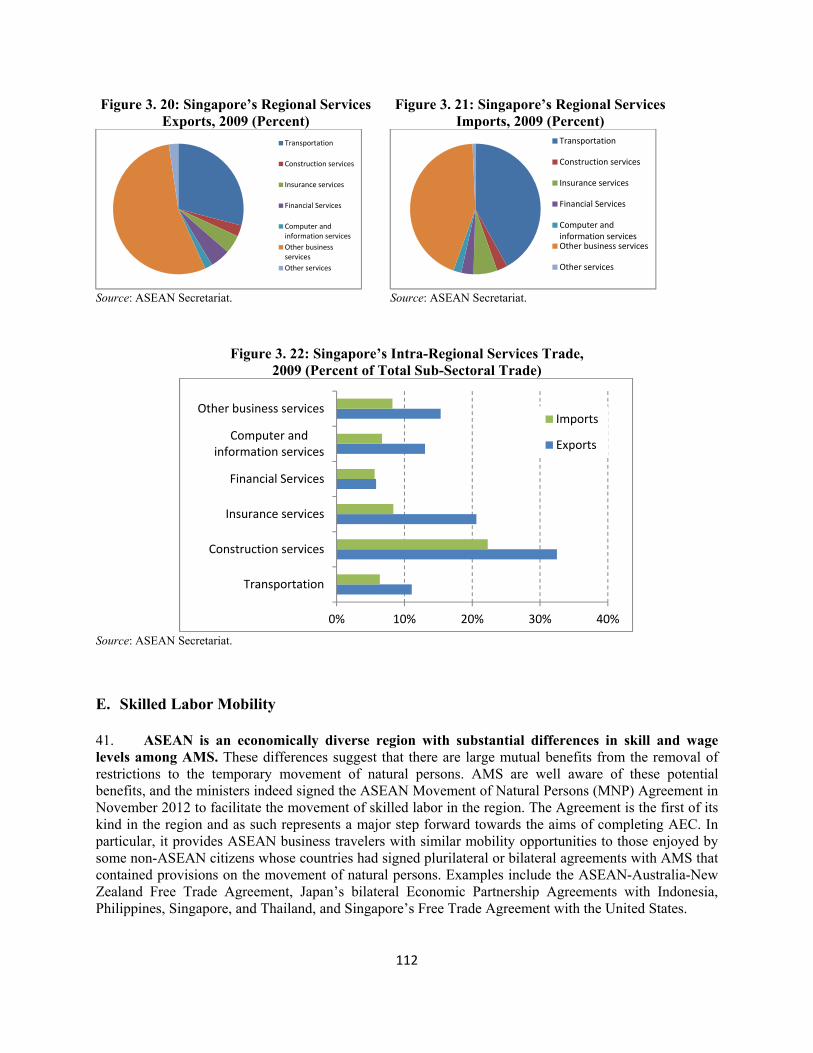
112
Figure 3. 20: Singapore’s Regional Services Exports, 2009 (Percent)
Figure 3. 21: Singapore’s Regional Services Imports, 2009 (Percent)
Source: ASEAN Secretariat. Source: ASEAN Secretariat.
Figure 3. 22: Singapore’s Intra-Regional Services Trade, 2009 (Percent of Total Sub-Sectoral Trade)
Source: ASEAN Secretariat.
E. Skilled Labor Mobility
41. ASEAN is an economically diverse region with substantial differences in skill and wage levels among AMS. These differences suggest that there are large mutual benefits from the removal of restrictions to the temporary movement of natural persons. AMS are well aware of these potential benefits, and the ministers indeed signed the ASEAN Movement of Natural Persons (MNP) Agreement in November 2012 to facilitate the movement of skilled labor in the region. The Agreement is the first of its kind in the region and as such represents a major step forward towards the aims of completing AEC. In particular, it provides ASEAN business travelers with similar mobility opportunities to those enjoyed by some non-ASEAN citizens whose countries had signed plurilateral or bilateral agreements with AMS that contained provisions on the movement of natural persons. Examples include the ASEAN-Australia-New Zealand Free Trade Agreement, Japan’s bilateral Economic Partnership Agreements with Indonesia, Philippines, Singapore, and Thailand, and Singapore’s Free Trade Agreement with the United States.
Transportation
Construction services
Insurance services
Financial Services
Computer andinformation servicesOther businessservicesOther services
Transportation
Construction services
Insurance services
Financial Services
Computer andinformation servicesOther business services
Other services
0% 10% 20% 30% 40%
Transportation
Construction services
Insurance services
Financial Services
Computer andinformation services
Other business servicesImports
Exports
113
42. The MNP Agreement is intended to facilitate the movement of natural persons engaged in the conduct of trade in goods, trade in services, and investment between ASEAN Member States. The provisions of the MNP Agreement govern the temporary entry and stay of skilled workers, professionals and executives in categories such as intra-corporate transferees, contractual services suppliers, and business visitors. The Agreement does not change any existing regulations on permanent entry and residence, nor does it cover the movement of unskilled workers.
43. Moreover, AMS have concluded a number of Mutual Recognition Arrangements (MRAs) to facilitate the supply of services within the region. In particular, eight MRAs for specific professions have been signed between 2005 and 2012:
• MRA on Engineering Services, signed on December 9, 2005. • MRA on Nursing Services, signed on December 8, 2006. • MRA on Architectural Services and Framework Arrangement in the mutual recognition of
Surveying Qualifications, both signed on November 19, 2007. • MRA on Tourism, signed on January 9, 2009, by nine AMS and on November 9, 2012, by
Thailand. • MRA on Medical Practitioners, MRA on Dental Practitioners, and MRA Framework on
Accountancy Services, signed on February 26, 2009.
44. Implementation mechanisms differ across MRAs. The agreements on accountancy services and surveying qualification services are framework MRAs, so that another stage of negotiated accords is required to turn them into fully functional MRAs. For architectural and engineering services, registration is conducted at the country level, with the approval of professionals submitted by AMS being granted by the ASEAN-level institutions named the ASEAN Architecture Council and the ASEAN Chartered Professional Engineer Coordinating Committee. For nursing, dental and medical practitioners, the MRAs provide for an implementation mechanism that relies on country registration without an ASEAN-level approval procedure. 45. Progress in implementing the ASEAN MRAs has varied across sectors. For architecture and engineering services, a number of professionals in various AMS have been registered and certified under the MRA process. For other MRAs, the exchange of information of domestic policies and regulations of the MRAs remains ongoing. For the healthcare MRAs, it was recognized that patient safety remains the ultimate consideration, and therefore a different understanding of mobility in these MRAs (as compared to the engineering and architecture MRAs) is under discussion. An MRA on accountancy services (no longer a framework) is under consideration, which may exclude independent practice for auditors.
46. While, to date, the MRAs have achieved little mobility of skilled human resources, Iredale and others (2010) point out that the process of negotiation itself might have been helpful for the least advanced members within ASEAN.47 Some AMS do not have guaranteed occupational standards, regulatory mechanisms, or professional bodies that register and accredit practitioners. In this context, the negotiations have been beneficial in raising the countries’ awareness of deficits that need to be remedied.
47. What can be done to accelerate the operationalization of the MRAs and increase their effectiveness, given the substantial diversity in educational standards and professional skills across
47 Robyn Iredale, Tim Turpin, Charles Stahl, and Tepin Getuadisorn (2010), “Free Flow of Skilled Labour Study,” ASEAN-Australia Development Cooperation Program.
114
AMS? One approach that has been advocated by some analysts is to aim for common minimum standards in professional qualifications that are acceptable to all member states.48 Setting such common standards would avoid the sometimes acrimonious discussions concerning the equivalence of qualifications and alleviate fears of a race to the bottom in terms of educational and professional standards. It would require, though, that partner countries come to an agreement on core competences and the harmonization of training schedules and programs.
F. Implementing the Services Integration Agenda: Domestic Regulatory Reform
48. One of the key issues that trade policy makers in ASEAN countries face concerns the inherent tension between domestic regulation and market openness. Regulatory autonomy makes it possible to tailor domestic rules to local conditions. Some of this autonomy might be lost when a country engages in an international trade agreement, as the provisions of services agreements frequently reach ‘behind the border.’ On the other hand, integrating with trade partners can provide a welcome opportunity to review and overhaul the domestic regulatory regime that might have become entrenched due to the influence of protectionist interests. Rationale for Services Sector Regulation 49. Even though there is considerable diversity across services sub-sectors, the underlying economic and social rationale for regulatory intervention rests on three pillars (Mattoo and Sauvé, 2003): (a) monopolies in network-based services (for example, telecommunications, transportation and energy services); (b) externalities and asymmetric information in knowledge and intermediation-based services (for example, financial and professional services); and (c) the desire to ensure universal access in essential services (for example, health and education services). 50. Many infrastructure services can be characterized as network services and as such provide natural monopolies or oligopolies for incumbent suppliers. Such services require specialized distribution networks, such as roads and rails for land transport, transmission lines and satellites for telecommunications, and cables for energy distribution. The provision of this infrastructure is often subject to space constraints that make it impossible to develop several parallel networks. Moreover, the activities tend to be highly capital-intensive, with strong scale economies and assets that are long-lived and cannot be easily redeployed in other activities. While changing technologies have over time reduced both the optimal scale of operation and the importance of sunk costs in some services sectors, such as telecommunications and air transport, the issue of market power and anti-competitive behavior remains and the resultant market failure calls for regulatory intervention. The latter often takes the form of price controls that try to achieve a balance between investor and consumer interests, with the prices being set by a government agency or an independent regulator. 51. In intermediation and knowledge-based services, asymmetric information is prevalent and can lead to market failures that motivate regulation. Buyers are often not fully informed about the characteristics of service suppliers and their offers. For example, consumers cannot easily evaluate the competence of lawyers and medical doctors, the safety of air transport, or the soundness of insurance and banking companies. Since the dissemination of all the missing information to individual buyers would be very expensive, it has become general practice to regulate the suppliers. This regulation takes the form of minimum qualification and performance standards that ensure, for example, that professionals have the
48 Aaditya Mattoo and Pierre Sauve (2008), “Regionalism in Services Trade,” in A Handbook of International Trade in Services, Aaditya Mattoo, Robert M. Stern, Gianni Zanini (eds.), Oxford: Oxford University Press.
115
competence expected by consumers and that institutions, such as banks, are established in a sound and trustworthy manner. 52. A third type of regulation arises from distributional objectives, such as to ensure universal access to services. For example, regulations try to provide postal, health and education services across the entire population. In these situations, governments frequently regulate and enforce a uniform price, irrespective of the cost of service provision. The resulting, distorted price structure is then often sustained through cross-subsidization within public monopolies or through direct financial support from the government. There are alternatives to direct regulation that have frequently proven to be a more efficient means of reaching the distributional objective. These include competitive bidding for subsidized contracts to serve disadvantaged areas or groups of customers, and the distribution of vouchers to target groups who can then purchase the services from providers of their choice.
Trade and Regulatory Reform
53. Trade integration can in some cases facilitate the task of services sector regulation by strengthening competition and thus helping consumers to obtain quality services at low prices. Yet, the success of trade negotiations depends on the implementation of two principles: market access and national treatment. These principles require that regulations make it possible for foreign suppliers to enter the domestic market and that the regulatory framework does not discriminate against foreigners. In this context, it is important to note that trade can be inhibited even by regulations that do not discriminate, such as certain standards and licensing requirements, and by the absence of pro-competitive regulations. Hence, successful services trade integration will often require accompanying changes to the regulatory framework. 54. In network services, existing monopolistic or oligopolistic market structures may undermine integration efforts if incumbents can impede access through their control of essential facilities. Therefore, additional regulation might be required to ensure that monopolistic suppliers do not engage in anti-competitive behavior. In particular, appropriate regulation would stipulate that any major owner of essential facilities provides access to all service suppliers, national and foreign, at cost-based rates. 55. Concerning intermediation and knowledge-based services, regulations like licensing and qualification requirements can often become obstacles to trade. Market-opening commitments may thus need to be supported by a thorough review of the regulatory regime to identify and reform needlessly restrictive impediments to trade and investment integration. Also, creating the possibility to challenge trade-impeding or particularly burdensome regulation can provide government authorities with valuable input into the regulatory process.
56. As may be expected given the overwhelming importance of the services sector in Singapore, regulatory reforms addressing these issues are most advanced in Singapore. Box 3.2 provides the case study of how Singapore addresses these reforms in key sectors.
116
Box 3. 2: Services Trade Policy and Development in Singapore
The development of the services trade sector in Singapore is examined from the regulatory and liberalization policy perspectives (after the AFAS was launched in 1995). The areas of telecommunication, maritime transport and financial services are emphasized in this section. Deregulation of the telecommunication industry was undertaken in 1989 in order to attract new competition, lower prices and charges, and to provide a larger range of services. Full competition in the telecommunications market was introduced in April 2000. The liberalization of services comprises facilities-based telecommunication services providers and services-based operators. It has been reported that the number of telecommunications service providers has increased significantly: 922 telecoms licenses were issued in 2008, of which 43 are facility-based operators and 879 are service-based operators. Former telecom services providers such as Sin-Tel and Temsack hold nearly half of StarHub’s capacity. In shipping, the main legislation constitutes the Merchant Shipping Act and the Carriage of Goods by Sea Act. The Marine and Port Authority of Singapore under the Ministry of Transport implements maritime policies. Singapore Ports are managed under licenses by the PSA Corporation Ltd and Jurong Port Pte Ltd. Singapore attracted 40 shipping companies’ national headquarters in Singapore including COSCO, Odjfell Tankers, Shell Tankers, IMC Shipping, and K Line. The liberalization in the financial sector was performed by conducting ‘phased liberalization’ in three phases. The Monetary Authority of Singapore (MAS) introduced the first phase—a five-year program in March 1999, a second phase in June 2001, and the third phase in 2004. In the first phase was a package on new banking privileges and licenses for foreign banks for three years (1999-2001). MAS introduced a new category of full banking license with Qualifying Full Bank (QFB) privileges or full service licenses. MAS issued these QFB licenses to ABN Amro Bank, Banque Nationale de Paris, Citibank, and Standard Chartered Bank by the end of 2000, and it awarded the last two of the planned six initial QFB licenses to Malaysia’s Maybank and HSBC in December 2001. The government lifted the 40 percent limit on aggregate foreign shareholding of local banks in July 1999 and allowed local banks to merge the local and foreign share tranches. Under the US-Singapore Free Trade Agreement, US banks with QFB privileges were permitted in 2005 and Wholesale Bank licenses were allowed in 2007. The wholesale banks and offshore banks were not allowed to make transactions using Singapore dollar domestic retail operations. As of the beginning of 2013, ten foreign banks operating in Singapore have been granted QFB privileges and may operate in 25 locations. In capital markets, MAS identified measures for further liberalization in March 2002 to facilitate the development Singapore’s capital markets. At the same time, new wholesale licenses were granted to banks from Switzerland, Japan, France, Australia, etc. To compete with incumbents’ foreign banks, the local banks were consolidated—such as Development Bank of Singapore (DBS) with Post Office Saving Bank (POSB), United Overseas Bank Ltd. (UOB) with Overseas Union Bank Ltd. (OUB), and Overseas-Chinese Banking Corporation (OCBC) with Keppel-Tat Lee. With respect to investment banking, three main local banks were required to dispose of non-core assets by 2006, which would enable them to focus on core banking business. In the Stock Exchange, the Stock Exchange of Singapore (SES) merged with the Singapore International Monetary Exchange (SIMEX) and formed the Singapore Exchange (SGX) in December 1999. The stock broking industry was liberalized in 1998 in the context of fees and opening up of market access. The brokerages have consolidated and upgraded capabilities, and widened services and products. New foreign brokerages were permitted to reach out to foreign investors. Since SGX was listed in November 2000, MAS administered statutory laws regulating the capital market, and oversaw SGX’s regulatory functions while SGX retained the regulation of market participants. The insurance sector is regulated by the Insurance Act of 2002, which is revised by replacing the audit-based inspection framework to a risk-based capital supervision Act of 2003. In 2004, MAS introduced a new system framework centered on a risk-based capital framework. In this framework, however, the minimum capital requirements on admission to the reinsurance market were unchanged at USD 25 million for direct insurers and re-insurers. It was reported that there were 153 insurance companies in Singapore.
117
Box 3. 3: Services Trade Policy and Development in Singapore (continued)
The MAS is the integrated regulator and supervisor of financial institutions in Singapore. MAS established rules for financial institutions, which are implemented through legislation, directions and notices. Guidelines have also been formulated to encourage best practices among financial institutions. As of 2012, there were over 600 operational financial institutions offering a variety of services across various asset classes in Singapore. Thus, major unilateral financial reforms were launched in Singapore based on four main tasks: reforming regulatory environment; liberalizing financial sector; developing strategic and proactive approaches including encouraging capacity of local banks; and enhancing the financial sector.
Preparing for Trade-Induced Regulatory Reform
57. Regulations of services sectors tend to be complex. Typically, multiple regulatory and enforcement frameworks are involved that are managed by different agencies. Also, governments frequently impose restrictions on foreign ownership, market access, and the operation of services providers that might have been suitable at the time these regulations were introduced but might no longer represent efficient means of achieving the desired policy objective. Moreover, in addition to the laws and regulations themselves, the governance setting surrounding the decision-making and implementation process of services sector regulations plays a crucial role in determining the efficiency of the regulatory framework and the country’s preparedness for international integration. 58. In this context, the decision to further integrate with trading partners within ASEAN provides a useful opportunity to fundamentally review the state of services sector regulations and to bring it into line with international best practice and the objectives and commitments under the ASEAN Blueprint. In particular, AMS might want to put in place (or revisit existing) mechanisms that are aimed at promoting the needed reforms. Examples exist in other countries or country groups on how, for example, services knowledge platforms that bring together regulators, trade policy makers, and private sector representatives can be organized to exchange information and generate evidence-based policy dialogue.49 Moreover, a thorough regulatory stock-taking might be desirable. The latter would involve three major elements: (a) an inventory of regulations affecting the sectors covered in the Agreement, as well as an assessment of the regulatory process and institutional arrangements; (b) an impact evaluation that aims at collecting quantitative information on prices and costs, market structures, and prospective benefits and adjustment costs due to trade integration, and (c) the exploration of alternative regulatory means to achieve the domestic policy objectives while minimizing adverse impacts on trade. 59. Such an assessment would provide the basis for the development and modernization of the regulatory framework for the services sector, with a view to fully support the ongoing trade integration process within ASEAN. It could help to identify areas that require reform, both in the formal laws and in the administrative implementation procedures. Moreover, the assessment would make it possible to spot potential inconsistencies with international disciplines that may affect the negotiation process or compliance with the Agreement.
49 See, for example, Bernard Hoekman and Aaditya Mattoo (2011), “Services Trade Liberalization and Regulatory Reform: Reinvigorating International Cooperation,” Policy Research Working Paper no. 5517, Washington DC; The World Bank; or Bernard Hoekman and Aaditya Mattoo (2012), “Liberalizing Trade in Services: Lessons from Regional and WTO Negotiations,” paper prepared for the Global Trade and Financial Architecture project, Washington DC; The World Bank.
118
G. Conclusion and Policy Implications
60. The preceding analysis of services trade and regulatory trends revealed some encouraging developments. Services trade in ASEAN is growing fast, and the historically persistent services trade deficit is narrowing and might in the near-term turn into a surplus. On the other hand, the data also revealed some challenges that suggest policy implications. 61. In particular, the commitment analysis based on the STRI data revealed that AFAS often goes beyond GATS commitments or Doha Round offers, but rarely leads to changes in the regulations that are applied in AMS. Hence, the impact on trade and competitiveness of ASEAN services providers is limited to the potential effect on investment from strengthened assurances against a policy rollback. According to the analysis of services trade data, this effect has not been sufficiently strong to trigger a large expansion of intra-ASEAN services trade. A renewed focus on the implementation of pro-trade regulatory reforms thus seems desirable in order to move more quickly towards the objective of the AEC Blueprint of creating a unified services market in ASEAN. A first step in this direction could involve a more thorough monitoring of the implementation status of existing reform commitments, such that the available scorecard of commitment approval is supplemented by a scorecard of commitment implementation. 62. One of ASEAN’s relatively successful integration efforts concerns the mutual recognition arrangements for professional services that have been concluded among AMS. Indeed, international experience suggests that the most pronounced benefits from regional integration in services come from the harmonization of the regulatory environment and the convergence of policy regimes through the creation of common standards and institutions. Yet, the conclusion of the MRAs can only generate the hoped for benefits in terms of market integration if the arrangements are properly implemented and not compromised by national regulations. In this context, a close monitoring of the movement of professionals under the MRAs and the compliance of AMS with the spirit of the arrangements seems desirable. 63. More generally, the past focus of reform discussions in the Coordinating Community on Services (CCS) on improving market access could usefully be supplemented by discussions on deep integration through regulatory convergence and harmonization. Measures to open markets towards regional partners are often rapidly multilateralized, and, while being welcome parts of the regulatory reform process, provide as such limited impetus for more intense regional services trade and investment. Hence, shifting the attention of regulators and policymakers towards creating a unified services market with common rules and procedures is often a more promising avenue to foster regional integration. Steps in this direction could range from the occasional organization of information exchanges among sectoral regulators to the delegation of negotiating authority from the CCS to new sectoral working groups. In fact, the Air Transport Working Group and the Working Committee on Financial Services Liberalization have arguably been advancing the implementation of the AEC Blueprint objectives in their areas faster than the CCS has been able to across its broad portfolio of sub-sectors that each are subject to very particular technical specificities and regulatory requirements. 64. The establishment of new sub-sectoral working groups might also help to bridge the existing divide in regulatory capacity among AMS. As the data analysis has demonstrated, there is considerable diversity within ASEAN with some strong services exporters, such as Singapore or the Philippines, and several less well-positioned countries, which are just starting to integrate their services sectors into international markets. Moreover, in the STRI analysis, CLMV appear as being relatively open to services trade. Yet, these AMS are still in the process of codifying their existing regulations, and creating transparent and consistent policy regimes in the different services sub-sectors is an important step in the
119
development process. On the other hand, many of the more advanced AMS have mature services sectors and well-established prudential and consumer protection measures in place and would benefit from a regulatory easing and its pro-competitive impacts. These diverging situations and needs might best be appreciated and dealt with in discussions of sectoral experts rather than trade policy all-rounders. Also, the regular meetings of sectoral officials from AMS might help to spread information on best practices and useful approaches to regulatory challenges in the individual sub-sectors. 65. Last, the earlier discussion has revealed some marked gaps in the availability of information on intra-ASEAN services trade. ASEANstats has recently started to compile a dataset on intra-regional trade in collaboration with national statistical authorities, but these data are not available for all AMS and the uncertain quality of the information at the sub-sectoral level does not make it possible to provide detailed assessments of the situation and prospects of intra-ASEAN services trade. Hence, further steps of regional integration should go hand-in-hand with efforts to strengthen the statistical apparatus in order to enable policymakers to properly monitor progress towards established integration goals with the help of quantitative indicators.
Where do AMS Stand with Respect to AEC Goals: Implementation and the Domestic Regulatory Reform Agenda
66. The AMS established for themselves an ambitious set of objectives when they signed up for the AEC Blueprint targets on services sector integration. By 2015, there should be substantially no restrictions to suppliers providing services and establishing companies across national borders. 67. Subsequent rounds of negotiations have indeed resulted in good progress towards these goals. In particular, the establishment of clear, quantifiable targets has provided useful guidance to negotiators and helped them advance towards the desired outcome. Naturally, some sectors and policy areas (such as relaxing restrictions on foreign ownership) are politically more sensitive than others and the negotiation mechanism has allowed for sufficient flexibility to accommodate related reform-reluctance while keeping the overall negotiating process on track. Yet, these flexibilities have also meant that many sensitive issues and difficult reforms have been back loaded, so that the remaining time till the 2015 target date risks becoming a rather charged period for negotiators and policy makers. 68. Recent analysis by ERIA (2012) provided a detailed stocktaking on the extent to which AMS have fulfilled their AFAS commitments and concluded that the existing process of negotiations had proven its usefulness and could, with some modifications, also serve AMS well in the coming years. These recommendations are welcome and should encourage AMS to reinforce their efforts towards fully meeting the AEC targets by 2015. Missing the objectives set out by political leaders or introducing new ‘flexibilities’ just before the deadline to formally meet the targets could seriously undermine the credibility of the integration process and, as a result, compromise progress in future negotiations. 69. Given the urgency and sensitivity of the remaining tasks, it seems of fundamental importance that concerted efforts are launched in AMS involving all affected ministries to conclude the AEC reform agenda on time. Sectoral ministries might usefully want to develop their own blueprints and reform schedules to meet the 2015 targets, rather than rely on the Trade Ministry (or other lead coordinating agency) to advance the reform agenda in their area of expertise and responsibility. Also, renewed efforts to reach out to business associations, local communities and civic society and inform
120
these stakeholders about upcoming regulatory changes and their rationale seems crucial in order to harness sufficient political support for reform. 70. More generally, moving the services trade integration process forward will increasingly involve domestic policy reforms that entail regulatory adjustments. The AFAS negotiating process has over time led to a convergence of openness commitments of AMS with the applied policy regime within countries. Further trade-enhancing reforms will, hence, increasingly trigger changes on the ground. In this context, it is important for policymakers to get the sequence of reforms right. Often, ownership restrictions in sectors such as financial services or health services are put in place because the institutional framework to regulate the behavior of financial institutions or the quality of medical services is insufficient. Lifting these ownership restrictions will, thus, first require that an appropriate regulatory framework be established in order to avoid adverse impacts on services quality. Also, international experience suggests that success in the opening of network industries, such as telecommunications or transport, depends on competition to be introduced into the sector before privatization, so that public monopolies are not simply replaced by private monopolies. These reforms are in the proper interest of each AMS unilaterally and their benefits do not depend on a reciprocal market opening by trading partners. However, undertaking the policy changes in the context of an international agreement increases their credibility and can help further illustrate the reforms’ benefits to skeptical stakeholder groups. 71. In order to deepen financial integration, among the important policies are the development of financial infrastructure, harmonization of regulations, market standards and rules, strengthening of member countries’ capacity, as well as the promotion of greater macroeconomic and policy coordination. These measures are important to enable ASEAN to further enhance financial linkages and implement new initiatives, including the integration of banking services. Moreover, a monitoring mechanism for regional financial integration is crucial to ensure the timelines and milestones in line with the AEC 2015 targets and beyond.
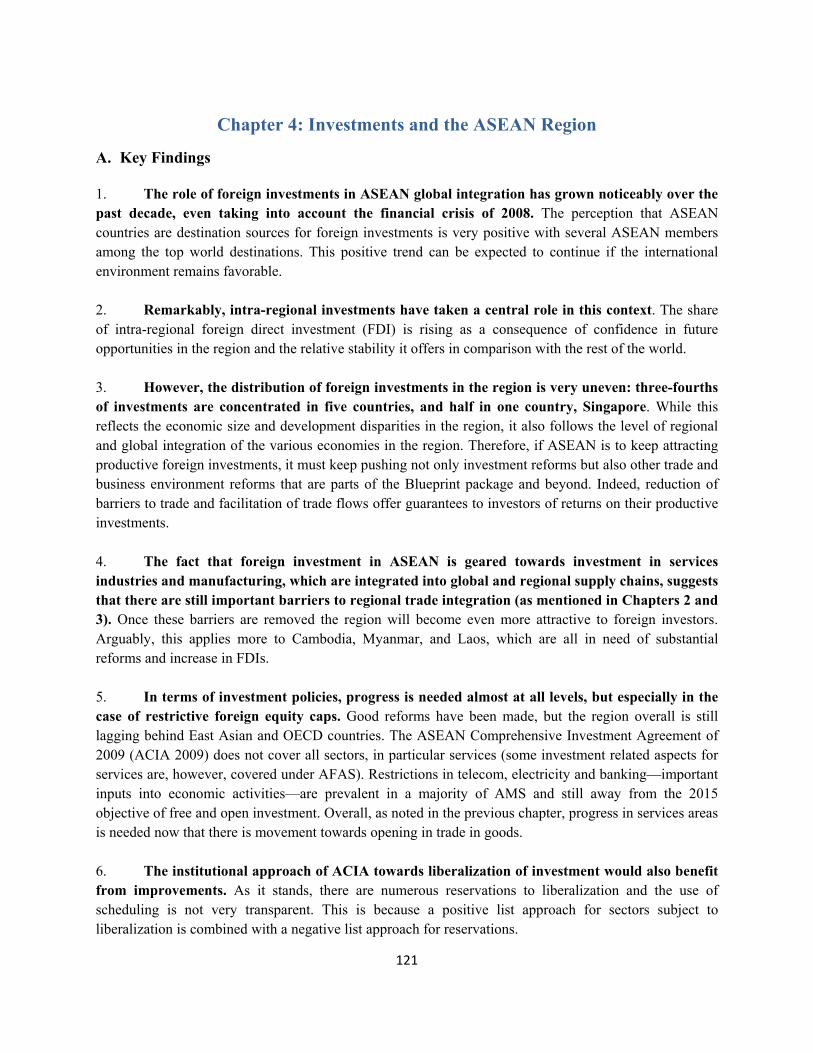
121
Chapter 4: Investments and the ASEAN Region
A. Key Findings
1. The role of foreign investments in ASEAN global integration has grown noticeably over the past decade, even taking into account the financial crisis of 2008. The perception that ASEAN countries are destination sources for foreign investments is very positive with several ASEAN members among the top world destinations. This positive trend can be expected to continue if the international environment remains favorable. 2. Remarkably, intra-regional investments have taken a central role in this context. The share of intra-regional foreign direct investment (FDI) is rising as a consequence of confidence in future opportunities in the region and the relative stability it offers in comparison with the rest of the world.
3. However, the distribution of foreign investments in the region is very uneven: three-fourths of investments are concentrated in five countries, and half in one country, Singapore. While this reflects the economic size and development disparities in the region, it also follows the level of regional and global integration of the various economies in the region. Therefore, if ASEAN is to keep attracting productive foreign investments, it must keep pushing not only investment reforms but also other trade and business environment reforms that are parts of the Blueprint package and beyond. Indeed, reduction of barriers to trade and facilitation of trade flows offer guarantees to investors of returns on their productive investments.
4. The fact that foreign investment in ASEAN is geared towards investment in services industries and manufacturing, which are integrated into global and regional supply chains, suggests that there are still important barriers to regional trade integration (as mentioned in Chapters 2 and 3). Once these barriers are removed the region will become even more attractive to foreign investors. Arguably, this applies more to Cambodia, Myanmar, and Laos, which are all in need of substantial reforms and increase in FDIs.
5. In terms of investment policies, progress is needed almost at all levels, but especially in the case of restrictive foreign equity caps. Good reforms have been made, but the region overall is still lagging behind East Asian and OECD countries. The ASEAN Comprehensive Investment Agreement of 2009 (ACIA 2009) does not cover all sectors, in particular services (some investment related aspects for services are, however, covered under AFAS). Restrictions in telecom, electricity and banking—important inputs into economic activities—are prevalent in a majority of AMS and still away from the 2015 objective of free and open investment. Overall, as noted in the previous chapter, progress in services areas is needed now that there is movement towards opening in trade in goods.
6. The institutional approach of ACIA towards liberalization of investment would also benefit from improvements. As it stands, there are numerous reservations to liberalization and the use of scheduling is not very transparent. This is because a positive list approach for sectors subject to liberalization is combined with a negative list approach for reservations.
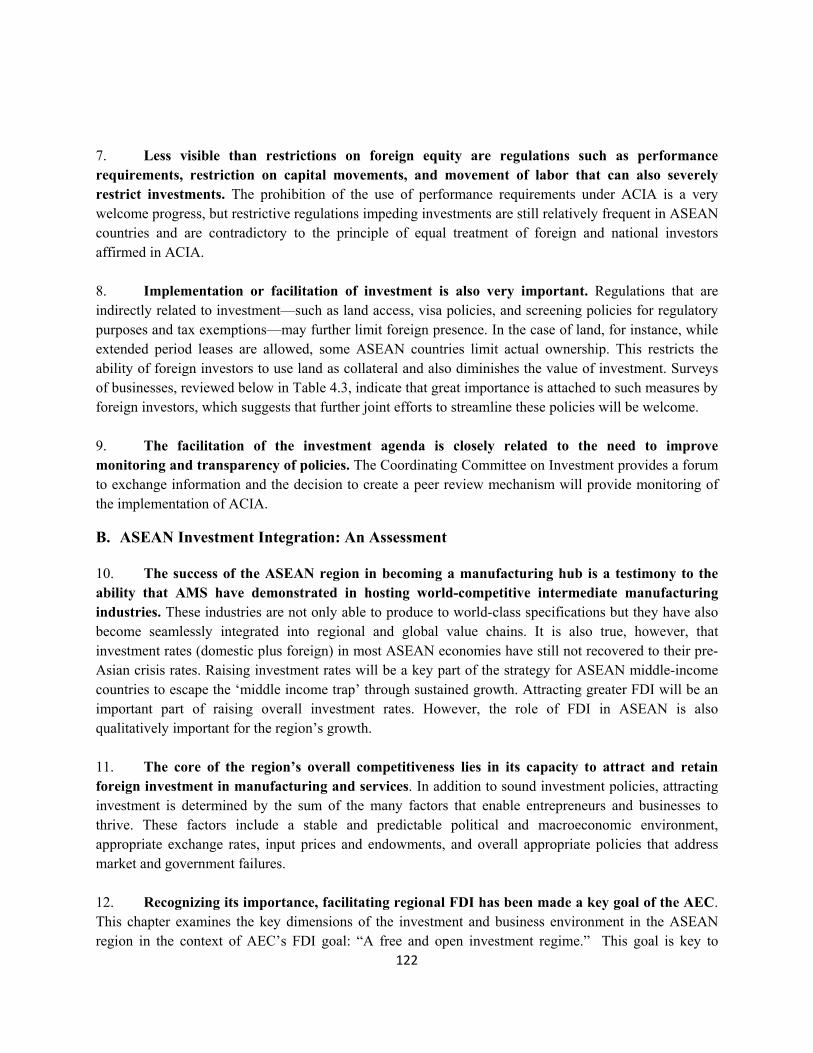
122
7. Less visible than restrictions on foreign equity are regulations such as performance requirements, restriction on capital movements, and movement of labor that can also severely restrict investments. The prohibition of the use of performance requirements under ACIA is a very welcome progress, but restrictive regulations impeding investments are still relatively frequent in ASEAN countries and are contradictory to the principle of equal treatment of foreign and national investors affirmed in ACIA.
8. Implementation or facilitation of investment is also very important. Regulations that are indirectly related to investment—such as land access, visa policies, and screening policies for regulatory purposes and tax exemptions—may further limit foreign presence. In the case of land, for instance, while extended period leases are allowed, some ASEAN countries limit actual ownership. This restricts the ability of foreign investors to use land as collateral and also diminishes the value of investment. Surveys of businesses, reviewed below in Table 4.3, indicate that great importance is attached to such measures by foreign investors, which suggests that further joint efforts to streamline these policies will be welcome.
9. The facilitation of the investment agenda is closely related to the need to improve monitoring and transparency of policies. The Coordinating Committee on Investment provides a forum to exchange information and the decision to create a peer review mechanism will provide monitoring of the implementation of ACIA.
B. ASEAN Investment Integration: An Assessment
10. The success of the ASEAN region in becoming a manufacturing hub is a testimony to the ability that AMS have demonstrated in hosting world-competitive intermediate manufacturing industries. These industries are not only able to produce to world-class specifications but they have also become seamlessly integrated into regional and global value chains. It is also true, however, that investment rates (domestic plus foreign) in most ASEAN economies have still not recovered to their pre-Asian crisis rates. Raising investment rates will be a key part of the strategy for ASEAN middle-income countries to escape the ‘middle income trap’ through sustained growth. Attracting greater FDI will be an important part of raising overall investment rates. However, the role of FDI in ASEAN is also qualitatively important for the region’s growth. 11. The core of the region’s overall competitiveness lies in its capacity to attract and retain foreign investment in manufacturing and services. In addition to sound investment policies, attracting investment is determined by the sum of the many factors that enable entrepreneurs and businesses to thrive. These factors include a stable and predictable political and macroeconomic environment, appropriate exchange rates, input prices and endowments, and overall appropriate policies that address market and government failures.
12. Recognizing its importance, facilitating regional FDI has been made a key goal of the AEC. This chapter examines the key dimensions of the investment and business environment in the ASEAN region in the context of AEC’s FDI goal: “A free and open investment regime.” This goal is key to
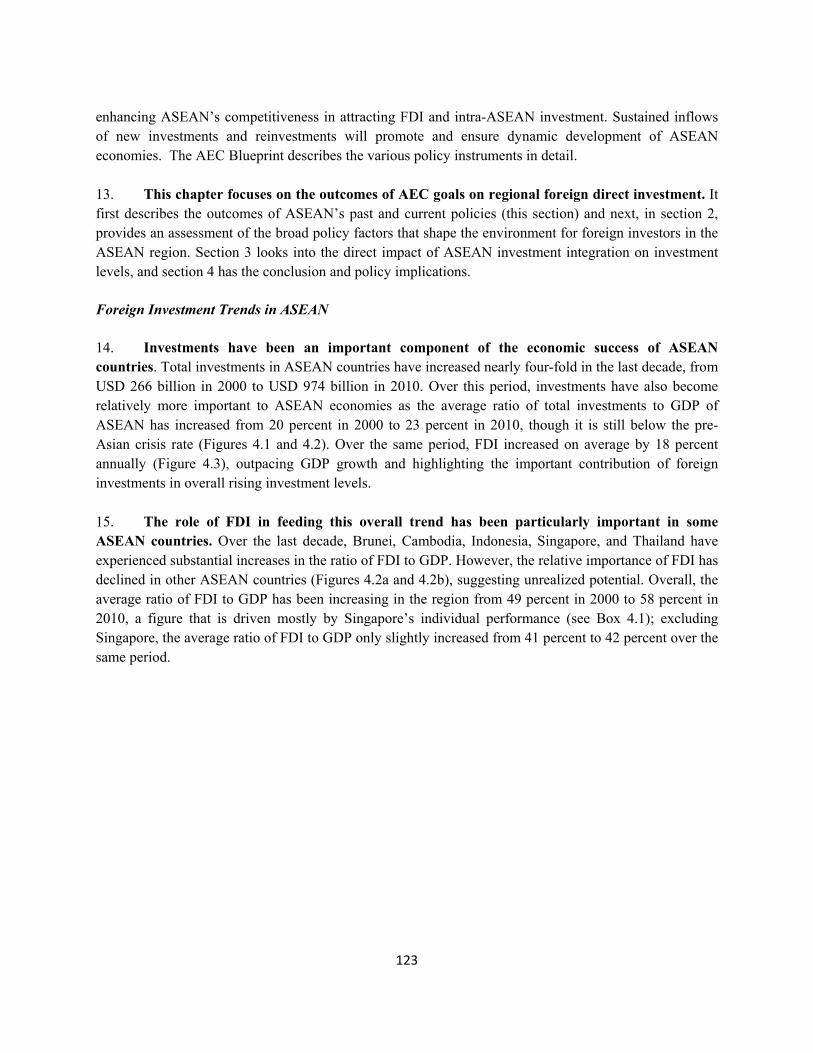
123
enhancing ASEAN’s competitiveness in attracting FDI and intra-ASEAN investment. Sustained inflows of new investments and reinvestments will promote and ensure dynamic development of ASEAN economies. The AEC Blueprint describes the various policy instruments in detail.
13. This chapter focuses on the outcomes of AEC goals on regional foreign direct investment. It first describes the outcomes of ASEAN’s past and current policies (this section) and next, in section 2, provides an assessment of the broad policy factors that shape the environment for foreign investors in the ASEAN region. Section 3 looks into the direct impact of ASEAN investment integration on investment levels, and section 4 has the conclusion and policy implications.
Foreign Investment Trends in ASEAN
14. Investments have been an important component of the economic success of ASEAN countries. Total investments in ASEAN countries have increased nearly four-fold in the last decade, from USD 266 billion in 2000 to USD 974 billion in 2010. Over this period, investments have also become relatively more important to ASEAN economies as the average ratio of total investments to GDP of ASEAN has increased from 20 percent in 2000 to 23 percent in 2010, though it is still below the pre- Asian crisis rate (Figures 4.1 and 4.2). Over the same period, FDI increased on average by 18 percent annually (Figure 4.3), outpacing GDP growth and highlighting the important contribution of foreign investments in overall rising investment levels. 15. The role of FDI in feeding this overall trend has been particularly important in some ASEAN countries. Over the last decade, Brunei, Cambodia, Indonesia, Singapore, and Thailand have experienced substantial increases in the ratio of FDI to GDP. However, the relative importance of FDI has declined in other ASEAN countries (Figures 4.2a and 4.2b), suggesting unrealized potential. Overall, the average ratio of FDI to GDP has been increasing in the region from 49 percent in 2000 to 58 percent in 2010, a figure that is driven mostly by Singapore’s individual performance (see Box 4.1); excluding Singapore, the average ratio of FDI to GDP only slightly increased from 41 percent to 42 percent over the same period.
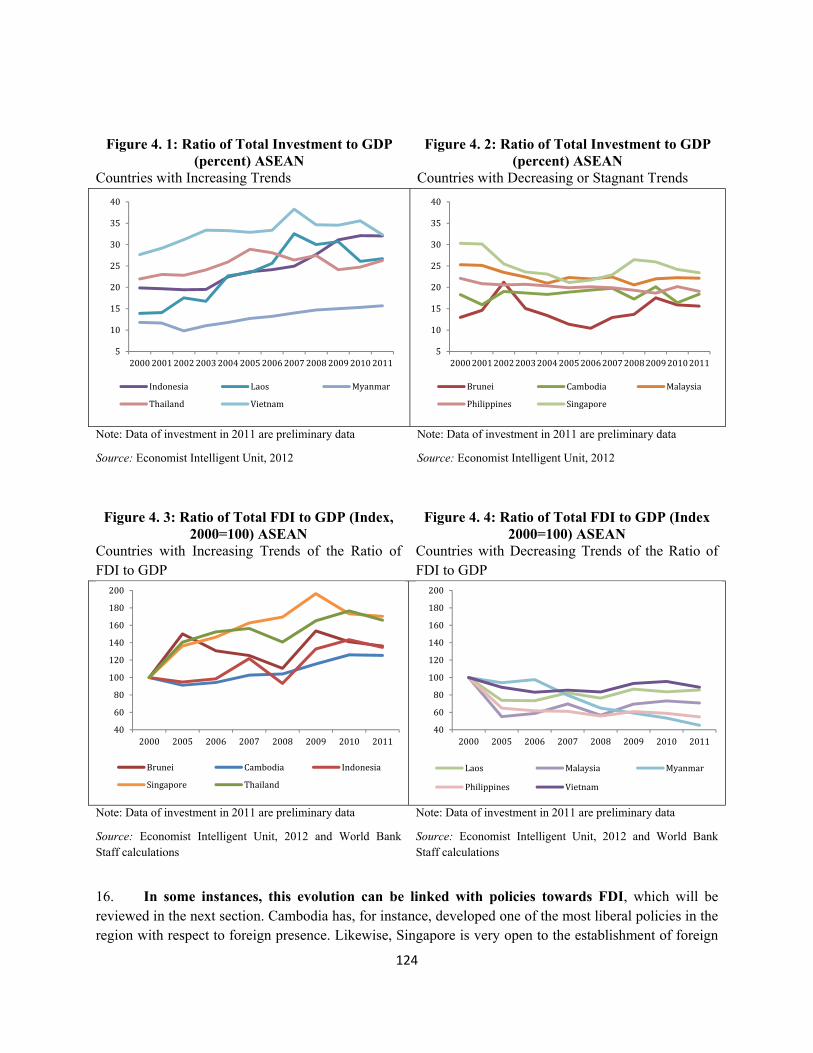
124
Figure 4. 1: Ratio of Total Investment to GDP (percent) ASEAN
Countries with Increasing Trends
Figure 4. 2: Ratio of Total Investment to GDP (percent) ASEAN
Countries with Decreasing or Stagnant Trends
Note: Data of investment in 2011 are preliminary data
Source: Economist Intelligent Unit, 2012
Note: Data of investment in 2011 are preliminary data
Source: Economist Intelligent Unit, 2012
Figure 4. 3: Ratio of Total FDI to GDP (Index, 2000=100) ASEAN
Countries with Increasing Trends of the Ratio of FDI to GDP
Figure 4. 4: Ratio of Total FDI to GDP (Index 2000=100) ASEAN
Countries with Decreasing Trends of the Ratio of FDI to GDP
Note: Data of investment in 2011 are preliminary data
Source: Economist Intelligent Unit, 2012 and World Bank Staff calculations
Note: Data of investment in 2011 are preliminary data
Source: Economist Intelligent Unit, 2012 and World Bank Staff calculations
16. In some instances, this evolution can be linked with policies towards FDI, which will be reviewed in the next section. Cambodia has, for instance, developed one of the most liberal policies in the region with respect to foreign presence. Likewise, Singapore is very open to the establishment of foreign
510152025303540
2000 2001 2002 2003 2004 2005 2006 2007 2008 2009 2010 2011Indonesia Laos MyanmarThailand Vietnam510152025303540
2000 2001 2002 2003 2004 2005 2006 2007 2008 2009 2010 2011Brunei Cambodia MalaysiaPhilippines Singapore
406080100120140160180200
2000 2005 2006 2007 2008 2009 2010 2011Brunei Cambodia IndonesiaSingapore Thailand406080100120140160180200
2000 2005 2006 2007 2008 2009 2010 2011Laos Malaysia MyanmarPhilippines Vietnam
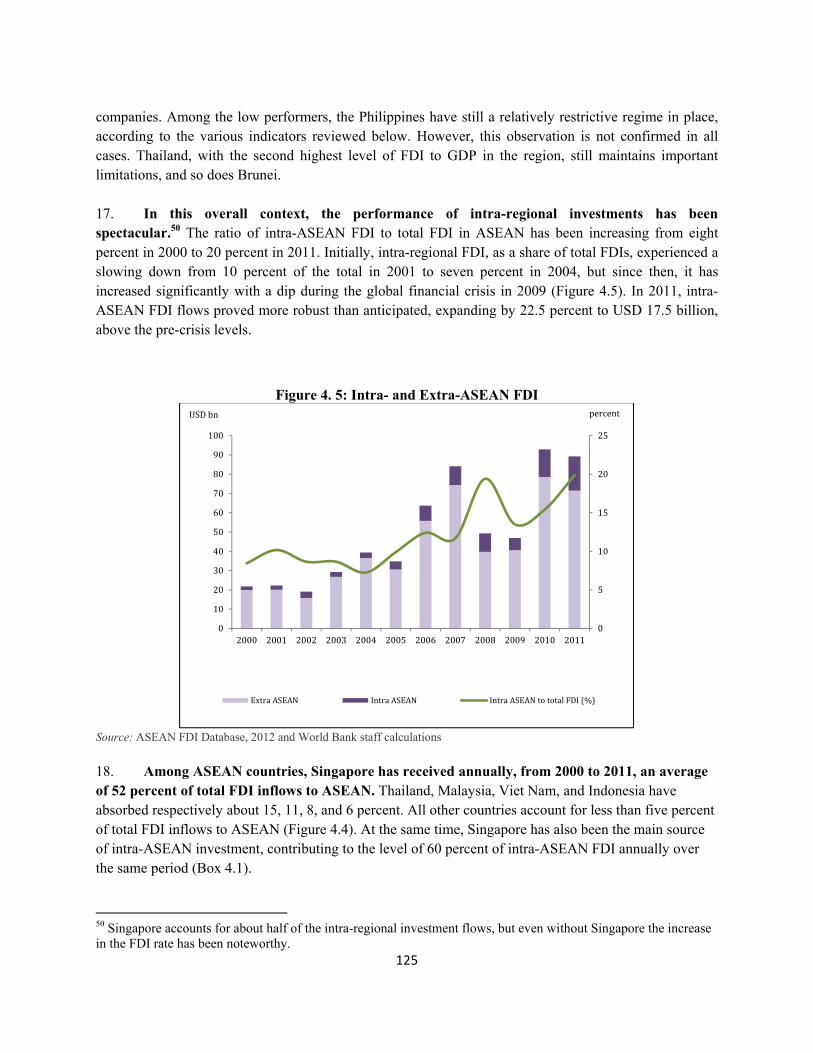
125
companies. Among the low performers, the Philippines have still a relatively restrictive regime in place, according to the various indicators reviewed below. However, this observation is not confirmed in all cases. Thailand, with the second highest level of FDI to GDP in the region, still maintains important limitations, and so does Brunei. 17. In this overall context, the performance of intra-regional investments has been spectacular.50 The ratio of intra-ASEAN FDI to total FDI in ASEAN has been increasing from eight percent in 2000 to 20 percent in 2011. Initially, intra-regional FDI, as a share of total FDIs, experienced a slowing down from 10 percent of the total in 2001 to seven percent in 2004, but since then, it has increased significantly with a dip during the global financial crisis in 2009 (Figure 4.5). In 2011, intra-ASEAN FDI flows proved more robust than anticipated, expanding by 22.5 percent to USD 17.5 billion, above the pre-crisis levels.
Figure 4. 5: Intra- and Extra-ASEAN FDI
Source: ASEAN FDI Database, 2012 and World Bank staff calculations
18. Among ASEAN countries, Singapore has received annually, from 2000 to 2011, an average of 52 percent of total FDI inflows to ASEAN. Thailand, Malaysia, Viet Nam, and Indonesia have absorbed respectively about 15, 11, 8, and 6 percent. All other countries account for less than five percent of total FDI inflows to ASEAN (Figure 4.4). At the same time, Singapore has also been the main source of intra-ASEAN investment, contributing to the level of 60 percent of intra-ASEAN FDI annually over the same period (Box 4.1).
50 Singapore accounts for about half of the intra-regional investment flows, but even without Singapore the increase in the FDI rate has been noteworthy.
0510152025
0102030405060708090100
2000 2001 2002 2003 2004 2005 2006 2007 2008 2009 2010 2011Extra ASEAN Intra ASEAN Intra ASEAN to total FDI (%)
USD bn percent
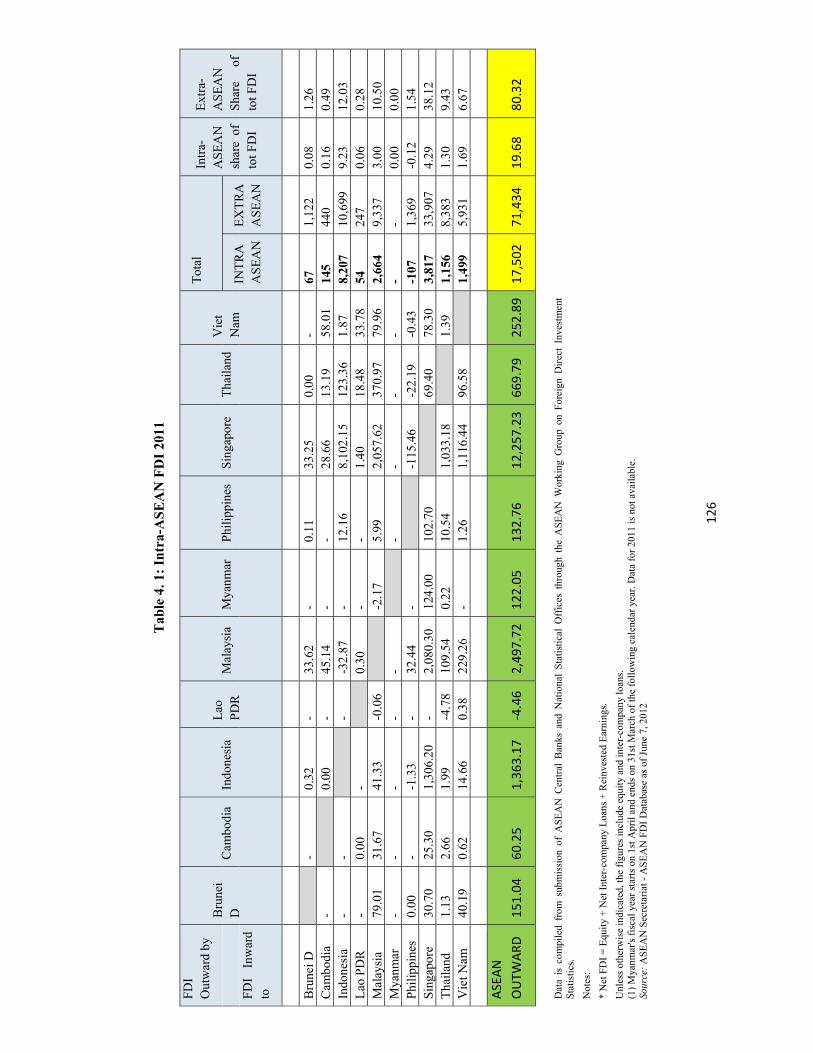
126
Tab
le 4
. 1:
Intr
a-A
SE
AN
FD
I 20
11
FD
I O
utw
ard
by
Bru
nei
D
Cam
bodi
a In
done
sia
Lao
P
DR
M
alay
sia
Mya
nmar
P
hilip
pine
s S
inga
pore
T
haila
nd
Vie
t N
am
Tot
al
Intr
a-A
SE
AN
sh
are
of
tot F
DI
Ext
ra-
AS
EA
N
Sha
re
of
tot F
DI
IN
TR
A
AS
EA
N
EX
TR
A
AS
EA
N
FD
I In
war
d to
Bru
nei D
-
0.32
-
33.6
2 -
0.11
33
.25
0.00
-
67
1,12
2 0.
08
1.26
C
ambo
dia
- 0.
00
- 45
.14
- -
28.6
6 13
.19
58.0
1 14
5 44
0 0.
16
0.49
In
done
sia
- -
- -3
2.87
-
12.1
6 8,
102.
15
123.
36
1.87
8,
207
10,6
99
9.23
12
.03
Lao
PD
R
- 0.
00
- 0.
30
- -
1.40
18
.48
33.7
8 54
24
7 0.
06
0.28
M
alay
sia
79.0
1 31
.67
41.3
3 -0
.06
-2.1
7 5.
99
2,05
7.62
37
0.97
79
.96
2,66
4 9,
337
3.00
10
.50
Mya
nmar
-
- -
- -
- -
- -
- -
0.00
0.
00
Phi
lippi
nes
0.00
-
-1.3
3 -
32.4
4 -
-115
.46
-22.
19
-0.4
3 -1
07
1,36
9 -0
.12
1.54
S
inga
pore
30
.70
25.3
0 1,
306.
20
- 2,
080.
30
124.
00
102.
70
69.4
0 78
.30
3,81
7 33
,907
4.
29
38.1
2 T
haila
nd
1.13
2.
66
1.99
-4
.78
109.
54
0.22
10
.54
1,03
3.18
1.
39
1,15
6 8,
383
1.30
9.
43
Vie
t Nam
40
.19
0.62
14
.66
0.38
22
9.26
-
1.26
1,
116.
44
96.5
8 1,
499
5,93
1 1.
69
6.67
AS
EAN
O
UTW
ARD
151.
04
60.2
5 1,
363.
17
-4.4
6 2,
497.
7212
2.05
13
2.76
12
,257
.23
669.
79
252.
8917
,502
71
,434
19
.68
80.3
2
Dat
a is
com
pile
d fr
om s
ubm
issi
on o
f A
SE
AN
Cen
tral
Ban
ks a
nd N
atio
nal
Sta
tist
ical
Off
ices
thr
ough
the
AS
EA
N W
orki
ng G
roup
on
For
eign
Dir
ect
Inve
stm
ent
Sta
tist
ics.
Not
es:
* N
et F
DI
= E
quit
y +
Net
Int
er-c
ompa
ny L
oans
+ R
einv
este
d E
arni
ngs.
Unl
ess
othe
rwis
e in
dica
ted,
the
figu
res
incl
ude
equi
ty a
nd in
ter-
com
pany
loan
s.
(1)
Mya
nmar
's f
isca
l yea
r st
arts
on
1st A
pril
and
end
s on
31s
t Mar
ch o
f th
e fo
llow
ing
cale
ndar
yea
r. D
ata
for
2011
is n
ot a
vaila
ble.
So
urce
: A
SE
AN
Sec
reta
riat
- A
SE
AN
FD
I D
atab
ase
as o
f Ju
ne 7
, 201
2
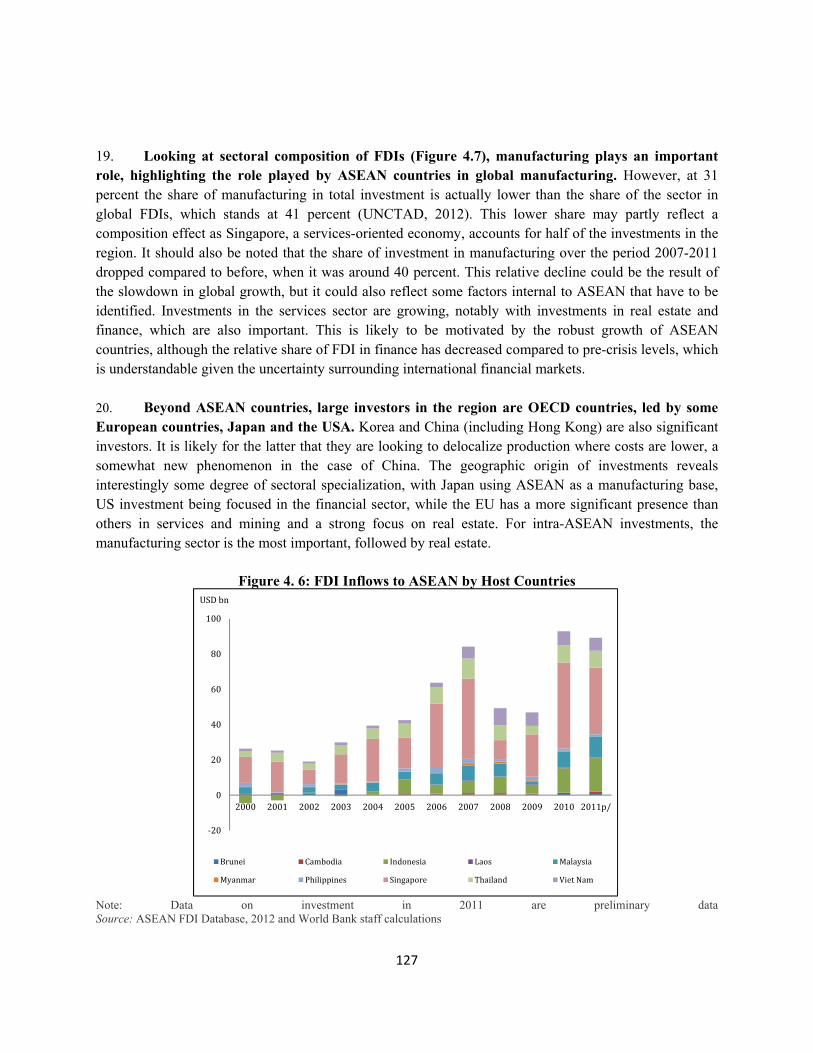
127
19. Looking at sectoral composition of FDIs (Figure 4.7), manufacturing plays an important role, highlighting the role played by ASEAN countries in global manufacturing. However, at 31 percent the share of manufacturing in total investment is actually lower than the share of the sector in global FDIs, which stands at 41 percent (UNCTAD, 2012). This lower share may partly reflect a composition effect as Singapore, a services-oriented economy, accounts for half of the investments in the region. It should also be noted that the share of investment in manufacturing over the period 2007-2011 dropped compared to before, when it was around 40 percent. This relative decline could be the result of the slowdown in global growth, but it could also reflect some factors internal to ASEAN that have to be identified. Investments in the services sector are growing, notably with investments in real estate and finance, which are also important. This is likely to be motivated by the robust growth of ASEAN countries, although the relative share of FDI in finance has decreased compared to pre-crisis levels, which is understandable given the uncertainty surrounding international financial markets. 20. Beyond ASEAN countries, large investors in the region are OECD countries, led by some European countries, Japan and the USA. Korea and China (including Hong Kong) are also significant investors. It is likely for the latter that they are looking to delocalize production where costs are lower, a somewhat new phenomenon in the case of China. The geographic origin of investments reveals interestingly some degree of sectoral specialization, with Japan using ASEAN as a manufacturing base, US investment being focused in the financial sector, while the EU has a more significant presence than others in services and mining and a strong focus on real estate. For intra-ASEAN investments, the manufacturing sector is the most important, followed by real estate.
Figure 4. 6: FDI Inflows to ASEAN by Host Countries
Note: Data on investment in 2011 are preliminary data Source: ASEAN FDI Database, 2012 and World Bank staff calculations
-200
20406080
100
2000 2001 2002 2003 2004 2005 2006 2007 2008 2009 2010 2011p/
USD bn
Brunei Cambodia Indonesia Laos MalaysiaMyanmar Philippines Singapore Thailand Viet Nam
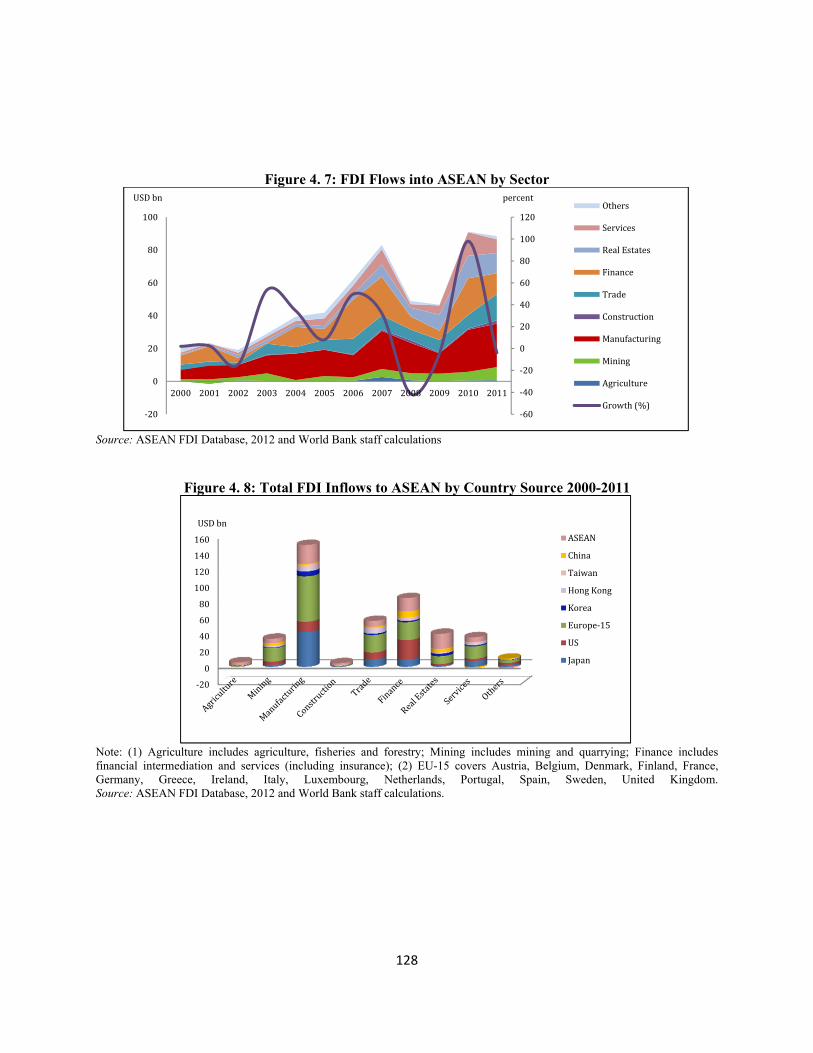
128
Figure 4. 7: FDI Flows into ASEAN by Sector
Source: ASEAN FDI Database, 2012 and World Bank staff calculations
Figure 4. 8: Total FDI Inflows to ASEAN by Country Source 2000-2011
Note: (1) Agriculture includes agriculture, fisheries and forestry; Mining includes mining and quarrying; Finance includes financial intermediation and services (including insurance); (2) EU-15 covers Austria, Belgium, Denmark, Finland, France, Germany, Greece, Ireland, Italy, Luxembourg, Netherlands, Portugal, Spain, Sweden, United Kingdom. Source: ASEAN FDI Database, 2012 and World Bank staff calculations.
-60-40-20020406080100120
-200
20406080
100
2000 2001 2002 2003 2004 2005 2006 2007 2008 2009 2010 2011
OthersServicesReal EstatesFinanceTradeConstructionManufacturingMiningAgricultureGrowth (%)
USD bn percent
-20020406080100120140160 ASEANChinaTaiwanHong KongKoreaEurope-15USJapan
USD bn
129
Box 4. 1: Singapore: The Investment Hub of ASEAN
Singapore receives a little over half of the FDI of the ASEAN region even though it only accounted for a little less than 10 percent of the region’s total GDP in 2011. The level of sophistication of the economy, and the quality of its business environment, are among the factors that make Singapore relatively more attractive than its ASEAN neighbors for FDI. Another reason why Singapore attracts so much FDI is because some of these investments are seeking access to the whole ASEAN market to benefit from the increased freedom of circulation within the ASEAN market. Plummer and Cheong (2009) noted that Singapore dominates as a source of intra-regional FDI, supplying 61 percent of total intra-regional FDI for the period 1995-2006. This share was 70 percent in 2011 (Table 4.1). They note that Singapore serves as both an “entrepot” center for intra-ASEAN trade and a hub for FDI and that without Singapore, intra-regional trade and investment would be much diminished. Singapore’s excellent performance in attracting FDI is thus in many ways linked to the economic performance of the region. ASEAN is, for instance, the first destination of Japanese investments, on par with investments towards China. Of these, investments in the services sector have been increasing and directed mostly towards Singapore, whose share was about 60 percent of total investment in 2009 and 2010. In the transport sector, Singapore’s share of Japan’s total investment in ASEAN has been over 80 percent in the five-year period 2006-2010. Among the companies that have established regional operating headquarters in Singapore in such sectors are: Nippon Express, Yamato Transport, and Mitsubishi Logistics.
These investments in the transport sector took place at a time when ASEAN members had decided to liberalize transport and logistics services, and in particular cross-border supply under AFAS. Singapore has also liberalized its logistics sector, allowing unrestricted foreign commercial presence, and has taken steps to liberalize parts of its transport sector.51 Singapore has also extensive bilateral liberalization commitments in transport services under the 2002 Japan Singapore Economic Partnership Agreement.
Source: Hamanaka (2011)
21. Since 2000, foreign investments in ASEAN have augmented slightly as a share of the region GDP and importantly in overall volumes, mirroring the growth of ASEAN countries. In this overall positive context, the role of ASEAN as a region has been central. First, intra-regional investments have grown significantly in share, replacing to some extent investments coming from outside the region. This could reflect two developments. The first is that market access conditions for intra-ASEAN investors have become more favorable than for investors from outside the region; this also includes the possibility that over time, investments from outside ASEAN have generated profits that have been reinvested in other countries in the region by companies established in one ASEAN country.52 The second development is the very important role played by Singapore at the regional level, as the country is both the host of a majority of FDIs in the ASEAN region and the majority source of intra-regional FDIs. This suggests that Singapore has a key role as an investment hub and probably also as a model of good practice. Also, investments have targeted, as would be expected, large and populated markets in the region, with the Philippines being an exception here.
51 Note that in Table 4.5 Singapore’s transport sector still appears relatively closed to foreign establishment. This reflects restrictions in the operations of airports and ports. The score on the transport sector in Table 4.5 does not include maritime transport. 52 Early evidence from Tejima (1995) points to the importance of reinvested earnings by Japanese affiliates in ASEAN, amounting to 45 percent of total FDI in 1993.
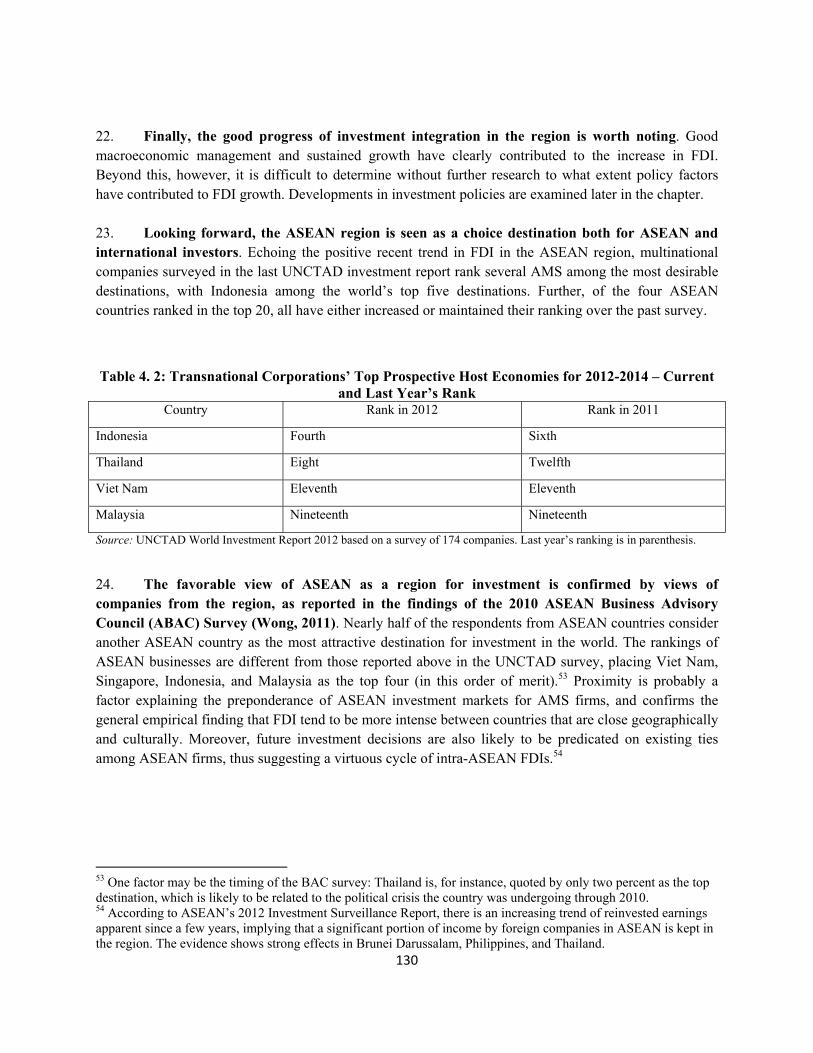
130
22. Finally, the good progress of investment integration in the region is worth noting. Good macroeconomic management and sustained growth have clearly contributed to the increase in FDI. Beyond this, however, it is difficult to determine without further research to what extent policy factors have contributed to FDI growth. Developments in investment policies are examined later in the chapter.
23. Looking forward, the ASEAN region is seen as a choice destination both for ASEAN and international investors. Echoing the positive recent trend in FDI in the ASEAN region, multinational companies surveyed in the last UNCTAD investment report rank several AMS among the most desirable destinations, with Indonesia among the world’s top five destinations. Further, of the four ASEAN countries ranked in the top 20, all have either increased or maintained their ranking over the past survey.
Table 4. 2: Transnational Corporations’ Top Prospective Host Economies for 2012-2014 – Current and Last Year’s Rank
Country Rank in 2012 Rank in 2011
Indonesia Fourth Sixth
Thailand Eight Twelfth
Viet Nam Eleventh Eleventh
Malaysia Nineteenth Nineteenth
Source: UNCTAD World Investment Report 2012 based on a survey of 174 companies. Last year’s ranking is in parenthesis.
24. The favorable view of ASEAN as a region for investment is confirmed by views of companies from the region, as reported in the findings of the 2010 ASEAN Business Advisory Council (ABAC) Survey (Wong, 2011). Nearly half of the respondents from ASEAN countries consider another ASEAN country as the most attractive destination for investment in the world. The rankings of ASEAN businesses are different from those reported above in the UNCTAD survey, placing Viet Nam, Singapore, Indonesia, and Malaysia as the top four (in this order of merit).53 Proximity is probably a factor explaining the preponderance of ASEAN investment markets for AMS firms, and confirms the general empirical finding that FDI tend to be more intense between countries that are close geographically and culturally. Moreover, future investment decisions are also likely to be predicated on existing ties among ASEAN firms, thus suggesting a virtuous cycle of intra-ASEAN FDIs.54
53 One factor may be the timing of the BAC survey: Thailand is, for instance, quoted by only two percent as the top destination, which is likely to be related to the political crisis the country was undergoing through 2010. 54 According to ASEAN’s 2012 Investment Surveillance Report, there is an increasing trend of reinvested earnings apparent since a few years, implying that a significant portion of income by foreign companies in ASEAN is kept in the region. The evidence shows strong effects in Brunei Darussalam, Philippines, and Thailand.
131
Business Environment in ASEAN Region and Attractiveness of FDIs
25. The ABAC survey suggests a positive outlook for investment in the ASEAN region. This is likely a response to reform policies region-wide. However, several questions remain as the performance of individual AMS has been uneven and the regional trend appears to be largely led by the dynamism of Singapore. There is also the question of whether the positive trend of recent years can be sustained. This, in turn, raises the question of whether the overall environment for investment in ASEAN can be further improved. In particular, what are the areas where the region is performing well and what are the areas where it is performing not so well? Is ASEAN performing to its full potential? Also, can the large differences among members be closed? 26. Pinpointing the policy determinants of FDI is notoriously complicated. Economics suggests that the following factors are at play: the business environment and quality of infrastructure; the cost of factors of production (labor and access to finance and land); the overall macroeconomic state (exchange rate, macroeconomic stability); the institutional environment (corruption, political stability and quality of legal institutions); and the existence of international trade and investment agreements. However, some authors argue that the economic literature of empirical investigations has generally provided a partial view on what determinants matter for FDI (Blonigen and Piger, 2011).
27. In fact, in the case of trade flows, bilateral investment flows are primarily determined by economic size and proximity of countries (measured by geographical or cultural closeness). This explains why FDI in the region has been robust—fueled by economic growth averaging six percent from 2000 to 2011 and a rising middle-income class with GDP per capita of more than USD 3,000 in Malaysia, Thailand and Indonesia. Proximity explains also to some extent why intra-ASEAN investments should be relatively important. With respect to policy driven factors such as the business environment, infrastructure, and the quality of institutions, all are thought to be determinants of FDI, but the evidence is not conclusive. Therefore, while these policy dimensions are central for domestic activity to thrive, their direct role in promoting inward investment is not entirely proven. Among the possible factors driving foreign investment, only relative endowments in labor (especially important for vertical FDI) and, importantly for ASEAN, membership in a regional trading agreement are found to be significant factors (Blonigen and Piger, 2011).
28. To better understand the determinants of investment, it is important to examine the broad constraints firms say they are facing in ASEAN countries in doing business that may deter prospective investors. The World Bank’s Enterprise Surveys data on businesses’ perceptions of top business environment constraints is used to examine these constraints. The Enterprise Surveys show that in the six ASEAN countries surveyed, access to finance is the top constraint. This is followed by the practices of the informal sector, tax rates and administration, and concerns about workforce skills. These concerns about constraints are roughly similar to that of the rest of the world. ASEAN countries, however, perform better on access to electricity and instability of the political environment, which are globally identified as major constraints to doing business.
132
29. Presumably access to finance and tax constraints are lower for foreign investors than domestic firms, because foreign investors have greater access to international finance from a foreign parent firm and are sometimes granted tax exemption. Perception of political instability does not appear to be an important deterrent to foreign investors in ASEAN with a few exceptions.55 The only dimension that may be a constraining factor is workforce skills. 30. Additional information provided by the 2010 World Governance Indicators (WGI) suggests that there is also much progress to be made on governance. The WGI reports aggregate and individual governance indicators for 213 economies over the period 1996-2010, for six dimensions of governance: voice and accountability, political stability and absence of violence, government effectiveness, regulatory quality, rule of law, and control of corruption. The five latter dimensions are directly relevant to foreign investment decisions because they show a picture of vast contrasts in the region: ASEAN countries belong to both the top 10 and bottom 10 percent of countries as measured by these indicators. 31. Given that half the ASEAN countries’ governance indicators that matter to foreign investors (Figure 4.9) are ranked in the bottom half of the world, there is considerable room for improvement. Government effectiveness and regulatory quality will ensure that appropriate policies are in place to enable business development and satisfactory rule of law and control of corruption will ensure that rights are properly enforced and business transactions can safely take place.
55 These are Cambodia, Indonesia, and Philippines, and this finding is also reflected in the World Governance Indicators reviewed next.
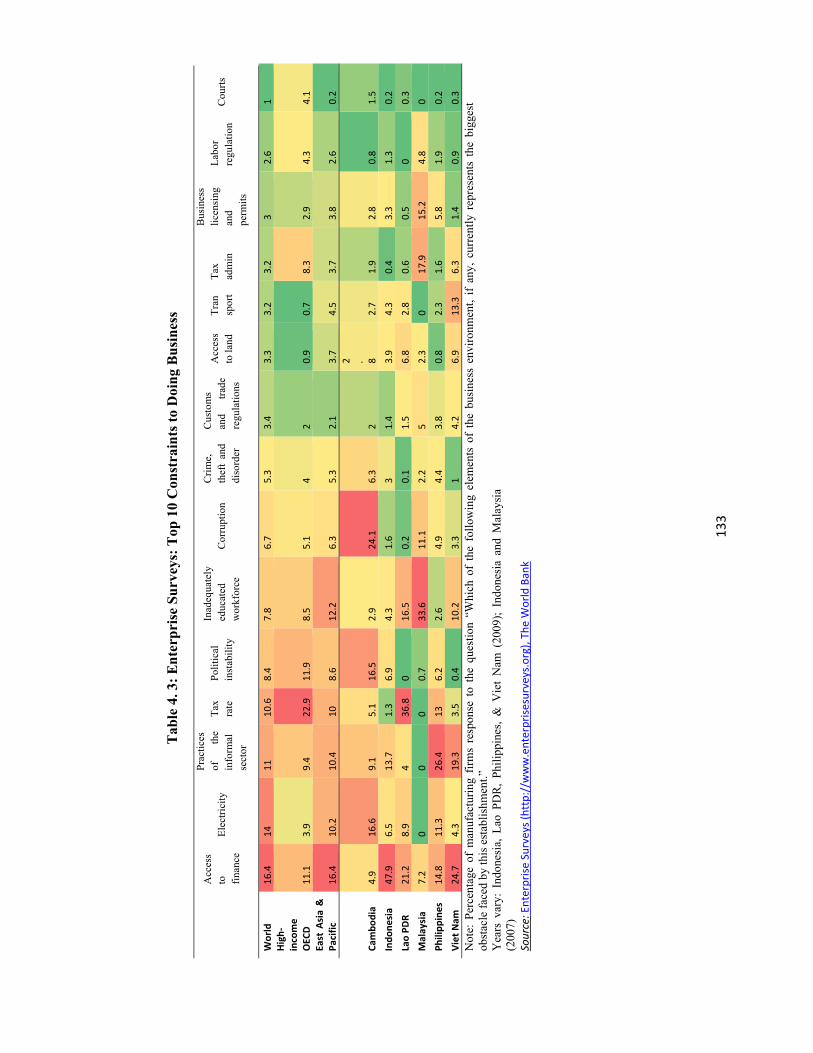
133
Tab
le 4
. 3:
En
terp
rise
Su
rvey
s: T
op 1
0 C
onst
rain
ts t
o D
oin
g B
usi
nes
s
Acc
ess
to
fina
nce
Ele
ctri
city
Pra
ctic
es
of
the
info
rmal
se
ctor
Tax
ra
te
Pol
itic
al
inst
abil
ity
Inad
equa
tely
ed
ucat
ed
wor
kfor
ce
Cor
rupt
ion
Cri
me,
th
eft
and
diso
rder
Cus
tom
s an
d tr
ade
regu
lati
ons
Acc
ess
to la
nd
Tra
nsp
ort
Tax
ad
min
Bus
ines
s li
cens
ing
and
perm
its
Lab
or
regu
lati
on
Cou
rts
Wor
ld
16.4
14
11
10
.6
8.4
7.8
6.7
5.3
3.4
3.3
3.2
3.2
3 2.
6 1
High
-in
com
e O
ECD
11
.1
3.9
9.4
22.9
11
.9
8.5
5.1
4 2
0.9
0.7
8.3
2.9
4.3
4.1
East
Asi
a &
Pa
cific
16
.4
10.2
10
.4
10
8.6
12.2
6.
3 5.
3 2.
1 3.
7 4.
5 3.
7 3.
8 2.
6 0.
2
Cam
bodi
a 4.
9 16
.6
9.1
5.1
16.5
2.
9 24
.1
6.3
2
2 . 8 2.
7 1.
9 2.
8 0.
8 1.
5 In
done
sia
47.9
6.
5 13
.7
1.3
6.9
4.3
1.6
3 1.
4 3.
9 4.
3 0.
4 3.
3 1.
3 0.
2 La
o PD
R 21
.2
8.9
4 36
.8
0 16
.5
0.2
0.1
1.5
6.8
2.8
0.6
0.5
0 0.
3 M
alay
sia
7.2
0 0
0 0.
7 33
.6
11.1
2.
2 5
2.3
0 17
.9
15.2
4.
8 0
Phili
ppin
es
14.8
11
.3
26.4
13
6.
2 2.
6 4.
9 4.
4 3.
8 0.
8 2.
3 1.
6 5.
8 1.
9 0.
2 Vi
et N
am
24.7
4.
3 19
.3
3.5
0.4
10.2
3.
3 1
4.2
6.9
13.3
6.
3 1.
4 0.
9 0.
3 N
ote:
Per
cent
age
of m
anuf
actu
ring
fir
ms
resp
onse
to
the
ques
tion
“W
hich
of
the
foll
owin
g el
emen
ts o
f th
e bu
sine
ss e
nvir
onm
ent,
if a
ny,
curr
entl
y re
pres
ents
the
big
gest
ob
stac
le f
aced
by
this
est
ablis
hmen
t.”
Yea
rs v
ary:
Ind
ones
ia,
Lao
PD
R,
Phi
lipp
ines
, &
Vie
t N
am (
2009
); I
ndon
esia
and
Mal
aysi
a (2
007)
So
urce
: Ent
erpr
ise S
urve
ys (h
ttp:
//w
ww
.ent
erpr
isesu
rvey
s.or
g), T
he W
orld
Ban
k
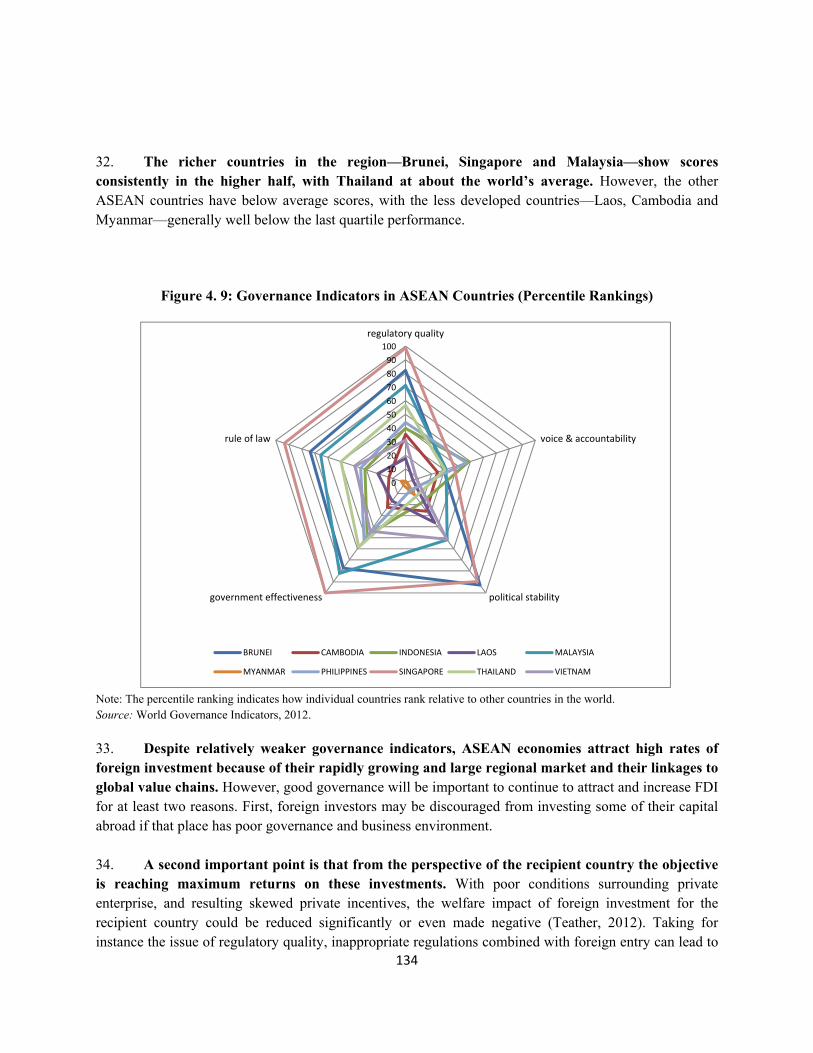
134
32. The richer countries in the region—Brunei, Singapore and Malaysia—show scores consistently in the higher half, with Thailand at about the world’s average. However, the other ASEAN countries have below average scores, with the less developed countries—Laos, Cambodia and Myanmar—generally well below the last quartile performance.
Figure 4. 9: Governance Indicators in ASEAN Countries (Percentile Rankings)
Note: The percentile ranking indicates how individual countries rank relative to other countries in the world. Source: World Governance Indicators, 2012.
33. Despite relatively weaker governance indicators, ASEAN economies attract high rates of foreign investment because of their rapidly growing and large regional market and their linkages to global value chains. However, good governance will be important to continue to attract and increase FDI for at least two reasons. First, foreign investors may be discouraged from investing some of their capital abroad if that place has poor governance and business environment. 34. A second important point is that from the perspective of the recipient country the objective is reaching maximum returns on these investments. With poor conditions surrounding private enterprise, and resulting skewed private incentives, the welfare impact of foreign investment for the recipient country could be reduced significantly or even made negative (Teather, 2012). Taking for instance the issue of regulatory quality, inappropriate regulations combined with foreign entry can lead to
0102030405060708090
100regulatory quality
voice & accountability
political stabilitygovernment effectiveness
rule of law
BRUNEI CAMBODIA INDONESIA LAOS MALAYSIA
MYANMAR PHILIPPINES SINGAPORE THAILAND VIETNAM
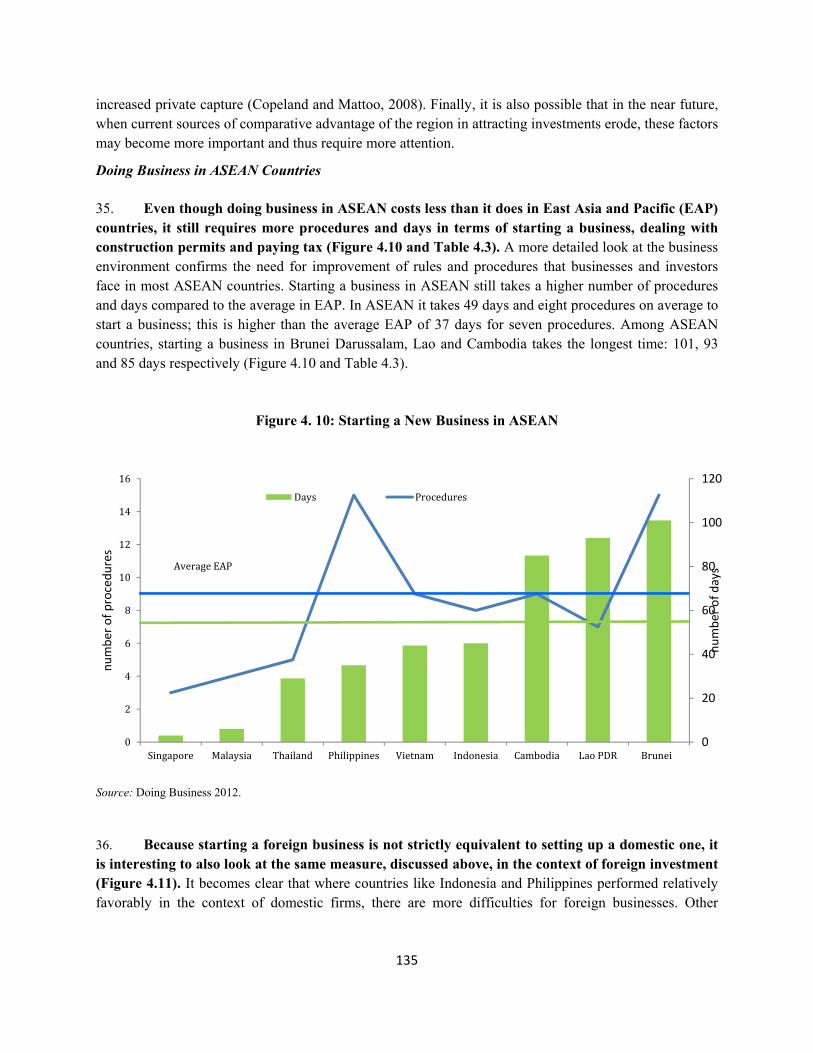
135
increased private capture (Copeland and Mattoo, 2008). Finally, it is also possible that in the near future, when current sources of comparative advantage of the region in attracting investments erode, these factors may become more important and thus require more attention.
Doing Business in ASEAN Countries
35. Even though doing business in ASEAN costs less than it does in East Asia and Pacific (EAP) countries, it still requires more procedures and days in terms of starting a business, dealing with construction permits and paying tax (Figure 4.10 and Table 4.3). A more detailed look at the business environment confirms the need for improvement of rules and procedures that businesses and investors face in most ASEAN countries. Starting a business in ASEAN still takes a higher number of procedures and days compared to the average in EAP. In ASEAN it takes 49 days and eight procedures on average to start a business; this is higher than the average EAP of 37 days for seven procedures. Among ASEAN countries, starting a business in Brunei Darussalam, Lao and Cambodia takes the longest time: 101, 93 and 85 days respectively (Figure 4.10 and Table 4.3).
Figure 4. 10: Starting a New Business in ASEAN
Source: Doing Business 2012.
36. Because starting a foreign business is not strictly equivalent to setting up a domestic one, it is interesting to also look at the same measure, discussed above, in the context of foreign investment (Figure 4.11). It becomes clear that where countries like Indonesia and Philippines performed relatively favorably in the context of domestic firms, there are more difficulties for foreign businesses. Other
0
20
40
60
80
100
120
02468
10121416
Singapore Malaysia Thailand Philippines Vietnam Indonesia Cambodia Lao PDR Bruneinu
mbe
r of d
ays
num
ber o
f pro
cedu
res
Days ProceduresAverage EAP
136
countries are more consistent in their performance (good or bad) as measured by Doing Business.56 Overall, this is a situation that is not unique to ASEAN, as EAP countries are not faring any better. A second point is the variance in terms of days it takes to start a foreign business among ASEAN countries is significantly higher than the variance for the number of procedures; this indicates that each additional administrative step has a compounding effect and lengthens the whole process. Finally, comparing the performance of most ASEAN countries with China, India and Korea shows that this latter countries perform better by this indicator.
Box 4. 2: Business Licensing Reforms in Singapore and Malaysia
Singapore Singapore has been the world’s top-ranked economy on the ease of Doing Business for the last five years running. Entrepreneurs starting a new business in Singapore enjoy an average of nominal or zero minimum capital, standardized forms, online registration, no court involvement, fixed registration fee, and simple or no publication requirements. It takes just three days to complete the necessary procedures with fees of about one percent of GNI per capita. Singapore has not only been the top-ranked of Doing Business, but also one of the top reformers to have conducted reforms in a short period.
Singapore started its business regulatory reform in 2003. Singapore’s Accounting and Corporate Regulatory Authority (ACRA) is the first stop to start a business for entrepreneurs. The organization embarked on Bizfile, an Internet-based online registration, filing, and information retrieval system. With Bizfile up and running, information is now updated within half an hour of a successful filing—down from 14-21 days before reform. The time to register a new business has fallen from 24 hours to 15 minutes, and the time to incorporate a company has fallen from five days to just 15 minutes. Likewise, costs are down too. Businesses will benefit through faster business licenses and lower registration fees. Singapore has also developed an online business startup system, enterpriseone.gov.sg, which is a comprehensive network for business startups. A positive aspect about the system is that it is not only an online application system, but also provides a range of services in business starting from business guidelines to comprehensive information on government assistance programs, regulations and e-services for businesses.
Malaysia The Malaysian government set up a regulatory reform committee, the Special Taskforce to Facilitate Business (Pemudah), in February 2007. Pemudah consists of highly respected members from the government and the private sector. This is a public private partnership that helped inform and monitor the implementation of the national business climate reform agenda. This task force reports directly to the Prime Minister. Every year, Pemudah has targets in improving business licensing. Many believe that Pemudah has played a significant role in improving Malaysia's ranking on ease of Doing Business, as its ranking improved from 23rd in 2010 to 18th in 2011. This was largely because there was significant improvement in the ‘starting a business’ ranking, from 111 to 50 over the same period (Doing Business, 2012). Malaysia has cut the number of procedures, length of time and costs of starting a business from 10 procedures, 37 days and 25 percent of income per capita in 2006, to four procedures, six days and 16 percent in 2011 respectively (Doing Business 2007-2012). Between 2007 and 2010, Pemudah initiated a series of improvements in business licensing. Some among them are:
• Time reduction for business registration. Companies Commission of Malaysia has actively engaged in reducing the time taken for approval of activities (for example, registering new business from three days
56 The number of days reported by Doing Business and Investing Across Borders cannot be directly measured against each other as they are differently measured.
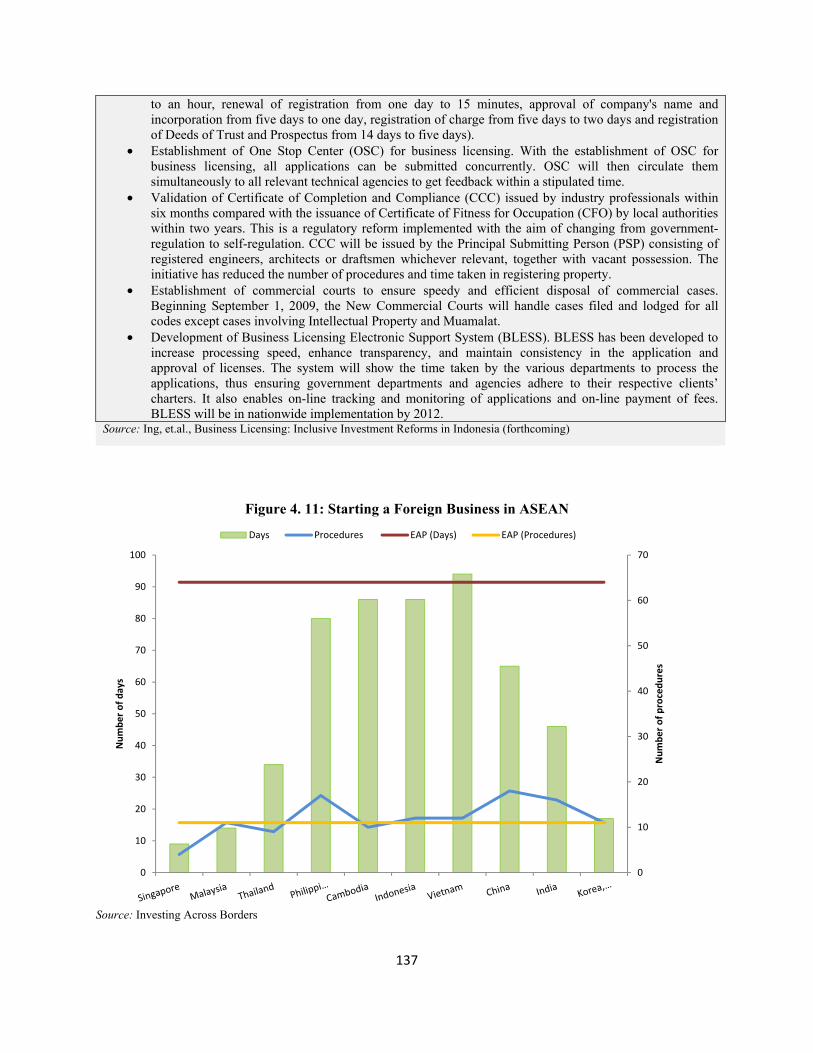
137
to an hour, renewal of registration from one day to 15 minutes, approval of company's name and incorporation from five days to one day, registration of charge from five days to two days and registration of Deeds of Trust and Prospectus from 14 days to five days).
• Establishment of One Stop Center (OSC) for business licensing. With the establishment of OSC for business licensing, all applications can be submitted concurrently. OSC will then circulate them simultaneously to all relevant technical agencies to get feedback within a stipulated time.
• Validation of Certificate of Completion and Compliance (CCC) issued by industry professionals within six months compared with the issuance of Certificate of Fitness for Occupation (CFO) by local authorities within two years. This is a regulatory reform implemented with the aim of changing from government-regulation to self-regulation. CCC will be issued by the Principal Submitting Person (PSP) consisting of registered engineers, architects or draftsmen whichever relevant, together with vacant possession. The initiative has reduced the number of procedures and time taken in registering property.
• Establishment of commercial courts to ensure speedy and efficient disposal of commercial cases. Beginning September 1, 2009, the New Commercial Courts will handle cases filed and lodged for all codes except cases involving Intellectual Property and Muamalat.
• Development of Business Licensing Electronic Support System (BLESS). BLESS has been developed to increase processing speed, enhance transparency, and maintain consistency in the application and approval of licenses. The system will show the time taken by the various departments to process the applications, thus ensuring government departments and agencies adhere to their respective clients’ charters. It also enables on-line tracking and monitoring of applications and on-line payment of fees. BLESS will be in nationwide implementation by 2012.
Source: Ing, et.al., Business Licensing: Inclusive Investment Reforms in Indonesia (forthcoming)
Figure 4. 11: Starting a Foreign Business in ASEAN
Source: Investing Across Borders
0
10
20
30
40
50
60
70
0
10
20
30
40
50
60
70
80
90
100
Num
ber o
f pro
cedu
res
Num
ber o
f day
s
Days Procedures EAP (Days) EAP (Procedures)
138
37. In terms of other components of ease of Doing Business, ASEAN has performed slightly better in enforcing contracts compared to the average East Asia and Pacific (EAP) country (Table 4.4). Enforcing a contract requires 37 procedures in 461 days and costs about 46 percent of total claims in ASEAN. Meanwhile, on average, dealing with construction permits and paying tax requires more procedures and days in ASEAN compared to the EAP region. It requires 19 procedures and 201 days in dealing with construction permits and 30 procedures and 279 days in paying tax in ASEAN; it requires 17 procedures and 159 days in dealing with construction permits and 25 procedures and 215 days in paying tax in EAP.
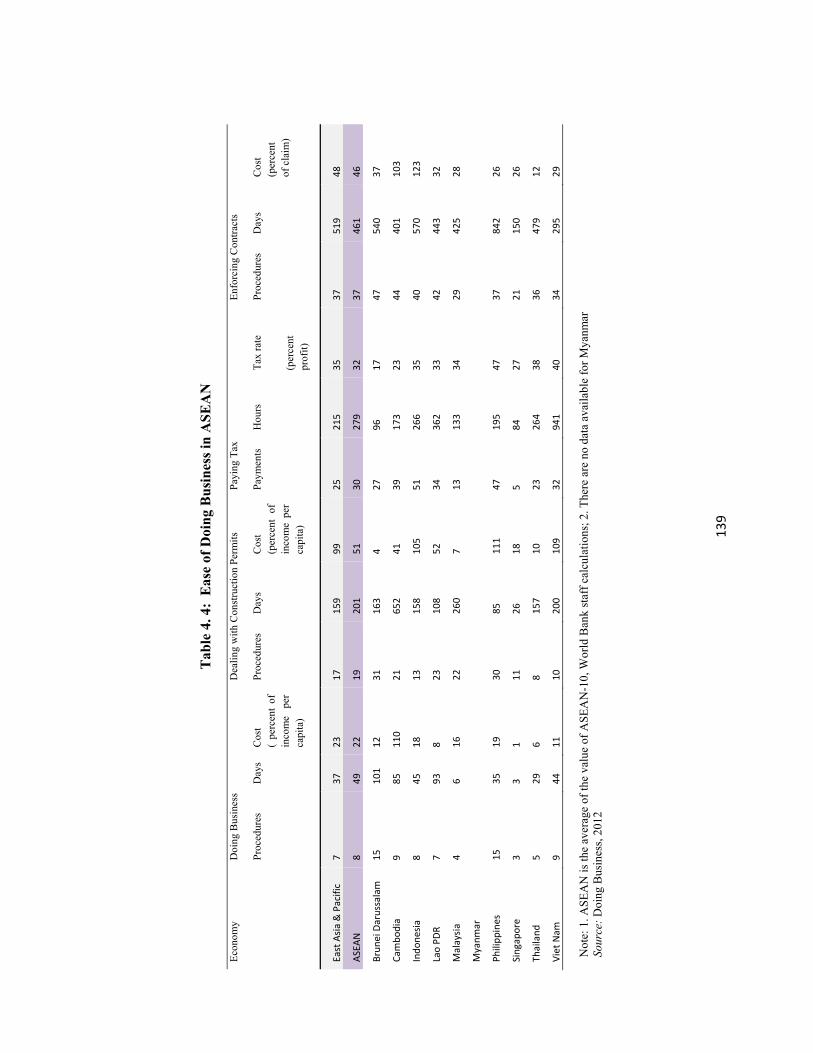
139
Tab
le 4
. 4:
Eas
e of
Doi
ng
Bu
sin
ess
in A
SE
AN
Eco
nom
y
Doi
ng B
usin
ess
D
eali
ng w
ith
Con
stru
ctio
n P
erm
its
P
ayin
g T
ax
Enf
orci
ng C
ontr
acts
Pro
cedu
res
D
ays
Cos
t (
perc
ent
of
inco
me
per
capi
ta)
Pro
cedu
res
D
ays
Cos
t (p
erce
nt
of
inco
me
per
capi
ta)
Pay
men
ts
Hou
rs
Tax
rat
e
(per
cent
pr
ofit
)
Pro
cedu
res
Day
s C
ost
(per
cent
of
cla
im)
East
Asia
& P
acifi
c 7
37
23
17
159
99
25
215
35
37
519
48
ASEA
N
8 49
22
19
20
1 51
30
27
9 32
37
46
1 46
Brun
ei D
arus
sala
m
15
101
12
31
163
4 27
96
17
47
54
0 37
Cam
bodi
a 9
85
110
21
652
41
39
173
23
44
401
103
Indo
nesia
8
45
18
13
158
105
51
266
35
40
570
123
Lao
PDR
7 93
8
23
108
52
34
362
33
42
443
32
Mal
aysia
4
6 16
22
26
0 7
13
133
34
29
425
28
Mya
nmar
Phili
ppin
es
15
35
19
30
85
111
47
195
47
37
842
26
Sing
apor
e 3
3 1
11
26
18
5 84
27
21
15
0 26
Thai
land
5
29
6 8
157
10
23
264
38
36
479
12
Viet
Nam
9
44
11
10
200
109
32
941
40
34
295
29
Not
e: 1
. ASE
AN
is th
e av
erag
e of
the
valu
e of
ASE
AN
-10,
Wor
ld B
ank
staf
f ca
lcul
atio
ns; 2
. The
re a
re n
o da
ta a
vail
able
for
Mya
nmar
So
urce
: D
oing
Bus
ines
s, 2
012
140
The Role of Labor Costs for Vertical Investments
38. ASEAN’s relatively lower labor costs and the region’s integration with the world economy make ASEAN an attractive destination for FDI. The most important FDI flows to ASEAN are linked with ‘vertical’-type FDIs, which are investments that are made to outsource whole or part of a production to a lower-cost country. Vertical FDIs are different in nature and motivation from ‘horizontal’ FDIs, which are made with market access in mind and the consumers of the destination country; vertical FDIs are motivated by access to cheap and competitive production and export conditions. 39. For vertical-type FDIs, labor costs are an important motive. Evidence from average wages in ASEAN countries collated by ILO suggest that ASEAN is at an advantage there and that the relative position of ASEAN countries has improved or at least maintained in recent years compared to large neighbors and potential competitors such as China (manufactured goods) and India (services). The ILO survey includes data for only five of the eight lower income countries of the region (Figure 4.6).57 40. From 2006-2009, China’s wages (in current dollars), in particular, rose by over 50 percent. Indonesian wages seem to have slightly declined, and wages in the Philippines and Viet Nam increased slightly (Figure 4.12). This likely explains some of the attractiveness of ASEAN for FDIs58 and corroborates an increase in the flow of investment to wage-competitive countries like Viet Nam.59 At the same time, labor productivity in the region has been keeping pace with that of neighboring China (Figure 4.13). 41. This attractiveness of the region for vertical-type investment is confirmed by looking at the good performance of ASEAN in terms of logistics performance. On average, ASEAN is a strong performer in logistics and trade facilitation, and this has consistently been the case since the first Logistics Performance Index (LPI) survey in 2007 (see Box 2.4 in Chapter 2). A steady pattern of improvement is evident from 2007 to 2012. In all three LPI surveys, ASEAN’s average score is much higher than the average for any developing region and the upper-middle income group average for the world. This result is striking given the range of per capita incomes in ASEAN (see Chapter 2 for a full discussion).
57 Singapore and Brunei are high wages countries. 58 For instance, Oclaro (United States) announced in March 2012 that it would relocate its production and testing businesses from Shenzhen, China to Malaysia within the next three years. (Source: UNCTAD, 2012). 59 Source: ERIA Mid Term Review executive summary. It also mentions ‘recent reports’ that Viet Nam, Indonesia, Thailand and the Philippines would benefit from relocation of FDI away from China.
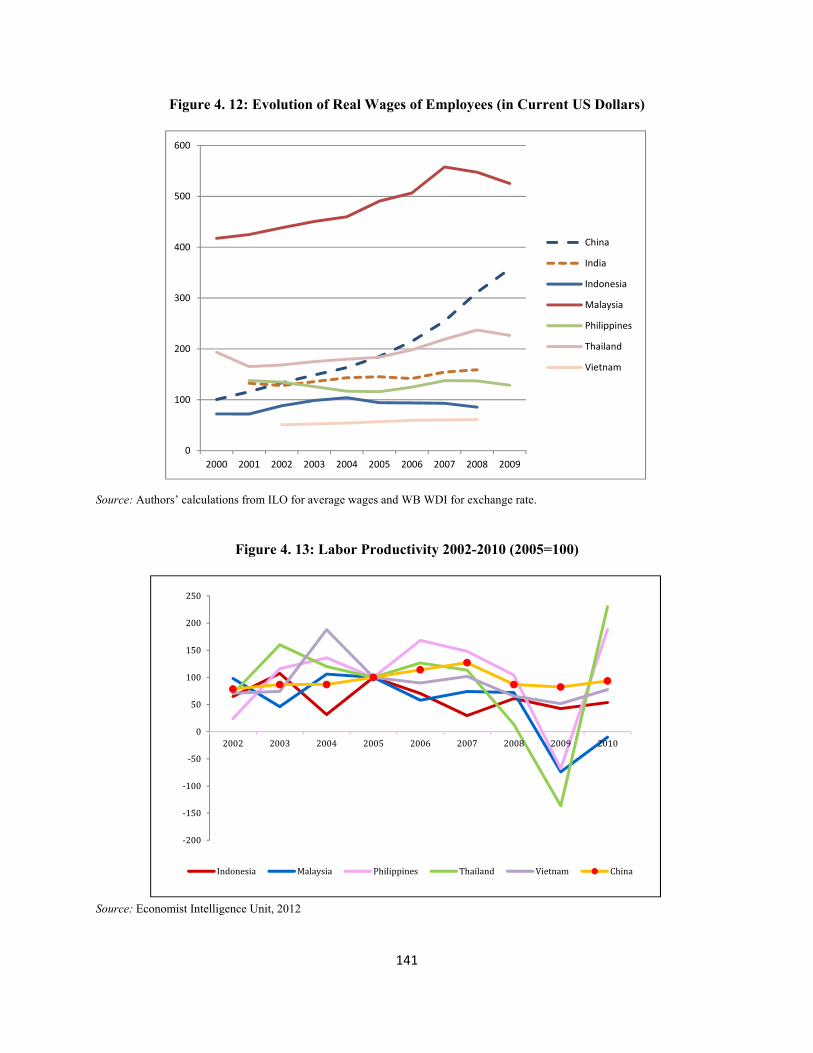
141
Figure 4. 12: Evolution of Real Wages of Employees (in Current US Dollars)
Source: Authors’ calculations from ILO for average wages and WB WDI for exchange rate.
Figure 4. 13: Labor Productivity 2002-2010 (2005=100)
Source: Economist Intelligence Unit, 2012
0
100
200
300
400
500
600
2000 2001 2002 2003 2004 2005 2006 2007 2008 2009
China
India
Indonesia
Malaysia
Philippines
Thailand
Vietnam
-200-150-100
-500
50100150200250
2002 2003 2004 2005 2006 2007 2008 2009 2010
Indonesia Malaysia Philippines Thailand Vietnam China
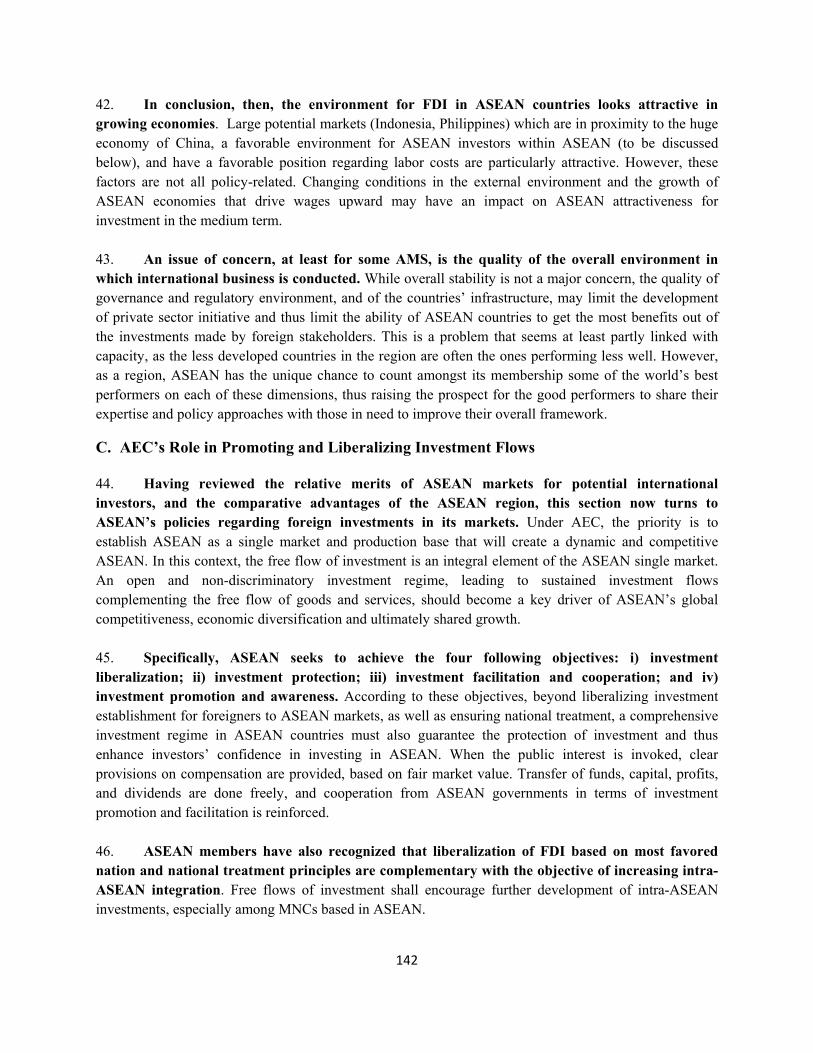
142
42. In conclusion, then, the environment for FDI in ASEAN countries looks attractive in growing economies. Large potential markets (Indonesia, Philippines) which are in proximity to the huge economy of China, a favorable environment for ASEAN investors within ASEAN (to be discussed below), and have a favorable position regarding labor costs are particularly attractive. However, these factors are not all policy-related. Changing conditions in the external environment and the growth of ASEAN economies that drive wages upward may have an impact on ASEAN attractiveness for investment in the medium term. 43. An issue of concern, at least for some AMS, is the quality of the overall environment in which international business is conducted. While overall stability is not a major concern, the quality of governance and regulatory environment, and of the countries’ infrastructure, may limit the development of private sector initiative and thus limit the ability of ASEAN countries to get the most benefits out of the investments made by foreign stakeholders. This is a problem that seems at least partly linked with capacity, as the less developed countries in the region are often the ones performing less well. However, as a region, ASEAN has the unique chance to count amongst its membership some of the world’s best performers on each of these dimensions, thus raising the prospect for the good performers to share their expertise and policy approaches with those in need to improve their overall framework.
C. AEC’s Role in Promoting and Liberalizing Investment Flows
44. Having reviewed the relative merits of ASEAN markets for potential international investors, and the comparative advantages of the ASEAN region, this section now turns to ASEAN’s policies regarding foreign investments in its markets. Under AEC, the priority is to establish ASEAN as a single market and production base that will create a dynamic and competitive ASEAN. In this context, the free flow of investment is an integral element of the ASEAN single market. An open and non-discriminatory investment regime, leading to sustained investment flows complementing the free flow of goods and services, should become a key driver of ASEAN’s global competitiveness, economic diversification and ultimately shared growth. 45. Specifically, ASEAN seeks to achieve the four following objectives: i) investment liberalization; ii) investment protection; iii) investment facilitation and cooperation; and iv) investment promotion and awareness. According to these objectives, beyond liberalizing investment establishment for foreigners to ASEAN markets, as well as ensuring national treatment, a comprehensive investment regime in ASEAN countries must also guarantee the protection of investment and thus enhance investors’ confidence in investing in ASEAN. When the public interest is invoked, clear provisions on compensation are provided, based on fair market value. Transfer of funds, capital, profits, and dividends are done freely, and cooperation from ASEAN governments in terms of investment promotion and facilitation is reinforced.
46. ASEAN members have also recognized that liberalization of FDI based on most favored nation and national treatment principles are complementary with the objective of increasing intra-ASEAN integration. Free flows of investment shall encourage further development of intra-ASEAN investments, especially among MNCs based in ASEAN.
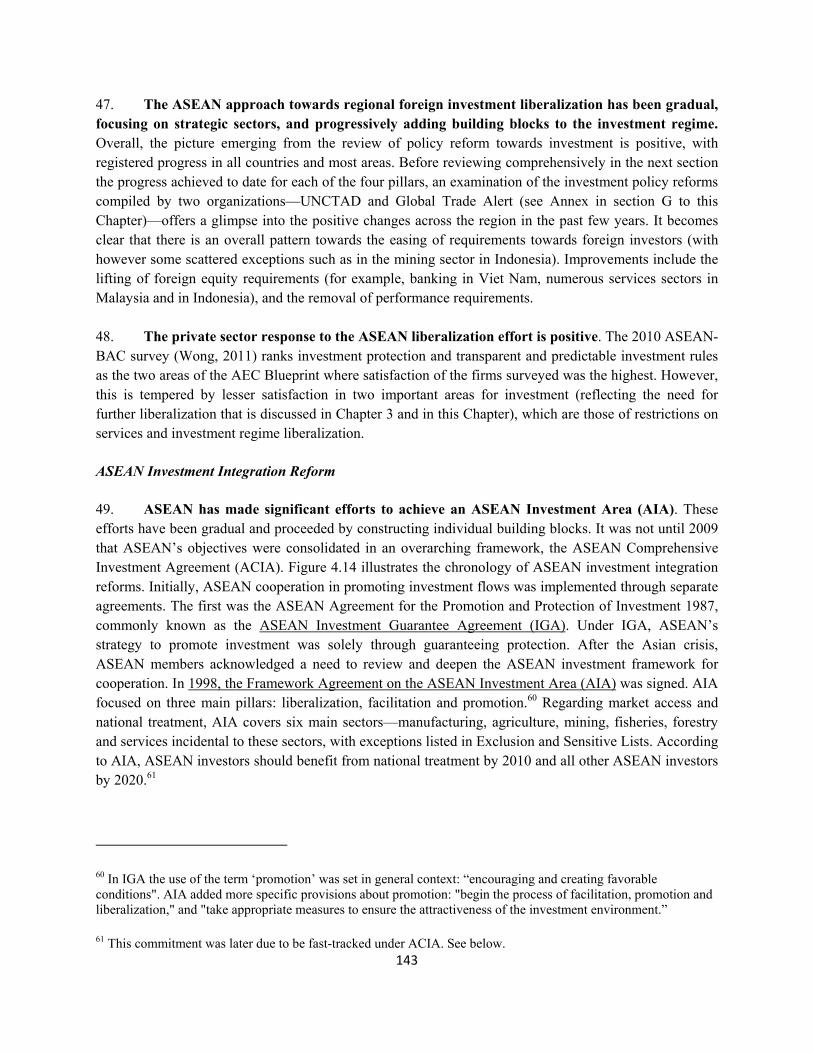
143
47. The ASEAN approach towards regional foreign investment liberalization has been gradual, focusing on strategic sectors, and progressively adding building blocks to the investment regime. Overall, the picture emerging from the review of policy reform towards investment is positive, with registered progress in all countries and most areas. Before reviewing comprehensively in the next section the progress achieved to date for each of the four pillars, an examination of the investment policy reforms compiled by two organizations—UNCTAD and Global Trade Alert (see Annex in section G to this Chapter)—offers a glimpse into the positive changes across the region in the past few years. It becomes clear that there is an overall pattern towards the easing of requirements towards foreign investors (with however some scattered exceptions such as in the mining sector in Indonesia). Improvements include the lifting of foreign equity requirements (for example, banking in Viet Nam, numerous services sectors in Malaysia and in Indonesia), and the removal of performance requirements.
48. The private sector response to the ASEAN liberalization effort is positive. The 2010 ASEAN-BAC survey (Wong, 2011) ranks investment protection and transparent and predictable investment rules as the two areas of the AEC Blueprint where satisfaction of the firms surveyed was the highest. However, this is tempered by lesser satisfaction in two important areas for investment (reflecting the need for further liberalization that is discussed in Chapter 3 and in this Chapter), which are those of restrictions on services and investment regime liberalization.
ASEAN Investment Integration Reform
49. ASEAN has made significant efforts to achieve an ASEAN Investment Area (AIA). These efforts have been gradual and proceeded by constructing individual building blocks. It was not until 2009 that ASEAN’s objectives were consolidated in an overarching framework, the ASEAN Comprehensive Investment Agreement (ACIA). Figure 4.14 illustrates the chronology of ASEAN investment integration reforms. Initially, ASEAN cooperation in promoting investment flows was implemented through separate agreements. The first was the ASEAN Agreement for the Promotion and Protection of Investment 1987, commonly known as the ASEAN Investment Guarantee Agreement (IGA). Under IGA, ASEAN’s strategy to promote investment was solely through guaranteeing protection. After the Asian crisis, ASEAN members acknowledged a need to review and deepen the ASEAN investment framework for cooperation. In 1998, the Framework Agreement on the ASEAN Investment Area (AIA) was signed. AIA focused on three main pillars: liberalization, facilitation and promotion.60 Regarding market access and national treatment, AIA covers six main sectors—manufacturing, agriculture, mining, fisheries, forestry and services incidental to these sectors, with exceptions listed in Exclusion and Sensitive Lists. According to AIA, ASEAN investors should benefit from national treatment by 2010 and all other ASEAN investors by 2020.61
60 In IGA the use of the term ‘promotion’ was set in general context: “encouraging and creating favorable conditions". AIA added more specific provisions about promotion: "begin the process of facilitation, promotion and liberalization," and "take appropriate measures to ensure the attractiveness of the investment environment.”
61 This commitment was later due to be fast-tracked under ACIA. See below.
144
Figure 4. 14: From IGA to ACIA
50. In 2007, the 39th ASEAN Economic Ministers Meeting agreed to review the AIA Agreement and the ASEAN IGA, with the aim of consolidating these two agreements. In February 2009, the ASEAN Comprehensive Investment Agreement (ACIA) was signed. Fundamentally, ACIA is a comprehensive agreement covering liberalization, protection, facilitation, and promotion. 51. ACIA entered into force on March 29, 2012. Upon ACIA’s entry into force, the ASEAN IGA and AIA Agreements were terminated. A three-year transition period applies to investors who wish to keep existing investments (that is, all direct investment) within the ambit of the IGA and AIA Agreements.
52. ACIA, while being similar in structure to AIA, covering the same four pillars—liberalization, protection, facilitation, and promotion—and the same six sectors, is actually more comprehensive than AIA and IGA put together. ACIA has both incorporated new provisions and made improvements to existing provisions in AIA and IGA, including acceleration of ASEAN investment integration.
53. ACIA is developed as a comprehensive investment agreement that provides a single framework for relevant investment provisions such as liberalization and protection. ACIA is also conceived to provide clear and transparent procedures and definitions that are in line with international investment agreements (for example, US Model Investment Text, NAFTAS, OECD Guidelines for Multinational Enterprises, UNCTAD’s assessment on international investment agreement).
54. Among the notable improvements provided by ACIA, over IGA, are several liberalization provisions. First, the agreement brings forward the objective to achieve an ASEAN open investment regime to all investors to 2015, instead of 2020 as previously under AIA. Second, ASEAN and foreign investors now enjoy the same benefits at the same time (AIA offered a 2020 timeline for foreign investors). Third, the coverage of the agreement is extended to include portfolio investment, which in doing so follows the practice of numerous bilateral investment treaties of strong proponents of comprehensive investment agreements such as the one modeled on the US NAFTA. Fourth, the agreement includes new articles on the prohibition of performance requirements under Trade-Related Investment Measures as defined by the WTO (Article 7),62 and nationality requirements in the
62 Article 7 of ACIA mentions that the provisions of the Agreement on Trade-Related Investment Measures in Annex 1A to the WTO Agreement (TRIMs) which are not specifically mentioned in or modified by this Agreement, shall apply, mutatis mutandis, to this Agreement.
Investment GuaranteeIGA 1987
National Treatment by 2020AIA1998
Comprehensive integration by 2015ACIA 2009

145
appointment of managers (Article 8). Finally, ACIA provides detailed procedures on dispute settlement, including on consultation among the member states (Article 43). 55. In an important step forward, ACIA has changed the liberalization scheduling approach, moving to a single negative list regime. Exceptions to liberalization are listed in a single negative list replacing the prior lists: the Tentative Exclusion List (TEL) and Sensitive List (SL) under AIA. The ACIA consolidated Reservation List consists essentially of the remaining exceptions in TEL and SL, plus additional amendments and inclusions. The Reservation List for each country is intended to note only those sectors that are not subject to future elimination or improvement (that is, permanent exclusions) and those whose reservations are to be improved63 or eliminated over time (that is, temporary exclusions). As of February 2010, ASEAN members had put forward a total of about 130 business sectors for inclusion in the Reservation List (Pratruangkrai, 2010). However, the Reservation List has not been finalized and is subject to further liberalization.
D. Policies towards FDI: Market Access and Equal Treatment of Foreign Investment
56. Restrictions on foreign investments can occur prior to or after the establishment phase. The protection of investment in the post establishment phase is generally more widely accepted and subject to better rules such as bilateral investment treaties (Golub, 2009). The history of investment agreements in ASEAN confirms this since protection of investment under IGA was the first element of investment integration. 57. Guaranteeing market access to trade and investment from partner countries has recently become a central part of regional integration efforts (Miroudot, 2011). Restrictions on foreign entry can take various forms (Golub, 2009). The most common are limitations to foreign ownership, specifying a maximum level of equity that can be owned by foreigners. Limitation on ownership can also target some asset classes, such as land. Another form of limitation is the use of screening conditions such as economics needs tests or various notification requirements. Finally, restrictions on operations or performance requirements can also be applied, such as specifying the use of local inputs or the employment of nationals. All these restrictions are present to some extent in ASEAN countries.
58. The main World Bank database on investment access regulations (Investment Across Borders—IAB, 2010) suggests a mixed picture in ASEAN countries. While ASEAN has relatively high openness to foreign equity compared to other developing regions it is on average, according to IAB, more restrictive than other EAP countries. Countries that are the most restrictive include Thailand, Philippines and Viet Nam (Table 4.5).64 This is not however the case for all ASEAN countries: Cambodia and Singapore show fewer restrictions.
63 The possibility to improve on commitments is an innovation of ACIA since AIA considered only the option of elimination. This may be interpreted as a softening of the liberalization requirements (ERIA, 2011; ERIA, 2012), but possibly also, in the context of some limitations, the recognition of the regulatory necessity to maintain some government oversight. 64 The foreign equity caps measured for the industries listed in the IAB database represent an average of foreign equity caps of subsectors in this industry. As there is a relatively limited number of subsectors, these averages represent an approximation of the degree of liberalization. Another method used is that of Intal and Panggabean (2012, as quoted in Chapter VIII of ERIA (2012)), who look at restrictions for all ISIC-3 subsectors and assess
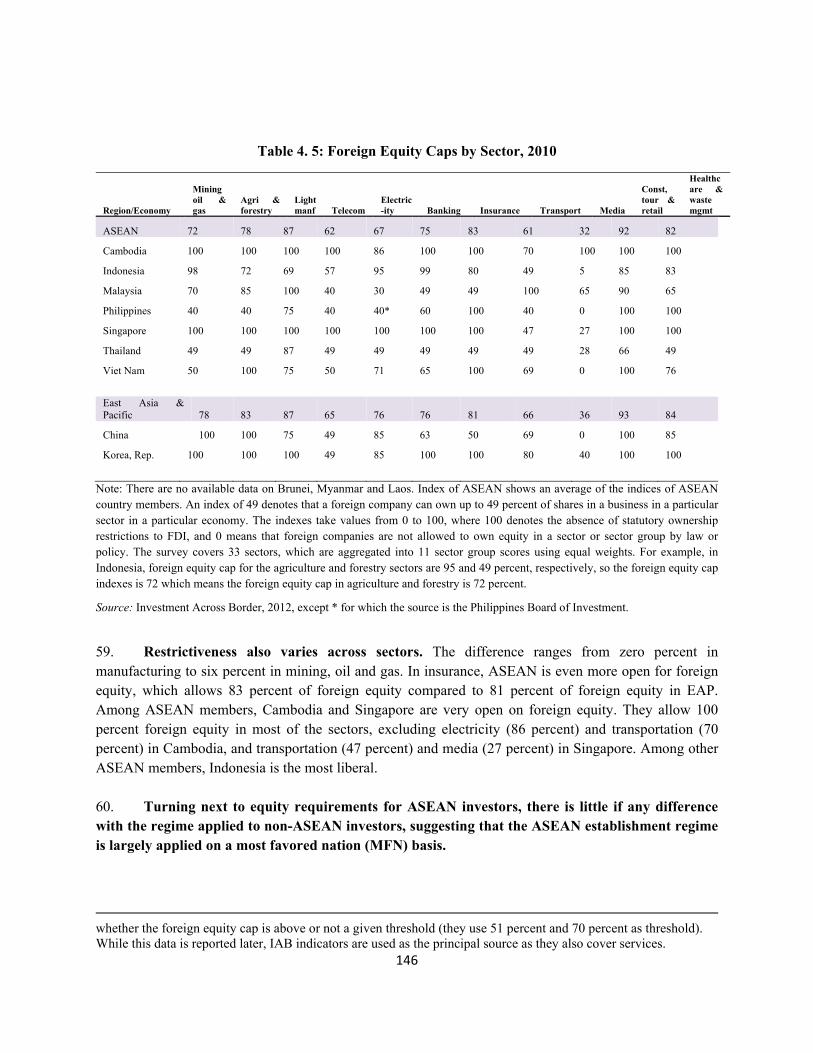
146
Table 4. 5: Foreign Equity Caps by Sector, 2010
Region/Economy
Miningoil & gas
Agri & forestry
Light manf Telecom
Electric-ity Banking Insurance Transport Media
Const, tour & retail
Healthcare & waste mgmt
ASEAN 72 78 87 62 67 75 83 61 32 92 82
Cambodia 100 100 100 100 86 100 100 70 100 100 100
Indonesia 98 72 69 57 95 99 80 49 5 85 83
Malaysia 70 85 100 40 30 49 49 100 65 90 65
Philippines 40 40 75 40 40* 60 100 40 0 100 100
Singapore 100 100 100 100 100 100 100 47 27 100 100
Thailand 49 49 87 49 49 49 49 49 28 66 49
Viet Nam 50 100 75 50 71 65 100 69 0 100 76
East Asia & Pacific 78 83 87 65 76 76 81 66 36 93 84
China 100 100 75 49 85 63 50 69 0 100 85
Korea, Rep. 100 100 100 49 85 100 100 80 40 100 100
Note: There are no available data on Brunei, Myanmar and Laos. Index of ASEAN shows an average of the indices of ASEAN country members. An index of 49 denotes that a foreign company can own up to 49 percent of shares in a business in a particular sector in a particular economy. The indexes take values from 0 to 100, where 100 denotes the absence of statutory ownership restrictions to FDI, and 0 means that foreign companies are not allowed to own equity in a sector or sector group by law or policy. The survey covers 33 sectors, which are aggregated into 11 sector group scores using equal weights. For example, in Indonesia, foreign equity cap for the agriculture and forestry sectors are 95 and 49 percent, respectively, so the foreign equity cap indexes is 72 which means the foreign equity cap in agriculture and forestry is 72 percent.
Source: Investment Across Border, 2012, except * for which the source is the Philippines Board of Investment.
59. Restrictiveness also varies across sectors. The difference ranges from zero percent in manufacturing to six percent in mining, oil and gas. In insurance, ASEAN is even more open for foreign equity, which allows 83 percent of foreign equity compared to 81 percent of foreign equity in EAP. Among ASEAN members, Cambodia and Singapore are very open on foreign equity. They allow 100 percent foreign equity in most of the sectors, excluding electricity (86 percent) and transportation (70 percent) in Cambodia, and transportation (47 percent) and media (27 percent) in Singapore. Among other ASEAN members, Indonesia is the most liberal. 60. Turning next to equity requirements for ASEAN investors, there is little if any difference with the regime applied to non-ASEAN investors, suggesting that the ASEAN establishment regime is largely applied on a most favored nation (MFN) basis.
whether the foreign equity cap is above or not a given threshold (they use 51 percent and 70 percent as threshold). While this data is reported later, IAB indicators are used as the principal source as they also cover services.
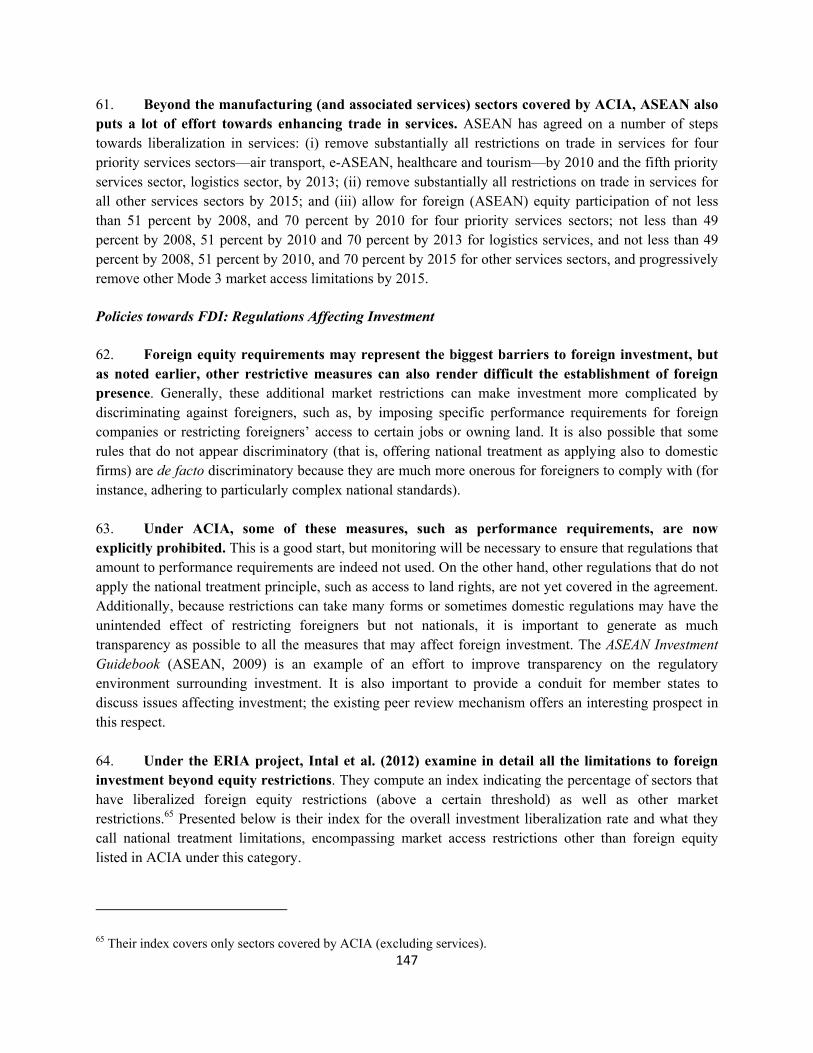
147
61. Beyond the manufacturing (and associated services) sectors covered by ACIA, ASEAN also puts a lot of effort towards enhancing trade in services. ASEAN has agreed on a number of steps towards liberalization in services: (i) remove substantially all restrictions on trade in services for four priority services sectors—air transport, e-ASEAN, healthcare and tourism—by 2010 and the fifth priority services sector, logistics sector, by 2013; (ii) remove substantially all restrictions on trade in services for all other services sectors by 2015; and (iii) allow for foreign (ASEAN) equity participation of not less than 51 percent by 2008, and 70 percent by 2010 for four priority services sectors; not less than 49 percent by 2008, 51 percent by 2010 and 70 percent by 2013 for logistics services, and not less than 49 percent by 2008, 51 percent by 2010, and 70 percent by 2015 for other services sectors, and progressively remove other Mode 3 market access limitations by 2015.
Policies towards FDI: Regulations Affecting Investment
62. Foreign equity requirements may represent the biggest barriers to foreign investment, but as noted earlier, other restrictive measures can also render difficult the establishment of foreign presence. Generally, these additional market restrictions can make investment more complicated by discriminating against foreigners, such as, by imposing specific performance requirements for foreign companies or restricting foreigners’ access to certain jobs or owning land. It is also possible that some rules that do not appear discriminatory (that is, offering national treatment as applying also to domestic firms) are de facto discriminatory because they are much more onerous for foreigners to comply with (for instance, adhering to particularly complex national standards). 63. Under ACIA, some of these measures, such as performance requirements, are now explicitly prohibited. This is a good start, but monitoring will be necessary to ensure that regulations that amount to performance requirements are indeed not used. On the other hand, other regulations that do not apply the national treatment principle, such as access to land rights, are not yet covered in the agreement. Additionally, because restrictions can take many forms or sometimes domestic regulations may have the unintended effect of restricting foreigners but not nationals, it is important to generate as much transparency as possible to all the measures that may affect foreign investment. The ASEAN Investment Guidebook (ASEAN, 2009) is an example of an effort to improve transparency on the regulatory environment surrounding investment. It is also important to provide a conduit for member states to discuss issues affecting investment; the existing peer review mechanism offers an interesting prospect in this respect.
64. Under the ERIA project, Intal et al. (2012) examine in detail all the limitations to foreign investment beyond equity restrictions. They compute an index indicating the percentage of sectors that have liberalized foreign equity restrictions (above a certain threshold) as well as other market restrictions.65 Presented below is their index for the overall investment liberalization rate and what they call national treatment limitations, encompassing market access restrictions other than foreign equity listed in ACIA under this category.
65 Their index covers only sectors covered by ACIA (excluding services).
148
Table 4.6: Investment Liberalization Rates in ASEAN
Overall liberalization Score NT Score
Country Agriculture Mining Manufacture Goods Brunei 87.3 79.1 84.3 36.9 Cambodia 76.5 95.8 93.2 83.3 Indonesia 69.1 95.3 84.8 88.7 Lao PDR 68.5 87.7 80.1 50.0 Malaysia 57.2 70.7 83.2 78.7 Myanmar 83.3 82.7 86.5 61.0 Philippines 66.5 68.8 97.5 98.2 Singapore 88.0 86.5 89.0 66.0 Thailand 72.4 79.7 93.3 98.6 Viet Nam 76.2 85.9 76.8 57.1 Note: The overall liberalization score is calculated as a weighted average of 3 scores: foreign equity liberalization (0.6), national treatment (0.24), and other market access restrictions (0.16). The foreign equity threshold used is 51 percent; the restriction levels represent commitments under ACIA.
Source: Intal and Panggabean (2012) as quoted in ERIA (2012)
65. The inclusion of restrictions other than foreign equity introduces some interesting nuances. Brunei and Myanmar are among the most liberal members in terms of absence of restrictions to foreign equity, ranking above Singapore. However, these two countries (Brunei in particular) exhibit important restrictions beyond foreign equity, meaning derogations to national treatment that create preferential treatment for national investors. On the other hand, Cambodia has a liberal regime beyond the absence of foreign equity requirements and is thus overall the most liberal country in the region for foreign investment according to Intal et al. (2012) calculations. It is evident that countries like Thailand and the Philippines, which still restrict some access to FDI, use mostly foreign equity limits, whereas Viet Nam uses a variety of discriminatory restrictions other than foreign equity caps. 66. Finally, research suggests that the signing of ACIA translates into significant liberalization in three countries: the Philippines, Thailand and Viet Nam (Intal et al. (2012))66. While for the Philippines (manufacturing) and Thailand (agriculture and manufacturing), the liberalization will be the result of relaxation of foreign equity requirement and various access restrictions, for Viet Nam the prohibition of performance requirements should add an important liberalization effect.
66 As quoted in ERIA (2012).
149
67. ERIA (2012) also reports significant improvements in CLMV and Malaysia in the facilitation of investment according to a survey of the private sector, with more transparent and consistent rules in the two years preceding their survey (which took place in 2011). The survey, however, shows that much progress is needed, as respondents perceive the process of setting up a local presence in several ASEAN countries to be ‘slow’ or ‘very slow,’ in particular in Indonesia, Cambodia and Myanmar. Singapore, Malaysia, and to a lesser extent Lao PDR, offer better services on the whole.
68. Turning now to the issue of land rights, the IAB database provides several indicators of ease of access to land for foreign investors. The “strength of leasing right” index measures the security of legal rights to investors: for ASEAN this index (82.4 out of 100)67 is relatively high, in par with the same number for EAP countries on average, and not significantly below that of OECD countries (92.2). Of the seven ASEAN countries covered in IAB, the Philippines exhibits the lowest index (below 70), followed by Malaysia, Indonesia and Viet Nam with indexes around 78. The access to land rights may both convey de jure legal discrimination against foreigners, as well as de facto differential treatment when they go to courts.
69. Measuring the length of time taken to lease public land gives an insight on whether administrative procedures are onerous or not, and on that count the performance of ASEAN countries is much worse (152 days), though comparable to that of the East Asia and Pacific region, but much above high income countries (88 days). This average is the result of the particularly bad performance of Malaysia (355 days). Viet Nam, Thailand and Cambodia take between 133 and 119 days. When one compares this with the time it takes to lease private land—only 56 days (which is only six days more than high income countries and 10 days less than EAP on average)—this seems to confirm that bureaucracy or capacity constraints are indeed adding costs.
Policies towards FDI: Investment Promotion and Protection
70. This section investigates policies that take place before market access (investment promotion) and after market access (investment protection). Starting with protection of investments, ASEAN performs very well, very close to OECD levels and better than the average for EAP countries (Figure 4.15). Given the importance of FDI for the economies of ASEAN countries, and also given past evidence of steady inflows of FDI, one could indeed expect that ASEAN countries offer strong guarantees to investors. 71. However, improvements could be made when one considers facilitating procedures, echoing again the burdensome processes of administrative procedures and the lack of capacity witnessed in other areas. Measuring by the ease of the arbitrating process, ASEAN countries perform relatively well on average and better than the average EAP country, but significantly lower than OECD countries. The reason is the poor performance of Cambodia and Viet Nam, the two CLMV countries for which data is available. This could confirm that the issue is perhaps one of capacity. The extent of judicial assistance in ASEAN countries is also low, highlighting here not only a capacity issue but perhaps also the need for 67 The strength of leasing index compares economies on the security of legal rights they offer to investors interested in leasing industrial land—whether or not foreign and domestic companies are treated differently and whether the land can be subleased, subdivided, mortgaged, or used as collateral.
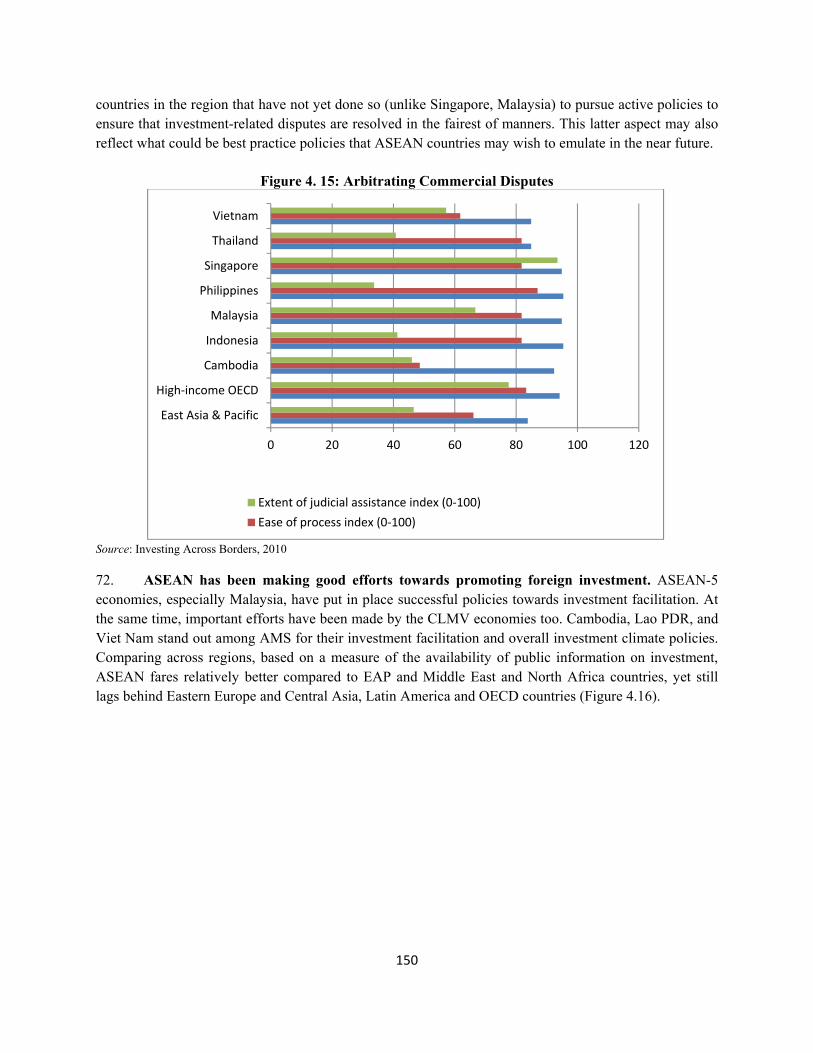
150
countries in the region that have not yet done so (unlike Singapore, Malaysia) to pursue active policies to ensure that investment-related disputes are resolved in the fairest of manners. This latter aspect may also reflect what could be best practice policies that ASEAN countries may wish to emulate in the near future.
Figure 4. 15: Arbitrating Commercial Disputes
Source: Investing Across Borders, 2010 72. ASEAN has been making good efforts towards promoting foreign investment. ASEAN-5 economies, especially Malaysia, have put in place successful policies towards investment facilitation. At the same time, important efforts have been made by the CLMV economies too. Cambodia, Lao PDR, and Viet Nam stand out among AMS for their investment facilitation and overall investment climate policies. Comparing across regions, based on a measure of the availability of public information on investment, ASEAN fares relatively better compared to EAP and Middle East and North Africa countries, yet still lags behind Eastern Europe and Central Asia, Latin America and OECD countries (Figure 4.16).
0 20 40 60 80 100 120
East Asia & Pacific
High-income OECD
Cambodia
Indonesia
Malaysia
Philippines
Singapore
Thailand
Vietnam
Extent of judicial assistance index (0-100)Ease of process index (0-100)
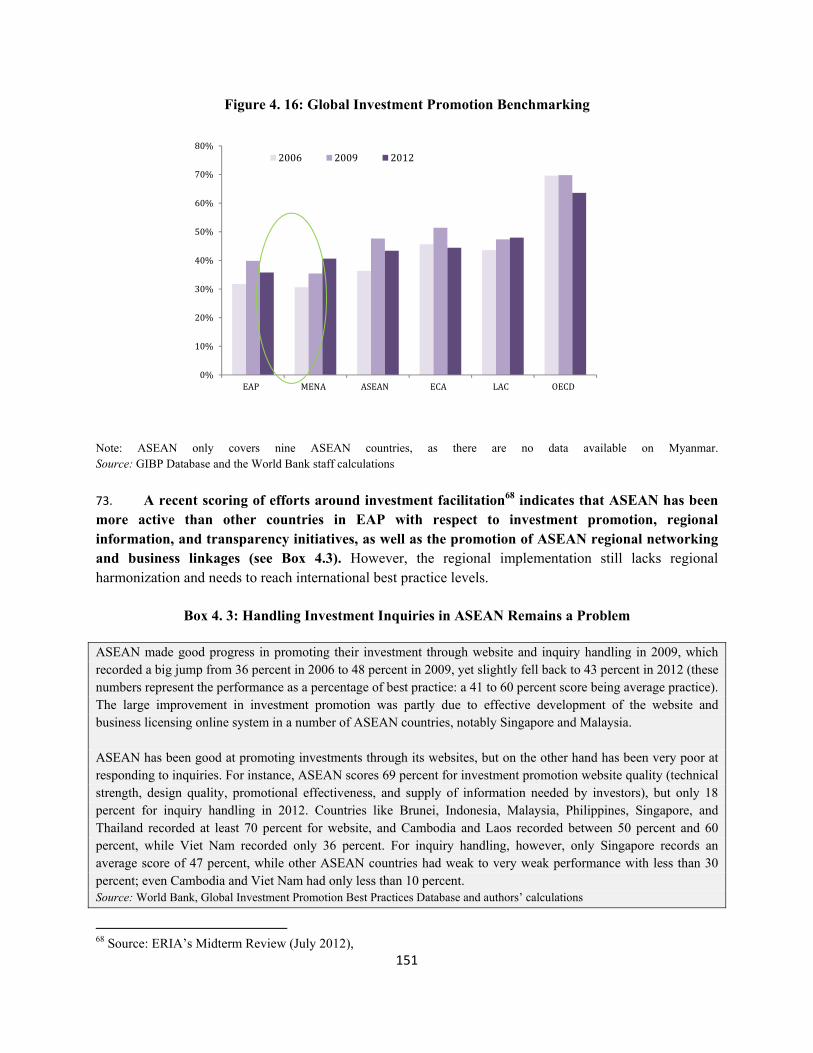
151
Figure 4. 16: Global Investment Promotion Benchmarking
Note: ASEAN only covers nine ASEAN countries, as there are no data available on Myanmar. Source: GIBP Database and the World Bank staff calculations
73. A recent scoring of efforts around investment facilitation68 indicates that ASEAN has been more active than other countries in EAP with respect to investment promotion, regional information, and transparency initiatives, as well as the promotion of ASEAN regional networking and business linkages (see Box 4.3). However, the regional implementation still lacks regional harmonization and needs to reach international best practice levels.
Box 4. 3: Handling Investment Inquiries in ASEAN Remains a Problem
ASEAN made good progress in promoting their investment through website and inquiry handling in 2009, which recorded a big jump from 36 percent in 2006 to 48 percent in 2009, yet slightly fell back to 43 percent in 2012 (these numbers represent the performance as a percentage of best practice: a 41 to 60 percent score being average practice). The large improvement in investment promotion was partly due to effective development of the website and business licensing online system in a number of ASEAN countries, notably Singapore and Malaysia. ASEAN has been good at promoting investments through its websites, but on the other hand has been very poor at responding to inquiries. For instance, ASEAN scores 69 percent for investment promotion website quality (technical strength, design quality, promotional effectiveness, and supply of information needed by investors), but only 18 percent for inquiry handling in 2012. Countries like Brunei, Indonesia, Malaysia, Philippines, Singapore, and Thailand recorded at least 70 percent for website, and Cambodia and Laos recorded between 50 percent and 60 percent, while Viet Nam recorded only 36 percent. For inquiry handling, however, only Singapore records an average score of 47 percent, while other ASEAN countries had weak to very weak performance with less than 30 percent; even Cambodia and Viet Nam had only less than 10 percent. Source: World Bank, Global Investment Promotion Best Practices Database and authors’ calculations
68 Source: ERIA’s Midterm Review (July 2012),
0%10%20%30%40%50%60%70%80%
EAP MENA ASEAN ECA LAC OECD
2006 2009 2012
152
E. ASEAN Integration Impacts on FDI
74. Having assessed the evolution of FDIs in the region, and the policies that are conducive to attract investment, and in particular those through ASEAN joint efforts, this final section seeks to ascertain whether reform policies have truly impacted investment levels. A simultaneous movement of increasing FDIs, in particular intra-regional ones, and of policies and government actions to facilitate foreign investment in ASEAN countries is quite evident. However, to what extent have ASEAN efforts been the cause of the good performance of the region in attracting investment? Also, to what extent have ASEAN policies been shaping the type of investments received from abroad? This section offers a brief survey of the technical empirical literature. 75. The empirical economic literature suggests that regional trade agreements have a positive influence on the flow of FDIs. The facts suggest that this is indeed the case for ASEAN. Recent studies on FDI flows in the ASEAN region highlight the impact of ASEAN integration efforts in the volume of FDI and its nature. Investment decisions are indeed shaped by factors that are affected by regional integration efforts.
76. Recent research (Plummer and Cheong, 2009) investigating the determinants of FDI after the 1998 financial crisis and the impact of the ASEAN Investment Area find that intra-ASEAN investment stocks are higher, while investments coming from outside the region are lower than they would be without ASEAN. This result is confirmed by other research (Hattari and Rajan, 2009) that suggests that on average ASEAN countries invest more into each other because of regional integration. Ismail et al. (2009) also find that investments from outside ASEAN are negatively impacted by regional integration. This study further distinguishes between the 1967 founding members and members that later acceded to ASEAN to conclude that the increase in intra-ASEAN investment was more towards the new members, suggesting that the reforms that these countries had to implement to gain benefits from the ASEAN Investment Agreement (AIA) and ASEAN Industrial Cooperation (AICO) would have attracted this supplement of FDI. These studies look at the period after the financial crisis from 2003-2005; their results suggest that ASEAN helped its members weather the crisis by keeping on generating FDIs. Although one study posited that the decrease in outside-ASEAN investments could be a consequence of the crisis and diversion of investment towards other emerging economies, rather than investment displacement in favor of intra-ASEAN investments, further calculations made by Thangavelu (2012) for the period 2002-2009 using the same methodology confirm the negative impact of ASEAN integration on extra-ASEAN FDI flows. This study also confirms the importance of affordable human capital69 in the region for attracting investment. 77. Multinationals may seek to serve foreign markets through local subsidiaries rather than by exporting: this is the ‘horizontal’ FDI type model, motivated by market size and relative trade costs and cost of establishment. Another motive may be to seek efficient host countries for fragments of an international production chain, because of local advantage in production costs: this is the ‘vertical’ FDI type model. In practice, FDI by MNCs may seek both objectives. In the context of regional integration, as suggested by Ismail (2009), liberalization of internal trade barriers would suggest that intra-regional FDI
69 Proxied by skill differentials between host and source country.
153
would likely diminish if the motive of FDI is primarily horizontal FDI. Firms that would invest in a given ASEAN country to access its market may now be able to export at low cost to the market, thereby removing the FDI incentive. On the contrary, vertical type FDI may boost intra-regional FDI because the finished product may be easily exported to other markets in the region. The expected impact of a regional agreement on FDI originating from outside the region would be an increase of flows both for vertical and horizontal types of FDI. 78. Evidence shows that FDI in the ASEAN region tends to be dominated by vertical-type investment. This is what is suggested by the findings of Plummer and Cheong (2009). They show that motives for vertical investment tend to dominate in their analysis of FDI to ASEAN. More specifically, they find that investment seeks cheaper factors of production, which echoes the findings of Petri (2012) that Asian FDIs tends to be dominated by investments from high technology economies to mid-level technology economies (unlike FDI in the rest of the world).
79. Analysis of the behavior of both US and Korean affiliates confirms these findings. Antras and Foley (2009) look at how ASEAN integration efforts affect the investment decisions of American multinationals and the performance of their ASEAN affiliates. Their findings confirm theoretical predictions that regional liberalization increases the volume of FDI (originating from the US) in ASEAN. US affiliates also grow in size and become more active selling to markets outside ASEAN, thus suggesting that FDI towards ASEAN is to create export platforms (as for instance in the automobile sector, see Box 4.4). Based on these findings, the authors conclude that the increase in FDI triggered by regional integration is likely to generate benefits in the form of future productivity gains within ASEAN as multinationals and exporters typically exhibit high levels of productivity, pay high wages, and create positive spillovers for other firms. A similar study is conducted by Lee (2011) for Korean firms and also shows that FDI in ASEAN is not only to serve local ASEAN markets, but also to export outside of ASEAN.
80. In summary, empirical analysis shows that intra-regional FDIs are by and large complementary of regional integration in ASEAN. This is linked with an important motivation for FDI in the region, which is to take advantage of international differences in factor prices in fragmented supply chains. There is some suggestion that these intra-regional investment flows have benefited in particular the new ASEAN members. Besides, ASEAN integration seems to attract investment that is beneficial to the region as it contributes to higher level of exports and likely gains in competitiveness. One concern for the ASEAN region has been the prospect of a loss of competitiveness in attracting investment towards third countries, in particular China. Plummer and Cheong (2009) do not find supporting evidence that the rise of China has resulted in diversion of investments away from ASEAN.
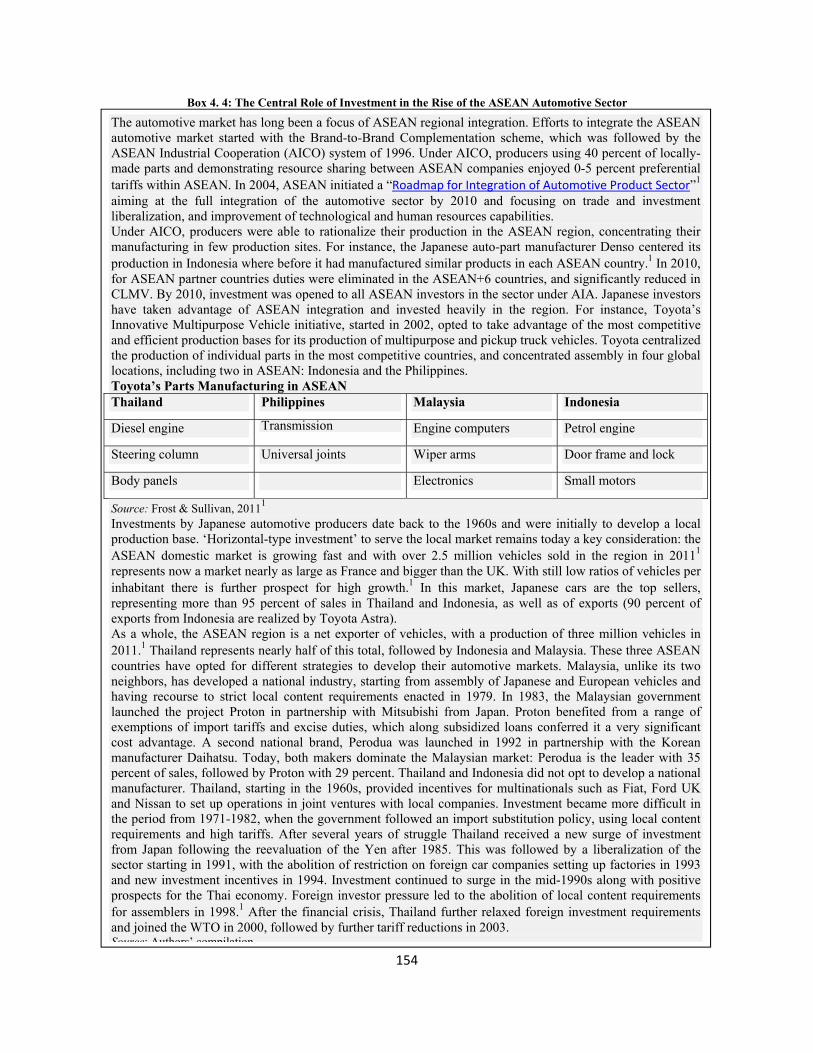
154
Box 4. 4: The Central Role of Investment in the Rise of the ASEAN Automotive Sector
The automotive market has long been a focus of ASEAN regional integration. Efforts to integrate the ASEAN automotive market started with the Brand-to-Brand Complementation scheme, which was followed by the ASEAN Industrial Cooperation (AICO) system of 1996. Under AICO, producers using 40 percent of locally-made parts and demonstrating resource sharing between ASEAN companies enjoyed 0-5 percent preferential tariffs within ASEAN. In 2004, ASEAN initiated a “Roadmap for Integration of Automotive Product Sector”1 aiming at the full integration of the automotive sector by 2010 and focusing on trade and investment liberalization, and improvement of technological and human resources capabilities. Under AICO, producers were able to rationalize their production in the ASEAN region, concentrating their manufacturing in few production sites. For instance, the Japanese auto-part manufacturer Denso centered its production in Indonesia where before it had manufactured similar products in each ASEAN country.1 In 2010, for ASEAN partner countries duties were eliminated in the ASEAN+6 countries, and significantly reduced in CLMV. By 2010, investment was opened to all ASEAN investors in the sector under AIA. Japanese investors have taken advantage of ASEAN integration and invested heavily in the region. For instance, Toyota’s Innovative Multipurpose Vehicle initiative, started in 2002, opted to take advantage of the most competitive and efficient production bases for its production of multipurpose and pickup truck vehicles. Toyota centralized the production of individual parts in the most competitive countries, and concentrated assembly in four global locations, including two in ASEAN: Indonesia and the Philippines. Toyota’s Parts Manufacturing in ASEAN Thailand Philippines Malaysia Indonesia
Diesel engine Transmission Engine computers Petrol engine
Steering column Universal joints Wiper arms Door frame and lock
Body panels Electronics Small motors
Source: Frost & Sullivan, 20111 Investments by Japanese automotive producers date back to the 1960s and were initially to develop a local production base. ‘Horizontal-type investment’ to serve the local market remains today a key consideration: the ASEAN domestic market is growing fast and with over 2.5 million vehicles sold in the region in 20111 represents now a market nearly as large as France and bigger than the UK. With still low ratios of vehicles per inhabitant there is further prospect for high growth.1 In this market, Japanese cars are the top sellers, representing more than 95 percent of sales in Thailand and Indonesia, as well as of exports (90 percent of exports from Indonesia are realized by Toyota Astra). As a whole, the ASEAN region is a net exporter of vehicles, with a production of three million vehicles in 2011.1 Thailand represents nearly half of this total, followed by Indonesia and Malaysia. These three ASEAN countries have opted for different strategies to develop their automotive markets. Malaysia, unlike its two neighbors, has developed a national industry, starting from assembly of Japanese and European vehicles and having recourse to strict local content requirements enacted in 1979. In 1983, the Malaysian government launched the project Proton in partnership with Mitsubishi from Japan. Proton benefited from a range of exemptions of import tariffs and excise duties, which along subsidized loans conferred it a very significant cost advantage. A second national brand, Perodua was launched in 1992 in partnership with the Korean manufacturer Daihatsu. Today, both makers dominate the Malaysian market: Perodua is the leader with 35 percent of sales, followed by Proton with 29 percent. Thailand and Indonesia did not opt to develop a national manufacturer. Thailand, starting in the 1960s, provided incentives for multinationals such as Fiat, Ford UK and Nissan to set up operations in joint ventures with local companies. Investment became more difficult in the period from 1971-1982, when the government followed an import substitution policy, using local content requirements and high tariffs. After several years of struggle Thailand received a new surge of investment from Japan following the reevaluation of the Yen after 1985. This was followed by a liberalization of the sector starting in 1991, with the abolition of restriction on foreign car companies setting up factories in 1993 and new investment incentives in 1994. Investment continued to surge in the mid-1990s along with positive prospects for the Thai economy. Foreign investor pressure led to the abolition of local content requirements for assemblers in 1998.1 After the financial crisis, Thailand further relaxed foreign investment requirements and joined the WTO in 2000, followed by further tariff reductions in 2003. Source: Authors’ compilation
155
81. On the other hand, evidence suggests that ASEAN integration has not had any discernible impact on attracting extra-regional investments. While in theory one should expect a positive impact, studies covering the post-Asian financial crisis show a negative impact on extra-ASEAN investment levels. Thus, there seems to be some degree of investment diversion at play: one potential explanation might be that investments originating in Singapore, the largest intra-ASEAN investor, might have replaced investments from outside the region.
F. Conclusion and Policy Recommendations
82. Investment integration has been progressing quite well in ASEAN, which is driven concurrently by ASEAN growing economies and the ASEAN investment integration policy. A free flow of investment regime should also be supported by business licensing, land, labor, and tax administration, which are all key to enhancing ASEAN attractiveness to FDI. 83. Overall, the more open countries in ASEAN have tended to show that they have had more success generating FDI flows. Further, the opening of sectors to foreign investors is the main goal of ACIA and what the ASEAN membership should seek to advance. However, the region still restricts access much more than countries with which ASEAN competes on a global scale. The level of opening in the manufacturing sector is high in most countries, and there is progress in the agricultural sector. In this respect, most countries already have liberal policies, with a few ASEAN members still pursuing more restrictive agendas. Where the region lags overall is regarding openness to foreign investors in the services sector. Quick interventions to remedy this could focus on the following areas:
i. Liberalization of investment in services sectors is as important as in the manufacturing sector if not more, since many services are essential inputs into most economic activities. AMS commitments to liberalizing foreign investments in all sectors need to become more commercially meaningful.
ii. Improving the clarity of the negative list used for investment market access liberalization in
ASEAN will be important. By consolidating various pieces related to the investment regime, ACIA is a good step forward. However, the existence of both negative list (exception lists in sectors covered in ACIA) and positive list (limitation of coverage to certain services sectors) results in a lack of transparency.
iii. Providing clarity on measures affecting investments seems desirable. The language of ACIA is
general about the measures that should be covered by the national treatment provision. Transparency would be improved by listing these measures, and also by monitoring in detail their use. Additionally, ACIA only provides for national treatment, but this does not guarantee that regulations affecting investment reflect best international practice or are implemented in the most efficient way. Defining what is best international practice is however complicated and not an exact science: it would be useful to consider a mechanism, for instance through the Coordination Committee on Investment, for member states to interact to exchange views on regulatory matters.
iv. Continuing business license simplification will be useful. Simplifying licensing is not only about
cutting licenses, but it is more about how to limit licenses that serve their objectives best. The first thing is to compile all licenses and cut unnecessary licenses. It could be started by setting technical standards to ensure that licenses should fulfill legitimate regulatory purposes—such as safeguard public health and safety, protect the environment, ensure national security, or manage limited natural resources. ASEAN
156
should also foster the full implementation of an integrated One Stop Shop where there is an authority delegation to a particular agency to issue licenses and allow reductions of overlapping licenses (as one agency could take a control in issuing licenses). This should also be accompanied by fostering the implementation of an online system—not only electronic business licensing system but also electronic payment system. In addition, there should be full implementation of electronic filling and payment system of business licenses nationwide as well as ASEAN-wide.
v. Improving the service quality of the website70 and the help desk at investment offices will
facilitate investment. Website and help desk services should act as a front line in dealing with investment regulations and policies for investors. The improvement should cover both hard and soft infrastructure, including personal skills of officials. It could be started with, first, providing detailed information on business startup requirements online or making them publicly available along with the costs of obtaining licenses, and identifying government departments that are responsible to issue licenses as well as persons in charge and their contacts. Second, the focus should be on empowering the help desks and/or investment relation units with enough knowledge to respond to basic questions related to investment, investment policies and regulations of each member country and ASEAN, and providing information on standard operating procedures on how to start up a business.
70 The ASEAN investment website is under development.
157
References
ACIA: “ASEAN Comprehensive Investment Agreement” (February, 2009), ASEAN Member Countries Agreement Document, Thailand.
“Piloting a Results-Based Financing for Programs Modality,” ADB, Manila, Philippines.
Anderson, James E. and Eric Van Wincoop, (2003), “Gravity with Gravitas: A Solution to the Border Puzzle”, The American Economic Review, 93(1), 170-192.
Ando, Mitsuyo and Ayako Obashi (2010), “The Pervasiveness of Non-Tariff Measures in ASEAN- Evidences from the Inventory Approach”, M. Mikic, Mia and M. Wermelinger, eds., Rising Non-Tariff Protectionism and Crisis Recovery, a study of the Asia-Pacific Research and Training Network on Trade, UNESCAP.
Antras, Pol, and C. Fritz Foley (2009), “Regional Trade Integration and Multinational Firm Strategies”, Working Paper No. 14891, NBER.
Arvis, Jean-François, and Shepherd, Ben (2011), “The Air Connectivity Index: Measuring Integration in the Global Air Transport Network.” Policy Research Working Paper 5722, World Bank.
Arvis, Jean-François, Duval, Yann, Shepherd, Ben, and Utoktham, Chorthip (Forthcoming), “Trade Costs in the Developing World: 1995-2010”, Working Paper.
ASEAN Secretariat (undated), “Rules of origin for the Agreement on the Common Effective Preferential Tariff Scheme for the ASEAN Free Trade Area (CEPT-AFTA-ROO)”, available at ‘www.asean.org’.
ASEAN (2010) “Master Plan on ASEAN Connectivity”, ASEAN Secretariat, Jakarta.
ASEAN-ANU Migration Research Team (2005), “Movement of Workers in ASEAN: Health Care and IT sectors”, Project No. 04/007, REPSF.
Australian National University (2004), “Liberalization and Harmonization of ASEAN Telecommunications”, Project No.02/009, REPSF.
Baddeley, M (2006), “Convergence or Divergence? The Impacts of Globalization on Growth and Inequality in Less-Developed Countries”, International Review of Applied Economics, 20(3).
Baldwin (2012), “Global Supply Chains: Why They Emerged, Why They Matter, and Where They Are Going”.
Baldwin, Richard E. and Daria Taglioni (2006), “Gravity for Dummies and Dummies for Gravity Equations”, Working Paper No. 12516, NBER.
158
Basu, Sudip Ranjan and Hiroaki Kuwahara (2010), “UNCTAD Initiatives on Non-Tariff Measures - Some Results from a Pilot Project”, in M. Mikic, Mia and M. Wermelinger, eds., Rising Non-Tariff Protectionism and Crisis Recovery, a study of the Asia-Pacific Research and Training Network on Trade, UNESCAP.
Bhattacharyya, B. (1999), “Non-Tariff Measures on India’s Exports: An Assessment”, Occasional Paper No. 16, Indian Institute of Foreign Trade, New Delhi.
Bhattacharyya, B. and S. Mukhopadyaha (2002), “Barricading Trade through Non-Tariff Measures through the Indian Eyes”, in A. Dasgupta and B. Debroy (eds.), Salvaging the WTO’s Future Doha and Beyond, Konark New Delhi.
Blonigen, Bruce, and Jeremy Piger, (2011), “Determinants of Foreign Direct Investment”, Working Paper No. 16704, NBER.
Calvo-Pardo, Hector, Caroline Freund and Emmanuel Ornelas (2009), “The ASEAN Free Trade Agreement: Impact on Trade Flows and External Trade Barriers”, Policy Research Working Paper No. 4960, World Bank.
Calvo-Pardo, Hector, Caroline Freund and Emmanuel Ornelas (2009), “The ASEAN Free Trade Agreement: Impact on Trade Flows and External Trade Barriers”, Working Paper 4960, World Bank.
Chandra, A. C. (2009), “The Pursuit of Sustainable Development through Regional Economic Integration”, ASEAN and Its Potential as a Development-oriented Organization, Trade Knowledge Network, International Institute for Sustainable Development, Canada.
Chaturvedi, S. and G. Nagpal (1999), “WTO and Product Related Environmental Standards: Emerging Issues and Policy Options before India”, RIS, New Delhi.
Chia Siow Yue (2003), “Provision and Commitments on Trade in Financial Services in Trade Agreements in East Asia; Notes on Singapore Commitments”, presented at the 2nd Annual Conference of PECC Finance Forum, Thailand.
Copeland, Brian and Aaditya Mattoo (2008), “The Basic Economics of Services Trade”, Chapter 3 in A. Mattoo, R. Stern and G. Zanini, A Handbook of International Trade in Services, Oxford: Oxford University Press.
Crivelli, Pramila, Jasmin Groschi (2012), “SPS Measures and Trade: Implementation Matters”, Economic Research and Statistics Division, Staff Working Paper ERSD-2012-05, World Trade Organization.
De Sousa, Jose (Forthcoming), “The Currency Union Effect on Trade is Decreasing over Time,” Economics Letters.
159
Dee, P. (2009), “Service Liberalization Toward the ASEAN Economic Community”, in J.Corbett and S. Umezaki (ed.), Deepening East Asian Economic Integration, REIA Research Project Report 2008, Jakarta.
Duval, Yann, and Chorthip Utoktham (2011), “Intraregional Trade Costs in Asia: A Primer,” Asia-Pacific Development Journal, 18(2): 1-23.
Economic Research Institute for ASEAN and East Asia –ERIA (2012), “Mid-Term Review of the Implementation of AEC Blueprint”, Jakarta
Economic Research Institute for ASEAN and East Asia-ERIA (2012), “The Integrative Report of the ASEAN Economic Community Blueprint Mid Term Review Project”.
European Central Bank (2011), “Financial Integration in Europe”, Frankfurt: European Central Bank.
Ferrantino, Michael J (2010), “Methodological Approaches to the Quantification of Non-Tariff Measures”, in M. Mikic, Mia and M. Wermelinger, eds., Rising Non-Tariff Protectionism and Crisis Recovery, a study of the Asia-Pacific Research and Training network on Trade, UNESCAP.
Findlay, Christopher (2009), “Trade Facilitation”, In Corbett, Jenny, and Umezaki, So (eds.). Deepening East Asian Economic Integration, ERIA, Jakarta.
Forsyth, P., J. King, C.L. Rodolfo and K. Trace (2004), “Preparing ASEAN for Open Sky”, Project No. 02/008, REPSF.
Francois, Joseph and H.K. Hall (1997), “Global Simulation Analysis of Industrial Level Trade Policy”, Applied Methods for Trade Policy Analysis: A Handbook, Cambridge University Press, Cambridge.
Geloso Grosso, Massimo (2008), “Liberalising Air Transport Services in APEC”, GEM Working Paper, Institut d’Etudes Politiques de Paris.
Golub, Stephen S. (2009), “Openness to Foreign Direct Investment in Services: An International Comparative Analysis”, The World Economy, Volume 32, Issue 8, Pages 1135–1268.
Gordon and Chapman (2003), “Liberalization of Financial Services in the ASEAN Region”, Project No.02/006, REPSF.
Hanspeter, T. and L. Wiedmer (2001), “Non-Tariff Barriers to Trade in the Core Countries of the Stability Pact for South Eastern Europe”, Bureau Arthur Dunkel, Geneva.
Hattari, Rabin, and Ramkishen S. Rajan (2009), “Understanding bilateral FDI flows in developing Asia”, Asian-Pacific Economic Literature, volume 23, Issue 2.

160
Hew, Denis (2002), “Singapore as a Regional Financial Center”, presented at Research Conference, Institute of Southeast Asian Studies.
Heyman, Erik (2011). “ASEAN Auto Market: Growing in the shadow of China and India”, Deutsche Bank Research.
Hoekman, Bernard (2010), “Trade in Services and Prospects for Global Inclusive Growth”, ADBI/ARTNet, Bali.
Hollweg, Claire, and Wong, Marn-Heong (2009), “Measuring Regulatory Restrictions in Logistics Services.” Discussion Paper No. 2009-14, ERIA.
Iredale, R., T. Turpin, C. Stahl and T. Getusdisorn (2010), “Free Flow of Skilled Labour Study”, AADCP II.
Ismail (2009), “The Effect of ASEAN Economic Integration on Foreign Direct Investment”, Journal of Economic Integration, 24(3): 385-407.
Kankesu and Lee, Shao-Wei (2008), “Integration and Income Convergence: ASEAN and SAARS”, Working Paper, University of Wollongong, Australia.
Kartadjoemena, H.S. (2003), “Reforming Trade in Services Negotiations under AFAS”, REPSF Project 02/003.
KPMG (2005), “Automotive and Component Markets in Asia”, KPMG, Hong Kong.
Krskina, Alex (2003), “Liberalizing Capital Movement in the ASEAN Region”, July.
Lee, Hiro and Michael G. Plummer (2011), “Assessing the Impact of the ASEAN Economic Community”, OSIPP Discussion Paper: DP-2011-E-002, Osaka University.
Lee, Seungrae (2011), “Regional Economic Integration and Multinational Firm Strategies in Middle-Income Countries”, mimeo University of Texas Austin.
Liang, T. S. and G.T.P. Wei (2006), “Financial Liberalization and its Challenges to the Local Banks—The Experience of Singapore”, Banks and Bank Systems, Vol.1, issue 4.
Lim, Hank and Khin Maung Nyunt (2010), “Study to Determine the Impact of Accelerating the ASEAN the ASEAN Economic Community from 2020 to 2015 on Cambodia, Lao PDR, Myanmar, Viet Nam”, presented at the 36th IAI Task Force Meeting, ASEAN Secretariat, Jakarta.
Low, Patrick, Roberta Piermartini and Jurgen Richtering (2005), “Multilateral Solutions to the Erosion of Non-Reciprocal Preferences in NAMA”, Staff Working Paper ERSD-2005-05, World Trade Organization.
161
Manchin, Miriam and Annette Pelkmans-Balaoing (2008), “Clothes Without an Emperor: Analysis of the Preferential Tariffs in ASEAN”, Journal of Asian Economics, 19(3), 213-223.
Manchin, Miriam and Pelkmans-Balaoing (2007), “Rules of Origin and the Web of East Asian Free Trade Agreements”, Policy Research Working Paper, WPS 4273, World Bank.
MAS (2012), “Singapore Financial Center”, available at ‘http/app.www.sg/what/58/Banks-and-financial-institution.aspx’.
Michalopoulos, C (1999), “Trade Policy and Market Access Issues for DCs: Implications for the Millennium Round”, World Bank.
Miroutdot, Sébastien (2011), “Investment”, Chapter 14 in J-P Chauffour and J-C Maur eds. Preferential Trade Agreement Policies for Development: A Handbook, World Bank.
Narjoko, D, P. Kartika and T. Wicaksono (2009), “Narrowing the Development Gap in ASEAN” In ed. Plummer, M. and Chia S. Yue. Realizing the ASEAN Economic Community: A Comprehensive Assessment, Institute of Southeast Studies (ISEAS), Singapore.
Nicita. Alessandro and Julien Gourdon (2011), “A Preliminary Analysis on Newly Collected Data on Non-Tariff Measures”, UNCTAD, New York and Geneva.
O’Donnell, P., R. You, J. Harris (2000), “Telecommunications Liberalization”, available at ‘http://facweb.cs.depaul.edu/yele/Course/IS540/Global-Project/2001/Singapore/telecom.html’
(2005), “Analysis of Non-Tariff Barriers of Concern to Developing Countries”, Trade Policy Working Papers No. 16., OECD
Petri, Peter (2012), “The Determinants of Bilateral FDI: Is Asia Different?”, Journal of Asian Economics,
Volume 23, Issue 3, Pages 201–209.
Petri, Plummer and Zhai (2010), “The Economics of the ASEAN Community”, in Plummer, M. and Chia S. Yue (ed.), Realizing the ASEAN Economic Community: A Comprehensive Assessment, Institute of Southeast Studies, Singapore.
Plummer , M. and Chia S. Yue (2009), Realizing the ASEAN Economic Community: A Comprehensive Assessment, Institute of Southeast Studies, ISEAS, Singapore.
Plummer, Michael G., and David Cheong (2009), “FDI Effects of ASEAN Integration”, Région et Développement , Vol. 29: pp. 50-67.
Pratruangkrai, Petchanet (2010), “ASEAN Investment Liberalization Could be Delayed by Desire to Protect Many Sectors”, The Nation.
162
Richardson, M. (1997), “Analysts Split on Deregulations Impact: For Singapore Telecom, Battle on Home Front”, New York Times.
Schlueter, Rau, Wieck, Humphrey, Colen & Heckelei (2009), “Assessment on the Impacts of Non-Tariff Measures NTM on the Competitiveness of the EU and Selected Trade Partners”, NTM Impact Working Paper 09/02.
Severino, Rodolfo (2009), “Report on the Mid Term Review of the Initiative for SEAN Integration (IAI) Work Plan”, available at ‘http://www.aseansec.org/18201.htm’.
Shepherd, Ben and John Wilson (2008), “Trade Facilitation in ASEAN Member Countries: Measuring Progress and Assessing Priorities”, Policy Research Working Paper No. 4615, World Bank.
Shepherd, Ben and John Wilson (2008), “Trade Facilitation in ASEAN Member Countries: Measuring Progress and Assessing Priorities”, Working Paper 4615,World Bank.
Shepherd, Ben and John Wilson (2008), “Trade Facilitation in ASEAN Member Countries: Measuring Progress and Assessing Priorities”, Working Paper 4615, World Bank.
Shepherd, Ben (2010), “Trade Costs and Facilitation in APEC and ASEAN: Delivering the Goods?” in Mia Mikic (ed.) Rising Non-Tariff Protectionism and Crisis Recovery, ESCAP, Bangkok.
Shepherd, Ben, and Wilson, John (2009), “Trade Facilitation in ASEAN Member Countries: Measuring Progress and Assessing Priorities.” Journal of Asian Economics, 20(4), 367-383.
Soesastro Hadi (2008), “Deepening Economic Integration—The ASEAN Economic Community and Beyond”, Research Project Report 2007-1-2, ERIA.
Sourdin, Patricia, and Richard Pomfret (2009), “Monitoring Trade Costs in Southeast Asia”, Discussion Paper 2009-12, ERIA.
Staiger, Robert W (2012), “Non-Tariff Measures and the WTO”, Staff Working Paper ERSD-2012-01, Economic Research and Statistics Division, World Trade Organization.
Stephenson, S (1997), “Standards and Conformity Assessment as Nontariff Barriers to Trade”, Policy Research Working Paper No. 1826, World Bank.
Stoler, Andrew L. (2010), “Untangling the Noodle Bowl in East Asia: Progresses in De Facto Convergence of Rules of Origin”, presented at workshop on Rules of Origin in East Asian Economic Integration in Tokyo, Institute for International Trade, The University of Adelaide.
Teather, Edward (2012), “ASEAN: Linkages and Liberalisation”, Asian Economic Perspectives, UBS Investment Research, available at ‘www.ubs.com/economics’.
163
Tham, Siew Yean (2008), “ASEAN Open Skies and the Implications for Airport Development Strategy in Malaysia”, Working Paper No: 119, ADB Institute.
Thangavelu, Shangree M. (2012), “Human Capital, FTAs and Foreign Direct Investment Flows into ASEAN”, mimeo.
Thanh, V.T. and P. Bartlett (2006), “Ten Years of ASEAN Framework Agreement on Services (AFAS)”, REOPSF Project No. 05/004.
Tongzon, J.L. and L.D. Doanh (2003), “Options for Manufacturing Revenue Losses and other Adj Costs of CLMV participation in AFTA”, REPSF Project 02/002, AADCP- I.
Trewin, Bosworth, Narjoko, A. Mukherjee, A. Stoler, J. Redden, V. Donaldson, G. Thomson (2008), “East Asian Free Trade Agreements in Services: Facilitating Free Flow of Services in ASEAN?”.
UNCTAD (2010), “Non-tariff Measures: Evidence form Selected Developing Countries and Future Research Agenda”, New York and Geneva.
UNCTAD (2012), “World Investment Report 2012: Towards a New Generation of Investment Policies”, Geneva.
USITC (2010), “ASEAN: Regional Trends in Economic Integration, Export Competitiveness, and Inbound Investment for Selected Industries.” Publication No. 4176.
World Bank (2007), “Preferential Rules Of Origin: Policy Research Report”, East Asia And Pacific Region, Poverty Reduction And Economic Management.
World Bank (2008), “A Survey on Non-Tariff Measure in the East Asia and Pacific Region”, Policy Research Report, East Asia and Pacific Region.
WTO (2008), “Trade Policy Review: Singapore”, available WTO website.
World Economic Forum (2013), “Enabling Trade: Valuing Growth Opportunities”, Geneva, available at: ‘http://www3.weforum.org/docs/WEF_SCT_EnablingTrade_Report_2013.pdf’.
Zarrilli, S. and I. Musselli (2004), “The Sanitary and Phytosanitary Agreement, Food Safety Policies, and Product Attributes”, in D. Merlinda and J. Nash (eds.), Agriculture in the WTO: Creating a Trading System for Development, World Bank and Oxford University Press.

ASEAN Integration Monitoring Report
A Joint Report by the ASEAN Secretariat and the World Bank
“One Vision, One Identity, One Community”
“Working for a World Free of Poverty”
ASEAN ASEAN Integration Monitoring Office
World Bank
East Asia and Pacific Region
ASEA
N Integration M
onitoring Report ‐ A Joint Report by the A
SEAN Secretariat and the W
orld Bank
Supported by the Australian Government through the ASEAN-Australia Development Cooperation Program Phase II

![A Passion for the Elements - AIMR, Tohoku Univ. · 019 ]AIMR Action Log[April 2015 - March 2016 Contents It is our great pleasure to publish Volume 8 of AIMR Magazine. Fiscal year](https://img.pdfslide.net/doc/110x75/5f32efe6caee3e246a54f6b7/a-passion-for-the-elements-aimr-tohoku-univ-019-aimr-action-logapril-2015.jpg)