Embed Size (px)
Citation preview
Ainsworth Game Technology Limited
ABN 37 068 516 665
APPENDIX 4E
Preliminary Final Report
Year Ended: 30 June 2013
Previous corresponding period: 30 June 2012
Results for announcement to the market
Up / Down
%
Change
Year ended 30/06/13 A$’000
Revenue from operating activities Up 32% to 198,147
Profit before tax Up 50% to 69,267 Profit for the period attributable to equity holders of the parent (Refer Note below)
Down
19%
to
52,202
Dividends (distributions) Amount per security
Franked amount per security
Final dividend Interim dividend
5.0¢
3.0¢
-¢
-¢
Previous corresponding period -¢ -¢
Record date for determining entitlements to the dividend
10 September 2013
Brief explanation of any of the figures reported above and short details of any bonus or cash issue or other item(s) of importance not previously released to the market: Note The profit after tax of $52.2 million for the period attributed to equity holders of the parent included income tax expense of $17.1 million. The previous corresponding period in 2012 included an income tax benefit of $18.1 million following the recognition of previously unrecognised deferred tax assets. Refer Operating and Financial Review section within the attached Directors’ Report. NTA backing Current period Previous corresponding
Period
Net tangible asset backing per ordinary security $0.54 $0.36
ANNUAL MEETING
The annual meeting will be held as follows:
Place: “Georges River Room”
Bankstown Sports Club
8 Greenfield Parade
BANKSTOWN NSW 2200
Date: Wednesday 20th November 2013
Time: 11.00am
Approximate date the Annual Report will be available: 20 October 2013
For
per
sona
l use
onl
y
Ainsworth Game Technology Limited Annual Financial Report for the year ended 30 June 2013
1
Ainsworth Game Technology Limited ABN 37 068 516 665
ANNUAL FINANCIAL REPORT
FOR THE YEAR ENDED
30 JUNE 2013
For
per
sona
l use
onl
y
Ainsworth Game Technology Limited Annual Financial Report for the year ended 30 June 2013
2
Ainsworth Game Technology Limited
Contents
Page
Directors’ report 3
Consolidated statement of financial position 25
Consolidated statement of comprehensive income 26
Consolidated statement of changes in equity 27
Consolidated statement of cash flows 28
Index to notes to the financial statements 29
Index to significant accounting policies 30
Notes to the financial statements 31
Directors’ declaration 73
Independent auditor’s report 74
Lead auditor’s independence declaration 76
For
per
sona
l use
onl
y
Ainsworth Game Technology Limited Annual Financial Report for the year ended 30 June 2013
3
Ainsworth Game Technology Limited
Directors’ report
For the year ended 30 June 2013
The directors present their report together with the consolidated financial statements of the Group comprising of Ainsworth
Game Technology Limited (the Company) and its subsidiaries for the financial year ended 30 June 2013 and the auditor’s
report thereon.
1. Directors
The directors of the Company at any time during or since the end of the financial year are:
NAME, QUALIFICATIONS AND
INDEPENDENCE STATUS
AGE EXPERIENCE, SPECIAL RESPONSIBILITIES AND OTHER
DIRECTORSHIPS
CURRENT
Mr Leonard Hastings Ainsworth Executive Chairman
90 yrs � Sixty years gaming industry experience � Founder and former Managing Director of Aristocrat � Fellow of the Institute of Company Directors in Australia and
the Australian Institute of Management � Life member – Clubs N.S.W � Founder of Australian Gaming Machines Manufacturers
Association – now Gaming Technology Association � Founder of Australasian Gaming Exhibition � Inducted into the Australian Gaming Hall of Fame and U.S
Gaming Hall of Fame in 1994 and 1995, respectively � Recognition as export hero in 2002 by Australian Institute of
Export � G2E Asia Gaming Visionary Award Recipient in 2010 � Recipient of Clubs NSW award for outstanding contribution to
the club industry in 2011 � Director and Chairperson since 1995 – Executive Chairperson
since 2003
Mr Graeme John Campbell Lead Independent Non-Executive Director
56 yrs � Graeme has specialised in the area of liquor and hospitality for over 30 years in corporate consultancy services with particular emphasis on hotels and registered clubs
� Chairman of Harness Racing NSW � Director of Central Coast Stadium and Blue Pyrenees Wines � Chairman of Audit Committee of Illawarra Catholic Club Group � Director since 2007 � Chairperson of Audit Committee and member of Regulatory
and Compliance Committee � Member of Remuneration and Nomination Committee until 30
June 2013 � Lead Independent Non-Executive Director since 30 June 2013
Mr Michael Bruce Yates B.Com (with merit), LLB Independent Non-Executive Director
59 yrs � Michael has extensive commercial and corporate law experience in a career spanning over 33 years
� He is a former senior corporate partner of Sydney Law practices Holding Redlich and Dunhill Madden Butler and has acted for a number of clients involved in the gaming industry
� Director since 2009 � Member of Audit Committee until 30 June 2013
� Chairperson of Regulatory and Compliance Committee and member of Remuneration and Nomination Committee since 30 June 2013
For
per
sona
l use
onl
y
Ainsworth Game Technology Limited Annual Financial Report for the year ended 30 June 2013
4
Ainsworth Game Technology Limited
Directors’ report (continued)
For the year ended 30 June 2013
1. Directors (continued)
NAME, QUALIFICATIONS AND INDEPENDENCE STATUS
AGE EXPERIENCE, SPECIAL RESPONSIBILITIES AND OTHER DIRECTORSHIPS
CURRENT
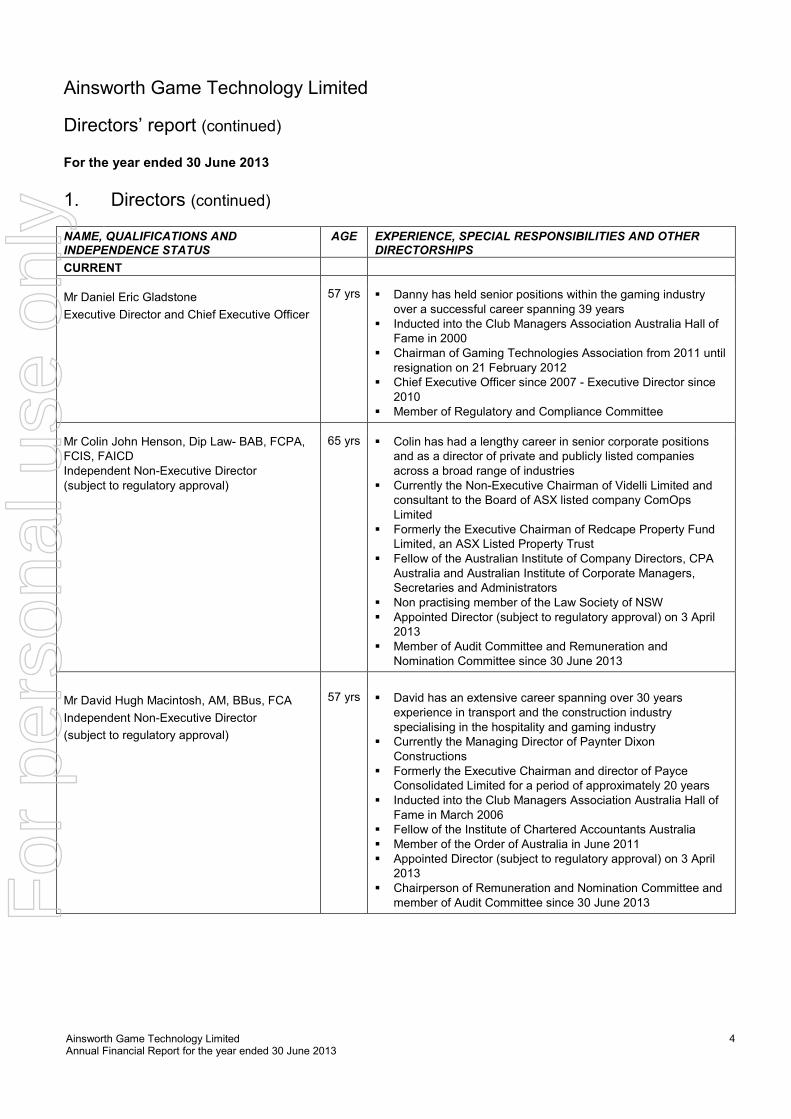
Mr Daniel Eric Gladstone
Executive Director and Chief Executive Officer
57 yrs � Danny has held senior positions within the gaming industry over a successful career spanning 39 years
� Inducted into the Club Managers Association Australia Hall of Fame in 2000
� Chairman of Gaming Technologies Association from 2011 until resignation on 21 February 2012
� Chief Executive Officer since 2007 - Executive Director since 2010
� Member of Regulatory and Compliance Committee
Mr Colin John Henson, Dip Law- BAB, FCPA, FCIS, FAICD Independent Non-Executive Director (subject to regulatory approval)
65 yrs � Colin has had a lengthy career in senior corporate positions and as a director of private and publicly listed companies across a broad range of industries
� Currently the Non-Executive Chairman of Videlli Limited and consultant to the Board of ASX listed company ComOps Limited
� Formerly the Executive Chairman of Redcape Property Fund Limited, an ASX Listed Property Trust
� Fellow of the Australian Institute of Company Directors, CPA Australia and Australian Institute of Corporate Managers, Secretaries and Administrators
� Non practising member of the Law Society of NSW � Appointed Director (subject to regulatory approval) on 3 April
2013
� Member of Audit Committee and Remuneration and Nomination Committee since 30 June 2013
Mr David Hugh Macintosh, AM, BBus, FCA
Independent Non-Executive Director
(subject to regulatory approval)
57 yrs � David has an extensive career spanning over 30 years experience in transport and the construction industry specialising in the hospitality and gaming industry
� Currently the Managing Director of Paynter Dixon Constructions
� Formerly the Executive Chairman and director of Payce Consolidated Limited for a period of approximately 20 years
� Inducted into the Club Managers Association Australia Hall of Fame in March 2006
� Fellow of the Institute of Chartered Accountants Australia � Member of the Order of Australia in June 2011 � Appointed Director (subject to regulatory approval) on 3 April
2013
� Chairperson of Remuneration and Nomination Committee and member of Audit Committee since 30 June 2013
For
per
sona
l use
onl
y
Ainsworth Game Technology Limited Annual Financial Report for the year ended 30 June 2013
5
Ainsworth Game Technology Limited
Directors’ report (continued)
For the year ended 30 June 2013
1. Directors (continued)
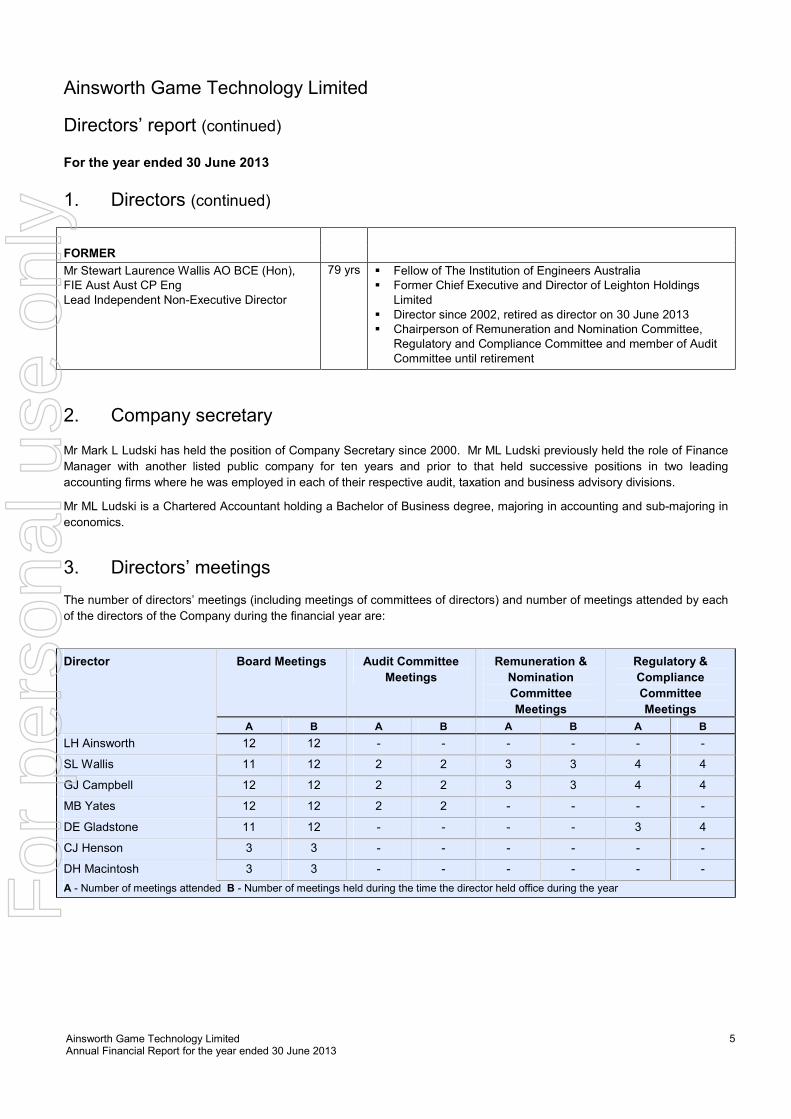
FORMER
Mr Stewart Laurence Wallis AO BCE (Hon), FIE Aust Aust CP Eng Lead Independent Non-Executive Director
79 yrs � Fellow of The Institution of Engineers Australia � Former Chief Executive and Director of Leighton Holdings
Limited � Director since 2002, retired as director on 30 June 2013 � Chairperson of Remuneration and Nomination Committee,
Regulatory and Compliance Committee and member of Audit Committee until retirement
2. Company secretary
Mr Mark L Ludski has held the position of Company Secretary since 2000. Mr ML Ludski previously held the role of Finance
Manager with another listed public company for ten years and prior to that held successive positions in two leading
accounting firms where he was employed in each of their respective audit, taxation and business advisory divisions.
Mr ML Ludski is a Chartered Accountant holding a Bachelor of Business degree, majoring in accounting and sub-majoring in
economics.
3. Directors’ meetings
The number of directors’ meetings (including meetings of committees of directors) and number of meetings attended by each
of the directors of the Company during the financial year are:
Director Board Meetings Audit Committee
Meetings
Remuneration &
Nomination
Committee
Meetings
Regulatory &
Compliance
Committee
Meetings
A B A B A B A B
LH Ainsworth 12 12 - - - - - -
SL Wallis 11 12 2 2 3 3 4 4
GJ Campbell 12 12 2 2 3 3 4 4
MB Yates 12 12 2 2 - - - -
DE Gladstone 11 12 - - - - 3 4
CJ Henson 3 3 - - - - - -
DH Macintosh 3 3 - - - - - -
A - Number of meetings attended B - Number of meetings held during the time the director held office during the year
For
per
sona
l use
onl
y
Ainsworth Game Technology Limited Annual Financial Report for the year ended 30 June 2013
6
Ainsworth Game Technology Limited
Directors’ report (continued) For the year ended 30 June 2013
4. Principal activities
The principal activity of the Group during the course of the financial year was the design, development, production, lease, sale
and servicing of gaming machines and other related equipment and services.
There were no significant changes in the nature of the activities of the Group during the year.
Objectives
The Group’s objectives are to:
• focus on increasing revenue and profitability within geographical markets which are expected to achieve the greatest
contributions to the Group’s financial results and creation of sustained growth;
• continue investing in product research and development in order to provide quality market leading products that are
innovative and entertaining resulting in increased player satisfaction and therefore greater venue profitability;
• provide a growing return on shareholder equity through increasing profitability, payment of dividends and share price
growth;
• prudently manage levels of investment in working capital and further improve cash flow from operations in the ensuing
financial year; and
• continue to pursue greater presence within the Americas.
In order to meet these objectives the following priority actions will continue to apply in future financial years:
• grow market share for existing business and increase revenue and operating activities in domestic and international
markets;
• continual investment in research and development;
• further reduce product and overhead costs through improved efficiencies in supply chain and inventory management;
• continue to improve and manage working capital;
• maintain best practice compliance policies and procedures and increase stakeholder awareness of the Group’s regulatory
environment; and
• ensure retention and development of key employees.
5. Operating and financial review
Overview of the Group
The profit after income tax for the year ended 30 June 2013 was $52.2 million, compared to $64.3 million in 2012. The result
in 2012 included the recognition of previously unrecognised deferred tax assets, resulting in an income tax benefit of $18.1
million being recognised in the full year profit after tax compared to an income tax expense of $17.1 million in the current year.
The profit before tax in the current year was $69.3 million compared to $46.2 million in 2012, an increase of 50%. This result
includes a second half profit before tax of $39.2 million compared to the reported profit before tax of $30.1 million for the six
month period ended 31 December 2012, an increase of 30%.
Sales revenue in the current year was $198.1 million compared to $150.6 million in 2012, an increase of 32%. Further strong
product performance and increased market share was achieved following the continued leading product performance of the
A560™ product family within domestic and international markets. Progression of development strategies in all geographical
markets together with progress to establish a greater presence in the Americas assisted to provide a strong foundation for
growth in the future. The Group continues to invest in product development to enable pursuit of new markets and provide
further extensions to the current product range in established markets.
For
per
sona
l use
onl
y
Ainsworth Game Technology Limited Annual Financial Report for the year ended 30 June 2013
7
Ainsworth Game Technology Limited
Directors’ report (continued) For the year ended 30 June 2013
5. Operating and financial review (continued)
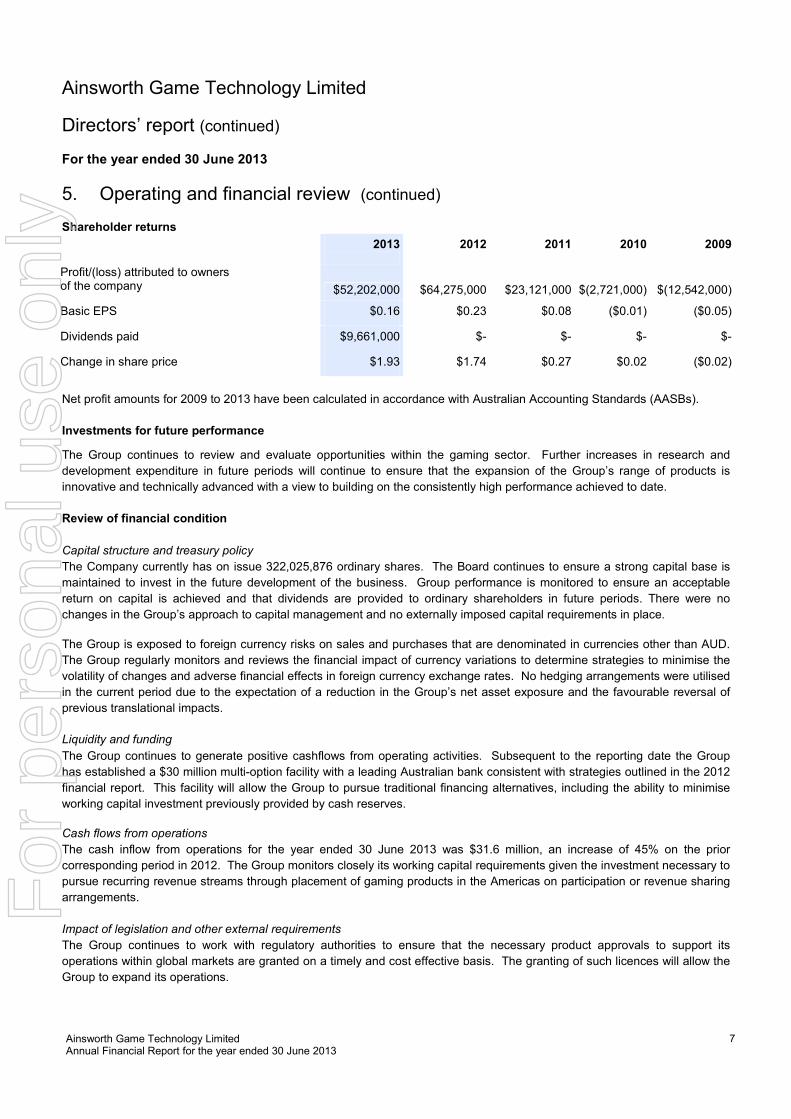
Shareholder returns
2013 2012 2011 2010 2009 Profit/(loss) attributed to owners of the company $52,202,000 $64,275,000 $23,121,000
$(2,721,000)
$(12,542,000)
Basic EPS $0.16 $0.23 $0.08 ($0.01) ($0.05)
Dividends paid $9,661,000 $- $- $- $-
Change in share price $1.93 $1.74 $0.27 $0.02 ($0.02)
Net profit amounts for 2009 to 2013 have been calculated in accordance with Australian Accounting Standards (AASBs).
Investments for future performance
The Group continues to review and evaluate opportunities within the gaming sector. Further increases in research and
development expenditure in future periods will continue to ensure that the expansion of the Group’s range of products is
innovative and technically advanced with a view to building on the consistently high performance achieved to date.
Review of financial condition
Capital structure and treasury policy
The Company currently has on issue 322,025,876 ordinary shares. The Board continues to ensure a strong capital base is
maintained to invest in the future development of the business. Group performance is monitored to ensure an acceptable
return on capital is achieved and that dividends are provided to ordinary shareholders in future periods. There were no
changes in the Group’s approach to capital management and no externally imposed capital requirements in place.
The Group is exposed to foreign currency risks on sales and purchases that are denominated in currencies other than AUD.
The Group regularly monitors and reviews the financial impact of currency variations to determine strategies to minimise the
volatility of changes and adverse financial effects in foreign currency exchange rates. No hedging arrangements were utilised
in the current period due to the expectation of a reduction in the Group’s net asset exposure and the favourable reversal of
previous translational impacts.
Liquidity and funding
The Group continues to generate positive cashflows from operating activities. Subsequent to the reporting date the Group
has established a $30 million multi-option facility with a leading Australian bank consistent with strategies outlined in the 2012
financial report. This facility will allow the Group to pursue traditional financing alternatives, including the ability to minimise
working capital investment previously provided by cash reserves.
Cash flows from operations
The cash inflow from operations for the year ended 30 June 2013 was $31.6 million, an increase of 45% on the prior
corresponding period in 2012. The Group monitors closely its working capital requirements given the investment necessary to
pursue recurring revenue streams through placement of gaming products in the Americas on participation or revenue sharing
arrangements.
Impact of legislation and other external requirements
The Group continues to work with regulatory authorities to ensure that the necessary product approvals to support its
operations within global markets are granted on a timely and cost effective basis. The granting of such licences will allow the
Group to expand its operations.
For
per
sona
l use
onl
y
Ainsworth Game Technology Limited Annual Financial Report for the year ended 30 June 2013
8
Ainsworth Game Technology Limited
Directors’ report (continued) For the year ended 30 June 2013
5. Operating and financial review (continued)
Review of financial condition (continued)
Impact of legislation and other external requirements (continued)
The Group aims to conduct its business worldwide in jurisdictions where gaming is legal and commercially viable.
Accordingly, the Group is subject to licensing and other regulatory requirements of those jurisdictions.
The Group’s ability to operate in existing and new jurisdictions could be adversely impacted by new or changing laws or
regulations and delays or difficulties in obtaining or maintaining approvals and licences.
Review of principal businesses
Revenue
Sales revenue of $198.1 million was recorded in the year under review compared to $150.6 million in 2012, an increase of
32%.
Within domestic markets revenue achieved was $124.4 million, an increase of 17% over the prior corresponding year in 2012.
This increase was predominately in the New South Wales, Queensland and Victorian markets which contributed 94% of
domestic revenue. The continued success of the A560™ gaming machine, release of new game combinations and leading
product performance resulted in the Group further increasing its market share in these markets. The increased revenue within
Australia was primarily due to the product development strategies previously introduced providing continued high yielding
performance and the expansion of the cabinet variants within the A560™ product family. The Victorian market contributed
revenue of $16.8 million, in the second half of FY13, an increase of 349% compared to the six months ended 31/12/2012 as
transitional changes to the new monitoring provider were implemented and the A560 ™ was released.
International revenue was $73.7 million compared to $47.5 million in 2012, representing an increase of 55%. The key markets
of North and South America contributed 85% of total international revenue, an increase of 70% over the corresponding year in
2012. The Group expects to achieve further increases in international revenue in FY14, from additional initiatives
complemented by the increased resources and capability within the Americas. Combined with the ongoing release of newly
developed product initiatives, the establishment of an operational base for North America in Las Vegas, Nevada in 2012, is
expected to assist in the achievement of growth objectives.
Revenue from other international markets of New Zealand, Europe and Asia contributed $11.1 million (15% of international
revenue), an increase of 7% on the corresponding period in 2012. The market of Asia represented 56% of revenue within
these geographical segments and achieved a 94% increase over the same period in 2012.
Operating costs
Gross margin of 66% was achieved, compared to 68% in 2012. The Company noted that margins within domestic markets
remained strong and the margin decrease in the year was primarily due to the increased revenue from South America which
is at a lower margin. Continued cost reduction initiatives combined with higher sales volumes, favourable currency
movements, production efficiencies and a greater concentration of premium progressive recurring revenue games are
expected to assist in off-setting potential negative margin impacts as international revenue increases its contribution to total
revenue of the Group.
Operating costs, excluding cost of sales, other expenses and financing costs, were $65.9 million, an increase of 22% over
2012. This increase was primarily attributed to increased variable selling costs in line with revenue increases, increased
expenditure on research and development on new product initiatives and the full year impact of the increased investment
within the Company’s operational facility in Las Vegas, Nevada established in 2012. The Group has now established the
necessary USA infrastructure to support the expected expansion in targeted international markets. Further expansion will be
aligned to the achievement of revenue growth within international market segments.
For
per
sona
l use
onl
y
Ainsworth Game Technology Limited Annual Financial Report for the year ended 30 June 2013
9
Ainsworth Game Technology Limited
Directors’ report (continued) For the year ended 30 June 2013
5. Operating and financial review (continued)
Review of principal businesses (continued)
Operating costs (continued)
Research and development (R&D) expense was $23.2 million, an increase of 24% over 2012 and represented 12% of
revenue (2012: 12%). Further investment into the A560 cabinet range with the addition of a Slant Top bench model and a 32”
LCD slimline (SL) upright is designed to enhance game presentation and leverage off the intellectual property in the A560
game library. These hardware initiatives have allowed for an expanded library of the Premium Plus range of recurring
revenue games targeted for international markets.
Administration costs were $15.2 million, an increase of $2.8 million (23%) compared to 2012. The costs represented 8% of
total revenue, no change from 8% in 2012. This increase was primarily due to the full year impact of expansion of the
American facility established in FY12 which accounted for 57% of the overall increase. The Group has now established the
USA infrastructure necessary to support the expected expansion in targeted international markets.
Financing income and costs
Net financing income was $6.2 million in the current period, a positive movement of $10.3 million on the net financing costs of
$4.1 million in 2012. This movement was a result of net foreign exchange gains of $2.9 million (2012: $0.5 million), a
reduction in interest costs of $6.0 million as a result of debt reduction initiatives undertaken in 2012 and interest income
earned on cash deposits and trade receivables of $3.3 million, an increase of $1.8 million on 2012.
Significant changes in the state of affairs
Investment in research and development continues to help ensure new initiatives positively affect future product performance.
Further investment within the Americas was undertaken in the 2013 financial year to ensure the Group is positioned to
capitalise on the significant opportunities within this region.
The high yielding performance of the Group’s current range of products combined with further development and release of
new products in selected markets is expected to enable the Group to further improve financial results.
Other than the matters noted above, there were no significant changes in the state of affairs of the Group during the financial
year.
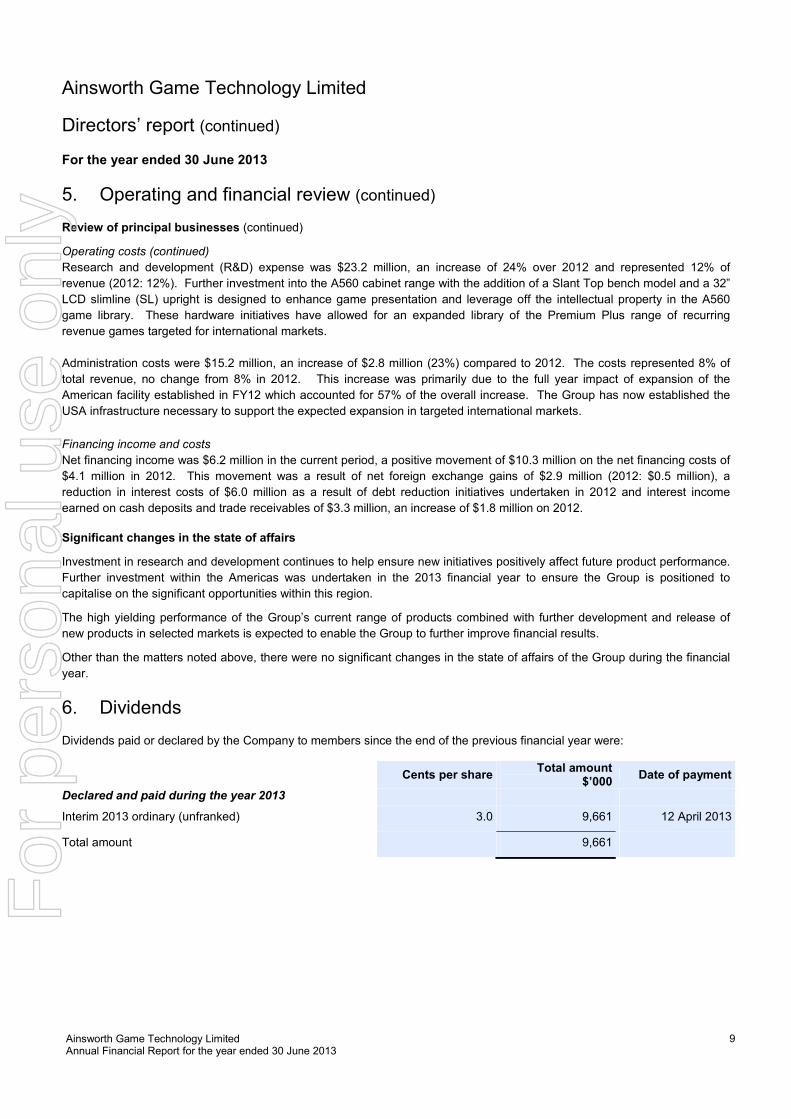
6. Dividends
Dividends paid or declared by the Company to members since the end of the previous financial year were:
Cents per share
Total amount $’000
Date of payment
Declared and paid during the year 2013
Interim 2013 ordinary (unfranked) 3.0 9,661 12 April 2013
Total amount 9,661
For
per
sona
l use
onl
y

Ainsworth Game Technology Limited Annual Financial Report for the year ended 30 June 2013
10
Ainsworth Game Technology Limited
Directors’ report (continued) For the year ended 30 June 2013
6. Dividends (continued)
Declared after end of year
After the balance sheet date the following dividend was declared by the directors.
Cents per share
Total amount $’000
Date of payment
Final ordinary (unfranked) 5.0 16,101 27 September 2013
Total amount 16,101
The financial effect of this dividend has not been brought to account in the consolidated financial statements for the year
ended 30 June 2013 and will be recognised in subsequent financial reports, and there are no income tax consequences.
7. Events subsequent to reporting date
After the reporting date, the Company declared an unfranked dividend of 5 cents per ordinary share amounting to
$16,101,000 with an expected payment date of 27 September 2013. The financial effect of this dividend has not been brought
to account in the financial statements for the year ended 30 June 2013 and will be recognised in subsequent financial reports.
Subsequent to 30 June 2013 the Group acquired approximately 24 acres of vacant land in Las Vegas, Nevada for US$7.0
million. This acquisition will allow the Group the option to build a bigger purpose built facility in Las Vegas prior to the
expiration of the current lease in November 2016.
In addition to the above and subsequent to the reporting date the Company has established an unsecured multi-option
currency facility of $30 million for an initial term of three years with the Australia and New Zealand Banking Group (ANZ)
consistent with strategies outlined in 2012. This facility will ensure additional flexibility to manage working capital, ensure over
time an appropriate mix of debt on the balance sheet and assist in creating a natural hedge against adverse foreign currency
movements.
Other than matters discussed above, there has not arisen in the interval between the end of the financial year and the date of
this report any item, transaction or event of a material and unusual nature likely, in the opinion of the directors of the
Company, to affect significantly the operations of the Group, the results of those operations, or the state of affairs of the
Group, in future financial years.
8. Likely developments
The Group will evaluate and pursue further product approvals to help ensure sustainable revenue growth and continued
financial improvement in future periods. This strategy is aimed at achieving increased market share in selected geographical
business sectors so as to positively contribute to Group results in future financial years.
The presence in the Americas through the Las Vegas, Nevada facility and release of new product initiatives is expected to help
ensure sustainable revenue growth.
Further information about likely developments in the operations of the Group and the expected results of those operations in
future financial years has not been included in this report because disclosure of the information would be likely to result in
unreasonable prejudice to the Group.
For
per
sona
l use
onl
y
Ainsworth Game Technology Limited Annual Financial Report for the year ended 30 June 2013
11
Ainsworth Game Technology Limited
Directors’ report (continued) For the year ended 30 June 2013
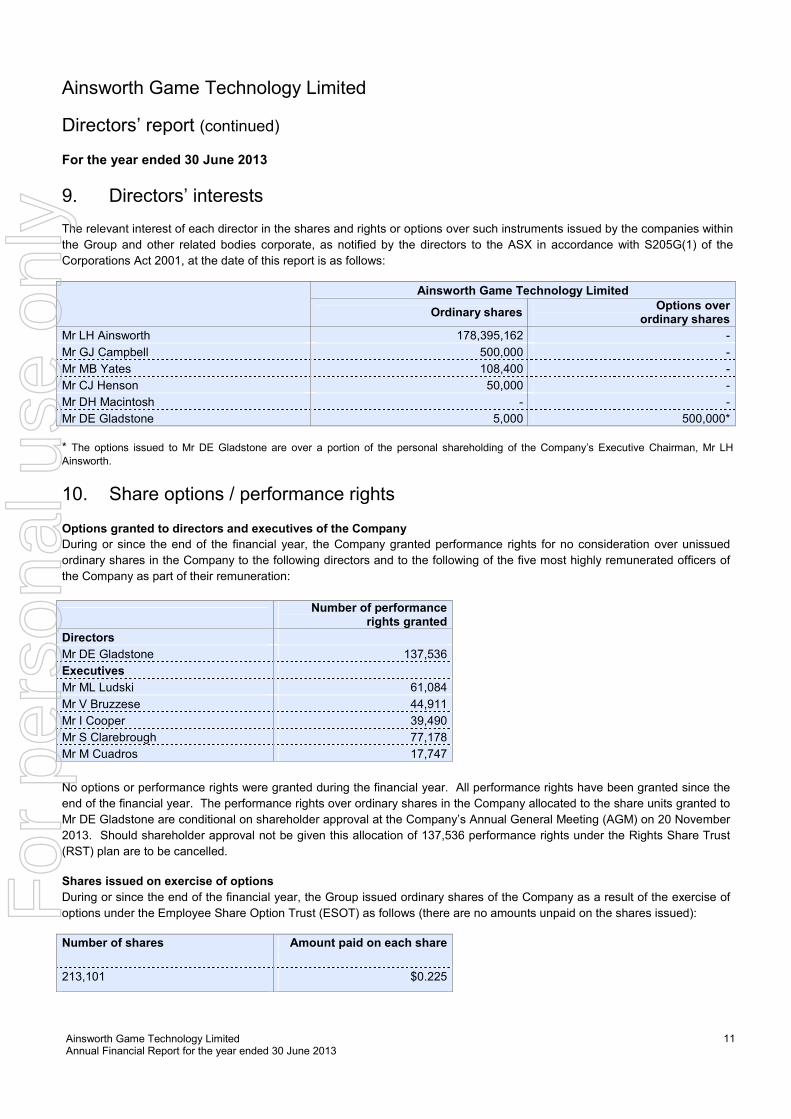
9. Directors’ interests
The relevant interest of each director in the shares and rights or options over such instruments issued by the companies within
the Group and other related bodies corporate, as notified by the directors to the ASX in accordance with S205G(1) of the
Corporations Act 2001, at the date of this report is as follows:
Ainsworth Game Technology Limited
Ordinary shares Options over
ordinary shares
Mr LH Ainsworth 178,395,162 -
Mr GJ Campbell 500,000 -
Mr MB Yates 108,400 -
Mr CJ Henson 50,000 -
Mr DH Macintosh - -
Mr DE Gladstone 5,000 500,000* * The options issued to Mr DE Gladstone are over a portion of the personal shareholding of the Company’s Executive Chairman, Mr LH
Ainsworth.
10. Share options / performance rights
Options granted to directors and executives of the Company
During or since the end of the financial year, the Company granted performance rights for no consideration over unissued
ordinary shares in the Company to the following directors and to the following of the five most highly remunerated officers of
the Company as part of their remuneration:
Number of performance
rights granted
Directors
Mr DE Gladstone 137,536
Executives
Mr ML Ludski 61,084
Mr V Bruzzese 44,911
Mr I Cooper 39,490
Mr S Clarebrough 77,178
Mr M Cuadros 17,747
No options or performance rights were granted during the financial year. All performance rights have been granted since the
end of the financial year. The performance rights over ordinary shares in the Company allocated to the share units granted to
Mr DE Gladstone are conditional on shareholder approval at the Company’s Annual General Meeting (AGM) on 20 November
2013. Should shareholder approval not be given this allocation of 137,536 performance rights under the Rights Share Trust
(RST) plan are to be cancelled.
Shares issued on exercise of options
During or since the end of the financial year, the Group issued ordinary shares of the Company as a result of the exercise of
options under the Employee Share Option Trust (ESOT) as follows (there are no amounts unpaid on the shares issued):
Number of shares Amount paid on each share
213,101 $0.225
For
per
sona
l use
onl
y
Ainsworth Game Technology Limited Annual Financial Report for the year ended 30 June 2013
12
Ainsworth Game Technology Limited
Directors’ report (continued) For the year ended 30 June 2013
10. Share options / performance rights (continued)
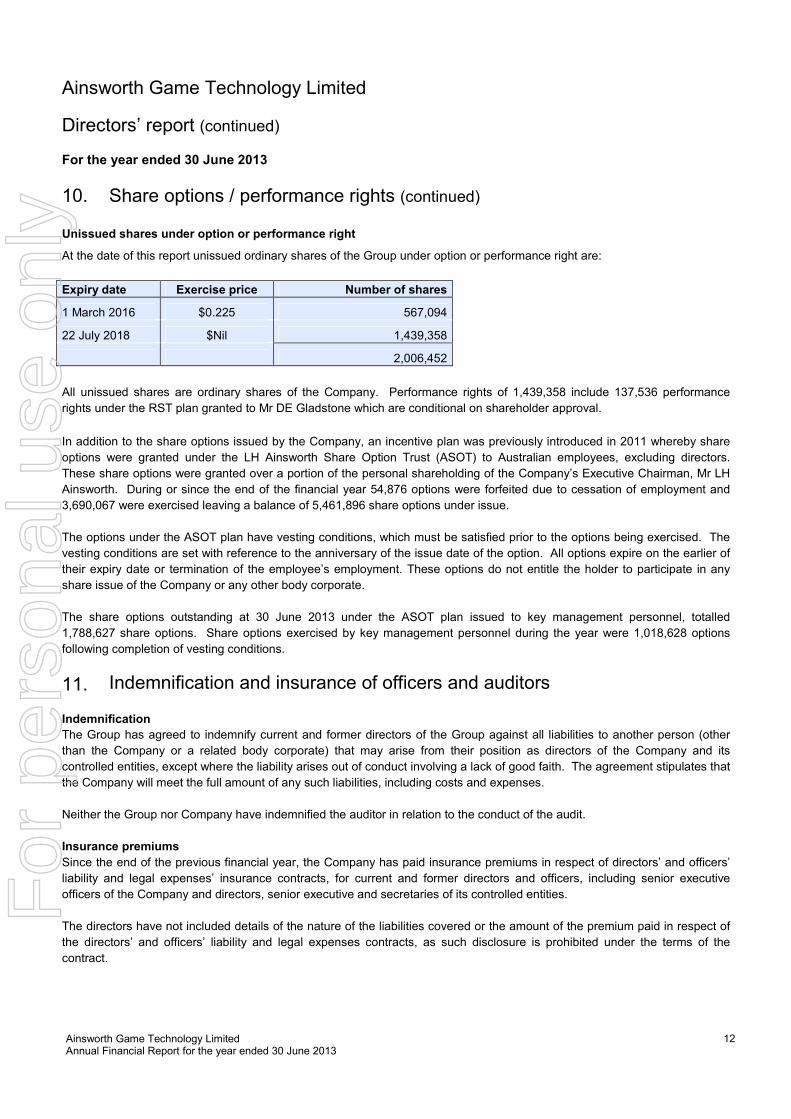
Unissued shares under option or performance right
At the date of this report unissued ordinary shares of the Group under option or performance right are:
Expiry date Exercise price Number of shares
1 March 2016 $0.225 567,094
22 July 2018 $Nil 1,439,358
2,006,452
All unissued shares are ordinary shares of the Company. Performance rights of 1,439,358 include 137,536 performance
rights under the RST plan granted to Mr DE Gladstone which are conditional on shareholder approval.
In addition to the share options issued by the Company, an incentive plan was previously introduced in 2011 whereby share
options were granted under the LH Ainsworth Share Option Trust (ASOT) to Australian employees, excluding directors.
These share options were granted over a portion of the personal shareholding of the Company’s Executive Chairman, Mr LH
Ainsworth. During or since the end of the financial year 54,876 options were forfeited due to cessation of employment and
3,690,067 were exercised leaving a balance of 5,461,896 share options under issue.
The options under the ASOT plan have vesting conditions, which must be satisfied prior to the options being exercised. The
vesting conditions are set with reference to the anniversary of the issue date of the option. All options expire on the earlier of
their expiry date or termination of the employee’s employment. These options do not entitle the holder to participate in any
share issue of the Company or any other body corporate.
The share options outstanding at 30 June 2013 under the ASOT plan issued to key management personnel, totalled
1,788,627 share options. Share options exercised by key management personnel during the year were 1,018,628 options
following completion of vesting conditions.
11. Indemnification and insurance of officers and auditors Indemnification
The Group has agreed to indemnify current and former directors of the Group against all liabilities to another person (other
than the Company or a related body corporate) that may arise from their position as directors of the Company and its
controlled entities, except where the liability arises out of conduct involving a lack of good faith. The agreement stipulates that
the Company will meet the full amount of any such liabilities, including costs and expenses.
Neither the Group nor Company have indemnified the auditor in relation to the conduct of the audit.
Insurance premiums
Since the end of the previous financial year, the Company has paid insurance premiums in respect of directors’ and officers’
liability and legal expenses’ insurance contracts, for current and former directors and officers, including senior executive
officers of the Company and directors, senior executive and secretaries of its controlled entities.
The directors have not included details of the nature of the liabilities covered or the amount of the premium paid in respect of
the directors’ and officers’ liability and legal expenses contracts, as such disclosure is prohibited under the terms of the
contract.
For
per
sona
l use
onl
y
Ainsworth Game Technology Limited Annual Financial Report for the year ended 30 June 2013
13
Ainsworth Game Technology Limited
Directors’ report (continued) For the year ended 30 June 2013
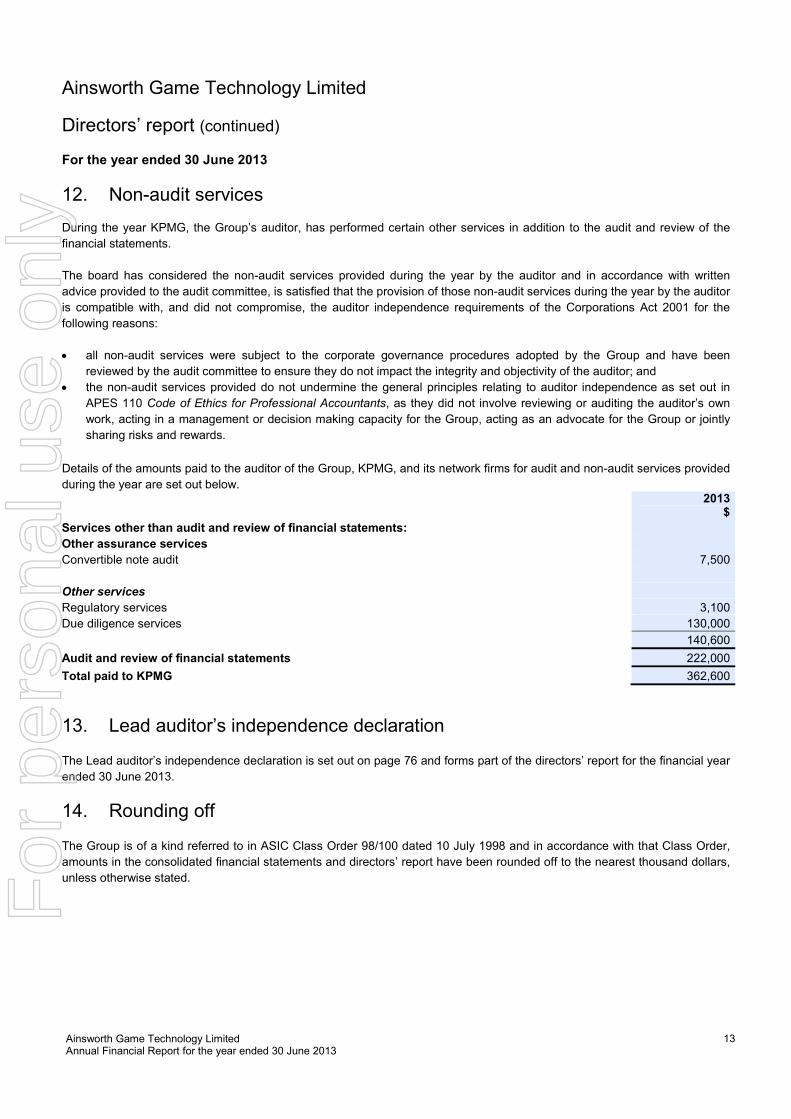
12. Non-audit services
During the year KPMG, the Group’s auditor, has performed certain other services in addition to the audit and review of the
financial statements.
The board has considered the non-audit services provided during the year by the auditor and in accordance with written
advice provided to the audit committee, is satisfied that the provision of those non-audit services during the year by the auditor
is compatible with, and did not compromise, the auditor independence requirements of the Corporations Act 2001 for the
following reasons:
• all non-audit services were subject to the corporate governance procedures adopted by the Group and have been
reviewed by the audit committee to ensure they do not impact the integrity and objectivity of the auditor; and
• the non-audit services provided do not undermine the general principles relating to auditor independence as set out in
APES 110 Code of Ethics for Professional Accountants, as they did not involve reviewing or auditing the auditor’s own
work, acting in a management or decision making capacity for the Group, acting as an advocate for the Group or jointly
sharing risks and rewards.
Details of the amounts paid to the auditor of the Group, KPMG, and its network firms for audit and non-audit services provided
during the year are set out below.
2013 $
Services other than audit and review of financial statements:
Other assurance services
Convertible note audit 7,500
Other services
Regulatory services 3,100
Due diligence services 130,000
140,600
Audit and review of financial statements 222,000
Total paid to KPMG 362,600
13. Lead auditor’s independence declaration The Lead auditor’s independence declaration is set out on page 76 and forms part of the directors’ report for the financial year
ended 30 June 2013.
14. Rounding off
The Group is of a kind referred to in ASIC Class Order 98/100 dated 10 July 1998 and in accordance with that Class Order,
amounts in the consolidated financial statements and directors’ report have been rounded off to the nearest thousand dollars,
unless otherwise stated.
For
per
sona
l use
onl
y
Ainsworth Game Technology Limited Annual Financial Report for the year ended 30 June 2013
14
Ainsworth Game Technology Limited
Directors’ report (continued)
For the year ended 30 June 2013
15. Remuneration report – audited
15.1 Principles of compensation - audited
Remuneration is referred to as compensation throughout this report.
Key management personnel have authority and responsibility for planning, directing and controlling the activities of the
Group, including directors of the Company and other executives. Key management personnel comprise the directors of the
Company and senior executives for the Group.
Compensation levels for key management personnel and secretaries of the Group are competitively set to attract and retain
appropriately qualified and experienced directors and executives. The remuneration and nomination committee reviews
market surveys on the appropriateness of compensation packages of the Group given trends in comparative companies both
locally and internationally, and the objectives of the Group’s compensation strategy.
The compensation structures explained below are designed to attract suitably qualified candidates, reward the achievement
of strategic objectives, and achieve the broader outcome of creation of value for shareholders. The compensation structures
take into account:
• the capability and experience of the key management personnel;
• the key management personnel’s performance against Key Performance Indicators (KPIs) and individual contributions to
the Group’s performance;
• the Group’s performance including:
- revenue and earnings;
- growth in share price and delivering returns on shareholder wealth; and
- the amount of incentives within each key management person’s compensation.
Compensation packages include a mix of fixed and variable compensation and short-term and long-term performance-based
incentives.
In addition to their salaries, the Group also provides non-cash benefits to its key management personnel, and contributes to
post-employment defined contribution superannuation plans on their behalf.
Fixed compensation
Fixed compensation consists of base compensation (which is calculated on a total cost basis and includes any FBT charges
related to employee benefits including motor vehicles), as well as employer contributions to superannuation funds.
Compensation levels are reviewed annually by the remuneration and nomination committee through a process that considers
individual, segment and overall performance of the Group. In addition market surveys are obtained to provide further
analysis so as to ensure the directors’ and senior executives’ compensation is competitive in the market place. A senior
executive’s compensation is also reviewed on promotion and performance.
Performance linked compensation
Performance linked compensation includes both short-term and long-term incentives and is designed to reward key
management personnel for meeting or exceeding their financial and personal objectives. The short-term incentive (STI) is an
‘at risk’ bonus provided in the form of cash, while the long-term incentive (LTI) is provided as options or performance rights
over ordinary shares of the Company under the rules of the Employee Share Option Plans (see note 23 to financial
statements).
In addition to their salaries, selected key sales management personnel receive commission on sales within their specific
business segments as part of their service contracts at each vesting date.
For
per
sona
l use
onl
y
Ainsworth Game Technology Limited Annual Financial Report for the year ended 30 June 2013
15
Ainsworth Game Technology Limited
Directors’ report (continued)
For the year ended 30 June 2013
15. Remuneration report – audited (continued)
15.1 Principles of compensation – audited (continued) Short-term incentive bonus
Each year the remuneration and nomination committee sets the KPIs for the key management personnel. The KPIs
generally include measures relating to the Group, the relevant segment, and the individual, and include financial, people,
customer, strategy and risk measures. The measures are chosen as they directly align the individual’s reward to the KPIs of
the Group and to its strategy and performance.
The financial performance objective is ‘profit before tax’ excluding foreign currency gains / (losses) and any extra-ordinary
items (e.g., the profit on sale in the 2012 financial year following the sale and leaseback of the Company’s property), which is
compared to budgeted amounts. This objective is designed to reward key management personnel for the Group’s
performance and not simply the achievement of individual segment results. The non-financial objectives vary with position
and responsibility and include measures such as achieving strategic outcomes, safety measures, and compliance with
established regulatory processes, customer satisfaction and staff development.
At the end of the financial year the remuneration and nomination committee assesses the actual performance of the Group,
the relevant segment and individual against the KPI’s set at the beginning of the financial year. A pre-determined maximum
amount is awarded depending on results with an additional amount awarded for stretch performance. No bonus is awarded
where performance falls below the minimum performance established. The performance evaluation in respect of the year
ended 30 June 2013 has taken place in accordance with this process.
The remuneration and nomination committee recommends the cash incentive to be paid to the individuals for approval by the
board. The method of assessment was chosen as it provides the Committee with an objective assessment of the individual’s
performance.
For the year ended 30 June 2013, the Group exceeded the minimum performance targets outlined in the incentive plan
approved by the Board in November 2012, with most segments exceeding operational targets. This resulted in short-term
incentives being earned during 2013 and confirmed by the Board on 27 August 2013. Currently, the performance linked
component of compensation comprises approximately 35% (2012: 45%) of total payments to key management personnel.
Long-term incentive
There were two share option schemes in place during the 2013 financial year. Options for new shares were issued under an
Employee Share Option Trust (ESOT) to American employees. Additionally, there is an option scheme entitling Australian
employees to options over a number of existing shares personally held by the Company’s Executive Chairman, Mr LH
Ainsworth under the LH Ainsworth Share Option Trust (ASOT). These share option plans provide for employees to receive
options over new or existing ordinary shares at a pre-determined exercise price. The ability to exercise the options is
conditional on continuation of employment.
Since the reporting date a new employee incentive plan was established whereby performance rights were granted under the
Rights Share Trust (RST). Under the RST eligible employees were allocated performance rights over ordinary shares in the
Company. The performance rights were granted at nil consideration or exercise price however are dependent on service
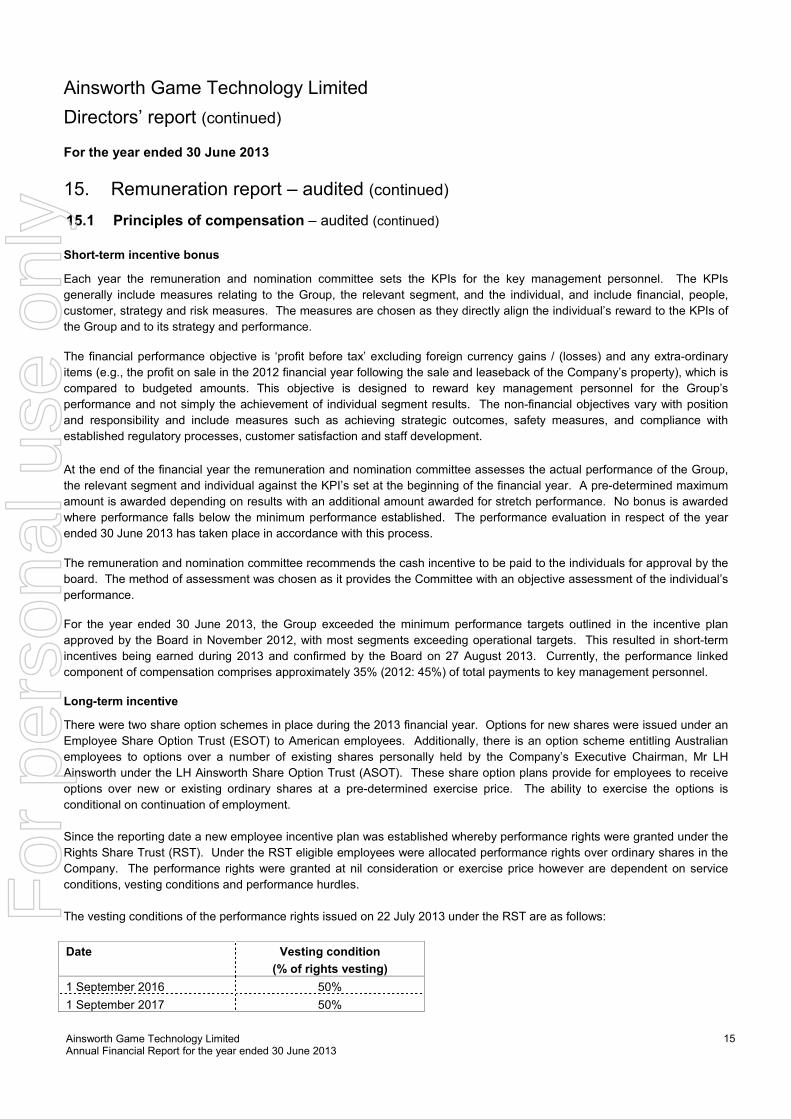
conditions, vesting conditions and performance hurdles.
The vesting conditions of the performance rights issued on 22 July 2013 under the RST are as follows:
Date Vesting condition
(% of rights vesting)
1 September 2016 50%
1 September 2017 50%
For
per
sona
l use
onl
y
Ainsworth Game Technology Limited Annual Financial Report for the year ended 30 June 2013
16
Ainsworth Game Technology Limited
Directors’ report (continued)
For the year ended 30 June 2013
15. Remuneration report – audited (continued)
15.1 Principles of compensation – audited (continued) Long-term incentive (continued)
In addition to the vesting conditions above, specific performance hurdles relative to Total Shareholder Return (TSR) relative
targets and Earnings Per Share (EPS) targets are required to be met.
The Group prohibits employees that are granted share-based payments as part of their remuneration from entering into other
arrangements that limit their exposure to losses that would result from share price decreases. Entering into such
arrangements has been prohibited by law since 1 July 2011.
Short-term and long-term incentive structure
The remuneration and nomination committee considers that the above performance-linked remuneration structure is
appropriate because it is designed to maximise the Group’s performance.
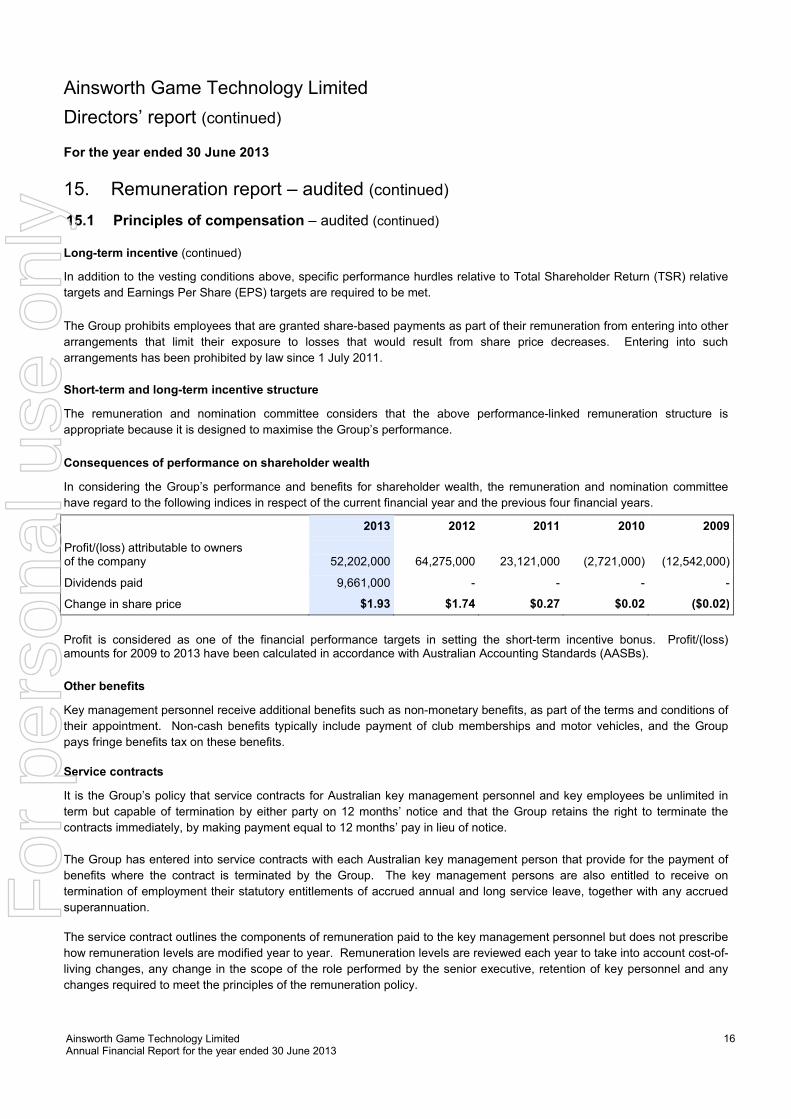
Consequences of performance on shareholder wealth
In considering the Group’s performance and benefits for shareholder wealth, the remuneration and nomination committee
have regard to the following indices in respect of the current financial year and the previous four financial years.
Profit is considered as one of the financial performance targets in setting the short-term incentive bonus. Profit/(loss) amounts for 2009 to 2013 have been calculated in accordance with Australian Accounting Standards (AASBs).
Other benefits
Key management personnel receive additional benefits such as non-monetary benefits, as part of the terms and conditions of
their appointment. Non-cash benefits typically include payment of club memberships and motor vehicles, and the Group
pays fringe benefits tax on these benefits.
Service contracts
It is the Group’s policy that service contracts for Australian key management personnel and key employees be unlimited in
term but capable of termination by either party on 12 months’ notice and that the Group retains the right to terminate the
contracts immediately, by making payment equal to 12 months’ pay in lieu of notice.
The Group has entered into service contracts with each Australian key management person that provide for the payment of
benefits where the contract is terminated by the Group. The key management persons are also entitled to receive on
termination of employment their statutory entitlements of accrued annual and long service leave, together with any accrued
superannuation.
The service contract outlines the components of remuneration paid to the key management personnel but does not prescribe
how remuneration levels are modified year to year. Remuneration levels are reviewed each year to take into account cost-of-
living changes, any change in the scope of the role performed by the senior executive, retention of key personnel and any
changes required to meet the principles of the remuneration policy.
2013 2012 2011 2010 2009
Profit/(loss) attributable to owners of the company
52,202,000
64,275,000
23,121,000
(2,721,000)
(12,542,000)
Dividends paid 9,661,000 - - - -
Change in share price $1.93 $1.74 $0.27 $0.02 ($0.02)
For
per
sona
l use
onl
y
Ainsworth Game Technology Limited Annual Financial Report for the year ended 30 June 2013
17
Ainsworth Game Technology Limited
Directors’ report (continued)
For the year ended 30 June 2013
15. Remuneration report – audited (continued)
15.1 Principles of compensation – audited (continued) Service contracts (continued)
Mr Danny Gladstone, Executive Director and Chief Executive Officer (CEO), has a contract of employment dated 5 February
2007 and amended on 7 December 2010 with the Company. The contract specifies the duties and obligations to be fulfilled
by the CEO and provides that the board and CEO will early in each financial year, consult and agree objectives for
achievement during that year.
The CEO has no entitlement to a termination payment in the event of removal for misconduct as specified in his service
contract.
Refer to note 28 of the financial statements for details on the financial impact in future periods resulting from the Group’s
commitments arising from non-cancellable contracts for services with key management personnel.
Non-executive directors
Total compensation for all non-executive directors, last voted upon by shareholders at the 2012 Annual General Meeting, is
not to exceed $850,000 per annum, with effect from 1 July 2012. Directors’ base fees are presently $100,000 per annum
(excluding superannuation) and is set based on a review of fees paid to other non-executive directors of comparable
companies. The fees paid to non-executive directors reflect the demands and responsibilities associated with their roles and
the global nature of the operations within the highly regulated environment within which the Group operates. Fees
incorporate an allowance for the onerous probity requirements placed on non-executive directors by regulators of the
jurisdictions in which the Group operates or proposes to operate in. In addition to these fees the cost of reasonable
expenses are reimbursed as incurred.
Non-executive directors do not currently receive or participate in any performance related compensation.
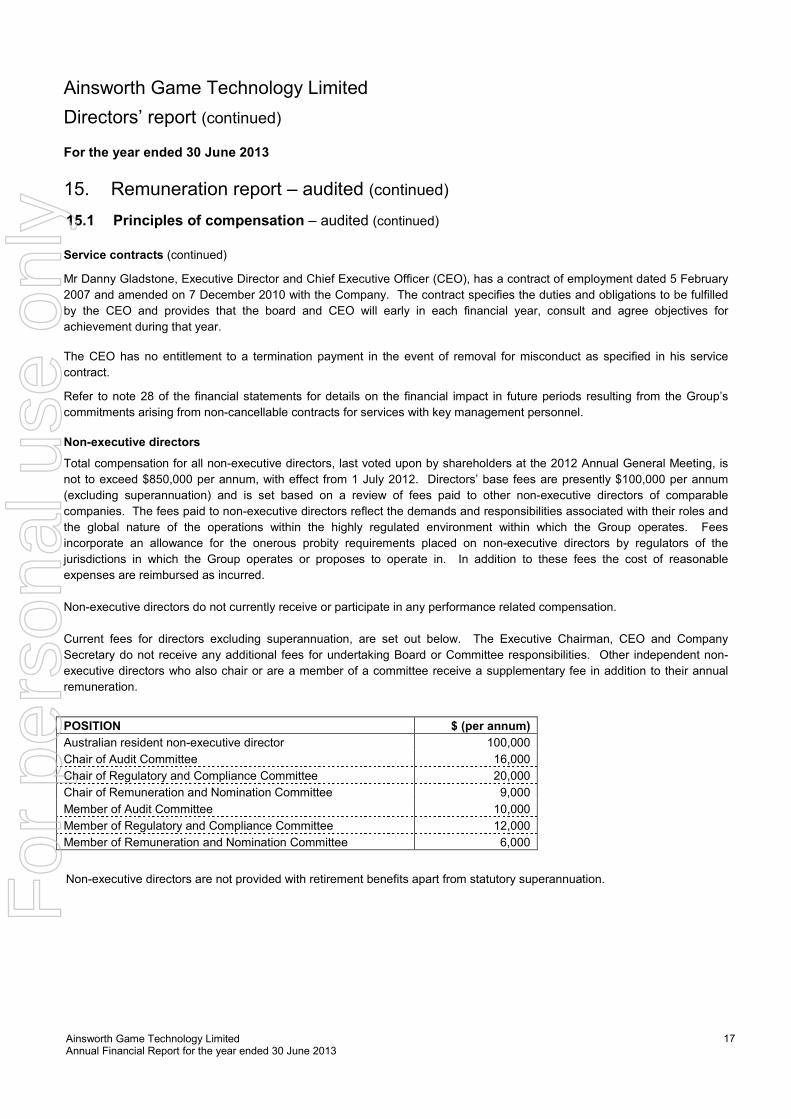
Current fees for directors excluding superannuation, are set out below. The Executive Chairman, CEO and Company
Secretary do not receive any additional fees for undertaking Board or Committee responsibilities. Other independent non-
executive directors who also chair or are a member of a committee receive a supplementary fee in addition to their annual
remuneration.
POSITION $ (per annum)
Australian resident non-executive director 100,000
Chair of Audit Committee 16,000
Chair of Regulatory and Compliance Committee 20,000
Chair of Remuneration and Nomination Committee 9,000
Member of Audit Committee 10,000
Member of Regulatory and Compliance Committee 12,000
Member of Remuneration and Nomination Committee 6,000
Non-executive directors are not provided with retirement benefits apart from statutory superannuation.
For
per
sona
l use
onl
y
Ainsworth Game Technology Limited Annual Financial Report for the year ended 30 June 2013
18
Ainsworth Game Technology Limited
Directors’ report (continued)
For the year ended 30 June 2013
15. Remuneration report – audited (continued)
15.1 Principles of compensation – audited (continued) Services from remuneration consultants
The remuneration and nomination committee, comprising of independent non-executive directors only, engaged CRA Plan
Managers Pty Ltd (CRA) as remuneration consultant to the board to review the amount and elements of the key management
personnel remuneration and provide recommendations in relation thereto.
CRA was paid $13,445 for the remuneration recommendations in respect of their review.
In addition to CRA the remuneration and nomination committee similarly engaged Remuneration Strategies Group (RSG) to
undertake the review and introduction of a Long Term Incentive Plan (LTI).
RSG was paid $5,000 for the remuneration recommendation in respect of reviewing the amount and elements of the new LTI
(RST) introduced on 22 July 2013. RSG was paid $8,700 in total for all services, including services in relation to previous
incentive plans.
The engagement of CRA and RSG by the remuneration and nomination committee was subject to protocols to be followed by
CRA and RSG, members of the remuneration and nomination committee and members of the key management personnel for
the way in which remuneration recommendations would be developed and provided to the board.
The protocols included the prohibition of CRA and RSG providing advice or recommendations to key management personnel
before the advice or recommendations were given to members of the remuneration and nomination committee and not unless
they had approval to do so from members of the remuneration and nomination committee.
These arrangements were implemented to ensure that CRA and RSG would be able to carry out their work, including
information capture and the formation of its recommendations, free from undue influence by members of the key
management personnel about whom the recommendations may relate.
The board is satisfied that the remuneration recommendations were made by CRA and RSG free from undue influence by
members of the key management personnel about whom the recommendations may relate.
The board undertook its own inquiries and review of the processes and procedures followed by CRA and RSG during the
course of their assignment and is satisfied that its remuneration recommendations were made free from undue influence.
These inquiries included arrangements under which CRA and RSG was required to provide the board with a summary of the
way in which it carried out its work, details of its interaction with key management personnel in relation to the assignment and
other services, and respond to questioning by members of the board after the completion of the assignment.
.
For
per
sona
l use
onl
y
Ainsworth Game Technology Limited Annual Financial Report for the year ended 30 June 2013
19
Ainsworth Game Technology Limited
Directors’ report (continued)
For the year ended 30 June 2013
15. Remuneration report – audited (continued)
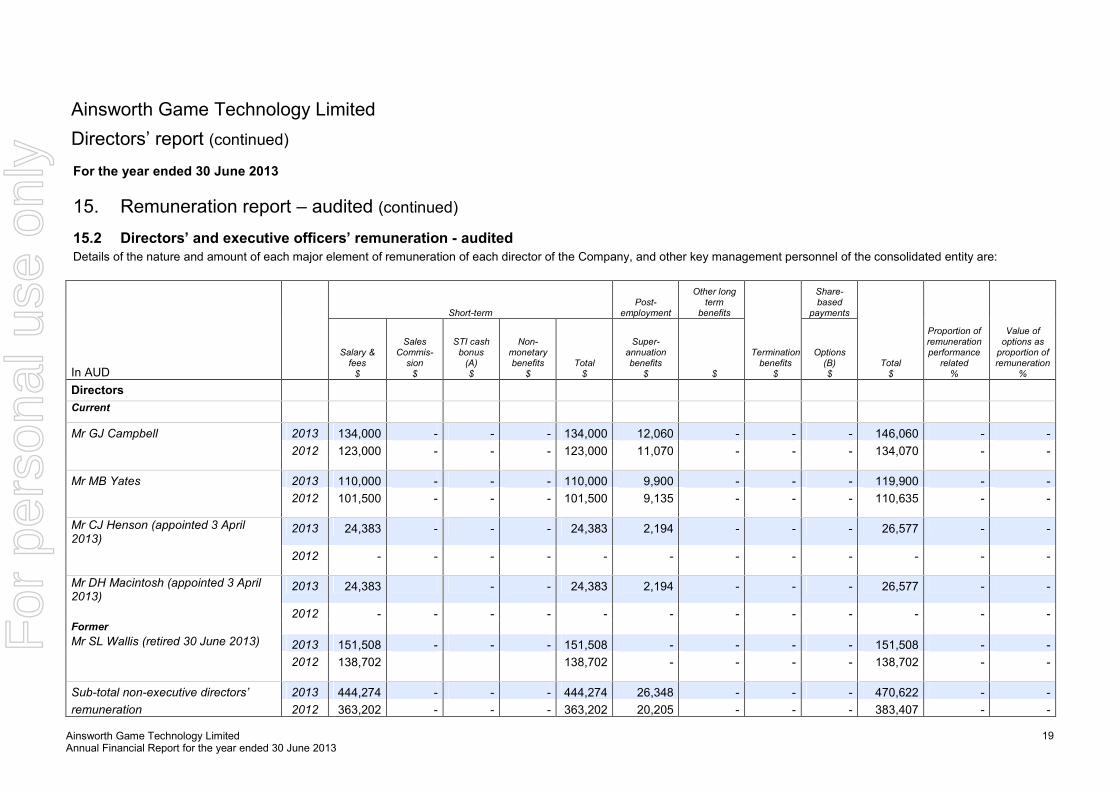
15.2 Directors’ and executive officers’ remuneration - audited Details of the nature and amount of each major element of remuneration of each director of the Company, and other key management personnel of the consolidated entity are:
Short-term Post-
employment
Other long term
benefits
Termination benefits
$
Share-based
payments
Total $
Proportion of remuneration performance
related %
Value of options as proportion of remuneration
%
In AUD
Salary & fees $
Sales Commis-sion $
STI cash bonus (A) $
Non-monetary benefits
$ Total $
Super-annuation benefits
$ $
Options (B) $
Directors
Current Mr GJ Campbell 2013 134,000 - - - 134,000 12,060 - - - 146,060 - -
2012 123,000 - - - 123,000 11,070 - - - 134,070 - -
Mr MB Yates 2013 110,000 - - - 110,000 9,900 - - - 119,900 - -
2012 101,500 - - - 101,500 9,135 - - - 110,635 - -
Mr CJ Henson (appointed 3 April 2013)
2013 24,383 - - - 24,383 2,194 - - - 26,577 - -
2012 - - - - - - - - - - - -
Mr DH Macintosh (appointed 3 April 2013)
2013 24,383 - - 24,383 2,194 - - - 26,577 - -
2012 - - - - - - - - - - - - Former Mr SL Wallis (retired 30 June 2013) 2013 151,508 - - - 151,508 - - - - 151,508 - - 2012 138,702 138,702 - - - - 138,702 - -
Sub-total non-executive directors’ 2013 444,274 - - - 444,274 26,348 - - - 470,622 - -
remuneration 2012 363,202 - - - 363,202 20,205 - - - 383,407 - -
For
per
sona
l use
onl
y
Ainsworth Game Technology Limited Annual Financial Report for the year ended 30 June 2013
20
Ainsworth Game Technology Limited
Directors’ report (continued)
For the year ended 30 June 2013
15. Remuneration report - audited (continued)
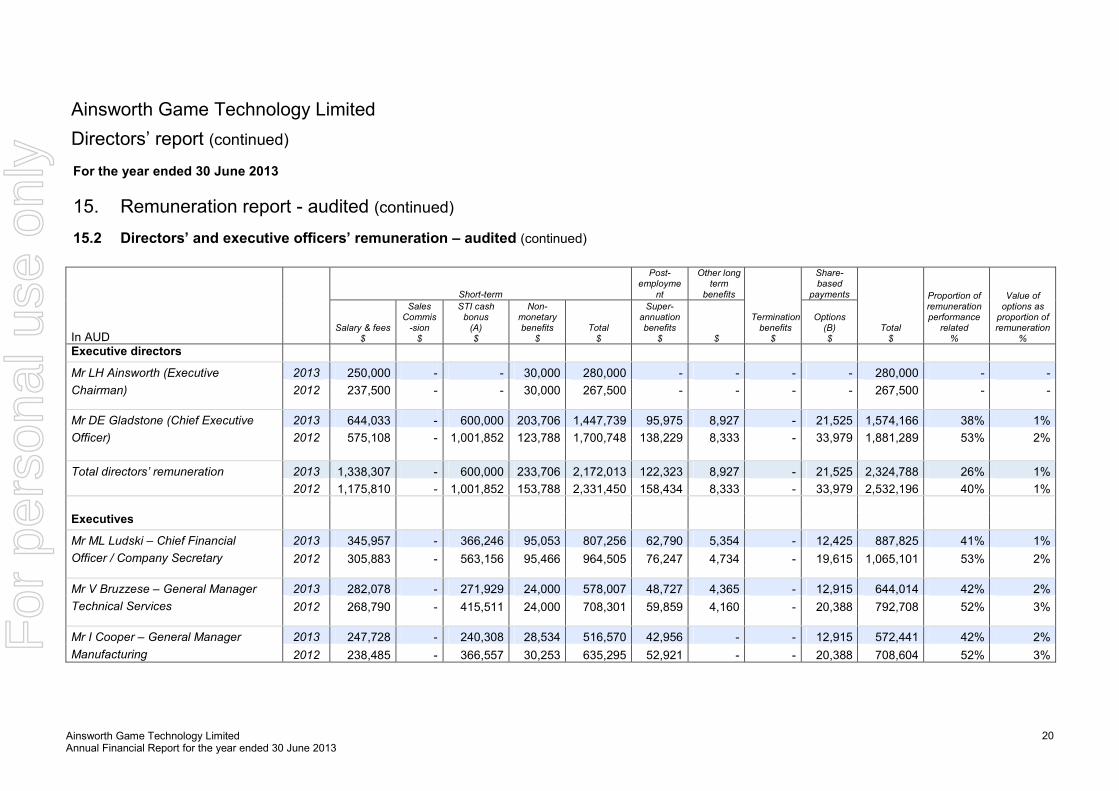
15.2 Directors’ and executive officers’ remuneration – audited (continued)
Short-term
Post-employme
nt
Other long term
benefits
Share-based
payments
Total $
Proportion of remuneration performance
related %
Value of options as proportion of remuneration
%
In AUD
Salary & fees $
Sales Commis-sion $
STI cash bonus (A) $
Non-monetary benefits
$ Total $
Super-annuation benefits
$ $
Termination benefits $
Options (B) $
Executive directors
Mr LH Ainsworth (Executive 2013 250,000 - - 30,000 280,000 - - - - 280,000 - -
Chairman) 2012 237,500 - - 30,000 267,500 - - - - 267,500 - -
Mr DE Gladstone (Chief Executive 2013 644,033 - 600,000 203,706 1,447,739 95,975 8,927 - 21,525 1,574,166 38% 1%
Officer) 2012 575,108 - 1,001,852 123,788 1,700,748 138,229 8,333 - 33,979 1,881,289 53% 2%
Total directors’ remuneration 2013 1,338,307 - 600,000 233,706 2,172,013 122,323 8,927 - 21,525 2,324,788 26% 1%
2012 1,175,810 - 1,001,852 153,788 2,331,450 158,434 8,333 - 33,979 2,532,196 40% 1%
Executives
Mr ML Ludski – Chief Financial
Officer / Company Secretary
2013 345,957 - 366,246 95,053 807,256 62,790 5,354 - 12,425 887,825 41% 1%
2012 305,883 - 563,156 95,466 964,505 76,247 4,734 - 19,615 1,065,101 53% 2%
Mr V Bruzzese – General Manager
Technical Services
2013 282,078 - 271,929 24,000 578,007 48,727 4,365 - 12,915 644,014 42% 2%
2012 268,790 - 415,511 24,000 708,301 59,859 4,160 - 20,388 792,708 52% 3%
Mr I Cooper – General Manager
Manufacturing
2013 247,728 - 240,308 28,534 516,570 42,956 - - 12,915 572,441 42% 2%
2012 238,485 - 366,557 30,253 635,295 52,921 - - 20,388 708,604 52% 3%
For
per
sona
l use
onl
y
Ainsworth Game Technology Limited Annual Financial Report for the year ended 30 June 2013
21
Ainsworth Game Technology Limited
Directors’ report (continued)
For the year ended 30 June 2013
15. Remuneration report – audited (continued)
15.2 Directors’ and executive officers’ remuneration - audited (continued)
In AUD
Short-term
Post-employment
Other long term
benefits
Termination benefits
$
Share-based
payments
Total
$
Proportion of remuneration performance
related %
Value of options as proportion of remuneration
%
Salary & fees
$
Sales Commis-sion
$
STI cash bonus
(A)
$
Non-monetary benefits
$
Total
$
Super-annuation benefits
$ $
Options
(B)
$
Executives
Mr S Clarebrough - Group General Manager Strategy and Development
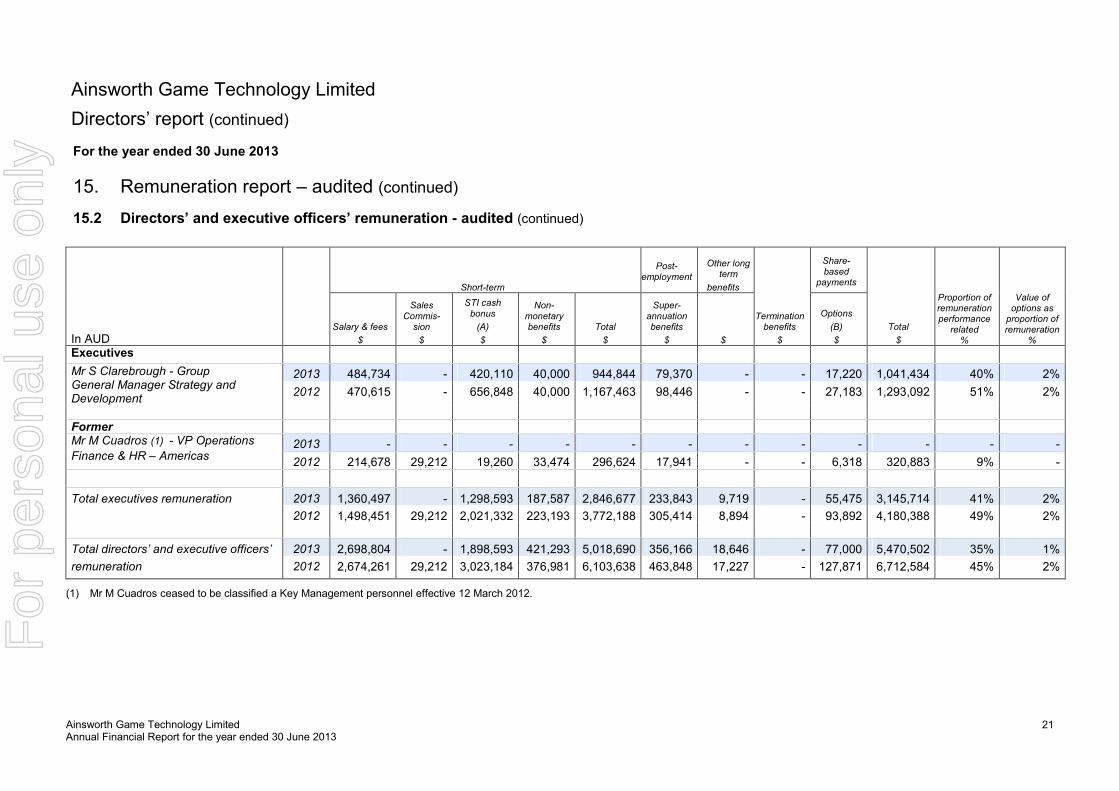
2013 484,734 - 420,110 40,000 944,844 79,370 - - 17,220 1,041,434 40% 2%
2012 470,615 - 656,848 40,000 1,167,463 98,446 - - 27,183 1,293,092 51% 2%
Former
Mr M Cuadros (1) - VP Operations
Finance & HR – Americas 2013 - - - - - - - - - - - -
2012 214,678 29,212 19,260 33,474 296,624 17,941 - - 6,318 320,883 9% -
Total executives remuneration 2013 1,360,497 - 1,298,593 187,587 2,846,677 233,843 9,719 - 55,475 3,145,714 41% 2%
2012 1,498,451 29,212 2,021,332 223,193 3,772,188 305,414 8,894 - 93,892 4,180,388 49% 2%
Total directors’ and executive officers’
remuneration
2013 2,698,804 - 1,898,593 421,293 5,018,690 356,166 18,646 - 77,000 5,470,502 35% 1%
2012 2,674,261 29,212 3,023,184 376,981 6,103,638 463,848 17,227 - 127,871 6,712,584 45% 2%
(1) Mr M Cuadros ceased to be classified a Key Management personnel effective 12 March 2012.
For
per
sona
l use
onl
y
Ainsworth Game Technology Limited Annual Financial Report for the year ended 30 June 2013
22
Ainsworth Game Technology Limited
Directors’ report (continued)
For the year ended 30 June 2013
15. Remuneration report – audited (continued)
15.2 Directors’ and executive officers’ remuneration - audited (continued)
Notes in relation to the table of directors’ and executive officers’ remuneration - audited
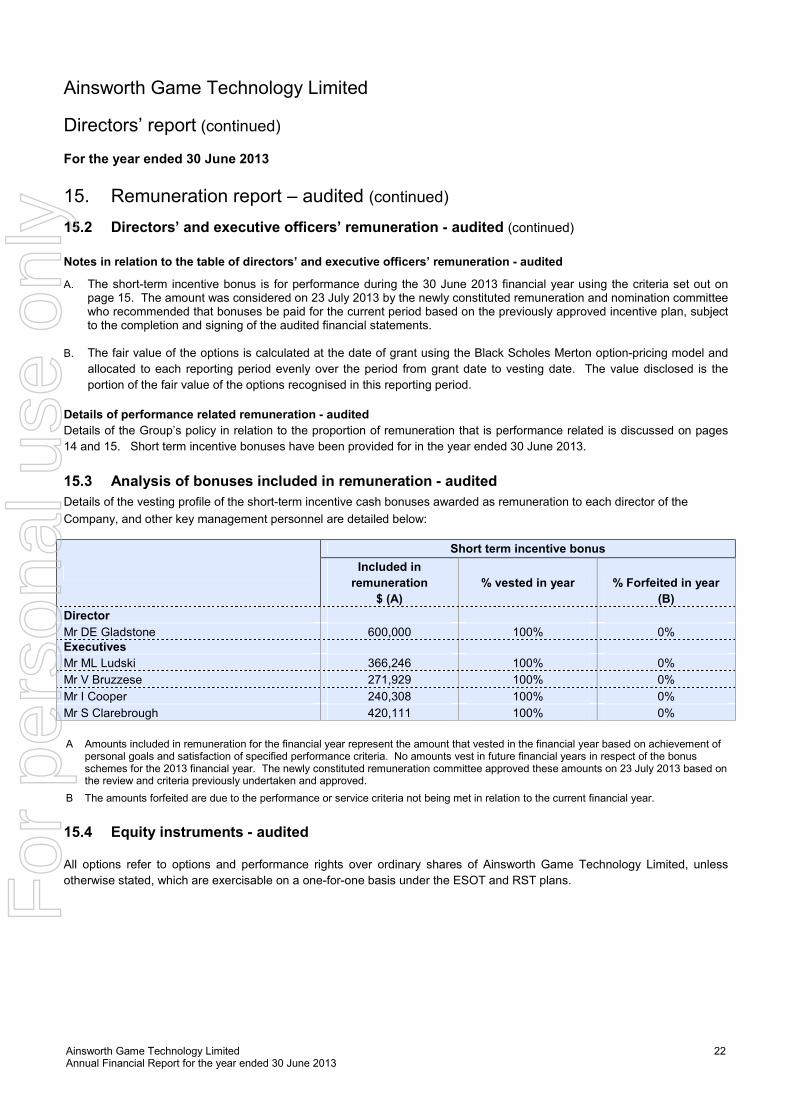
A. The short-term incentive bonus is for performance during the 30 June 2013 financial year using the criteria set out on page 15. The amount was considered on 23 July 2013 by the newly constituted remuneration and nomination committee who recommended that bonuses be paid for the current period based on the previously approved incentive plan, subject to the completion and signing of the audited financial statements.
B. The fair value of the options is calculated at the date of grant using the Black Scholes Merton option-pricing model and
allocated to each reporting period evenly over the period from grant date to vesting date. The value disclosed is the
portion of the fair value of the options recognised in this reporting period.
Details of performance related remuneration - audited
Details of the Group’s policy in relation to the proportion of remuneration that is performance related is discussed on pages
14 and 15. Short term incentive bonuses have been provided for in the year ended 30 June 2013.
15.3 Analysis of bonuses included in remuneration - audited
Details of the vesting profile of the short-term incentive cash bonuses awarded as remuneration to each director of the
Company, and other key management personnel are detailed below:
Short term incentive bonus
Included in
remuneration
$ (A)
% vested in year % Forfeited in year
(B)
Director
Mr DE Gladstone 600,000 100% 0% Executives
Mr ML Ludski 366,246 100% 0%
Mr V Bruzzese 271,929 100% 0%
Mr I Cooper 240,308 100% 0%
Mr S Clarebrough 420,111 100% 0%
A Amounts included in remuneration for the financial year represent the amount that vested in the financial year based on achievement of
personal goals and satisfaction of specified performance criteria. No amounts vest in future financial years in respect of the bonus schemes for the 2013 financial year. The newly constituted remuneration committee approved these amounts on 23 July 2013 based on the review and criteria previously undertaken and approved.
B The amounts forfeited are due to the performance or service criteria not being met in relation to the current financial year.
15.4 Equity instruments - audited
All options refer to options and performance rights over ordinary shares of Ainsworth Game Technology Limited, unless
otherwise stated, which are exercisable on a one-for-one basis under the ESOT and RST plans.
For
per
sona
l use
onl
y
Ainsworth Game Technology Limited Annual Financial Report for the year ended 30 June 2013
23
Ainsworth Game Technology Limited
Directors’ report (continued)
For the year ended 30 June 2013
15. Remuneration report – audited (continued)
15.4 Equity instruments – audited (continued)
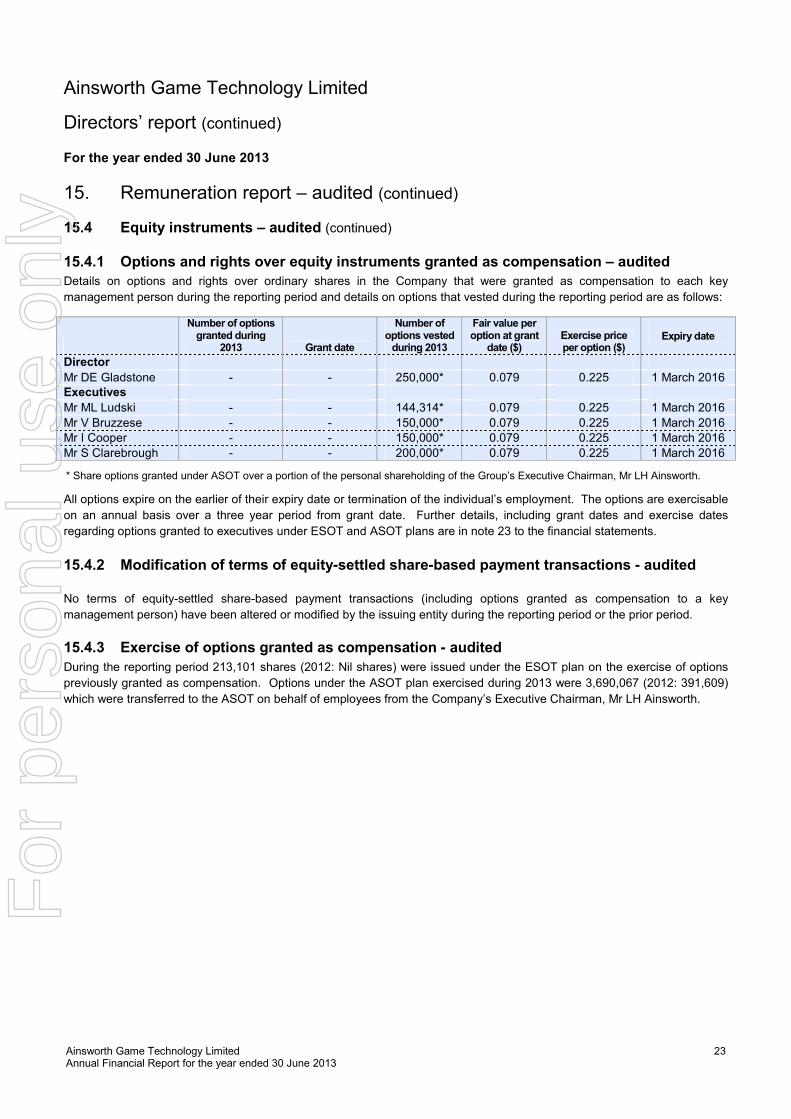
15.4.1 Options and rights over equity instruments granted as compensation – audited
Details on options and rights over ordinary shares in the Company that were granted as compensation to each key
management person during the reporting period and details on options that vested during the reporting period are as follows:
Number of options granted during
2013 Grant date
Number of options vested during 2013
Fair value per option at grant
date ($) Exercise price per option ($)
Expiry date
Director
Mr DE Gladstone - - 250,000* 0.079 0.225 1 March 2016 Executives
Mr ML Ludski - - 144,314* 0.079 0.225 1 March 2016
Mr V Bruzzese - - 150,000* 0.079 0.225 1 March 2016
Mr I Cooper - - 150,000* 0.079 0.225 1 March 2016
Mr S Clarebrough - - 200,000* 0.079 0.225 1 March 2016
* Share options granted under ASOT over a portion of the personal shareholding of the Group’s Executive Chairman, Mr LH Ainsworth.
All options expire on the earlier of their expiry date or termination of the individual’s employment. The options are exercisable
on an annual basis over a three year period from grant date. Further details, including grant dates and exercise dates
regarding options granted to executives under ESOT and ASOT plans are in note 23 to the financial statements.
15.4.2 Modification of terms of equity-settled share-based payment transactions - audited
No terms of equity-settled share-based payment transactions (including options granted as compensation to a key
management person) have been altered or modified by the issuing entity during the reporting period or the prior period.
15.4.3 Exercise of options granted as compensation - audited
During the reporting period 213,101 shares (2012: Nil shares) were issued under the ESOT plan on the exercise of options
previously granted as compensation. Options under the ASOT plan exercised during 2013 were 3,690,067 (2012: 391,609)
which were transferred to the ASOT on behalf of employees from the Company’s Executive Chairman, Mr LH Ainsworth.
For
per
sona
l use
onl
y
Ainsworth Game Technology Limited Annual Financial Report for the year ended 30 June 2013
24
Ainsworth Game Technology Limited
Directors’ report (continued)
For the year ended 30 June 2013
15. Remuneration report – audited (continued)
15.4 Equity instruments (continued)
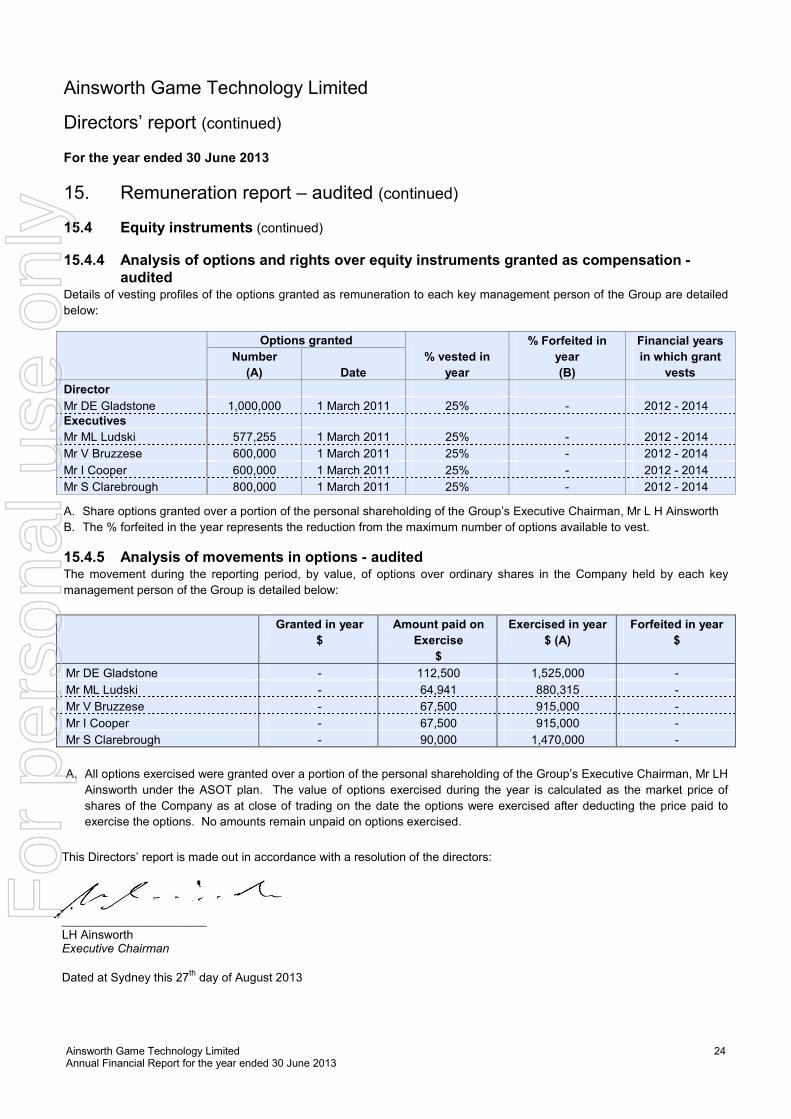
15.4.4 Analysis of options and rights over equity instruments granted as compensation - audited
Details of vesting profiles of the options granted as remuneration to each key management person of the Group are detailed
below:
Options granted
% vested in
year
% Forfeited in
year
(B)
Financial years
in which grant
vests
Number
(A) Date
Director
Mr DE Gladstone 1,000,000 1 March 2011 25% - 2012 - 2014 Executives
Mr ML Ludski 577,255 1 March 2011 25% - 2012 - 2014
Mr V Bruzzese 600,000 1 March 2011 25% - 2012 - 2014
Mr I Cooper 600,000 1 March 2011 25% - 2012 - 2014
Mr S Clarebrough 800,000 1 March 2011 25% - 2012 - 2014
A. Share options granted over a portion of the personal shareholding of the Group’s Executive Chairman, Mr L H Ainsworth
B. The % forfeited in the year represents the reduction from the maximum number of options available to vest.
15.4.5 Analysis of movements in options - audited
The movement during the reporting period, by value, of options over ordinary shares in the Company held by each key
management person of the Group is detailed below:
Granted in year
$
Amount paid on
Exercise
$
Exercised in year
$ (A)
Forfeited in year
$
Mr DE Gladstone - 112,500 1,525,000 -
Mr ML Ludski - 64,941 880,315 -
Mr V Bruzzese - 67,500 915,000 -
Mr I Cooper - 67,500 915,000 -
Mr S Clarebrough - 90,000 1,470,000 -
A. All options exercised were granted over a portion of the personal shareholding of the Group’s Executive Chairman, Mr LH
Ainsworth under the ASOT plan. The value of options exercised during the year is calculated as the market price of
shares of the Company as at close of trading on the date the options were exercised after deducting the price paid to
exercise the options. No amounts remain unpaid on options exercised.
This Directors’ report is made out in accordance with a resolution of the directors:
____________________________
LH Ainsworth Executive Chairman
Dated at Sydney this 27th
day of August 2013
For
per
sona
l use
onl
y
Ainsworth Game Technology Limited Annual Financial Report for the year ended 30 June 2013
25
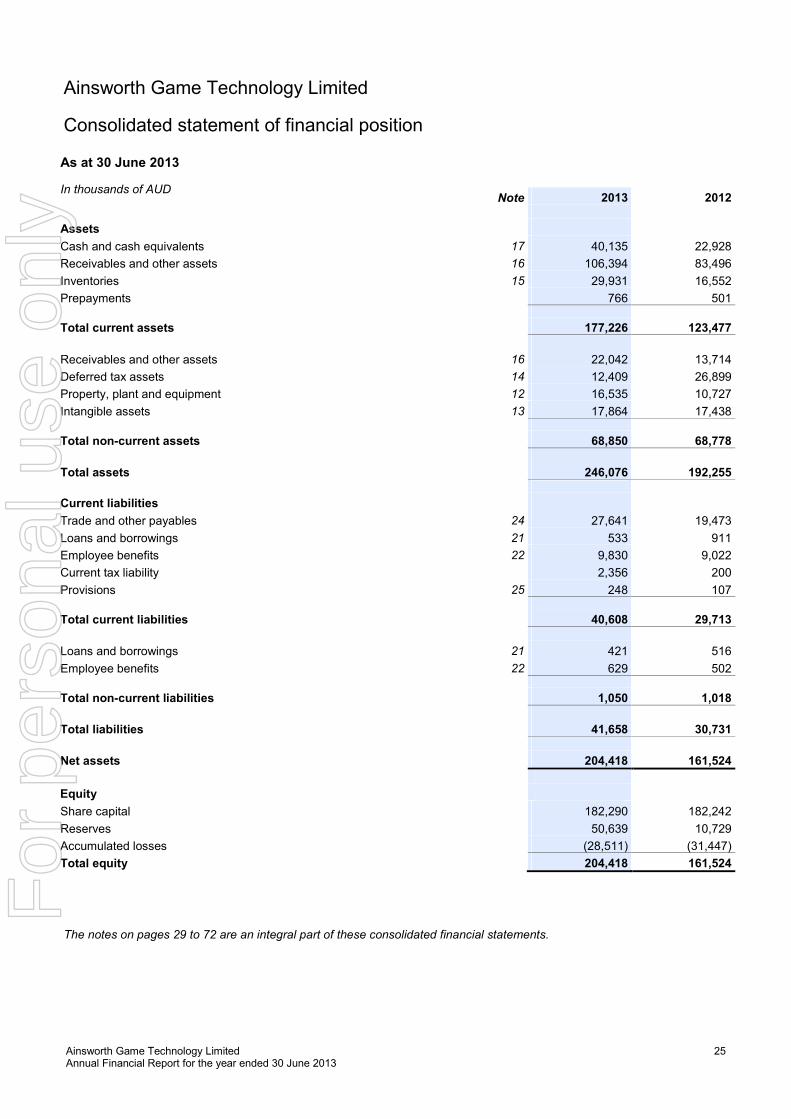
Ainsworth Game Technology Limited
Consolidated statement of financial position
As at 30 June 2013
In thousands of AUD
Note 2013 2012
Assets
Cash and cash equivalents 17 40,135 22,928
Receivables and other assets 16 106,394 83,496
Inventories 15 29,931 16,552
Prepayments 766 501
Total current assets 177,226 123,477
Receivables and other assets 16 22,042 13,714
Deferred tax assets 14 12,409 26,899
Property, plant and equipment 12 16,535 10,727
Intangible assets 13 17,864 17,438
Total non-current assets 68,850 68,778
Total assets 246,076 192,255
Current liabilities
Trade and other payables 24 27,641 19,473
Loans and borrowings 21 533 911
Employee benefits 22 9,830 9,022
Current tax liability 2,356 200
Provisions 25 248 107
Total current liabilities 40,608 29,713
Loans and borrowings 21 421 516
Employee benefits 22 629 502
Total non-current liabilities 1,050 1,018
Total liabilities 41,658 30,731
Net assets 204,418 161,524
Equity
Share capital 182,290 182,242
Reserves 50,639 10,729
Accumulated losses (28,511) (31,447)
Total equity 204,418 161,524
The notes on pages 29 to 72 are an integral part of these consolidated financial statements.
For
per
sona
l use
onl
y
Ainsworth Game Technology Limited Annual Financial Report for the year ended 30 June 2013
26
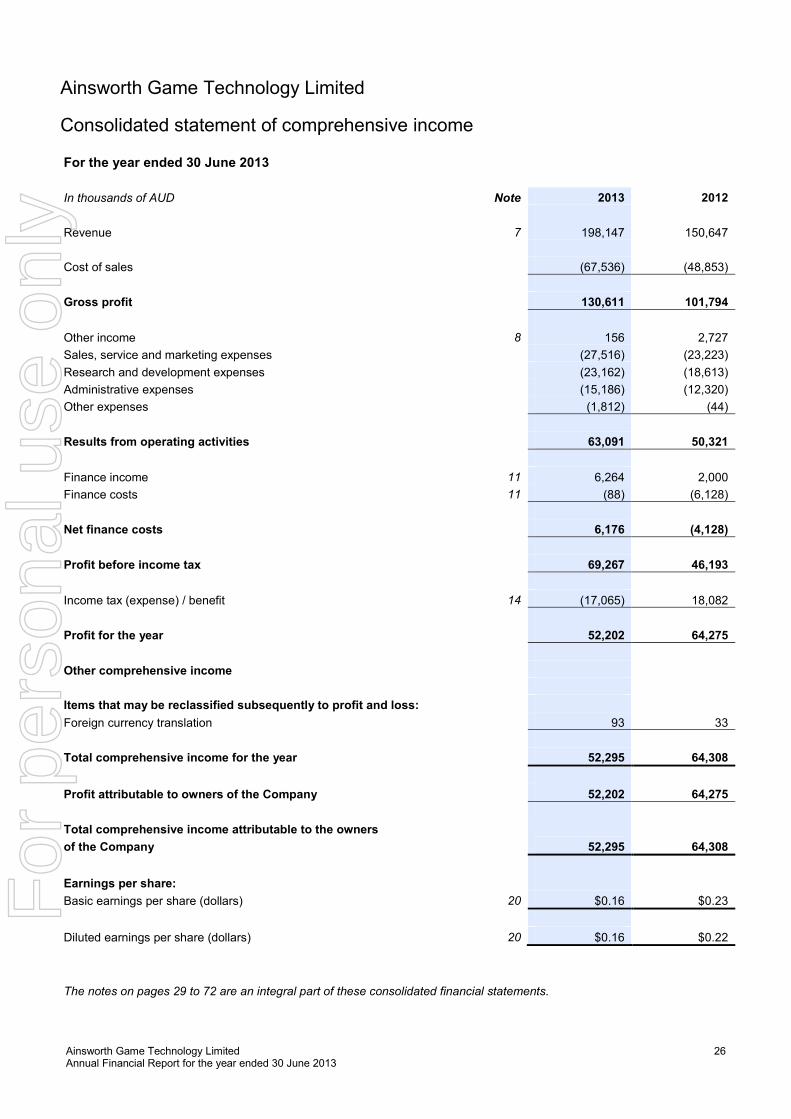
Ainsworth Game Technology Limited
Consolidated statement of comprehensive income
For the year ended 30 June 2013
In thousands of AUD Note 2013 2012
Revenue 7 198,147 150,647
Cost of sales (67,536) (48,853)
Gross profit 130,611 101,794
Other income 8 156 2,727
Sales, service and marketing expenses (27,516) (23,223)
Research and development expenses (23,162) (18,613)
Administrative expenses (15,186) (12,320)
Other expenses (1,812) (44)
Results from operating activities 63,091 50,321
Finance income 11 6,264 2,000
Finance costs 11 (88) (6,128)
Net finance costs 6,176 (4,128)
Profit before income tax 69,267 46,193
Income tax (expense) / benefit 14 (17,065) 18,082
Profit for the year 52,202 64,275
Other comprehensive income
Items that may be reclassified subsequently to profit and loss:
Foreign currency translation 93 33
Total comprehensive income for the year 52,295 64,308
Profit attributable to owners of the Company 52,202 64,275
Total comprehensive income attributable to the owners
of the Company 52,295 64,308
Earnings per share:
Basic earnings per share (dollars) 20 $0.16 $0.23
Diluted earnings per share (dollars) 20 $0.16 $0.22
The notes on pages 29 to 72 are an integral part of these consolidated financial statements.
For
per
sona
l use
onl
y
Ainsworth Game Technology Limited Annual Financial Report for the year ended 30 June 2013
27
The notes on pages 29 to 72 are an integral part of these consolidated financial statements
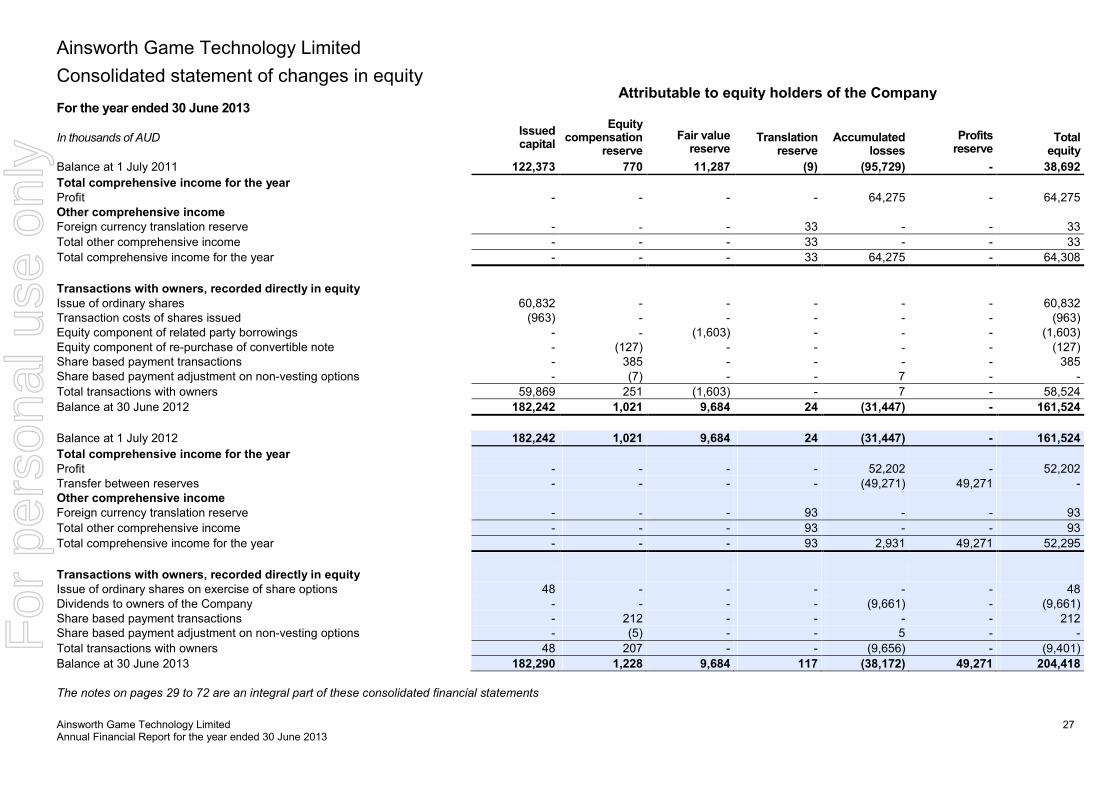
Ainsworth Game Technology Limited
Consolidated statement of changes in equity
Attributable to equity holders of the Company For the year ended 30 June 2013
In thousands of AUD
Issued capital
Equity compensation
reserve
Fair value reserve
Translation
reserve
Accumulated
losses
Profits reserve
Total
equity
Balance at 1 July 2011 122,373 770 11,287 (9) (95,729) - 38,692
Total comprehensive income for the year Profit - - - - 64,275 - 64,275 Other comprehensive income Foreign currency translation reserve - - - 33 - - 33
Total other comprehensive income - - - 33 - - 33
Total comprehensive income for the year - - - 33 64,275 - 64,308
Transactions with owners, recorded directly in equity Issue of ordinary shares 60,832 - - - - - 60,832 Transaction costs of shares issued (963) - - - - - (963) Equity component of related party borrowings - - (1,603) - - - (1,603) Equity component of re-purchase of convertible note - (127) - - - - (127) Share based payment transactions - 385 - - - - 385 Share based payment adjustment on non-vesting options - (7) - - 7 - -
Total transactions with owners 59,869 251 (1,603) - 7 - 58,524
Balance at 30 June 2012 182,242 1,021 9,684 24 (31,447) - 161,524
Balance at 1 July 2012 182,242 1,021 9,684 24 (31,447) - 161,524
Total comprehensive income for the year Profit - - - - 52,202 - 52,202 Transfer between reserves - - - - (49,271) 49,271 - Other comprehensive income Foreign currency translation reserve - - - 93 - - 93
Total other comprehensive income - - - 93 - - 93
Total comprehensive income for the year - - - 93 2,931 49,271 52,295
Transactions with owners, recorded directly in equity Issue of ordinary shares on exercise of share options 48 - - - - - 48 Dividends to owners of the Company - - - - (9,661) - (9,661) Share based payment transactions - 212 - - - - 212 Share based payment adjustment on non-vesting options - (5) - - 5 - -
Total transactions with owners 48 207 - - (9,656) - (9,401)
Balance at 30 June 2013 182,290 1,228 9,684 117 (38,172) 49,271 204,418
For
per
sona
l use
onl
y
Ainsworth Game Technology Limited Annual Financial Report for the year ended 30 June 2013
28
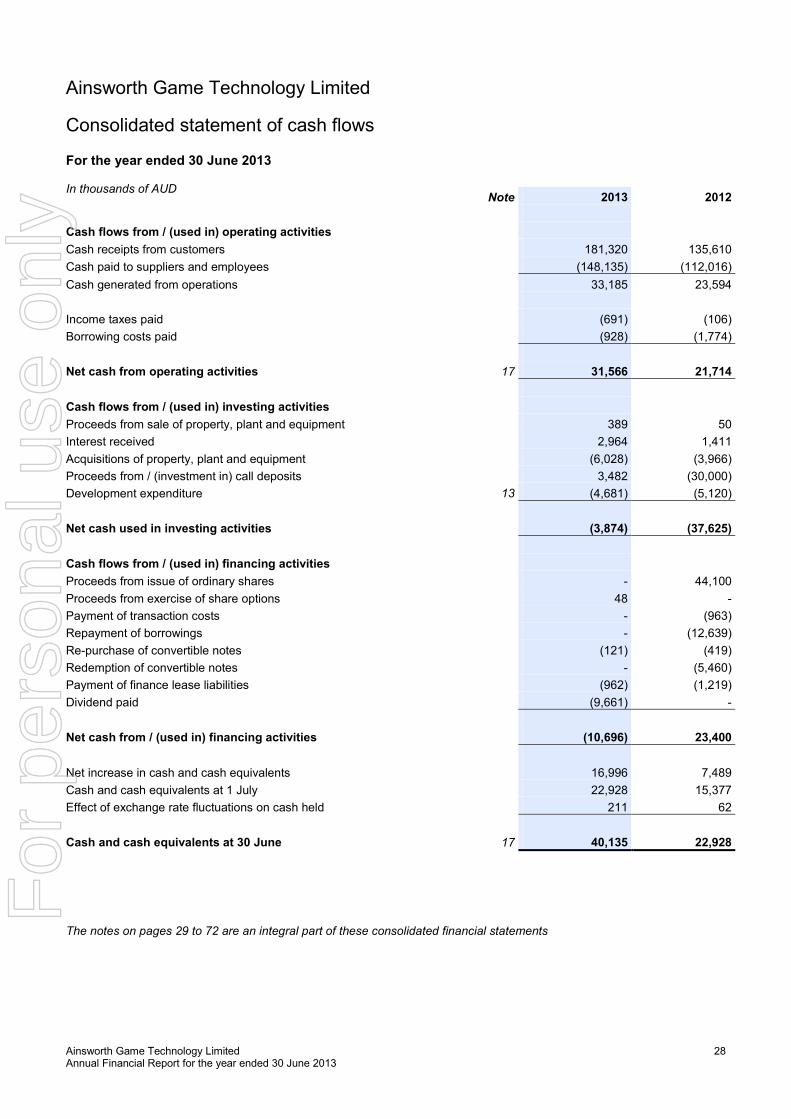
Ainsworth Game Technology Limited
Consolidated statement of cash flows For the year ended 30 June 2013
In thousands of AUD
Note 2013 2012
Cash flows from / (used in) operating activities
Cash receipts from customers 181,320 135,610
Cash paid to suppliers and employees (148,135) (112,016)
Cash generated from operations 33,185 23,594
Income taxes paid (691) (106)
Borrowing costs paid (928) (1,774)
Net cash from operating activities 17 31,566 21,714
Cash flows from / (used in) investing activities
Proceeds from sale of property, plant and equipment 389 50
Interest received 2,964 1,411
Acquisitions of property, plant and equipment (6,028) (3,966)
Proceeds from / (investment in) call deposits 3,482 (30,000)
Development expenditure 13 (4,681) (5,120)
Net cash used in investing activities (3,874) (37,625)
Cash flows from / (used in) financing activities
Proceeds from issue of ordinary shares - 44,100
Proceeds from exercise of share options 48 -
Payment of transaction costs - (963)
Repayment of borrowings - (12,639)
Re-purchase of convertible notes (121) (419)
Redemption of convertible notes - (5,460)
Payment of finance lease liabilities (962) (1,219)
Dividend paid (9,661) -
Net cash from / (used in) financing activities (10,696) 23,400
Net increase in cash and cash equivalents 16,996 7,489
Cash and cash equivalents at 1 July 22,928 15,377
Effect of exchange rate fluctuations on cash held 211 62
Cash and cash equivalents at 30 June 17 40,135 22,928
The notes on pages 29 to 72 are an integral part of these consolidated financial statements
For
per
sona
l use
onl
y
Ainsworth Game Technology Limited Annual Financial Report for the year ended 30 June 2013
29
Ainsworth Game Technology Limited
Index to notes to the financial statements Page
1. Reporting entity 31
2. Basis of preparation 31
3. Significant accounting policies 32
4. Determination of fair values 40
5. Financial risk management 41
6. Operating segments 43
7. Revenue 46
8. Other income 46
9. Expenses by nature 46
10. Personnel expenses 46
11. Finance income and finance costs 47
12. Property, plant and equipment 47
13. Intangible assets 48
14. Taxes 51
15. Inventories 52
16. Receivables and other assets 53
17. Cash and cash equivalents 54
17a. Reconciliation of cash flows from
operating activities 54
Page
18. Capital and reserves 54
19. Dividends 55
20. Earnings per share 56
21. Loans and borrowings 56
22. Employee benefits 59
23. Share-based payments 59
24. Trade and other payables 61
25. Provisions 61
26. Financial instruments 61
27. Operating leases 66
28. Capital and other commitments 66
29. Contingencies 66
30. Related parties 67
31. Group entities 71
32. Subsequent events 71
33. Auditor’s remuneration 71
34. Parent entity disclosures 72
For
per
sona
l use
onl
y
Ainsworth Game Technology Limited Annual Financial Report for the year ended 30 June 2013
30
Ainsworth Game Technology Limited
Index to significant accounting policies Page
(a) Basis of consolidation 32
(b) Foreign currency 32
(c) Financial instruments 33
(d) Property, plant and equipment 34
(e) Intangible assets 35
(f) Leased assets 35
(g) Inventories 36
(h) Impairment 36
(i) Employee benefits 37
(j) Provisions 38
(k) Warranties 38
(l) Revenue 38
(m) Lease payments 38
(n) Finance income and finance costs 39
(o) Income tax 39
(p) Earnings per share 40
(q) Segment reporting 40
(r) New standards and interpretations not yet adopted 40
For
per
sona
l use
onl
y
Ainsworth Game Technology Limited Annual Financial Report for the year ended 30 June 2013
31
Ainsworth Game Technology Limited
Notes to the financial statements
1. Reporting entity
Ainsworth Game Technology Limited (the ‘Company’) is a company domiciled in Australia. The address of the
Company’s registered office is 10 Holker Street, Newington, NSW, 2127. The consolidated financial statements of
the Company as at and for the year ended 30 June 2013 comprise the Company and its subsidiaries (together
referred to as the ‘Group’ and individually as ‘Group entities’). The Group is a for-profit entity and primarily is
involved in the design, development, manufacture, sale and servicing of gaming machines and other related
equipment and services.
2. Basis of preparation
(a) Statement of compliance
The consolidated financial statements are general purpose financial statements which have been prepared in
accordance with Australian Accounting Standards (AASBs) adopted by the Australian Accounting Standards Board
(AASB) and the Corporations Act 2001. The consolidated financial statements comply with International Financial
Reporting Standards (IFRSs) adopted by the International Accounting Standards Board (IASB).
The consolidated financial statements were authorised for issue by the Board of Directors on 27 August 2013.
(b) Basis of measurement
The consolidated financial statements have been prepared on the historical cost basis except for loans and
borrowings with a Director related entity, which were measured initially at fair value and then subsequently carried at
amortised cost.
(c) Functional and presentation currency
The financial information of each of the Group’s entities and foreign branches is measured using the currency of the
primary economic environment in which it operates (the functional currency).
These consolidated financial statements are presented in Australian dollars, which is the Company’s functional
currency and presentation currency.
The Company is of a kind referred to in ASIC Class Order 98/100 dated 10 July 1998 and in accordance with that
Class Order, all financial information presented in Australian dollars has been rounded to the nearest thousand
unless otherwise stated.
(d) Use of estimates and judgements
The preparation of the consolidated financial statements in conformity with IFRSs requires management to make
judgements, estimates and assumptions that affect the application of accounting policies and the reported amounts
of assets, liabilities, income and expenses. Actual results may differ to these estimates.
Estimates and underlying assumptions are reviewed on an ongoing basis. Revisions to accounting estimates are
recognised in the period in which the estimate is revised and in any future periods affected.
Information about assumptions and estimation uncertainties that have a significant risk of resulting in a material
adjustment to the carrying amounts of assets and liabilities within the next financial year are included in note 13 -
Intangible assets and note 26 – Financial instruments (trade and other receivables).
(e) Presentation of transactions recognised in other comprehensive income
From 1 July 2012 the Group applied amendments to AASB 101 Presentation of Financial Statements outlined in
AASB 2011-9 Amendments to Australian Accounting Standards – Presentation of Items of Other Comprehensive
Income. The change in accounting policy only relates to disclosures and has had no impact on consolidated
earnings per share or profit. The changes have been applied retrospectively and require the Group to separately
present those items of other comprehensive income that may be reclassified to profit of loss in the future from those
that will never be reclassified to profit or loss. These changes are included in the statement of profit or loss and
other comprehensive income.
For
per
sona
l use
onl
y
Ainsworth Game Technology Limited Annual Financial Report for the year ended 30 June 2013
32
Ainsworth Game Technology Limited
Notes to the financial statements
3. Significant accounting policies
The accounting policies set out below have been applied consistently to all periods presented in these consolidated
financial statements, and have been applied consistently by Group entities.
Certain comparative amounts have been reclassified to conform with the current year’s presentation.
(a) Basis of consolidation
(i) Subsidiaries
Subsidiaries are entities controlled by the Group. The financial statements of subsidiaries are included in the
consolidated financial statements from the date that control commences until the date that control ceases.
(ii) Transactions eliminated on consolidation
Intra-group balances and transactions, and any unrealised income and expenses arising from intra-group
transactions, are eliminated in preparing the consolidated financial statements. (iii) Acquisitions prior to 1 July 2004
As part of its transition to AASBs, the Group elected to restate only those business combinations that occurred on or
after 1 July 2004. In respect of acquisitions prior to 1 July 2004, goodwill represents the amount recognised under
the Group’s previous accounting framework, Australian GAAP.
(iv) Acquisitions on or after 1 July 2004
For acquisitions on or after 1 July 2004, goodwill represents the excess of the cost of the acquisition over the
Group’s interest in the net fair value of the identifiable assets, liabilities and contingent liabilities of the acquiree.
When the excess is negative (negative goodwill), it is recognised immediately in profit or loss. (b) Foreign currency
(i) Foreign currency transactions
Transactions in foreign currencies are translated to the respective functional currencies of Group entities at
exchange rates at the dates of the transaction. Monetary assets and liabilities denominated in foreign currencies at
the balance date are retranslated to the functional currency at the foreign exchange rate at that date. The foreign
currency gain or loss on monetary items is the difference between amortised cost in the functional currency at the
beginning of the period, adjusted for effective interest and payments during the period, and the amortised cost in
foreign currency translated at the exchange rate at the end of the year.
(ii) Foreign operations
The assets and liabilities of foreign operations are translated to Australian dollars at exchange rates at the reporting
date. The income and expenses of foreign operations are translated to Australian dollars at the average exchange
rates for the period.
Foreign currency differences are recognised in other comprehensive income and presented in the Translation
Reserve in equity. When a foreign operation is disposed of such that control is lost, the cumulative amount in the
Translation Reserve related to that foreign operation is transferred to the profit or loss, as part of gain or loss on
disposal.
When the Group disposes of only a part of its interest in a subsidiary that includes a foreign operation while retaining
control, the relevant portion of cumulative amounts is re-attributed to non-controlling interest.
When the settlement of a monetary item receivable from or payable to a foreign operation is neither planned nor
likely in the foreseeable future, foreign exchange gains and losses arising from such a monetary item are considered
to form part of a net investment in a foreign operation, are recognised in other comprehensive income and are
presented in the translation reserve in equity.
For
per
sona
l use
onl
y
Ainsworth Game Technology Limited Annual Financial Report for the year ended 30 June 2013
33
Ainsworth Game Technology Limited
Notes to the financial statements
3. Significant accounting policies (continued)
(c) Financial instruments
(i) Non-derivative financial assets
Non-derivative financial assets comprise trade and other receivables and cash and cash equivalents.
Trade and other receivables are recognised on the date that they are originated. Financial assets are derecognised
if the Group’s contractual rights to the cash flows from the financial assets expire or if the Group transfers the
financial asset to another party without retaining control or substantially all risks and rewards of ownership of the
financial asset are transferred.
Financial assets and liabilities are offset and the net amount presented in the statement of financial position when,
and only when, the Group has a legal right to offset the amounts and intends either to settle on a net basis or to
realise the asset and settle the liability simultaneously.
Trade and other receivables are financial assets with fixed or determinable payments that are not quoted in an
active market. Such assets are recognised initially at fair value. Subsequent to initial recognition trade and other
receivables are measured at amortised cost using the effective interest method, less any impairment losses.
Cash and cash equivalents comprise cash balances and call deposits with original maturities of three months or less
from the acquisition date that are subject to an insignificant risk of changes in their fair value, and are used by the
Group in the management of its short-term commitments.
(ii) Non-derivative financial liabilities
Non-derivative financial liabilities comprise loans and borrowings and trade and other payables.
Debt securities issued and subordinated liabilities are initially recognised on the date that they are originated. All
other financial liabilities are recognised initially on the trade date at which the Group becomes a party to the
contractual provisions of the instrument. The Group derecognises a financial liability when its contractual obligations
are discharged or cancelled or expire.
Loans and borrowings and trade and other payables are recognised initially at fair value plus any directly attributable
transaction costs. Subsequent to initial recognition, these financial liabilities are measured at amortised cost with
any difference between cost and redemption value being recognised in the income statement over the period of the
borrowings on an effective interest basis.
Where the terms and conditions of borrowings are modified, the carrying amount is remeasured to fair value. Any
difference between the carrying amount and fair value is recognised in equity. (iii) Compound financial instruments
Compound financial instruments issued by the Group comprise convertible notes that can be converted to share
capital at the option of the holder, and the number of shares to be issued does not vary with changes in their fair
value.
The liability component of a compound financial instrument is recognised initially at the fair value of a similar liability
that does not have an equity conversion option. The equity component is recognised initially at the difference
between the fair value of the compound financial instrument as a whole and the fair value of the liability component.
Any directly attributable transaction costs are allocated to the liability and equity components in proportion to their
initial carrying amounts.
Subsequent to initial recognition, the liability component of a compound financial instrument is measured at
amortised cost using the effective interest method. The equity component of a compound financial instrument is not
remeasured subsequent to initial recognition.
Interest, losses and gains relating to the financial liability are recognised in profit or loss. On conversion, the
financial liability is re-classified to equity. No gain or loss is recognised on conversion.
For
per
sona
l use
onl
y
Ainsworth Game Technology Limited Annual Financial Report for the year ended 30 June 2013
34
Ainsworth Game Technology Limited
Notes to the financial statements
3. Significant accounting policies (continued)
(c) Financial instruments (continued) (iv) Share capital
Ordinary shares
Ordinary shares are classified as equity. Incremental costs directly attributable to issue of ordinary shares and
share options are recognised as a deduction from equity, net of any tax effects.
(d) Property, plant and equipment (i) Recognition and measurement
Items of property, plant and equipment are measured at cost less accumulated depreciation and impairment losses.
Cost includes expenditures that are directly attributable to the acquisition of the asset. Purchased software that is
integral to the functionality of the related equipment is capitalised as part of that equipment.
When parts of an item of property, plant and equipment have different useful lives, they are accounted for as
separate items (major components) of property, plant and equipment. Machines previously held as inventory are transferred to property, plant and equipment when a rental or participation
agreement is entered into. When the rental or participation agreements cease and the machines become held for
sale, they are transferred to inventory at their carrying amount.
Gains and losses on disposal of an item of property, plant and equipment are determined by comparing the
proceeds from disposal with the carrying amount of the property, plant and equipment and are recognised net within
“other income” in profit and loss.
(ii) Subsequent costs
The cost of replacing a part of an item of property, plant and equipment is recognised in the carrying amount of an
item if it is probable that the future economic benefits embodied within the part will flow to the Group and its cost can
be measured reliably. The costs of the day-to-day servicing of property, plant and equipment are recognised in
profit or loss as incurred.
(iii) Depreciation
Depreciation is based on the cost of an asset less its residual value. Significant components of individual assets are
assessed and if a component has a useful life that is different from the remainder of that asset, that component is
depreciated separately.
Depreciation is recognised in profit or loss on a straight-line basis over the estimated useful lives of each part of an
item of property, plant and equipment since this most closely reflects the expected pattern of consumption of the
future economic benefits embodied in the assets. Leased assets are depreciated over the shorter of the lease term
and their useful lives unless it is reasonably certain that the Group will obtain ownership by the end of the lease
term. Land is not depreciated.
Items of property, plant and equipment are depreciated from the date that they are installed and are ready for use, or
in respect of internally constructed assets, from the date that the asset is completed and ready for use.
The estimated useful lives for the current and comparative periods are as follows:
• buildings 40 years
• leasehold improvements 10 years
• plant and equipment 2.5 – 20 years
• machines under rental or participation agreements 3 years
Depreciation methods, useful lives and residual values are reviewed at each financial year-end and adjusted if
appropriate.
For
per
sona
l use
onl
y
Ainsworth Game Technology Limited Annual Financial Report for the year ended 30 June 2013
35
Ainsworth Game Technology Limited
Notes to the financial statements
3. Significant accounting policies (continued)
(e) Intangible assets
(i) Goodwill
Goodwill that arises upon the acquisition of subsidiaries is included in intangible assets. For the measurement of
goodwill at initial recognition, see note 3(a)(iii) and (iv).
(ii) Subsequent measurement
Goodwill is measured at cost less accumulated impairment losses.
(iii) Research and development
Expenditure on research activities, undertaken with the prospect of gaining new technical knowledge and
understanding, is recognised in profit or loss when incurred.
Development activities involve a plan or design for the production of new or substantially improved products and
processes. Development expenditure is capitalised only if development costs can be measured reliably, the product
or process is technically and commercially feasible, future economic benefits are probable, and the Group intends to
and has sufficient resources to complete development and to use or sell the asset. The expenditure capitalised
includes the cost of materials, direct labour and overhead costs that are directly attributable to preparing the asset
for its intended use. Other development expenditure is recognised in profit or loss when incurred. Capitalised development expenditure is measured at cost less accumulated amortisation and accumulated impairment losses.
(iv) Other intangible assets
Other intangible assets, which include service contracts, that are acquired by the Group, which have finite useful
lives, are measured at cost less accumulated amortisation and accumulated impairment losses.
(v) Subsequent expenditure
Subsequent expenditure is capitalised only when it increases the future economic benefits embodied in the specific
asset to which it relates. All other expenditure, including expenditure on internally generated goodwill and brands, is
recognised in profit or loss when incurred.
(vi) Amortisation
Amortisation is based on the cost of an asset less its residual value. Amortisation is recognised in profit or loss on a
straight-line basis over the estimated useful lives of intangible assets, other than goodwill, from the date that they
are available for use, since this most closely reflects the expected pattern of consumption of the future economic
benefit embodied in the asset. The estimated useful lives for the current and comparative periods are as follows:
• capitalised development costs 4 years
• service contracts 8 years
• intellectual property 10 years
Amortisation methods, useful lives and residual values are reviewed at each reporting date and adjusted if
appropriate.
(f) Leased assets
Leases in terms of which the Group assumes substantially all the risks and rewards of ownership are classified as
finance leases. Upon initial recognition the leased asset is measured at an amount equal to the lower of its fair
value and the present value of the minimum lease payments. Subsequent to initial recognition, the asset is
accounted for in accordance with the accounting policy applicable to that asset.
Other leases are operating leases and the leased assets are not recognised on the Group’s statement of financial
position.
For
per
sona
l use
onl
y
Ainsworth Game Technology Limited Annual Financial Report for the year ended 30 June 2013
36
Ainsworth Game Technology Limited
Notes to the financial statements
3. Significant accounting policies (continued)
(g) Inventories
Inventories are measured at the lower of cost and net realisable value. The cost of inventories is based on the first-
in first-out principle, and includes expenditure incurred in acquiring the inventories, production or conversion costs
and other costs incurred in bringing them to their existing location and condition. In the case of manufactured
inventories and work in progress, cost includes an appropriate share of production overheads based on normal
operating capacity. Net realisable value is the estimated selling price in the ordinary course of business, less the
estimated costs of completion and selling expenses.
(h) Impairment (i) Non-derivative financial assets
A financial asset not carried at fair value through profit or loss is assessed at each reporting date to determine
whether there is any objective evidence that it is impaired. A financial asset is considered to be impaired if objective
evidence indicates that one or more events have had a negative effect on the estimated future cash flows of that
asset that can be estimated reliably.
Objective evidence that financial assets are impaired can include default or delinquency by a debtor, restructuring of
an amount due to the Group on terms that the Group would not consider otherwise and indications that a debtor will
enter bankruptcy.
Financial assets measured at amortised cost
The Group considers evidence of impairment for financial assets measured at amortised cost (loans and
receivables) at both a specific and collective level. All individually significant financial assets are tested for
impairment on an individual basis. The remaining financial assets are assessed collectively in groups that share
similar credit risk characteristics.
In assessing collective impairment the Group uses historical trends of the probability of default, timing of recoveries
and the amount of loss incurred, adjusted for management’s judgement as to whether current economic, industry
and credit conditions are such that the actual losses are likely to be greater or less than suggested by historical
trends.
An impairment loss in respect of a financial asset measured at amortised cost is calculated as the difference
between its carrying amount, the present value of the estimated future cash flows discounted at the original effective
interest rate. All impairment losses are recognised in profit or loss and reflected in an allowance account against
receivables. An impairment loss is reversed if the reversal can be related objectively to an event occurring after the
impairment loss was recognised. When a subsequent event causes the amount of impairment loss to decrease, the
decrease in impairment loss is reversed through profit and loss.
(ii) Non-financial assets
The carrying amounts of the Group’s non-financial assets, other than inventories and deferred tax assets, are
reviewed at each reporting date to determine whether there is any indication of impairment. If any such indication
exists then the asset’s recoverable amount is estimated. For goodwill and intangible assets that have indefinite lives
or that are not yet available for use, recoverable amount is estimated at each reporting date. An impairment loss is
recognised if the carrying amount of an asset or its related cash generating unit (CGU) exceeds its estimated
recoverable amount.
The recoverable amount of an asset or CGU is the greater of its value in use and its fair value less costs to sell. In
assessing value in use, the estimated future cash flows are discounted to their present value using a pre-tax
discount rate that reflects current market assessments of the time value of money and the risks specific to the asset,
CGU or group of CGUs. For the purpose of impairment testing, assets are grouped together into the smallest group
of assets that generates cash inflows from continuing use that are largely independent of the cash inflows of other
assets or groups of assets (the “CGU or group of CGUs”). The goodwill acquired in a business combination for the
purpose of impairment testing, is allocated to CGUs or group of CGUs that are expected to benefit from the
synergies of the combination.
For
per
sona
l use
onl
y
Ainsworth Game Technology Limited Annual Financial Report for the year ended 30 June 2013
37
Ainsworth Game Technology Limited
Notes to the financial statements
3. Significant accounting policies (continued)
(h) Impairment (continued) (ii) Non-financial assets (continued)
The Group’s corporate assets do not generate separate cash inflows and are utilised by more than one CGU.
Corporate assets are allocated to CGUs or group of CGUs on a reasonable and consistent basis and tested for
impairment as part of the testing of the CGU or group of CGUs to which the corporate asset is allocated.
An impairment loss is recognised if the carrying amount of an asset or its CGU exceeds its recoverable amount.
Impairment losses are recognised in profit or loss. Impairment losses recognised in respect of CGUs are allocated
first to reduce the carrying amount of any goodwill allocated to the CGUs and then to reduce the carrying amount of
the other assets in the CGU or group of CGUs on a pro rata basis.
An impairment loss in respect of goodwill is not reversed. In respect of other assets, impairment losses recognised
in prior periods are assessed at each reporting date for any indications that the loss has decreased or no longer
exists. An impairment loss is reversed if there has been a change in the estimates used to determine the
recoverable amount. An impairment loss is reversed only to the extent that the asset’s carrying amount does not
exceed the carrying amount that would have been determined, net of depreciation or amortisation, if no impairment
loss had been recognised.
(i) Employee benefits (i) Defined contribution superannuation funds
A defined contribution plan is a post-employment benefit plan under which an entity pays fixed contributions into a
separate entity and will have no legal or constructive obligation to pay further amounts.
Obligations for contributions to defined contribution superannuation funds are recognised as an employee benefit
expense in profit or loss in the periods during which services are rendered by employees.
(ii) Other long term employee benefits
The Group’s net obligation in respect of long-term employee benefits is the amount of future benefit that employees
have earned in return for their service in the current and prior periods plus related on-costs; that benefit is
discounted to determine its present value, and the fair value of any related assets is deducted. The discount rate is
the yield rate at the reporting date on government bonds that have maturity dates approximating the terms of the
Group’s obligations.
(iii) Termination benefits
Termination benefits are recognised as an expense when the Group is demonstrably committed, without realistic
possibility of withdrawal, to a formal detailed plan to terminate employment before the normal retirement date or to
provide termination benefits as a result of an offer made to encourage voluntary redundancy. Termination benefits
for voluntary redundancies are recognised if the Group has made an offer encouraging voluntary redundancy, it is
probable that the offer will be accepted, and the number of acceptances can be estimated reliably.
(iv) Short term benefits
Liabilities for employee benefits for wages, salaries and annual leave represent present obligations resulting from
employees’ services provided to reporting date and are calculated at undiscounted amounts based on remuneration
wage and salary rates that the Group expects to pay as at reporting date including related on-costs, such as workers
remuneration insurance and payroll tax. Non-accumulating non-monetary benefits, such as cars and free or
subsidised goods and services, are expensed based on the net marginal cost to the Group as the benefits are taken
by the employees.
A liability is recognised for the amount expected to be paid under short-term cash bonus plans if the Group has a
present legal or constructive obligation to pay this amount as a result of past service provided by the employee and
the obligation can be estimated reliably.
For
per
sona
l use
onl
y
Ainsworth Game Technology Limited Annual Financial Report for the year ended 30 June 2013
38
Ainsworth Game Technology Limited
Notes to the financial statements
3. Significant accounting policies (continued)
(i) Employee benefits (continued) (v) Share-based payment transactions
The grant date fair value of options granted to employees is recognised as an employee expense, with a
corresponding increase in equity, over the period in which the employees become unconditionally entitled to the
options. The amount recognised as an expense is adjusted to reflect the actual number of share options for which
the related service and non-market vesting conditions are expected to be met, such that the amount ultimately
recognised is based on the number of awards that meet the related service and non-market performance conditions
at the vesting date.
(j) Provisions A provision is recognised if, as a result of a past event, the Group has a present legal or constructive obligation that
can be estimated reliably, and it is probable that an outflow of economic benefits will be required to settle the
obligation. Provisions are determined by discounting the expected future cash flows at a pre-tax rate that reflects
current market assessments of the time value of money and, where appropriate, the risks specific to the liability.
The unwinding of the discount is recognised as a finance cost.
(k) Warranties
A provision for warranties is recognised when the underlying products are sold. The provision is based on historical
warranty data and a weighting of all possible outcomes against their associated probabilities.
(l) Revenue (i) Goods sold
Revenue from the sale of goods in the course of ordinary activities is measured at the fair value of the consideration
received or receivable, net of returns, allowances and trade discounts. Revenue is recognised when persuasive
evidence exists usually in the form of an executed sales agreement, that the significant risks and rewards of
ownership have been transferred to the buyer, recovery of the consideration is probable, the associated costs and
possible return of goods can be estimated reliably, there is no continuing management involvement with the goods,
and the amount of revenue can be measured reliably. Transfer of risks and rewards vary depending on the
individual terms of the contract of sale.
When gaming machines, games, conversions and other incidental items are licensed to customers for extended
periods, revenue is recognised on delivery for gaming machines and games and for other items including
conversions on a straight line basis over the licence term. The revenue recognised for each item is based on the
relative fair values of the items included in the arrangement.
(ii) Services
Revenue from services rendered is recognised in profit or loss when the services are performed.
(iii) Participation and rental Participation revenue is where the Group’s owned machines are placed directly by the Group or indirectly through a
licensed operator in venues in return for a fee per day which can either be fixed or performance based. The amount
of revenue recognised is calculated by either; (i) multiplying a daily fee by the total number of days the machine has
been operating on the venue floor in the reporting period; or (ii) an agreed fee based upon a percentage of turnover
of participating machines.
Revenue from rental of gaming machines is recognised in profit or loss on a straight line basis over the term of the
rental agreement.
(m) Lease payments
Payments made under operating leases are recognised in profit or loss on a straight-line basis over the term of the
lease. Lease incentives received are recognised as an integral part of the total lease expense, over the term of the
lease.
For
per
sona
l use
onl
y
Ainsworth Game Technology Limited Annual Financial Report for the year ended 30 June 2013
39
Ainsworth Game Technology Limited
Notes to the financial statements
3. Significant accounting policies (continued) (m) Lease payments (continued)
Minimum lease payments made under finance leases are apportioned between the finance expense and the
reduction of the outstanding liability. The finance expense is allocated to each period during the lease term so as to
produce a constant periodic rate of interest on the remaining balance of the liability.
(n) Finance income and finance costs Finance income comprises interest income and foreign currency gains. Interest income is recognised in profit or
loss as it accrues using the effective interest method.
Finance costs comprise interest expense on borrowings, foreign currency losses and impairment losses recognised
on financial assets. Borrowing costs that are not directly attributable to the acquisition, construction or production of
a qualifying asset are recognised in profit or loss using the effective interest method.
Foreign currency gains and losses are reported on a net basis as either finance income or finance cost depending
on whether foreign currency movements are in a net gain or net loss position.
(o) Income tax
Income tax expense comprises current and deferred tax. Current and deferred tax are recognised in profit or loss
except to the extent that it relates to items recognised directly in equity, in which case it is recognised in other
comprehensive income.
Current tax is the expected tax payable on the taxable income for the year, using tax rates enacted or substantively
enacted at the reporting date, and any adjustment to tax payable in respect of previous years.
Deferred tax is recognised in respect of temporary differences between the carrying amounts of assets and liabilities
for financial reporting purposes and the amounts used for taxation purposes. Deferred tax is not recognised for
temporary differences arising from: the initial recognition of assets or liabilities that affect neither accounting nor
taxable profit, and differences relating to investments in subsidiaries to the extent that they will probably not reverse
in the foreseeable future.
Deferred tax is not recognised for taxable temporary differences arising from the initial recognition of goodwill.
Deferred tax is measured at the tax rates that are expected to be applied to the temporary differences when they
reverse, based on the laws that have been enacted or substantively enacted by the reporting date.
In determining the amount of current and deferred tax the Group takes into account the impact of uncertain tax
positions and whether additional taxes and interest may be due. The Group believes that its accruals for tax
liabilities are adequate for all open tax years based on its assessment of many factors, including interpretations of
tax law and prior experience. This assessment relies on estimates and assumptions and may involve a series of
judgements about future events. New information may become available that causes the Group to change its
judgement regarding the adequacy of existing tax liabilities; such changes to tax liabilities will impact tax expense in
the period that such a determination is made.
Deferred tax assets and liabilities are offset if there is a legally enforceable right to offset current tax liabilities and
assets, and they relate to income taxes levied by the same tax authority on the same taxable entity, or on different
tax entities, but they intend to settle current tax liabilities and assets on a net basis or their tax assets and liabilities
will be realised simultaneously.
A deferred tax asset is recognised for unused tax losses, tax credits and deductible temporary differences, to the
extent that it is probable that future taxable profits will be available against which they can be utilised. Deferred tax
assets are reviewed at each reporting date and are reduced to the extent that it is no longer probable that the related
tax benefit will be realised, see note 14.
For
per
sona
l use
onl
y
Ainsworth Game Technology Limited Annual Financial Report for the year ended 30 June 2013
40
Ainsworth Game Technology Limited
Notes to the financial statements
3. Significant accounting policies (continued)
(p) Earnings per share
The Group presents basic and diluted earnings per share (EPS) data for its ordinary shares. Basic EPS is
calculated by dividing the profit or loss attributable to ordinary shareholders of the Company by weighted average
number of ordinary shares outstanding during the period. Diluted EPS is determined by adjusting the profit or loss
attributable to ordinary shareholders and the weighted average number of ordinary shareholders and the weighted
average number of ordinary shares outstanding for the effects of all dilutive potential ordinary shares, which
comprise convertible notes and share options granted to employees.
(q) Segment reporting
An operating segment is a component of the Group that engages in business activities from which it may earn
revenues and incur expenses, including revenues and expenses that relate to transactions with any of the Group’s
other components. All operating segments’ operating results are regularly reviewed by the Group’s CEO to make
decisions about resources to be allocated to the segment and assess its performance, and for which discrete
financial information is available.
Segment results that are reported to the CEO include items directly attributable to a segment as well as those that
can be allocated on a reasonable basis.
(r) New standards and interpretations not yet adopted
A number of new standards, amendments to standards and interpretations are effective for annual periods beginning
after 1 July 2012, and have not been applied in preparing these consolidated financial statements. Those which
may be relevant to the Group are set out below. The Group does not plan to adopt these standards early.
(i) AASB 119 Employee Benefits (2011)
AASB 119 (2011) changes the definition of short-term and other long-term employee benefits to clarify the
distinction between the two. Upon adoption of AASB 119 (2011), the annual leave liability will be classified as
an other long-term employee benefit, resulting in a change in the recognition and measurement of the liability.
This change will not have a significant effect on the consolidated financial statement of the Group. AASB 119
(2011) is effective for annual periods beginning on or after 1 January 2013 with early adoption permitted.
No other new standards, amendments to standards and interpretations are expected to affect the Group’s
consolidated financial statements.
4. Determination of fair values A number of the Group’s accounting policies and disclosures require the determination of fair value, for both
financial and non-financial assets and liabilities. Fair values have been determined for measurement and/or
disclosure purposes based on the following methods. Where applicable, further information about the assumptions
made in determining fair values is disclosed in the notes specific to that asset or liability.
(i) Intangible assets The fair value of customer contracts acquired in a business combination is based on the discounted cash flows
expected to be derived from the use or eventual sale of these contracts. The fair value of other intangible assets is
based on the discounted cash flows expected to be derived from the use and eventual sale of the assets.
(ii) Trade and other receivables / payables For receivables / payables with a remaining life of less than one year, the notional amount is deemed to reflect the
fair value. The fair value of all other receivables / payables is estimated as the present value of future cash flows,
discounted at the market rate of interest at the reporting date.
For
per
sona
l use
onl
y
Ainsworth Game Technology Limited Annual Financial Report for the year ended 30 June 2013
41
Ainsworth Game Technology Limited
Notes to the financial statements
4. Determination of fair values (continued)
(iii) Non-derivative financial instruments Fair value, which is determined for disclosure purposes, is calculated based on the present value of future principal
and interest cash flows, discounted at the market rate of interest at the reporting date. In respect of the liability
component of convertible notes, the market rate of interest is determined by reference to similar liabilities that do not
have a conversion option. For finance leases the market rate of interest is determined by reference to similar lease
agreements.
(iv) Loans and borrowings Fair value is calculated based on discounted expected future principal and interest cash flows.
(v) Finance lease liabilities The fair value is estimated as the present value of future cash flows, discounted at market interest rates for
homogeneous lease agreements. The estimated fair values reflect changes in interest rates.
(vi) Share-based payment transactions The fair value of employee stock options is measured using the Black Scholes Merton model. Measurement inputs
include share price on measurement date, exercise price of the instrument, expected volatility (based on weighted
average historic volatility adjusted for changes expected due to publicly available information), weighted average
expected life of the instruments (based on historical experience and general option holder behaviour), expected
dividends, and the risk-free interest rate (based on government bonds). Service and non-market performance
conditions attached to the transactions are not taken into account in determining fair value.
5. Financial risk management
Overview
The Group has exposure to the following risks from their use of financial instruments:
• Credit risk;
• Liquidity risk; and
• Market risk.
This note presents information about the Group’s exposure to each of the above risks, its objectives, policies and
processes for measuring and managing risk, and the management of capital. Further quantitative disclosures are
included throughout this financial report.
Risk management framework
The Board of Directors has overall responsibility for the establishment and oversight of the risk management
framework. The Board has established processes through the Group Audit Committee, which is responsible for
developing and monitoring risk management policies. The Committee reports regularly to the Board of Directors on
its activities.
Risk management policies are established to identify and analyse the risks faced by the Group, to set appropriate
risk limits and controls, and to monitor risks and adherence to limits. Risk management policies and systems are
reviewed regularly to reflect changes in market conditions and the Group’s activities. The Group, through its training
and management standards and procedures, aims to develop a disciplined and constructive control environment in
which all employees understand their roles and obligations.
The Group’s Audit Committee oversees how management monitors compliance with the Group’s risk management
policies and procedures and reviews the adequacy of the risk management framework in relation to the risks faced
by the Group. The Audit Committee is assisted in its oversight role by Internal Audit. Internal Audit undertakes
reviews of risk management controls and procedures, the results of which are reported to the Audit Committee.
For
per
sona
l use
onl
y
Ainsworth Game Technology Limited Annual Financial Report for the year ended 30 June 2013
42
Ainsworth Game Technology Limited
Notes to the financial statements
5. Financial risk management (continued)
Credit risk
Credit risk is the risk of financial loss to the Group if a customer or counterparty to a financial instrument fails to meet
its contractual obligations, and arises principally from the Group’s receivables from customers.
Trade and other receivables
The Group’s exposure to credit risk is influenced mainly by the individual characteristics of each customer, including
the default risk of the industry and country in which customers operate. The Group’s most significant receivable
amount is represented by a customer within South America, which accounts for 4% (2012: 10%) of the trade
receivables carrying amount as at 30 June 2013.
Credit policy guidelines have been introduced under which each new customer is assessed by the compliance
division as to suitability and analysed for creditworthiness before the Group’s standard payment and delivery terms
and conditions are offered. The Group’s review includes investigations, external ratings, when available, and in
some cases bank references. Purchase limits are established for each customer, which represents the maximum
open amount without requiring approval from the Board. Customers that fail to meet the Group’s creditworthiness
criteria may only transact with the Group within established limits unless Board approval is received or otherwise
only on a prepayment basis.
In monitoring customer credit risk, customers are grouped according to their credit characteristics, including whether
they are an individual or legal entity, whether they are a distributor, operator or customer, geographic location, aging
profile, maturity and existence of previous financial difficulties. The Group’s trade and other receivables relate
mainly to the Group’s direct customers, operators and established distributors. Customers that are graded as “high
risk” require future sales to be made on a prepayment basis within sales limits approved by the Chief Executive
Officer and Chief Financial Officer, and thereafter only with Board approval.
Goods are sold subject to retention of title clauses, so that in the event of non-payment the Group may have a
secured claim. The Group does not require collateral in respect of trade and other receivables.
The Group has established an allowance for impairment that represents its estimate of incurred losses in respect of
trade and other receivables. The main components of this allowance are a specific loss component that relates to
individually significant exposures.
Guarantees
The Group’s policy is to provide financial guarantees only for wholly-owned subsidiaries. At 30 June 2013 no guarantees were outstanding (2012: none).
Liquidity risk
Liquidity risk is the risk that the Group will not be able to meet its financial obligations as they fall due. The Group’s
approach to managing liquidity is to ensure, as far as possible, that it will always have sufficient liquidity to meet its
liabilities when due, under both normal and stressed conditions, without incurring unacceptable losses or risking
damage to the Group’s reputation.
Typically the Group ensures that it has access to sufficient cash on demand to meet expected operational expenses
for a period of 60 days, including the servicing of financial obligations; this excludes the potential impact of extreme
circumstances that cannot reasonably be predicted, such as natural disasters.
Market risk
Market risk is the risk that changes in market prices, such as foreign exchange rates and interest rates will affect the
Group’s income or the value of its holdings of financial instruments. The objective of market risk management is to
manage and control market risk exposures within acceptable parameters, while optimising the return.
For
per
sona
l use
onl
y
Ainsworth Game Technology Limited Annual Financial Report for the year ended 30 June 2013
43
Ainsworth Game Technology Limited
Notes to the financial statements
5. Financial risk management (continued) Currency risk
The Group is exposed to currency risk on sales and purchases that are denominated in a currency other than the
respective functional currencies of Group entities, primarily the Australian dollar (AUD), but also the US dollar
(USD). The currencies in which these transactions primarily are denominated are AUD, USD, Euro and New
Zealand dollars (NZD). The Group regularly monitors and reviews, dependant on available facilities, the hedging of
net assets denominated in a foreign currency. The Group has previously utilised currency call options to hedge its
currency risk, most with a maturity of less than six months. No hedging arrangements were utilised during the
reporting period.
In respect of other monetary assets and liabilities denominated in foreign currencies, the Group monitors its net
exposure to address short-term imbalances in its exposure.
Interest rate risk
The Group’s borrowing rates are fixed and no interest rate risk exists.
Capital management
The Board’s policy is to maintain a strong capital base so as to maintain investor, creditor and market confidence
and to sustain future development of the business. The Board continues to monitor group performance so as to
ensure an acceptable return on capital is achieved and that dividends are able to be provided to ordinary
shareholders in the short term.
The Board continues to review alternatives to ensure present employees will hold 3-5% of the Company’s ordinary
shares. This is expected to be partially achieved assuming all outstanding share options issued vest and/or are
exercised. These share options were issued on 1 March 2011 to all Australian employees over a portion of the
Executive Chairman’s shareholding under the ASOT plan and to US employees under the ESOT plan, see note 23.
There were no changes in the Group’s approach to capital management during the year. The Group is not subject
to externally imposed capital requirements.
6. Operating segments The Group has nine reportable segments as identified below, which are the Group’s strategic business units. For
each of the strategic business units, the Chief Executive Officer (CEO) reviews internal management reports on a
monthly basis. The Group’s corporate head office is located in New South Wales, Australia where all design and
development is undertaken and manufacturing facilities are operated. Sales offices are operated in New South
Wales, Queensland and the Americas (Florida and Nevada).
From January 2012, the Group also operates a product assembly facility in Nevada.
Information regarding the results of each reportable segment is included below. Performance is measured based on
segment revenue and segment result as included in internal management reports that are reviewed by the Group’s
CEO. Segment result only takes into account directly attributable costs, which management believes is the most
relevant approach in evaluating segment performance.
A recognition of segment result to net profit after tax is also included below.
For
per
sona
l use
onl
y
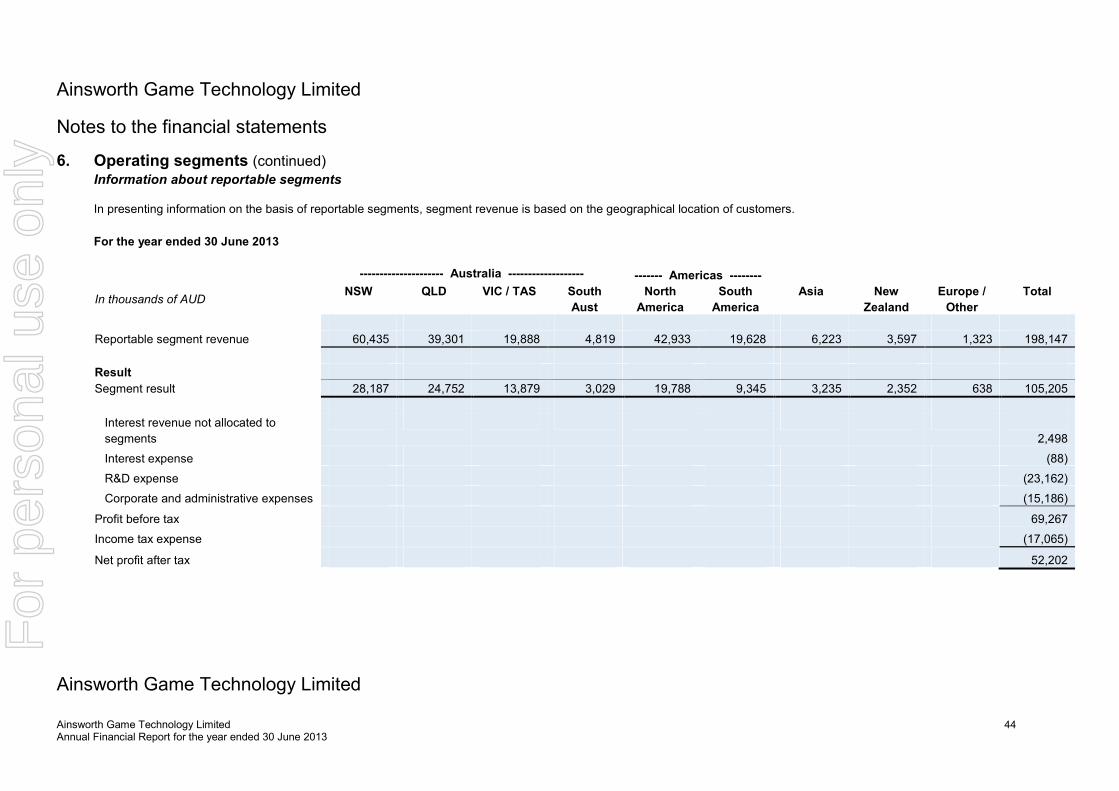
Ainsworth Game Technology Limited Annual Financial Report for the year ended 30 June 2013
44
Ainsworth Game Technology Limited
Notes to the financial statements
6. Operating segments (continued) Information about reportable segments
In presenting information on the basis of reportable segments, segment revenue is based on the geographical location of customers.
For the year ended 30 June 2013
Ainsworth Game Technology Limited
--------------------- Australia ------------------- ------- Americas --------
In thousands of AUD NSW QLD VIC / TAS South
Aust
North
America
South
America
Asia New
Zealand
Europe /
Other
Total
Reportable segment revenue 60,435 39,301 19,888 4,819 42,933 19,628 6,223 3,597 1,323 198,147
Result
Segment result 28,187 24,752 13,879 3,029 19,788 9,345 3,235 2,352 638 105,205
Interest revenue not allocated to
segments
2,498
Interest expense (88)
R&D expense (23,162)
Corporate and administrative expenses (15,186)
Profit before tax 69,267
Income tax expense (17,065)
Net profit after tax 52,202
For
per
sona
l use
onl
y
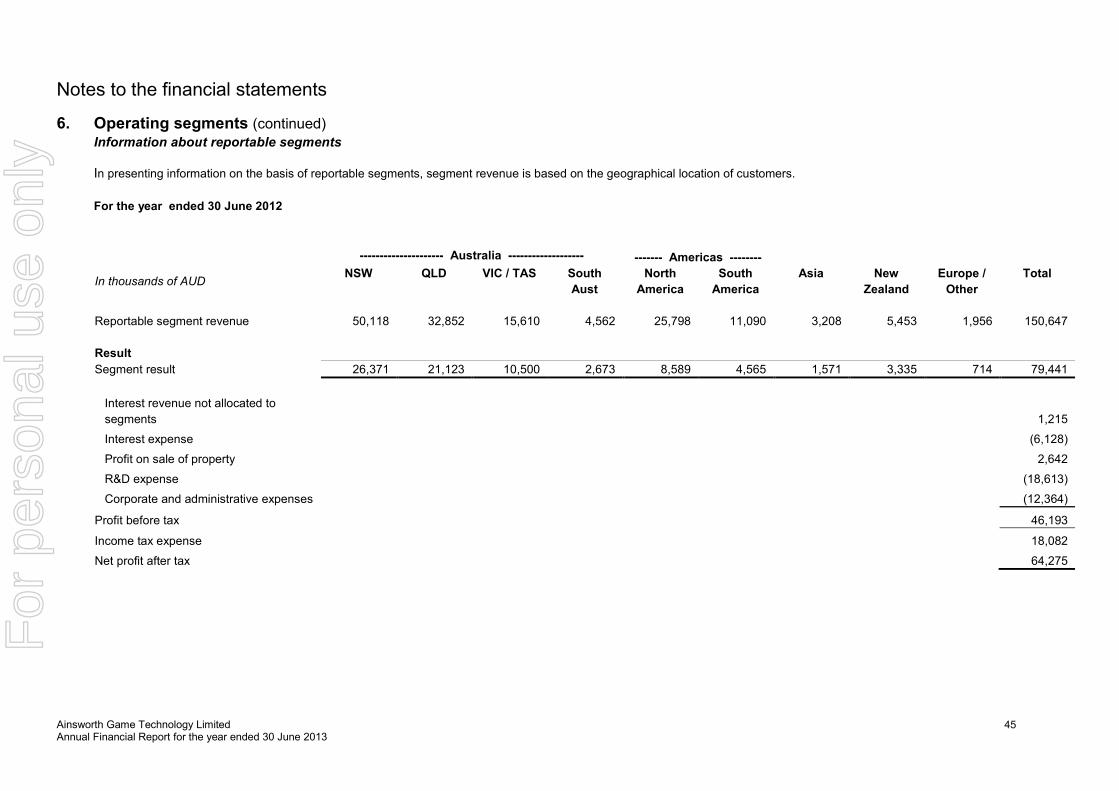
Ainsworth Game Technology Limited Annual Financial Report for the year ended 30 June 2013
45
Notes to the financial statements
6. Operating segments (continued) Information about reportable segments
In presenting information on the basis of reportable segments, segment revenue is based on the geographical location of customers.
For the year ended 30 June 2012
--------------------- Australia ------------------- ------- Americas --------
In thousands of AUD NSW QLD VIC / TAS South
Aust
North
America
South
America
Asia New
Zealand
Europe /
Other
Total
Reportable segment revenue 50,118 32,852 15,610 4,562 25,798 11,090 3,208 5,453 1,956 150,647
Result
Segment result 26,371 21,123 10,500 2,673 8,589 4,565 1,571 3,335 714 79,441
Interest revenue not allocated to
segments
1,215
Interest expense (6,128)
Profit on sale of property 2,642
R&D expense (18,613)
Corporate and administrative expenses (12,364)
Profit before tax 46,193
Income tax expense 18,082
Net profit after tax 64,275
For
per
sona
l use
onl
y
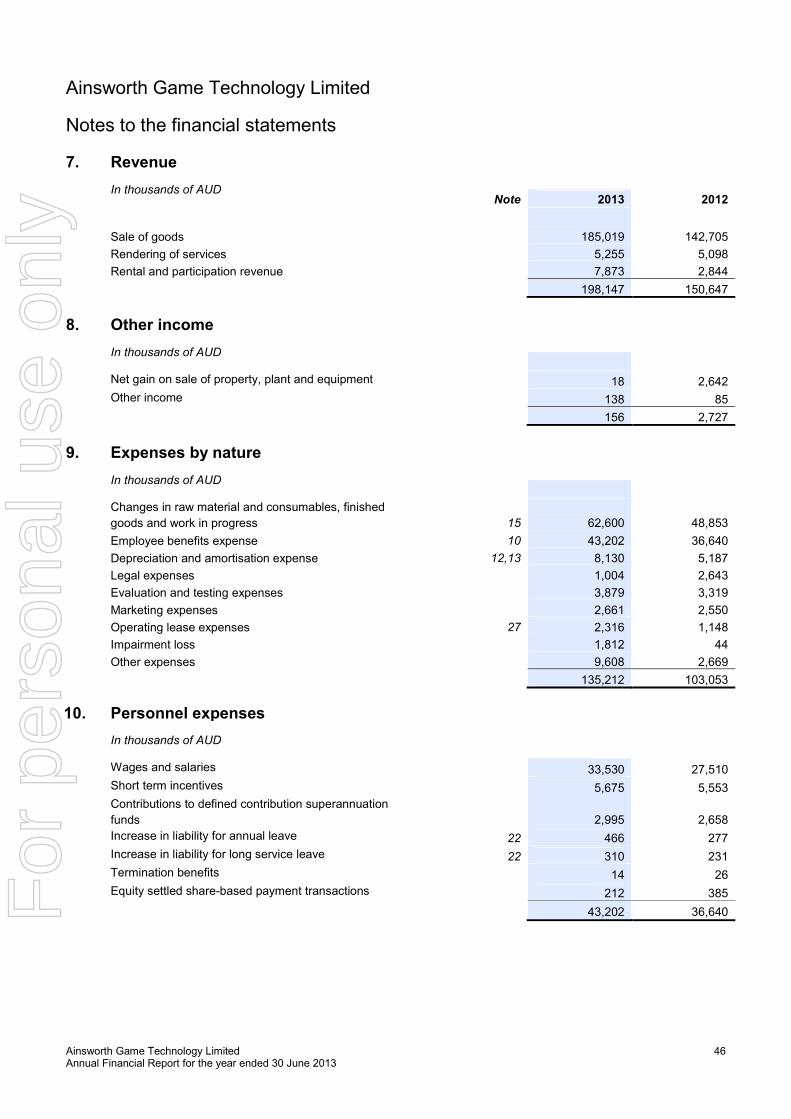
Ainsworth Game Technology Limited Annual Financial Report for the year ended 30 June 2013
46
Ainsworth Game Technology Limited
Notes to the financial statements
7. Revenue
In thousands of AUD
Note 2013 2012
Sale of goods 185,019 142,705
Rendering of services 5,255 5,098
Rental and participation revenue 7,873 2,844
198,147 150,647
8. Other income
In thousands of AUD
Net gain on sale of property, plant and equipment 18 2,642
Other income 138 85
156 2,727
9. Expenses by nature
In thousands of AUD
Changes in raw material and consumables, finished
goods and work in progress 15 62,600 48,853
Employee benefits expense 10 43,202 36,640
Depreciation and amortisation expense 12,13 8,130 5,187
Legal expenses 1,004 2,643
Evaluation and testing expenses 3,879 3,319
Marketing expenses 2,661 2,550
Operating lease expenses 27 2,316 1,148
Impairment loss 1,812 44
Other expenses 9,608 2,669
135,212 103,053
10. Personnel expenses
In thousands of AUD
Wages and salaries 33,530 27,510
Short term incentives 5,675 5,553
Contributions to defined contribution superannuation
funds 2,995 2,658
Increase in liability for annual leave 22 466 277
Increase in liability for long service leave 22 310 231
Termination benefits 14 26
Equity settled share-based payment transactions 212 385
43,202 36,640
For
per
sona
l use
onl
y
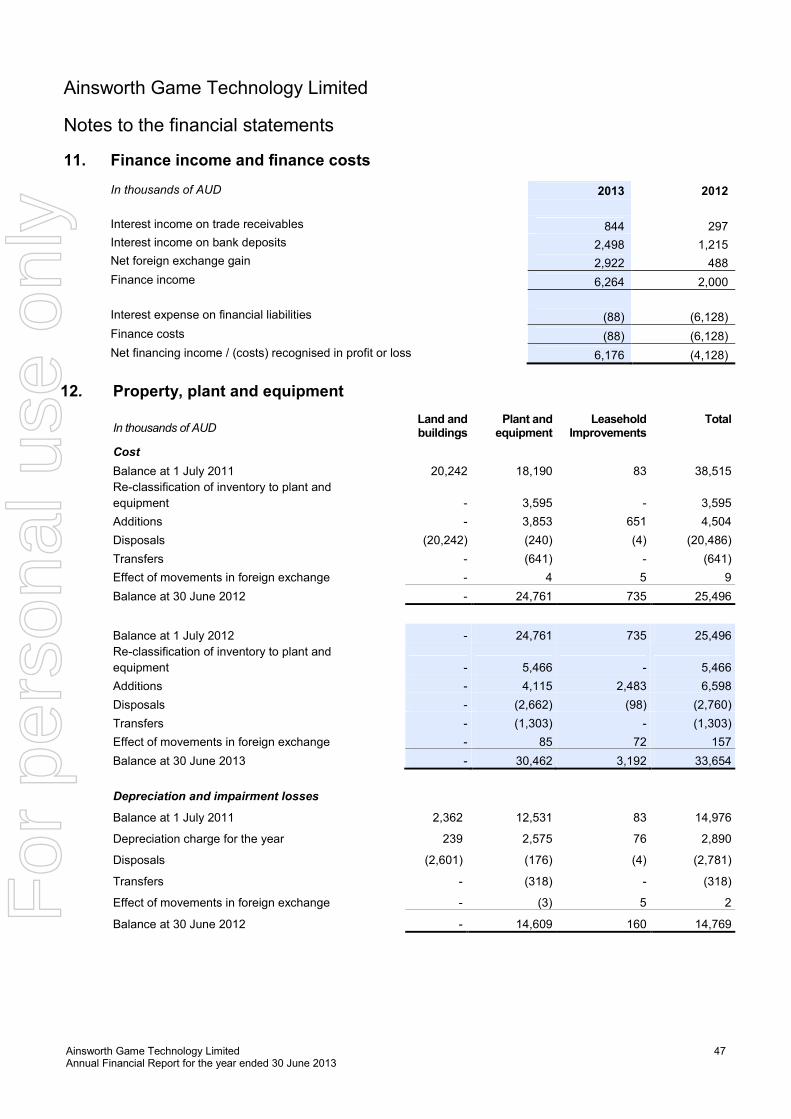
Ainsworth Game Technology Limited Annual Financial Report for the year ended 30 June 2013
47
Ainsworth Game Technology Limited
Notes to the financial statements 11. Finance income and finance costs
In thousands of AUD 2013 2012
Interest income on trade receivables 844 297
Interest income on bank deposits 2,498 1,215
Net foreign exchange gain 2,922 488
Finance income 6,264 2,000
Interest expense on financial liabilities (88) (6,128)
Finance costs (88) (6,128)
Net financing income / (costs) recognised in profit or loss 6,176 (4,128)
12. Property, plant and equipment
In thousands of AUD
Land and buildings
Plant and equipment
Leasehold Improvements
Total
Cost
Balance at 1 July 2011 20,242 18,190 83 38,515
Re-classification of inventory to plant and
equipment - 3,595 - 3,595
Additions - 3,853 651 4,504
Disposals (20,242) (240) (4) (20,486)
Transfers - (641) - (641)
Effect of movements in foreign exchange - 4 5 9
Balance at 30 June 2012 - 24,761 735 25,496
Balance at 1 July 2012 - 24,761 735 25,496
Re-classification of inventory to plant and
equipment - 5,466 - 5,466
Additions - 4,115 2,483 6,598
Disposals - (2,662) (98) (2,760)
Transfers - (1,303) - (1,303)
Effect of movements in foreign exchange - 85 72 157
Balance at 30 June 2013 - 30,462 3,192 33,654
Depreciation and impairment losses
Balance at 1 July 2011 2,362 12,531 83 14,976
Depreciation charge for the year 239 2,575 76 2,890
Disposals (2,601) (176) (4) (2,781)
Transfers - (318) - (318)
Effect of movements in foreign exchange - (3) 5 2
Balance at 30 June 2012 - 14,609 160 14,769
For
per
sona
l use
onl
y
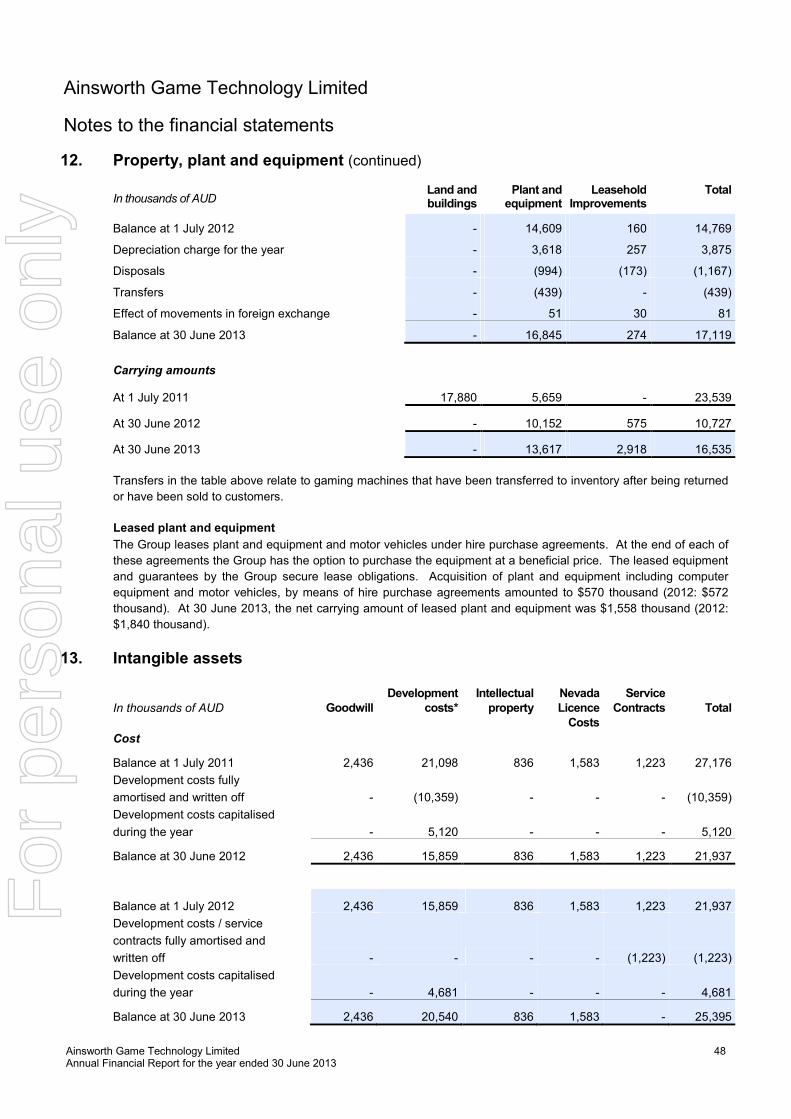
Ainsworth Game Technology Limited Annual Financial Report for the year ended 30 June 2013
48
Ainsworth Game Technology Limited
Notes to the financial statements
12. Property, plant and equipment (continued)
In thousands of AUD Land and
buildings Plant and equipment
Leasehold Improvements
Total
Balance at 1 July 2012 - 14,609 160 14,769
Depreciation charge for the year - 3,618 257 3,875
Disposals - (994) (173) (1,167)
Transfers - (439) - (439)
Effect of movements in foreign exchange - 51 30 81
Balance at 30 June 2013 - 16,845 274 17,119
Carrying amounts
At 1 July 2011 17,880 5,659 - 23,539
At 30 June 2012 - 10,152 575 10,727
At 30 June 2013 - 13,617 2,918 16,535
Transfers in the table above relate to gaming machines that have been transferred to inventory after being returned
or have been sold to customers.
Leased plant and equipment
The Group leases plant and equipment and motor vehicles under hire purchase agreements. At the end of each of
these agreements the Group has the option to purchase the equipment at a beneficial price. The leased equipment
and guarantees by the Group secure lease obligations. Acquisition of plant and equipment including computer
equipment and motor vehicles, by means of hire purchase agreements amounted to $570 thousand (2012: $572
thousand). At 30 June 2013, the net carrying amount of leased plant and equipment was $1,558 thousand (2012:
$1,840 thousand).
13. Intangible assets
In thousands of AUD
Goodwill
Development costs*
Intellectual property
Nevada Licence Costs
Service Contracts
Total
Cost
Balance at 1 July 2011 2,436 21,098 836 1,583 1,223 27,176
Development costs fully
amortised and written off - (10,359) - - - (10,359)
Development costs capitalised
during the year - 5,120 - - - 5,120
Balance at 30 June 2012 2,436 15,859 836 1,583 1,223 21,937
Balance at 1 July 2012 2,436 15,859 836 1,583 1,223 21,937
Development costs / service
contracts fully amortised and
written off - - - - (1,223) (1,223)
Development costs capitalised
during the year - 4,681 - - - 4,681
Balance at 30 June 2013 2,436 20,540 836 1,583 - 25,395
For
per
sona
l use
onl
y
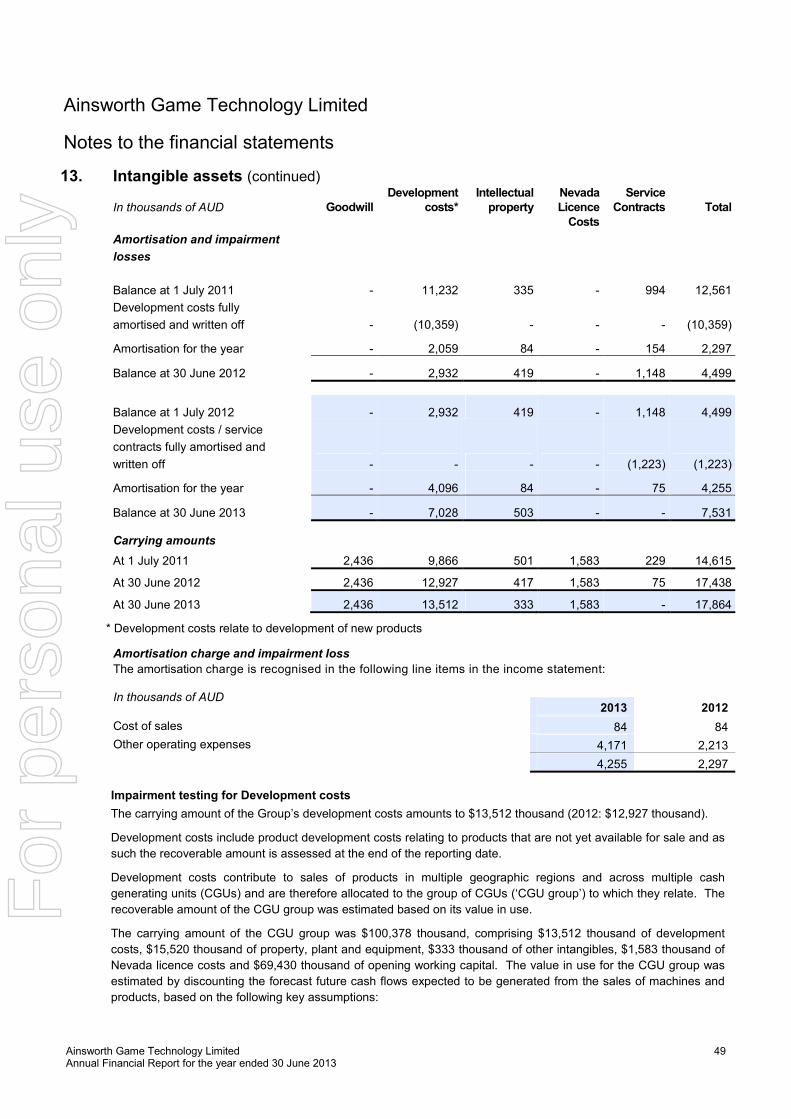
Ainsworth Game Technology Limited Annual Financial Report for the year ended 30 June 2013
49
Ainsworth Game Technology Limited
Notes to the financial statements
13. Intangible assets (continued)
In thousands of AUD
Goodwill Development
costs* Intellectual property
Nevada Licence Costs
Service Contracts
Total
Amortisation and impairment
losses
Balance at 1 July 2011 - 11,232 335 - 994 12,561
Development costs fully
amortised and written off - (10,359) - - - (10,359)
Amortisation for the year - 2,059 84 - 154 2,297
Balance at 30 June 2012 - 2,932 419 - 1,148 4,499
Balance at 1 July 2012 - 2,932 419 - 1,148 4,499
Development costs / service
contracts fully amortised and
written off - - - - (1,223) (1,223)
Amortisation for the year - 4,096 84 - 75 4,255
Balance at 30 June 2013 - 7,028 503 - - 7,531
Carrying amounts
At 1 July 2011 2,436 9,866 501 1,583 229 14,615
At 30 June 2012 2,436 12,927 417 1,583 75 17,438
At 30 June 2013 2,436 13,512 333 1,583 - 17,864
* Development costs relate to development of new products
Amortisation charge and impairment loss
The amortisation charge is recognised in the following line items in the income statement:
In thousands of AUD
2013 2012
Cost of sales 84 84
Other operating expenses 4,171 2,213
4,255 2,297
Impairment testing for Development costs
The carrying amount of the Group’s development costs amounts to $13,512 thousand (2012: $12,927 thousand).
Development costs include product development costs relating to products that are not yet available for sale and as
such the recoverable amount is assessed at the end of the reporting date.
Development costs contribute to sales of products in multiple geographic regions and across multiple cash
generating units (CGUs) and are therefore allocated to the group of CGUs (‘CGU group’) to which they relate. The
recoverable amount of the CGU group was estimated based on its value in use.
The carrying amount of the CGU group was $100,378 thousand, comprising $13,512 thousand of development
costs, $15,520 thousand of property, plant and equipment, $333 thousand of other intangibles, $1,583 thousand of
Nevada licence costs and $69,430 thousand of opening working capital. The value in use for the CGU group was
estimated by discounting the forecast future cash flows expected to be generated from the sales of machines and
products, based on the following key assumptions:
For
per
sona
l use
onl
y
Ainsworth Game Technology Limited Annual Financial Report for the year ended 30 June 2013
50
Ainsworth Game Technology Limited
Notes to the financial statements
13. Intangible assets (continued) Impairment testing for Development costs (continued)
• Cash inflows in the years 2014 to 2016 from the sale of the group’s products, estimated based on forecast
revenue, having regard to Board approved budgets, the Group’s 3 year business plan and supporting strategic
actions, historical experience and actual operating results;
• Annual revenue growth forecast in the year after the Group’s 3 year business plan of 5% for the year 2017 ;
• Positive cash flows will be generated for 4 years; and
• A discount rate of 10.2% based on the weighted average cost of capital adjusted for uncertainty of regulatory
conditions.
As the recoverable amount of the CGU group tested was estimated to be higher than the carrying amount of the
group, no impairment was considered necessary.
Impairment testing for Nevada licence costs
The Nevada licence costs capitalised are classified as an intangible asset with an indefinite life, and as such the
recoverable amount is assessed at each reporting date.
The carrying amount of $4,589 thousand, comprising of $1,583 thousand of Nevada licence costs and $3,006
thousand of gaming machines under leasing arrangements capitalised in property, plant and equipment was
allocated to the Nevada CGU without corporate assets in a ‘bottom-up test’ under the key assumptions noted
below. The Nevada licence costs were also included in the impairment assessment for the minimum collection of
CGUs to which corporate assets can be allocated reasonably and consistently (‘top-down test’) under the key
assumptions noted above (refer Impairment testing for Development Costs above).
The value in use for the Nevada CGU was estimated by discounting the forecasted future cash flows to be
generated from the sale of machines and products in Nevada, and was based on the following key assumptions:
• Cash inflows in the years 2014 to 2016, from the sale of the group’s products, estimated based on forecast
sales revenue, having regard to Board approved budgets, the Group’s 3 year business plan and supporting
strategic actions;
• Annual revenue growth forecasts in the years after the Group’s 3 year business plan of 5% for the years 2017
and 2018;
• The Nevada license will generate cash flows for 5 years; and
• A discount rate of 10.2% based on the weighted average cost of capital adjusted for volatility of regulatory conditions.
As the recoverable amount of the CGUs tested under both the bottom-up test and the top-down test were estimated
to be higher than the carrying amount of the asset, no impairment was considered necessary.
Impairment testing for goodwill
Goodwill relates to acquired service businesses and entities in Australia. The recoverable amount of the Australian
service CGU was estimated based on its value in use.
The carrying amount of the Australian service CGU was $3,804 thousand, comprising of $1,015 thousand of
property, plant and equipment, $104 thousand of other intangibles, $2,149 thousand of goodwill and $536 thousand
of opening working capital. Value in use was determined by discounting the future cash flows generated from the
continuing use of the service unit and was based on the following key assumptions:
For
per
sona
l use
onl
y
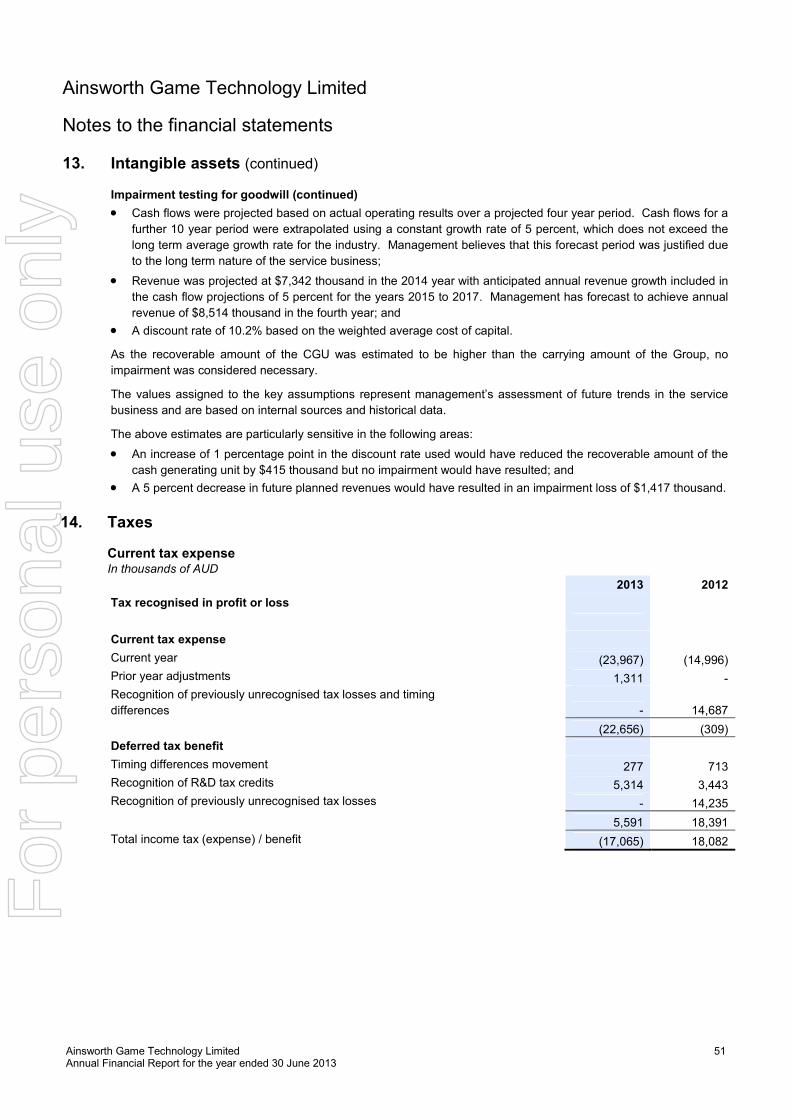
Ainsworth Game Technology Limited Annual Financial Report for the year ended 30 June 2013
51
Ainsworth Game Technology Limited
Notes to the financial statements
13. Intangible assets (continued)
Impairment testing for goodwill (continued)
• Cash flows were projected based on actual operating results over a projected four year period. Cash flows for a
further 10 year period were extrapolated using a constant growth rate of 5 percent, which does not exceed the
long term average growth rate for the industry. Management believes that this forecast period was justified due
to the long term nature of the service business;
• Revenue was projected at $7,342 thousand in the 2014 year with anticipated annual revenue growth included in
the cash flow projections of 5 percent for the years 2015 to 2017. Management has forecast to achieve annual
revenue of $8,514 thousand in the fourth year; and
• A discount rate of 10.2% based on the weighted average cost of capital.
As the recoverable amount of the CGU was estimated to be higher than the carrying amount of the Group, no
impairment was considered necessary.
The values assigned to the key assumptions represent management’s assessment of future trends in the service
business and are based on internal sources and historical data.
The above estimates are particularly sensitive in the following areas:
• An increase of 1 percentage point in the discount rate used would have reduced the recoverable amount of the
cash generating unit by $415 thousand but no impairment would have resulted; and
• A 5 percent decrease in future planned revenues would have resulted in an impairment loss of $1,417 thousand.
14. Taxes
Current tax expense In thousands of AUD
2013 2012
Tax recognised in profit or loss
Current tax expense
Current year (23,967) (14,996)
Prior year adjustments 1,311 -
Recognition of previously unrecognised tax losses and timing
differences - 14,687
(22,656) (309)
Deferred tax benefit
Timing differences movement 277 713
Recognition of R&D tax credits 5,314 3,443
Recognition of previously unrecognised tax losses - 14,235
5,591 18,391
Total income tax (expense) / benefit (17,065) 18,082
For
per
sona
l use
onl
y
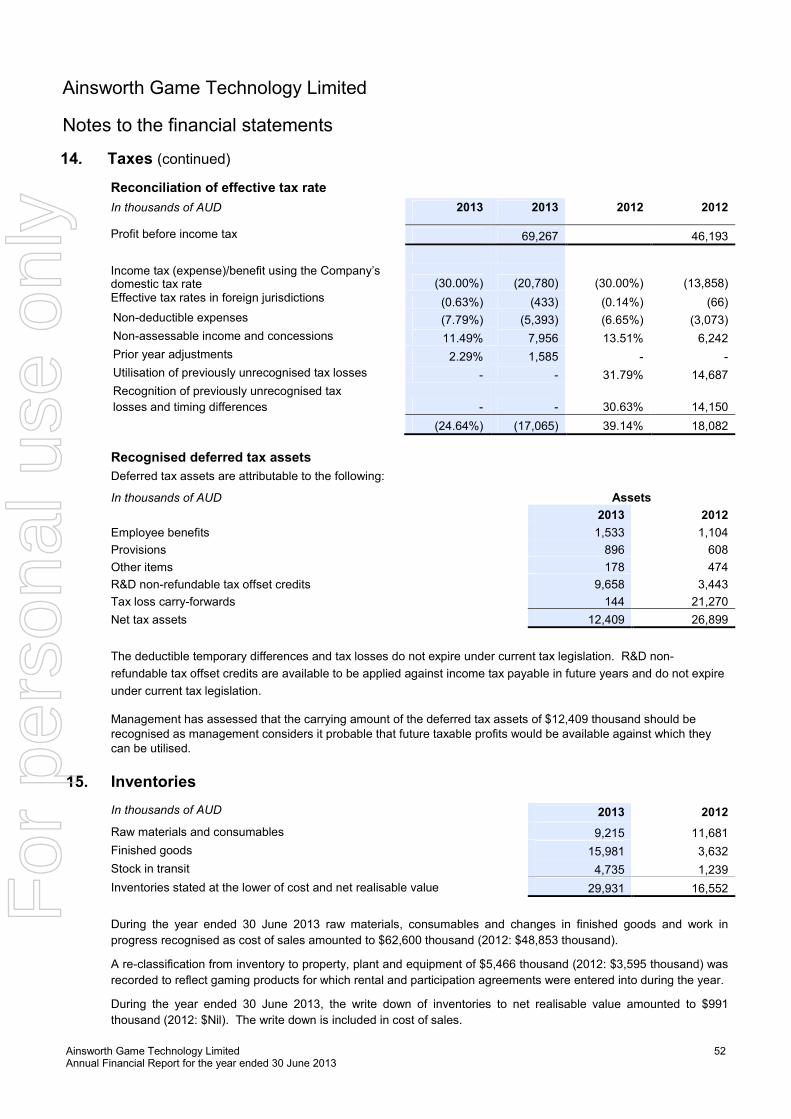
Ainsworth Game Technology Limited Annual Financial Report for the year ended 30 June 2013
52
Ainsworth Game Technology Limited
Notes to the financial statements
14. Taxes (continued)
Reconciliation of effective tax rate
In thousands of AUD 2013 2013 2012 2012
Profit before income tax 69,267 46,193
Income tax (expense)/benefit using the Company’s domestic tax rate (30.00%) (20,780) (30.00%) (13,858)
Effective tax rates in foreign jurisdictions (0.63%) (433) (0.14%) (66)
Non-deductible expenses (7.79%) (5,393) (6.65%) (3,073)
Non-assessable income and concessions 11.49% 7,956 13.51% 6,242
Prior year adjustments 2.29% 1,585 - -
Utilisation of previously unrecognised tax losses - - 31.79% 14,687
Recognition of previously unrecognised tax
losses and timing differences - - 30.63% 14,150
(24.64%) (17,065) 39.14% 18,082
Recognised deferred tax assets
Deferred tax assets are attributable to the following:
In thousands of AUD Assets
2013 2012
Employee benefits 1,533 1,104
Provisions 896 608
Other items 178 474
R&D non-refundable tax offset credits 9,658 3,443
Tax loss carry-forwards 144 21,270
Net tax assets 12,409 26,899
The deductible temporary differences and tax losses do not expire under current tax legislation. R&D non-
refundable tax offset credits are available to be applied against income tax payable in future years and do not expire
under current tax legislation. Management has assessed that the carrying amount of the deferred tax assets of $12,409 thousand should be recognised as management considers it probable that future taxable profits would be available against which they can be utilised.
15. Inventories
In thousands of AUD 2013 2012
Raw materials and consumables 9,215 11,681
Finished goods 15,981 3,632
Stock in transit 4,735 1,239
Inventories stated at the lower of cost and net realisable value 29,931 16,552
During the year ended 30 June 2013 raw materials, consumables and changes in finished goods and work in
progress recognised as cost of sales amounted to $62,600 thousand (2012: $48,853 thousand).
A re-classification from inventory to property, plant and equipment of $5,466 thousand (2012: $3,595 thousand) was
recorded to reflect gaming products for which rental and participation agreements were entered into during the year.
During the year ended 30 June 2013, the write down of inventories to net realisable value amounted to $991
thousand (2012: $Nil). The write down is included in cost of sales.
For
per
sona
l use
onl
y
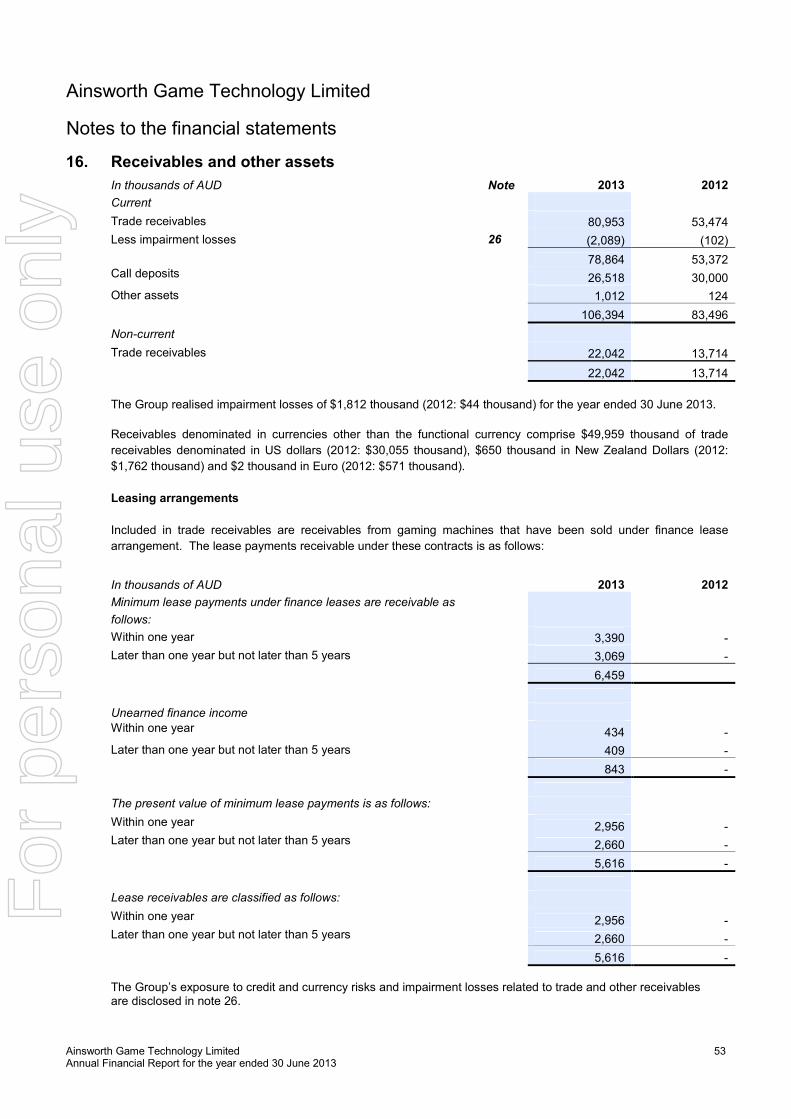
Ainsworth Game Technology Limited Annual Financial Report for the year ended 30 June 2013
53
16. Receivables and other assets In thousands of AUD Note 2013 2012
Current
Trade receivables 80,953 53,474
Less impairment losses 26 (2,089) (102)
78,864 53,372
Call deposits 26,518 30,000
Other assets 1,012 124
106,394 83,496
Non-current
Trade receivables 22,042 13,714
22,042 13,714
The Group realised impairment losses of $1,812 thousand (2012: $44 thousand) for the year ended 30 June 2013.
Receivables denominated in currencies other than the functional currency comprise $49,959 thousand of trade
receivables denominated in US dollars (2012: $30,055 thousand), $650 thousand in New Zealand Dollars (2012:
$1,762 thousand) and $2 thousand in Euro (2012: $571 thousand).
Leasing arrangements
Included in trade receivables are receivables from gaming machines that have been sold under finance lease
arrangement. The lease payments receivable under these contracts is as follows:
In thousands of AUD 2013 2012
Minimum lease payments under finance leases are receivable as
follows:
Within one year 3,390 -
Later than one year but not later than 5 years 3,069 -
6,459
Unearned finance income
Within one year 434 -
Later than one year but not later than 5 years 409 -
843 -
The present value of minimum lease payments is as follows:
Within one year 2,956 -
Later than one year but not later than 5 years 2,660 -
5,616 -
Lease receivables are classified as follows:
Within one year 2,956 -
Later than one year but not later than 5 years 2,660 -
5,616 -
The Group’s exposure to credit and currency risks and impairment losses related to trade and other receivables
are disclosed in note 26.
Ainsworth Game Technology Limited
Notes to the financial statements
For
per
sona
l use
onl
y
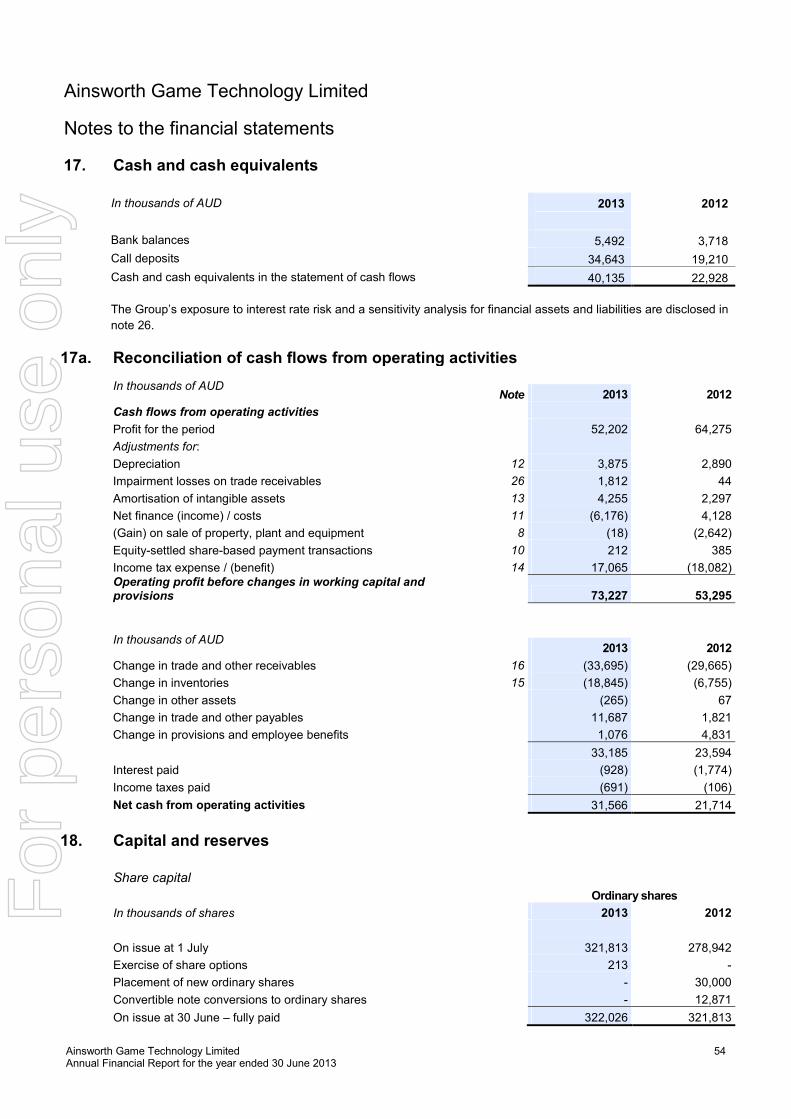
Ainsworth Game Technology Limited Annual Financial Report for the year ended 30 June 2013
54
17. Cash and cash equivalents In thousands of AUD 2013 2012
Bank balances 5,492 3,718
Call deposits 34,643 19,210
Cash and cash equivalents in the statement of cash flows 40,135 22,928
The Group’s exposure to interest rate risk and a sensitivity analysis for financial assets and liabilities are disclosed in
note 26.
17a. Reconciliation of cash flows from operating activities
In thousands of AUD
Note 2013 2012
Cash flows from operating activities
Profit for the period 52,202 64,275
Adjustments for:
Depreciation 12 3,875 2,890
Impairment losses on trade receivables 26 1,812 44
Amortisation of intangible assets 13 4,255 2,297
Net finance (income) / costs 11 (6,176) 4,128
(Gain) on sale of property, plant and equipment 8 (18) (2,642)
Equity-settled share-based payment transactions 10 212 385
Income tax expense / (benefit) 14 17,065 (18,082)
Operating profit before changes in working capital and provisions 73,227 53,295
In thousands of AUD
2013 2012
Change in trade and other receivables 16 (33,695) (29,665)
Change in inventories 15 (18,845) (6,755)
Change in other assets (265) 67
Change in trade and other payables 11,687 1,821
Change in provisions and employee benefits 1,076 4,831
33,185 23,594
Interest paid (928) (1,774)
Income taxes paid (691) (106)
Net cash from operating activities 31,566 21,714
18. Capital and reserves Share capital
Ordinary shares
In thousands of shares 2013 2012
On issue at 1 July 321,813 278,942
Exercise of share options 213 -
Placement of new ordinary shares - 30,000
Convertible note conversions to ordinary shares - 12,871
On issue at 30 June – fully paid 322,026 321,813
Ainsworth Game Technology Limited
Notes to the financial statements
For
per
sona
l use
onl
y
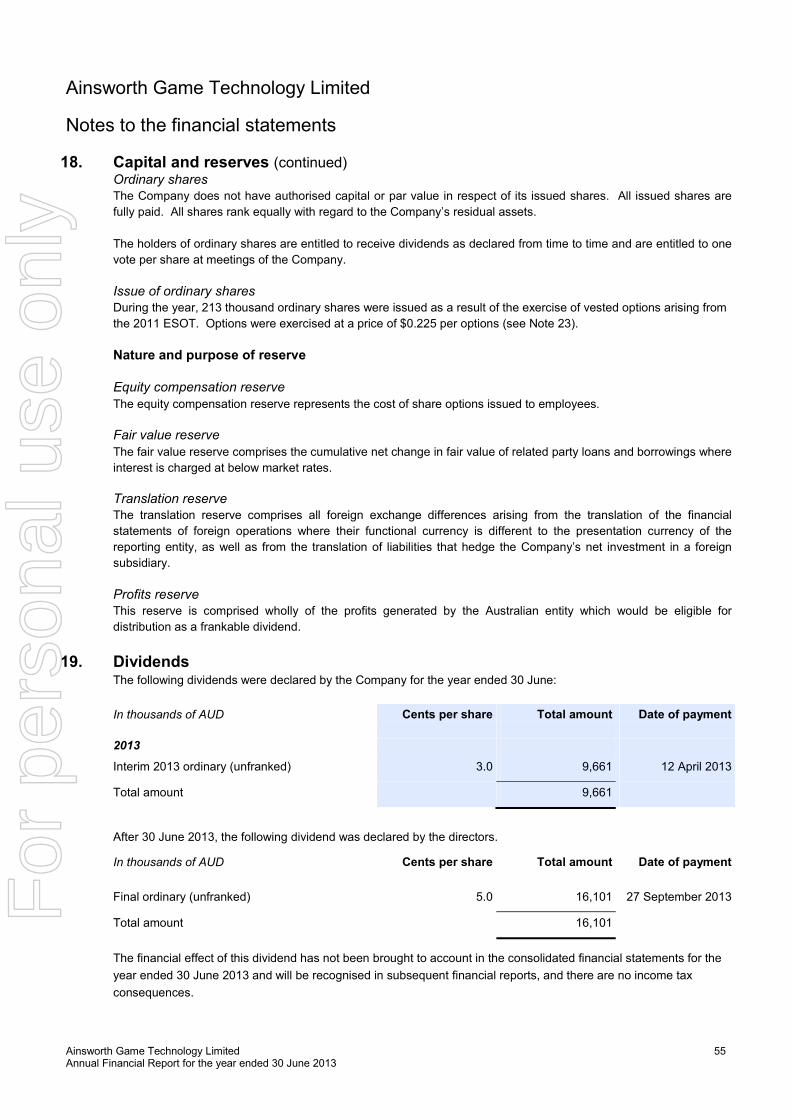
Ainsworth Game Technology Limited Annual Financial Report for the year ended 30 June 2013
55
Ainsworth Game Technology Limited
Notes to the financial statements
18. Capital and reserves (continued) Ordinary shares The Company does not have authorised capital or par value in respect of its issued shares. All issued shares are
fully paid. All shares rank equally with regard to the Company’s residual assets.
The holders of ordinary shares are entitled to receive dividends as declared from time to time and are entitled to one
vote per share at meetings of the Company.
Issue of ordinary shares During the year, 213 thousand ordinary shares were issued as a result of the exercise of vested options arising from
the 2011 ESOT. Options were exercised at a price of $0.225 per options (see Note 23).
Nature and purpose of reserve
Equity compensation reserve
The equity compensation reserve represents the cost of share options issued to employees.
Fair value reserve
The fair value reserve comprises the cumulative net change in fair value of related party loans and borrowings where
interest is charged at below market rates.
Translation reserve The translation reserve comprises all foreign exchange differences arising from the translation of the financial
statements of foreign operations where their functional currency is different to the presentation currency of the
reporting entity, as well as from the translation of liabilities that hedge the Company’s net investment in a foreign
subsidiary. Profits reserve This reserve is comprised wholly of the profits generated by the Australian entity which would be eligible for
distribution as a frankable dividend.
19. Dividends The following dividends were declared by the Company for the year ended 30 June:
In thousands of AUD Cents per share Total amount Date of payment
2013
Interim 2013 ordinary (unfranked) 3.0 9,661 12 April 2013
Total amount 9,661
After 30 June 2013, the following dividend was declared by the directors.
In thousands of AUD Cents per share Total amount Date of payment
Final ordinary (unfranked) 5.0 16,101 27 September 2013
Total amount 16,101
The financial effect of this dividend has not been brought to account in the consolidated financial statements for the
year ended 30 June 2013 and will be recognised in subsequent financial reports, and there are no income tax
consequences.
For
per
sona
l use
onl
y
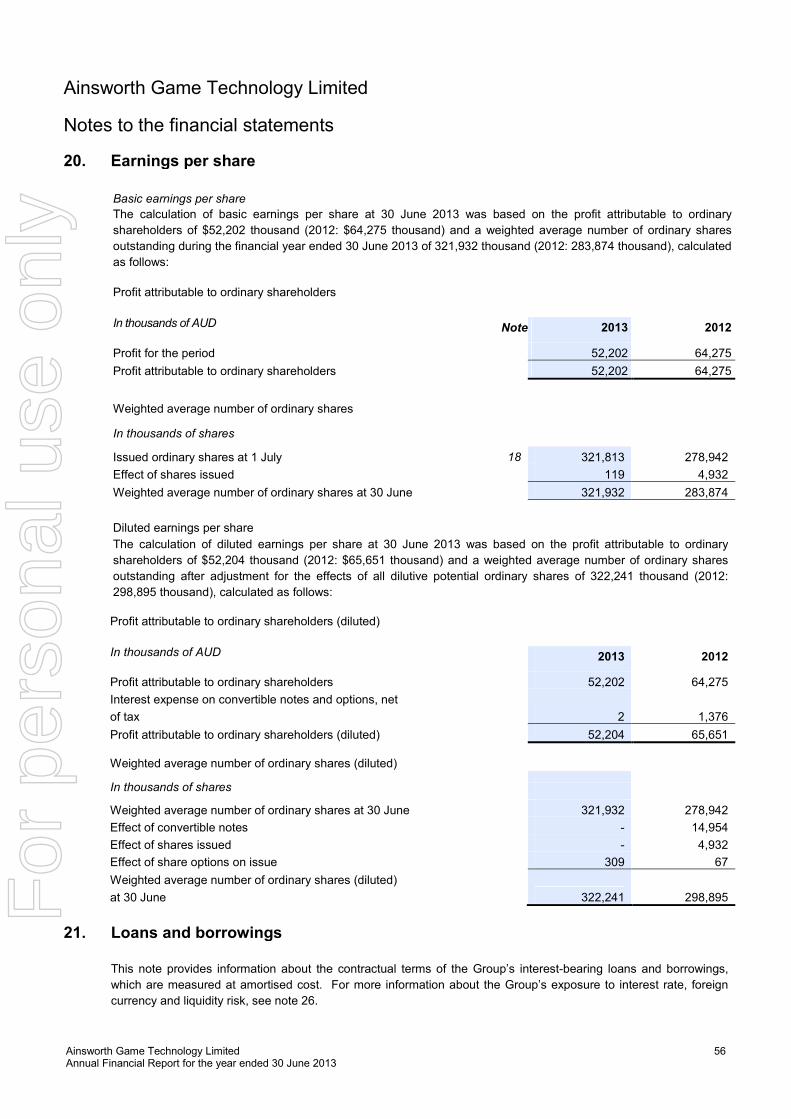
Ainsworth Game Technology Limited Annual Financial Report for the year ended 30 June 2013
56
Ainsworth Game Technology Limited
Notes to the financial statements
20. Earnings per share Basic earnings per share
The calculation of basic earnings per share at 30 June 2013 was based on the profit attributable to ordinary
shareholders of $52,202 thousand (2012: $64,275 thousand) and a weighted average number of ordinary shares
outstanding during the financial year ended 30 June 2013 of 321,932 thousand (2012: 283,874 thousand), calculated
as follows:
Profit attributable to ordinary shareholders
In thousands of AUD
Note 2013 2012
Profit for the period 52,202 64,275
Profit attributable to ordinary shareholders 52,202 64,275
Weighted average number of ordinary shares
In thousands of shares
Issued ordinary shares at 1 July 18 321,813 278,942
Effect of shares issued 119 4,932
Weighted average number of ordinary shares at 30 June 321,932 283,874
Diluted earnings per share The calculation of diluted earnings per share at 30 June 2013 was based on the profit attributable to ordinary
shareholders of $52,204 thousand (2012: $65,651 thousand) and a weighted average number of ordinary shares
outstanding after adjustment for the effects of all dilutive potential ordinary shares of 322,241 thousand (2012:
298,895 thousand), calculated as follows:
Profit attributable to ordinary shareholders (diluted)
In thousands of AUD
2013 2012
Profit attributable to ordinary shareholders 52,202 64,275
Interest expense on convertible notes and options, net
of tax
2 1,376
Profit attributable to ordinary shareholders (diluted) 52,204 65,651
Weighted average number of ordinary shares (diluted)
In thousands of shares
Weighted average number of ordinary shares at 30 June 321,932 278,942
Effect of convertible notes - 14,954
Effect of shares issued - 4,932
Effect of share options on issue 309 67
Weighted average number of ordinary shares (diluted)
at 30 June
322,241 298,895
21. Loans and borrowings This note provides information about the contractual terms of the Group’s interest-bearing loans and borrowings,
which are measured at amortised cost. For more information about the Group’s exposure to interest rate, foreign
currency and liquidity risk, see note 26.
For
per
sona
l use
onl
y
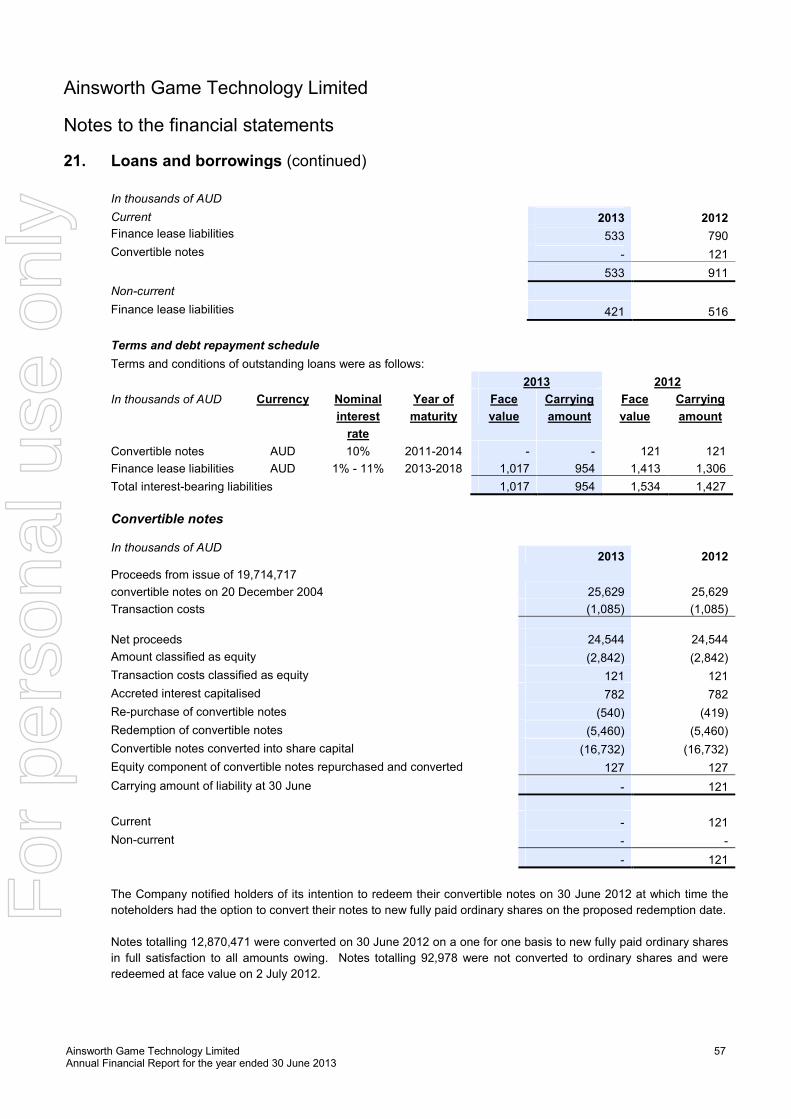
Ainsworth Game Technology Limited Annual Financial Report for the year ended 30 June 2013
57
Ainsworth Game Technology Limited
Notes to the financial statements
21. Loans and borrowings (continued) In thousands of AUD
Current 2013 2012
Finance lease liabilities 533 790
Convertible notes - 121
533 911
Non-current
Finance lease liabilities 421 516
Convertible notes
In thousands of AUD
2013 2012
Proceeds from issue of 19,714,717
convertible notes on 20 December 2004 25,629 25,629
Transaction costs (1,085) (1,085)
Net proceeds 24,544 24,544
Amount classified as equity (2,842) (2,842)
Transaction costs classified as equity 121 121
Accreted interest capitalised 782 782
Re-purchase of convertible notes (540) (419)
Redemption of convertible notes (5,460) (5,460)
Convertible notes converted into share capital (16,732) (16,732)
Equity component of convertible notes repurchased and converted 127 127
Carrying amount of liability at 30 June - 121
Current - 121
Non-current - -
- 121
The Company notified holders of its intention to redeem their convertible notes on 30 June 2012 at which time the
noteholders had the option to convert their notes to new fully paid ordinary shares on the proposed redemption date.
Notes totalling 12,870,471 were converted on 30 June 2012 on a one for one basis to new fully paid ordinary shares
in full satisfaction to all amounts owing. Notes totalling 92,978 were not converted to ordinary shares and were
redeemed at face value on 2 July 2012.
Terms and debt repayment schedule
Terms and conditions of outstanding loans were as follows:
2013 2012
In thousands of AUD Currency Nominal
interest
rate
Year of
maturity
Face
value
Carrying
amount
Face
value
Carrying
amount
Convertible notes AUD 10% 2011-2014 - - 121 121
Finance lease liabilities AUD 1% - 11% 2013-2018 1,017 954 1,413 1,306
Total interest-bearing liabilities 1,017 954 1,534 1,427
For
per
sona
l use
onl
y
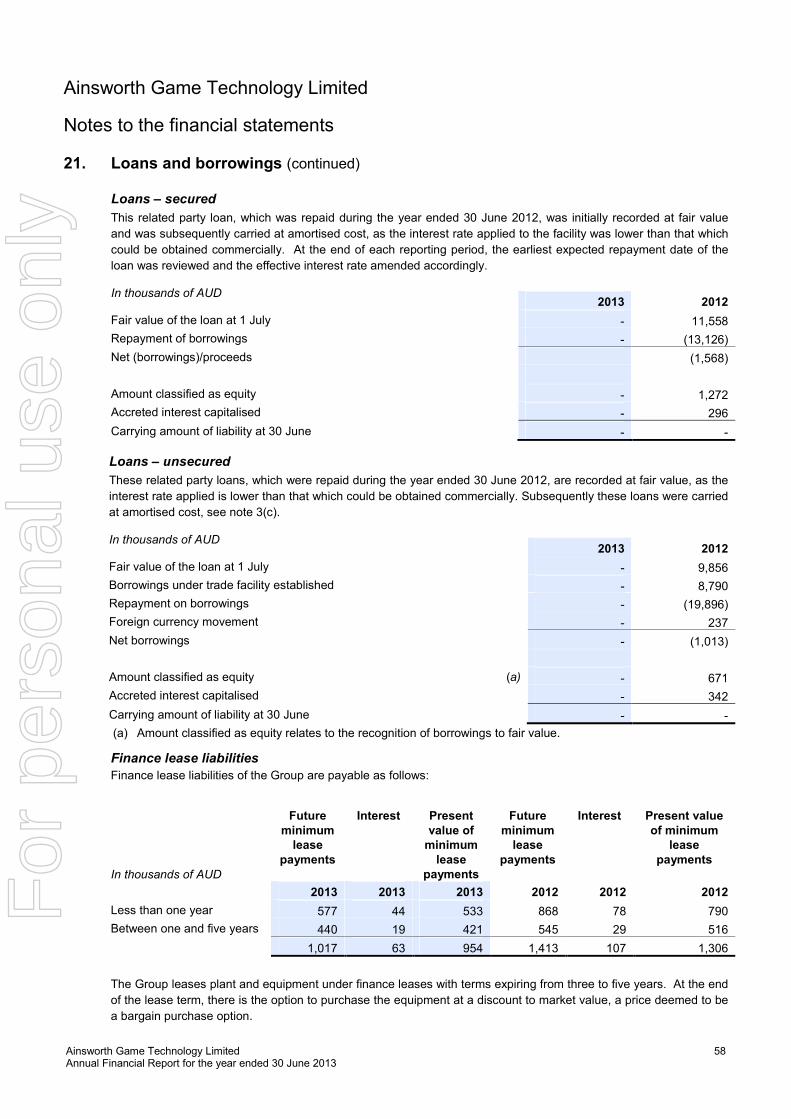
Ainsworth Game Technology Limited Annual Financial Report for the year ended 30 June 2013
58
Ainsworth Game Technology Limited
Notes to the financial statements
21. Loans and borrowings (continued)
Loans – secured
This related party loan, which was repaid during the year ended 30 June 2012, was initially recorded at fair value
and was subsequently carried at amortised cost, as the interest rate applied to the facility was lower than that which
could be obtained commercially. At the end of each reporting period, the earliest expected repayment date of the
loan was reviewed and the effective interest rate amended accordingly.
In thousands of AUD
2013 2012
Fair value of the loan at 1 July - 11,558
Repayment of borrowings - (13,126)
Net (borrowings)/proceeds (1,568)
Amount classified as equity - 1,272
Accreted interest capitalised - 296
Carrying amount of liability at 30 June - -
Loans – unsecured
These related party loans, which were repaid during the year ended 30 June 2012, are recorded at fair value, as the
interest rate applied is lower than that which could be obtained commercially. Subsequently these loans were carried
at amortised cost, see note 3(c).
In thousands of AUD
2013 2012
Fair value of the loan at 1 July - 9,856
Borrowings under trade facility established - 8,790
Repayment on borrowings - (19,896)
Foreign currency movement - 237
Net borrowings - (1,013)
Amount classified as equity (a) - 671
Accreted interest capitalised - 342
Carrying amount of liability at 30 June - -
(a) Amount classified as equity relates to the recognition of borrowings to fair value.
Finance lease liabilities
Finance lease liabilities of the Group are payable as follows:
In thousands of AUD
Future minimum lease
payments
Interest Present value of minimum lease
payments
Future minimum lease
payments
Interest Present value of minimum
lease payments
2013 2013 2013 2012 2012 2012
Less than one year 577 44 533 868 78 790
Between one and five years 440 19 421 545 29 516
1,017 63 954 1,413 107 1,306
The Group leases plant and equipment under finance leases with terms expiring from three to five years. At the end
of the lease term, there is the option to purchase the equipment at a discount to market value, a price deemed to be
a bargain purchase option.
For
per
sona
l use
onl
y
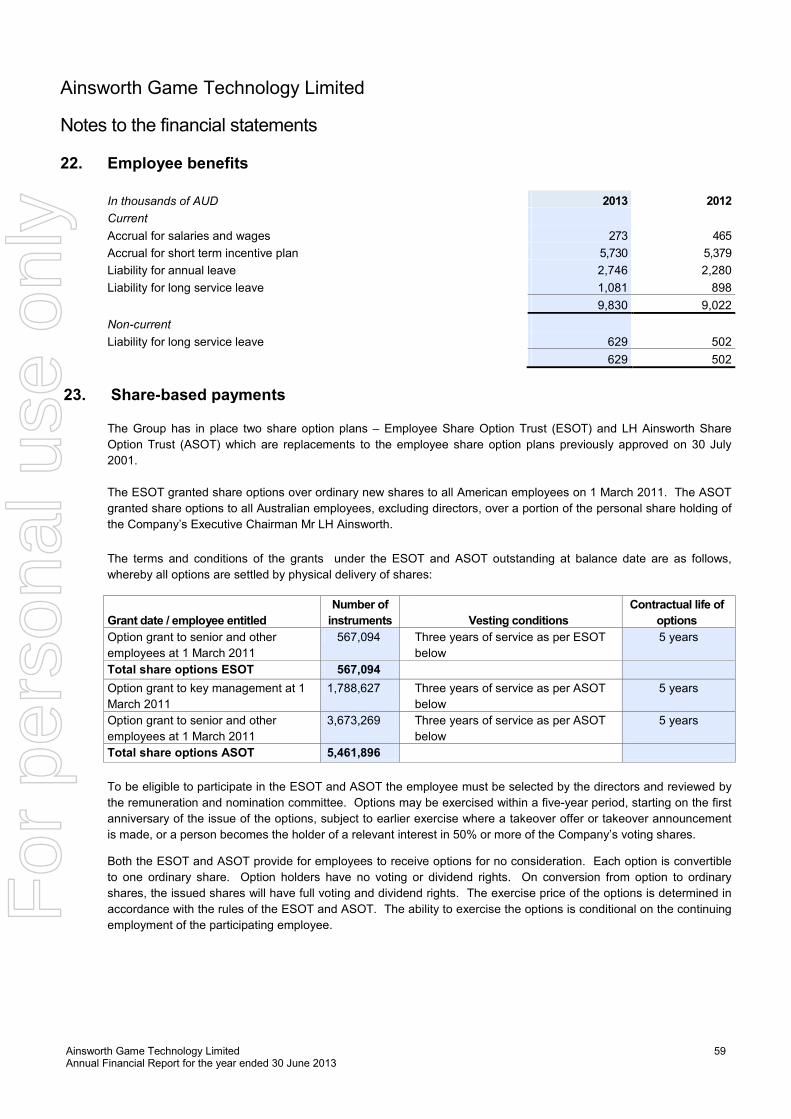
Ainsworth Game Technology Limited Annual Financial Report for the year ended 30 June 2013
59
Ainsworth Game Technology Limited
Notes to the financial statements 22. Employee benefits In thousands of AUD 2013 2012
Current
Accrual for salaries and wages 273 465
Accrual for short term incentive plan 5,730 5,379
Liability for annual leave 2,746 2,280
Liability for long service leave 1,081 898
9,830 9,022
Non-current
Liability for long service leave 629 502
629 502
23. Share-based payments
The Group has in place two share option plans – Employee Share Option Trust (ESOT) and LH Ainsworth Share
Option Trust (ASOT) which are replacements to the employee share option plans previously approved on 30 July
2001.
The ESOT granted share options over ordinary new shares to all American employees on 1 March 2011. The ASOT
granted share options to all Australian employees, excluding directors, over a portion of the personal share holding of
the Company’s Executive Chairman Mr LH Ainsworth.
The terms and conditions of the grants under the ESOT and ASOT outstanding at balance date are as follows,
whereby all options are settled by physical delivery of shares:
Grant date / employee entitled
Number of
instruments
Vesting conditions
Contractual life of
options
Option grant to senior and other
employees at 1 March 2011
567,094 Three years of service as per ESOT
below
5 years
Total share options ESOT 567,094
Option grant to key management at 1
March 2011
1,788,627 Three years of service as per ASOT
below
5 years
Option grant to senior and other
employees at 1 March 2011
3,673,269 Three years of service as per ASOT
below
5 years
Total share options ASOT 5,461,896
To be eligible to participate in the ESOT and ASOT the employee must be selected by the directors and reviewed by
the remuneration and nomination committee. Options may be exercised within a five-year period, starting on the first
anniversary of the issue of the options, subject to earlier exercise where a takeover offer or takeover announcement
is made, or a person becomes the holder of a relevant interest in 50% or more of the Company’s voting shares.
Both the ESOT and ASOT provide for employees to receive options for no consideration. Each option is convertible
to one ordinary share. Option holders have no voting or dividend rights. On conversion from option to ordinary
shares, the issued shares will have full voting and dividend rights. The exercise price of the options is determined in
accordance with the rules of the ESOT and ASOT. The ability to exercise the options is conditional on the continuing
employment of the participating employee.
For
per
sona
l use
onl
y
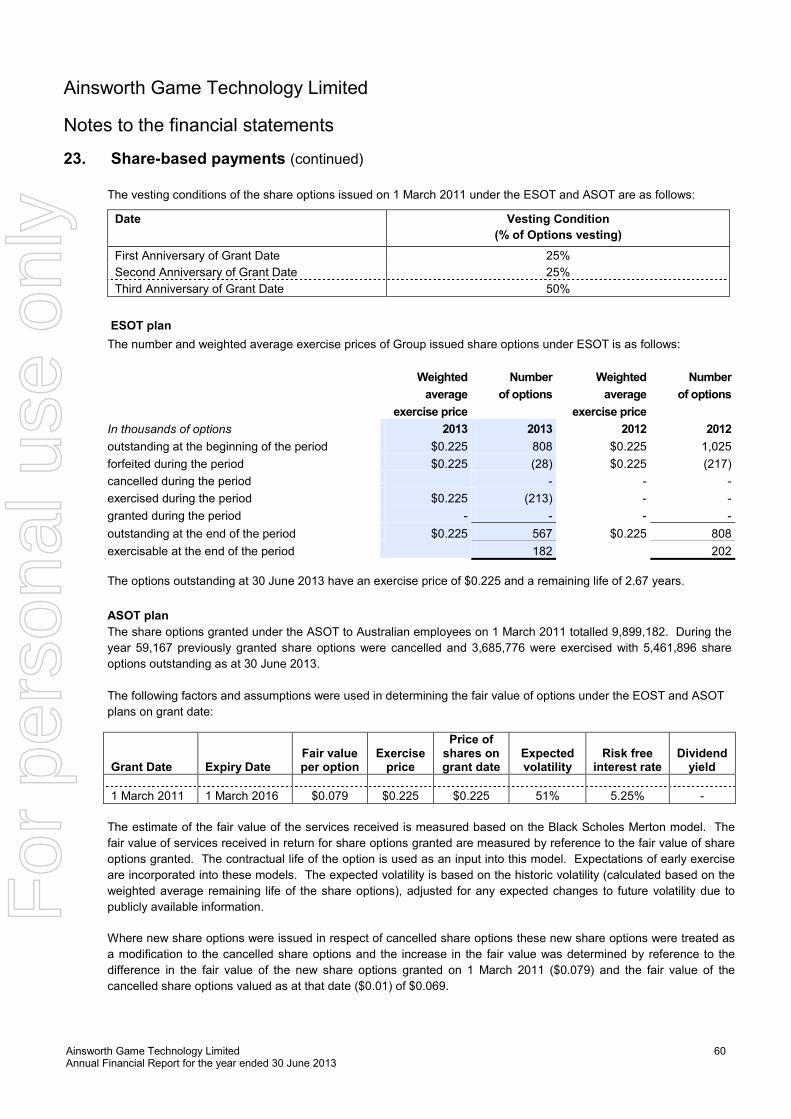
Ainsworth Game Technology Limited Annual Financial Report for the year ended 30 June 2013
60
Ainsworth Game Technology Limited
Notes to the financial statements
23. Share-based payments (continued)
The vesting conditions of the share options issued on 1 March 2011 under the ESOT and ASOT are as follows:
Date Vesting Condition
(% of Options vesting)
First Anniversary of Grant Date 25%
Second Anniversary of Grant Date 25%
Third Anniversary of Grant Date 50%
ESOT plan
The number and weighted average exercise prices of Group issued share options under ESOT is as follows:
Weighted
average
exercise price
Number
of options
Weighted
average
exercise price
Number
of options
In thousands of options 2013 2013 2012 2012
outstanding at the beginning of the period $0.225 808 $0.225 1,025
forfeited during the period $0.225 (28) $0.225 (217)
cancelled during the period - - -
exercised during the period $0.225 (213) - -
granted during the period - - - -
outstanding at the end of the period $0.225 567 $0.225 808
exercisable at the end of the period 182 202
The options outstanding at 30 June 2013 have an exercise price of $0.225 and a remaining life of 2.67 years.
ASOT plan
The share options granted under the ASOT to Australian employees on 1 March 2011 totalled 9,899,182. During the
year 59,167 previously granted share options were cancelled and 3,685,776 were exercised with 5,461,896 share
options outstanding as at 30 June 2013.
The following factors and assumptions were used in determining the fair value of options under the EOST and ASOT
plans on grant date:
Grant Date
Expiry Date
Fair value per option
Exercise price
Price of shares on grant date
Expected volatility
Risk free interest rate
Dividend yield
1 March 2011 1 March 2016 $0.079 $0.225 $0.225 51% 5.25% -
The estimate of the fair value of the services received is measured based on the Black Scholes Merton model. The
fair value of services received in return for share options granted are measured by reference to the fair value of share
options granted. The contractual life of the option is used as an input into this model. Expectations of early exercise
are incorporated into these models. The expected volatility is based on the historic volatility (calculated based on the
weighted average remaining life of the share options), adjusted for any expected changes to future volatility due to
publicly available information.
Where new share options were issued in respect of cancelled share options these new share options were treated as
a modification to the cancelled share options and the increase in the fair value was determined by reference to the
difference in the fair value of the new share options granted on 1 March 2011 ($0.079) and the fair value of the
cancelled share options valued as at that date ($0.01) of $0.069.
For
per
sona
l use
onl
y
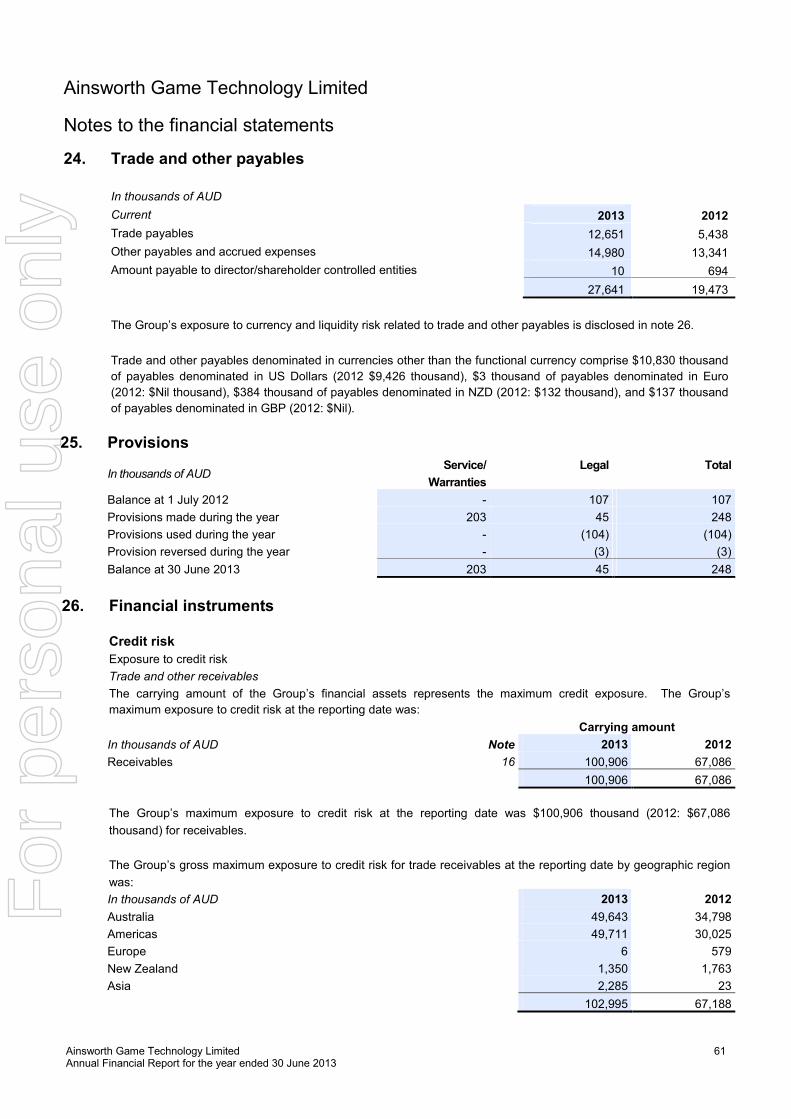
Ainsworth Game Technology Limited Annual Financial Report for the year ended 30 June 2013
61
Ainsworth Game Technology Limited
Notes to the financial statements
24. Trade and other payables In thousands of AUD
Current 2013 2012
Trade payables 12,651 5,438
Other payables and accrued expenses 14,980 13,341
Amount payable to director/shareholder controlled entities 10 694
27,641 19,473
The Group’s exposure to currency and liquidity risk related to trade and other payables is disclosed in note 26.
Trade and other payables denominated in currencies other than the functional currency comprise $10,830 thousand
of payables denominated in US Dollars (2012 $9,426 thousand), $3 thousand of payables denominated in Euro
(2012: $Nil thousand), $384 thousand of payables denominated in NZD (2012: $132 thousand), and $137 thousand
of payables denominated in GBP (2012: $Nil).
25. Provisions
In thousands of AUD
Service/ Legal Total
Warranties
Balance at 1 July 2012 - 107 107
Provisions made during the year 203 45 248
Provisions used during the year - (104) (104)
Provision reversed during the year - (3) (3)
Balance at 30 June 2013 203 45 248
26. Financial instruments Credit risk
Exposure to credit risk
Trade and other receivables
The carrying amount of the Group’s financial assets represents the maximum credit exposure. The Group’s
maximum exposure to credit risk at the reporting date was:
Carrying amount
In thousands of AUD Note 2013 2012
Receivables 16 100,906 67,086
100,906 67,086
The Group’s maximum exposure to credit risk at the reporting date was $100,906 thousand (2012: $67,086
thousand) for receivables.
The Group’s gross maximum exposure to credit risk for trade receivables at the reporting date by geographic region
was:
In thousands of AUD 2013 2012
Australia 49,643 34,798
Americas 49,711 30,025
Europe 6 579
New Zealand 1,350 1,763
Asia 2,285 23
102,995 67,188
For
per
sona
l use
onl
y
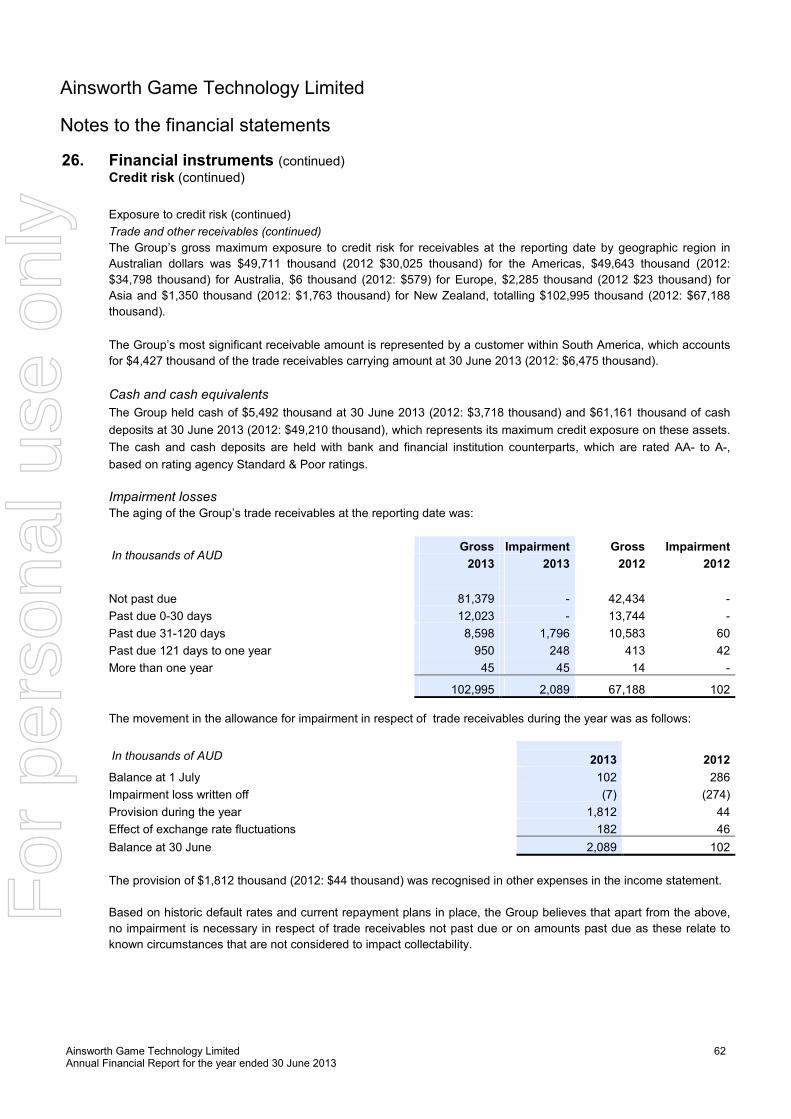
Ainsworth Game Technology Limited Annual Financial Report for the year ended 30 June 2013
62
Ainsworth Game Technology Limited
Notes to the financial statements
26. Financial instruments (continued) Credit risk (continued)
Exposure to credit risk (continued)
Trade and other receivables (continued)
The Group’s gross maximum exposure to credit risk for receivables at the reporting date by geographic region in
Australian dollars was $49,711 thousand (2012 $30,025 thousand) for the Americas, $49,643 thousand (2012:
$34,798 thousand) for Australia, $6 thousand (2012: $579) for Europe, $2,285 thousand (2012 $23 thousand) for
Asia and $1,350 thousand (2012: $1,763 thousand) for New Zealand, totalling $102,995 thousand (2012: $67,188
thousand).
The Group’s most significant receivable amount is represented by a customer within South America, which accounts
for $4,427 thousand of the trade receivables carrying amount at 30 June 2013 (2012: $6,475 thousand).
Cash and cash equivalents
The Group held cash of $5,492 thousand at 30 June 2013 (2012: $3,718 thousand) and $61,161 thousand of cash
deposits at 30 June 2013 (2012: $49,210 thousand), which represents its maximum credit exposure on these assets.
The cash and cash deposits are held with bank and financial institution counterparts, which are rated AA- to A-,
based on rating agency Standard & Poor ratings.
Impairment losses The aging of the Group’s trade receivables at the reporting date was:
In thousands of AUD
Gross Impairment Gross Impairment
2013 2013 2012 2012
Not past due 81,379 - 42,434 -
Past due 0-30 days 12,023 - 13,744 -
Past due 31-120 days 8,598 1,796 10,583 60
Past due 121 days to one year 950 248 413 42
More than one year 45 45 14 -
102,995 2,089 67,188 102
The movement in the allowance for impairment in respect of trade receivables during the year was as follows:
In thousands of AUD 2013 2012
Balance at 1 July 102 286
Impairment loss written off (7) (274)
Provision during the year 1,812 44
Effect of exchange rate fluctuations 182 46
Balance at 30 June 2,089 102
The provision of $1,812 thousand (2012: $44 thousand) was recognised in other expenses in the income statement.
Based on historic default rates and current repayment plans in place, the Group believes that apart from the above,
no impairment is necessary in respect of trade receivables not past due or on amounts past due as these relate to
known circumstances that are not considered to impact collectability.
For
per
sona
l use
onl
y
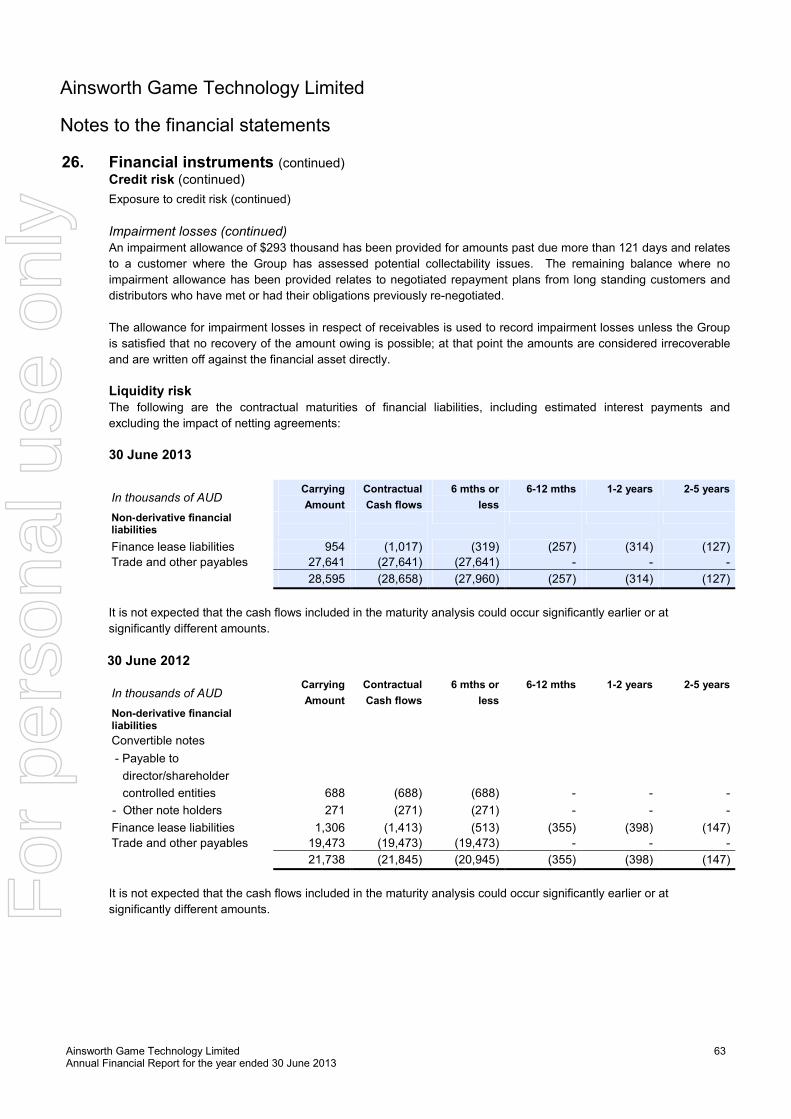
Ainsworth Game Technology Limited Annual Financial Report for the year ended 30 June 2013
63
Ainsworth Game Technology Limited
Notes to the financial statements
26. Financial instruments (continued) Credit risk (continued)
Exposure to credit risk (continued)
Impairment losses (continued) An impairment allowance of $293 thousand has been provided for amounts past due more than 121 days and relates
to a customer where the Group has assessed potential collectability issues. The remaining balance where no
impairment allowance has been provided relates to negotiated repayment plans from long standing customers and
distributors who have met or had their obligations previously re-negotiated.
The allowance for impairment losses in respect of receivables is used to record impairment losses unless the Group
is satisfied that no recovery of the amount owing is possible; at that point the amounts are considered irrecoverable
and are written off against the financial asset directly.
Liquidity risk The following are the contractual maturities of financial liabilities, including estimated interest payments and
excluding the impact of netting agreements:
30 June 2013
In thousands of AUD Carrying
Amount
Contractual
Cash flows
6 mths or
less
6-12 mths 1-2 years 2-5 years
Non-derivative financial liabilities
Finance lease liabilities 954 (1,017) (319) (257) (314) (127)
Trade and other payables 27,641 (27,641) (27,641) - - -
28,595 (28,658) (27,960) (257) (314) (127)
It is not expected that the cash flows included in the maturity analysis could occur significantly earlier or at
significantly different amounts.
30 June 2012
In thousands of AUD
Carrying
Amount
Contractual
Cash flows
6 mths or
less
6-12 mths 1-2 years 2-5 years
Non-derivative financial liabilities
Convertible notes
- Payable to
director/shareholder
controlled entities 688 (688) (688) - - -
- Other note holders 271 (271) (271) - - -
Finance lease liabilities 1,306 (1,413) (513) (355) (398) (147)
Trade and other payables 19,473 (19,473) (19,473) - - -
21,738 (21,845) (20,945) (355) (398) (147)
It is not expected that the cash flows included in the maturity analysis could occur significantly earlier or at
significantly different amounts.
For
per
sona
l use
onl
y
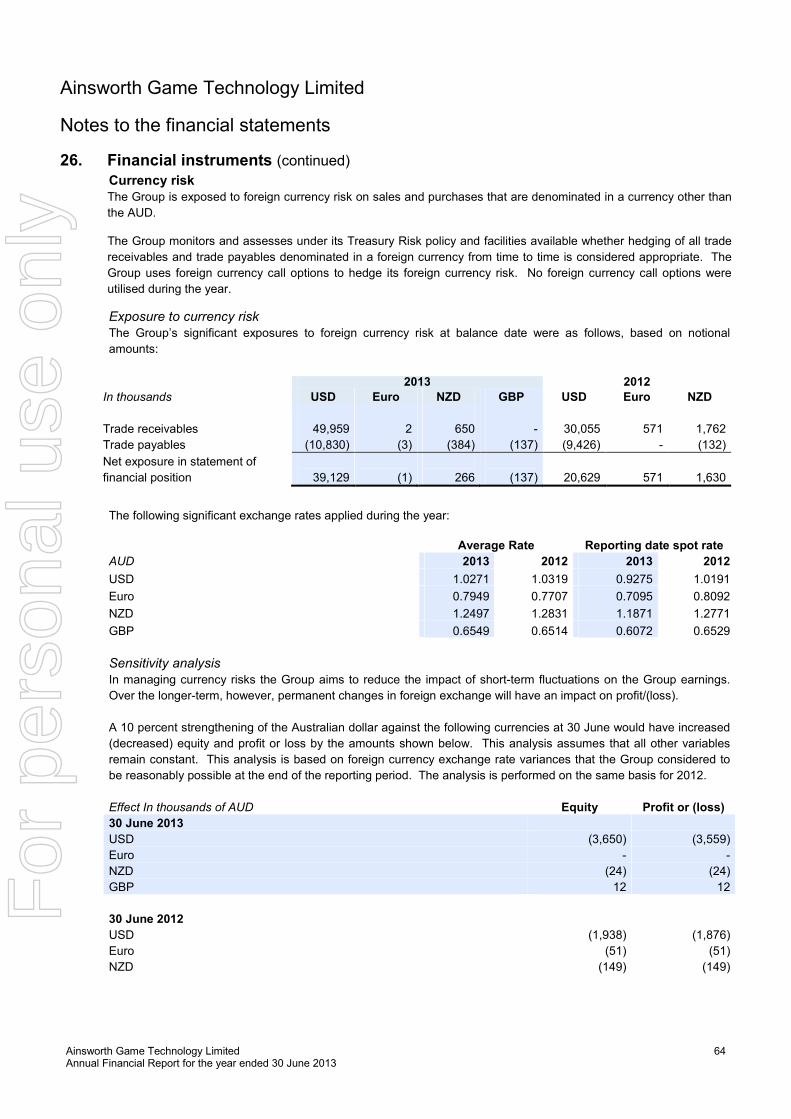
Ainsworth Game Technology Limited Annual Financial Report for the year ended 30 June 2013
64
Ainsworth Game Technology Limited
Notes to the financial statements
26. Financial instruments (continued)
Sensitivity analysis In managing currency risks the Group aims to reduce the impact of short-term fluctuations on the Group earnings.
Over the longer-term, however, permanent changes in foreign exchange will have an impact on profit/(loss).
A 10 percent strengthening of the Australian dollar against the following currencies at 30 June would have increased
(decreased) equity and profit or loss by the amounts shown below. This analysis assumes that all other variables
remain constant. This analysis is based on foreign currency exchange rate variances that the Group considered to
be reasonably possible at the end of the reporting period. The analysis is performed on the same basis for 2012.
Effect In thousands of AUD Equity Profit or (loss)
30 June 2013
USD (3,650) (3,559)
Euro - -
NZD (24) (24)
GBP 12 12
30 June 2012
USD (1,938) (1,876)
Euro (51) (51)
NZD (149) (149)
Currency risk The Group is exposed to foreign currency risk on sales and purchases that are denominated in a currency other than
the AUD.
The Group monitors and assesses under its Treasury Risk policy and facilities available whether hedging of all trade
receivables and trade payables denominated in a foreign currency from time to time is considered appropriate. The
Group uses foreign currency call options to hedge its foreign currency risk. No foreign currency call options were
utilised during the year.
Exposure to currency risk The Group’s significant exposures to foreign currency risk at balance date were as follows, based on notional
amounts:
2013 2012
In thousands USD Euro NZD GBP USD Euro NZD
Trade receivables 49,959 2 650 - 30,055 571 1,762
Trade payables (10,830) (3) (384) (137) (9,426) - (132)
Net exposure in statement of
financial position
39,129
(1)
266
(137)
20,629
571
1,630
The following significant exchange rates applied during the year:
Average Rate Reporting date spot rate
AUD 2013 2012 2013 2012
USD 1.0271 1.0319 0.9275 1.0191
Euro 0.7949 0.7707 0.7095 0.8092
NZD 1.2497 1.2831 1.1871 1.2771
GBP 0.6549 0.6514 0.6072 0.6529
For
per
sona
l use
onl
y
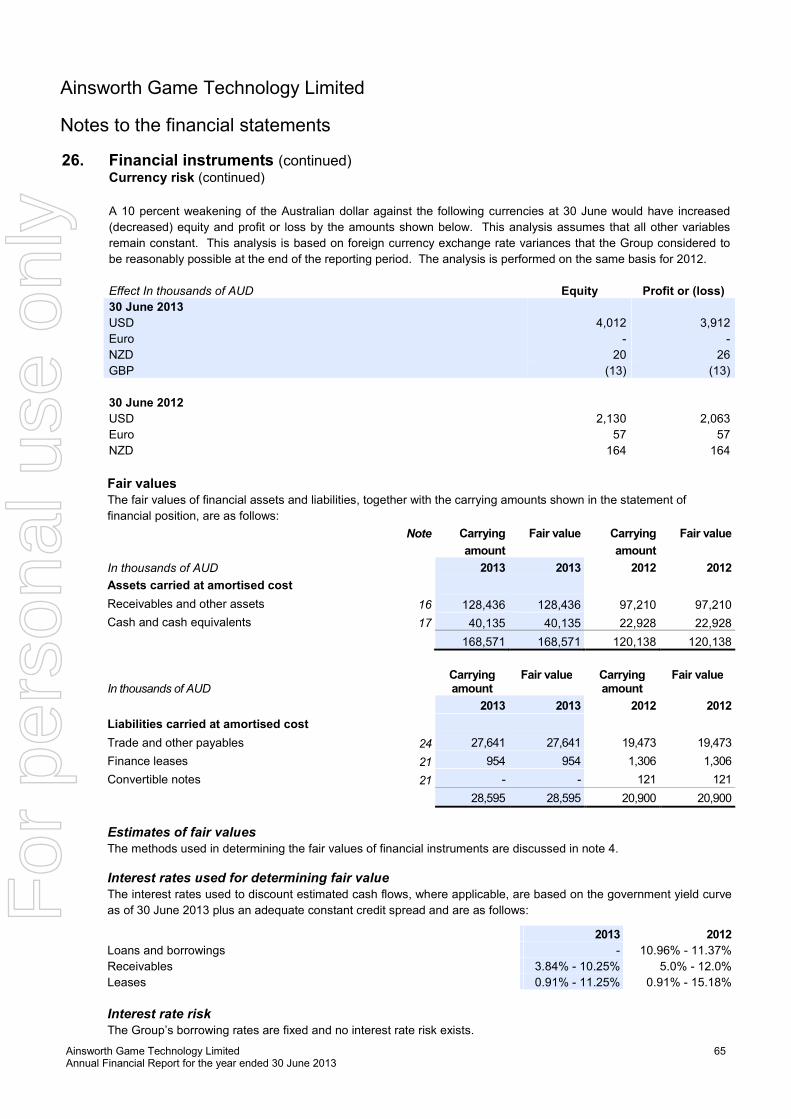
Ainsworth Game Technology Limited Annual Financial Report for the year ended 30 June 2013
65
Ainsworth Game Technology Limited
Notes to the financial statements
26. Financial instruments (continued) Currency risk (continued)
A 10 percent weakening of the Australian dollar against the following currencies at 30 June would have increased
(decreased) equity and profit or loss by the amounts shown below. This analysis assumes that all other variables
remain constant. This analysis is based on foreign currency exchange rate variances that the Group considered to
be reasonably possible at the end of the reporting period. The analysis is performed on the same basis for 2012.
Effect In thousands of AUD Equity Profit or (loss)
30 June 2013
USD 4,012 3,912
Euro - -
NZD 20 26
GBP (13) (13)
30 June 2012
USD 2,130 2,063
Euro 57 57
NZD 164 164
Fair values The fair values of financial assets and liabilities, together with the carrying amounts shown in the statement of
financial position, are as follows:
Note Carrying
amount
Fair value Carrying
amount
Fair value
In thousands of AUD 2013 2013 2012 2012
Assets carried at amortised cost
Receivables and other assets 16 128,436 128,436 97,210 97,210
Cash and cash equivalents 17 40,135 40,135 22,928 22,928
168,571 168,571 120,138 120,138
In thousands of AUD
Carrying amount
Fair value Carrying amount
Fair value
2013 2013 2012 2012
Liabilities carried at amortised cost
Trade and other payables 24 27,641 27,641 19,473 19,473
Finance leases 21 954 954 1,306 1,306
Convertible notes 21 - - 121 121
28,595 28,595 20,900 20,900
Estimates of fair values
The methods used in determining the fair values of financial instruments are discussed in note 4.
Interest rates used for determining fair value
The interest rates used to discount estimated cash flows, where applicable, are based on the government yield curve
as of 30 June 2013 plus an adequate constant credit spread and are as follows:
2013 2012
Loans and borrowings - 10.96% - 11.37%
Receivables 3.84% - 10.25% 5.0% - 12.0%
Leases 0.91% - 11.25% 0.91% - 15.18%
Interest rate risk
The Group’s borrowing rates are fixed and no interest rate risk exists.
For
per
sona
l use
onl
y
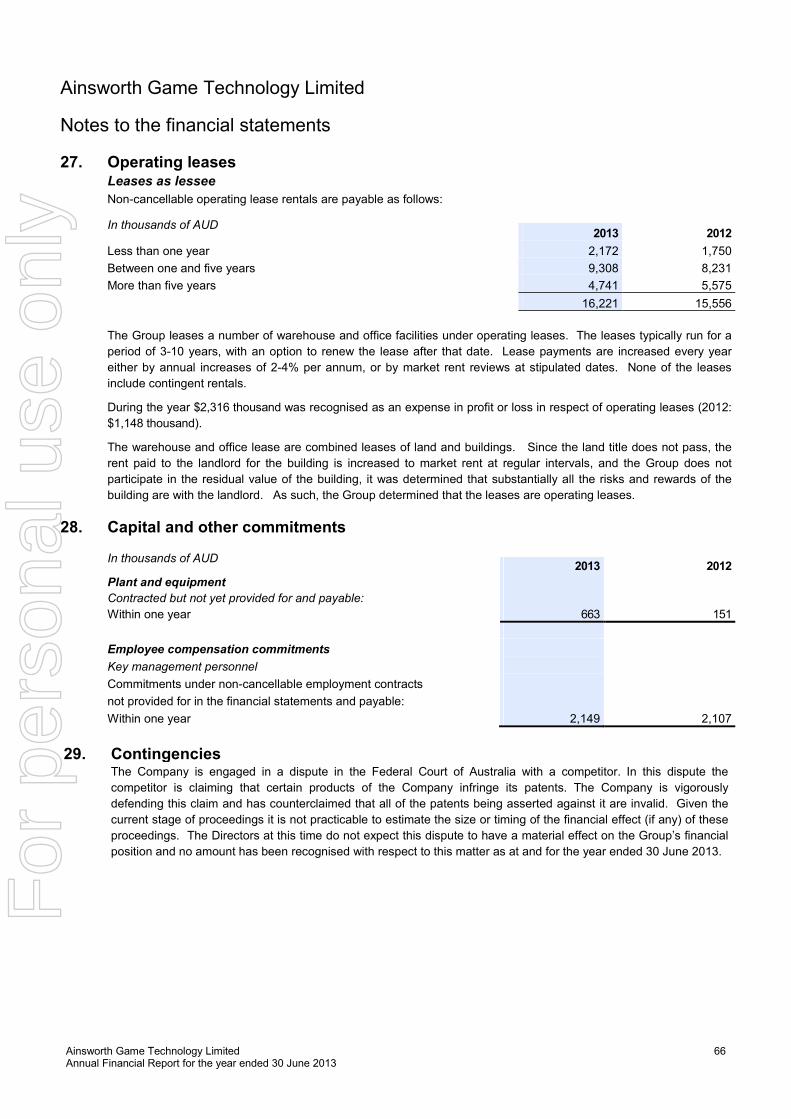
Ainsworth Game Technology Limited Annual Financial Report for the year ended 30 June 2013
66
Ainsworth Game Technology Limited
Notes to the financial statements
27. Operating leases Leases as lessee
Non-cancellable operating lease rentals are payable as follows:
In thousands of AUD
2013 2012
Less than one year 2,172 1,750
Between one and five years 9,308 8,231
More than five years 4,741 5,575
16,221 15,556
The Group leases a number of warehouse and office facilities under operating leases. The leases typically run for a
period of 3-10 years, with an option to renew the lease after that date. Lease payments are increased every year
either by annual increases of 2-4% per annum, or by market rent reviews at stipulated dates. None of the leases
include contingent rentals.
During the year $2,316 thousand was recognised as an expense in profit or loss in respect of operating leases (2012:
$1,148 thousand).
The warehouse and office lease are combined leases of land and buildings. Since the land title does not pass, the
rent paid to the landlord for the building is increased to market rent at regular intervals, and the Group does not
participate in the residual value of the building, it was determined that substantially all the risks and rewards of the
building are with the landlord. As such, the Group determined that the leases are operating leases.
28. Capital and other commitments
In thousands of AUD
2013 2012
Plant and equipment
Contracted but not yet provided for and payable:
Within one year 663 151
Employee compensation commitments
Key management personnel
Commitments under non-cancellable employment contracts
not provided for in the financial statements and payable:
Within one year 2,149 2,107
29. Contingencies The Company is engaged in a dispute in the Federal Court of Australia with a competitor. In this dispute the
competitor is claiming that certain products of the Company infringe its patents. The Company is vigorously
defending this claim and has counterclaimed that all of the patents being asserted against it are invalid. Given the
current stage of proceedings it is not practicable to estimate the size or timing of the financial effect (if any) of these
proceedings. The Directors at this time do not expect this dispute to have a material effect on the Group’s financial
position and no amount has been recognised with respect to this matter as at and for the year ended 30 June 2013.
For
per
sona
l use
onl
y
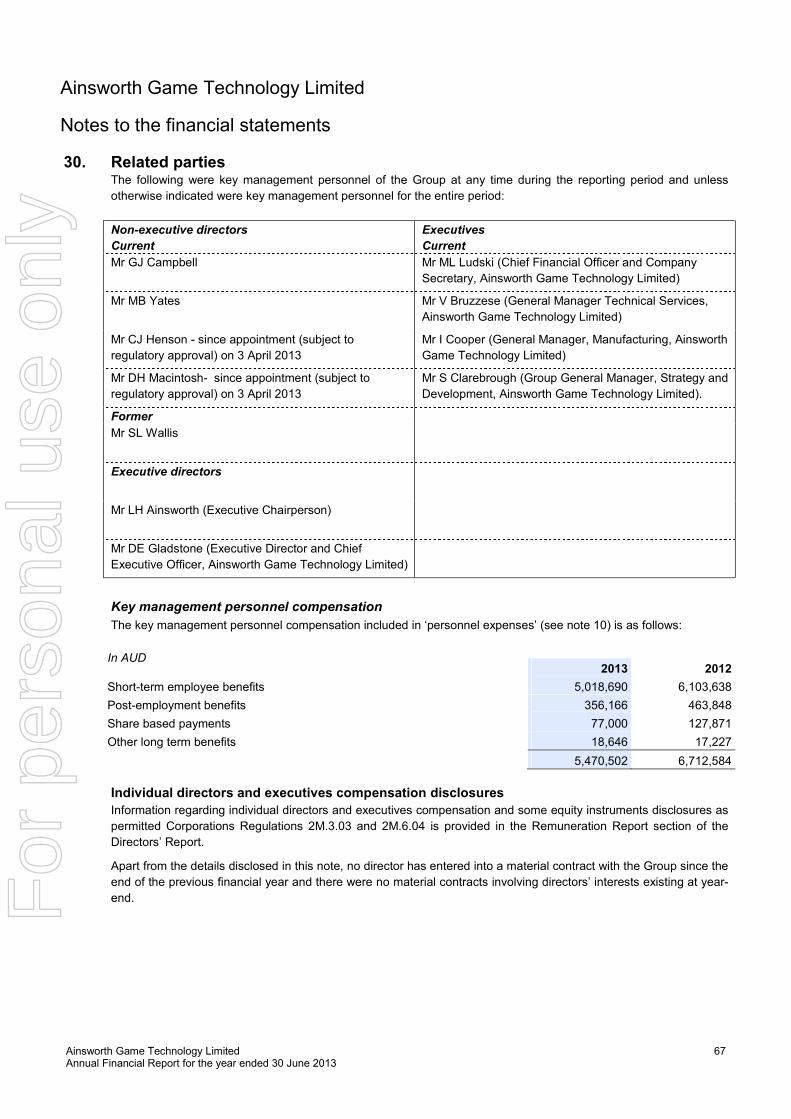
Ainsworth Game Technology Limited Annual Financial Report for the year ended 30 June 2013
67
Ainsworth Game Technology Limited
Notes to the financial statements
30. Related parties The following were key management personnel of the Group at any time during the reporting period and unless
otherwise indicated were key management personnel for the entire period:
Non-executive directors
Current
Executives
Current
Mr GJ Campbell
Mr ML Ludski (Chief Financial Officer and Company
Secretary, Ainsworth Game Technology Limited)
Mr MB Yates
Mr V Bruzzese (General Manager Technical Services,
Ainsworth Game Technology Limited)
Mr CJ Henson - since appointment (subject to
regulatory approval) on 3 April 2013
Mr I Cooper (General Manager, Manufacturing, Ainsworth
Game Technology Limited)
Mr DH Macintosh- since appointment (subject to
regulatory approval) on 3 April 2013
Mr S Clarebrough (Group General Manager, Strategy and
Development, Ainsworth Game Technology Limited).
Former
Mr SL Wallis
Executive directors
Mr LH Ainsworth (Executive Chairperson)
Mr DE Gladstone (Executive Director and Chief
Executive Officer, Ainsworth Game Technology Limited)
Key management personnel compensation
The key management personnel compensation included in ‘personnel expenses’ (see note 10) is as follows:
In AUD
2013 2012
Short-term employee benefits 5,018,690 6,103,638
Post-employment benefits 356,166 463,848
Share based payments 77,000 127,871
Other long term benefits 18,646 17,227
5,470,502 6,712,584
Individual directors and executives compensation disclosures
Information regarding individual directors and executives compensation and some equity instruments disclosures as
permitted Corporations Regulations 2M.3.03 and 2M.6.04 is provided in the Remuneration Report section of the
Directors’ Report.
Apart from the details disclosed in this note, no director has entered into a material contract with the Group since the
end of the previous financial year and there were no material contracts involving directors’ interests existing at year-
end.
For
per
sona
l use
onl
y
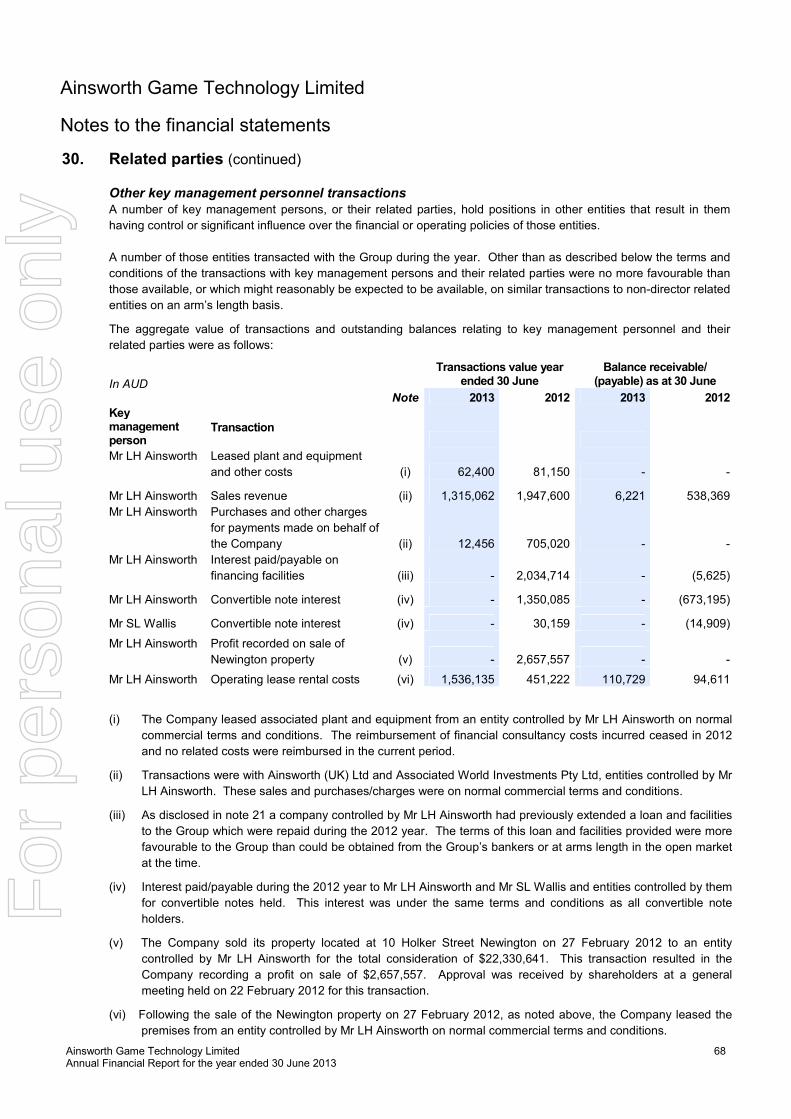
Ainsworth Game Technology Limited Annual Financial Report for the year ended 30 June 2013
68
Ainsworth Game Technology Limited
Notes to the financial statements
30. Related parties (continued) Other key management personnel transactions
A number of key management persons, or their related parties, hold positions in other entities that result in them
having control or significant influence over the financial or operating policies of those entities.
A number of those entities transacted with the Group during the year. Other than as described below the terms and
conditions of the transactions with key management persons and their related parties were no more favourable than
those available, or which might reasonably be expected to be available, on similar transactions to non-director related
entities on an arm’s length basis.
The aggregate value of transactions and outstanding balances relating to key management personnel and their
related parties were as follows:
In AUD
Transactions value year ended 30 June
Balance receivable/ (payable) as at 30 June
Note 2013 2012 2013 2012
Key management person
Transaction
Mr LH Ainsworth Leased plant and equipment
and other costs (i) 62,400 81,150 - -
Mr LH Ainsworth Sales revenue (ii) 1,315,062 1,947,600 6,221 538,369
Mr LH Ainsworth Purchases and other charges
for payments made on behalf of
the Company (ii) 12,456 705,020 - -
Mr LH Ainsworth Interest paid/payable on
financing facilities (iii) - 2,034,714 - (5,625)
Mr LH Ainsworth Convertible note interest (iv) - 1,350,085 - (673,195)
Mr SL Wallis Convertible note interest (iv) - 30,159 - (14,909)
Mr LH Ainsworth Profit recorded on sale of
Newington property (v) - 2,657,557 - -
Mr LH Ainsworth Operating lease rental costs (vi) 1,536,135 451,222 110,729 94,611
(i) The Company leased associated plant and equipment from an entity controlled by Mr LH Ainsworth on normal
commercial terms and conditions. The reimbursement of financial consultancy costs incurred ceased in 2012
and no related costs were reimbursed in the current period.
(ii) Transactions were with Ainsworth (UK) Ltd and Associated World Investments Pty Ltd, entities controlled by Mr
LH Ainsworth. These sales and purchases/charges were on normal commercial terms and conditions.
(iii) As disclosed in note 21 a company controlled by Mr LH Ainsworth had previously extended a loan and facilities
to the Group which were repaid during the 2012 year. The terms of this loan and facilities provided were more
favourable to the Group than could be obtained from the Group’s bankers or at arms length in the open market
at the time.
(iv) Interest paid/payable during the 2012 year to Mr LH Ainsworth and Mr SL Wallis and entities controlled by them
for convertible notes held. This interest was under the same terms and conditions as all convertible note
holders.
(v) The Company sold its property located at 10 Holker Street Newington on 27 February 2012 to an entity
controlled by Mr LH Ainsworth for the total consideration of $22,330,641. This transaction resulted in the
Company recording a profit on sale of $2,657,557. Approval was received by shareholders at a general
meeting held on 22 February 2012 for this transaction.
(vi) Following the sale of the Newington property on 27 February 2012, as noted above, the Company leased the
premises from an entity controlled by Mr LH Ainsworth on normal commercial terms and conditions.
For
per
sona
l use
onl
y
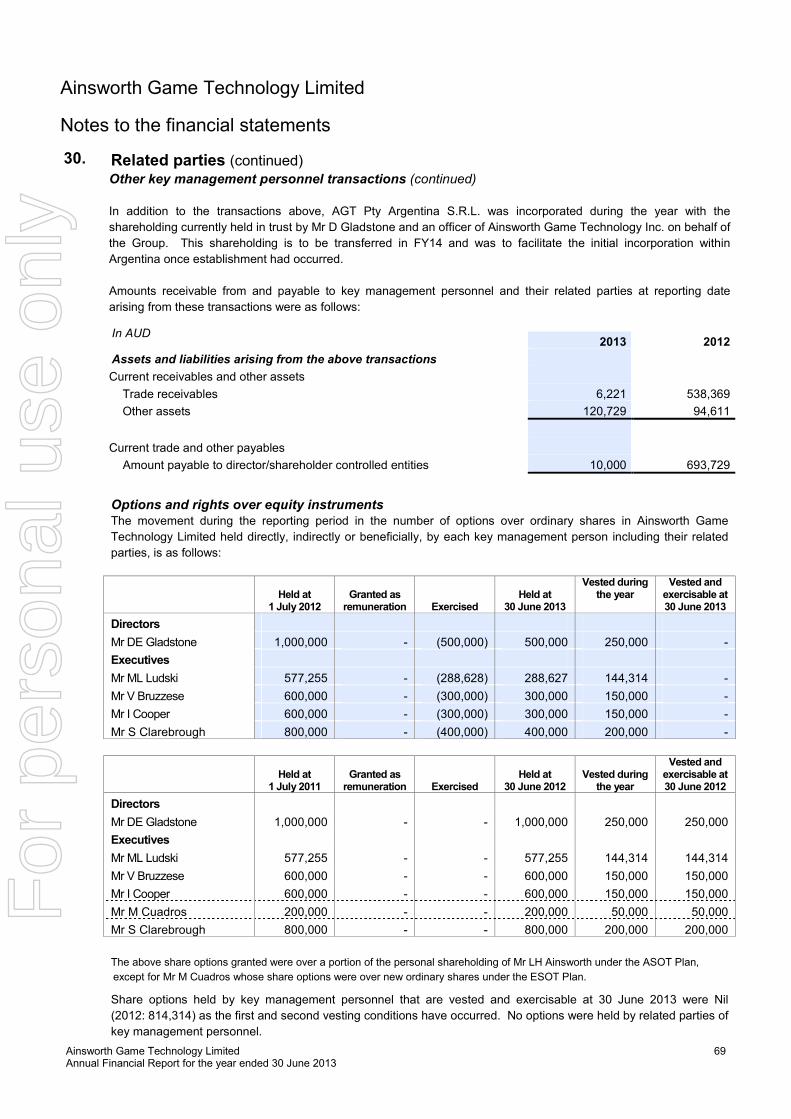
Ainsworth Game Technology Limited Annual Financial Report for the year ended 30 June 2013
69
Ainsworth Game Technology Limited
Notes to the financial statements 30. Related parties (continued) Other key management personnel transactions (continued)
In addition to the transactions above, AGT Pty Argentina S.R.L. was incorporated during the year with the
shareholding currently held in trust by Mr D Gladstone and an officer of Ainsworth Game Technology Inc. on behalf of
the Group. This shareholding is to be transferred in FY14 and was to facilitate the initial incorporation within
Argentina once establishment had occurred.
Amounts receivable from and payable to key management personnel and their related parties at reporting date
arising from these transactions were as follows:
In AUD
2013 2012
Assets and liabilities arising from the above transactions
Current receivables and other assets
Trade receivables 6,221 538,369
Other assets 120,729 94,611
Current trade and other payables
Amount payable to director/shareholder controlled entities 10,000 693,729
Options and rights over equity instruments
The movement during the reporting period in the number of options over ordinary shares in Ainsworth Game
Technology Limited held directly, indirectly or beneficially, by each key management person including their related
parties, is as follows:
Held at
1 July 2012 Granted as remuneration
Exercised
Held at 30 June 2013
Vested during the year
Vested and exercisable at 30 June 2013
Directors
Mr DE Gladstone 1,000,000 - (500,000) 500,000 250,000 -
Executives
Mr ML Ludski 577,255 - (288,628) 288,627 144,314 -
Mr V Bruzzese 600,000 - (300,000) 300,000 150,000 -
Mr I Cooper 600,000 - (300,000) 300,000 150,000 -
Mr S Clarebrough 800,000 - (400,000) 400,000 200,000 -
Held at
1 July 2011 Granted as remuneration
Exercised
Held at 30 June 2012
Vested during the year
Vested and exercisable at 30 June 2012
Directors
Mr DE Gladstone 1,000,000 - - 1,000,000 250,000 250,000
Executives
Mr ML Ludski 577,255 - - 577,255 144,314 144,314
Mr V Bruzzese 600,000 - - 600,000 150,000 150,000
Mr I Cooper 600,000 - - 600,000 150,000 150,000
Mr M Cuadros 200,000 - - 200,000 50,000 50,000
Mr S Clarebrough 800,000 - - 800,000 200,000 200,000
The above share options granted were over a portion of the personal shareholding of Mr LH Ainsworth under the ASOT Plan,
except for Mr M Cuadros whose share options were over new ordinary shares under the ESOT Plan.
Share options held by key management personnel that are vested and exercisable at 30 June 2013 were Nil
(2012: 814,314) as the first and second vesting conditions have occurred. No options were held by related parties of
key management personnel.
For
per
sona
l use
onl
y
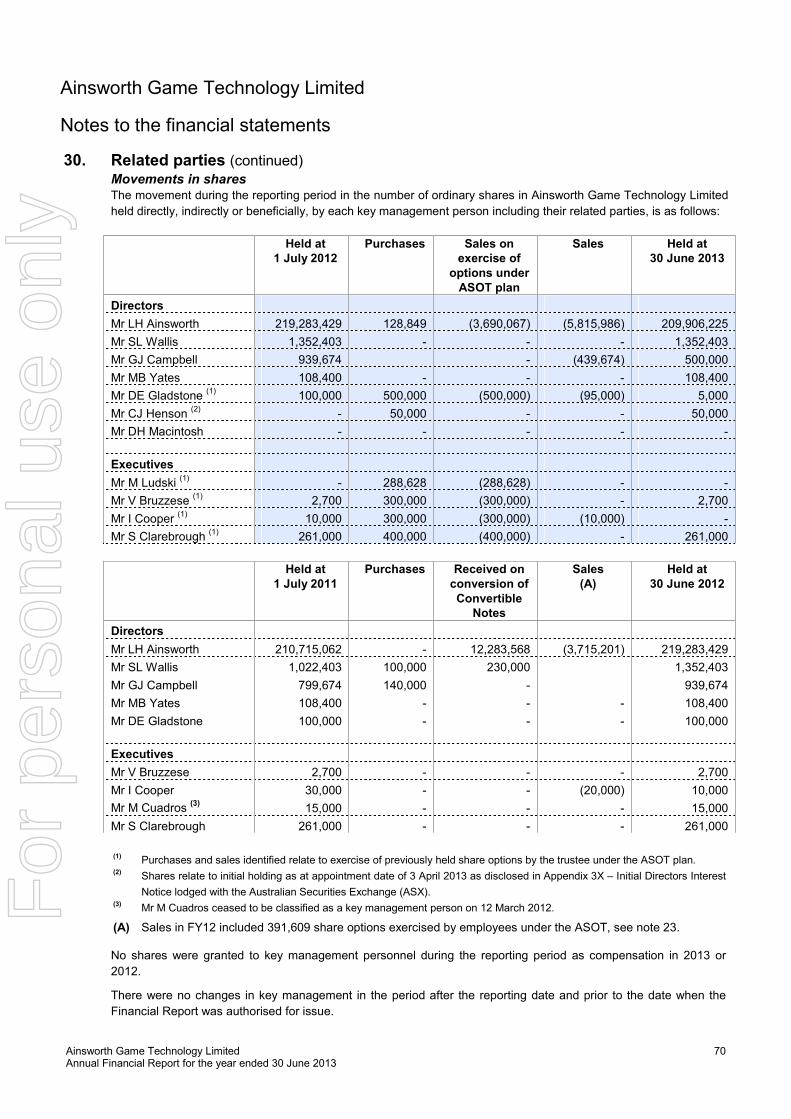
Ainsworth Game Technology Limited Annual Financial Report for the year ended 30 June 2013
70
Ainsworth Game Technology Limited
Notes to the financial statements
30. Related parties (continued) Movements in shares
The movement during the reporting period in the number of ordinary shares in Ainsworth Game Technology Limited
held directly, indirectly or beneficially, by each key management person including their related parties, is as follows:
Held at 1 July 2012
Purchases
Sales on exercise of
options under ASOT plan
Sales Held at 30 June 2013
Directors
Mr LH Ainsworth 219,283,429 128,849 (3,690,067) (5,815,986) 209,906,225
Mr SL Wallis 1,352,403 - - - 1,352,403
Mr GJ Campbell 939,674 - (439,674) 500,000
Mr MB Yates 108,400 - - - 108,400
Mr DE Gladstone (1)
100,000 500,000 (500,000) (95,000) 5,000
Mr CJ Henson (2)
- 50,000 - - 50,000
Mr DH Macintosh - - - - -
Executives
Mr M Ludski (1)
- 288,628 (288,628) - -
Mr V Bruzzese (1)
2,700 300,000 (300,000) - 2,700
Mr I Cooper (1)
10,000 300,000 (300,000) (10,000) -
Mr S Clarebrough (1)
261,000 400,000 (400,000) - 261,000
Held at 1 July 2011
Purchases
Received on conversion of Convertible
Notes
Sales (A)
Held at 30 June 2012
Directors
Mr LH Ainsworth 210,715,062 - 12,283,568 (3,715,201) 219,283,429
Mr SL Wallis 1,022,403 100,000 230,000 1,352,403
Mr GJ Campbell 799,674 140,000 - 939,674
Mr MB Yates 108,400 - - - 108,400
Mr DE Gladstone 100,000 - - - 100,000
Executives
Mr V Bruzzese 2,700 - - - 2,700
Mr I Cooper 30,000 - - (20,000) 10,000
Mr M Cuadros (3)
15,000 - - - 15,000
Mr S Clarebrough 261,000 - - - 261,000
(1)
Purchases and sales identified relate to exercise of previously held share options by the trustee under the ASOT plan. (2) Shares relate to initial holding as at appointment date of 3 April 2013 as disclosed in Appendix 3X – Initial Directors Interest
Notice lodged with the Australian Securities Exchange (ASX). (3) Mr M Cuadros ceased to be classified as a key management person on 12 March 2012.
(A) Sales in FY12 included 391,609 share options exercised by employees under the ASOT, see note 23.
No shares were granted to key management personnel during the reporting period as compensation in 2013 or
2012.
There were no changes in key management in the period after the reporting date and prior to the date when the
Financial Report was authorised for issue.
For
per
sona
l use
onl
y
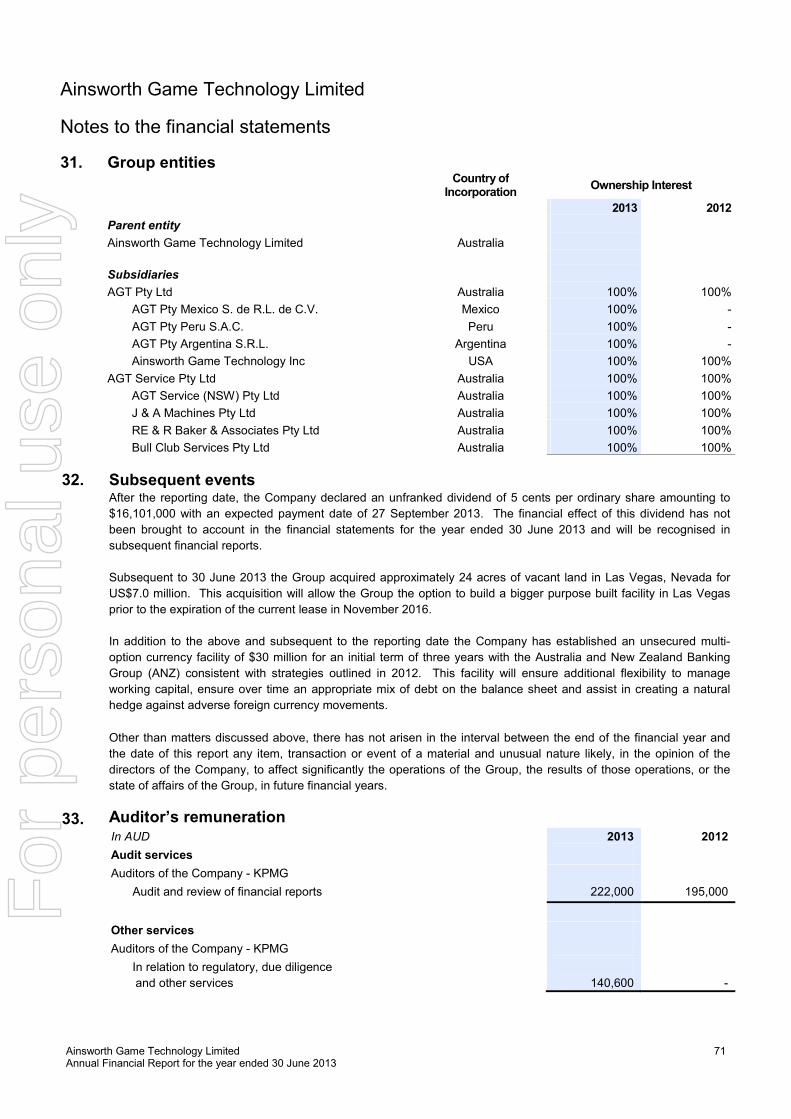
Ainsworth Game Technology Limited Annual Financial Report for the year ended 30 June 2013
71
Ainsworth Game Technology Limited
Notes to the financial statements
31. Group entities Country of
Incorporation Ownership Interest
2013 2012
Parent entity
Ainsworth Game Technology Limited Australia
Subsidiaries
AGT Pty Ltd Australia 100% 100%
AGT Pty Mexico S. de R.L. de C.V. Mexico 100% -
AGT Pty Peru S.A.C. Peru 100% -
AGT Pty Argentina S.R.L. Argentina 100% -
Ainsworth Game Technology Inc USA 100% 100%
AGT Service Pty Ltd Australia 100% 100%
AGT Service (NSW) Pty Ltd Australia 100% 100%
J & A Machines Pty Ltd Australia 100% 100%
RE & R Baker & Associates Pty Ltd Australia 100% 100%
Bull Club Services Pty Ltd Australia 100% 100%
32. Subsequent events After the reporting date, the Company declared an unfranked dividend of 5 cents per ordinary share amounting to
$16,101,000 with an expected payment date of 27 September 2013. The financial effect of this dividend has not
been brought to account in the financial statements for the year ended 30 June 2013 and will be recognised in
subsequent financial reports.
Subsequent to 30 June 2013 the Group acquired approximately 24 acres of vacant land in Las Vegas, Nevada for
US$7.0 million. This acquisition will allow the Group the option to build a bigger purpose built facility in Las Vegas
prior to the expiration of the current lease in November 2016.
In addition to the above and subsequent to the reporting date the Company has established an unsecured multi-
option currency facility of $30 million for an initial term of three years with the Australia and New Zealand Banking
Group (ANZ) consistent with strategies outlined in 2012. This facility will ensure additional flexibility to manage
working capital, ensure over time an appropriate mix of debt on the balance sheet and assist in creating a natural
hedge against adverse foreign currency movements.
Other than matters discussed above, there has not arisen in the interval between the end of the financial year and
the date of this report any item, transaction or event of a material and unusual nature likely, in the opinion of the
directors of the Company, to affect significantly the operations of the Group, the results of those operations, or the
state of affairs of the Group, in future financial years.
33. Auditor’s remuneration
In AUD 2013 2012
Audit services
Auditors of the Company - KPMG
Audit and review of financial reports 222,000 195,000
Other services
Auditors of the Company - KPMG
In relation to regulatory, due diligence
and other services
140,600
-
For
per
sona
l use
onl
y
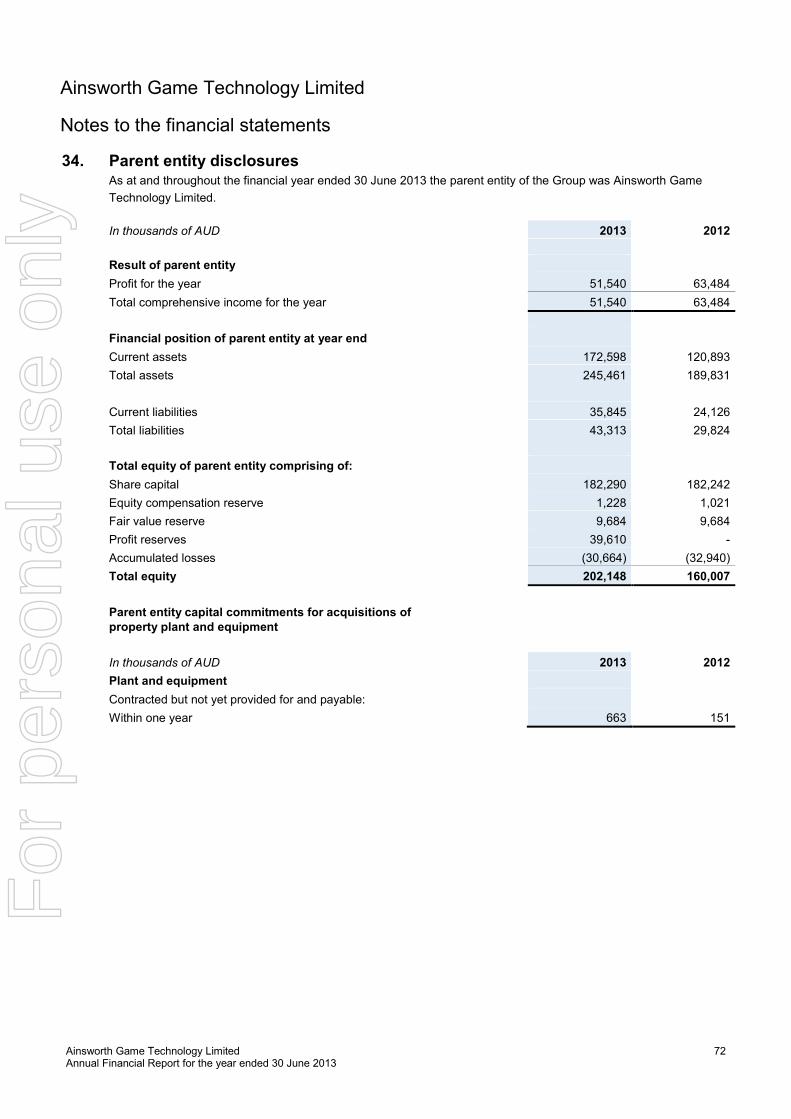
Ainsworth Game Technology Limited Annual Financial Report for the year ended 30 June 2013
72
Ainsworth Game Technology Limited
Notes to the financial statements
34. Parent entity disclosures As at and throughout the financial year ended 30 June 2013 the parent entity of the Group was Ainsworth Game
Technology Limited.
In thousands of AUD 2013 2012
Result of parent entity
Profit for the year 51,540 63,484
Total comprehensive income for the year 51,540 63,484
Financial position of parent entity at year end
Current assets 172,598 120,893
Total assets 245,461 189,831
Current liabilities 35,845 24,126
Total liabilities 43,313 29,824
Total equity of parent entity comprising of:
Share capital 182,290 182,242
Equity compensation reserve 1,228 1,021
Fair value reserve 9,684 9,684
Profit reserves 39,610 -
Accumulated losses (30,664) (32,940)
Total equity 202,148 160,007
Parent entity capital commitments for acquisitions of property plant and equipment
In thousands of AUD 2013 2012
Plant and equipment
Contracted but not yet provided for and payable:
Within one year 663 151
For
per
sona
l use
onl
y
Ainsworth Game Technology Limited Annual Financial Report for the year ended 30 June 2013
73
Ainsworth Game Technology Limited
Directors’ declaration
1.
In the opinion of the directors of Ainsworth Game Technology Limited (the ‘Company’):
(a) the consolidated financial statements and notes that are set out on pages 25 to 72 and the Remuneration
report in sections 15.1 to 15.4 in the Directors' report, are in accordance with the Corporations Act 2001,
including:
(i) giving a true and fair view of the Group’s financial position as at 30 June 2013 and of its performance
for the financial year ended on that date; and
(ii) complying with Australian Accounting Standards and the Corporations Regulations 2001; and
(b) there are reasonable grounds to believe that the Company will be able to pay its debts as and when they
become due and payable.
2. The directors have been given the declarations required by Section 295A of the Corporations Act 2001 from the
chief executive officer and chief financial officer for the financial year ended 30 June 2013.
3. The directors draw attention to Note 2(a) to the consolidated financial statements, which includes a statement of
compliance with International Financial Reporting Standards.
Signed in accordance with a resolution of the directors:
Dated at Sydney this 27th
day of August 2013.
_______________________
LH Ainsworth
Executive Chairman
For
per
sona
l use
onl
y
Independent auditor’s report to the members of Ainsworth Game Technology Limited
Report on the financial report
We have audited the accompanying financial report of Ainsworth Game Technology Limited (the
company), which comprises the consolidated statement of financial position as at 30 June 2013,
and consolidated statement of comprehensive income, consolidated statement of changes in
equity and consolidated statement of cash flows for the year ended on that date, notes 1 to 34
comprising a summary of significant accounting policies and other explanatory information and
the directors’ declaration of the Group comprising the company and the entities it controlled at
the year’s end or from time to time during the financial year.
Directors’ responsibility for the financial report
The directors of the company are responsible for the preparation of the financial report that gives
a true and fair view in accordance with Australian Accounting Standards and the Corporations
Act 2001 and for such internal control as the directors determine is necessary to enable the
preparation of the financial report that is free from material misstatement whether due to fraud or
error. In note 2(a), the directors also state, in accordance with Australian Accounting Standard
AASB 101 Presentation of Financial Statements, that the financial statements of the Group
comply with International Financial Reporting Standards.
Auditor’s responsibility
Our responsibility is to express an opinion on the financial report based on our audit. We
conducted our audit in accordance with Australian Auditing Standards. These Auditing
Standards require that we comply with relevant ethical requirements relating to audit
engagements and plan and perform the audit to obtain reasonable assurance whether the
financial report is free from material misstatement.
An audit involves performing procedures to obtain audit evidence about the amounts and
disclosures in the financial report. The procedures selected depend on the auditor’s judgement,
including the assessment of the risks of material misstatement of the financial report, whether
due to fraud or error. In making those risk assessments, the auditor considers internal control
relevant to the entity’s preparation of the financial report that gives a true and fair view in order to
design audit procedures that are appropriate in the circumstances, but not for the purpose of
expressing an opinion on the effectiveness of the entity’s internal control. An audit also includes
evaluating the appropriateness of accounting policies used and the reasonableness of
accounting estimates made by the directors, as well as evaluating the overall presentation of the
financial report.
We performed the procedures to assess whether in all material respects the financial report
presents fairly, in accordance with the Corporations Act 2001 and Australian Accounting
Standards, a true and fair view which is consistent with our understanding of the Group’s
financial position and of its performance.
We believe that the audit evidence we have obtained is sufficient and appropriate to provide a
basis for our audit opinion.
KPMG, an Australian partnership and a member firm of the KPMG network of independent member firms affiliated with KPMG International Cooperative (“KPMG International”), a Swiss entity. Liability limited by a scheme approved under Professional Standards Legislation.
74
For
per
sona
l use
onl
y
Independence
In conducting our audit, we have complied with the independence requirements of the
Corporations Act 2001.
Auditor’s opinion
In our opinion:
(a) the financial report of the Group is in accordance with the Corporations Act 2001,
including:
(i) giving a true and fair view of the Group’s financial position as
at 30 June 2013 and of its performance for the year ended on that date; and
(ii) complying with Australian Accounting Standards and the Corporations Regulations
2001.
(b) the financial report also complies with International Financial Reporting Standards as
disclosed in note 2(a).
Report on the remuneration report
We have audited the Remuneration Report included in sections 15.1 to 15.4 of the directors’
report for the year ended 30 June 2013. The directors of the company are responsible for the
preparation and presentation of the remuneration report in accordance with Section 300A of the
Corporations Act 2001. Our responsibility is to express an opinion on the remuneration report,
based on our audit conducted in accordance with auditing standards.
Auditor’s opinion
In our opinion, the remuneration report of Ainsworth Game Technology Limited for the year
ended 30 June 2013, complies with Section 300A of the Corporations Act 2001.
KPMG
Tony Nimac
Partner
Sydney
27 August 2013
75
For
per
sona
l use
onl
y
KPMG, an Australian partnership and a member firm of the KPMG network of independent member firms affiliated with KPMG International Cooperative (“KPMG International”), a Swiss entity. Liability limited by a scheme approved under Professional Standards Legislation.
Lead Auditor’s Independence Declaration under Section 307C of the Corporations Act 2001
To: the directors of Ainsworth Game Technology Limited
I declare that, to the best of my knowledge and belief, in relation to the audit for the financial
year ended 30 June 2013 there have been:
(i) no contraventions of the auditor independence requirements as set out in the
Corporations Act 2001 in relation to the audit; and
(ii) no contraventions of any applicable code of professional conduct in relation to the
audit.
KPMG
Tony Nimac
Partner
Sydney
27 August 2013
76
For
per
sona
l use
onl
y