Embed Size (px)
Citation preview

Air Arabia
Air Arabia, based out of Sharjah in the UAE, pioneered the low-cost carrier (LCC) model
in the Middle East, being the first to introduce it successfully in the region. Its fleet today
consists of nine aircrafts, which it flies to 32 destinations around the Middle East and the
Indian Sub Continent. The company plans to grow the fleet to 34 aircrafts by 2015, to be
utilized on existing routes and new potential routes in the region.
Core competitive strengths of Air Arabia include its first mover advantage, its ability to
quickly scale up, a young fleet, high utilization of its aircrafts, its strong and established
brand, its established and effective distribution network, its efficient low cost base and
highly favourable home and regional market dynamics.
Core drivers for the company include high expected economic growth, the
demographic mix in the UAE and the region, the current low penetration rate of LCCs,
the high elasticity of demand, growth in air travel infrastructure and the expected
deregulation and liberalization of the sector.
•
•
•
Current Price: NA Country: United Arab Emirates
Fair value Target: NA Sector: Airlines / Transportation
Recommendation: NA Exchange: Dubai Financial Market
March 12th, 2007
Pre IPO CoverageEquity Research
Sector Coverage Team
Kareem Z. Murad+9714 3199 [email protected]
Ahmad Shahin+9714 3199 [email protected]

Equities research
March 12th, 2007 2
Air Arabia
Contents
INVESTMENT HIGHLIGHTS .........................................................3
COMPANY OVERVIEW ................................................................4
DESCRIPTION ................................................................................................................................... 4
THE HUB .......................................................................................................................................... 5
ORGANIZATION STRUCTURE .......................................................................................................... 5
OWNERSHIP STRUCTURE ............................................................................................................... 6
SUBSIDIARIES .................................................................................................................................. 6
OPERATIONS .................................................................................................................................... 6
KEY OPERATING DATA .................................................................................................................... 7
MILESTONES .................................................................................................................................... 7
FLEET ................................................................................................................................................ 7
PASSENGER TRAFFIC....................................................................................................................... 8
ROUTES ............................................................................................................................................ 9
CORE COMPETITIVE STRENGTHS ................................................................................................. 11
SWOT ............................................................................................................................................. 11
COMPANY STRATEGY ................................................................................................................... 12
USES OF RAISED CAPITAL ............................................................................................................ 16
INDUSTRY OVERVIEW ..............................................................17
REGIONAL DRIVERS ...................................................................................................................... 19
PENETRATION RATES .................................................................................................................... 24
PASSENGER TRAFFIC GROWTH BY REGION ............................................................................... 25
PORTER’S 5 FORCES ..................................................................................................................... 25
OUTLOOK ....................................................................................................................................... 26
FINANCIAL ANALYSIS AND FORECASTS ......................................28
ASK & RPK ..................................................................................................................................... 28
REVENUES, PASSENGER GROWTH AND REVENUES PER PASSENGER ..................................... 29
TOTAL COSTS BREAKDOWN ......................................................................................................... 30
CASH .............................................................................................................................................. 30
LOANS ............................................................................................................................................ 30
GOODWILL AND AMORTIZATION ................................................................................................ 31
EBITDAR AND EBITDAR MARGIN ................................................................................................ 31
NET PROFITS AND NET PROFIT MARGIN..................................................................................... 31
GLOBAL PEERS .......................................................................32
FINANCIALS AND KEY RATIOS ...................................................33
APPENDIX ..............................................................................36

Equities research
March 12th, 2007 3
Air Arabia
Investment Highlights
Air Arabia pioneered the low cost carrier model in the Middle East, being the first to
introduce it successfully in the region.
A low-cost carrier or low-cost airline is an airline that generally offers low flight fares by
eliminating many traditional passenger services. The business model is typically based
on cost reduction by operating a single passenger class, a single type of airplane, and the
absence of ‘free’ in-flight catering and other additional services.
The company uses Sharjah International Airport as its main hub, making it the first
passenger airline to use the airport as a hub, and contributing massively to traffic through
the airport.
Air Arabia fleet today consists of nine aircrafts, which it flies to 32 destinations around
the Middle East and the Indian Sub Continent. The company plans to grow the fleet to 34
owned and leased aircrafts by 2015, to be utilized on existing routes and new potential
routes within a 4-5 hours flying time radius from its hub.
Core competitive strengths of Air Arabia include its first mover advantage, its ability to
quickly scale up, a young fleet, its high utilization of its aircrafts its strong and established
brand, its established and effective distribution network, its efficient low cost base and
highly favorable home and regional market dynamics.
Core risks include market resistance due to underdeveloped perception of LCCs,
sluggish liberalization of the sector, higher fuel costs, and the risk of deterioration on the
geopolitical front in the region.
Demand for air transportation services in the Middle East has shown substantial
growth in recent years, with passenger traffic in the Middle East increasing by a CAGR of
9% over the past five years. The primary drivers of this growth include strong economic
growth, lower fares, supportive demographic trends, growth in tourism, deregulation and
liberalization, and improved infrastructure. We expect demand in this sector to continue
to exceed global averages for the foreseeable future.
The price elasticity of demand for air transport is high, and we are therefore expecting
LCCs to enjoy higher growth rates than conventional airlines in the region, especially that
the sector currently enjoys a very low penetration rate.
The expatriate population of the UAE is estimated at around 80% of the country’s total
population, the highest rate in the GCC, the majority of which are from neighboring
countries. We believe that this demographic mix represents one of the core growth
drivers for Air Arabia going forward.
The company plans to utilize the proceeds from the upcoming IPO to grow its fleet
across its existing routes and into new regional routes. Other areas of potential growth
include the adoption of a second hub to broaden the airlines coverage in the region.
We project revenues of Air Arabia to reach AED 2.5 bn by 2011, representing a CAGR
of 26.3% from 2006, driven by the high load factors and in anticipation of new aircrafts
joining the current fleet. The number of passengers traveling with Air Arabia is expected
to grow at a CAGR of 25% between 2006 and 2011, reaching 5.263 million passengers by
2011, stimulated by the positive outlook of the industry and the region.
Air Arabia became profitable after its first full year of operation in 2004. We expect net
profits to double in 2007 reaching AED 226 mn and grow commensurately with gross
profits and EBITDAR at a CAGR of 29.6% to reach AED 369 mn by 2011 compared to AED
101 mn in 2006. We expect margins to reach 15% by 2011 versus 14% in 2006.
•
•
•
•
•
•
•
•
•
•
•
•

Equities research
March 12th, 2007 4
Air Arabia
Company overview
Description
Air Arabia pioneered the low-cost carrier (LCC) model in the Middle East, being the first
to introduce it successfully in the region. It was established on the 3rd of February 2003
by an Ameeri decree issued by the ruler of Sharjah, His Highness Dr. Sheikh Sultan Bin
Mohamed Al Qassimi. Sharjah’s International Airport is the company’s main hub. Air Arabia
began with a mission to revolutionize air travel in the region, much in the same way that
the introduction of low cost carriers revolutionized travel in the US, Europe and Asia, by
offering good value for money, and a safe, reliable operation. Air Arabia, as a business,
aims to be known for its low fares, growing business volume and profitability, highest
operational standards, a motivated work force and efficient management.
A low-cost carrier (LCC) or low-cost airline is an airline which is able to offer generally low
flight fares by eliminating many traditional passenger services. The concept was incepted
in the United States before spreading to Europe in the early 90’s. A low cost carrier’s
business model is typically based on cost cuts such as a single passenger class, a single
type of airplane (commonly the Airbus A 320 or Boeing 737), and the absence of ‘free’ in-
flight catering and other additional services.
Air Arabia is effectively modeled after leading American and European LLCs and is
customized to local preferences. However, we believe that the demographic structure
and intra-regional travel practice of the MENA might better fit the American model. This
is due to the fact that a large portion of the inhabitants of the US choose to work or study
away from their home states, driving a large number of ‘visiting friends and family’ (VFF)
travelers, which is similar to trends witnessed in expatriate-laden populations of the Gulf.
Such travelers tend to lean towards low cost carriers, which make multiple visits more
feasible economically.
Air Arabia’s value proposition is to offer individuals in the region - who were previously
discouraged from frequent regional travel by the high fares of conventional airlines - the
ability to travel almost at will. This value proposition has affected, and will continue to
affect, the whole regional airline industry, and is now one of the core factors boosting
growth in passenger traffic going forward.
First low cost carrier concept in the Middle East, established with a
mission to revolutionize air travel
Modelled after the US & European LCCs, however, the demographics of
the region better fit the US model

Equities research
March 12th, 2007 5
Air Arabia
The hub
Sharjah International Airport was established in 1932, serving as a stopover point for
flights en-route to their final destinations in India and Australia. As both the UAE and
the emirate of Sharjah grew in stature over the years, the airport has since expanded to
connect all major international destinations. However, substantial growth in passenger
traffic only really took off after the establishment of Air Arabia, as it was the first passenger
carrier to adopt the airport as a hub.
Sharjah International Airport is 10 kilometers away from Sharjah city centre and about 15
kilometers away from the emirate of Dubai. It is also in the vicinity of the smaller northern
and eastern emirates of the UAE. It operates an open sky policy that has enhanced its
flexibility and competitiveness, and that have attracted a broad number of carriers,
primarily from central and south Asia.
In October 2003, the first Air Arabia flight took off from Sharjah Airport heading to Bahrain,
marking the airline’s official launch of operations.
Sharjah International Airport handles at least 1,800 aircraft and some 100,000 passengers
every month. Below is a chart displaying the passenger movement at Sharjah
International airport, and Air Arabia’s contribution to that movement.
Source: Sharjah International Airport, Air Arabia, SHUAA Capital
Organization structure
Adel A. AliChief Executive Officer
HH Sheikh Abdullah Bin
Mohammed Al Thani
Chairman
Mohammad Al Qassimi
Advisor Operations & Technical
(Vacant)
Manager of Internal Audit
Oussama Alfonse Salah
Quality and Safety Manager
Imad Raad
Manager Corporate Security
Ali Hamdany
Director of IT &
Corporate Projects
Kyle Haywood
Commercial Director
Mohamed Ahmed
Director of Operations &
Maintenance
Donald Hubbard
Director of Strategy &
Planning
Paul Suckling
Director of Finance &
Administration
Source: Air Arabia, SHUAA Capital
Passenger movement
0
500
1,000
1,500
2,000
2,500
3,000
3,500
2000 2001 2002 2003 2004 2005 2006
Pa
sse
ng
er
tra
ffic
'00
0
Other airlines Air Arabia passengers
Passenger movement
0
500
1,000
1,500
2,000
2,500
3,000
3,500
2000 2001 2002 2003 2004 2005 2006
Pa
sse
ng
er
tra
ffic
'00
0
Other airlines Air Arabia passengers
Air Arabia adopted Sharjah International Airport as its main hub for cost efficiency
and due to its proximity to Dubai and accessibility to northern emirates.

Equities research
March 12th, 2007 6
Air Arabia
Ownership structure
Source: Air Arabia, SHUAA Capital
Subsidiaries
Subsidiary Place of incorporation Percentage ownership Activities
Red Marketing Communications FZE
Sharjah Airport International Free Zone 100% Providing marketing, advertisement agency and
communication services.
Information Systems Association FZC
Sharjah Airport International Free Zone 51% ownership, a joint venture with John Keels
Holding Limited
Providing IT services for the business require-
ments of Air Arabia in addition to IT solutions &
services for low cost carriers globally.
Sharjah Aviation Services
Sharjah Airport International Free Zone 50% joint venture with the
government of Sharjah
Ground handling
Haeco Sharjah Aircraft Maintenance Ltd.*
Sharjah International Airport 51% joint venture with Honk Kong listed Haeco Engineering and maintenance
*announced on 12th of March 2007
Source: Air Arabia, SHUAA Capital
Operations
Typically, the vast majority of low cost carriers’ revenues are passenger-related. In 2005 and
2006, over 95% of the revenues of Air Arabia were passenger revenues, 3% were baggage
revenues and the remaining 2% came in from cargo activities.
Passenger revenues are a function of load factor and airfare, where the load factor is the
average number of occupied seats relative to total seats available for all flights made
during the year.
A good estimate for air fares, and by extension passengers’ cost savings in LCCs, is revenue
per available seat kilometers (RASK) (revenues * seat capacity * kilometers traveled).
Comparing the 2004 and 2005 RASK of Air Arabia to that of Emirates Airlines, the largest
UAE based conventional carrier, we find that the RASK of Air Arabia is 35% and 27% lower
than that of Emirates Airlines, respectively.
Source: Emirates Airlines, Company, SHUAA Capital
Pre IPO ownership structure
27%
15%
20%
15%
23%
Department of Civil Aviation
Sharjah International Airport Authority
Al Maha Holding
Institutional investors
Other investors
Post IPO ownership structure12%
7%
9%
7%
10%
55%
Department of Civil Aviation
Sharjah International Airport Authority
Al Maha Holding
Institutional investors
Other investors
Free Float
RASK for conventional airlines vs LCC
0.0
2.0
4.0
6.0
8.0
10.0
2004 2005
RA
SK
(ce
nts
)
RASK Emirates (cents) RASK Air Arabia (cents)
35%
27%
RASK for conventional airlines vs LCC
0.0
2.0
4.0
6.0
8.0
10.0
2004 2005
RA
SK
(ce
nts
)
RASK Emirates (cents) RASK Air Arabia (cents)
35%
27%
Air fares for Air Arabia are on average 27% less than local
conventional airlines as at 2005

Equities research
March 12th, 2007 7
Air Arabia
In addition to the air-travel services, Air Arabia provides several on-board, on-ground and
logistic services that are purchased, optionally and separately, from the ticket charges.
Ground Services are limited to coaching services that provide airport drop-off and pick up
(only within UAE and Istanbul) at special relatively low-price rates.
Visa Assistance services are also provided by Air Arabia, whereby the passenger contacts
Air Arabia for visa assistance in UAE and any other country of destination.
Key operating data
Key operating data 2004 2005 2006
No. of routes 15 23 32
No. of passengers 546,587 1,132,912 1,762,810
Seat factor % 68 79 80
No of aircraft at year end 4 5 8
Average no. of aircrafts 4 5.2 6.8
ASK ‘000 1,734,696 3,172,349 4,695,667
RPK ‘000 1,179,593 2,506,156 3,737,751
Block hrs per aircraft per day 9.2 12.9 14.5
No. of sectors flown 5,398 9,412 13,512
Block hours 13,385 24,478 35,902
Average no. of employees 250 314 464
Source: Air Arabia, SHUAA Capital
Milestones
Source: Air Arabia website, SHUAA Capital
Fleet
Air Arabia’s fleet today consists of 9 aircraft (8 at the end of 2006 and an additional aircraft
joining the fleet early 2007), all of which are leased aircrafts. However, the company
intends to place orders to purchase additional aircrafts, following its IPO. As per the
company’s existing strategy, the fleet is to increase in size to 34 owned and leased aircraft
by 2015. Consistent with the traditional model for LCCs, all aircrafts will likely continue to
be of a single type, the narrow bodied Airbus A320.
According to Air Arabia’s management, the increase of its fleet size is a strategic decision
based primarily on demand for existing routes, as well as new potential routes. The
company believes that a significant portion of the 34-aircraft fleet will be required to
service existing routes through increasing the number of trips to existing destinations,
while agreements to fly to other destinations will drive the demand for further aircrafts.
2003 2007
Launch of
Air Arabia
Fleet:
2 aircrafts
Fleet:
4 aircrafts
Dec 04
Fleet:
9 aircrafts
Jan 07Dec 05
Fleet:
5 aircrafts
Oct 06
3 million
passengers
March 07
Dec 06
Fleet:
8 aircrafts
2 million
passngers
Mar 06
1 million passengers
since launch
Jun 05
Air Arabia 500,000 passenger
celebration
Oct-04
First plane departing
Sharjah
Oct 03
Dec 032003
IPO Start
Fleet today consists of 9 leased aircrafts and is expected to reach 34
aircrafts owned & leased by 2015

Equities research
March 12th, 2007 8
Air Arabia
Below are tables detailing existing, ordered and to be potentially ordered aircrafts.
Existing fleet
Aircraft type and registration no. Lessor Date of Lease Date of Delivery Lease Period Option to Extend
A-ABA (MSN2158) ILFC1 10/09/2003 24/02/2004 5 years 2 years
A6-ABD (MSN2349) ILFC 10/09/2003 25/01/2005 5 years 2 years
A6-ABB (MSN2166) ILFC 10/09/2003 23/03/2004 5 years 2 years
A6-ABC (MSN2278) ILFC 10/09/2003 13/10/2004 5 years 2 years
A-ABE (MSN2712) CIT2 31/07/2006 17/03/2006 6 years -
A6-ABF (MSN2764) CIT 30/11/2005 28/04/2006 6 years -
A6-ABG (MSN2930) CIT 30/11/2005 31/10/2006 6 years -
A6-ABH(MSN2964) CIT 22/02/2006 28/11/2006 6 years -
A6-ABI (MSN3044) CIT 04/09/2006 23/02/2007 6 years -
1 International Lease Finance Corporation, 2 CIT Aerospace International
Source: Air Arabia, SHUAA Capital
The mentioned fleet expansion is to be achieved through ownership and lease of aircrafts
by 2015. As highlighted in the chart below, management currently has a clear idea on
the division between leasing and owning aircrafts. It is important to note, however, that
current management plans are subject to change with the possible introduction of new
routes. Following the IPO, the company will have more cash available on its books going
forward, which may influence its strategic thinking.
Source: Air Arabia, SHUAA Capital
Passenger traffic
Since Air Arabia started operations, its annual number of passengers has been showing
very strong growth, with 1.7 million passengers in 2006, 47% higher than in 2005.
This increase in passenger traffic was accompanied by increases in operating aircrafts,
destinations, average sector flights per year and most importantly, load factors. Taken
together, these factors reflect the increased awareness of Air Arabia’s brand and its
business model, and by extension, highlighting the potential market of the LCC model in
the Middle East.
Source: Air Arabia, SHUAA Capital
Air Arabia fleet
4 5 8 11 12 13 13 10 12 14 16 17
3
leased aircrafts owned aircrafts
6 1213
1415
17
-
5
10
15
20
25
30
35
40
20
04
20
05
20
06
20
07
E
20
08
E
20
09
E
20
10
E
20
11
E
20
12
E
20
13
E
20
14
E
20
15
E
Air
cra
fts
Air Arabia fleet
4 5 8 11 12 13 13 10 12 14 16 17
3
leased aircrafts owned aircrafts
6 1213
1415
17
-
5
10
15
20
25
30
35
40
20
04
20
05
20
06
20
07
E
20
08
E
20
09
E
20
10
E
20
11
E
20
12
E
20
13
E
20
14
E
20
15
E
Air
cra
fts
Passenger & revenue per passenger
0
1,000
2,000
3,000
4,000
5,000
6,000
7,000
Dec-
04
Dec-
05
Dec-
06
Dec-
07E
Dec-
08E
Dec-
09E
Dec-
10E
Dec-
11E
Pa
sse
ng
ers
’00
0
0
50
100
150
200
250
300
350
400
450
500
Re
ve
nu
e p
er
pa
sse
ng
er
AE
D
Number of Passengers Revenues / Passenger
Passenger & revenue per passenger
0
1,000
2,000
3,000
4,000
5,000
6,000
7,000
Dec-
04
Dec-
05
Dec-
06
Dec-
07E
Dec-
08E
Dec-
09E
Dec-
10E
Dec-
11E
Pa
sse
ng
ers
’00
0
0
50
100
150
200
250
300
350
400
450
500
Re
ve
nu
e p
er
pa
sse
ng
er
AE
D
Number of Passengers Revenues / Passenger
Air Arabia’s passenger traffic grew by 47% in 2006 to reach 1.7 mn passengers

Equities research
March 12th, 2007 9
Air Arabia
Routes
We provide a graphical illustration of Air Arabia’s currently scheduled flight routes.
Additionally, we also identify potential new destinations that Air Arabia could add to its
current portfolio of destinations.
Our selection of additional destinations is based on an estimate of a 4-5 hour flying time
radius from Air Arabia’s home base of Sharjah. Going forward, we expect the addition
of secondary hubs to significantly widen Air Arabia’s potential coverage reach, with
incremental 4-5 hour radius additions from each new hub.
Existing routes
Source: Air Arabia, SHUAA Capital
Today, Air Arabia has scheduled flights to 32 destinations around the Middle East and
the Indian Sub Continent. The routes operated all fall within a 4-5 hour flying time radius
from Sharjah international Airport, and hence are concentrated in the Gulf, the broader
Middle East, East Africa, Central and South Asia. Given the short haul nature of its routes,
traffic on Air Arabia is primarily point-to-point. The routes represent the population origin
mix within the UAE and intra-regional tourism flows accurately. The carrier flies routes
which are traditionally popular with conventional carriers in the region. In addition, Air
Arabia began flying to new routes that conventional carriers have not offered historically,
and which have generated new point-to-point traffic. Destination airports include both
primary and secondary airports. A number of popular destinations that fall within the
target radius are still missing, such as Cairo, primarily due to restrictions and limitations on
landing rights.
Arctic Circle
Tropic of CancerTropic of Cancer
Tropic of Capricorn
Equator Equator
Tropic of Capricorn
ATLANTICPACIFIC PACIFIC
OCEANOCEAN
OCEAN
ARCTIC OCEANARCTIC OCEAN
Somoa
Venezuela
Uruguay
United States
United Kingdom
Tunisia
Trinidad & Tobag oTogo
Switz.
Sweden
Suriname
Spain
Slovenia
Slovakia
Sierra Leone
Serb. &Mont.
Senegal
Sao Tome & Princip e
Portugal
Poland
Peru
Paraguay
Panama
Norway
Nigeria
Niger
Nicaragua
Neth.
Morocco
Mongolia
Mexico
Mauritania
Malta
Mali
Mace.
Lux.
Lithuania
Libya
Liberia
Latvia
S. Korea
N. Korea
Japan
Jamaica
Italy
Ireland
Iceland
Hungary
HondurasHaiti
Guyana
Guinea-BissauGuinea
Guatemala
Greenland
Ghana
Germany
Gambia
French Guiana
France
Finland
Estonia
Equatorial Guinea
El Salvado r
Ecuador
Dom. Rep.
Denmark
Czech Rep.
Cuba
Croatia
Coted'Ivoir
Costa Ric a
Colombia
Chil e
Cape Verde
Canad a
Cameroon
Burkina Fas o
Brazi l
Bos. &Herz.
Bolivi a
Benin
Beliz e
Bel.
Belarus
Bahamas
Austria
Argentina
Algeria
Albania
Western Sahara
1000 Km0
Ukraine
Mold.Romania
Russia
(Occupied by Morocco)
China
U.A.E. Jaipur
Kathmandu
Almaty
Astana
Alexandria
Assiut
Jeddah
Khartoum
Sana’a
Nagpur
Mumbai
Chennai
Thuravanthapuram
Colombo
Arctic Circle
Tropic of CancerTropic of Cancer
Tropic of Capricorn
Equator Equator
Tropic of Capricorn
ATLANTICPACIFIC PACIFIC
OCEANOCEAN
OCEAN
ARCTIC OCEANARCTIC OCEAN
Somoa
Venezuela
Uruguay
United States
United Kingdom
Tunisia
Trinidad & Tobag oTogo
Switz.
Sweden
Suriname
Spain
Slovenia
Slovakia
Sierra Leone
Serb. &Mont.
Senegal
Sao Tome & Princip e
Portugal
Poland
Peru
Paraguay
Panama
Norway
Nigeria
Niger
Nicaragua
Neth.
Morocco
Mongolia
Mexico
Mauritania
Malta
Mali
Mace.
Lux.
Lithuania
Libya
Liberia
Latvia
S. Korea
N. Korea
Japan
Jamaica
Italy
Ireland
Iceland
Hungary
HondurasHaiti
Guyana
Guinea-BissauGuinea
Guatemala
Greenland
Ghana
Germany
Gambia
French Guiana
France
Finland
Estonia
Equatorial Guinea
El Salvado r
Ecuador
Dom. Rep.
Denmark
Czech Rep.
Cuba
Croatia
Coted'Ivoir
Costa Ric a
Colombia
Chil e
Cape Verde
Canad a
Cameroon
Burkina Fas o
Brazi l
Bos. &Herz.
Bolivi a
Benin
Beliz e
Bel.
Belarus
Bahamas
Austria
Argentina
Algeria
Albania
Western Sahara
1000 Km0
Ukraine
Mold.Romania
Russia
(Occupied by Morocco)
China
INDIAN
OCEAN
YemenY
Sri LankaSomalia
India
U.A.E. Jaipur
Kathmandu
Kabul
Almaty
Astana
Tehran
YerevanIstanbul
AleppoLatakia
BeirutDamascus
AmmanAlexandria
Assiut
Luxor
Jeddah
Khartoum
Sana’a
Riyadh DohaBahrain
Dammam
Kuwait
Nagpur
Mumbai
Chennai
KochiThuravanthapuram
Colombo
Currently fly to 32 destination airports including primary and
secondary airports around the Middle East & Indian Sub-continent

Equities research
March 12th, 2007 10
Air Arabia
The company is currently operating at an average load factor of 80%, compared with a
2006 average of 73% for the industry (including conventional airlines). This higher load
factor indicates the potential and need for more frequent flights to existing destinations,
either by increasing the daily operating time per aircraft or by adding new aircrafts to
cater to these destinations.
The chart below illustrates the scheduled number of flights per week to destination
countries against their average load factors, as per 2006 data. The intention is to show the
countries with highest traffic demand. India, through its main destination hubs of Kochi,
Mumbai, Nagpur, Jaipur and Thiruvananthapuram, is the destination with the most traffic.
Source: Air Arabia, SHUAA Capital
Source: Air Arabia, SHUAA Capital
Prospect routes
Madinah
Ankara
Salalah
Addis Ababa
Bangalore
Aqaba
Taba
Aswan
Luxor
Cairo
Tehran
Calcutta
VishakhapatnamHyderabad
Mangalore
Karachi
Lahore
Islamabad
Peshawar
Delhi
Calicuta
Coimbatore
Pune
Al Arish
Goa
Isfahan
Baghdad
ErbilErbil
Madras
Dhaka
Amritsar
MuscatAhmedabad
Shiraz
INDIAN
OCEAN
Sudan
Sri LankaSomalia
JJordaJordaJ danadaJordaAqabAqabbbbababb
IraqIraq
India
Ethiopia
EritreEEE
Egypt
U.A.E.
Saudi ArabiaSaudi ArabiS
Kazakhstan
Source: SHUAA Capital
Flights per week from Sharjah airport to destination
0
5
10
15
20
25
30
35
40
Ba
hra
in
Eg
ypt
Ira
n
Jord
an
KS
A
Ku
wa
it
Leb
an
on
Om
an
Qa
tar
Su
da
n
Syr
ia
Yem
en
Ind
ia
Ka
zakh
sta
n
Ne
pa
l
Sri
La
nka
Turk
ey
Fli
gh
ts
0
10
20
30
40
50
60
70
80
90
100
Lo
ad
Fa
cto
r
Flights Load factor
Flights per week from Sharjah airport to destination
0
5
10
15
20
25
30
35
40
Ba
hra
in
Eg
ypt
Ira
n
Jord
an
KS
A
Ku
wa
it
Leb
an
on
Om
an
Qa
tar
Su
da
n
Syr
ia
Yem
en
Ind
ia
Ka
zakh
sta
n
Ne
pa
l
Sri
La
nka
Turk
ey
Fli
gh
ts
0
10
20
30
40
50
60
70
80
90
100
Lo
ad
Fa
cto
r
Flights Load factor
Passenger traffic to & from destinations in 2006
-
50
100
150
200
250
300
350
400
450
Ba
hra
in
Eg
ypt
Ira
n
Jord
an
KS
A
Ku
wa
it
Leb
an
on
Om
an
Qa
tar
Su
da
n
Syr
ia
Yem
en
Ind
ia
Ka
zakh
sta
n
Ne
pa
l
Sri
La
nka
Turk
ey
Nu
mb
er
of
pa
sse
ng
ers
'00
0
Passenger traffic to & from destinations in 2006
-
50
100
150
200
250
300
350
400
450
Ba
hra
in
Eg
ypt
Ira
n
Jord
an
KS
A
Ku
wa
it
Leb
an
on
Om
an
Qa
tar
Su
da
n
Syr
ia
Yem
en
Ind
ia
Ka
zakh
sta
n
Ne
pa
l
Sri
La
nka
Turk
ey
Nu
mb
er
of
pa
sse
ng
ers
'00
0

Equities research
March 12th, 2007 11
Air Arabia
There remain many prospective routes that Air Arabia may add in the future, and that
lie well within the four hour target flying radius, depending on a larger fleet, and more
importantly, landing rights. In addition to Cairo, Air Arabia has yet to introduce any flights
to Pakistan, whose expatriates make up 10% of the UAE population. Routes to new
destinations in Southern and Eastern Europe, Eastern Africa Central Asia and India may
also prove to be attractive prospects for the Airline in the future.
Core competitive strengths
Despite intensifying regional competition, the LCCs industry remains comparatively
immature. Air Arabia, being the first mover in this high-growth industry, is pre-eminently
positioned to capitalize on the expected growth of regional low-cost air travel demand.
Earlier this year, Air Arabia was awarded the ‘Low Cost Airline of the Year 2006’ award by
the Centre of Asia Pacific Aviation (CAPA), in recognition of its strong strategic contribution
for the aviation industry. CAPA is a leading aviation consulting services provider, airline
conferences organizer, aviation news publisher and analysis provider in the Asia Pacific
region, the Indian Subcontinent and Middle East.
Below are what we believe to be the company’s core competitive strengths at this point:
Clear first mover advantage in the region
Established and effective distribution network
Young fleet (low maintenance cost)
Efficient low cost base
An ability to scale up quickly
Highly favorable home and regional market dynamics
Efficient aircraft utilization
SWOT
Strengths
• Strong brand identity, being the first
low cost carrier in the region
• Taking Sharjah International Airport as
an operational hub
• Scheduled flights already established
around the region
• Safe (new air crafts fleet), not
compromising the safety for price
• Very young fleet
Opportunities
• Inbound / outbound tourism growth in
UAE
• Anticipated population growth will
tend to raise the frequency of business
travel
• Strong Economic growth
• Establishment of secondary hubs to
widen reach radius
• Single GCC Visa
• Potential intra gulf double daily flights
• Hub in the Mediterranean to gain
access to North Africa (Libya, Tunis,
Algeria and Morocco)
Threats
• New LCCs being established in the
region
• Conventional airline carriers on
regional routes
• Traffic and landing rights
• Deterioration in geopolitical
environment
Weaknesses
• Based in Sharjah airport which create
inconvenience to Dubai & Abu Dhabi
based clients (due to huge traffic
congestion)
• No incentive program (compared
with skywards)
• Perception of low price means
compromising safety
Source: SHUAA Capital
•
•
•
•
•
•
•
With a potential to add many new routes in the future

Equities research
March 12th, 2007 12
Air Arabia
Company strategy
Corporate strategy The company aims to revolutionize air travel in the region and to become the leading low
cost carrier in the Middle East, taking advantage of the prevalent low penetration rate and
substantial potential for increased air travel. To achieve its vision, it will have to attend to
the key market requirements of substantially lower fares and adequate supply capacities.
The successful low cost structure is vital for the success and survival of Air Arabia’s
business model. The strategy should be focused on gaining more cost efficiencies to
maintain competitive fares. Maintaining low fare structure is the key driver given the price
elasticity of demand and the likely increase in competition, even against conventional
airlines on certain destinations. Regional conventional airlines have recently started
to focus on lowering their fares by achieving economies of scale and gaining cost
efficiencies.
In the case of Air Arabia, a key success factor in cost savings is their operations from
a small and un-congested hub. The benefits are shorter times to take off, taxi-in and
taxi-out; resulting in costs savings on fuel and repair costs. Air Arabia on average needs
around 5 minutes from the time they turn on their engines to get to the takeoff runway,
as opposed to almost 30 minutes in large congested airports. This means that there
are 25 minutes per trip per aircraft of fuel saving and lower engine usage and therefore
maintenance.
According to regulations, one cabin crew member is required per 50 passengers. Since Air
Arabia’s aircrafts are fitted with 162 seats, no more than 4 crew members are necessary per
flight; acting as another cost cut.
A vital role Air Arabia plays is deciding on its optimal seat configuration and concentrating
on maintaining that level. The decision on fitting all aircrafts with 162 seats came from
taking into consideration the optimal load factor, cabin space and weight for regional air
travel.
Source: IATA
Airlines tend to compensate for higher costs by charging higher than average fares and
excess luggage fees. Indeed factors such as pollution have already caused some countries
to consider, and in some cases, to implement, further limitations on weight.
Since its establishment, Air Arabia has succeeded in regularly increasing scheduled flights
to various destinations. Today it travels to 32 destinations, and will soon commence its
scheduled flights to Ahmadabad in India and Karachi and Peshawar in Pakistan. Potential
for further growth still exists given that a number of airports/destinations, within a 4 to 5
hour flight time radius, are yet to be penetrated.
Passenger load factor by region
68.6
72.7
76.4
72.673.6
79.5
75.1
68.3
74.6
77.0
73.0 73.4
80.2
76.0
60
65
70
75
80
85
Africa AsiaPacific
Europe LatinAmerica
MiddleEast
NorthAfrica
Total
2005 2006
Passenger load factor by region
68.6
72.7
76.4
72.673.6
79.5
75.1
68.3
74.6
77.0
73.0 73.4
80.2
76.0
60
65
70
75
80
85
Africa AsiaPacific
Europe LatinAmerica
MiddleEast
NorthAfrica
Total
2005 2006
Success depends on the ability to maintain cost efficiency
Operations from a secondary and un-congested hub is a key success factor

Equities research
March 12th, 2007 13
Air Arabia
Based on the potential for growth in existing routes, which are subject to current airport
capacity constraints, increasing the airline’s fleet size has become a priority. This is
especially the case if the airline is to continue to grow its overall market share in regional
air travel, as well as retaining its leading position among Low Cost Carriers in the Middle
East.
As mentioned earlier the company is currently operating 9 leased aircrafts and has the
ambition to operate 34 aircraft, owned and leased, by 2015. However, according to the
management, these numbers do not fully take into consideration other potential routes
or regulatory developments that can open doors to even bigger markets.
In the medium to long term, Air Arabia may adopt a second regional hub to enhance its
intra-regional capacity. We believe that this will be a key development for the airline, as it
would allow it to expand its regional profile and to increase its radius of coverage.
Competitive strategyCompetitive advantage is usually achieved by either price leadership or through
differentiation. However, as we have been arguing, the price competitiveness in the case
of Air Arabia is the main anchor for its business.
The low fare structure has increased the number of passengers traveling in general, and
in turn, increased the size of the market. Based on IATA surveys, 30% of the decision to
choose one flight over another is determined by price, while the remaining 70% is divided
between other considerations like frequent flyer programs, convenience and a positive
flight experience, each accounting for less than 30% of the decision. In other words, price
is the single most important factor in choosing flights for most travelers.
The survey defines the cost-driven competitive advantage, which Air Arabia currently
enjoys.
We identify Air Arabia’s competition -for the time being - as regional conventional airlines,
whose fares are almost 40% higher than that of Air Arabia. Conventional airlines might
be offering other added value services that contribute to the passengers’ experience, but
as shown above, ticket prices play a determining role in choosing between an LCC and a
conventional carrier.
Source: IATA
Air Arabia has the advantage of having the flexibility to increase its fares slightly because
it retains a temporary semi-monopoly, given the minimal competition from other LCC’s in
the region. However, we do not believe that it will increase its fares. Instead, we believe Air
Arabia will concentrate on penetrating new markets and establishing a competitive edge
over future potential competitors down the line, in an attempt to boost its brand equity in
the region.
As Air Arabia operates from a secondary airport, it tends to benefit from lower costs (less
fuel consumption) and higher turnover (more trips per aircraft) due to less congestion in
Airline criteria of flight choice
0%
5%
10%
15%
20%
25%
30%
35%
Price Frequent flier Convenient
schedules
Non-stop
flights
Previous
good
experience
Other
Airline criteria of flight choice
0%
5%
10%
15%
20%
25%
30%
35%
Price Frequent flier Convenient
schedules
Non-stop
flights
Previous
good
experience
Other
Air Arabia may adopt a secondary hub to increase radius of coverage
High price elasticity of demand
Equities research
March 12th, 2007 14
Air Arabia
the airport. This is since taxi, takeoff and landing are usually more efficient than at larger,
busier airports. Lower airport fees compared with larger regional hubs is also crucial in
retaining cost benefits.
On the down side, access to destination airports remains limited by capacity constraints,
reluctance in adopting open skies policies, and the reciprocation of access to airports
between flag carriers (national carriers). The Middle East region continues to be
dominated by flag carriers, while Air Arabia is the smallest among three flag-carriers in the
UAE, which may put it at a comparative disadvantage when negotiating landing rights.
1000 Km0
INDIAN
OCEAN
TurkmenistanT
Sudan
Sri LankaSomalia
Bahrain
Iraq
India
Ethiopia
EritreE e
Egypt
Iran
U.A.E.
Saudi Arabia
Kazakhstan
Gulf air - Bahrain
Destinations 46Fleet Size in service 29Orders 0Services Scheduled, Passenger,
Cargo, International, Regional, Domestic
Iran Air - Iran
Destinations 39Fleet Size in service 39Orders 0Services Scheduled, Passenger,
Cargo, International, Regional, Domestic
Kuwait Airways - Kuwiat
Destinations 36Fleet Size in service 24Orders 0Services Scheduled, Passenger,
Cargo, International, Regional
Middle East - Lebanon
Destinations 22Fleet Size in service 9Orders 8Services Scheduled, Passenger,
Cargo, International, Regional
Qatar airways - Qatar
Destinations 69Fleet Size in service 52Orders 38Services Scheduled, Passenger,
Cargo, International, Regional
Indian Airlines - India
Destinations 52Fleet Size in service 59Orders 44Services Scheduled, Passenger,
Cargo, International, Regional, Domestic
Air India - India
Destinations 43Fleet Size in service 32Orders 63Services Scheduled, Passenger,
Cargo, International, Regional
Royal Jordanian - Jordan
Destinations 48Fleet Size in service 20Orders 5Services Scheduled, Passenger,
Cargo, International, Regional, Domestic
Saudi Arabian Airlines - KSA
Destinations 61Fleet Size in service 108Orders 1Services Scheduled, Passenger,
Cargo, International, Regional, Domestic
Air Arabia - UAE
Destinations 32Fleet Size in service 9Orders 17Services Scheduled, Passenger,
Regional
Emirates Airlines - UAE
Destinations 82Fleet Size in service 100Orders 120Services Scheduled, Passenger,
Cargo, International, Regional
Etihad Airways - UAE
Destinations Fleet Size in service 23Orders 13Services Scheduled, Passenger,
Cargo, International
Source: ATI, SHUAA Capital
However, we believe that deregulation and the adoption of open skies agreements and
network travel is inevitable, as flag carriers in the region get privatized, and protection is
dropped. Air Arabia will then have the advantage of being able to grow existing routes
and tap new markets well before others. As the primary direct markets get accessed, the
airline may use those markets as secondary hubs for further destinations travel, growing
its footprint substantially.
Prospective CompetitionA budget airline model is a successful model. Experiences around the world proved
that the majority of LCC’s are profitable, as opposed to conventional airlines. The under
penetrated market of the Middle East promises to be a feasible and profitable model for
new entrants, given the necessary foundation for a successful budget airline model and
based on the region’s economic and demographic dynamics.
The existing regional budget airlines will form a threat to conventional airlines as they
will be touching on markets they fly to, or at least, in the meantime, the Middle East and
Indian Sub-continent.
Based on the existing point to point model of today and given the LCCs travel time radius
of four to five hours, we see the intensity of the competition being a function of proximity.
In the case of Air Arabia, competition will extend to reach India, Nepal, Kazakhstan, Turkey,
Sudan and Kenya.
Domination of flag carriers put privately owned airlines at a disadvantage

Equities research
March 12th, 2007 15
Air Arabia
The Middle East already has three operational LCC’s in the UAE, Saudi Arabia (domestic
carrier) and Kuwait, as well as other airlines currently being set up. However, we expect
that others will be announcing their setup in the very near future. The Saudi Arabian
General Authority of Civil Aviation is already evaluating domestic travel demands and is
willing to provide private air carriers with licenses if deemed necessary.
A brief overview of a few regional budget carriers other than Air Arabia: Al Jazeera Airways was formed in Kuwait in November 2004 following the placement
of 70% its share capital. Operations started in 2005 with services from Kuwait to Dubai.
Towards the end of 2006, Al Jazeera was operating a fleet of four Airbus A320 aircraft
on scheduled services to 15 destinations, namely Assiut, El Nouzha, Luxor, and Sharm
El Sheikh in Egypt; Cochin, Mumbai/Bombay and Delhi in India; and Aleppo, Bahrain,
Damascus, Kuwait, Amman, Beirut, Dubai and Mashad in the Middle East.
A fifth A320 aircraft joined the Al Jazeera fleet in January 2007, and a sixth is due before
the end of the year, while four others are expected to be delivered by 2010. In February
2007, Al Jazeera introduced operations from a second hub, becoming the first low cost
carrier to operate from Dubai International Airport. Initial services will link Dubai with
Bahrain. Six further routes from Dubai to Kuwait, Mumbai, Kochi, New Delhi, Muscat and
Salalah will be introduced on 27 March 2007.
RAK Airways, a start-up LCC in the northernmost emirate of the UAE, is planning to
launch during this year and plans to cater for flights to the GCC, Levant, Europe, Africa
and Indian Sub-continent. RAK Airways was established through a royal decree and will
launch with authorized capital of AED 1.5 bn of which AED 850 mn paid up capital. The
airline currently owns 1 Boeing 757 aircraft and announced plans to place an order for 15
passenger aircraft from Airbus or Boeing.
In Saudi Arabia, National Air Services (NAS), the only licensed private aircraft operator
in the Kingdom, announced its plans to launch a low-cost carrier in the country. Saudi
National Air Services (SNAS) currently operates scheduled and non-scheduled cargo
services throughout the Middle East on behalf of DHL Express, serving all major regional
cities. It is expected to commence with its low cost passenger business in 2007 with four
Airbus A320 aircraft.
Sama Airlines is currently operating a Boeing 737-300 between Saudi Arabian cities. It
is planning to widen its operations to service Intra Middle Eastern routes with 2 or 3
additional Boeing aircrafts that will be joining its current fleet by 2008. The airline was
established by the Saudi company, Investment Enterprises, and will be operationally
assisted by UK advisory firm Mango Aviation Partners. Sama is one of 6 companies
pursuing national carrier licenses from the Saudi Arabia’s General Authority for Civil
Aviation (GACA).
In India, Air Deccan, Air India Express, Go Air, IndiGo Airlines, Paramount Airways and
SpiceJet, make up the 6 existing LCC’s to date. Pakistan has a single operating LCC, Aero
Asia International. If we adopt the view that LCC’s travel radius is around 4 to 5 hours,
then the Indian and Pakistani LCC’s will compete with Air Arabia on regions east of UAE.
Competition might be on routes to Iran, Qatar, Oman, Pakistan, Afghanistan, Kazakhstan
and Sri Lanka.
Indian LCC’s will primarily compete domestically and with Asian airlines on destinations
like China, Malaysia, Indonesia and other South East Asian countries that have significant
potential passenger traffic and above average business growth potentials. On this basis,
we believe that Indian LCC’s are targeting a different niche than Air Arabia is, and that it is
therefore not to be considered as a high threat.
Few operational Middle Eastern LLCs, but competition is expected to increase
Al Jazeera currently operates 5 aircrafts servicing 15 destinations
RAK to start operations in 2007 with 1 aircraft but expected to purchase
an additional 15 aircrafts
Sama Airlines is operating 1 aircraft between Saudi Arabia cities

Equities research
March 12th, 2007 16
Air Arabia
Should open skies agreements and network airlines be implemented, thus allowing
Indian carriers to land in the UAE and fly from the UAE to other destinations, then Indian
LCCs may cause a threat to Air Arabia.
Airline Country Established Base Fleet Destinations
Air Deccan India 2003 Bangalore 29 57
Air India Express India 2005 Cochin 7 11
Spice Jet India 2005 New Dehli 6 11
GoAir India 2004 Mumbai 3 12
Indigo Airlines India 2006 Dehli 3 11
Paramount Airways India 2005 Chennai 2 6
Air Arabia UAE 2003 Sharjah 8 32
Al Jazeera Airways Kuwait 2005 Kuwait 4 7
Source: Companies websites
Uses of raised capital
Given the above average growth potential in the budget airline business, and the fact
that the Middle East remains a virgin market for budget airlines, Air Arabia aims to be the
first carrier to penetrate this market and to acquire substantial market share by increasing
its fleet, increasing the frequency of its flights on existing routes, as well as introducing
new, potentially lucrative routes as the industry in the region deregulates, and the
transportation infrastructure develops.
The company has decided to raise its capital by AED 2.6 billion through an initial public
offering to reach AED 4.67 billion, in order to fund the increase its fleet from the current 9
leased aircrafts to 34 owned and leased aircrafts within the next ten years, and to finance
other capital expenditure directed at the purchase of engines and other fixed assets.
As per our estimates, the capital expenditure financing will be 80 pct debt versus 20 pct
equity.
Proceeds from the IPO are to be used in the fleet expansion plan
and to establish secondary hubs to widen the destination routes

Equities research
March 12th, 2007 17
Air Arabia
Industry Overview
A budget airline or a low cost carrier is an airline that generally charges a low fare in
comparison with conventional passenger carriers. This concept originated in the US and
soon afterwards moved to Europe and Asia, before finally penetrating the Middle East in
2003, when Air Arabia made its debut.
The typical low cost carrier business model is characterized by the practices that enable
LCC’s to cost cuts vis-à-vis conventional carriers. Those characteristics are typically as
follows:
Single passenger class
Single type of airplane (commonly the Airbus A320 or Boeing 737), reducing
training and servicing costs.
Simple fare scheme (typically fares increase as the plane fills up, which rewards
early reservations)
Unreserved seating (encouraging passengers to board early and quickly)
Flying to cheaper, less congested secondary airports and flying early in the
morning or late in the evening to avoid air traffic delays and take advantage of
lower landing fees
Short flights and fast turnaround times (allowing maximum utilization of air-
craft)
Simplified routes, emphasizing point-to-point traffic instead of transfers at hubs
(again enhancing aircraft utilization)
Eliminating disruption due to delayed passengers or luggage missing due to
connecting flights
Emphasis on direct sales of tickets, especially over the Internet (avoiding fees
and commissions paid to travel agents and Computer Reservations Systems)
Encouraged use and issuance of the electronic ticket
Employees working in multiple roles, for instance flight attendants also cleaning
the aircraft or working as gate agents (limiting personnel costs)
"Free" in-flight catering and other "complimentary" services are eliminated, and
replaced by optional paid-for in-flight food and drink (which represent an ad-
ditional profit source for the airline).
Aggressive fuel hedging programs.
"Unbundling" of ancillary charges (showing airport fees, taxes as separate
charges rather than as part of the advertised fare) to make the "headline fare"
appear lower.
These characteristics are heavily geared towards cutting unnecessary costs
related to labor, aircraft and fuel, infrastructure, distribution and seat density
adjustments.
•
•
•
•
•
•
•
•
•
•
•
•
•
•
•
LCCs characterized by:

Equities research
March 12th, 2007 18
Air Arabia
The charts below are examples of the American, European model and the Middle East
cost saving structure models.
Source: IATA, Emirates Airlines, Air Arabia, SHUAA Capital
In the American model, a low cost carrier saves around 40% on costs versus a
conventional carrier, while the European LCC saves around 67.8% on their costs. However,
cost differences today are less than they were in 2004, as conventional carriers started to
cut some costs in order to maximize profits and to regain market share lost to LCCs.
The trend is that as the number of regional LCC’s increase and force tighter profit
margins across the entire industry, cost cuts and lower prices no longer become a
competing factor, but more of the norm. Competition therefore tends to shift towards the
differentiation of products or services. This is reflected in the difference between US and
European markets’ cost-cutting, which is lower in the US (40%) than in Europe (67.8%).
That is because the US market is more saturated than the European one.
As for the Middle Eastern model, we decided to compare Air Arabia, the first LCC in the
region, to Emirates Airlines, the UAE’s largest conventional carrier, and a highly efficient
and profitable one at that. The chart above suggests that the cost saving is approximately
50.4%
As we mentioned earlier, the cost advantage is maintained through the efficiency of
costing and other factors that affect the industry as a whole. These factors contribute to
the growth of LCC model and are vital when considering entry into an under-penetrated
and untapped market such as the Middle East.
Cost gap European model as at year 2004
11.8
0.51.5
2.3
2.6
1.1
3.8
0.00
2.00
4.00
6.00
8.00
10.00
12.00
14.00
Ne
two
rk
Air
line
Lab
ou
r
Air
cra
ft a
nd
fue
l
Infr
ast
ruc
ture
Pro
du
ct
dis
trib
uti
on
ove
rhe
ad
Se
at
de
nsi
ty
ad
just
me
nt
Rya
na
ir L
CC
Eu
rop
ea
n
Mo
de
l
Eu
ro c
en
ts p
er
AS
K
67.8%
Cost gap for US Model as at year 2004
7
0.20.7
0.41.1
0.4
4.2
0.00
1.00
2.00
3.00
4.00
5.00
6.00
7.00
8.00
Ne
two
rkA
irlin
e
Lab
ou
r
Air
cra
ft a
nd
fue
l
Infr
ast
ruc
ture
Pro
du
ct
dis
trib
uti
on
ove
rhe
ad
Se
at
de
nsi
tya
dju
stm
en
t
So
uth
we
stLC
C U
SM
od
el
US
ce
nts
pe
r A
SK
40%
Cost gap UAE model as at year 2005
24.41
2.462.27
2.02
12.11
1.381.151.280.67
1.07
0.00
5.00
10.00
15.00
20.00
25.00
30.00
Em
ira
tes
Air
line
s
Fue
l an
d O
il
Em
plo
yee
Air
cra
ft
op
era
tin
g
Sa
les
an
d
Ma
rke
tin
g
Ha
nd
ling
Ca
teri
ng
De
pre
cia
tio
n
Oth
er
Air
Ara
bia
AE
D c
en
t p
er
AS
K
50.4%
LCCs cost saving is significant even as market penetration rates increase
Equities research
March 12th, 2007 19
Air Arabia
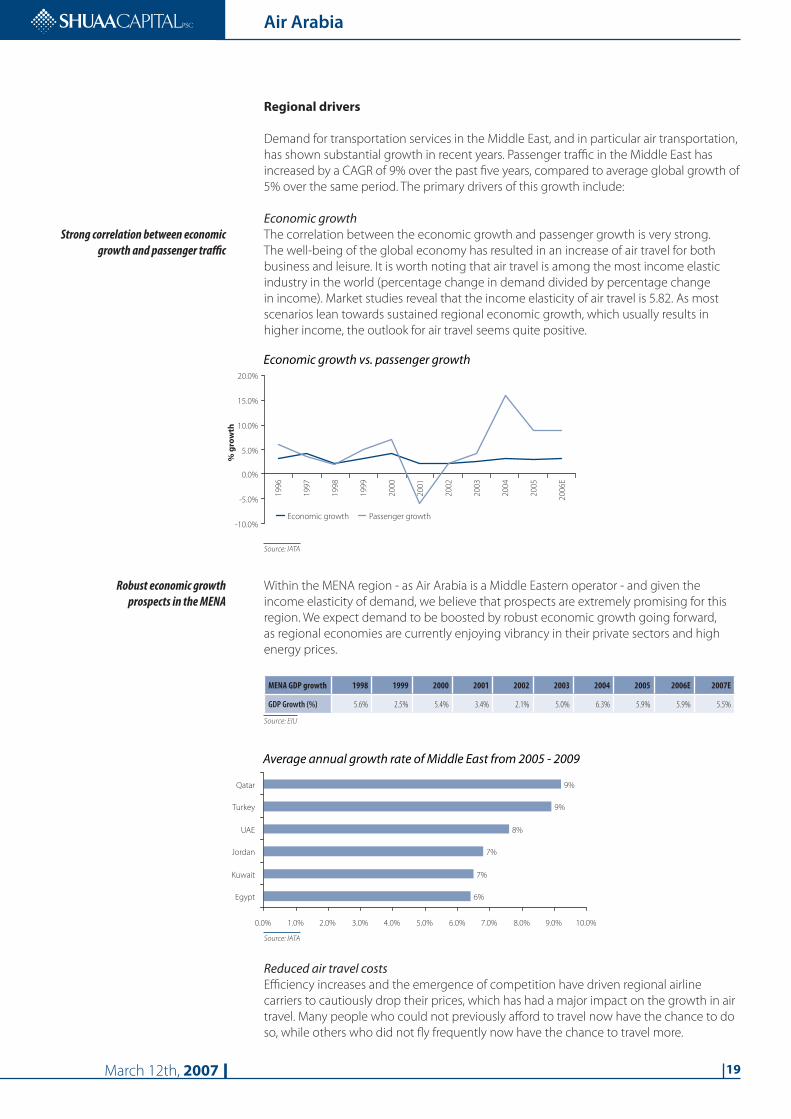
Regional drivers
Demand for transportation services in the Middle East, and in particular air transportation,
has shown substantial growth in recent years. Passenger traffic in the Middle East has
increased by a CAGR of 9% over the past five years, compared to average global growth of
5% over the same period. The primary drivers of this growth include:
Economic growthThe correlation between the economic growth and passenger growth is very strong.
The well-being of the global economy has resulted in an increase of air travel for both
business and leisure. It is worth noting that air travel is among the most income elastic
industry in the world (percentage change in demand divided by percentage change
in income). Market studies reveal that the income elasticity of air travel is 5.82. As most
scenarios lean towards sustained regional economic growth, which usually results in
higher income, the outlook for air travel seems quite positive.
Source: IATA
Within the MENA region - as Air Arabia is a Middle Eastern operator - and given the
income elasticity of demand, we believe that prospects are extremely promising for this
region. We expect demand to be boosted by robust economic growth going forward,
as regional economies are currently enjoying vibrancy in their private sectors and high
energy prices.
MENA GDP growth 1998 1999 2000 2001 2002 2003 2004 2005 2006E 2007E
GDP Growth (%) 5.6% 2.5% 5.4% 3.4% 2.1% 5.0% 6.3% 5.9% 5.9% 5.5%
Source: EIU
Source: IATA
Reduced air travel costsEfficiency increases and the emergence of competition have driven regional airline
carriers to cautiously drop their prices, which has had a major impact on the growth in air
travel. Many people who could not previously afford to travel now have the chance to do
so, while others who did not fly frequently now have the chance to travel more.
Economic growth vs. passenger growth
-10.0%
-5.0%
0.0%
5.0%
10.0%
15.0%
20.0%
19
96
19
97
19
98
19
99
20
00
20
01
20
02
20
03
20
04
20
05
20
06
E
Economic growth Passenger growth
% g
row
th
Economic growth vs. passenger growth
-10.0%
-5.0%
0.0%
5.0%
10.0%
15.0%
20.0%
19
96
19
97
19
98
19
99
20
00
20
01
20
02
20
03
20
04
20
05
20
06
E
Economic growth Passenger growth
% g
row
th
Average annual growth rate of Middle East from 2005 - 2009
6%
7%
7%
8%
9%
9%
0.0% 1.0% 2.0% 3.0% 4.0% 5.0% 6.0% 7.0% 8.0% 9.0% 10.0%
Egypt
Kuwait
Jordan
UAE
Turkey
Qatar
Average annual growth rate of Middle East from 2005 - 2009
6%
7%
7%
8%
9%
9%
0.0% 1.0% 2.0% 3.0% 4.0% 5.0% 6.0% 7.0% 8.0% 9.0% 10.0%
Egypt
Kuwait
Jordan
UAE
Turkey
Qatar
Robust economic growth prospects in the MENA
Strong correlation between economic growth and passenger traffic

Equities research
March 12th, 2007 20
Air Arabia
Given the high price elasticity of demand, LCCs in the region should enjoy even higher
growth rates than conventional airlines due to their significantly lower ticket prices. An
analysis done by IATA revealed that frequency of flying is mainly driven by lower fares.
Below is a summary of the results of IATA’s analysis.
Source: IATA
Demographics of the regionThe population of the Middle East has been growing at a CAGR of 2% since 1998 reaching
around 380 million in 2005, of which a large number of individuals, mainly the younger
population, are relocating from their home countries to the GCC. The majority of such
relocations are work-related, and the main destinations are UAE, Saudi Arabia, Kuwait and
Qatar.
Regional demographics, whether in terms of population growth or by composition, will
play an important role in shaping regional air transportation trends. The breakdown of the
population illustrates the potential market share and potential growth driver for LCCs in
the region clearly.
Source: EIU
The expatriate population of the UAE is estimated at around 80% of the country’s total
population, the highest rate of foreigners in the GCC. The majority of expatriates are
originally from neighboring countries. Most residents who originate from neighboring
countries retain strong ties with friends and family in their home countries, with some
even supporting their direct family back home. This trend in particular is clear from the
country’s gender demographics, in which males constitute over 70%.
What makes you fly more frequently
Safety on ground10%
lower fares49%
Frequent Flyer
Programs (FFP's)
10%
Safety on board13%
Other12%
Schedules6%
What makes you fly more frequently
Safety on ground10%
lower fares49%
Frequent Flyer
Programs (FFP's)
10%
Safety on board13%
Other12%
Schedules6%
300
320
340
360
380
400
420
1998 1999 2000 2001 2002 2003 2004 2005 2006E 2007E
Mil
lio
n
Sh
are
of
wo
rld
po
pu
lati
on
5.4%
5.5%
5.6%
5.7%
5.8%
5.9%
6.0%
6.1%
Population
Population growth
Share of world population (%)
300
320
340
360
380
400
420
1998 1999 2000 2001 2002 2003 2004 2005 2006E 2007E
Mil
lio
n
Sh
are
of
wo
rld
po
pu
lati
on
5.4%
5.5%
5.6%
5.7%
5.8%
5.9%
6.0%
6.1%
Population
Population growth
Share of world population (%)
80% of UAE population are expatriates from neighbouring countries therefore
driving significant VFF passenger traffic

Equities research
March 12th, 2007 21
Air Arabia
The chart below shows the breakdown of the UAE population by origin.
Source: Wikipedia
TourismRegional tourism has emerged as a key driver of air travel, on the back of increased intra-
Arab business and leisure travel, as well as cultural and religious travel. According to the
United Nations World Tourism Organization (UNWTO), the Middle East was the fastest
growing region in the world in terms of tourism arrivals between 2000 and 2005, going
from 25.2 million arrivals in 2000 to 39.7 million arrivals in 2005, implying a CAGR of 9.5%.
Regional economies have benefited strongly from this trend, which has been further
solidified by concrete economic policies geared toward increasing tourism’s share of
regional economies. Specifically, tourism is increasingly viewed by local governments as
a key sector of economic growth and as an important vehicle of economic diversification
for the region’s oil-based economies. Cities such as Dubai have made concerted efforts to
build world-class leisure and hospitality facilities. In fact, Dubai boasts the leading hotel
occupancy rate and average revenue per room in the world, and its excellent conference
facilities and free economic zones are viewed as catalysts to be emulated in other parts of
the Middle East.
Religious travel is also increasing in volumes and in scope, with more money being
spent on developing adequate infrastructure to accommodate ever-increasing number
of pilgrims from all over the world. Regional air travel has moreover proved resilient to
political instability, as exemplified by Egypt’s tourism arrivals, which have increased year-
on-year despite several incidents.
The UNWTO predicts substantial growth for the tourism sector in the region. 2005 figures
reveal that tourism grew by 11% in the Middle East and Africa region, its fastest rate in
five years. Based on these figures, the Middle East’s share of global tourism is expected to
grow to 4.4% by 2020, from 2.2% in 1995. This would make the region the fastest growing
tourist destination the world, ahead even of Asia-Pacific, which is expected to grow at
6.7% per annum over the same period. The foregoing will provide ample opportunity for
growth for the air travel industry.
Population in the UAE
South Asians50%
Arabs23%
UAE nationals19%
Others8%
Population in the UAE
South Asians50%
Arabs23%
UAE nationals19%
Others8%
Middle East is the fastest growing region in the world in terms of tourism
arrivals between 2000 and 2005
Middle East share of global tourism to increase to 4.4% by 2020

Equities research
March 12th, 2007 22
Air Arabia
The pie chart below breaks down inbound tourism to the region by purpose of visit, as
per the World Tourism Organization’s (WTO) estimates. As illustrated, travelers seeking
leisure, recreation and holidays account for the majority of the total (52%), while travelers
visiting friends and family follow with a 24% share of the total number of travelers.
Source: World Tourism Organization
Deregulation and liberalization Deregulation often leads to increased route availability and lower prices in specific
regions. The airline industry is currently exposed to a generally lower price environment
due to greater competition from new low cost airlines and constraints adjusting for excess
capacity.
Middle Eastern Aviation Authorities have recently begun to adopt more liberalized
policies and open skies agreements to promote competition and increase air travel.
As of May 2006, 17 open skies agreements among the Arab Civil Aviation Commission
states were concluded by Bahrain, Jordan, Lebanon, Morocco, Oman, Qatar, Syria and the
UAE. In addition, the UAE, Bahrain and Lebanon have committed to an open skies policy
allowing foreign carriers to operate unlimited services into their territories. Full and proper
implementation of liberalized policies has not yet been adopted by most countries.
However, several countries are holding the grants of permits for use of their skies and
hubs until they begin restructuring their own national carriers. The speed at which such
policies are implemented will have a direct bearing on the performance of independent
and privately owned LCCs in the region.
NetworksAn air transport network is a global system of flight operators that connects thousands
of destinations through direct and indirect routes via different hubs. This allows travelers
to go from one point to another, and to continue onwards from those destinations to yet
more destinations when direct flights are not viable.
Such networks will facilitate transport to diversified markets by providing a larger
customer base and potentially increasing the market share of LCC’s. In point to point
travel and operations form one single hub, the potential markets are usually measured
through a radius of 4 – 5 hours of travel from the hub. However, when implementing the
transport network, the radius will expand to serve another 4 - 5 hour travel from the next
hub. Applying network transport to regional markets will result in higher competition and
higher penetration rate by pulling down costs and boosting cost efficiencies, even among
conventional airlines.
Inbound tourism by purpose of visit
Leisure, recreation
and holidays
52%
VFF (Visit Friends and
Family
24%
Business and
professional
16%
Not specified
8%
Inbound tourism by purpose of visit
Leisure, recreation
and holidays
52%
VFF (Visit Friends and
Family
24%
Business and
professional
16%
Not specified
8%
Open Skies agreements amongst Arab Civil Aviation Commission states
were concluded in May 2006

Equities research
March 12th, 2007 23
Air Arabia
Infrastructure
1000 Km0
INDIAN
OCEAN
TurkmenistanTTT
Sudan
Sri LankaSomalia
Kenya
JJordaaJ dandaIraq
India
Ethiopia
eaEritreaeaEEE
Egypt
Iran
U.A.E.
Saudi Arabia
Kazakhstan
Abu Dhabi
Existing Capacity: 6 mn PAX
Added planned: 35 mn PAX
Dubai
Existing Capacity: 29 mn PAX
Added planned: 41 mn PAX
Doha
Existing Capacity: 9 mn PAX
Added planned: 41 mn PAX
Cairo
Existing Capacity: 10 mn PAX
Added planned: 10 mn PAX
Amman
Existing Capacity: 3 mn PAX
Added planned: 6 mn PAX
Jeddah
Existing Capacity: 14 mn PAX
Added planned: 27 mn PAX
Kuwait
Existing Capacity: 6 mn PAX
Added planned: 15 mn PAX
Bahrain
Existing Capacity: 6 mn PAX
Added planned: 12 mn PAX
Muscat
Existing Capacity: 4 mn PAX
Added planned: 6 mn PAX
Jebel Ali
Existing Capacity: 0 mn PAX
Added planned: 120 mn PAX
SharjahExisting Capacity: 3 mn PAXAdded planned: 5 mn PAX
Source: ATI, SHUAA Capital
The booming economies of the Middle East have fueled massive infrastructure
developments throughout the region and in the GCC in particular, which have attracted
businesses, investors and tourists to the region. The continued pace of infrastructure
development and its continued needs, estimated at some USD 600 bn over the next five
years, should continue to affect regional air travel positively.
The anticipated growth in passenger traffic in the Middle East will necessitate
developments in airport infrastructures, mainly in the passenger capacities. Developments
have already started talking place and are illustrated in the map above.
In the UAE, work is well under way to increase airport capacities. Upon the completion of
its development and expansion plan, Jebel Ali airport will be able to handle 120 million
passengers a year, and Dubai, the second largest in terms of capacity, will be able to
accommodate 70 million, almost twice its current capacity. Abu Dhabi is next, with a
capacity of 40 million passengers, and Sharjah airport, where air Arabia operates, will
handle 8 million passengers a year.
Qatar, Saudi Arabia, Kuwait, Egypt and others have followed suit by announcing the
airport capacity expansions as well. The growth rates vary but none involves less than 40%
increase on current capacities.
320 mn additional annual passenger capacity planned for
major regional airports

Equities research
March 12th, 2007 24
Air Arabia
Penetration rates
Examining different LCC models around the world can provide us with a guide as to how
the new model for the Middle East will evolve. It is apparent that as markets mature, the
market share of the LCC increases. The LCC model in the Middle East is a new concept, (Air
Arabia pioneered the introduction of the concept and will be the first in the Middle East
to be a public company) with a penetration rate of almost zero.
Source: IBM Business Consulting Services, SHUAA Capital
The potential for LCC operators is thus huge, with virtually unlimited fleet size expansion.
Operators could grow their fleets by over 80 times, and not gain more than 2% market
share.
We believe that the European model represents a phase that the industry will have to pass
through. However, we think that the US model best describes the potential long-term
future of the Middle Eastern model. This is based on the region’s demographics, its high
expatriate population, and its economic growth in promoting the advancement of the
LCC industry.
North America
Penetration rate
Traditional carriers
75%
Low cost carriers
25%
Europe
Traditional
carriers
89%
Low cost carriers
11%
Asia ex Australia
Traditional carriers
98%
Low cost carriers
2%
Middle East
Traditional carriers
99.9%
Low cost carriers
0.1%
More Mature
Less Mature
North America
Penetration rate
Traditional carriers
75%
Low cost carriers
25%
Europe
Traditional
carriers
89%
Low cost carriers
11%
Asia ex Australia
Traditional carriers
98%
Low cost carriers
2%
Middle East
Traditional carriers
99.9%
Low cost carriers
0.1%
More Mature
Less Mature
Middle East LCCs penetration rate is almost zero relative to
25% in North America

Equities research
March 12th, 2007 25
Air Arabia
Passenger traffic growth by region
In 2006, the Middle East regions recorded the highest passenger-traffic growth rate in the
world, reaching 15.4% versus an increase of 13.1% in 2005. It is likely that the main reason
behind this growth is the significant increase in the number of tourists in the Middle East,
which nearly tripled over the past year, according to the World Tourism Organization.
Additionally, as we have seen, many countries in the Middle East region have built
strong leisure and business facilities. These serve not only to accommodate growth in
passenger traffic, but also as facilitators to create important transcontinental and regional
connecting hubs, such as the UAE and Qatar. Furthermore, the growth in the MENA
region has pushed airlines and airport authorities to acquire new and modern airline
fleets, and to renovate and/ or build new airports to absorb the hefty flow of passengers
and freight to the region.
Going forward, Middle Eastern and Asian based airlines are expected to continue
growing faster than airlines based in other regions, growing by an average of 6.4% and
6.2% respectively, as per the expectations of Airbus. The higher growth will be driven
by the growing aspirations of these airlines, and in some cases, by the aspirations of
their host countries themselves. We expect markets growth to be also driven by market
liberalization and an increased propensity to travel by domestic populations.
Source: IATA
Porter’s 5 forces
Low Cost Carriers Industry
Bargaining Power
Existing and Potential competition
Threat of new entrants
• High capital and startup cost
• Government support
• Brand identity
• Expected high retaliation
from existing Airlines
• Service differentiation
• Low switching cost
Competitive rivalry
• Price war
• Service differentiation
• Low switching cost
• High exit barriers
• Price elasticity of demand
Threat of substitutes
• Low switching cost between
airlines.
• Price war
• Low product-for-product
substitution (due to unavailability of
high-speed trains within the region)
Power of buyers
• High demand for traveling
• High Price elasticity of demand
• High income elasticity of demand
• Price versus quality of services
Power of suppliers
• Aircraft deliveries to the middle east
are 869 airplanes by 2024 of which
39% are single aisle
• High integration (most airlines own
their catering suppliers and
maintenance services)
Passenger growth by region
Gro
wth
ra
te
9.9%
6.3% 6.4%
11.4%
13.1%
8.9%7.6%
8.6%
5.3% 5.3%
-2.4%
15.4%
5.7% 5.9%
-4.0%
-2.0%
0.0%
2.0%
4.0%
6.0%
8.0%
10.0%
12.0%
14.0%
16.0%
18.0%
Africa Asia Pacific Europe LatinAmerica
MiddleEast
NorthAfrica
Total
2005 2006
Passenger growth by region
Gro
wth
ra
te
9.9%
6.3% 6.4%
11.4%
13.1%
8.9%7.6%
8.6%
5.3% 5.3%
-2.4%
15.4%
5.7% 5.9%
-4.0%
-2.0%
0.0%
2.0%
4.0%
6.0%
8.0%
10.0%
12.0%
14.0%
16.0%
18.0%
Africa Asia Pacific Europe LatinAmerica
MiddleEast
NorthAfrica
Total
2005 2006

Equities research
March 12th, 2007 26
Air Arabia
Outlook
The outlook on the projected world passenger traffic is positive. World traffic is expected
to increase at an average of 4% per annum over the 2006-2025 periods to reach 9.1 billion
passengers by 2025, versus 4.3 billion passengers in 2006.
Source ACI airport council International
The Middle East is expected to show the highest AAGR over the next 5 years to record a
6.9% growth in number of passengers on average. This will be stimulated by expected
strong economic growth and by new capacities and routes. Open skies agreements
and network airline agreements are also expected to soon finalize, further boosting our
outlook on the region’s air transport business.
Source ACI airport council International
Budget airlines are expected to grow at an even higher rate by gaining higher market
share through higher market penetration. Based on the business model of a low cost
carrier and the price elasticity of demand, we expect that the LCCs will contribute to
boosting demand on air travel in the region as a whole.
The growth potential can be shown by comparing the MENA model to other existing
models like US, Europe and Asia. Results show that the penetration rate for the US model
is approximately three low cost aircrafts per million population, against one low cost
aircraft per million population in Europe and almost zero low cost aircrafts per million of
population in the Middle East.
Projected world passenger traffic
-
1,000
2,000
3,000
4,000
5,000
6,000
7,000
8,000
9,000
10,000
Passengers Growth rate
20052006
2007E
2008E
2009E
2010E
2015E
2025E
Pa
sse
ng
ers
in
mn
0.0%
1.0%
2.0%
3.0%
4.0%
5.0%
6.0%
Gro
wth
ra
te
Projected world passenger traffic
-
1,000
2,000
3,000
4,000
5,000
6,000
7,000
8,000
9,000
10,000
Passengers Growth rate
20052006
2007E
2008E
2009E
2010E
2015E
2025E
Pa
sse
ng
ers
in
mn
0.0%
1.0%
2.0%
3.0%
4.0%
5.0%
6.0%
Gro
wth
ra
te
Passenger AAGR 2006 - 2010
5.1%5.7%
4.4% 4.6%
6.9%
4.3%4.8%
0.0%
1.0%
2.0%
3.0%
4.0%
5.0%
6.0%
7.0%
8.0%
Afr
ica
Asi
a P
aci
fic
Eu
rop
e
Lati
nA
me
rica
Mid
dle
Ea
st
No
rth
Afr
ica
Tota
lIn
tern
ati
on
al
Gro
wth
ra
te
Passenger AAGR 2006 - 2010
5.1%5.7%
4.4% 4.6%
6.9%
4.3%4.8%
0.0%
1.0%
2.0%
3.0%
4.0%
5.0%
6.0%
7.0%
8.0%
Afr
ica
Asi
a P
aci
fic
Eu
rop
e
Lati
nA
me
rica
Mid
dle
Ea
st
No
rth
Afr
ica
Tota
lIn
tern
ati
on
al
Gro
wth
ra
te
Passenger traffic in the Middle East is expected to grow at a AAGR
of 6.9% between 2005 - 2010

Equities research
March 12th, 2007 27
Air Arabia
Depending on which model we believe the MENA model fits better, growth potentials
can be estimated. However it’s worth mentioning that the European model is viewed as
undervalued, and that by comparing it to the US model, it is expected to double or even
triple from the size of today.
Source: Boeing
LCCs will continue to grow around the world especially in the Middle East and Asia,
meanwhile network airlines are expected to benefit from the fast growing international
markets with a wave of new international travel consumers from emerging markets.
Between 2005 and 2025, intra Middle East traffic is expected to increase at an average
of 5% per annum to reach 91.8 bn RPK, while Middle East to Southwest Asia is expected
to grow at 6% per annum 121.6 bn RPK for the same period. Opportunities are therefore
promising for both existing and emergent LCC.
RPK in billions 1985 - 2005 2005 - 2025
Middle East – Middle East 3.4% 5.0%
Middle East - Southwest Asia 4.9% 6.0%
Source: Boeing
Passenger Traffic
0.0
20.0
40.0
60.0
80.0
100.0
120.0
140.0
1985 1990 1995 2000 2001 2002 2003 2004 2005 2025E
RP
K's
in
bil
lio
ns
Middle East - Middle East Middle East - Southwest Asia
Passenger Traffic
0.0
20.0
40.0
60.0
80.0
100.0
120.0
140.0
1985 1990 1995 2000 2001 2002 2003 2004 2005 2025E
RP
K's
in
bil
lio
ns
Middle East - Middle East Middle East - Southwest Asia
Promising growth opportunities
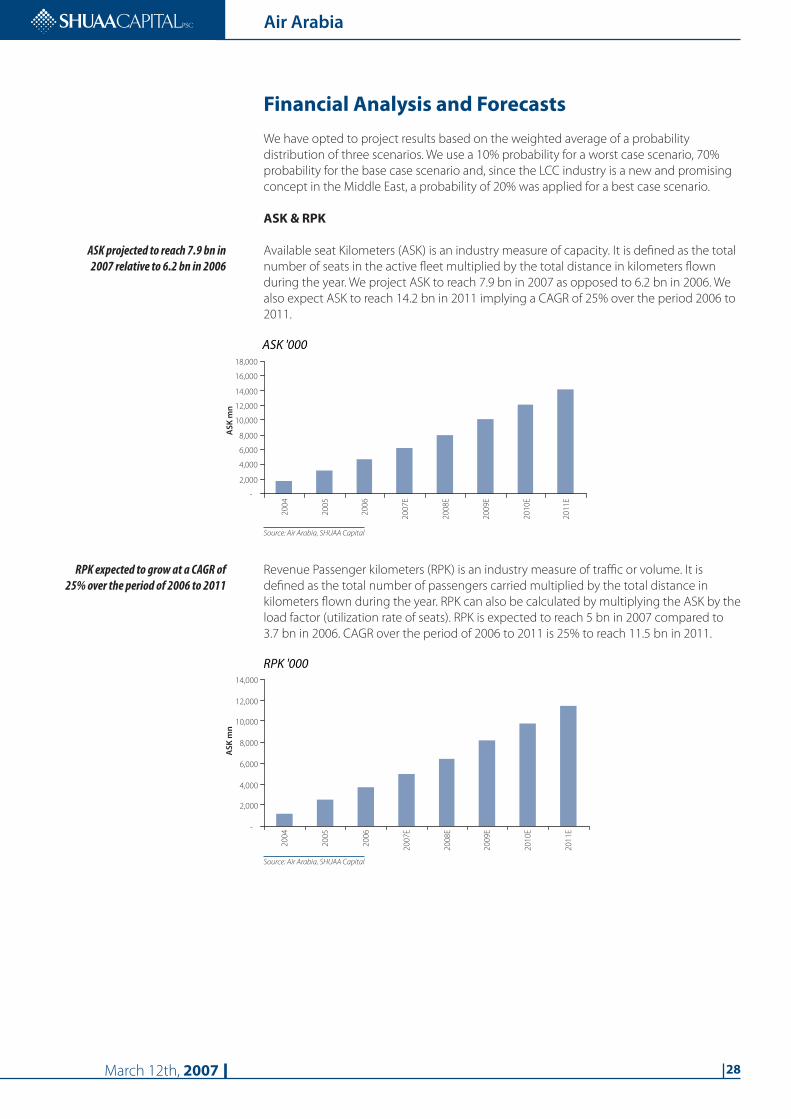
Equities research
March 12th, 2007 28
Air Arabia
Financial Analysis and Forecasts
We have opted to project results based on the weighted average of a probability
distribution of three scenarios. We use a 10% probability for a worst case scenario, 70%
probability for the base case scenario and, since the LCC industry is a new and promising
concept in the Middle East, a probability of 20% was applied for a best case scenario.
ASK & RPK
Available seat Kilometers (ASK) is an industry measure of capacity. It is defined as the total
number of seats in the active fleet multiplied by the total distance in kilometers flown
during the year. We project ASK to reach 7.9 bn in 2007 as opposed to 6.2 bn in 2006. We
also expect ASK to reach 14.2 bn in 2011 implying a CAGR of 25% over the period 2006 to
2011.
Source: Air Arabia, SHUAA Capital
Revenue Passenger kilometers (RPK) is an industry measure of traffic or volume. It is
defined as the total number of passengers carried multiplied by the total distance in
kilometers flown during the year. RPK can also be calculated by multiplying the ASK by the
load factor (utilization rate of seats). RPK is expected to reach 5 bn in 2007 compared to
3.7 bn in 2006. CAGR over the period of 2006 to 2011 is 25% to reach 11.5 bn in 2011.
Source: Air Arabia, SHUAA Capital
ASK '000
-
2,000
4,000
6,000
8,000
10,000
12,000
14,000
16,000
18,000
20
04
20
05
20
06
20
07
E
20
08
E
20
09
E
20
10
E
20
11
E
AS
K m
n
ASK '000
-
2,000
4,000
6,000
8,000
10,000
12,000
14,000
16,000
18,000
20
04
20
05
20
06
20
07
E
20
08
E
20
09
E
20
10
E
20
11
E
AS
K m
n
RPK '000
-
2,000
4,000
6,000
8,000
10,000
12,000
14,000
20
04
20
05
20
06
20
07
E
20
08
E
20
09
E
20
10
E
20
11
E
AS
K m
n
RPK '000
-
2,000
4,000
6,000
8,000
10,000
12,000
14,000
20
04
20
05
20
06
20
07
E
20
08
E
20
09
E
20
10
E
20
11
E
AS
K m
n
RPK expected to grow at a CAGR of 25% over the period of 2006 to 2011
ASK projected to reach 7.9 bn in 2007 relative to 6.2 bn in 2006

Equities research
March 12th, 2007 29
Air Arabia
Revenues, passenger growth and revenues per passenger
Source: Air Arabia, SHUAA Capital
We project revenues to reach AED 2.5 bn by 2011, representing a CAGR of 26.3%, from
end 2006, driven by a high load factor and in anticipation of new aircrafts joining the
current fleet.
Since the MENA market is a virgin market and penetration rates of LCCs are almost zero,
we have estimated the number of passengers based mainly on load factors and fleet size.
We believe that the passenger traffic will grow in line with the increase in supply of
aircrafts and that penetration rates of LCCs will not exceed 25% in the long term. As
mentioned earlier, this implies a closer similarity to the US model than to either the Asian
or European models.
Source: Air Arabia, SHUAA Capital
We believe passenger traffic will grow at a CAGR of 25% between 2006 and 2011 to reach
5.263 million passengers, stimulated by the positive outlook on the growth of the region
and by a load factor that varies between 80.35 and 81.
The above implies revenue per passenger of around AED 450 in 2007 increasing to almost
AED 470 by 2011, suggesting a minimal increment of 1.4% in the prices of tickets on
average.
Revenues
0
500
1,000
1,500
2,000
2,500
3,000
De
c-0
4
De
c-0
5
De
c-0
6
De
c-0
7E
De
c-0
8E
De
c-0
9E
De
c-1
0E
De
c-1
1E
Re
ve
nu
e A
ED
mn
Revenues
Revenues
0
500
1,000
1,500
2,000
2,500
3,000
De
c-0
4
De
c-0
5
De
c-0
6
De
c-0
7E
De
c-0
8E
De
c-0
9E
De
c-1
0E
De
c-1
1E
Re
ve
nu
e A
ED
mn
Revenues
Passenger & revenue per passenger
0
1,000
2,000
3,000
4,000
5,000
6,000
7,000
Dec-
04
Dec-
05
Dec-
06
Dec-
07E
Dec-
08E
Dec-
09E
Dec-
10E
Dec-
11E
Pa
sse
ng
ers
’00
0
0
50
100
150
200
250
300
350
400
450
500R
ev
en
ue
pe
r p
ass
en
ge
r
AE
D
Number of Passengers Revenues / Passenger
Passenger & revenue per passenger
0
1,000
2,000
3,000
4,000
5,000
6,000
7,000
Dec-
04
Dec-
05
Dec-
06
Dec-
07E
Dec-
08E
Dec-
09E
Dec-
10E
Dec-
11E
Pa
sse
ng
ers
’00
0
0
50
100
150
200
250
300
350
400
450
500R
ev
en
ue
pe
r p
ass
en
ge
r
AE
D
Number of Passengers Revenues / Passenger
Revenues to reach AED 2.4 bn by 2011 driven by high load factor
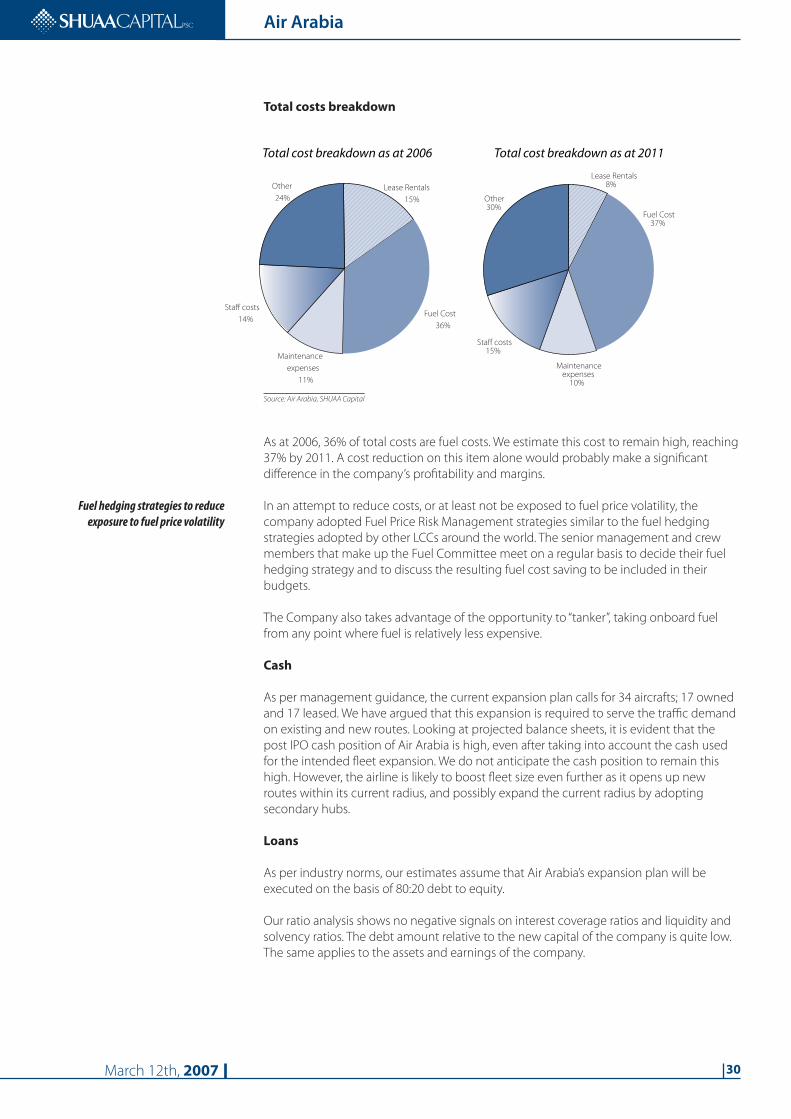
Equities research
March 12th, 2007 30
Air Arabia
Total costs breakdown
Source: Air Arabia, SHUAA Capital
As at 2006, 36% of total costs are fuel costs. We estimate this cost to remain high, reaching
37% by 2011. A cost reduction on this item alone would probably make a significant
difference in the company’s profitability and margins.
In an attempt to reduce costs, or at least not be exposed to fuel price volatility, the
company adopted Fuel Price Risk Management strategies similar to the fuel hedging
strategies adopted by other LCCs around the world. The senior management and crew
members that make up the Fuel Committee meet on a regular basis to decide their fuel
hedging strategy and to discuss the resulting fuel cost saving to be included in their
budgets.
The Company also takes advantage of the opportunity to “tanker”, taking onboard fuel
from any point where fuel is relatively less expensive.
Cash
As per management guidance, the current expansion plan calls for 34 aircrafts; 17 owned
and 17 leased. We have argued that this expansion is required to serve the traffic demand
on existing and new routes. Looking at projected balance sheets, it is evident that the
post IPO cash position of Air Arabia is high, even after taking into account the cash used
for the intended fleet expansion. We do not anticipate the cash position to remain this
high. However, the airline is likely to boost fleet size even further as it opens up new
routes within its current radius, and possibly expand the current radius by adopting
secondary hubs.
Loans
As per industry norms, our estimates assume that Air Arabia’s expansion plan will be
executed on the basis of 80:20 debt to equity.
Our ratio analysis shows no negative signals on interest coverage ratios and liquidity and
solvency ratios. The debt amount relative to the new capital of the company is quite low.
The same applies to the assets and earnings of the company.
Total cost breakdown as at 2011
Lease Rentals8%
Fuel Cost37%
Maintenance expenses
10%
Staff costs15%
Other30%
Total cost breakdown as at 2006
Lease Rentals
15%
Fuel Cost
36%
Maintenance
expenses
11%
Staff costs
14%
Other
24%
Total cost breakdown as at 2011
Lease Rentals8%
Fuel Cost37%
Maintenance expenses
10%
Staff costs15%
Other30%
Total cost breakdown as at 2006
Lease Rentals
15%
Fuel Cost
36%
Maintenance
expenses
11%
Staff costs
14%
Other
24%
Fuel hedging strategies to reduce exposure to fuel price volatility

Equities research
March 12th, 2007 31
Air Arabia
Goodwill and amortization
Goodwill was valued based on a valuation of the company prior to IPO of AED 2 bn.
The difference between the valuation and the shareholders funds as at the end of year
2006 which was AED 173 mn and excluding the net profits of that year represents the
outstanding Goodwill.
EBITDAR and EBITDAR margin
Source: Air Arabia, SHUAA Capital
We expect the EBITDAR (Earnings Before Interest, Tax, Depreciation, Amortization and
Rent) to reach AED 622 mn in 2011, compared to 182 mn in 2006, implying a CAGR of 28%
with a margin 25%. This will be driven by the increase in the average number of operating
aircrafts.
Net profits and net profit margin
Source: Air Arabia, SHUAA Capital
Air Arabia managed to cover all expenses and become profitable as of its first full year of
operation in 2004, and followed up with strong growth in profitability for every year since.
Net profits are expected to grow commensurately with gross profits and EBITDAR at
a CAGR of 29.6% to reach AED 369 mn by 2011 compared to AED 101 mn in 2006. We
expect net profits to double in 2007 reaching AED 226 mn in 2007. We expect net margins
to reach 15% by 2011 versus 14% in 2006.
It is important to note, however, that the amount of CAPEX during the coming years
will be substantial, and so will deprecation expenses. We believe that the net profit per
passenger will drop slightly during the expansion period.
-
100,000
200,000
300,000
400,000
500,000
600,000
700,000D
ec-
04
De
c-0
5
De
c-0
6
De
c-0
7E
De
c-0
8E
De
c-0
9E
De
c-1
0E
De
c-1
1E
AE
D '0
00
0%
5%
10%
15%
20%
25%
30%
Ma
rgin
EBITDAR
EBITDAR
EBITDAR margin
-
100,000
200,000
300,000
400,000
500,000
600,000
700,000D
ec-
04
De
c-0
5
De
c-0
6
De
c-0
7E
De
c-0
8E
De
c-0
9E
De
c-1
0E
De
c-1
1E
AE
D '0
00
0%
5%
10%
15%
20%
25%
30%
Ma
rgin
EBITDAR
EBITDAR
EBITDAR margin
(50,000)
-
50,000
100,000
150,000
200,000
250,000
300,000
350,000
400,000
De
c-0
4
De
c-0
5
De
c-0
6
De
c-0
7E
De
c-0
8E
De
c-0
9E
De
c-1
0E
De
c-1
1E
AE
D '0
00
Net Profit
Net Profit
(50,000)
-
50,000
100,000
150,000
200,000
250,000
300,000
350,000
400,000
De
c-0
4
De
c-0
5
De
c-0
6
De
c-0
7E
De
c-0
8E
De
c-0
9E
De
c-1
0E
De
c-1
1E
AE
D '0
00
Net Profit
Net Profit
Net profits to double in 2007

Equities research
March 12th, 2007 32
Air Arabia
Global Peers
SOUTHWEST
AIRLINES CO
NORTHWEST
AIRLINES CORP
JETBLUE AIR-
WAYS CORP
EASYJET
PLC
RYANAIR
HOLDINGS PLCAIRASIA BHD
VIRGIN BLUE
HOLDINGS LTDAVERAGE
Ticker LUV NWACQ JBLU EZJ RYA AIRA VBA
Country US US US GB IR MA AU
Currency USD USD USD GBP EUR MYR AUD
Current market cap ‘000 12,141,840 199,045 2,330,552 2,890,623 9,530,862 4,145,206 2,938,648
Last price 15.4 2.3 13.1 696.0 12.4 1.8 2.8
Price to Book ratio 1.9 n/a 2.4 2.9 8.0 3.9 4.9 4.0
Price to Sales ratio 1.4 0.0 1.0 1.8 9.0 4.8 2.2 2.9
Price / EBITDA 8.4 0.2 8.2 22.0 26.9 27.0 15.2 15.4
Price to Earnings ratio (P/E) 21.7 0.8 n/a 30.0 47.2 46.3 34.6 30.1
Est P/E current year 16.9 n/a 26.3 21.8 50.6 27.5 15.6 26.4
EV To EBITDA 12.8 n/a 32.2 15.5 15.9 50.5 13.7 23.4
Sales / Revenue / Turnover 9,086.0 12,568.0 2,363.0 1,619.7 1,692.5 862.9 1,318.4 4,215.8
Operating margin 10.3 6.1 5.4 6.3 22.2 9.1 9.8 9.9
Sales growth 19.8 2.3 38.9 20.8 28.3 29.6 (45.4) 13.5
Return onCommon Equity 7.6 n/a (0.1) 10.2 16.5 8.8 12.3 9.2
EPS before abnormal items 0.7 3.0 (0.0) 0.2 0.2 n/a 0.1 0.7
Dividends per share 0.0 - - - - - - 0.0
Airlines - Load Factor 73.1 n/a 81.6 84.8 77.0 78.0 77.0 78.6
Airlines - Oper exp. per ASM ASK 8.8 n/a 7.8 4.0 5.2 n/a n/a 6.5
EBITDA margin 16.5% n/a 11.9% 8.0% 29.5% 17.7% 14.6% 16.4%
*prices as at 26 Feb 2007
Source: Bloomberg, SHUAA Capital

Equities research
March 12th, 2007 33
Air Arabia
Financials and key ratios
Income Statement
Year to December 2005 2006 2007E 2008E 2009E 2010E 2011E
Revenues 411,181 749,165 1,026,737 1,318,031 1,709,687 2,068,015 2,464,045
Lease rentals (55,448) (104,097) (141,074) (179,916) (201,979) (201,979) (170,905)
Fuel cost (132,697) (235,457) (321,664) (422,535) (557,481) (683,885) (816,017)
Maintenance expenses (46,582) (75,594) (100,263) (127,869) (163,793) (195,079) (228,206)
Ground & technical handling charges (31,563) (53,907) (73,644) (96,738) (127,634) (156,574) (188,657)
Landing and overflying charges (19,864) (31,601) (43,171) (56,709) (74,820) (91,785) (110,592)
Insurance (8,060) (11,773) (15,615) (19,914) (25,509) (30,381) (35,540)
Other operating costs (7,142) (11,153) (15,237) (20,015) (26,407) (32,395) (39,032)
Staff costs (44,617) (96,042) (131,205) (167,330) (220,770) (270,828) (326,323)
Cost of sales -345,972 -619,623 -841,873 -1,091,026 -1,398,392 -1,662,905 -1,915,271
Gross income 65,209 129,542 184,864 227,005 311,295 405,110 548,774
Staff cost (7,650) (11,422) (12,565) (13,821) (15,203) (15,963) (16,762)
Advertisement expenses (10,234) (15,280) (14,187) (18,093) (23,176) (27,602) (32,290)
Reservation management expenses (2,857) (4,265) (3,960) (5,050) (6,469) (7,705) (9,014)
Selling and marketing expenses -20,741 -30,968 -30,711 -36,964 -44,848 -51,271 -58,065
Staff costs (9,111) (11,872) (13,861) (15,561) (17,546) (18,396) (18,944)
Legal and professional fees (1,232) (1,606) (1,875) (2,105) (2,373) (2,488) (2,562)
Travel and accommodation costs (1,044) (1,361) (1,805) (2,302) (2,948) (3,511) (4,108)
Communications costs (1,230) (1,603) (2,125) (2,711) (3,472) (4,135) (4,838)
Printing and stationary (807) (1,052) (1,395) (1,779) (2,278) (2,714) (3,174)
Depreciation of property and equipment (1,257) (1,638) (3,687) (4,102) (33,448) (61,073) (118,591)
Other expenses (2,738) (3,567) (4,258) (4,887) (5,634) (6,040) (6,359)
General and administrative expenses -17,419 -22,697 -29,006 -33,447 -67,701 -98,358 -158,576
Profit / Loss from operations (EBIT) 27,048 75,877 125,147 156,595 198,745 255,481 332,133
Finance costs (435) (3,430) - - (14,058) (35,508) (69,149)
Other income 303 28,698 100,779 90,169 95,015 91,174 106,005
Investment income 4,392 - - - - - -
Net profits for the year 31,309 101,145 225,926 246,764 279,702 311,148 368,989
Source: Air Arabia, SHUAA Capital

Equities research
March 12th, 2007 34
Air Arabia
Balance Sheet
Year to December 2005 2006 2007E 2008E 2009E 2010E 2011E
Bank balances and cash 99,560 182,156 2,879,394 2,576,261 2,714,720 2,604,978 3,028,707
Trade and other receivables 35,841 74,760 93,275 119,738 155,318 187,871 223,849
Total current assets 135,402 256,916 2,972,669 2,695,999 2,870,038 2,792,849 3,252,556
Investments available for sale 20,074 13,855 - - - - -
Deferred charges 4,998 17,128 20,047 25,734 33,381 40,377 48,109
Aircraft lease deposits 16,060 26,020 100,270 199,270 273,520 603,520 603,520
Investment property 14,063 13,313 12,563 11,813 11,063 10,313 9,563
Property and equipment 4,118 40,300 407,363 847,261 1,263,563 1,656,240 2,210,149
Goodwill - - 1,724,891 1,724,891 1,724,891 1,724,891 1,724,891
Total non current assets 59,313 110,616 2,265,133 2,808,969 3,306,417 4,035,340 4,596,231
Total assets 194,715 367,531 5,237,802 5,504,967 6,176,456 6,828,189 7,848,787
Trade and other payable 56,059 115,235 168,605 218,504 280,062 333,037 383,579
Deferred income 41,721 65,449 96,939 124,441 161,420 195,251 232,642
Due to related parties 3,695 3,133 4,257 5,516 7,070 8,408 9,684
Total current liability 101,475 183,817 269,801 348,462 448,552 536,696 625,905
Due to related parties 8,250 5,250 7,133 9,244 11,848 14,090 16,228
Provisions for employees end of service indemnity 2,515 4,501 5,160 6,480 8,000 9,600 11,200
Long term loan - - - - 357,498 683,885 1,334,794
Total non current liability 10,765 9,751 12,293 15,724 377,346 707,575 1,362,222
Total liability 112,240 193,568 282,094 364,186 825,898 1,244,271 1,988,127
Minority interest 0 0 0 0 0 0 0
Share capital 50,000 50,000 4,666,700 4,666,700 4,666,700 4,666,700 4,666,700
Statutory reserves 3,214 13,336 35,929 60,605 88,575 119,690 156,589
Cumulative changes in fair value of investment AFS 14,056 4,400 - - - - -
Accumulated losses 15,204 106,228 253,079 413,476 595,282 797,528 1,037,371
Shareholders current account - - - - - - -
Total shareholders funds 82,475 173,964 4,955,708 5,140,781 5,350,558 5,583,918 5,860,660
Total liability andshareholders’ equity 194,715 367,531 5,237,802 5,504,967 6,176,456 6,828,189 7,848,787
Source: Air Arabia, SHUAA Capital

Equities research
March 12th, 2007 35
Air Arabia
Key Ratios
Year to December 2005 2006 2007E 2008E 2009E 2010E 2011E
Growth
Revenues 126.8% 82.2% 37.1% 28.4% 29.7% 21.0% 19.2%
Gross profit 173.2% 98.7% 42.7% 22.8% 37.1% 30.1% 35.5%
EBITDAR 231.7% 116.8% 48.6% 26.2% 27.5% 19.4% 19.9%
Net profit 0.0% 223.1% 123.4% 9.2% 13.3% 11.2% 18.6%
Total assets 105.7% 88.8% 1325.1% 5.1% 12.2% 10.6% 14.9%
Shareholders’ equity 114.5% 110.9% 2748.7% 3.7% 4.1% 4.4% 5.0%
Number of passenger 112.5% 47.4% 33.9% 27.5% 28.5% 19.5% 17.3%
Yield 6.7% 22.2% 0.4% 0.7% 1.0% 1.3% 1.6%
Margins
EBITDAR margin 20.4% 24.2% 26.3% 25.8% 25.4% 25.1% 25.2%
Net profit margins 7.6% 13.5% 22.0% 18.7% 16.4% 15.0% 15.0%
Gross margins 15.9% 17.3% 18.0% 17.2% 18.2% 19.6% 22.3%
Earnings / returns
ROAE 51.78% 78.88% 8.81% 4.89% 5.33% 5.69% 6.45%
ROAA 21.64% 35.98% 8.06% 4.59% 4.79% 4.79% 5.03%
Liquidity & leverage
Current ratio 0.43 0.49 0.42 0.42 0.42 0.43 0.44
Debt/equity (x) 1.36 1.11 0.06 0.07 0.15 0.22 0.34
Interest coverage (x) 62.21 22.12 n/a n/a 14.14 7.20 4.80
Debt to assets 0.00 0.00 0.00 0.00 0.06 0.10 0.17
Total liability to equity 1.36 1.11 0.06 0.07 0.15 0.22 0.34
Efficiency
ASK ‘000 3,172,349 4,695,667 6,228,045 7,942,815 10,174,302 12,117,708 14,175,432
RPM ‘000 2,506,156 3,737,751 5,004,234 6,382,052 8,200,487 9,797,167 11,496,275
Load factor 79.0% 79.6% 80.4% 80.4% 80.6% 80.9% 81.1%
Days receivable 31.8 36.4 33.2 33.2 33.2 33.2 33.2
Days payable 59.1 67.9 73.1 73.1 73.1 73.1 73.1
Valuation
Share price n/a n/a 1.00 1.00 1.00 1.00 1.00
No of shares in issue (‘000) n/a n/a 4,666,700 4,666,700 4,666,700 4,666,700 4,666,700
Market cap (AED ‘000) n/a n/a 4,666,700 4,666,700 4,666,700 4,666,700 4,666,700
Market cap (USD ‘000) n/a n/a 1,244,055 1,244,055 1,244,055 1,244,055 1,244,055
EPS (AED) n/a n/a 0.05 0.05 0.06 0.07 0.08
EPS growth (%) n/a n/a 0.5% 9.2% 13.3% 11.2% 18.6%
P/E (x) n/a n/a 20.66 18.91 16.68 15.00 12.65
BVPS (AED) n/a n/a 1.06 1.10 1.15 1.20 1.26
P/BV (x) n/a n/a 0.94 0.91 0.87 0.84 0.80
EV/EBITDA n/a n/a 14.67 13.83 10.68 9.33 7.14
EBITDA per share (AED) n/a n/a 0.03 0.03 0.05 0.07 0.10
Dividend pay-out ratio (%) (DPS/EPS)
n/a n/a 25.0% 25.0% 25.0% 25.0% 25.0%
Dividend yield (%) n/a n/a 1.2% 1.3% 1.5% 1.7% 2.0%
Source: Air Arabia, SHUAA Capital

Equities research
March 12th, 2007 36
Air Arabia
Appendix
Abbreviation
LCC Low Cost Carrier
RPK Revenue Passenger Kilometers measures actual passenger traffic defined as the total number of passengers carried multiplied by the number of kilometers flown.
ASK Available Seat Kilometers measures available passenger capacity defined as the total number of seats in the active fleet multiplied by the number of Kilometers flown
PLF or Load Factor A capacity utilization measure defined as the percentage of available seat miles filled with pas-sengers; in other words, a measure of how full the plane is.
RASK Revenue per Available Seat Kilometers
Yield A measure of price defined as passenger revenues divided by traffic (or RPK).
Unit revenues A measure of revenue efficiency defined as total airline operating revenues divided by capacity (ASK).
Unit costs A measure of cost efficiency defined as total operating expense (we also include net interest expense) divided by capacity (ASK).
Open-skies pact Bilateral aviation accord that provides wider access to markets and fare-setting freedom for air carriers of two nations.
Point-to-point Service that avoids a hub. Low cost carriers, such as Southwest, can keep costs down by offering high frequency, point-to-point service, but only if the market has enough traffic density to fill a large number of flights.
AAGR Average Annual Growth Rate
ACAC Arab Civil Aviation Commission
EIU Economist Intelligence Unit
IATA International Air Transport Association
ACI Airports Council International

Equities research
March 12th, 2007 37
Air Arabia
Research
Head of Research
Walid Shihabi+9714 3199 [email protected]
Strategy and Economics
Walid Shihabi+9714 3199 [email protected]
Ahmad Shahin+9714 3199 [email protected]
Ryan Ayache+9714 3199 [email protected]
Commercial Banks and otherFinancial Services
Mohamed El Nabarawy, CFA+9714 3199 [email protected]
Munir Shahin+9714 3199 [email protected]
Ryan Ayache+9714 3199 [email protected]
Data
Ahmad Shahin+9714 3199 [email protected]
Heavy Industries and Utilities
Mohamed El Nabarawy, CFA+9714 3199 [email protected]
Munir Shahin+9714 3199 [email protected]
Telecommunications, Media and Technology
Marc Hammoud+9714 3199 [email protected]
Transportation and Logistics
Kareem Murad+9714 3199 [email protected]
Real Estate, Construction andConstruction Materials
Roy Cherry+9714 3199 [email protected]
Lara Hourani+9714 3199 [email protected]
Layout & Design
Jovan Ruseski+9714 3199 [email protected]
Head of Sales
Jamil Barrage+9714 3199 [email protected]
Regional Sales
Mohamad Bleik+9714 3199 [email protected]
Elias Bakhazi+9714 3199 [email protected]
Faisal Rajeh+9714 3199 [email protected]
Tala Al-Sahsah+9714 3199 [email protected]
Yazen Abu Gulal+9714 3199 [email protected]
International Sales
Nadine Haddad+9714 3199 [email protected]
Saad Tayara+9714 3199 [email protected]
Equity Advisory
Fares Mechelany+9714 3199 [email protected]
Brokerage
Diya Al Sarraj+9714 3199 [email protected]
Nadeem Outry+9714 3199 [email protected]

This page was intentionally left blank
This document has been issued by SHUAA Capital for informational purposes only. This document is not and should not be
construed as an offer or the solicitation of an offer to purchase or subscribe or sell any investment or subscribe to any investment
management or advisory service. This document is not intended as investment advice as to the value of any securities or as to the
advisability of investing in, purchasing, or selling any security. SHUAA Capital has based this document on information obtained
from sources it believes to be reliable. It makes no guarantee, representation or warranty as to its accuracy or completeness and
accepts no responsibility or liability in respect thereof or for any reliance placed by any person on such information. All opinions
expressed herein are subject to change without notice. This document may not be reproduced or circulated without the prior
written consent of SHUAA Capital psc.